Q1 - gunnebogroup.com€¦ · secured with the banks Santander and Banorte. In Brazil, ... Q1 Q1...
19
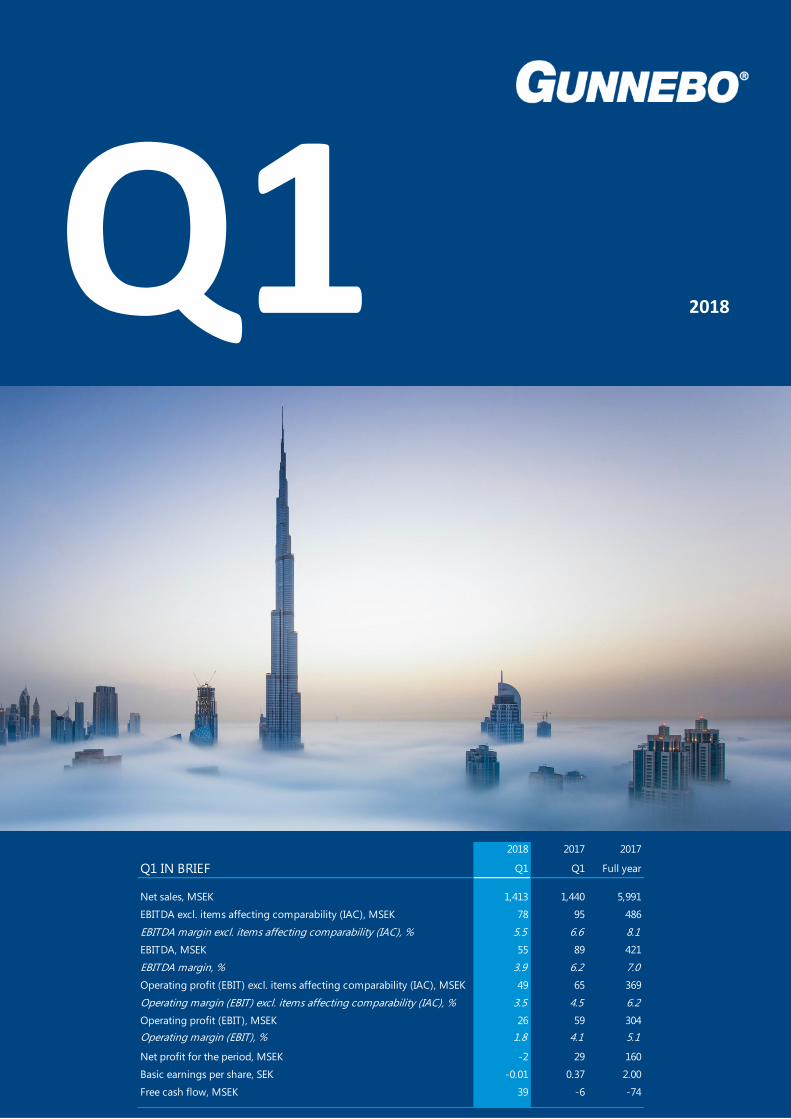
Q1 2018 2018 2017 2017 Q1 IN BRIEF Q1 Q1 Full year Net sales, MSEK 1,413 1,440 5,991 EBITDA excl. items affecting comparability (IAC), MSEK 78 95 486 EBITDA margin excl. items affecting comparability (IAC), % 5.5 6.6 8.1 EBITDA, MSEK 55 89 421 EBITDA margin, % 3.9 6.2 7.0 Operating profit (EBIT) excl. items affecting comparability (IAC), MSEK 49 65 369 Operating margin (EBIT) excl. items affecting comparability (IAC), % 3.5 4.5 6.2 Operating profit (EBIT), MSEK 26 59 304 Operating margin (EBIT), % 1.8 4.1 5.1 Net profit for the period, MSEK -2 29 160 Basic earnings per share, SEK -0.01 0.37 2.00 Free cash flow, MSEK 39 -6 -74
Transcript of Q1 - gunnebogroup.com€¦ · secured with the banks Santander and Banorte. In Brazil, ... Q1 Q1...
Q1 2018
2018 2017 2017
Q1 IN BRIEF Q1 Q1 Full year
Net sales, MSEK 1,413 1,440 5,991
EBITDA excl. items affecting comparability (IAC), MSEK 78 95 486
EBITDA margin excl. items affecting comparability (IAC), % 5.5 6.6 8.1
EBITDA, MSEK 55 89 421
EBITDA margin, % 3.9 6.2 7.0
Operating profit (EBIT) excl. items affecting comparability (IAC), MSEK 49 65 369
Operating margin (EBIT) excl. items affecting comparability (IAC), % 3.5 4.5 6.2
Operating profit (EBIT), MSEK 26 59 304
Operating margin (EBIT), % 1.8 4.1 5.1
Net profit for the period, MSEK -2 29 160
Basic earnings per share, SEK -0.01 0.37 2.00
Free cash flow, MSEK 39 -6 -74
2 GUNNEBO Q1 REPORT 2018
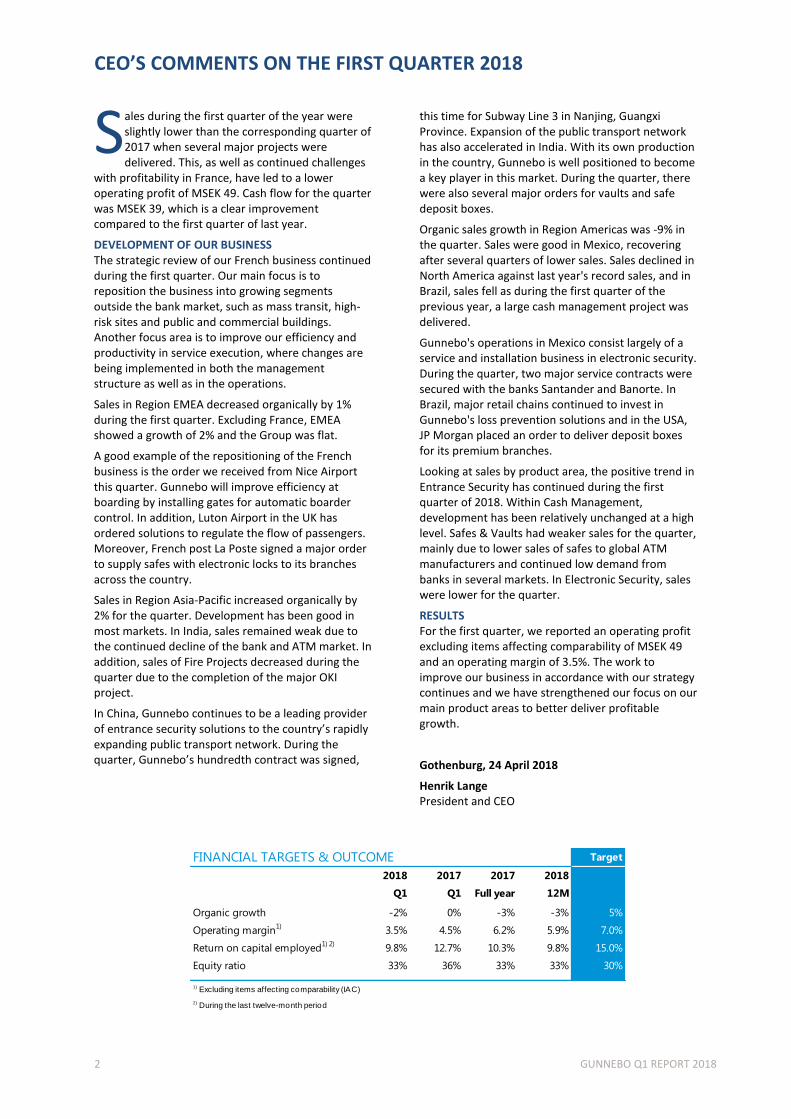
CEO’S COMMENTS ON THE FIRST QUARTER 2018
ales during the first quarter of the year were slightly lower than the corresponding quarter of 2017 when several major projects were delivered. This, as well as continued challenges
with profitability in France, have led to a lower operating profit of MSEK 49. Cash flow for the quarter was MSEK 39, which is a clear improvement compared to the first quarter of last year.
DEVELOPMENT OF OUR BUSINESS The strategic review of our French business continued during the first quarter. Our main focus is to reposition the business into growing segments outside the bank market, such as mass transit, high-risk sites and public and commercial buildings. Another focus area is to improve our efficiency and productivity in service execution, where changes are being implemented in both the management structure as well as in the operations.
Sales in Region EMEA decreased organically by 1% during the first quarter. Excluding France, EMEA showed a growth of 2% and the Group was flat.
A good example of the repositioning of the French business is the order we received from Nice Airport this quarter. Gunnebo will improve efficiency at boarding by installing gates for automatic boarder control. In addition, Luton Airport in the UK has ordered solutions to regulate the flow of passengers. Moreover, French post La Poste signed a major order to supply safes with electronic locks to its branches across the country.
Sales in Region Asia-Pacific increased organically by 2% for the quarter. Development has been good in most markets. In India, sales remained weak due to the continued decline of the bank and ATM market. In addition, sales of Fire Projects decreased during the quarter due to the completion of the major OKI project.
In China, Gunnebo continues to be a leading provider of entrance security solutions to the country’s rapidly expanding public transport network. During the quarter, Gunnebo’s hundredth contract was signed,
this time for Subway Line 3 in Nanjing, Guangxi Province. Expansion of the public transport network has also accelerated in India. With its own production in the country, Gunnebo is well positioned to become a key player in this market. During the quarter, there were also several major orders for vaults and safe deposit boxes.
Organic sales growth in Region Americas was -9% in the quarter. Sales were good in Mexico, recovering after several quarters of lower sales. Sales declined in North America against last year's record sales, and in Brazil, sales fell as during the first quarter of the previous year, a large cash management project was delivered.
Gunnebo's operations in Mexico consist largely of a service and installation business in electronic security. During the quarter, two major service contracts were secured with the banks Santander and Banorte. In Brazil, major retail chains continued to invest in Gunnebo's loss prevention solutions and in the USA, JP Morgan placed an order to deliver deposit boxes for its premium branches.
Looking at sales by product area, the positive trend in Entrance Security has continued during the first quarter of 2018. Within Cash Management, development has been relatively unchanged at a high level. Safes & Vaults had weaker sales for the quarter, mainly due to lower sales of safes to global ATM manufacturers and continued low demand from banks in several markets. In Electronic Security, sales were lower for the quarter.
RESULTS For the first quarter, we reported an operating profit excluding items affecting comparability of MSEK 49 and an operating margin of 3.5%. The work to improve our business in accordance with our strategy continues and we have strengthened our focus on our main product areas to better deliver profitable growth.
Gothenburg, 24 April 2018
Henrik Lange President and CEO
S
FINANCIAL TARGETS & OUTCOME Target
2018 2017 2017 2018
Q1 Q1 Full year 12M
Organic growth -2% 0% -3% -3% 5%
Operating margin1)
3.5% 4.5% 6.2% 5.9% 7.0%
Return on capital employed1) 2)
9.8% 12.7% 10.3% 9.8% 15.0%
Equity ratio 33% 36% 33% 33% 30%
1) Excluding items affecting comparability (IAC)
2) During the last twelve-month period

3 GUNNEBO Q1 REPORT 2018
SALES AND RESULT IN BRIEF
SALES BY REGION YTD 2018
SALES BY PRODUCT AREA YTD 2018
SALES BY CUSTOMER SEGMENT YTD 2018
SALES Q1 2018 VS Q1 2017
GROUP SALES & OPERATING MARGIN BY QUARTER
QUARTERLY SALES 2016 – Q1 2018
Organic Structure Currency Total
EMEA -1% 0% 4% 3%
APAC 2% 0% -5% -3%
AMERICAS -9% 0% -8% -17%
TOTAL -2% 0% 0% -2%
Operating margin %, excl. IAC
Operating margin % 12M, excl. IAC
Sales per quarter
Sales 2016
Sales 2017
Sales 2018
Operating margin % 12M, excl. IAC 2016
Operating margin % 12M, excl. IAC 2017
Operating margin % 12M, excl. IAC 20180

4 GUNNEBO Q1 REPORT 2018
% GROUP SALES YTD
SALES DEVELOPMENT Q1 2018 Organically, the region’s sales decreased by 1% during the quarter. Excluding France, sales increased by 2%. The markets of UK, Italy and Middle East developed well. Other markets in the region showed weaker development.
Entrance Security developed well on most markets in the region. In Italy, roll-out of the major order for the Italian railway network started, which contributed positively to sales for the quarter.
Sales within Cash Management developed positively, especially in Germany, UK, France and the Middle East.
Safes & Vaults had good volumes of sales in the UK, Netherlands and South Africa. This did however not compensate for drops in other markets, which resulted in a weak quarter.
Electronic Security developed positively in Belgium but was weaker in the rest of the region, giving an overall weak start to the year.
RESULT DEVELOPMENT Q1 2018 Operating profit excluding items affecting comparability amounted to MSEK 8 (12), giving an operating margin of 0.8% (1.3).
The lower profit was derived mainly from France. Items affecting comparability amounted to MSEK -16 (-6), and were related to continued structural activities in Europe, and mainly France.
QUARTER HIGHLIGHTS
▪ UK: Luton Airport installs anti-return gates from Gunnebo at its new international arrivals area.
▪ France: A gas company upgrades its security at sites across the country to meet SEVESO regulations.
▪ France: Nice Airport improves efficiency at boarding control by installing automatic boarding control gates
▪ France: National post office, La Poste, is one of the oldest customers in France. During the quarter, a 3-year framework agreement for customised safes and electronic locks was renewed.
▪ UK: Major CIT company provides solutions from Gunnebo to improve efficiency in cash management at its end retail customers.
▪ New SVP appointed Stefan Syrén takes up the position as SVP EMEA as of 1 May, 2018.
EMEA IN BRIEF
SVP: Heinz Jacqui | Sales Companies: 17 Europe, Middle East & Africa (EMEA) is the Group’s largest region. It is divided into eight sub-regions: Nordic, Central Europe, South Europe, UK/Ireland, France, East Europe, Middle East and Africa SALES BY PRODUCT AREA YTD 2018
2018 2017 2017
Q1 Q1 Full year
Net sales, MSEK 947 919 3,831
Organic growth, % -1 2 -3
Operating profit excl. IAC, MSEK 8 12 116
Operating margin excl. IAC, % 0.8 1.3 3.0
Items affecting comparability (IAC), MSEK -16 -6 -47
Operating profit, MSEK -8 6 69
REGION EMEA
Operating margin %, excl. IAC
Operating margin % 12M, excl. IAC
Sales per quarter
0
5 GUNNEBO Q1 REPORT 2018
% GROUP SALES YTD
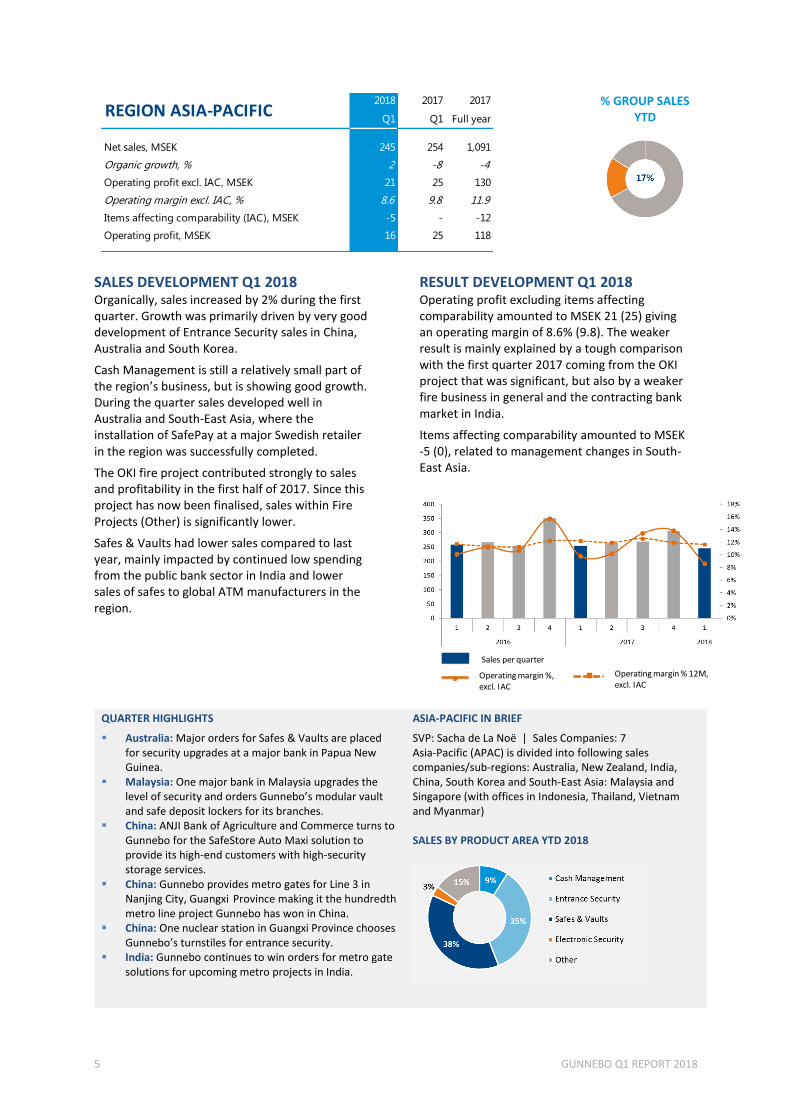
SALES DEVELOPMENT Q1 2018 Organically, sales increased by 2% during the first quarter. Growth was primarily driven by very good development of Entrance Security sales in China, Australia and South Korea.
Cash Management is still a relatively small part of the region’s business, but is showing good growth. During the quarter sales developed well in Australia and South-East Asia, where the installation of SafePay at a major Swedish retailer in the region was successfully completed.
The OKI fire project contributed strongly to sales and profitability in the first half of 2017. Since this project has now been finalised, sales within Fire Projects (Other) is significantly lower.
Safes & Vaults had lower sales compared to last year, mainly impacted by continued low spending from the public bank sector in India and lower sales of safes to global ATM manufacturers in the region.
RESULT DEVELOPMENT Q1 2018 Operating profit excluding items affecting comparability amounted to MSEK 21 (25) giving an operating margin of 8.6% (9.8). The weaker result is mainly explained by a tough comparison with the first quarter 2017 coming from the OKI project that was significant, but also by a weaker fire business in general and the contracting bank market in India.
Items affecting comparability amounted to MSEK -5 (0), related to management changes in South-East Asia.
QUARTER HIGHLIGHTS
▪ Australia: Major orders for Safes & Vaults are placed for security upgrades at a major bank in Papua New Guinea.
▪ Malaysia: One major bank in Malaysia upgrades the level of security and orders Gunnebo’s modular vault and safe deposit lockers for its branches.
▪ China: ANJI Bank of Agriculture and Commerce turns to Gunnebo for the SafeStore Auto Maxi solution to provide its high-end customers with high-security storage services.
▪ China: Gunnebo provides metro gates for Line 3 in Nanjing City, Guangxi Province making it the hundredth metro line project Gunnebo has won in China.
▪ China: One nuclear station in Guangxi Province chooses Gunnebo’s turnstiles for entrance security.
▪ India: Gunnebo continues to win orders for metro gate solutions for upcoming metro projects in India.
ASIA-PACIFIC IN BRIEF
SVP: Sacha de La Noë | Sales Companies: 7 Asia-Pacific (APAC) is divided into following sales companies/sub-regions: Australia, New Zealand, India, China, South Korea and South-East Asia: Malaysia and Singapore (with offices in Indonesia, Thailand, Vietnam and Myanmar) SALES BY PRODUCT AREA YTD 2018
2018 2017 2017
Q1 Q1 Full year
Net sales, MSEK 245 254 1,091
Organic growth, % 2 -8 -4
Operating profit excl. IAC, MSEK 21 25 130
Operating margin excl. IAC, % 8.6 9.8 11.9
Items affecting comparability (IAC), MSEK -5 - -12
Operating profit, MSEK 16 25 118
REGION ASIA-PACIFIC
Operating margin %, excl. IAC
Operating margin % 12M, excl. IAC
Sales per quarter
0

6 GUNNEBO Q1 REPORT 2018
% GROUP SALES YTD
SALES DEVELOPMENT Q1 2018 The region had a slow start to the year where sales decreased organically by 9%. Sales were strong in Mexico, but showed weaker development on other markets in the region.
Sales within Entrance Security were stable for the quarter.
Sales within Cash Management decreased, mainly due to delays in investments in bank projects in the US.
Safes & Vaults showed weak development, mainly due to low activity from national accounts in the US and strong sales in Q1 2017, giving a strong comparison.
The strongest sales performance came from Electronic Security. Delivery of a large refurbishment project to a bank customer in Mexico as well as good sales in Canada contributed to the overall positive development.
RESULT DEVELOPMENT Q1 2018
Operating profit excluding items affecting comparability amounted to MSEK 20 (28) and the operating margin to 9.0% (10.5). The quarter’s lower margin is explained by a relatively lower sales start in the region.
2018 2017 2017
Q1 Q1 Full year
Net sales, MSEK 221 267 1,069
Organic growth, % -9 3 1
Operating profit excl. IAC, MSEK 20 28 123
Operating margin excl. IAC, % 9.0 10.5 11.5
Items affecting comparability (IAC), MSEK -2 - -6
Operating profit, MSEK 18 28 117
REGION AMERICAS
QUARTER HIGHLIGHTS
▪ USA: JP Morgan increases security and accessibility for its end customers by installing solutions for value deposit at premium branches across the country
▪ USA: Associated Bank harmonises electronic security at branches for the newly acquired Bank Mutual
▪ Mexico: Major banks Santander and Banorte extend contracts for electronic security supply and service.
▪ Mexico: Retailer Cosco signs a contract for electronic security supply and service
▪ Canada: Retailer Best Buy Canada turns to Gunnebo for delivery of a hardware re-key project, upgrading all locks to new and improved high security keyway
▪ Canada: Gunnebo builds and installs two large vaults for one of Canada’s largest licensed cannabis producers
▪ Brazil: Retailer Magazine Luiza continues to roll out cord protection to another 170 stores in the country
▪ USA: Insurance company Westfield refurbishes its HQ building and upgrades entrance control by installing Gunnebo SpeedStiles
AMERICAS IN BRIEF
SVP: Dan Schroeder | Sales Companies: 4 North America: Canada, USA Latin America: Brazil, Mexico SALES BY PRODUCT AREA YTD 2018
Operating margin %, excl. IAC
Operating margin % 12M, excl. IAC
Sales per quarter
0

7 GUNNEBO Q1 REPORT 2018
FINANCIAL PERFORMANCE JANUARY - MARCH 2018
Net sales The Group’s net sales during the first quarter amounted to MSEK 1,413 (1,440). Organic growth for the Group was -2%, where EMEA ended at -1%, Asia-Pacific at 2%, and Americas at -9%. The currency effect was 0%.
Excluding France, EMEA had an organic growth of 2% and the Group ended flat.
Net sales comprised of MSEK 1,119 related to product sales and MSEK 294 related to sales of service.
Operating results Operating profit was MSEK 26 (59), equaling an operating margin of 1.8% (4.1). Excluding items affecting comparability, operating profit amounted to MSEK 49 (65), equaling an operating margin of 3.5% (4.5). EBITDA excluding items affecting comparability reached MSEK 78 (95) corresponding to 5.5% (6.6) of net sales.
Included in the operating profit was MSEK 6 (0) from associated companies and MSEK 10 (0) from the result of the sale of facility caused by the restructuring of our South African business.
The gross margin excluding items affecting comparability was 26.4% compared to 28.4% last year. In the regions, Entrance Security started the year strong, while other product areas had a weaker first quarter. Selling and administrative expenses excluding items affecting comparability decreased by some MSEK 5 over the same quarter last year. As a percent of net sales, this equaled 24.1% which was in line with last year.
Gross spending on product development, which included capitalised amounts, totalled MSEK 29 (27) corresponding to 2.1% (1.9) of net sales.
Items affecting comparability impacted the Group’s result by MSEK -23 (-6) in the quarter, with MSEK -3 (-4) in cost of goods sold and MSEK -20 (-2) reported in selling and administrative expenses. For EMEA, these related to the continued focus on increased productivity and structural changes, of which the majority derived from French activities. Items affecting comparability in the other regions related primarily to structural changes affecting management levels.
Changes in the operating profit in the first quarter, as compared to the corresponding quarter 2017, can be explained by: ▪ The negative organic growth impacted
operating profit by MSEK -6. ▪ The negative net structural effects of MSEK -6
reflect realised savings from implemented productivity measures and a higher level of structural changes when compared to the same period last year.
▪ Currency effects were MSEK -2, of which translation effect was MSEK -4 and transaction effect was MSEK 2.
▪ Other effects came mainly from the negative gross margin development and income from associated companies of MSEK 6, as well as the profit from sale of facility in South Africa of MSEK 10.
Other financial highlights Net financial items in the quarter was MSEK -14 which was in line with 2017. Tax expense was MSEK -14 (-17) representing an effective tax rate of 117% (37). The high effective tax rate is mainly caused by final adjustments to prior year tax returns.
Free cash flow for the quarter was MSEK 39 (-6), which included the positive cash flow effect of MSEK 13 from the sale of property in South Africa. Investments in the quarter were MSEK 35 (29), reflecting increased investments in property, plant and equipment, partly caused by relocating in a couple of sites and continued investments in product/IT development. There was a positive contribution to the cash flow from working capital, mainly from customer receivables.
Cash flow from investment activities included MSEK -15 being an earn-out from a previous acquisition. Cash flow from financing activities totalled MSEK -39 (-27) including loan repayments and change in bank overdrafts.
Total equity increased by MSEK 24 and was mainly attributable to positive currency translations on foreign operations of MSEK 23. Equity ratio was 33% at the end of the year (33% at the beginning of the year).
OPERATING PROFIT BRIDGE Q1
Operating profit 2017 59
Organic -6
Structure -6
Currency -2
Other -19
Operating profit 2018 26

8 GUNNEBO Q1 REPORT 2018
Parent company The Group’s parent company, Gunnebo AB, is a holding company which has the main task of owning and managing shares in other Group companies, as well as providing Group-wide services. Net revenue for the first quarter was MSEK 52 (61). Profit after financial items was MSEK 7 (16) and net profit for the first quarter amounted to MSEK 6 (12).
Employees The number of employees at the end of the first quarter was 5,162 which is a decrease of 48 employees when compared to the end of 2017.
Gothenburg, 24 April 2018
Henrik Lange President and CEO
This interim report is a translation of the original report in Swedish. This report has not been reviewed by the company´s auditors.

9 GUNNEBO Q1 REPORT 2018
CONDENSED CONSOLIDATED INCOME STATEMENTS
2018 2017 2017
MSEK Q1 Q1 Full year
Net sales 1,413 1,440 5,991
Cost of goods sold -1,043 -1,035 -4,306
Gross profit 370 405 1,685
Selling and administrative expenses -361 -348 -1,395
Other operating income and expenses, net 17 2 14
Operating profit 26 59 304
Financial income and expenses, net -14 -13 -57
Profit before taxes 12 46 247
Income taxes -14 -17 -87
Net profit for the period -2 29 160
Net profit attributable to:
Shareholders of the Parent Company -1 28 153
Non-controlling interests -1 1 7
Net profit for the period -2 29 160
Basic earnings per share, SEK -0.01 0.37 2.00
Diluted earnings per share, SEK -0.01 0.36 2.00
CONDENSED CONSOLIDATED STATEMENTS OF COMPREHENSIVE INCOME
2018 2017 2017
MSEK Q1 Q1 Full year
Net profit for the period -2 29 160
Other comprehensive income
Items that will not be reclassified to the income statement
Remeasurements (actuarial gains and losses)1)
- - -20
Subtotal - - -20
Items that may be reclassified to the income statement
Translation differences on foreign operations 23 13 -74
Other1)
3 1 4
Subtotal 26 14 -70
Other comprehensive income for the period 26 14 -90
Total comprehensive income for the period 24 43 70
Total comprehensive income attributable to:
Shareholders of the Parent Company 28 42 66
Non-controlling interests -4 1 4
Total comprehensive income for the period 24 43 70
1) Net of taxes

10 GUNNEBO Q1 REPORT 2018
CONDENSED CONSOLIDATED BALANCE SHEETS
2018 20171) 2017
MSEK Mar 31 Mar 31 Dec 31
Goodwill 1,646 1,623 1,596
Other intangible assets 330 299 314
Property, plant and equipment 350 341 345
Deferred tax assets 336 328 322
Other long-term assets 21 13 17
Total non-current assets 2,683 2,604 2,594
Inventories 951 876 902
Total customer receivables 1,230 1,221 1,413
Other short-term assets 322 306 294
Cash and cash equivalents 488 552 498
Total current assets 2,991 2,955 3,107
Total assets 5,674 5,559 5,701
Total equity 1,890 1,933 1,866
Long-term financial liabilities 1,438 1,129 1,396
Provisions for post-employment benefits 511 484 494
Deferred tax liabilities 71 87 66
Total non-current liabilities 2,020 1,700 1,956
Accounts payable 635 617 742
Short-term financial liabilities 74 219 108
Other short-term liabilities 1,055 1,090 1,029
Total current liabilities 1,764 1,926 1,879
Total equity and liabilities 5,674 5,559 5,701
1) Reclassification made to previously published report. See Note 1.
CONDENSED CONSOLIDATED STATEMENTS OF CHANGES IN EQUITY2018 2017 2017
MSEK Mar 31 Mar 31 Dec 31
Opening balance 1,866 1,890 1,890
Total comprehensive income for the period 24 43 70
Dividends - - -92
Other, including new share issue - - -2
Closing balance 1,890 1,933 1,866
11 GUNNEBO Q1 REPORT 2018
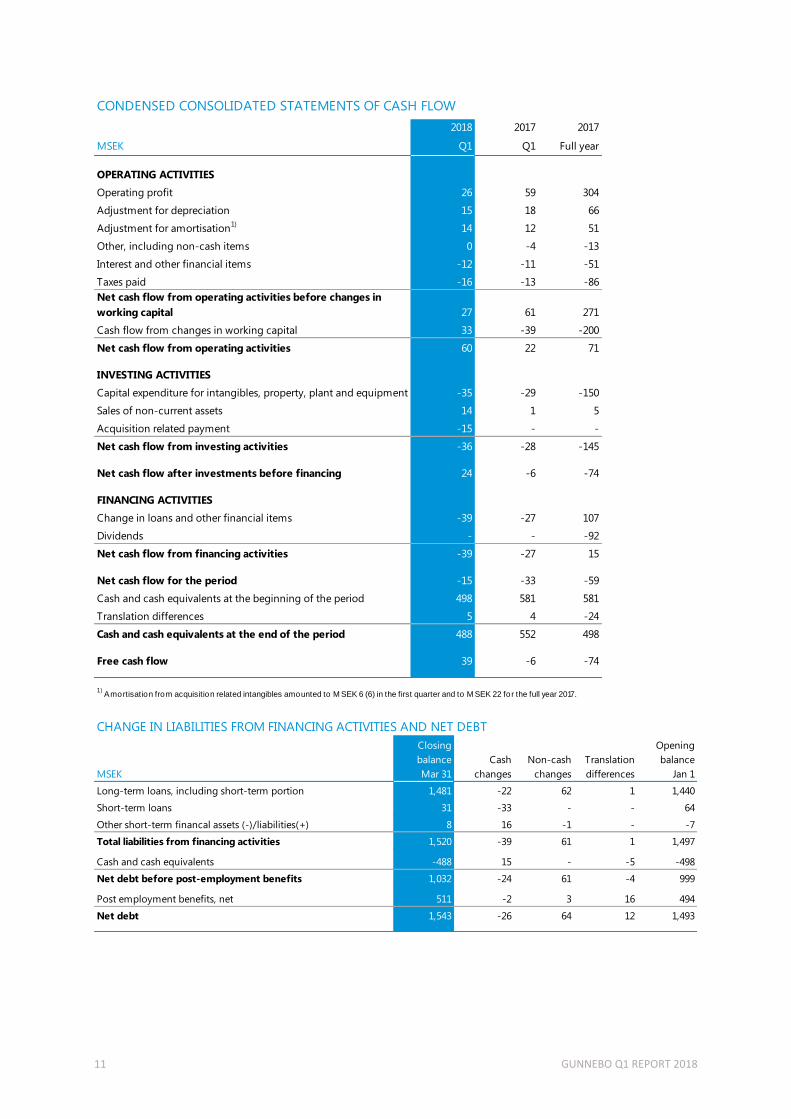
CONDENSED CONSOLIDATED STATEMENTS OF CASH FLOW
2018 2017 2017
MSEK Q1 Q1 Full year
OPERATING ACTIVITIES
Operating profit 26 59 304
Adjustment for depreciation 15 18 66
Adjustment for amortisation1)
14 12 51
Other, including non-cash items 0 -4 -13
Interest and other financial items -12 -11 -51
Taxes paid -16 -13 -86
Net cash flow from operating activities before changes in
working capital 27 61 271
Cash flow from changes in working capital 33 -39 -200
Net cash flow from operating activities 60 22 71
INVESTING ACTIVITIES
Capital expenditure for intangibles, property, plant and equipment -35 -29 -150
Sales of non-current assets 14 1 5
Acquisition related payment -15 - -
Net cash flow from investing activities -36 -28 -145
Net cash flow after investments before financing 24 -6 -74
FINANCING ACTIVITIES
Change in loans and other financial items -39 -27 107
Dividends - - -92
Net cash flow from financing activities -39 -27 15
Net cash flow for the period -15 -33 -59
Cash and cash equivalents at the beginning of the period 498 581 581
Translation differences 5 4 -24
Cash and cash equivalents at the end of the period 488 552 498
Free cash flow 39 -6 -74
1) Amortisation from acquisition related intangibles amounted to M SEK 6 (6) in the first quarter and to M SEK 22 for the full year 2017.
CHANGE IN LIABILITIES FROM FINANCING ACTIVITIES AND NET DEBT
MSEK
Closing
balance
Mar 31
Cash
changes
Non-cash
changes
Translation
differences
Opening
balance
Jan 1
Long-term loans, including short-term portion 1,481 -22 62 1 1,440
Short-term loans 31 -33 - - 64
Other short-term financal assets (-)/liabilities(+) 8 16 -1 - -7
Total liabilities from financing activities 1,520 -39 61 1 1,497
Cash and cash equivalents -488 15 - -5 -498
Net debt before post-employment benefits 1,032 -24 61 -4 999
Post employment benefits, net 511 -2 3 16 494
Net debt 1,543 -26 64 12 1,493

12 GUNNEBO Q1 REPORT 2018
GROUP KEY RATIOS1)
2018 2017 2017
Q1 Q1 Full year
Income statement
EBITDA, MSEK 55 89 421
EBITDA excluding IAC, MSEK 78 95 486
EBITDA margin, % 3.9 6.2 7.0
EBITDA margin excluding IAC, % 5.5 6.6 8.1
Operating margin (EBIT), % 1.8 4.1 5.1
Operating margin (EBIT) excluding IAC, % 3.5 4.5 6.2
Profit margin (EBT), % 0.8 3.2 4.1
Interest coverage ratio, times 1.9 4.8 5.8
Balance sheet
Return on capital employed, % 7.6 10.7 8.6
Return on capital employed excluding IAC, % 9.8 12.7 10.3
Capital employed turnover rate, times 1.6 1.7 1.6
Return on equity, % 6.9 12.0 8.6
Net debt, MSEK 1,543 1,271 1,493
Net debt/EBITDA, times 4.0 2.6 3.5
Equity ratio, % 33 36 33
Debt/equity, times 0.8 0.7 0.8
Share data
Basic earnings per share, SEK -0.01 0.37 2.00
Diluted earnings per share, SEK -0.01 0.36 2.00
Equity per share, SEK 24.40 24.95 24.03
Free cash flow per share, SEK 0.51 -0.08 -0.97
Total number of shares at end of period 77,050,848 77,050,848 77,050,848
Weighted average number of shares 77,050,848 77,050,848 77,050,848
76,320,001 76,320,001 76,320,001
76,407,526 76,370,232 76,389,239
1) For a reconciliation of key ratios, refer to gunnebogroup.com/en/investors/financial-definitions
Weighted average number of basic shares
Weighted average number of diluted shares

13 GUNNEBO Q1 REPORT 2018
QUARTERLY DATA GROUP
2018Income statement, MSEK 1 2 3 4 Full year 1 2 3 4 Full year 1
Net sales 1,390 1,474 1,448 1,776 6,088 1,440 1,510 1,409 1,632 5,991 1,413
Cost of goods sold -993 -1,049 -1,020 -1,257 -4,319 -1,035 -1,065 -1,021 -1,185 -4,306 -1,043
Gross profit 397 425 428 519 1,769 405 445 388 447 1,685 370
Selling and administrative expenses (S&A) -346 -349 -343 -379 -1,417 -348 -356 -340 -351 -1,395 -361
Other operating income and expenses, net 2 4 6 2 14 2 3 1 8 14 17
Operating profit 53 80 91 142 366 59 92 49 104 304 26
Financial income and expenses, net -14 -12 -14 -13 -53 -13 -17 -13 -14 -57 -14
Profit before taxes 39 68 77 129 313 46 75 36 90 247 12
Income tax -19 -26 -26 -33 -104 -17 -36 -20 -14 -87 -14
Net profit for the period 20 42 51 96 209 29 39 16 76 160 -2
Key ratios
Organic growth, % 1 -1 -1 3 1 0 -3 -2 -6 -3 -2
Gross margin, % 28.6 28.8 29.6 29.2 29.1 28.1 29.5 27.5 27.4 28.1 26.2
Gross margin excl. IAC, % 28.6 29.4 30.0 29.7 29.5 28.4 29.5 27.8 28.4 28.6 26.4
S&A in % of net sales 24.9 23.7 23.7 21.3 23.3 24.2 23.6 24.1 21.5 23.3 25.5
S&A in % of net sales excl. IAC 24.6 22.7 23.2 20.1 22.5 24.0 22.9 23.1 20.7 22.6 24.1
Operating margin (EBIT), % 3.8 5.4 6.3 8.0 6.0 4.1 6.1 3.5 6.4 5.1 1.8
Operating profit (EBIT) excl. IAC, MSEK 58 103 105 172 438 65 103 67 134 369 49
Operating margin (EBIT) excl. IAC, % 4.2 7.0 7.3 9.7 7.2 4.5 6.8 4.8 8.2 6.2 3.5
EBITDA, MSEK 82 109 125 173 489 89 121 78 133 421 55
EBITDA margin, % 5.9 7.4 8.6 9.7 8.0 6.2 8.0 5.5 8.1 7.0 3.9
EBITDA excl. IAC, MSEK 87 132 139 203 561 95 132 96 163 486 78
EBITDA margin excl. IAC, % 6.2 9.0 9.6 11.4 9.2 6.6 8.7 6.8 10.0 8.1 5.5
Items affecting comparability (IAC), MSEK -5 -23 -14 -30 -72 -6 -11 -18 -30 -65 -23
Whereof cost of goods sold -1 -9 -7 -8 -25 -4 -1 -4 -17 -26 -3
Whereof S&A -4 -14 -7 -22 -47 -2 -10 -14 -13 -39 -20
Whereof other IAC - - - - - - - - - - -
Basic earnings per share, SEK 0.26 0.55 0.65 1.25 2.71 0.37 0.51 0.21 0.91 2.00 -0.01
Cash flow
Free cash flow 7 27 18 107 159 -6 -76 -63 71 -74 39
2016 2017

14 GUNNEBO Q1 REPORT 2018
QUARTERLY REGIONAL DATA
2018EMEA 1 2 3 4 Full year 1 2 3 4 Full year 1
Net sales, MSEK 888 966 922 1,131 3,907 919 979 875 1,058 3,831 947
Organic growth, % -1 -1 0 2 0 2 -2 -5 -6 -3 -1
Operating profit (EBIT), MSEK 4 25 31 53 113 6 36 -5 32 69 -8
Operating margin (EBIT), % 0.5 2.6 3.4 4.7 2.9 0.7 3.7 -0.6 3.0 1.8 -0.8
Items affecting comparability (IAC), MSEK -3 -22 -11 -23 -59 -6 -10 -9 -22 -47 -16
Operating profit (EBIT) excl. IAC, MSEK 7 47 42 76 172 12 46 4 54 116 8
Operating margin (EBIT) excl. IAC, % 0.8 4.9 4.6 6.7 4.4 1.3 4.7 0.5 5.1 3.0 0.8
APAC
Net sales, MSEK 258 267 253 351 1,129 254 264 268 305 1,091 245
Organic growth, % 10 4 2 3 5 -8 -9 9 -9 -4 2
Operating profit (EBIT), MSEK 26 29 26 52 133 25 27 30 36 118 16
Operating margin (EBIT), % 10.1 10.9 10.3 14.8 11.8 9.8 10.2 11.2 11.8 10.8 6.5
Items affecting comparability (IAC), MSEK - -1 -1 -3 -5 - - -6 -6 -12 -5
Operating profit (EBIT) excl. IAC, MSEK 26 30 27 55 138 25 27 36 42 130 21
Operating margin (EBIT) excl. IAC, % 10.1 11.2 10.7 15.7 12.2 9.8 10.2 13.4 13.8 11.9 8.6
AMERICAS
Net sales, MSEK 244 241 273 294 1,052 267 267 266 269 1,069 221
Organic growth, % -1 -6 -5 4 -2 3 4 0 -3 1 -9
Operating profit (EBIT), MSEK 23 26 34 37 120 28 29 24 36 117 18
Operating margin (EBIT), % 9.4 10.8 12.5 12.6 11.4 10.5 10.9 9.0 13.4 10.9 8.1
Items affecting comparability (IAC), MSEK -2 - -2 -4 -8 - -1 -3 -2 -6 -2
Operating profit (EBIT) excl. IAC, MSEK 25 26 36 41 128 28 30 27 38 123 20
Operating margin (EBIT) excl. IAC, % 10.2 10.8 13.2 13.9 12.2 10.5 11.2 10.2 14.1 11.5 9.0
2016 2017
15 GUNNEBO Q1 REPORT 2018
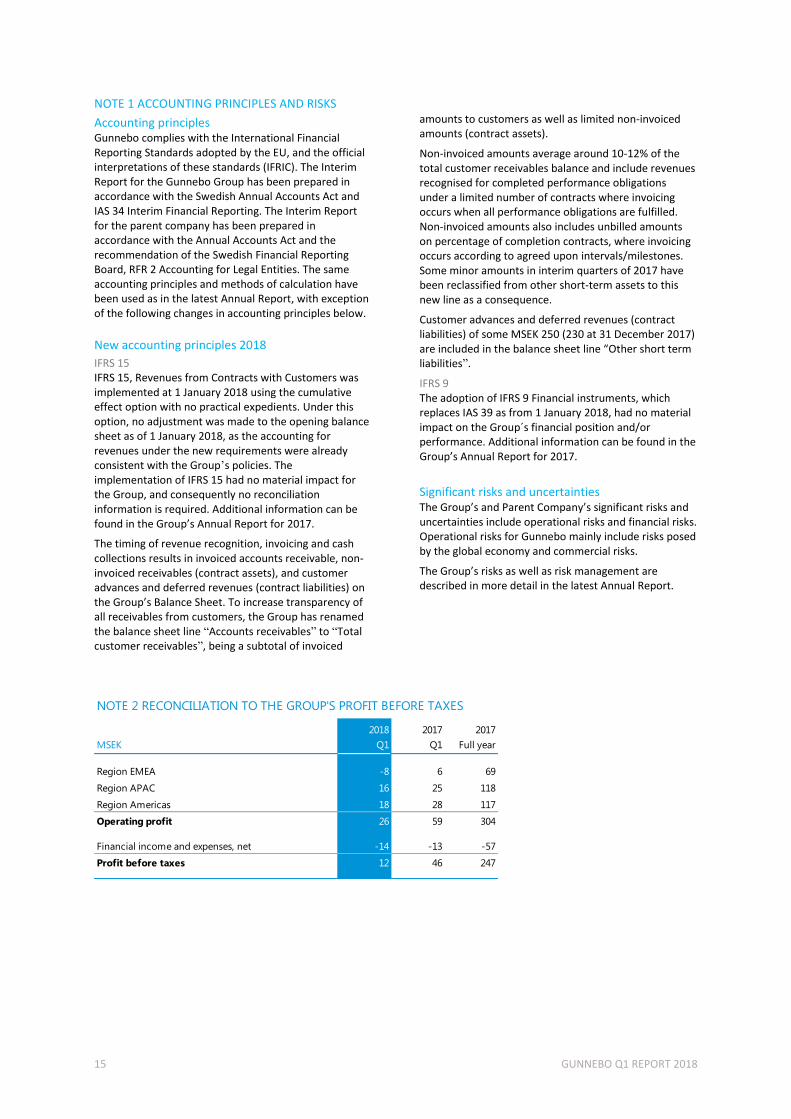
NOTE 1 ACCOUNTING PRINCIPLES AND RISKS
Accounting principles Gunnebo complies with the International Financial Reporting Standards adopted by the EU, and the official interpretations of these standards (IFRIC). The Interim Report for the Gunnebo Group has been prepared in accordance with the Swedish Annual Accounts Act and IAS 34 Interim Financial Reporting. The Interim Report for the parent company has been prepared in accordance with the Annual Accounts Act and the recommendation of the Swedish Financial Reporting Board, RFR 2 Accounting for Legal Entities. The same accounting principles and methods of calculation have been used as in the latest Annual Report, with exception of the following changes in accounting principles below.
New accounting principles 2018
IFRS 15 IFRS 15, Revenues from Contracts with Customers was implemented at 1 January 2018 using the cumulative effect option with no practical expedients. Under this option, no adjustment was made to the opening balance sheet as of 1 January 2018, as the accounting for revenues under the new requirements were already consistent with the Group’s policies. The implementation of IFRS 15 had no material impact for the Group, and consequently no reconciliation information is required. Additional information can be found in the Group’s Annual Report for 2017.
The timing of revenue recognition, invoicing and cash collections results in invoiced accounts receivable, non-invoiced receivables (contract assets), and customer advances and deferred revenues (contract liabilities) on the Group’s Balance Sheet. To increase transparency of all receivables from customers, the Group has renamed the balance sheet line “Accounts receivables” to “Total customer receivables”, being a subtotal of invoiced
amounts to customers as well as limited non-invoiced amounts (contract assets).
Non-invoiced amounts average around 10-12% of the total customer receivables balance and include revenues recognised for completed performance obligations under a limited number of contracts where invoicing occurs when all performance obligations are fulfilled. Non-invoiced amounts also includes unbilled amounts on percentage of completion contracts, where invoicing occurs according to agreed upon intervals/milestones. Some minor amounts in interim quarters of 2017 have been reclassified from other short-term assets to this new line as a consequence.
Customer advances and deferred revenues (contract liabilities) of some MSEK 250 (230 at 31 December 2017) are included in the balance sheet line “Other short term liabilities”.
IFRS 9 The adoption of IFRS 9 Financial instruments, which replaces IAS 39 as from 1 January 2018, had no material impact on the Group´s financial position and/or performance. Additional information can be found in the Group’s Annual Report for 2017.
Significant risks and uncertainties
The Group’s and Parent Company’s significant risks and uncertainties include operational risks and financial risks. Operational risks for Gunnebo mainly include risks posed by the global economy and commercial risks.
The Group’s risks as well as risk management are described in more detail in the latest Annual Report.
NOTE 2 RECONCILIATION TO THE GROUP'S PROFIT BEFORE TAXES
2018 2017 2017
MSEK Q1 Q1 Full year
Region EMEA -8 6 69
Region APAC 16 25 118
Region Americas 18 28 117
Operating profit 26 59 304
Financial income and expenses, net -14 -13 -57
Profit before taxes 12 46 247
16 GUNNEBO Q1 REPORT 2018
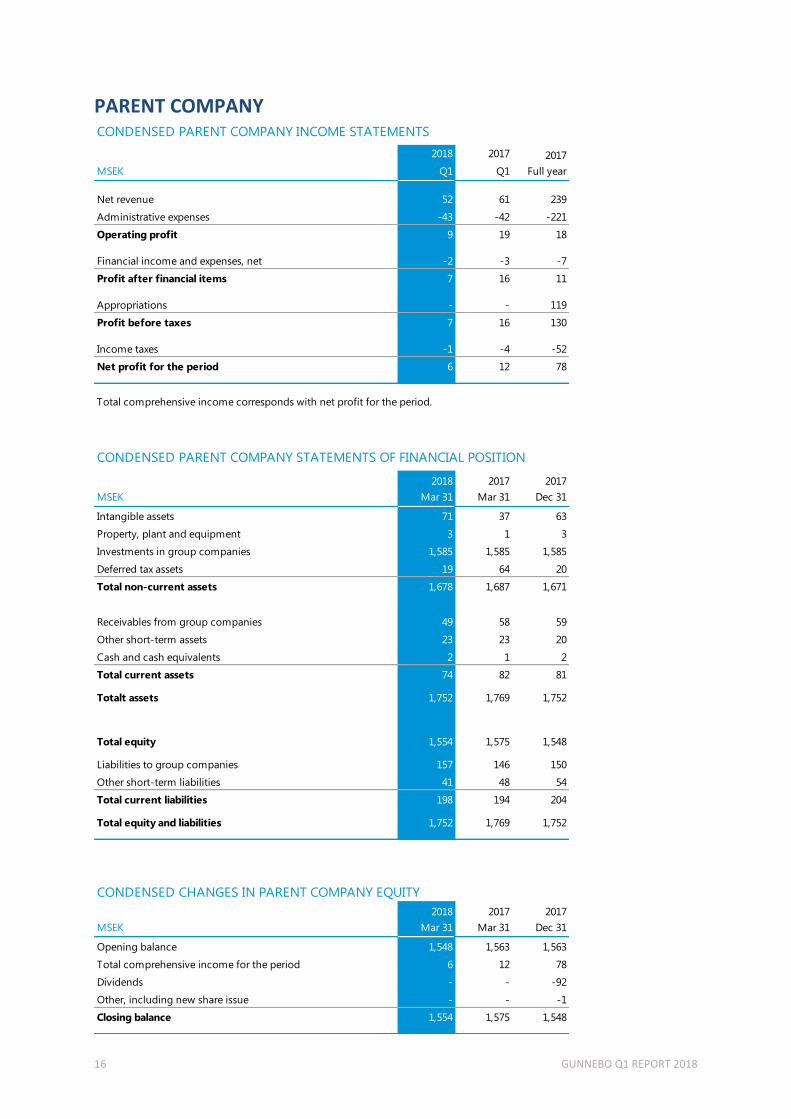
PARENT COMPANY CONDENSED PARENT COMPANY INCOME STATEMENTS
2018 2017 2017
MSEK Q1 Q1 Full year
Net revenue 52 61 239
Administrative expenses -43 -42 -221
Operating profit 9 19 18
Financial income and expenses, net -2 -3 -7
Profit after financial items 7 16 11
Appropriations - - 119
Profit before taxes 7 16 130
Income taxes -1 -4 -52
Net profit for the period 6 12 78
Total comprehensive income corresponds with net profit for the period.
CONDENSED PARENT COMPANY STATEMENTS OF FINANCIAL POSITION
2018 2017 2017
MSEK Mar 31 Mar 31 Dec 31
Intangible assets 71 37 63
Property, plant and equipment 3 1 3
Investments in group companies 1,585 1,585 1,585
Deferred tax assets 19 64 20
Total non-current assets 1,678 1,687 1,671
Receivables from group companies 49 58 59
Other short-term assets 23 23 20
Cash and cash equivalents 2 1 2
Total current assets 74 82 81
Totalt assets 1,752 1,769 1,752
Total equity 1,554 1,575 1,548
Liabilities to group companies 157 146 150
Other short-term liabilities 41 48 54
Total current liabilities 198 194 204
Total equity and liabilities 1,752 1,769 1,752
CONDENSED CHANGES IN PARENT COMPANY EQUITY
2018 2017 2017
MSEK Mar 31 Mar 31 Dec 31
Opening balance 1,548 1,563 1,563
Total comprehensive income for the period 6 12 78
Dividends - - -92
Other, including new share issue - - -1
Closing balance 1,554 1,575 1,548

17 GUNNEBO Q1 REPORT 2018
DEFINITIONS In the Interim Report, Gunnebo presents certain key performance measures that are not defined according to IFRS. The Group believes that these measures provide investors and the management with valuable supplementary disclosures, since they enable a valuation of the Group´s financial results and position. Since not all companies calculate performance measures in the same way, these are not always comparable with measures used by other companies. Definitions of Gunnebo key performance measures which are not defined according to IFRS are presented below.
Key performance measures according to IFRS
Basic earnings per share Net profit attributable to the Parent Company’s shareholders divided by the weighted average number of shares excluding C-shares as these have no dividend rights.
Diluted earnings per share Net profit attributable to the Parent Company’s shareholders divided by the weighted average number of shares excluding C-shares as these have no dividend rights, after dilution.
Key performance measures not defined according to IFRS
Capital employed Total assets less non-interest-bearing provisions and liabilities.
Capital employed turnover rate Net sales rolling 12 months in relation to average capital employed.
Debt/equity ratio Net debt in relation to equity.
EBITDA Operating profit before depreciation/amortisation and impairment of intangible assets and property, plant and equipment.
EBITDA margin EBITDA as a percentage of net sales.
Equity per share Equity attributable to the shareholders of the Parent Company divided by the number of shares excluding C-shares as these have no dividend rights, at the end of the period.
Equity ratio Equity as a percentage of the total assets.
Free cash flow Cash flow from operating and investing activities, excluding acquisitions and divestments.
Free cash flow per share Free cash flow divided by weighted average number of shares excluding C-shares as these have no dividend rights.
Gross margin Gross profit as a percentage of net sales.
Interest coverage ratio Profit before taxes excluding interest expense, divided by interest expense.
Items affecting comparability (IAC)
Items affecting comparability encompass restructuring programmes (closure of businesses and/or employee related costs) and other items affecting comparability.
Net debt Interest-bearing provisions and liabilities less cash and cash equivalents and interest-bearing receivables.
Net debt/EBITDA Net debt divided by EBITDA rolling 12 months.
Operating margin (EBIT) Operating profit as a percentage of net sales.
Organic growth Growth in net sales adjusted for acquisitions, divestments and exchange rate effects.
Profit margin Profit before taxes as a percentage of net sales.
Return on capital employed Operating profit plus financial income rolling 12 months as a percentage of average capital employed.
Return on equity Net profit for rolling 12 months as a percentage of average equity.
For a reconciliation of key performance measures, refer to gunnebogroup.com/en/investors/financial-definitions

18 GUNNEBO Q1 REPORT 2018
Financial Calendar 2018/2019
About Gunnebo Gunnebo is a global security provider with an offering covering cash management, entrance security, safes and vaults as well as electronic security. The Group has an annual turnover of MSEK 6,000 and 5,200 employees in 28 countries worldwide. Gunnebo has 10 production units in 9 countries. Gunnebo’s share (GUNN) is traded on NASDAQ Stockholm under Mid Cap and Industrials.
Vision To be the leading global provider of a safer future.
Customer segments Bank Central, national, regional and local banks, pawn shops and other
financial institutions.
Retail Shops, restaurants, casinos, mass transit, post offices, public services
such as libraries and other organisations outside of the bank segment that
handle cash in their day-to-day operations.
Mass Transit Public rail, bus and metro networks and airports, which
transport large volumes of passengers.
Public & Commercial buildings Includes company and government offices,
administrative centres and public buildings.
Industrial & High-Risk Sites Includes factories, logistics companies, power
plants, stadia, ports, prisons and casinos.
Mission Gunnebo’s mission is to offer products, services and solutions that increase security and efficiency, and to create value for shareholders, customers, partners, employees and society on a global scale.
Product Areas Cash Management Development, production, installation and service of cash management solutions for deposit, dispense, recycling and closed cash management. Marketed and sold under the Gunnebo brand with strong product brands as SafePay and Sallén. Entrance Security Development, production, installation and service of turnstiles, security doors & partitions and electronic article surveillance (EAS). Marketed and sold under the Gunnebo and Gateway (EAS) brands. Safes & Vaults Development, production, installation and service of safes, vaults, vault doors, safe deposit lockers (SDL’s) and ATM safes. Marketed and sold under world leading brands such as Chubbsafes and Fichet-Bauche. Electronic Security Development, production, installation and service of solutions for remote surveillance, access control, intrusion detection and electronic locking. Marketed and sold under the Gunnebo brand. Other Development, production, installation and service of solutions for fire safety and other traded products.
JUL AUG SEPT OCT NOV DEC JAN FEB MAR APR
Interim Report Q3 2018 23 October 2018
Interim Report Q2 2018 19 July 2018
Year-End report 2018 6 February 2019
AGM 2019 11 April 2019
19 GUNNEBO Q1 REPORT 2018
Contacts
Karin Wallström Nordén, SVP Marketing & Communications +46 (0)10 2095 026
Susanne Larsson, Group Chief Financial Officer +46 (0)10 2095 092
This information is information that Gunnebo AB is obliged to make public pursuant to the EU Market Abuse Regulation. The information was submitted for publication, through the contact persons, at 08.01 CET on 24 April 2018.
Gunnebo
Gunnebo AB (publ) | Reg. no. 556438-2629 | Box 5181, SE-402 26 Gothenburg, Sweden.
Tel: +46 (0)10 2095 000 | e-mail: [email protected] | www.gunnebogroup.com