THIRD QUARTER 2016 · EBITDA: ($ 7.9M) Loss Solar Grade Polysilicon Market Disruption ... Module...
28
THIRD QUARTER 2016 PRESENTATION
Transcript of THIRD QUARTER 2016 · EBITDA: ($ 7.9M) Loss Solar Grade Polysilicon Market Disruption ... Module...
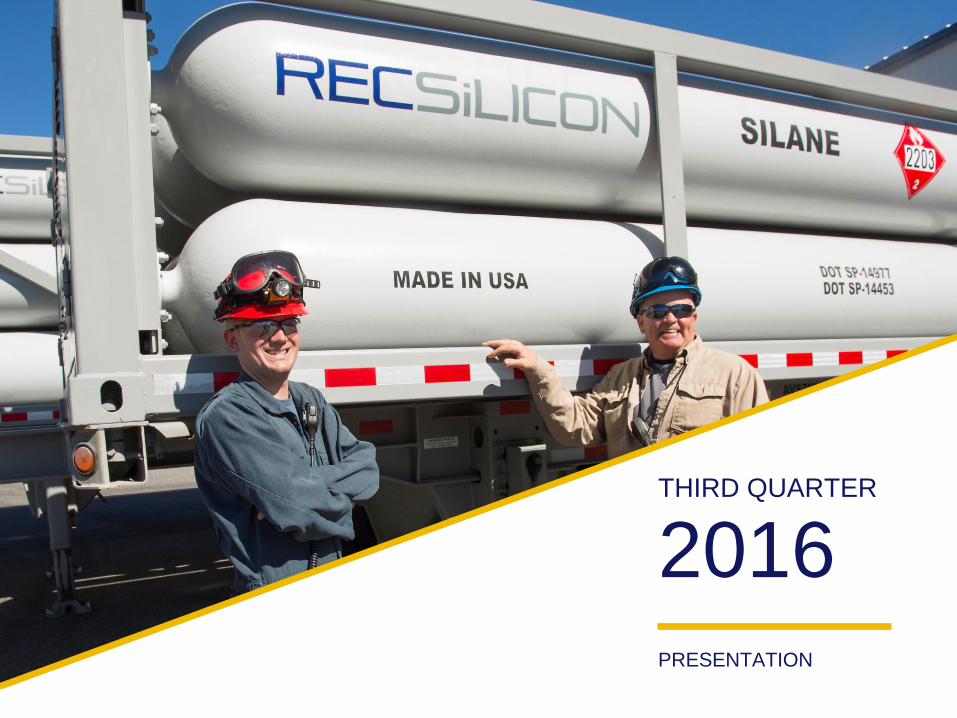
THIRD QUARTER
2016PRESENTATION
2 © REC Silicon ASA. All rights reserved. Confidential
This presentation includes and is based, inter alia, on forward-looking information and statements that are subject to risks and uncertainties that could cause actual results to differ. These statements and this presentation are based on current expectations, estimates and projections about global economic conditions, the economic conditions of the regions and industries that are major markets for REC Silicon ASA’s (including subsidiaries and affiliates) lines of business. These expectations, estimates and projections are generally identifiable by statements containing words such as ”expects”, ”believes”, ”estimates” or similar expressions. Important factors that could cause actual results to differ materially from those expectations include, among others, economic and market conditions in the geographic areas and industries that are or will be major markets for REC Silicon ASA’s businesses, energy prices, market acceptance of new products and services, changes in governmental regulations, interest rates, fluctuations in currency exchange rates and such other factors as may be discussed from time to time in the presentation. Although REC Silicon ASA believes that its expectations and the presentation are based upon reasonable assumptions, it can give no assurance that those expectations will be achieved or that the actual results will be as set out in the presentation. REC Silicon ASA makes no representations or warranties, expressed or implied, as to the accuracy, reliability or completeness of the presentation, and neither REC Silicon ASA nor any of its directors, officers or employees will have any liability to you or any other persons resulting from your use.
This presentation was prepared for the third quarter 2016 results on November 2, 2016. Information contained herein will not be updated. The following slides should be read and considered in connection with the information given orally during the presentation.
REC Silicon ASA shares have not been registered under the U.S. Securities Act of 1933, as amended (the "Act"), and may not be offered or sold in the United States absent registration or an applicable exemption from the registration requirementsof the Act.
Disclaimer
November 2, 2016
3 © REC Silicon ASA. All rights reserved. Confidential
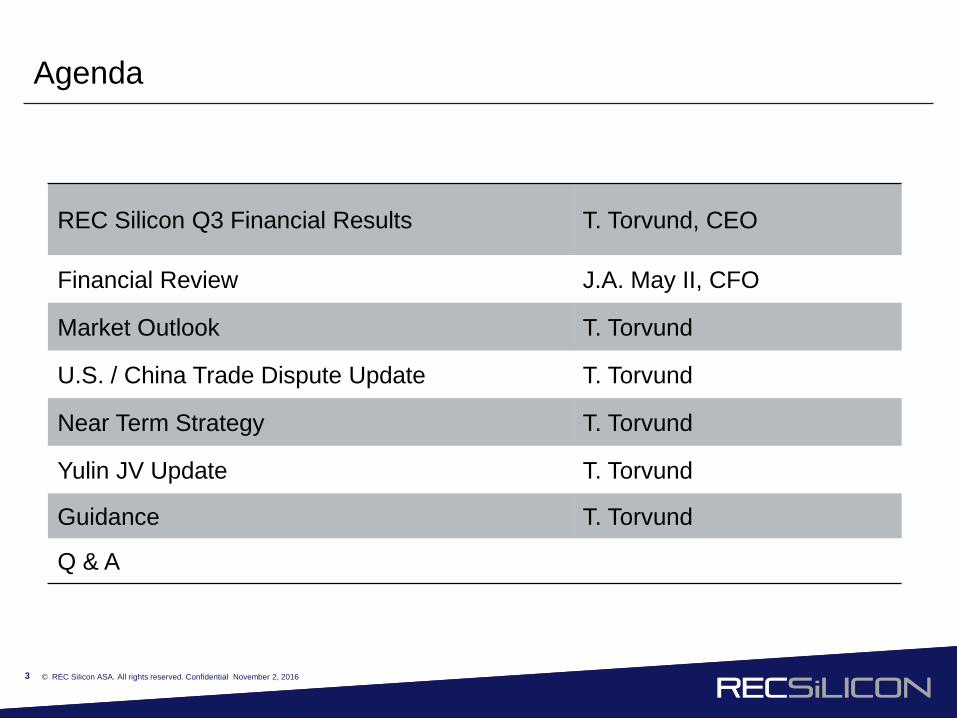
Agenda
REC Silicon Q3 Financial Results T. Torvund, CEO
Financial Review J.A. May II, CFO
Market Outlook T. Torvund
U.S. / China Trade Dispute Update T. Torvund
Near Term Strategy T. Torvund
Yulin JV Update T. Torvund
Guidance T. Torvund
Q & A
November 2, 2016
4 © REC Silicon ASA. All rights reserved. Confidential
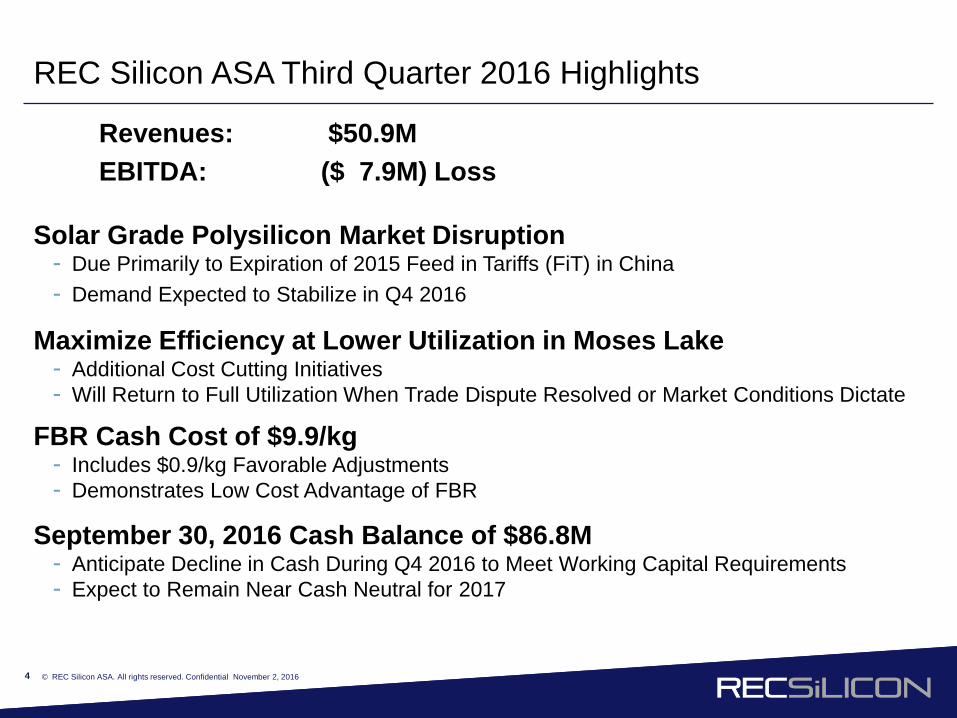
REC Silicon ASA Third Quarter 2016 Highlights
Revenues: $50.9MEBITDA: ($ 7.9M) Loss
Solar Grade Polysilicon Market Disruption- Due Primarily to Expiration of 2015 Feed in Tariffs (FiT) in China- Demand Expected to Stabilize in Q4 2016
Maximize Efficiency at Lower Utilization in Moses Lake - Additional Cost Cutting Initiatives- Will Return to Full Utilization When Trade Dispute Resolved or Market Conditions Dictate
FBR Cash Cost of $9.9/kg- Includes $0.9/kg Favorable Adjustments- Demonstrates Low Cost Advantage of FBR
September 30, 2016 Cash Balance of $86.8M- Anticipate Decline in Cash During Q4 2016 to Meet Working Capital Requirements- Expect to Remain Near Cash Neutral for 2017
November 2, 2016
5 © REC Silicon ASA. All rights reserved. Confidential
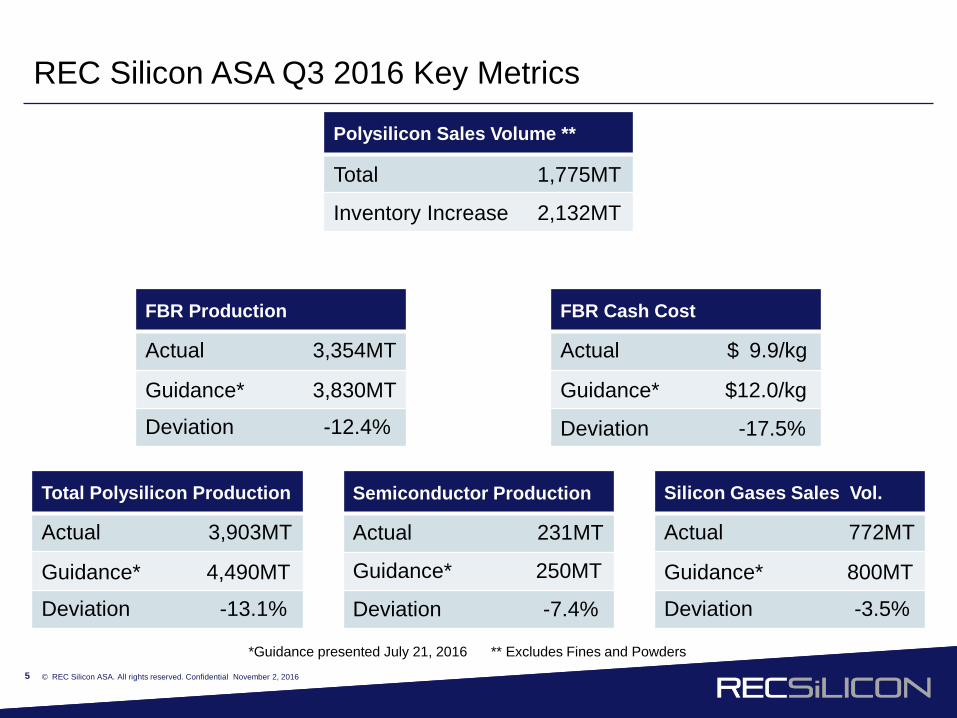
REC Silicon ASA Q3 2016 Key Metrics
November 2, 2016
FBR Production
Actual 3,354MT
Guidance* 3,830MT
Deviation -12.4%
FBR Cash Cost
Actual $ 9.9/kg
Guidance* $12.0/kg
Deviation -17.5%
Silicon Gases Sales Vol.
Actual 772MT
Guidance* 800MT
Deviation -3.5%
Total Polysilicon Production
Actual 3,903MT
Guidance* 4,490MT
Deviation -13.1%
Polysilicon Sales Volume **
Total 1,775MT
Inventory Increase 2,132MT
*Guidance presented July 21, 2016 ** Excludes Fines and Powders
Semiconductor Production
Actual 231MT
Guidance* 250MT
Deviation -7.4%
6 © REC Silicon ASA. All rights reserved. Confidential
FINANCIAL REVIEW
7 © REC Silicon ASA. All rights reserved. Confidential
Q3 2016 Key Financial Results
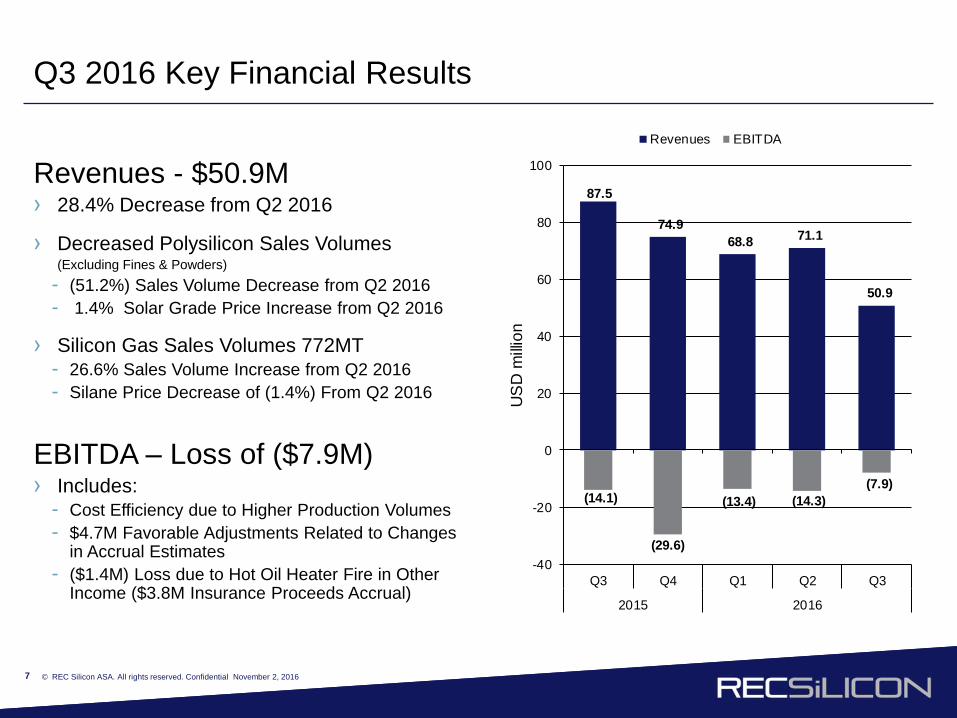
Revenues - $50.9M› 28.4% Decrease from Q2 2016
› Decreased Polysilicon Sales Volumes(Excluding Fines & Powders)- (51.2%) Sales Volume Decrease from Q2 2016- 1.4% Solar Grade Price Increase from Q2 2016
› Silicon Gas Sales Volumes 772MT- 26.6% Sales Volume Increase from Q2 2016- Silane Price Decrease of (1.4%) From Q2 2016
EBITDA – Loss of ($7.9M)› Includes:
- Cost Efficiency due to Higher Production Volumes- $4.7M Favorable Adjustments Related to Changes
in Accrual Estimates- ($1.4M) Loss due to Hot Oil Heater Fire in Other
Income ($3.8M Insurance Proceeds Accrual)
November 2, 2016
87.5
74.9 68.8 71.1
50.9
(14.1)
(29.6)
(13.4) (14.3)(7.9)
-40
-20
0
20
40
60
80
100
Q3 Q4 Q1 Q2 Q3
2015 2016
US
D m
illion
Revenues EBITDA
8 © REC Silicon ASA. All rights reserved. Confidential
Q3 2016 Cash Flows
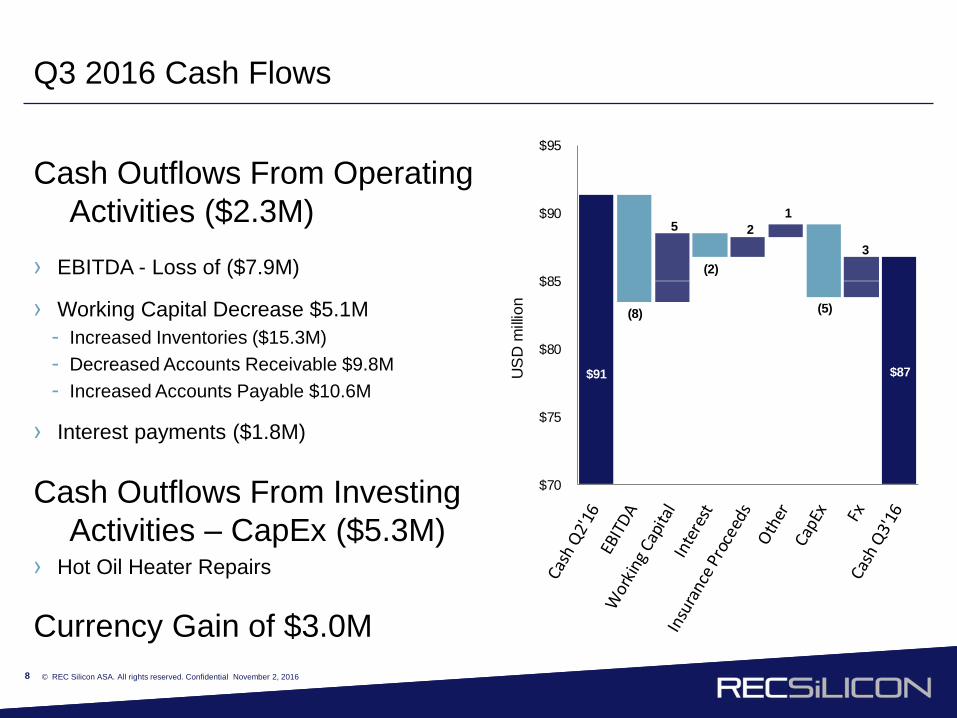
Cash Outflows From Operating Activities ($2.3M)
› EBITDA - Loss of ($7.9M)
› Working Capital Decrease $5.1M- Increased Inventories ($15.3M)- Decreased Accounts Receivable $9.8M- Increased Accounts Payable $10.6M
› Interest payments ($1.8M)
Cash Outflows From Investing Activities – CapEx ($5.3M)
› Hot Oil Heater Repairs
Currency Gain of $3.0MNovember 2, 2016
$91
$84
$87
5 2 1
3
(8)
(2)
(5)
$70
$75
$80
$85
$90
$95
US
D m
illion
9 © REC Silicon ASA. All rights reserved. Confidential
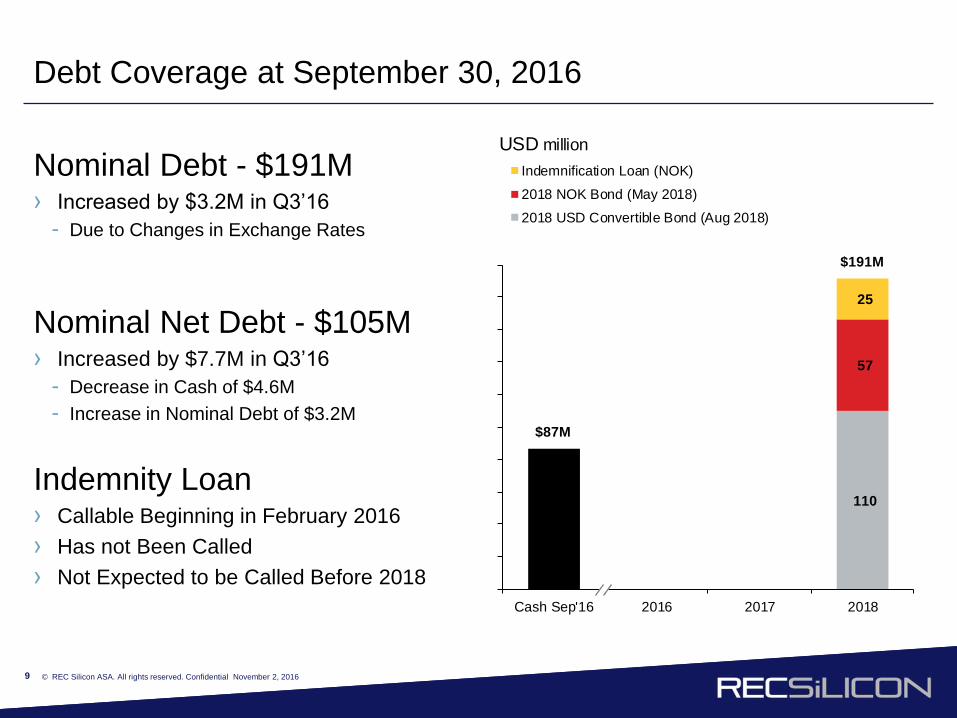
110
57
25
$87M
$191M
Cash Sep'16 2016 2017 2018
USD millionIndemnification Loan (NOK)
2018 NOK Bond (May 2018)
2018 USD Convertible Bond (Aug 2018)
Debt Coverage at September 30, 2016
Nominal Debt - $191M› Increased by $3.2M in Q3’16
- Due to Changes in Exchange Rates
Nominal Net Debt - $105M› Increased by $7.7M in Q3’16
- Decrease in Cash of $4.6M- Increase in Nominal Debt of $3.2M
Indemnity Loan› Callable Beginning in February 2016› Has not Been Called› Not Expected to be Called Before 2018
November 2, 2016
MARKET OUTLOOK
11 © REC Silicon ASA. All rights reserved. Confidential
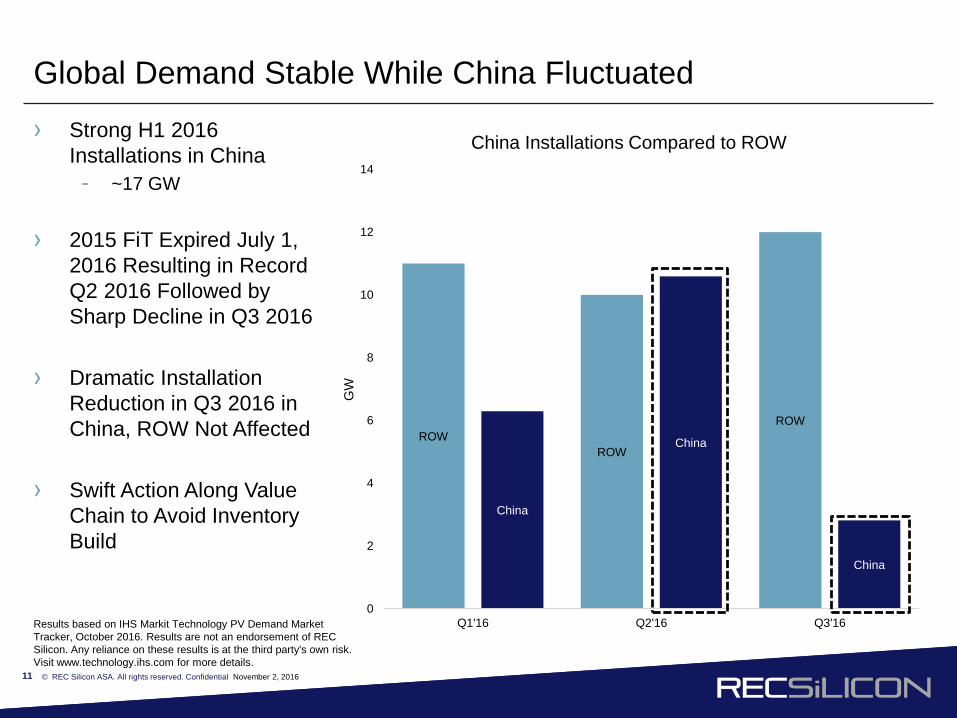
Global Demand Stable While China Fluctuated
› Strong H1 2016 Installations in China- ~17 GW
› 2015 FiT Expired July 1, 2016 Resulting in Record Q2 2016 Followed by Sharp Decline in Q3 2016
› Dramatic Installation Reduction in Q3 2016 in China, ROW Not Affected
› Swift Action Along Value Chain to Avoid Inventory Build
Results based on IHS Markit Technology PV Demand Market Tracker, October 2016. Results are not an endorsement of REC Silicon. Any reliance on these results is at the third party's own risk. Visit www.technology.ihs.com for more details.
ROWROW
ROW
China
China
China
0
2
4
6
8
10
12
14
Q1'16 Q2'16 Q3'16
GW
China Installations Compared to ROW
November 2, 2016
12 © REC Silicon ASA. All rights reserved. Confidential
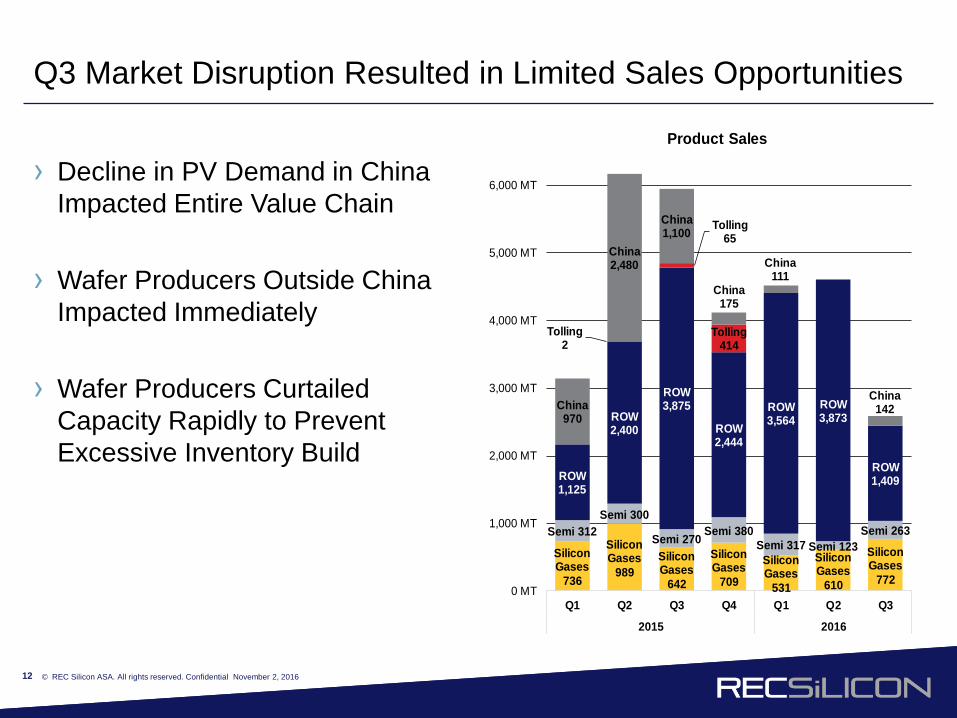
Q3 Market Disruption Resulted in Limited Sales Opportunities
› Decline in PV Demand in China Impacted Entire Value Chain
› Wafer Producers Outside China Impacted Immediately
› Wafer Producers Curtailed Capacity Rapidly to Prevent Excessive Inventory Build
November 2, 2016
SiliconGases
736
SiliconGases
989SiliconGases
642
SiliconGases
709
SiliconGases
531
SiliconGases
610
SiliconGases
772
Semi 312Semi 300
Semi 270 Semi 380Semi 317 Semi 123
Semi 263
ROW1,125
ROW2,400
ROW3,875
ROW2,444
ROW3,564
ROW3,873
ROW1,409
Tolling2
Tolling65
Tolling414
China970
China2,480
China1,100
China175
China111
China142
0 MT
1,000 MT
2,000 MT
3,000 MT
4,000 MT
5,000 MT
6,000 MT
Q1 Q2 Q3 Q4 Q1 Q2 Q3
2015 2016
Product Sales

13 © REC Silicon ASA. All rights reserved. Confidential
Demand Recovery in China Depends on FiT Decisions
November 2, 2016
Results based on IHS Markit Technology PV Demand Market Tracker, October 2016. Results are not an endorsement of REC Silicon. Any reliance on these results is at the third party's own risk. Visit www.technology.ihs.com for more details.
As of 26th October, the FiT policy amendment for China is yet to be finalized and the details have the potential to change, including current discussions around an extension of the proposed grace period. Until the FiT policy is finalized, the demand forecast for China remains uncertain
› Current Draft 2016 FiT Policy: - Applicable to Projects Approved in
2016 and Installed by September 30, 2017 (Deadline Extended Compared to 2016)
› Demand Expected to Recover in H1 2017
› Uncertainty for H2 2017 Still Remains
Ground project2015
RMB/KWH(Approved: 2015; Expiration: July
2016)
Ground project2016
RMB/KWH(Approved: 2016;
Expiration: September2017)
Ground project2017
RMB/KWH(Approved: 2017)
Region-I 0.90 0.80 0.55
Region-II 0.95 0.88 0.65
Region-III 1.00 0.98 0.75
14 © REC Silicon ASA. All rights reserved. Confidential
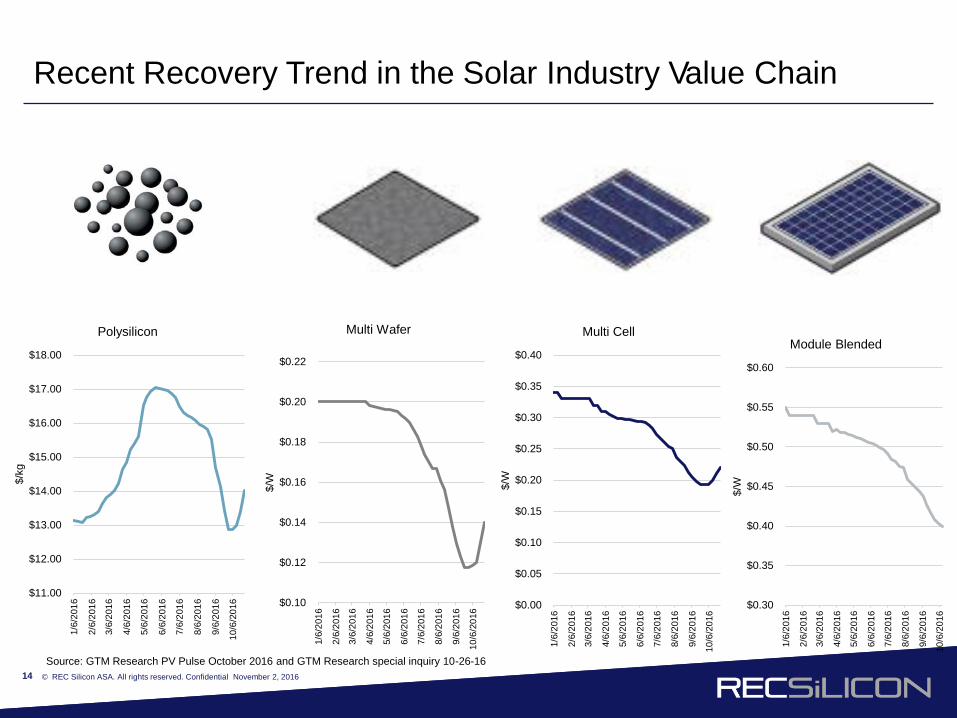
Recent Recovery Trend in the Solar Industry Value Chain
Source: GTM Research PV Pulse October 2016 and GTM Research special inquiry 10-26-16November 2, 2016
$11.00
$12.00
$13.00
$14.00
$15.00
$16.00
$17.00
$18.00
1/6/
2016
2/6/
2016
3/6/
2016
4/6/
2016
5/6/
2016
6/6/
2016
7/6/
2016
8/6/
2016
9/6/
2016
10/6
/201
6
$/kg
Polysilicon
$0.10
$0.12
$0.14
$0.16
$0.18
$0.20
$0.22
1/6/
2016
2/6/
2016
3/6/
2016
4/6/
2016
5/6/
2016
6/6/
2016
7/6/
2016
8/6/
2016
9/6/
2016
10/6
/201
6
$/W
Multi Wafer
$0.00
$0.05
$0.10
$0.15
$0.20
$0.25
$0.30
$0.35
$0.40
1/6/
2016
2/6/
2016
3/6/
2016
4/6/
2016
5/6/
2016
6/6/
2016
7/6/
2016
8/6/
2016
9/6/
2016
10/6
/201
6
$/W
Multi Cell
$0.30
$0.35
$0.40
$0.45
$0.50
$0.55
$0.60
1/6/
2016
2/6/
2016
3/6/
2016
4/6/
2016
5/6/
2016
6/6/
2016
7/6/
2016
8/6/
2016
9/6/
2016
10/6
/201
6
$/W
Module Blended
15 © REC Silicon ASA. All rights reserved. Confidential
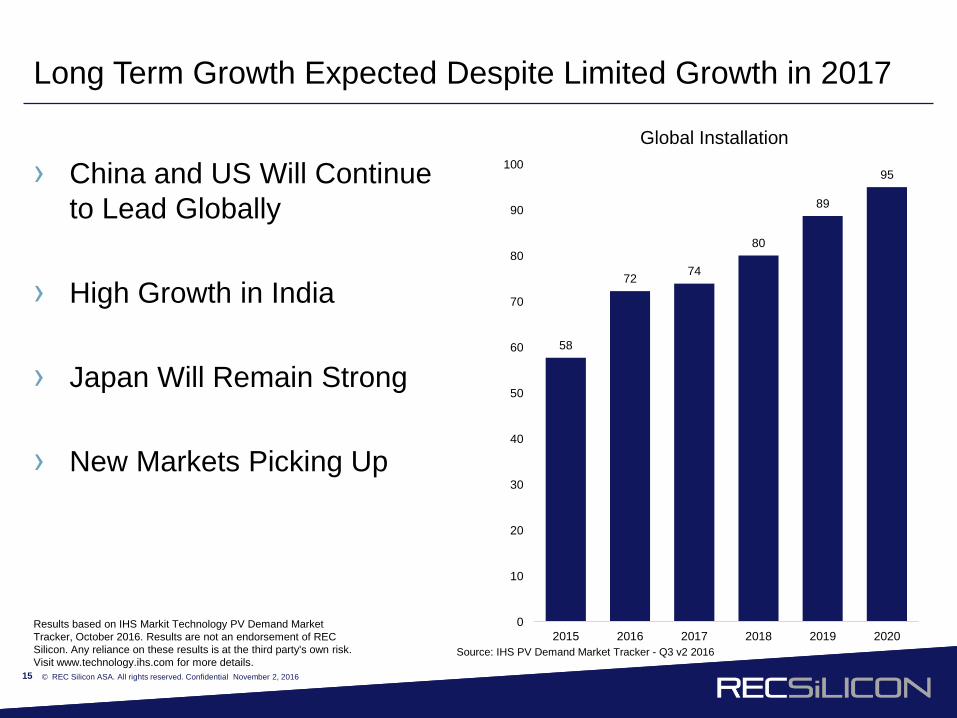
Long Term Growth Expected Despite Limited Growth in 2017
› China and US Will Continue to Lead Globally
› High Growth in India
› Japan Will Remain Strong
› New Markets Picking Up
November 2, 2016
Results based on IHS Markit Technology PV Demand Market Tracker, October 2016. Results are not an endorsement of REC Silicon. Any reliance on these results is at the third party's own risk. Visit www.technology.ihs.com for more details.
58
72 74
80
89
95
0
10
20
30
40
50
60
70
80
90
100
2015 2016 2017 2018 2019 2020
Global Installation
Source: IHS PV Demand Market Tracker - Q3 v2 2016
U.S./ CHINA TRADE DISPUTE UPDATE
17 © REC Silicon ASA. All rights reserved. Confidential
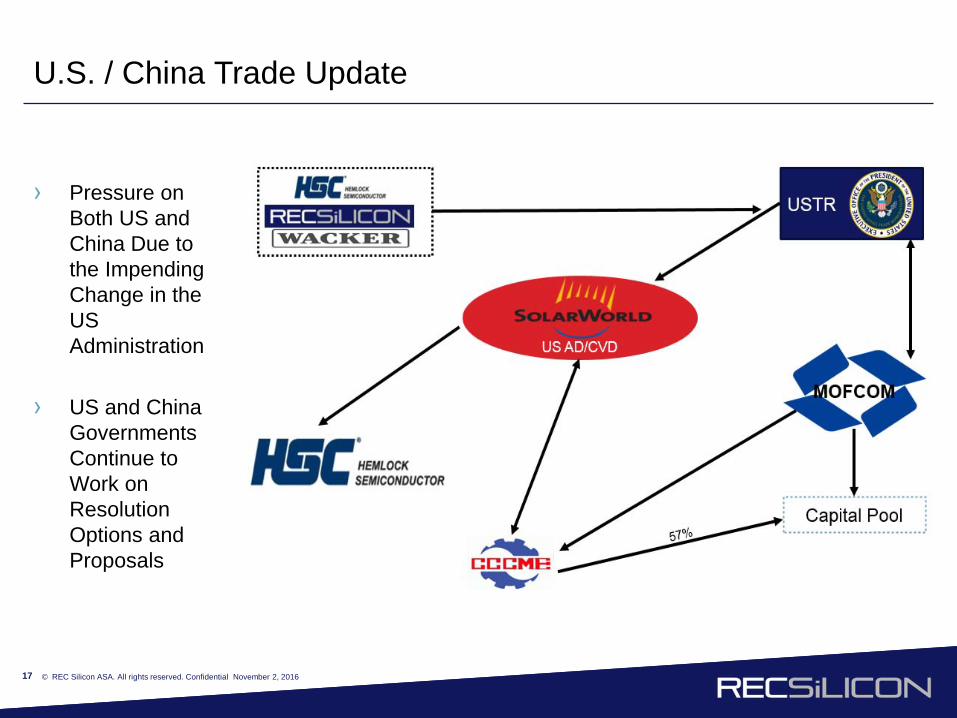
U.S. / China Trade Update
› Pressure on Both US and China Due to the Impending Change in the US Administration
› US and China Governments Continue to Work on Resolution Options and Proposals
November 2, 2016
18 © REC Silicon ASA. All rights reserved. Confidential
NEAR TERM STRATEGY
19 © REC Silicon ASA. All rights reserved. Confidential
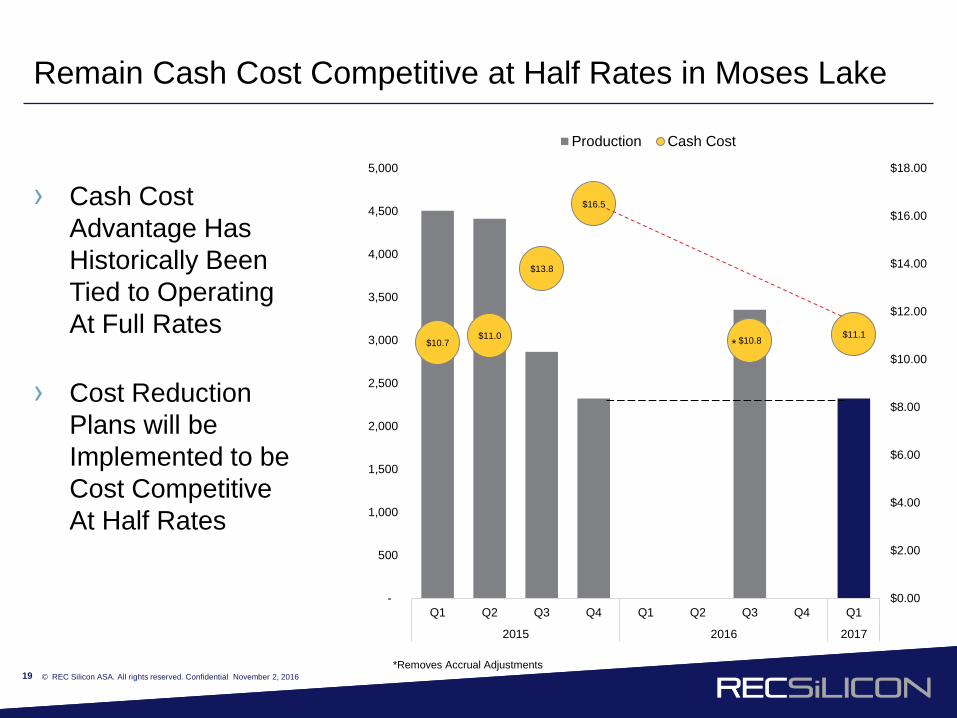
Remain Cash Cost Competitive at Half Rates in Moses Lake
November 2, 2016
$10.7$11.0
$13.8
$16.5
$10.8 $11.1
$0.00
$2.00
$4.00
$6.00
$8.00
$10.00
$12.00
$14.00
$16.00
$18.00
-
500
1,000
1,500
2,000
2,500
3,000
3,500
4,000
4,500
5,000
Q1 Q2 Q3 Q4 Q1 Q2 Q3 Q4 Q1
2015 2016 2017
Production Cash Cost
› Cash Cost Advantage Has Historically Been Tied to Operating At Full Rates
› Cost Reduction Plans will be Implemented to be Cost Competitive At Half Rates
*
*Removes Accrual Adjustments
20 © REC Silicon ASA. All rights reserved. Confidential
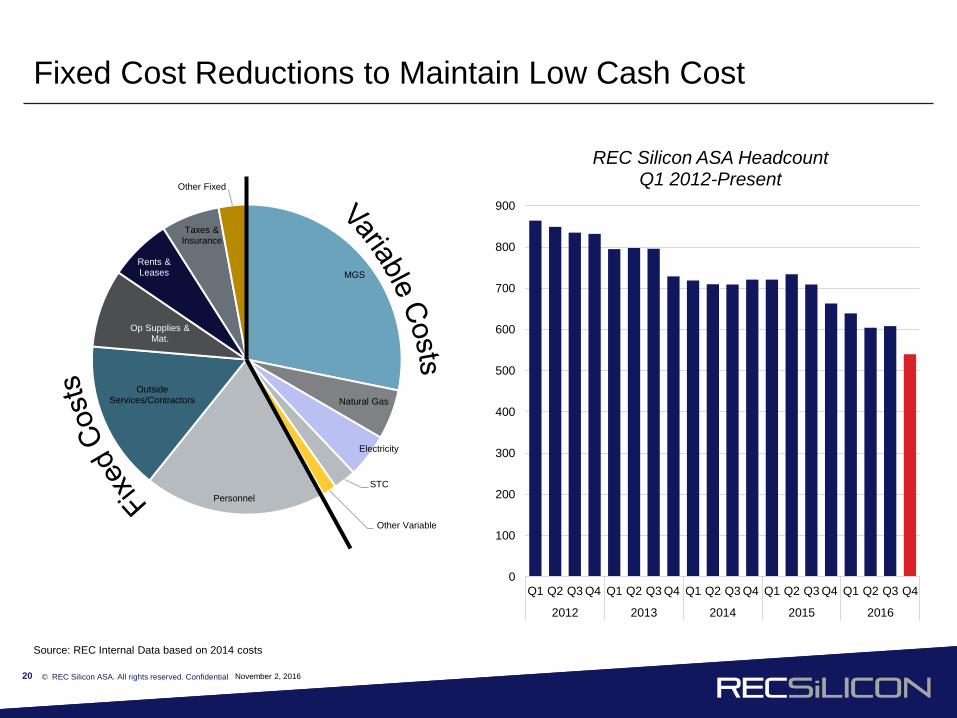
Fixed Cost Reductions to Maintain Low Cash Cost
MGS
Natural Gas
Electricity
STC
Other Variable
Personnel
Outside Services/Contractors
Op Supplies & Mat.
Rents & Leases
Taxes & Insurance
Other Fixed
Source: REC Internal Data based on 2014 costs
0
100
200
300
400
500
600
700
800
900
Q1 Q2 Q3 Q4 Q1 Q2 Q3 Q4 Q1 Q2 Q3 Q4 Q1 Q2 Q3 Q4 Q1 Q2 Q3 Q4
2012 2013 2014 2015 2016
REC Silicon ASA HeadcountQ1 2012-Present
November 2, 2016
21 © REC Silicon ASA. All rights reserved. Confidential November 2, 2016
YULIN JV UPDATE
22 © REC Silicon ASA. All rights reserved. Confidential
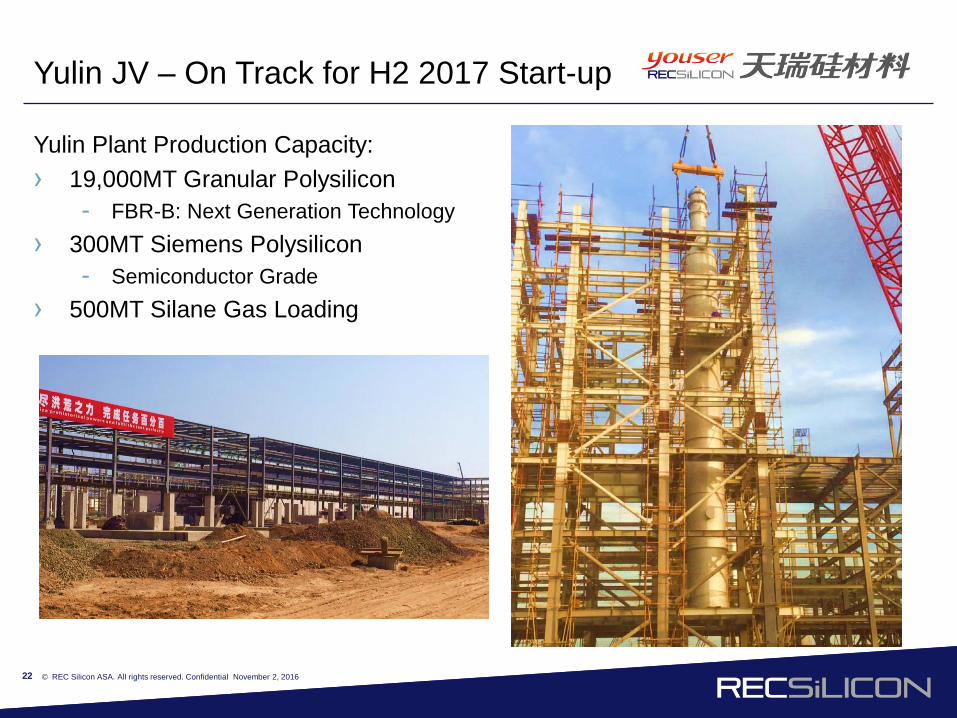
Yulin JV – On Track for H2 2017 Start-up
Yulin Plant Production Capacity:› 19,000MT Granular Polysilicon
- FBR-B: Next Generation Technology› 300MT Siemens Polysilicon
- Semiconductor Grade› 500MT Silane Gas Loading
November 2, 2016
23 © REC Silicon ASA. All rights reserved. Confidential
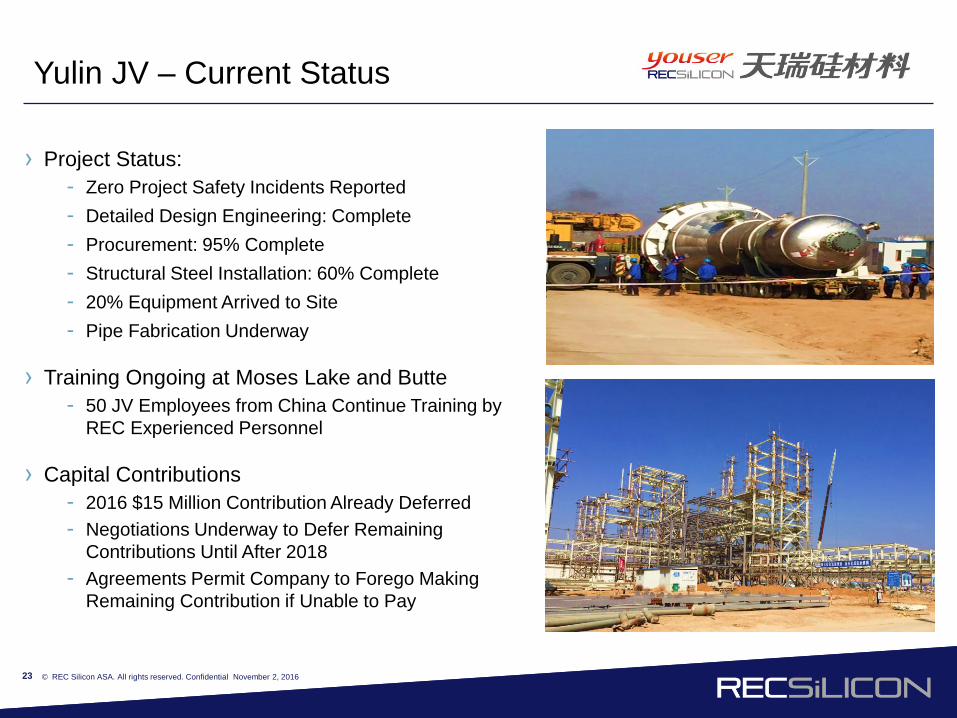
Yulin JV – Current Status
› Project Status:- Zero Project Safety Incidents Reported- Detailed Design Engineering: Complete- Procurement: 95% Complete- Structural Steel Installation: 60% Complete- 20% Equipment Arrived to Site- Pipe Fabrication Underway
› Training Ongoing at Moses Lake and Butte- 50 JV Employees from China Continue Training by
REC Experienced Personnel
› Capital Contributions - 2016 $15 Million Contribution Already Deferred - Negotiations Underway to Defer Remaining
Contributions Until After 2018- Agreements Permit Company to Forego Making
Remaining Contribution if Unable to Pay
November 2, 2016
GUIDANCE
25 © REC Silicon ASA. All rights reserved. Confidential
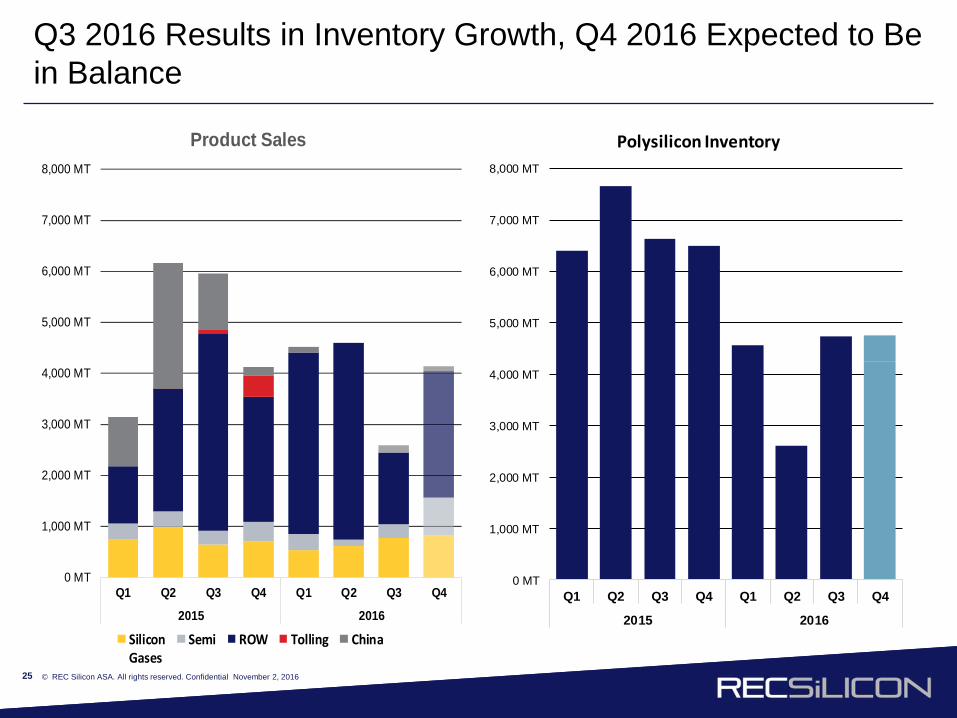
Q3 2016 Results in Inventory Growth, Q4 2016 Expected to Be in Balance
November 2, 2016
0 MT
1,000 MT
2,000 MT
3,000 MT
4,000 MT
5,000 MT
6,000 MT
7,000 MT
8,000 MT
Q1 Q2 Q3 Q4 Q1 Q2 Q3 Q4
2015 2016
Product Sales
SiliconGases
Semi ROW Tolling China
0 MT
1,000 MT
2,000 MT
3,000 MT
4,000 MT
5,000 MT
6,000 MT
7,000 MT
8,000 MT
Q1 Q2 Q3 Q4 Q1 Q2 Q3 Q4
2015 2016
Polysilicon Inventory
26 © REC Silicon ASA. All rights reserved. Confidential
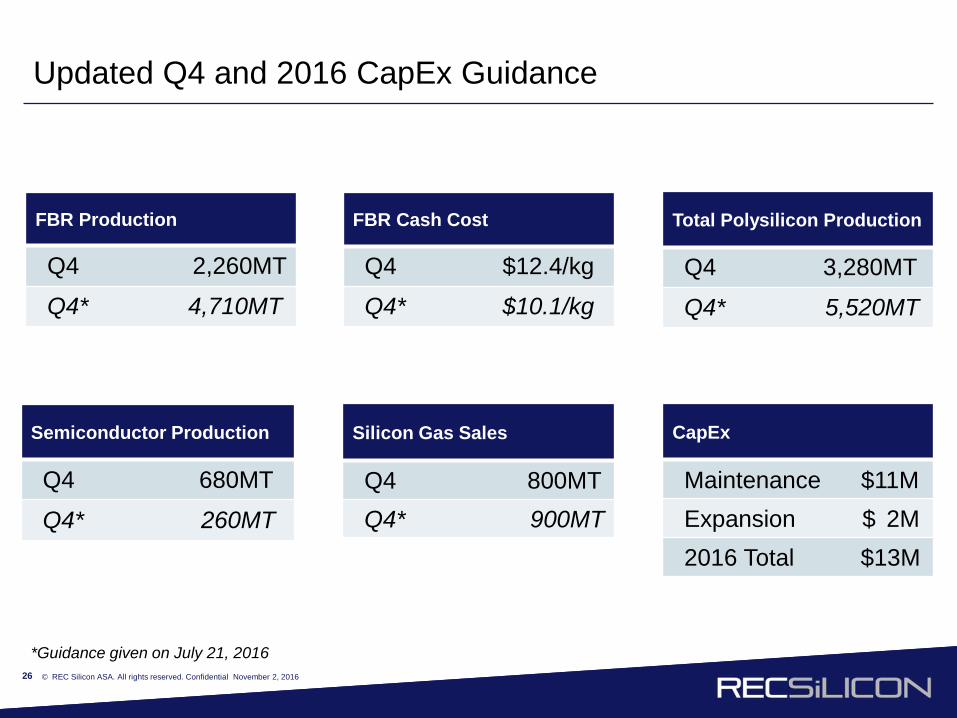
Updated Q4 and 2016 CapEx Guidance
FBR Production
Q4 2,260MT
Q4* 4,710MT
Semiconductor Production
Q4 680MT
Q4* 260MT
Silicon Gas Sales
Q4 800MTQ4* 900MT
FBR Cash Cost
Q4 $12.4/kg
Q4* $10.1/kg
Total Polysilicon Production
Q4 3,280MT
Q4* 5,520MT
CapEx
Maintenance $11MExpansion $ 2M2016 Total $13M
November 2, 2016
*Guidance given on July 21, 2016
27 © REC Silicon ASA. All rights reserved. Confidential
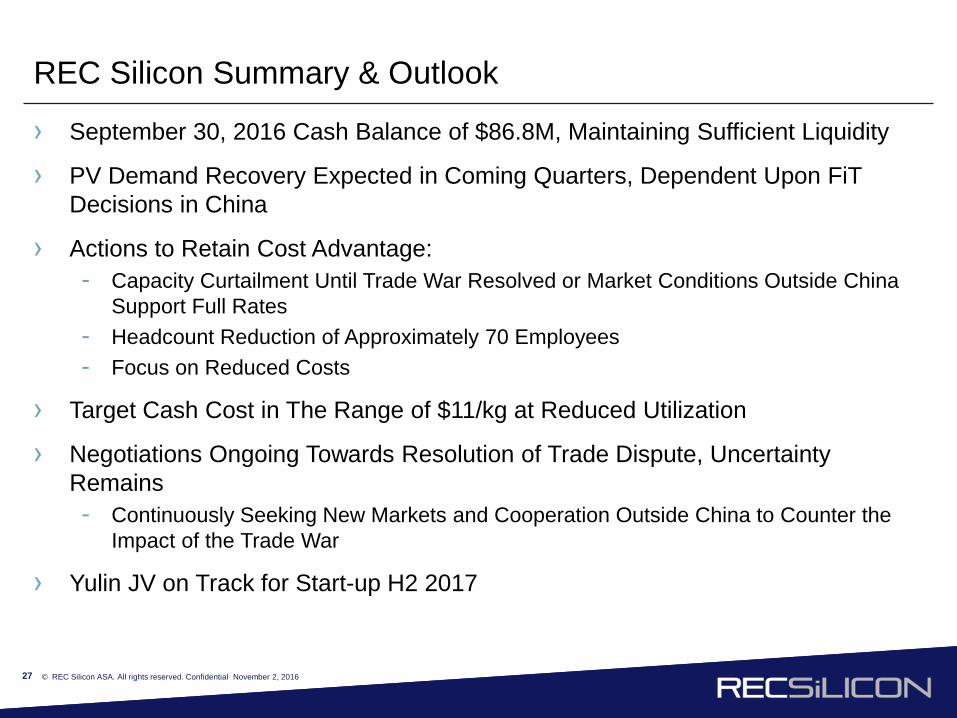
REC Silicon Summary & Outlook
› September 30, 2016 Cash Balance of $86.8M, Maintaining Sufficient Liquidity
› PV Demand Recovery Expected in Coming Quarters, Dependent Upon FiTDecisions in China
› Actions to Retain Cost Advantage:- Capacity Curtailment Until Trade War Resolved or Market Conditions Outside China
Support Full Rates- Headcount Reduction of Approximately 70 Employees- Focus on Reduced Costs
› Target Cash Cost in The Range of $11/kg at Reduced Utilization
› Negotiations Ongoing Towards Resolution of Trade Dispute, Uncertainty Remains - Continuously Seeking New Markets and Cooperation Outside China to Counter the
Impact of the Trade War
› Yulin JV on Track for Start-up H2 2017
November 2, 2016
28 © REC Silicon ASA. All rights reserved. Confidential
Q4 2016 ReportingFebruary 16, 2017