
Q1 2015 Global Talent Market Quarterly
21
Global Talent Market Quarterly FIRST QUARTER l 2015
-
Upload
kelly-services -
Category
Career
-
view
1.747 -
download
5
Transcript of Q1 2015 Global Talent Market Quarterly

Global Talent Market QuarterlyFIRST QUARTER l 2015

Global Talent Market Quarterly
CONTENTS
3 Global Economic Situation • Outlook
• Briefing
6 Global Labor Market Update • Americas
• EMEA
• APAC
• Global Labor Market Spotlight
• Legislative Update
12 U.S. Labor Market Overview • Current Employment Conditions
• Supply and Demand
• Labor Market Spotlight
16 Workforce Solutions Industry Insight • Talent Imperatives for 2015
• On Board with Onboarding
• Active and Passive Candidate Recruiting
• The Talent Project

Global Economic SituationFIRST QUARTER l 2015
GLOBAL ECONOMIC OUTLOOK
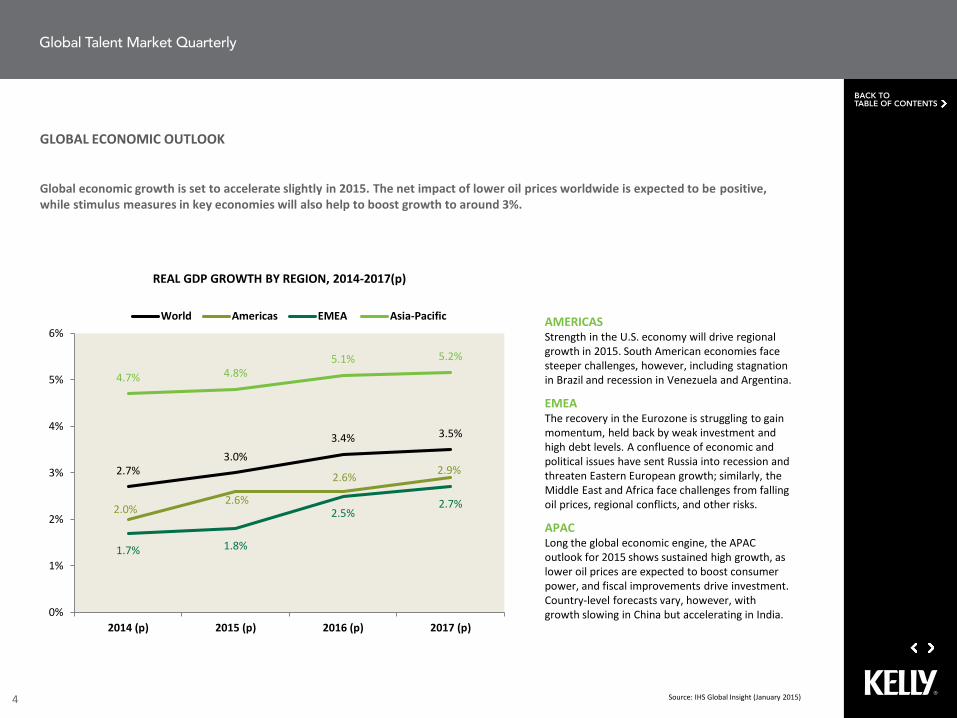
Global economic growth is set to accelerate slightly in 2015. The net impact of lower oil prices worldwide is expected to be positive, while stimulus measures in key economies will also help to boost growth to around 3%.
Source: IHS Global Insight (January 2015)4
AMERICASStrength in the U.S. economy will drive regional growth in 2015. South American economies face steeper challenges, however, including stagnation in Brazil and recession in Venezuela and Argentina.
EMEAThe recovery in the Eurozone is struggling to gain momentum, held back by weak investment and high debt levels. A confluence of economic and political issues have sent Russia into recession and threaten Eastern European growth; similarly, the Middle East and Africa face challenges from falling oil prices, regional conflicts, and other risks.
APACLong the global economic engine, the APAC outlook for 2015 shows sustained high growth, as lower oil prices are expected to boost consumer power, and fiscal improvements drive investment. Country-level forecasts vary, however, with growth slowing in China but accelerating in India.
2.7%3.0%
3.4% 3.5%
2.0%2.6%
2.6% 2.9%
1.7% 1.8%
2.5%2.7%
4.7% 4.8%5.1% 5.2%
0%
1%
2%
3%
4%
5%
6%
2014 (p) 2015 (p) 2016 (p) 2017 (p)
REAL GDP GROWTH BY REGION, 2014-2017(p)
World Americas EMEA Asia-Pacific
Global Talent Market Quarterly
BACK TOTABLE OF CONTENTS

ECONOMIC BRIEFINGS
The gap in emerging market performances continues to widen in 2015, as India and China still rank among the fastest-growing global economies, while Brazil and Russia face significant challenges. The developed countries also show a wide range of growth patterns, from strength in the U.S. and U.K. to modest recoveries in Japan and the Eurozone.
-5% -4% -3% -2% -1% 0% 1% 2% 3% 4% 5% 6% 7% 8% 9% 10%
Russia
Brazil
Italy
France
Japan
Germany
Canada
Australia
U.K.
U.S.
China
India
REAL GDP GROWTH RATES, SELECTED MARKETSRanked by 2015(p) growth
2014(p)
2015(p)
2016(p)
5
Global GDP Growth2015(p): 3.0%
Sources: IHS Global Insight (January 2015)
EMERGING MARKETS INDIA’s growth is forecast to reach 6.7% in 2015, as business and consumer activity
will be lifted by easing fiscal policy, government reforms, and lower oil prices.
Meanwhile, imbalances in the housing, credit, and industrial markets in CHINA are expected to cause economic growth to decelerate to 6.5% in 2015.
BRAZIL’s economic growth will remain essentially flat; investment is stabilizing, but the country is still battling inflation, high debt levels, and labor market challenges.
The RUSSIAN economy is expected to contract by -4% in 2015 as a result of falling oil prices, economic and financial sanctions, poor policies, and capital flight.
DEVELOPED ECONOMIES In the U.S., growth is expected to exceed 3% in 2015, supported by accelerating
domestic demand, including consumer and capital spending as well as housing.
The outlook is also positive in the U.K., where GDP growth is forecast to reach 2.7%, lifted by upturns in the housing market and earnings growth.
Lower oil prices limit the growth outlook for 2015 in CANADA, while the slowdown in natural resources is having a similar effect on the economy in AUSTRALIA.
The EUROZONE recovery is proceeding very gradually, with modest growth rates expected in 2015. Stimulus and monetary policies will help support growth. Ireland and the Baltic nations are expected to rank among the regional growth leaders.
Monetary easing and other favorable financial policies following the election in JAPAN are also expected to drive a modest acceleration in the economy.
Global Talent Market Quarterly
BACK TOTABLE OF CONTENTS

Global Labor Market UpdateFIRST QUARTER l 2015

GLOBAL LABOR MARKET UPDATE: AMERICAS
Key labor markets across the Americas region showed very divergent performances in 2014: the U.S. and Mexico exhibited stronggrowth, while employment trends were more sluggish in Canada and South America. These trends are expected to persist in 2015.
Sources: IHS Global Insight (January 2015); BBC Monitoring Americas, 01.14.15; Toronto Star, 01.29.15; Reuters, 01.23.15
7
UNITED STATESEmployment growth continued to accelerate in 2014, with the labor market posting its highest expansion since 1999 and the unemployment rate falling by more than a full percentage point. The positive trend is expected to continue in 2015, although the pace may be slightly less robust.
BRAZILBrazil’s labor market recorded its lowest job growth in 15 years in 2014. Net job creation was around 150,000—one-tenth of the official forecast of 1.5 million. Unemployment remained low as workers exited the labor force; however, jobless numbers are expected to rise in 2015.
CANADARevised statistics show that the Canadian economy generated an average of just 10,000 jobs per month in 2014. Lower oil prices are expected to contribute to the sluggishness in the labor market in the short term.
MEXICOIn 2014, formal employment in Mexico grew by more than 4%, according to federal statistics. Healthy economic growth in 2015 will continue to generate demand for jobs in the formal sector, pushing the unemployment rate down.
6.2%5.5%
5.3% 5.2%4.9%
5.4%
5.4% 5.4%
6.9% 6.9% 6.8%6.5%
5.1%
4.8%4.5%
4.3%
3%
4%
5%
6%
7%
8%
9%
2014 (e) 2015 (p) 2016 (p) 2017 (p)
AVERAGE ANNUAL UNEMPLOYMENT RATE
U.S. Brazil Canada Mexico
Global Talent Market Quarterly
BACK TOTABLE OF CONTENTS

GLOBAL LABOR MARKET UPDATE: EMEA
Labor market conditions continue to recover gradually across most of Europe; in many countries, hiring is slowly picking up and unemployment is edging down, but activity remains a long way from pre-crisis levels.
Sources: IHS Global Insight (January 2015); EIU, 01.21.15; EU Employment and Social Situation, Q4 2014
8
FRANCEUnemployment reached a new high in France in November 2014, as the country struggles to stimulate job creation amidst very sluggish economic conditions. Tax credits and payroll tax cuts designed to reduce labor costs are expected to help boost job growth in 2015.
GERMANYThe resilient German labor market continues to create jobs, despite some turbulence in 2014. Employment growth is expected to continue in 2015 as the economic outlook remains solid.
RUSSIAAlthough joblessness reached a record low in Russia in mid-2014, labor market conditions have begun to reflect the deteriorating economic climate. Unemployment is forecast to rise in 2015 as both the manufacturing and service sectors have recently reported labor force contractions.
UNITED KINGDOMThe labor market continued to strengthen at the end of 2014, with a rise in employment and vacancies, and a much-anticipated acceleration in wage growth. These positive employment trends are expected to continue in 2015.
10.3% 10.2%9.8%
9.5%
6.7%
6.3% 6.1% 5.9%5.2%
6.6% 6.7%
5.9%
6.2%
5.5%5.2% 5.1%
3%
4%
5%
6%
7%
8%
9%
10%
11%
12%
2014 (e) 2015 (p) 2016 (p) 2017 (p)
AVERAGE ANNUAL UNEMPLOYMENT RATE
France Germany Russia U.K.
Global Talent Market Quarterly
BACK TOTABLE OF CONTENTS

GLOBAL LABOR MARKET UPDATE: APAC
In line with the solid economic forecast for APAC, employment trends across the region are looking broadly positive to begin 2015. However, economic transitions and challenges in some key countries may put a damper on hiring activity.
Sources: IHS Global Insight (January 2015); EIU, 01.20.15; SIA Daily News, 01.21.15 and 12.30.14; Reuters, 01.26.15
9
AUSTRALIAThe Australian job market ended 2014 on a positive note, as nearly 83,000 jobs were created in the last quarter, comprising nearly 40% of the full-year increase. Still, employment trends are likely to be volatile in 2015 as the labor market adjusts to a rebalancing economy.
CHINAAlthough not reflected in its official unemployment statistics, China’s cooling economy is accompanied by a slowdown in job creation. Around 13 million jobs were added in China in 2014, and 10 million are predicted in 2015. China’s labor force is also forecast to continue to shrink in the coming year.
INDIAThe government’s economic reforms—particularly the ‘Make in India’ initiative designed to boost manufacturing—are expected to provide a lift to the Indian labor market, but the country faces a deficit of skilled workers.
JAPANDespite a somewhat brighter economic outlook for 2015, Japan’s unemployment rate is expected to rise as its sluggish labor market conditions continue and more workers exit the labor force.
6.1% 6.2%5.7%
5.2%
4.0% 3.9% 3.9% 3.9%
9.6% 9.4%9.0%
8.7%
3.8%
4.7% 4.8% 4.8%
3%
4%
5%
6%
7%
8%
9%
10%
2014 (e) 2015 (p) 2016 (p) 2017 (p)
AVERAGE ANNUAL UNEMPLOYMENT RATE
Australia China India Japan
Global Talent Market Quarterly
BACK TOTABLE OF CONTENTS
LABOR MARKET SPOTLIGHT: GLOBAL JOBS INDEX
Source: EIU/IMF. Chart data estimated.10
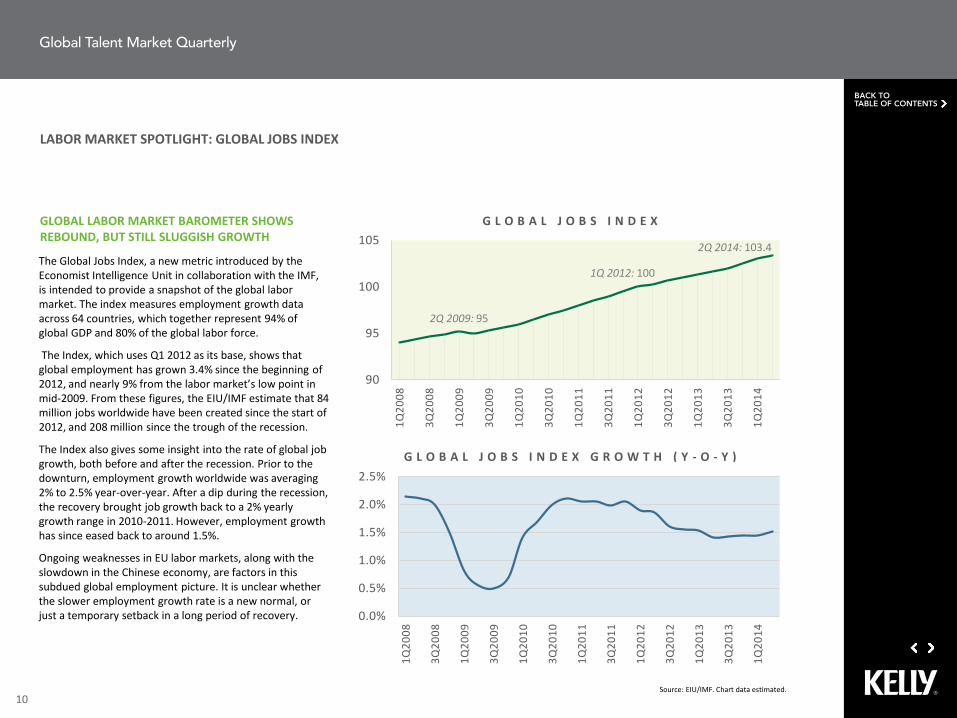
The Global Jobs Index, a new metric introduced by the Economist Intelligence Unit in collaboration with the IMF, is intended to provide a snapshot of the global labor market. The index measures employment growth data across 64 countries, which together represent 94% of global GDP and 80% of the global labor force.
The Index, which uses Q1 2012 as its base, shows that global employment has grown 3.4% since the beginning of 2012, and nearly 9% from the labor market’s low point in mid-2009. From these figures, the EIU/IMF estimate that 84 million jobs worldwide have been created since the start of 2012, and 208 million since the trough of the recession.
The Index also gives some insight into the rate of global job growth, both before and after the recession. Prior to the downturn, employment growth worldwide was averaging 2% to 2.5% year-over-year. After a dip during the recession, the recovery brought job growth back to a 2% yearly growth range in 2010-2011. However, employment growth has since eased back to around 1.5%.
Ongoing weaknesses in EU labor markets, along with the slowdown in the Chinese economy, are factors in this subdued global employment picture. It is unclear whether the slower employment growth rate is a new normal, or just a temporary setback in a long period of recovery.
GLOBAL LABOR MARKET BAROMETER SHOWS REBOUND, BUT STILL SLUGGISH GROWTH
G L O B A L J O B S I N D E X
G L O B A L J O B S I N D E X G R O W T H ( Y - O - Y )
90
95
100
105
1Q20
08
3Q20
08
1Q20
09
3Q20
09
1Q20
10
3Q20
10
1Q20
11
3Q20
11
1Q20
12
3Q20
12
1Q20
13
3Q20
13
1Q20
14
0.0%
0.5%
1.0%
1.5%
2.0%
2.5%
1Q20
08
3Q20
08
1Q20
09
3Q20
09
1Q20
10
3Q20
10
1Q20
11
3Q20
11
1Q20
12
3Q20
12
1Q20
13
3Q20
13
1Q20
14
2Q 2014: 103.4
1Q 2012: 100
2Q 2009: 95
Global Talent Market Quarterly
BACK TOTABLE OF CONTENTS
GLOBAL LEGISLATIVE UPDATE
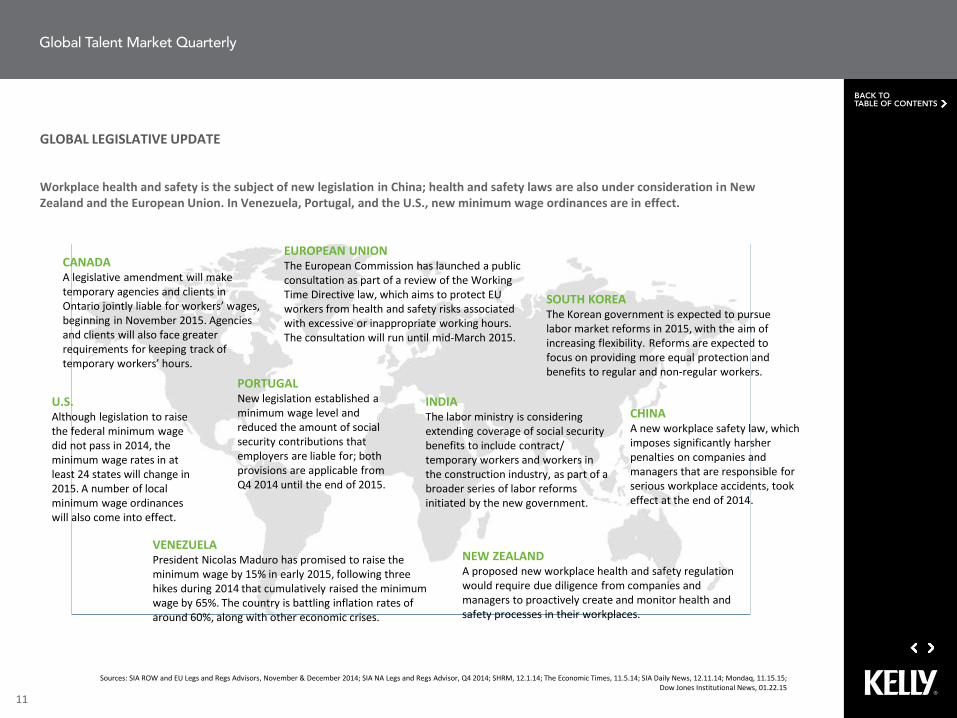
Workplace health and safety is the subject of new legislation in China; health and safety laws are also under consideration in New Zealand and the European Union. In Venezuela, Portugal, and the U.S., new minimum wage ordinances are in effect.
Sources: SIA ROW and EU Legs and Regs Advisors, November & December 2014; SIA NA Legs and Regs Advisor, Q4 2014; SHRM, 12.1.14; The Economic Times, 11.5.14; SIA Daily News, 12.11.14; Mondaq, 11.15.15; Dow Jones Institutional News, 01.22.15
11
EUROPEAN UNIONThe European Commission has launched a public consultation as part of a review of the Working Time Directive law, which aims to protect EU workers from health and safety risks associated with excessive or inappropriate working hours. The consultation will run until mid-March 2015.
SOUTH KOREAThe Korean government is expected to pursue labor market reforms in 2015, with the aim of increasing flexibility. Reforms are expected to focus on providing more equal protection and benefits to regular and non-regular workers.
CHINAA new workplace safety law, which imposes significantly harsher penalties on companies and managers that are responsible for serious workplace accidents, took effect at the end of 2014.
INDIAThe labor ministry is considering extending coverage of social security benefits to include contract/ temporary workers and workers in the construction industry, as part of a broader series of labor reforms initiated by the new government.
CANADAA legislative amendment will make temporary agencies and clients in Ontario jointly liable for workers’ wages, beginning in November 2015. Agencies and clients will also face greater requirements for keeping track of temporary workers’ hours.
NEW ZEALANDA proposed new workplace health and safety regulation would require due diligence from companies and managers to proactively create and monitor health and safety processes in their workplaces.
U.S.Although legislation to raise the federal minimum wage did not pass in 2014, the minimum wage rates in at least 24 states will change in 2015. A number of local minimum wage ordinances will also come into effect.
PORTUGALNew legislation established a minimum wage level and reduced the amount of social security contributions that employers are liable for; both provisions are applicable from Q4 2014 until the end of 2015.
VENEZUELAPresident Nicolas Maduro has promised to raise the minimum wage by 15% in early 2015, following three hikes during 2014 that cumulatively raised the minimum wage by 65%. The country is battling inflation rates of around 60%, along with other economic crises.
Global Talent Market Quarterly
BACK TOTABLE OF CONTENTS

U.S. Labor Market OverviewFIRST QUARTER l 2015

SOLID YEAR FOR JOB GROWTHU.S. job creation hit a 15-year high in 2014 as employment growth averaged 246,000 per month, up significantly from an average monthly gain of 194,000 in 2013. Nearly three million new jobs were created in 2014, making it the best year for the U.S. labor market since 1999. Employment gains have been broad-based: the professional and business services sector accounted for nearly one-fourth of the new jobs created in 2014, but strength also came in sectors ranging from construction to retail trade and food/drink establishments to healthcare.
UNEMPLOYMENT RATE DROPS TO POST-RECESSION LOWThe unemployment rate fell by 0.2 percentage points to 5.6% in December 2014, its lowest mark since June 2008, and more than a full percentage point lower than the prior year’s rate. The downward trend in unemployment, however, is joined by a similar ongoing decline in labor force participation. The labor force participation rate fell to 62.7% at the end of 2014, a level last seen in the late 1970s.
U.S. EMPLOYMENT CONDITIONS
EMPLOYMENT OVERVIEW
13Source: U.S Bureau of Labor Statistics
U.S. MONTHLY EMPLOYMENT CHANGE AND UNEMPLOYMENT RATE
LABOR MARKET SIGNS MOSTLY POSITIVEThe headline numbers continue to reflect a healthy U.S. labor market in which employers are hiring at a brisk and accelerating pace. However, the underlying data is not quite as strong: participation continues to trend down, and despite the tightening market for labor, wages have remained essentially flat since the recession. It remains to be seen whether the solid economic climate, strong job growth, and steady declines in unemployment will translate into higher wages and more people entering the labor market in 2015.
55.566.577.588.5
0
100
200
300
400
Dec12
Jan13
Feb13
Mar13
Apr13
May13
Jun13
Jul13
Aug13
Sep13
Oct13
Nov13
Dec13
Jan14
Feb14
Mar14
Apr14
May14
Jun14
Jul14
Aug14
Sep14
Oct14
Nov14
Dec14
Une
mpl
oym
ent R
ate
(%)
Empl
oym
ent (
000s
)
Total non-farm employment growth Unemployment rate
JUL AUG SEP OCT NOV DEC
Total non-farm employment growth 243K 203K 271K 261K 353K 252K
Private sector employment growth 239K 200K 249K 255K 345K 240K
Unemployment rate 6.2% 6.1% 5.9% 5.7% 5.8% 5.6%
Global Talent Market Quarterly
BACK TOTABLE OF CONTENTS

U.S. LABOR MARKET: SUPPLY AND DEMAND
14
U.S. MARKET - MONTHLY LABOR DEMAND VS. LABOR SUPPLY
Sources: Conference Board Help Wanted OnLine, Bureau of Labor Statistics
Une
mpl
oyed
Wor
kers
(in th
ousa
nds)
Onl
ine
Job
Ads
(in th
ousa
nds)
SUPPLY/DEMAND RATE ON DOWNWARD PATHThe gap between the number of available workers and hiring levels in the U.S. continues to narrow, according to the Conference Board. Its supply/demand ratio stood at 1.7 available workers per online job vacancy at the end of 2014, down from 2.1 at the start of the year and a high of 5.2 in 2009.
LABOR MARKETS TIGHTENING ACROSS SECTORSAmong the ten largest online job categories, six currently show supply/demand ratios below 1.0, signifying more online job ads than unemployed workers. These sectors are mostly high-level, STEM-related areas—computer/mathematical science, architecture/engineering, healthcare, business/finance, and management—but the installation, maintenance, and repair industry also has more demand than supply. Despite broad-level shortages, however, there may also be areas of excess supply in these sectors.
BIGGEST IMPROVEMENTS IN SUPPLY/DEMAND RATIOS IN THE NORTHEAST, MIDWESTYear-over-year, the supply/demand ratio fell by more than 0.5 points in both the Northeast region and the Midwest. Among the largest cities in those regions, Detroit, Chicago, and Philadelphia saw the largest decreases in the rate of unemployed workers to job ads.
0
2000
4000
6000
8000
10000
12000
0
2000
4000
6000
8000
10000
12000
14000
16000
Jan
11Ap
r 11
Jul 1
1O
ct 1
1Ja
n 12
Apr 1
2Ju
l 12
Oct
12
Jan
13Ap
r 13
Jul 1
3O
ct 1
3Ja
n 14
Apr 1
4Ju
l 14
Oct
14
# of Unemployed Workers # of Online Job Ads
“Labor demand in 2014 continued its steady growth pattern to new series highs.” — Gad Levanon, Director of Macroeconomics and Labor Markets, The Conference Board
Global Talent Market Quarterly
BACK TOTABLE OF CONTENTS
U.S. LABOR MARKET SPOTLIGHT: WAGE GROWTH
15
41%
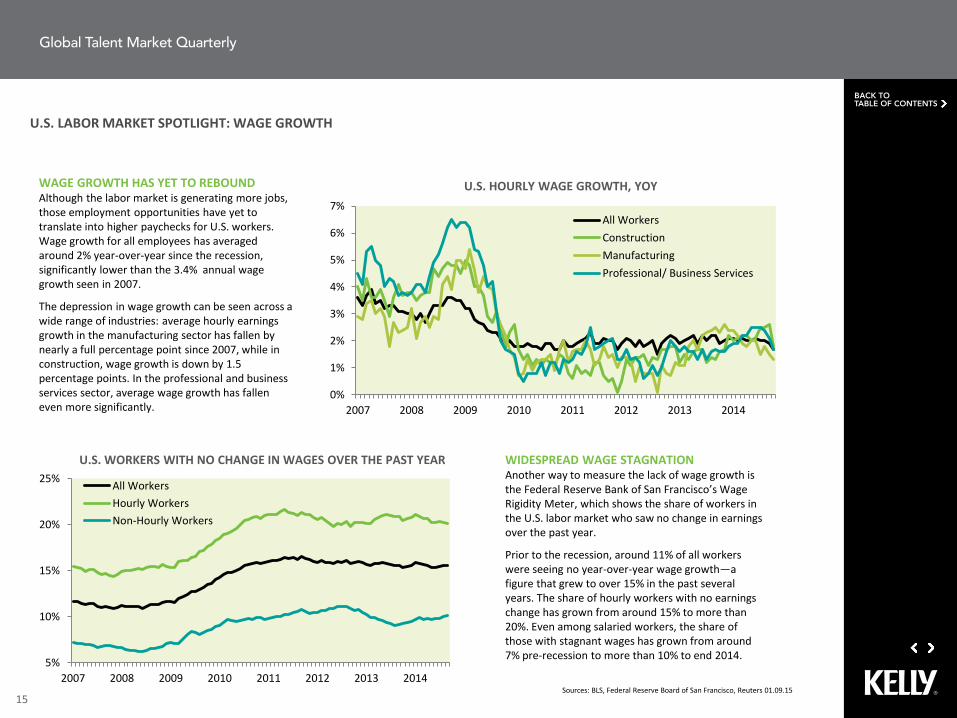
WAGE GROWTH HAS YET TO REBOUNDAlthough the labor market is generating more jobs, those employment opportunities have yet to translate into higher paychecks for U.S. workers. Wage growth for all employees has averaged around 2% year-over-year since the recession, significantly lower than the 3.4% annual wage growth seen in 2007.
The depression in wage growth can be seen across a wide range of industries: average hourly earnings growth in the manufacturing sector has fallen by nearly a full percentage point since 2007, while in construction, wage growth is down by 1.5 percentage points. In the professional and business services sector, average wage growth has fallen even more significantly.
Sources: BLS, Federal Reserve Board of San Francisco, Reuters 01.09.15
0%
1%
2%
3%
4%
5%
6%
7%
2007 2008 2009 2010 2011 2012 2013 2014
All WorkersConstructionManufacturingProfessional/ Business Services
U.S. HOURLY WAGE GROWTH, YOY
5%
10%
15%
20%
25%
2007 2008 2009 2010 2011 2012 2013 2014
All WorkersHourly WorkersNon-Hourly Workers
U.S. WORKERS WITH NO CHANGE IN WAGES OVER THE PAST YEAR WIDESPREAD WAGE STAGNATION Another way to measure the lack of wage growth is the Federal Reserve Bank of San Francisco’s Wage Rigidity Meter, which shows the share of workers in the U.S. labor market who saw no change in earnings over the past year.
Prior to the recession, around 11% of all workers were seeing no year-over-year wage growth—a figure that grew to over 15% in the past several years. The share of hourly workers with no earnings change has grown from around 15% to more than 20%. Even among salaried workers, the share of those with stagnant wages has grown from around 7% pre-recession to more than 10% to end 2014.
Global Talent Market Quarterly
BACK TOTABLE OF CONTENTS

Workforce Solutions Industry Insight
FIRST QUARTER l 2015
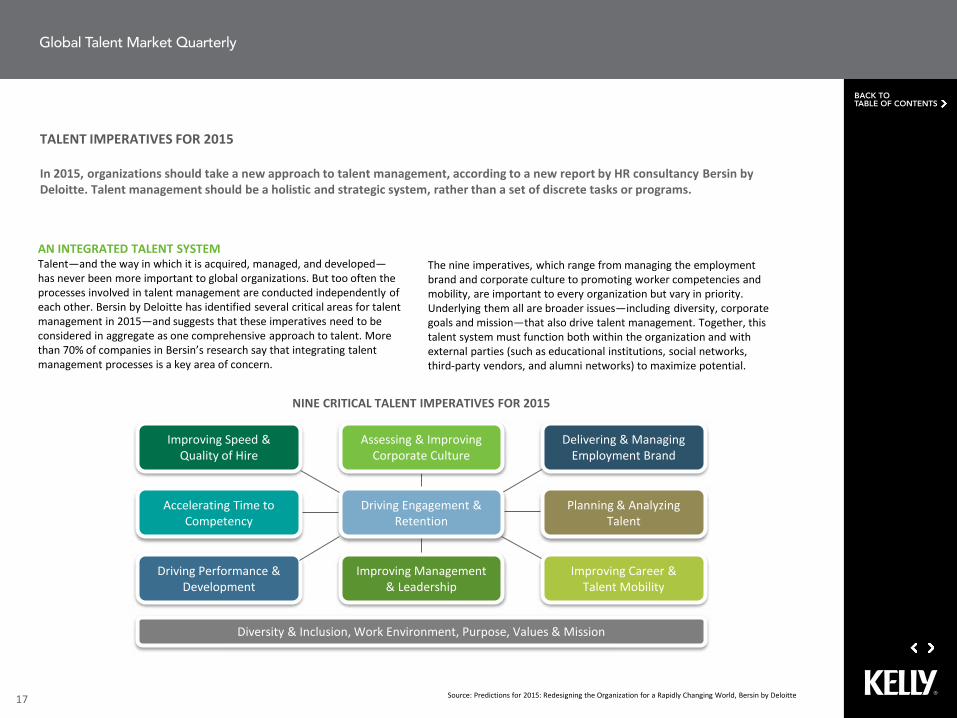
TALENT IMPERATIVES FOR 2015
In 2015, organizations should take a new approach to talent management, according to a new report by HR consultancy Bersin by Deloitte. Talent management should be a holistic and strategic system, rather than a set of discrete tasks or programs.
17 Source: Predictions for 2015: Redesigning the Organization for a Rapidly Changing World, Bersin by Deloitte
AN INTEGRATED TALENT SYSTEMTalent—and the way in which it is acquired, managed, and developed—has never been more important to global organizations. But too often the processes involved in talent management are conducted independently of each other. Bersin by Deloitte has identified several critical areas for talent management in 2015—and suggests that these imperatives need to be considered in aggregate as one comprehensive approach to talent. More than 70% of companies in Bersin’s research say that integrating talent management processes is a key area of concern.
Improving Speed & Quality of Hire
Accelerating Time to Competency
Driving Performance & Development
Improving Career & Talent Mobility
Driving Engagement & Retention
Improving Management & Leadership
Assessing & Improving Corporate Culture
Delivering & Managing Employment Brand
Planning & Analyzing Talent
Diversity & Inclusion, Work Environment, Purpose, Values & Mission
NINE CRITICAL TALENT IMPERATIVES FOR 2015
The nine imperatives, which range from managing the employment brand and corporate culture to promoting worker competencies and mobility, are important to every organization but vary in priority. Underlying them all are broader issues—including diversity, corporate goals and mission—that also drive talent management. Together, this talent system must function both within the organization and with external parties (such as educational institutions, social networks, third-party vendors, and alumni networks) to maximize potential.
Global Talent Market Quarterly
BACK TOTABLE OF CONTENTS

15%
18%
21%
29%
8%
2014
ON BOARD WITH ONBOARDING
The onboarding process is an essential—but often overlooked—step in engaging workers and setting the stage for successful employment. Leading companies know that using onboarding effectively can help increase performance, retention, and motivation.
18 Source: KGWI, 2014; Welcome to the 21st Century, Onboarding! Aberdeen, 2014
According to Kelly Global Workforce Index (KGWI) research, only around half of companies globally have a formal onboarding program in place at all. And many firms that do have onboarding processes are making them more brief: around a third of companies in 2014 said that their programs run one week or less, compared to 19% in 2012, according to Aberdeen.
But cutting down on onboarding can mean that employees aren’t getting the instruction and guidance necessary to perform their jobs successfully—and it can also increase the possibility of turnover. Companies who have shorter onboarding programs (one month or less) are 9% less likely to retain first-year employees than those with longer programs.
So what can a company do to create an effective onboarding process? Aberdeen suggests that in addition to lengthening programs, other strategies for driving onboarding success include clear communication, networking opportunities for new employees, and management support.
MY CURRENT EMPLOYER HAS A PLANNED APPROACH
TO ONBOARDING:
MY EXPERIENCE IN THE FIRST FEW MONTHS OF EMPLOYMENT POSITIVELY IMPACTED MY VIEW
OF THE COMPANY:
7%12%
20%
35%
26%
2012
1 day
1 week
1 week to 1 month
1 to 3 months
Over 3 months
LENGTH OF COMPANIES’ ONBOARDING PROGRAMS
58% 48% 60%
AMER EMEA APAC
Global 55%
49% 39% 43%
AMER EMEA APAC
Global 45%
ONBOARDING BEST PRACTICES
Pre-boarding: Provide forms, etc. before the first day
Clearly communicate core values, mission statements, norms
Make introductions and provide networking opportunities
Integrate onboarding with learning/development initiatives
Leverage technology, including new hire portals
Provide onboarding support to managers with new hires
Global Talent Market Quarterly
BACK TOTABLE OF CONTENTS

ACTIVE AND PASSIVE CANDIDATE RECRUITING
In order to attract top-tier talent, more organizations are beginning to realize that they have to look beyond the obvious. In addition to considering candidates that are actively searching for jobs, many companies are targeting passive candidates as well.
19 Source: 2015 Global Recruiting Trends, LinkedIn
REACHING OUT TO PASSIVE TALENTAccording to research from LinkedIn, only around one-quarter of the worldwide professional workforce considers themselves active candidates; that is, they are currently looking for a new job, a few times a week or more. The remainder of global professionals are passive candidates—satisfied with their current positions but amenable to talking to a recruiter about new opportunities.
Despite the prevalence of passive candidates, however, a large percentage of companies are not tapping into this large potential pool. Globally, 61% of companies say they reach out to passive candidates when recruiting. Most European countries fall below the norm in targeting passive candidates, while firms in Asian countries—particularly in China—are more likely to go after passive talent.
41%
48%
49%
51%
51%
53%
54%
57%
58%
63%
65%
67%
68%
69%
72%
83%
Belgium
Netherlands
Australia
France
Nordics
Italy
Germany
UK
Canada
Mexico
SE Asia
Brazil
Spain
India
US
China
% of COMPANIES RECRUITING PASSIVE CANDIDATES
Global Average: 61%
Passive 75%
Active25%
GLOBAL CANDIDATE BREAKDOWN
PASSIVE CANDIDATES
Satisfied with job, but open to talk to a recruiter
ACTIVE CANDIDATES
Actively looking for a job, at least a few times a week
Global Talent Market Quarterly
BACK TOTABLE OF CONTENTS

Kelly offers a complete content library that advances the discussion and thinking around current trends, strategies, and issues impacting global talent management.
To register for webcasts or for more information, visit www.kellyocg.comDownload The Talent Project, a free iPad ® app by Kelly Services.
TITLE PRESENTED BY: DESCRIPTION
Avoiding Groundhog Day Tim Meehan, Vice President - Recruitment Process Outsourcing, KellyOCG
Given that business planning cycles are now much shorter and more likely to change, organizations need a far more agile talent acquisition model to keep pace. Read this report to find out how Recruitment Process Outsourcing can help.
The TruFiles: Social Recruiting and Personalization
Klaus Topfer, Director - Talent Sourcing EMEA, KellyOCG
Bill Boorman, Founder, #TruEvents
If you want your social networks to function as recruiting power tools, it's time to consider personalization. This report offers insights into providing a personal approach to social recruiting.
The Rise of the Wise Anthony Raja Devadoss, Vice President -APAC – KellyOCG
The global population is aging fast, and best-in-class organizations are learning how to meet the demands of the older workforce. Use this e-book to gain a new perspective on managing older workers in the Asia-Pacific region.
20
Global Talent Market Quarterly
BACK TOTABLE OF CONTENTS
ABOUT KELLY SERVICES®
Kelly Services, Inc. (NASDAQ: KELYA, KELYB) is a global leader in providing workforce solutions. Kelly® offers a comprehensive array of outsourcing and consulting services as well as world-class staffing on a temporary, temporary-to-hire, and direct-hire basis. Serving clients around the world, Kelly provided employment to approximately 555,000 employees in 2014. Revenue in 2014 was $5.6 billion. Visit kellyservices.com and download The Talent Project, a free iPad® app by Kelly Services.
A KELLY SERVICES REPORT
All trademarks are property of their respective owners. An Equal Opportunity Employer © 2015 Kelly Services, Inc. 15-0065 Kelly Services Inc. makes no representation or warranty with respect to the material contained within this report.