Q1 2008 Conference call. Deutsche Telekom.
31
1 Q1 2008 Conference call. Deutsche Telekom. May 8, 2008
Transcript of Q1 2008 Conference call. Deutsche Telekom.
1
Q1 2008 Conference call.Deutsche Telekom.May 8, 2008

Q1 2008 Conference call May 8, 2008 2
Disclaimer.
This presentation contains forward-looking statements that reflect the current views of Deutsche Telekom management with respect to future events. They include, among others, statements as to market potential and financial guidance statements, as well as our dividend outlook. They are generally identified by the words “expect,” “anticipate,” “believe,” “intend,” “estimate,” “aim,” “goal,”“plan,” “will,” “seek,” “outlook” or similar expressions and include generally any information that relates to expectations or targets for revenue, adjusted EBITDA, earnings, operating profitability or other performance measures, as well as personnel related measuresand reductions. Forward-looking statements are based on current plans, estimates and projections. You should consider them with caution. Such statements are subject to risks and uncertainties, most of which are difficult to predict and are generally beyondDeutsche Telekom’s control, including those described in the sections “Forward-Looking Statements” and “Risk Factors” of the company’s Annual Report on Form 20-F filed with the U.S. Securities and Exchange Commission. Among the relevant factors are the progress of Deutsche Telekom’s workforce reduction initiative and the impact of other significant strategic or business initiatives, including acquisitions, dispositions and business combinations and cost-saving initiatives. In addition, regulatory rulings, stronger than expected competition, technological change, litigation and supervisory developments, among other factors, may have a material adverse effect on costs and revenue development. Further, an economic downturn in Europe or North America, and changes in exchange and interest rates, may also have an impact on our business development and availability of capital under favorable conditions. If these or other risks and uncertainties materialize, or if the assumptions underlying any of these statements prove incorrect, Deutsche Telekom’s actual results may be materially different from those expressed or implied by such statements. Deutsche Telekom can offer no assurance that its expectations or targets will be achieved. Deutsche Telekom does not assume any obligation to update forward-looking statements to take new information or future events into account or otherwise. Deutsche Telekom does not reconcile its adjusted EBITDA guidance to a GAAP measure because it would require unreasonable effort to do so.As a general matter, Deutsche Telekom does not predict the net effect of future special factors because of their uncertainty. Special factors and interest, taxes, depreciation and amortization (including impairment losses) can be significant to Deutsche Telekom’s results.
In addition to figures prepared in accordance with IFRS, Deutsche Telekom presents non-GAAP financial performance measures, including EBITDA, EBITDA margin, adjusted EBITDA, adjusted EBITDA margin, adjusted EBIT, adjusted net profit, free cash flow, gross debt and net debt. These non-GAAP measures should be considered in addition to, but not as a substitute for, the information prepared in accordance with IFRS. Non-GAAP financial performance measures are not subject to IFRS or any other generally accepted accounting principles. Other companies may define these terms in different ways. For further information relevant to the interpretation of these terms, please refer to the chapter “Reconciliation of pro forma figures”, which is posted on Deutsche Telekom’s Investor Relations webpage at www.telekom.com.

Q1 2008 Conference call May 8, 2008 3
Agenda.Deutsche Telekom Q1 2008 results conference call .
Introduction Stephan EgerHead of Investor Relations
Q1 2008 Highlights René ObermannCEO
Q1 2008 Financials Dr. Karl-Gerhard EickCFO and Deputy CEO
Q&A If you like to ask a question, please press ”* 1” on your touchtone telephone
4
Q1 2008.Highlights.René Obermann, CEO

Q1 2008 Conference call May 8, 2008 5
Q1 2008 Highlights.
Revenue -3.1% yoy to €15.0 billion – organic growth +0.4%
Adj. EBITDA stable at €4.7 billion – organic growth 1.1% (+3.1% assuming constant F/X). Well on track to achieve FY guidance
FCF at €1.6 billion (from €0.5 billion in Q1/07). Well on track to achieve FY guidance
Net income more than doubled to €924 million – adjusted net income up 33.2% yoy to €750 million
Adj. group personnel expenses down by 6.0% yoy to €3.3 billion
Net group headcount reduction of 9,400 employees (as of 3/31/08 yoy)

Q1 2008 Conference call May 8, 2008 6
Management update: Focus, fix and grow.
Achievements Q1 2008:DSL retail market share of net adds at 43% – strong DSL retail net adds of 539kBBFN Germany:
Cost savings continued in Q1: cost base reduced by €0.3 billionDomestic adj. EBITDA up 0.5% yoy, margin improved to 34.5% from 32.2% in Q1/07
Successful customer retention: Broadband churn reduced from 1.6% to 1.1% quarter on quarter1
Attractive new voice and data tariffs launched by T-Mobile GermanyRobust contract customer growth (+210k) at T-Mobile Germany in Q1/08T-Mobile Germany: adj. EBITDA margin improved to 36.7%
Build network-centric ICT
Mobilize the Internet
Grow abroad with mobile
Improve com-petitiveness
in Germany and CEE
1 Monthly churn rate
Q1 2008 Conference call May 8, 2008 7
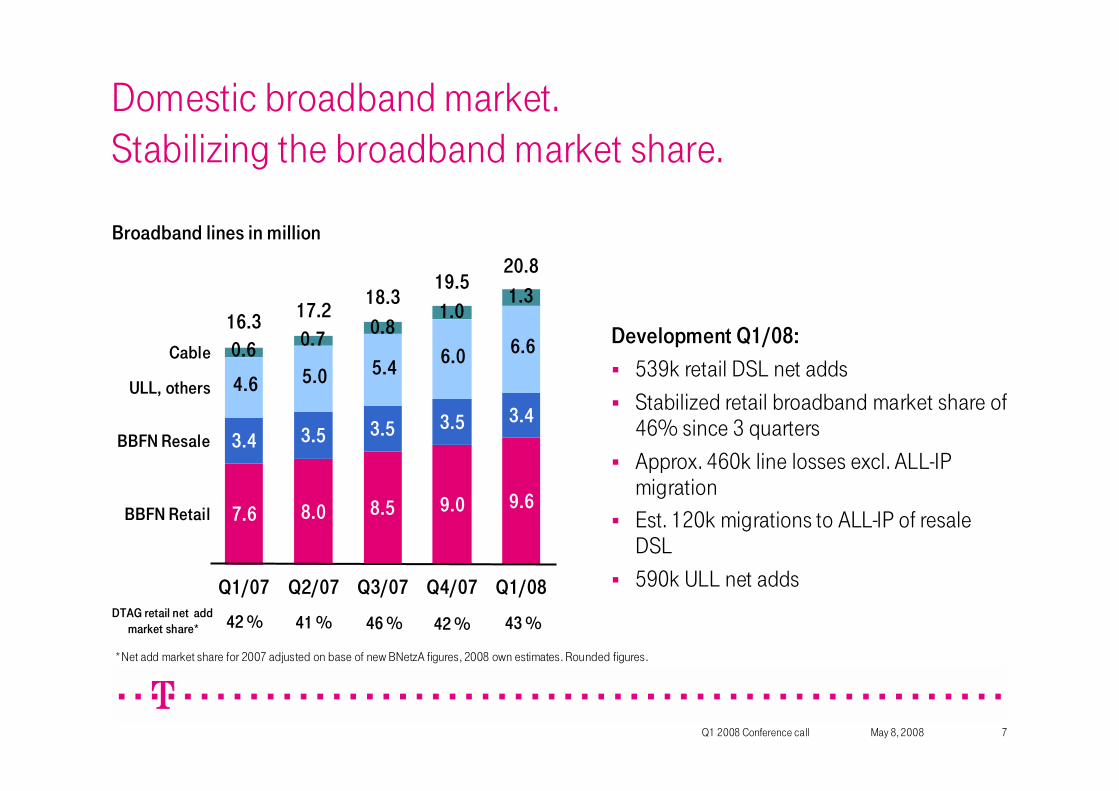
Domestic broadband market. Stabilizing the broadband market share.
Broadband lines in million
9.6
3.4
1.3
Q1/08
20.8
0.6
3.4
17.2
Q2/07
0.8
3.5
Q3/07
18.3
8.57.6
16.3
Q1/07
0.7
3.5
8.0
1.0
3.5
9.0
19.5
Q4/07
Cable
ULL, others
BBFN Resale
BBFN Retail
DTAG retail net addmarket share* 42 % 41 % 46 % 42 % 43 %
*Net add market share for 2007 adjusted on base of new BNetzA figures, 2008 own estimates. Rounded figures.
Development Q1/08:539k retail DSL net addsStabilized retail broadband market share of 46% since 3 quartersApprox. 460k line losses excl. ALL-IP migrationEst. 120k migrations to ALL-IP of resale DSL590k ULL net adds
4.6 5.06.0 6.6
5.4

Q1 2008 Conference call May 8, 2008 8
T-Mobile Germany.Improved margin.
Achievements Q1/08:Improved financial trends:
Service revenues: -2.2% yoy vs. -3.0% yoy in Q1/07Adj. EBITDA: -1.1% yoy vs. -11.4% yoy in Q1/07Adj. EBITDA margin: 36.7% vs. 35.9% in Q1/07
Contract net adds of 210k in Q1/08Contract churn: 1.1% in Q1/08 vs. 1.2% in Q1/07Attractive new voice and data tariffs launched, e.g.:
Max L (€79.95): 0 Cent/min all German networksMyFaves L (€24.95): 0 Cent/min to 5 numbers in German fixed line and other T-Mobile customersweb’n’walk L (€34.95): laptop flat rate
MOU per contract customer up about 6% yoy in Q1/08 – total contract MOU up 13% yoy
Service revenues (€ billion)
1.75 1.71
-2.2%
Q1/07 Q1/08
Adj. EBITDA (€ million)
700 692
-1.1%
Q1/07 Q1/08
Q1 2008 Conference call May 8, 2008 9
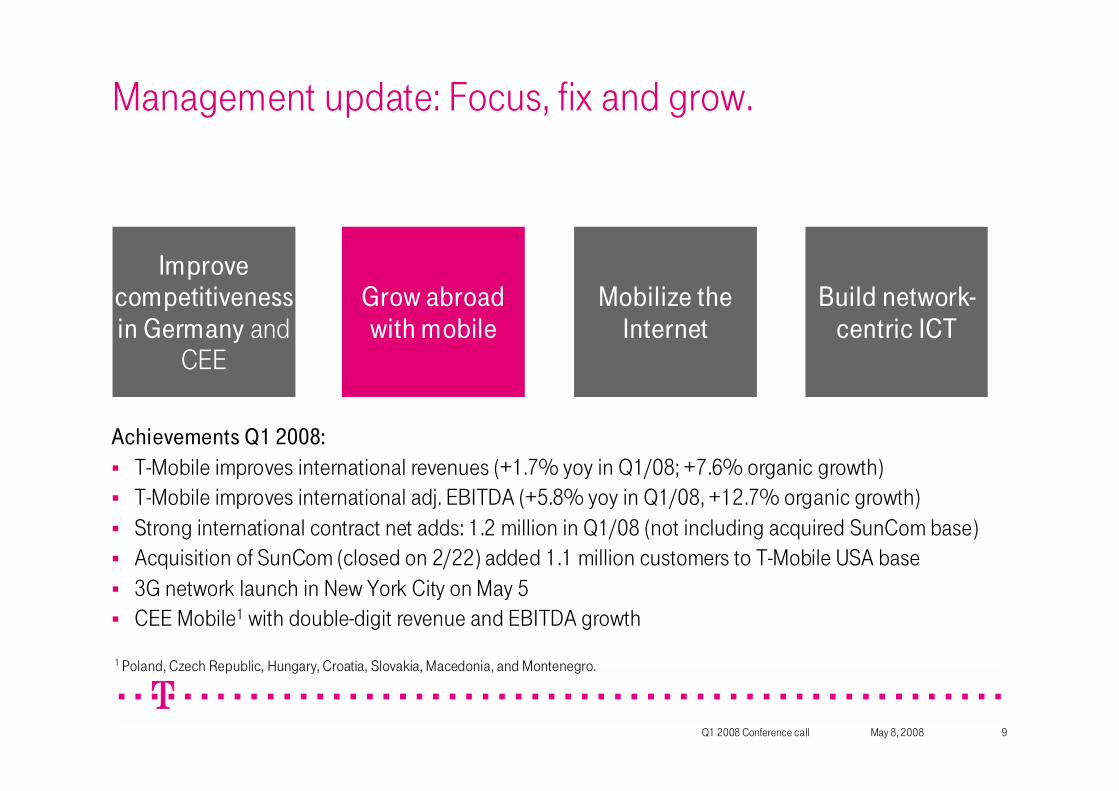
Management update: Focus, fix and grow.
Build network-centric ICT
Mobilize the Internet
Grow abroad with mobile
Improve competitiveness in Germany and
CEE
Achievements Q1 2008:T-Mobile improves international revenues (+1.7% yoy in Q1/08; +7.6% organic growth)T-Mobile improves international adj. EBITDA (+5.8% yoy in Q1/08, +12.7% organic growth)Strong international contract net adds: 1.2 million in Q1/08 (not including acquired SunCom base)Acquisition of SunCom (closed on 2/22) added 1.1 million customers to T-Mobile USA base3G network launch in New York City on May 5CEE Mobile1 with double-digit revenue and EBITDA growth
1 Poland, Czech Republic, Hungary, Croatia, Slovakia, Macedonia, and Montenegro.

Q1 2008 Conference call May 8, 2008 10
Grow abroad with mobile: T-Mobile USA.Continued strong growth despite economic slowdown.
Service revenues (US$ billion)
3.94.5
+14.5%
Total revenues (US$) up 14.1% in Q1/08 (organic 12.5%)Service revenues (US$) up 14.5% in Q1/08Adj. EBITDA margin: 27.9% in Q1/08, up from 27.0% in Q1/07Contract churn: 1.7% in Q1/08 (from 1.9%)Q1 net increase in customer base: 2.1 million
Net adds: 981k (versus 980k in Q1/07 and 951k in Q4/07), of which 732k contract1.1 million consolidation of SunCom (2/22)More than 5.5 million myFaves customersContinuing success of FlexPay
30.8 million customer baseVery strong messaging growth: almost 33 billion SMS/MMS in Q1/08 from 16 billion in Q1/073G launch in New York City on May 5Q1/07 Q1/08
Adj. EBITDA (US$ billion)
1.231.45
+18.0%
Q1/07 Q1/08

Q1 2008 Conference call May 8, 2008 11
Grow abroad with mobile: CEE1 countries.Delivering double-digit growth.
Service revenues (€ billion)
1.1951.335
+11.7%
Total revenues up 10.8% in Q1/08 (organic +5.5%)Service revenues up 11.7% in Q1/08Adj. EBITDA up 14.5% in Q1/08 (organic +9.1%)Adj. EBITDA margin in CEE countries up 1.4pp to 42.2% yoy in Q1/08Contract net adds: 407k in Q1/08Strong yoy non-voice revenue growth Q1/08:
Total up 28.3% to €256 millionWithout messaging up 86.4% to €77 million
Low contract churn in key markets in Q1/08:PTC: 0.7%T-Mobile CZ: 0.5%T-Mobile Hungary: 0.9%T-Mobile HR: 0.6%
Stable cash contribution of €371 millionQ1/07 Q1/08
Adj. EBITDA (€ million)
517592
+14.5%
Q1/07 Q1/08
1 Poland, Czech Republic, Hungary, Croatia, Slovakia, Macedonia, and Montenegro.

Q1 2008 Conference call May 8, 2008 12
Grow abroad with mobile: PTC. Strong yoy improvement.
Service revenues (€ billion)
429511
+19.1%
Total revenues up 17.5% in Q1/08 (organic +8.2%)Service revenues up 19.1% in Q1/08Adj. EBITDA up 25.2% in Q1/08 (organic +15.0%)Adj. EBITDA margin up 2.1pp to 35.1% in Q1/08Contract net adds: 190k in Q1/08Strong yoy non-voice revenue growth Q1/08:
Non-voice % of ARPU up 2pp to 20%
Contract churn at 0.7% in Q1/08Cash contribution of €93 million, down 18.4% due to higher CAPEX
Q1/07 Q1/08
Adj. EBITDA (€ million)
147184
+25.2%
Q1/07 Q1/08

Q1 2008 Conference call May 8, 2008 13
Management update: Focus, fix and grow.
Build network-centric ICT
Mobilize the Internet
Grow abroad with mobile
Improve com-petitiveness
in Germany and CEE
Achievements Q1 2008:Non-voice revenues w/o messaging up 28.0% yoy to €540 million
Europe up 41.5% yoy to €301 millionUS up 30.7% yoy in local currency to $358 million (total incl. messaging up 32.9% to $747 million)
Attractive new data tariffs launched incl. laptop flat rate of €34.95 in GermanyUS: 3G (UMTS/HSDPA) network launched in New York City on May 5
3G base stations increased to 13,000 at the end of Q1/08 from 8,000 at YE 200720 to 25 core markets to be launched by year-end 2008Launch enables use of AWS spectrum laying the foundation for future growth

Q1 2008 Conference call May 8, 2008 14
web‘n‘walk users1 (in 000)
Mobilize the Internet.
2,105
Q1 2007
3,836
Q1 2008
+82% +41.5%
213
Q1 2007
301
Q1 2008
Non-voice revenueexcluding messaging
(in € million)
myFaves users(in million)
+267%
1.5
Q1 2007
5.5
Q1 2008
+30.7%
274
Q1 2007
358
Q1 2008
Non-voice revenueexcluding messaging
(in $ million)
Europe USA
1 incl. D, UK, CZ, A and NL.

Q1 2008 Conference call May 8, 2008 15
Management update: Focus, fix and grow.
Build network-centric ICT
Mobilize the Internet
Grow abroad with mobile
Improve com-petitiveness
in Germany and CEE
Achievements Q1 2008:Cognizant alliance on global IT delivery, access to strong offshore capabilities of Cognizant, transfer of TS India to CognizantRoyal Dutch Shell: 5-year €1 billion agreement on global data-center outsourcing. TS to take on 900 IT-employees from ShellFocus on network-centric ICT:
Sale of Media & Broadcast, transfer of Active Billing to BBFNReporting focus: Computing & Desktop Services, Systems Integration, and Telecommunications (former Business Services now migrated to Telecommunications)

Q1 2008 Conference call May 8, 2008 16
Targets for 2008 confirmed.
Target
Adj. Group EBITDA Around €19.3 billion
Free cash flow Around €6.6 billion
Dividend policy Maintain attractive dividend policy

17
Q1 2008.Financials.Dr. Karl-Gerhard Eick, CFO and Deputy CEO

Q1 2008 Conference call May 8, 2008 18
Overview Group financials.Strong growth in adj. net income and FCF.
Revenue (€ billion) Adj. EBITDA (€ billion)
FCF adj. (€ billion)
15.5
0.5
1.6Net Income (€ million)
+213.3%
Q1/07reported
Q1/07 Q1/08
Q1/08reported
15.0 15.3
Q1/07Organic
Q1/08Organic
15.3
-3.1% 0.4%
4.7
Q1/07reported
Q1/08reported
4.7 4.7
Q1/07Organic
Q1/08Organic
4.8
0.1% 1.1%
459
Q1/07reported
Q1/08reported
924
563
Q1/07Adj.
Q1/08Adj.
750+101.3%
+33.2%

Q1 2008 Conference call May 8, 2008 19
BBFN Summary.Improvement in adj. EBITDA despite revenue pressures.
Domestic revenue (€ billion)
Domestic adj. EBITDA (€ billion)
Total revenue (€ billion)
Adj. EBITDA (€ billion)
5.8 5.4
1.911.87
-7.7%
[-7.6%1]
1.66 1.67
+0.5%
[-0.3%2]
5.1 4.8-6.1%
[-7.8%2]
+1.9%
[-1.7%1]
Q1/07Q1/08
Q1/07
Q1/07
Q1/07Q1/08 Q1/08
Q1/08
5.22
2 Prior year figures adjusted for Active Billing and DTKS.
1.941
1 Prior year figures adjusted for Active Billing, DTKS and T-Online France and Spain.
5.81
1.672

Q1 2008 Conference call May 8, 2008 20
0.070.01
5.15
Q1/07 (cum.)
0.31
Networkcommuni-
cations
0.03
Whole-sale
IP Internet
Otherfixed-
networkservices
0.1
Otherrevenues
4.83
Q1/08 (cum.)
-6% Reduction in network communicationsfrom access (€0.16bn) and calling revenues (€0.15bn) due to line losses and price effects from Max 06/Max 07Wholesale almost stable, growth in ULL offset by voice interconnection and resale DSLIP Internet almost stable due to growth in DSL lines and new consolidation of Immobilien Scout 24 as of November 2007 despite strong price pressureOther fixed-network services: reduction in data communications revenues and value-added servicesOffsetting: structural effects from DTKS and Active Billing
BBFN domestic revenue development in Q1 2008.

Q1 2008 Conference call May 8, 2008 21
1.87
Adj. EBITDA Q1/07
0.05
WE
0.03
CEE
0.32
Domesticrevenue
0.32
DomesticOPEX
Other**
1.91
Adj. EBITDA Q1/08*
1.9%
* Incl. Active Billing, DTKS. Prior year figures were not adjusted.**Change in other income and consolidation effects.
BBFN adj. EBITDA development in Q1 2008.
Increase in EBITDA by €36 million yoyRevenue decrease could be compensated by corresponding OPEX reduction€0.3 billion domestic net cost reduction:
€0.1 billion Save for Service€0.1 billion lower market invest€0.1 billion reduced outsourcingand termination costs
0.01

Q1 2008 Conference call May 8, 2008 22
Mobile summary.Strong organic adj. EBITDA growth.
Total revenue (€ billion)
International adj. EBITDA (€ billion)
Customers (million)1
Adj. EBITDA (€ billion)
112.4123.1
2.72.5
+9.5%
1.82.0
+5.8%[+12.7%1]
8.40 8.45
+0.5%[+5.0%1]
+4.9%[+8.9%1]
Q1/07Q1/08
Q1/07
Q1/07
Q1/07Q1/08 Q1/08
Q1/08
8.821
2.112.81
1 Organic growth.

Q1 2008 Conference call May 8, 2008 23
Business Customers summary.Results impacted by sale of Media & Broadcast.
External revenue (€ billion)
Adj. EBITDA (€ million)
Total revenue (€ billion)
International revenue (€ million)
2.9 2.6
593576
-10.4%[-5.2%1]
261 206
-21.1%[-2.4%1]
2.2 2.0
-7.2%[-4.1%1]
+3.0%
Q1/07Q1/08
Q1/07
Q1/07
Q1/07Q1/08 Q1/08
Q1/08
2.712.11
2111
1 Prior year figures adjusted for Active Billing and Media&Broadcast.

Q1 2008 Conference call May 8, 2008 24
Save for Service – Gross savings and opex development.Significant net cost reduction for the group.
Total run rate of “Save for Service” (S4S) program at €2.5 billion1st quarter of 2008 contribution of Save for Service €0.24 billionNet cost base reduction in the Group of €0.7 billionNet cost base reduction of €0.3 billion at BBFN domestic
11.2
Q1 2007
Cost base development1
1 Defined as revenue less adj. EBITDA plus other income (excl. SF).
Inorganic
-0.1
FX
-0.4
Market spend
0.3
S4S and other
Q1 2008
10.5-0.5

Q1 2008 Conference call May 8, 2008 25
Group headcount development: Q1 2007 to Q1 2008.
Group headcount net reduction – 9,400 FTEs (-3.8%) at the end of the period yoyEmployees decrease in Germany: net –13,300 FTEs (-8.4%)Employees increase International: net + 3,900 FTEs (+4.5%)
Increase in headcount at T-Mobile USA (related to the sustained customer growth and a systematic expansion of business, SunCom)Workforce reduction in Eastern Europe (Magyar Telekom Group, Croatia Telekom, Slovak Telekom)Business Customers: continuation of the internationalization strategy in so-called near- and offshore countries
Adj. personnel expenses in Q1 2008:Approx. 6% reduction for the Group to €3.3 billionApprox. 8% reduction domestically to €2.3 billion
Adj. personnel cost ratio in Q1 2008:Group cost ratio improved to 21.9% from 22.6% in Q1 2007Domestic cost ratio improved to 30.7% from 31.5% in Q1 2007

Q1 2008 Conference call May 8, 2008 26
Personnel: Domestic Restructuring ahead of plan.
5,500 domestic headcount gross reduction – 4,000 headcount net reduction (-2.6%) in Q1 20081,500 new hires mainly in service and sales1,600 employees of VTS transferred to Nokia Siemens Networks in January 2008Sale of Media & Broadcast, deconsolidation in January 2008: 1,200 employees Deconsolidation of 5 call center locations in March 2008: 400 VCS employees
Vivento update: Since start 39,300 transfers into Vivento; 30,900 have left again, thereof 19,800 outside the group; remaining Vivento employees as of March 31: 8,400

Q1 2008 Conference call May 8, 2008 27
4.5
0.2
Q1 2008 – Free cash flow.On track to achieve 2008 full-year guidance.
Rounded figures.
- 0.6Change in working capital and accruals
5.0EBITDA (reported)Q1 2008€ billion
- 0.5Non cash items and others
0.0- of which proceeds from real estate sales1.6Free cash flow
0.1Proceeds from disposition of assets
3.3Net cash provided by operating activities- 1.8Investments in PP&E and intangible assets
- 0.4Net interest payment
3.8Cash generated from operations
- 2.1
Q1 2007
- 0.1
0.30.4
0.4
2.1- 2.0
- 0.5
2.5- 0.2Income taxes
- 0.8- 0.3Incl. restructuring payments
Free cash flow adj. (excl. Centrica in Q1 2007) 1.6 0.5

Q1 2008 Conference call May 8, 2008 28
€ billion
Q1 2008 – Reported net income.Reported net income more than doubled to €924 million.
Rounded figures
- 0.7- 0.7Net financial expense
0.50.9Net income
- 0.7- 0.6- of which net interest expense
4.55.0EBITDA - 2.7- 2.7 Depreciation and amortization
0.61.1Earnings after taxes- 0.1- 0.1Minorities
- 0.5- 0.6Income taxes1.01.6EBT
Q1 2007Q1 2008
Q1 2008 Conference call May 8, 2008 29
- 2.7
€ billion
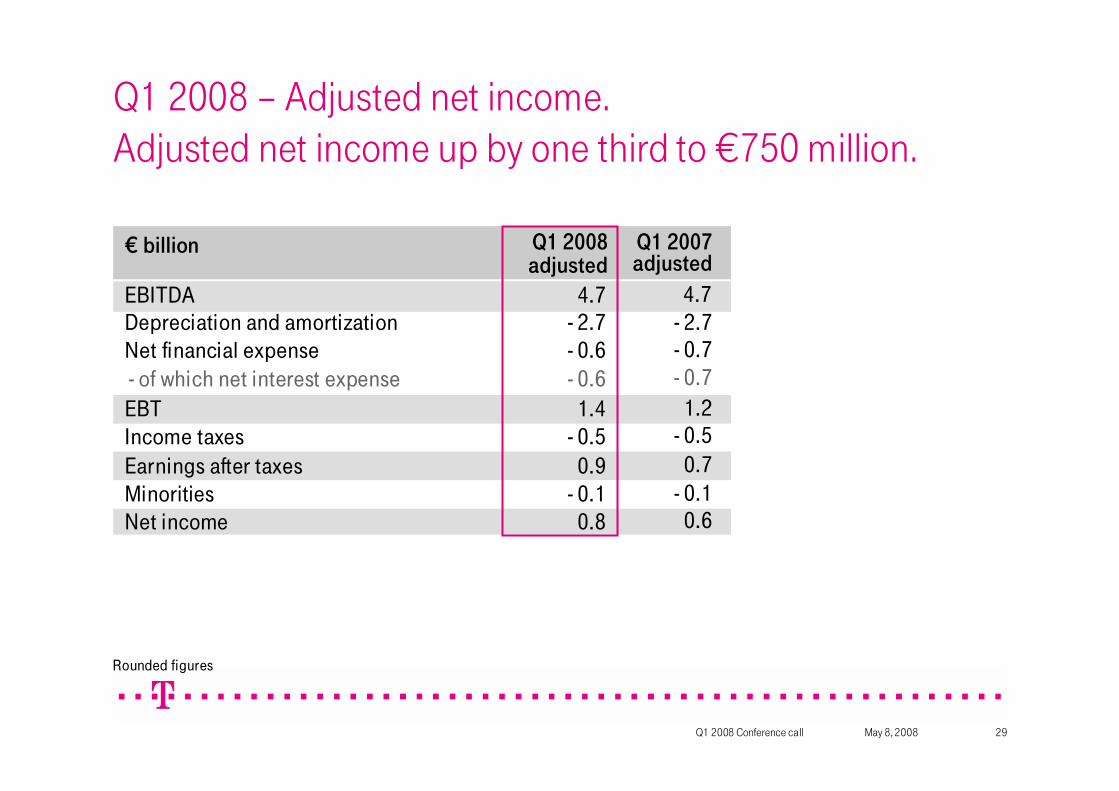
Q1 2008 – Adjusted net income.Adjusted net income up by one third to €750 million.
Rounded figures
- 0.6Net financial expense
0.8Net income
- 0.6- of which net interest expense
4.7EBITDA - 2.7 Depreciation and amortization
0.9Earnings after taxes- 0.1Minorities
- 0.5Income taxes1.4EBT
Q1 2007 adjusted
Q1 2008adjusted
- 0.7
0.6
- 0.7
4.7
0.7- 0.1
- 0.51.2

Q1 2008 Conference call May 8, 2008 30
€ billion
Q1 2008 – Balance sheet ratios.Reduced net debt despite SunCom acquisition.
37.235.9Net debt
120.7118.4Balance sheet total45.244.5Shareholders‘ equity
34.7%34.8%Equity ratio10.8x0.8xGearing
31.12.200731.03.2008
1 After dividends.

31
Thank you for your attention!