q Won• - DTIC
26
researcT1 FIE c j IZF 1989-53 THE EFFECT OF STEREOSCOPIC PRESENTATION ON A SIMULATED AIR J. Wataven TRAFFIC CONTROL TASK A.D. Hekstra 00 q W Won• c,, 4 '' ... s 1 e I IDTIC DISTRIBU_CN STATEMENT A :.ued f,:;z pubic rlease; Ditribution Unlirmted
Transcript of q Won• - DTIC

researcT1 FIE c j
IZF 1989-53 THE EFFECT OF STEREOSCOPICPRESENTATION ON A SIMULATED AIR
J. Wataven TRAFFIC CONTROL TASKA.D. Hekstra
00
qW
Won•
c,, 4 '' ...s 1 e I
IDTIC
DISTRIBU_CN STATEMENT A
:.ued f,:;z pubic rlease;Ditribution Unlirmted

Netherlands TNO Institute for Perceptionorganization for I!.applied scientific Z P Box 23
research 3769 ZG SoesterbergKampweg 5Sciesterberg Tie -Nc*,orrands
TNO-re port Phone +31 34 6362 11
IZF 1989-53 THE EFFECT OF STEREOSCOPICPRESENTATION ON A SIMULATED AIR
J. Wairaven TRAFFIC CONTROL TASKA.D. Hekstra 1
Nothing from this issue may be reproodicedaiid or pubiished by print, phatoprimmicrofinm or any other means vvithoutprevious written consent from TNOSubmittinlg the report for inspection topaltes directly irlteresteo is permitted
In ease this report was orafted Linderinstruction. the rignts and obiigationsof contracting parties are sublect to eitherthe Standard Conditions for ResearchInstructions given to TNO or the relevantagreement concluded between thre contractingparties on account of tne research objectinvolved
TNO
Nube of-.4 pages: 25
TINSi

3
CONTENTS
Page
SUMMARY 5
SAMENVATTING 6
1 INTRODUCTION 7
2 METHODS 8
2.1 Apparatus 8
2.2 Stimulus 8
2.3 Experimental task 10
2.4 Subjects 11
3 RESULTS 11
3.1 Experiment 1 11
3.2 Experiment 2 13
3.3 Experiment 3 15
3.4 Experiment 4 17
4 DISCUSSION 18
5 CONCLUSIONS 20
REFERENCES 21
APPENDIX 23

5
Report No.: IZF 1989-53
Title: The effect of stereoscopic presentation on asimulated Air Traffic Control task
Authors: Dr. J. Walraven and A.D. Hekstra
Institute: TNO Institute for Perception
Date: December 1989
HDO Assignment No.: B87-17
No. in Program of Work: 731.3
SUMMARY
Collision prediction in a simulated Air Traffic Control (ATC) task was
compared for conditions in which the aircraft displacements on the
radar display were shown in either two or three dimensions. The image
separation that is required for stereoscopic (3D) viewing was achieved
by both anaglyphic presentation (red-green glasses) and sequential
field stereoscopy (electro-optical shutters). The stimuli consisted of
traffic scenarios that varied in density and complexity. One of the
aircraft was singled out to represent the one to be under control.
The observer's task was to judge whether it was on a collision course
or not. In the 2D condition, the (necessary) altitude information was
provided in numerical form. In the 3D conditions, experiments both
with and without numerical information were performed.
The results indicate that stereoscopic information by itself, that is,
without numerical altitude information, may already be sufficient for
the task under consideration. However, in the condition with combined
stereoscopic and numerical altitude information, the performance was
not significantly better than in the 2D condition employing numerical
information only. Nevertheless, subjects preferred the stereoscopic
display over the (normal) two-dimensional format.

6
Rap.nr. IZE 1989-53 Instituut voor Zintuigfysiologie TNO,Soesterberg
Het effect van stereowaarneming op de uitvoering van een gesimuleerdeluchtverkeers leidingstaak
J. Walraven en A.D. Hekstra
SAMENVATTING
In een gesimuleerde luchtverkeersleidingstaak werden de vliegtuigbewe-
gingen op het beeldscherm in twee of drie dimensies getoond. Vergele-
ken werd of de taakprestatie, v.w.b. het voorspellen van een botsing,door deze verschillen in presentatiemethode werd beinvloed. Bij de
stereoscopische weergave (3D) werd de separatie van linker en rechter
stereobeeld bewerkstelligd met zowel de anaglyf methode (rood-groen
bril) als met electro-optische hulpmiddelen (PLATO knipperbril). De
simulatie betrof verkeersscenario' s met verschillende aantallen
vliegttuigen, waarvan er 66n fungeerde als het te controleren vlieg-
tuig. Beoordeeld moest worden of dit vliegtuig wel of niet op hot-
singskoers lag met de overige vliegtuigen. In de 2D conditie werd de
informatie over vlieghoogte uitsluitend in numerieke vorm gegeven. In
de 3D conditie werden experimenten verricht waarbij de botsingsvoor-
spelling zowel met als zonder numerieke informatie werd uitgevoerd.
De resultaten laten zien dat stereoscopische plaatsinformatie, zonder
toegevoegde numerieke hoogtegegevens, al nauwkeurig genoeg is voor de
hier onderzochte taak. In condities met zowel stereowaarneming alF
numerieke informatie bleek de taakprestatie echter niet significarxc
beter dan bij twee-dimensionaal presentatie met uitsluitend nume-: eke
informatie. Desalniettemin bleken proefpersonen de voorkeur tc geven
aan de stereoscopische beeldpresentatie.

7
1 INTRODUCTION
Due to the still increasing density and complexity of air traffic, the
work load in Air Traffic Control (ATC) has become a matter of great
concern. One of the factors that adds to the difficulty of a control-
ler's task is that his main (radar) display, showing the positions of
the aircraft under his control, only provides a plan view. The air-
craft altitude, an important variable that has to be continuously
monitored during the ascent and descent of the aircraft, is available
only as numerical information. It is to be expected that reconstruct-
ing (rather than seeing) the vertical separations of the aircraft,
will require quite some mental effort from the controller (Sperandio,
1975). So, anything that might help to support the controller's mental
grip on the three-dimensional space he is working in, should be
welcome. One possibility would be colour coding, an application that
has finally become well accepted in the ATC community (Narborough-
Hall, 1985; Walraven, 1987), and which already has been shown to aid
in identifying and memorizing aircraft at the same altitude (Wedell
and Alden, 1973). A more direct approach would be, of course, to show
the air traffic in three rather than in two dimensions.
It is possible to present a complete three-dimensional ATC picture by
using stereoscopic techniques. However, despite the obvious relevance
of 3D presentation for ATC application, such proposals have not been
met with a favourable response in ATC circles. A possible reason for
that adversity is given by Neeland k1982). Reporting on the FAA's
(Federal Aviation Administration) viewpoint regarding 3D displays he
stated: "The consensus was that the accuracy of tabular data was
needed for the responsibility of the air traffic controller. For him
to grant separation, issue clearances, and authorize descents, he
needs to have the accuracy that he gets from actually reading altitude
on the plan view that he uses right now. If he still has to have that,
there is not much sense in going to a 3D display. I think that this
has been one of the major problems. This idea of precision require-
ments, which controllers feel are too tight to allow human perceptual
capabilities to give them that data".
The main message from the above quote is that air traffic controllers
consider only numerical altitude information as precise enough, and
further, that there is apparently no further benefit to be expected
from a 3D display. This may or may not be true, but the fact is, that
this opinion is not based on a quantitative evaluation of the possible
benefit of a 3D ATC display, either with or without the addition of

8
numerical altitude information. This study is a first attempt at such
an evaluation.
2 METHODS
2.1 Apparatus
The stimulus pattern used for simulating aircraft on an ATC display
was generated on either a colour CRT (Conrac 7211, 66 Hz interlaced,
512 x 512 pixels) or a monochrome display (Tetraco 220, 50 Hz inter-
laced, 512 x 512 pixels). The colour CRT was used for displaying
stereoscopic pictures with the anaglyphic image separation method,
employing red-green glasses adapted to the phosphors of the display
(Mulligan, 1986). The monochrome CRT was used in conjunction with the
method of field-sequential stereoscopy. This was achieved with
electro-optical shutters, i.e. the PLATO goggles (Portable Liquid-
crystal Apparatus for Tachistoscopic Occlusion) developed at the TNO
institute for Perception (Milgram and Van der Horst, 1986).
The images were generated by an IP 8400 Gould/DeAnza graphical image
processor supported by a Gould-MPX computer system. Real-time software
was written in Fortran 77+, employing the graphical image processor
with standard GKS subroutine calls. The bit-mapped RGB multiple
memories were used for manipulating and storing the stereo images. The
equations for generating the latter are given in the Appendix.
2.2 Stimulus
The test stimuli consisted of aircraft representations according to
the conventions used on ATC displays, i.e. a position indicator (a
circle) connected to a speed/direction vector (Fig. 1).

9
Fig. 1 Anaglyph of an ATC traffic scenario. The red-green viewer should be used to see the picture in depth.For ease of viewing, that is, with the stereo imagefloating above rather than below the page, the left eyeshould look through the red filter. (It may take sometime before the eyes lock in on the raised image plane.)The filled circle identifies the test aircraft (A). Inthis example the latter is on a collision course withthe descending aircraft (C). An impression of the 2Dstimulus presentation can be obtained by looking throughthe viewer with one eye closed.
The tail-end of the latter was connected to a smaller circle (a third
of the size of the position indicator), to improve the perception of
its three -dimensional location. The length of the speed/direction
vector (or memory trace) was proportional to the speed of the air-
craft, varying between 50 and 25 mm on the screen (which was viewed
from a distance of 70 cm). Scaling was also applied to the diameter of
the position circle (12-15 mm) and the tail circle (4-5 mm). The
circles decreased and increased in size, consistent (although not
quite proportional) with their displacement from or towards the ob-
server.

10
Next to each aircraft an identification letter (A, B, C etc.) was
shown and, in the majority of the experiments, a three-digit number
indicating its altitude. One of the aircraft, the one under control,
was shown with a filled, rather than open leading circle. Within a
given traffic scenario each aircraft followed a fixed flight path at a
fixed speed. In total 70 different flight scenarios were available,
including 50 that resulted in a collision with the test aircraft,
after a flight time that could vary from 25 to 80 s. The traffic
scenarios were not just random combinations of individual aircraft
flight paths, but were programmed to have different directions of
encounter including "decoy" collisions, i.e. flights that barely
missed the test aircraft.
2.3 Experimental task
The traffic scenarios were viewed from a distance of 70 cm. The sub-
ject's task was to judge whether the test aircraft (labelled A) was on
a collision course or not. The instruction was to make the judgment as
quickly as possible, but without "endangering" the aircraft (precision
was considered more important than speed). After reaching a decision,
the subject pressed the space bar of the display terminal, thus timing
their own decision time and stopping the aircraft in their tracks.
After two seconds the stimulus was replaced by a text asking "Colli-
sion?" and "Which one?", to which the response was given by keyboard
input: that is, Y for yes, N for no, and one of the characters B to P,
indicating the aircraft that was expected to collide with the test
aircraft. Task performance was scored both by measuring the percentage
correctly predicted collisions and also, in the first experiments, by
the decision time. In later experiments the stimulus was stopped at a
preset moment, i.e. 5 to 20 s before collision time, resulting in
(enforced) decision times, varying also between 5 to 20 s.
The various experimental conditions will be detailed separately, when
presenting the results of the experiments in question. In all experi-
ments the subject x stimulus blocks were designed in accordance with
digram-balanced Latin squares (Wagenaar, 1969), in order to reduce
stimulus interaction and learning effects to a minimum.

11
2.4 Subjects
The subjects were students, between 18 and 28 years old, selected from
the Institute's subject "pool", on the basis of good general vision
(acuity, colour) and depth perception. Stereoscopic depth discrimina-
tion was tested with the TNO Stereopter (Walraven and Boogaard, 1970),
an instrument for the precise measurement of stereo-acuity. In addi-
tion, the subjects were screened with the TNO Test for Stereoscopic
Vision (Walraven, 1975), a test for the more global assessment of
stereoscopic vision. This test, which consists of anaglyphs, was used
to check whether the subjects would have problems with seeing depth
through red-green glasses, i.e. the kind of stimulus presentation also
used in part of the experiments.
3 RESULTS
The experiments differed somewhat with respect to stimulus presenta-
tion (red-green glasses or PLATO goggles), complexity of traffic
scenarios (number and density of aircraft), and experimental design
(number of sessions and subjects). The specific experimental condi-
tions will be detailed separately for each of the four experiments
discussed below.
3.1 Experiment 1
This experiment addresses two questions, that is:
I Is 3D presentation preferable over 2D?
2 Can the numerical altitude information be omitted in the stereo-
scopic presentation mode?
The experimental set-up was as follows:
- stimulus presentation: anaglyphic red-green display either with
(3D) or without (2D) binocular disparity
- number of aircraft in each scenario: 10
- number of different scenarios: 35
- number of collision scenarios: 24
- conditions: 2D or 3D, in the latter condition either with (+) or
without (-) numerical altitude information
12
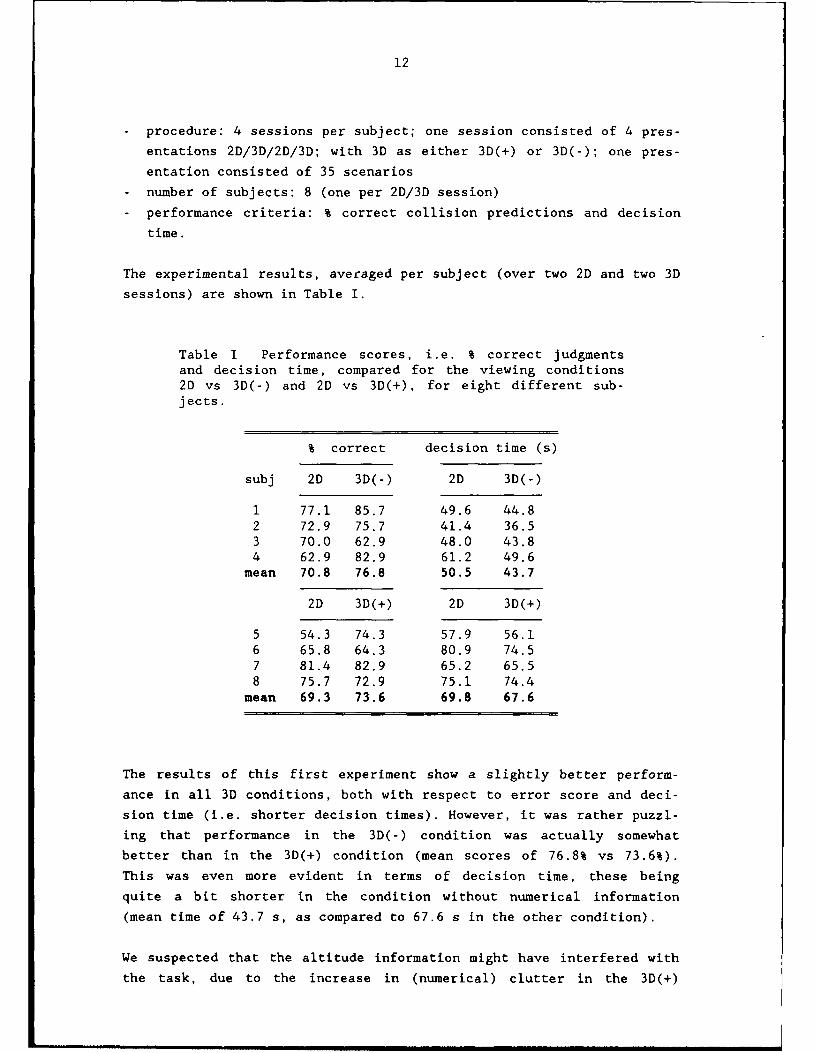
- procedure: 4 sessions per subject; one session consisted of 4 pres-
entations 2D/3D/2D/3D; with 3D as either 3D(+) or 3D(-); one pres-
entation consisted of 35 scenarios
- number of subjects: 8 (one per 2D/3D session)
- performance criteria: % correct collision predictions and decision
time.
The experimental results, averaged per subject (over two 2D and two 3D
sessions) are shown in Table I.
Table I Performance scores, i.e. % correct judgmentsand decision time, compared for the viewing conditions2D vs 3D(-) and 2D vs 3D(+), for eight different sub-j ects.
% correct decision time (s)
subj 2D 3D(-) 2D 3D(-)
1 77.1 85.7 49.6 44.82 72.9 75.7 41.4 36.53 70.0 62.9 48.0 43.84 62.9 82.9 61.2 49.6
mean 70.8 76.8 50.5 43.7
2D 3D(+) 2D 3D(+)
5 54.3 74.3 57.9 56.16 65.8 64.3 80.9 74.57 81.4 82.9 65.2 65.58 75.7 72.9 75.1 74.4
mean 69.3 73.6 69.8 67.6
The results of this first experiment show a slightly better perform-
ance in all 3D conditions, both with respect to error score and deci-
sion time (i.e. shorter decision times). However, it was rather puzzl-
ing that performance in the 3D(-) condition was actually somewhat
better than in the 3D(+) condition (mean scores of 76.8% vs 73.6%).
This was even more evident in terms of decision time, these being
quite a bit shorter in the condition without numerical information
(mean time of 43.7 s, as compared to 67.6 s in the other condition).
We suspected that the altitude information might have interfered with
the task, due to the increase in (numerical) clutter in the 3D(+)

13
condition. In addition, there might have been a difference in subject
population. This is suggested by the fact that the 2D/3D(+) group
(Ss 5-8) not only require longer decision times in the 3D(+), but also
in the 2D condition. A within-subjerts rather than between-groups
design would have been more appropriate to compare the 3D(+) vs 3D(-)
condition.
Since it was felt that, apart from the above flaw in design, the
experiment could be improved upon in other ways, a new experimental
set-up was tried.
3.2 Experiment 2
In this experiment only the condition 2D/3D(+) was studied. Thus, the
added clutter due to numerical information was a factor present in
both presentation modes. The clutter was somewhat reduced, however, by
using smaller characters.
The fact that in the previous experiment the improvement in perform-
ance in the 3D(+) condition was unexpectedly small, might possibly
reflect a too simple task, too easy anyway to profit from the addition
of 3D depth information. It was decided therefore, to vary the degree
of complexity by employing traffic scenarios with either 5, 10 or 15
aircraft. The task was also made more difficult by no longer allowing
the subject the freedom to watch the scenario as long as they felt
necessary. Decision time was set by the computer, thereby stopping the
aircraft displacement 5-20 s before a collision would take place.
Further experimental variables are summarised below:
- stimulus presentation: red-green anaglyphs either without (2D) or
with (3D) binocular disparity
- number of aircraft: variable (5, 10 or 15)
- number of different scenarios: 72
- number of collision scenarios: 48
- conditions: 2D or 3D with numerical altitude information, i.e.
3D(+)
- procedure: 6 sessions per subject, i.e. 2 display modes (2D or 3D)
x 3 densities (5, 10, 15) aircraft; one session consisted of 12
different scenario presentations
- number of suojects: 10-performance criterion: % correct collision predictions
- decision time: 5-20 seconds before collision, as set by the com-
puter.

14
100-/
La090
0) 8 0 0 0UQ) A 0 A a0 oL 00Lo 0'U 70 (30(
C71 00
c 60 -LcuCL
50L I I
50 60 70 80 90 t00percentage correct score, 20
Fig. 2 Comparison of task performance (% correctscores) for the 2D and 3D display mode. Open symbolsrelate to individual subject scores for traffic scen-arios with 5 (A), 10 (0), or 15 (0) a1rcraft. Filledsymbols represent the mean scores for each trafficdensity.
The results of Experiment 2, plotted in Fig. 2, do not show a differ-
ence in performance in favour of either the 2D or 3D presentation
mode. The overall score, generalising over the different traffic
densities, is 77.7% and 77.5% correct predictions for the 2D and 3D
condition, respectively. As can already be expected from Fig. 2, the
statistical analysis (ANOVA) only shows a fairly strong subject ef-
fect, i.e. 27% explained variance (Fp < 0.002), and consequently only
a small effect of aircraft density, i.e. 3.2% explained variance
(Fp < 0.02). No effect at all was found for 2D vs 3D. Still, in the
most complex condition (15 aircraft), where one might expect to profit
most from the 3D display, the data show a slight tendency for higher
3D scores. In general, the 3D/2D score ratio increases with increasing
traffic density.

15
When the subjects were asked for their preference with respect to 2D
or 3D viewing, the general feeling was that 3D was better, but there
were complaints that it was not always easy to maintain depth percep-
tion. This might reflect problems with binocular rivalry due to the
different colours of the stereo half-images. It was decided, there-
fore, to do a new experiment, in which the stereo images would be
generated with the method of sequential field stereoscopy (PLATO
goggles). In addition, the traffic scenarios were made more complex.
3.3 Experiment 3
The PLATO goggles used in this experiment precluded the problem of
binocular colour rivalry, but had the disadvantage that, due to the
alternation of odd and even interlaced half-frames, the display showed
more flicker. By sufficiently reducing the picture brightness and
contrast, this effect could be kept within acceptable limits. All
subjects agreed that the 3D picture was improved as compared to the
anaglyphic presentation.
For this experiment the traffic scenarios were made more complex by
having more aircraft closing in on the test aircraft, and also by
forcing the subjects to long-term predictions (10-20, rather than 5-10
s before collision). Further details are given below:
- stimulus presentation: field-sequential (PLATO goggles) in combina-
tion with the monochrome display.
- number of aircraft: 10, with the majority closing in on the test
aircraft
- number of different scenarios: 100
- number of collision scenarios: 50
- conditions: 2D or 3D(+)
- procedure: sessions (1 per subject) consisting of alternating 2D
and 3D presentation (10 of each); each presentation consisted of 10
scenarios
- number of subjects: 5
- performance score: % correct collision predictions
- decision time: 10-20 seconds before collision.
Fig. 3 shows the 2D/3D comparison of task performance for the 5 sub-
jects that participated in Experiment 3.

16
0 80-
0
C-0
U
L0U
00
c 60.4-) 0 0
C03
L
~50-
50 60 70 80percentage correct score. 20
Fig. 3 Comparison of task performance (% correct pre-dictions) for the 2D and 3D display mode. The datarepresent single subject score averaged over the sameset of 100 different traffic scenarios presented in 2Dand 3D mode, respectively.
The results of Experiment 3 confirm, again, the findings of Experiment
2; that is, task performance is the same in the 2D and 3D presentation
mode. Still, in this, as in the previous experiment, the subjects
expressed their preference for the 3D display. It would seem however,
and this was confirmed by their reports, that the subjects rely on
numerical rather than on perceptual information.
A possible reason for not utilizing perceptual 3D information could be
that it does not much add to the numerical information, or that it is
simply ignored while keeping track of the numbers indicating the air-
craft altitudes. The next, and last, experiment addresses this possi-
bility by providing still better visual information (predicted
tracks), so as to make the visual cues more competitive with respect
to the cognitive approach (i.e. relying on numbers only).

17
3.4 Experiment 4
In this experiment the ATC display showed aircraft equipped with
predictor rather than memory tracks. Using this information, which is
actually also used in modern ATC displays, the extrapolation task
involved in collision prediction should become easier; one can better
foresee, literally, whether aircraft are on a collision course or not
(see also the insets of Fig. 4).
The predictor lines, pointing in the direction the aircraft is going,
were computed for the aircraft's position 15 s ahead in time. In this
experiment the small tail circles (see Fig. 1) were omitted in order
to get a less cluttered picture. The other experimental variables were
the same as in Experiment 3, except that now 4 instead of 5 subjects
were used, one of which had also participated (three months earlier)
in Experiment 3.
The results of Experiment 4 are shown in Fig. 4, which also shows the
results obtained earlier in Experiment 3. Here again, there was no
significant improvement (not in a statistical sense either) of task
performance in the 3D display mode, despite an outspoken preference of
the subjects for 3D.
We can but conclude, therefore, that none of the obtained experimental
evidence sofar, provides evidence for a beneficial effect of stereo-
scopic presentation on performance. At least, as far as the collision
prediction task is concerned.
An interesting side result of Experiment 4 is the large gain in per-
formance that is obtained when employing a predictor track rather than
a memory trace. Even the one subject for which a comparison of these
two display modes would be justified on a statistical basis (see the
crossed symbol in Fig. 4), shows the difference to be highly signifi-
cant. Generalising over 2D and 3D presentations, a simple Wilcoxon
test already shows the improvement (from 73.5% to 88% correct predic-
tions) to be significant at a level of less than 0.5%. The advantage
of the prediction track already can be appreciated by the example
shown in the inset of Fig. 4. It shows two pairs of aircraft, that are
both on a near-collision course (the lower member of the pair is
slightly too slow to catch up with the upper member). That there will
be no collision is obvious for the pair on the right, but far from
clear for the pair on the left.

18
I I I
90
80ML0
WnQ)
70L00
L
Q)70-
memory predictorC trac track
U00 -
0 A
60 70 80 90
percentage correct score. 20
Fig. 4 Comparison of task performance (% correct pre-
dictions) for the 2D and 3D display mode, employing
either memory traces (0) or predictor tracks (0). Thedata represent single subject scores averaged over the
same set of 100 different traffic scenarios, presentedin 2D and 3D, respectively. The two crossed symbolsrelate to a subject that had also participated in Ex-periment 3.Inset: Example showing two aircraft equipped with eithera memory trace or track predictor. Both pairs of air-craft follow the same near-collision course. For theleft pair this is less easy to judge than for the pairon the right.
4 DISCUSSION
The results of this study are rather surprising in that they show no
indication of a beneficial effect of stereoscopic vision in a task
that actually would seem to invite such an effect. The subjective
impression of the simulated ATC display used here seemed so much more
19
informative in the 3D than in the 2D presentation made, that one would
expect a dramatic improvement in task performance in the 3D condition.
Considering the pilot nature of this study, it is still too early to
conclude that ATC operators would not benefit from a stereoscopic
display. The experiments were not designed to test factors like visual
fatigue and learning. It is noteworthy in this respect that the gen-
eral feeling of the subjects in this study was that 3D made it easier
to perform the task, although they reported that they let numerical
information prevail in their collision prediction task. The fact that
in the absence of numerical information, the 3D(-) condition, the task
performance was at least as good as in the 2D condition with numerical
information (Experiment 1), indicates that the spatial information
conveyed by stereopsis may be potentially as useful as numerical
information. It would be worthwhile to test whether this finding can
de substantiated under more realistic task conditions.
As has been discussed by Merrit (1982), the potential benefit of
stereoscopic displays has often been difficult to evaluate, due to the
poor quality of the stereo display (e.g. flicker, low resolution).
Thus, Kama and DuMars (1964) found no difference in 2D vs 3D in a
simple remote-manipulation task (peg-in-hole) when using 2D and 3D TV.
However, since this result might be due to the fact that the 2D TV had
only half the resolution of the 3D TV, Chub (1964) repeated the ex-
periment with monocular and binocular (i.e. stereoscopic) viewing. He
found a significant improvement (20% faster execution) and less vari-
ance in the 3D condition. A similar example of unrevealed 3D poten-
tial, due to the experimental set-up, i.e. a between-groups design of
unpractised subjects rather than a within-subjects design of trained
subjects, was reported by Smith et al. (1979). Still, if the reality
is such that a stereoscopic device does not allow the (full) benefit
of stereoscopic vision, there is of course, no reason for considering
its use. A case in point is a study by Walraven (1980), showing no
advantage of stereoscopic vision (due to inferior image quality) when
viewing through a binocular image intensifier.
The negative result of the present study with respect to a clear
advantage of 3D over 2D information is not likely to have been caused
by (stereo)equipment problems. The same display and viewing attributes
(red-green spectacles, PLATO goggles) were used in the 2D and 3D
presentation, the only difference being that in the 2D condition the
stereo half-images were presented without binocular disparity (i.e.
zero depth difference). In real ATC applications, however, the 2D

20
display might have the edge over 3D displays, when not employing 3D
techniques that avoid the loss of image quality that may occur with
some of the conventional techniques. However, there are already high-
resolution, 120 Hz flicker-free colour CRT's commercially available,
that employ cordless light-weight viewing glasses (Fuller & Phillips,
1989; Johnson, 1989). In future displays, even the glasses may be
dispensed of (Lane, 1982; Collender, 1986, 1987).
The present study was instigated with the stereo display of the future
in mind. Whether that display would be useful for ATC applications may
not be that evident from the results obtained in this limited study.
In view of the subject reports a beneficial effect should still not be
excluded. Maybe the trials in our laboratory study were too short, and
the task, watching only a single aircraft, too simple. Future research
should aim, therefore, at a more realistic task, in which the operator
is kept busy with monitoring various aircraft at the same time and
also with the communications involved. Under such conditions, in which
the operator's attention has to switch continuously from one aircraft
to the other, stereoscopic depth perception might be quite helpful in
the parallel processing of the aircraft altitudes. Alleviation of the
mental load involved would be expected, since it allows the controller
an instantaneous and global check on the aircraft movements. This
should be particularly true in military applications where the air-
craft movements are less predictable than in civilian air traffic.
A noteworthy side result of this study is the finding that a predictor
track is so much more effective than a memory trace, as an aid to
collision prediction. This is not an unexpected result (see Fig. 4),
but the size of the effect, an improvement of almost 20%, is substan-
tial enough to recommend it for "old-fashioned" ATC displays or other
applications, like (tactical) combat and navigation displays.
5 CONCLUSIONS
Keeping in mind that the results of this study apply to just a single
task (collision prediction), in conditions that are only distantly
related to the ATC working environment, the following tentative con-
clusions can be drawn:
21
- Stereoscopic depth perception does not add significantly to per-
formance in a simulated ATC task (collision prediction) when nu-
merical altitude information is available.
- Task performance on a 3D display without numerical altitude infor-
mation is at least as good as on a 2D display with numerical infor-
mation.
- Subjects prefer 3D over 2D data presentation.
- The use of a predictor track rather than a memory trace may improve
task performance by about 20%.
REFERENCES
Chub, G.P. (1964). A comparison of performance in operating the CRL-8
Master Slave Manipulator under monocular and binocular viewing
conditions. Report MRLD-TDR-65-68, Wright-Patterson AFB, Ohio.
Collender, R.B. (1986). 3D television, movies and computer graphics
without glasses. Displays 7, 121.
Collender, R.B. (1987). Methods for electronic 3D moving pictures
without glasses. Displays 10, 193.
Fuller, T.K. and Phillips, M.L. (1989). Stereoscopic video display
systems. Information Display 5(7/8), 20.
Johnson, Ph. (1989). Hardware stereoscopic computer graphics and
imaging. Information Display 5(7/8), 16.
Kama, W.N. and DuMars, R.C. (1964). Remote viewing: A comparison of
direct viewing, 2D and 3D television. Report AMRL-TDR-64-15, AMRL,
Wright-Patterson AFB, Ohio.
Lane, B. (1983). Stereoscopic displays. Proc. Soc. Photo-Opt. Instrum.
Eng. (SPIE) Vol. 367, 20.
Merrit, J.O. (1982). Common problems in the evaluation of 3D displays.
SID Digest 83, 192.
Milgram, P. and Van der Horst, R. (1986). Alternating-field stereo-
scopic displays using light-scattering liquid crystal spectacles.
Displays 7, 67.
Mulligan, J.B. (1986). Optimizing stereo separation in color tele-
vision. Perception 15, 27.
Narborough-Hall, C.S. (1985). Recommendations for applying colour
coding to air traffic control displays. Displays 6, 131.

22
Neeland, R.P. (1982). Airborne and air-traffic control applications of
3D display systems. In: D.J. Getty (Ed.) "3D Displays: Perceptual
Research and Applications to Military Systems", Nat.Acad.
Sciences, Washington.
Smith, D.C., Cole, R.E., Merrit, J.O. and Pepper, R.L. (1979). Remote
operator performance comparing mono and stereo TV displays: The
effect of visibility, learning and task factors. Report NOSC-TR
380, Naval Ocean Systems Center, San Diego, California.
Sperandio, J.C. (1975). Complements A l'6tude de la m~moire opera-
tionelle: deux experiences sur les controleurs de navigation
a4rienne. Le Travail Humain 38, 41.
Walraven, J. and Boogaard, J. (1970). Testing depth perception for the
selection of gunners for the Leopard tank. Report IZF 1970-22 (in
Dutch), TNO Institute for Perception, Soesterberg.
Walraven, J. (1975). Amblyopia screening with random-dot stereograms.
Amer. J. Ophthalmol. 80, 893.
Walraven, J. (1980). Evaluation of spatial task performance with the
Oldelft PSIMC night vision goggle. Report IZF 1980 C-5 (in Dutch),
TNO Institute for Perception, Soesterberg.
Walraven, J. (1987). Colour coding for ATC displays. ECC Report No.
112 (Eurocontrol Experimental Centre), Eurocontrol, Brussels.
Wedell, J. and Alden, D.G. (1973). Colour versus numeric coding in a
keap-track task; performance under varying load conditions. J.
Appl. Psych. 57, 154.
Soesterberg, December 1, 1989
Dr. J. Walraven

23
APPENDIX Stereoscopic image generation
Stereopsis results from merging the slightly different (disparate)
images that are formed on the retina of the right and left eye when
viewing a three-dimensional object or scene. So, in order to create a
stereoscopic picture on a display, a left and right-eye image have to
be generated that produce the retinal images associated with the
three-dimensional picture in question. The x,y coordinates of the
stereo pair can be derived from the x,y,z coordinates of the corre-
sponding three-dimensional image, given the point of view and the eye
base. The geometry in question is shown in Fig. 5.
PY P R P , PYA
dsporty pL LA
PU ...,I.VP
Fig. 5 Geometry7 of stereoscopic image generation. Thepoint P, with coordinates x,,yp,zp, is generated by theleft and right-eye projections P'L and P'R. The corre-sponding x,y (display) coordinates are the x-coordinatesxPL and x~I1 , and the comon y-coordinate YP'L . The twoeyes (EL,ER) are separated by the eye-base b, which isbisected by the Z-axis at z5.Note that increasing or decreasing the separation be-tween P'L and P'1 (by varying 5x) causes P to shift awayor towards the display, respectively. The inset illus-trates the difference between crossed and uncrosseddisparity (see text for further explanation).
"i llllmll~~~lmlnuan X P III ll I l ll*l I •milin

24
Fig. 5 portrays the situation where the two eyes (EL and ER) are
converged on a (virtual) point P, which is generated by its projec-
tions P'R and P'L on the display surface. These projections are located
at equal distances (Ax) from the point P' , where the line of sight,
i.e. the line through P and the center zE of the eye base b, intersects
the x,y plane (screen). Note that changing Ax causes P to travel along
the line of sight. For P'L > P'R point P will be seen in front of the
screen, a condition referred to as crossed (retinal) disparity. When
Ax - 0, P'L and P'R merge into a single point P' (-P), as is the case
when P is located in the x,y plane (no disparity). For P'L > P'R, P
will be seen behind the x,y plane, and the visual axes will no longer
cross in front of the screen (uncrossed disparity).
Because of the horizontal position of the eye base (b), the normal
viewing condition, there is no vertical disparity (YP'L - YP'R - YP')"
If, unwittingly, vertical disparities are introduced on the screen,
the eye will not be able to properly converge on P, and the images P'R
and P'L will no longer be seen as a single, fused, image of P.
In order to generate P one has to calculate the coordinates XPL and
Xp0R and yp'R of the stereo pair P'L,P'R. As for the x-coordinates,
these can be expressed as
XP.L - XP' + Ax
(1)
XPR - Xp, - Ax
On the basis of simple geometric considerations one can show that
I b.zpAx -- (2)
2 ZE-ZP
and
xp. ZE
Xp. - (3)ZE - Zp
Eqs. (2) and (3) apply to both crossed and uncrossed disparity. In the
latter case Ax takes negative values (because Zp is negative), with the
result that XpR > XPL, as it should be in the case of uncrossed dis-
parity.
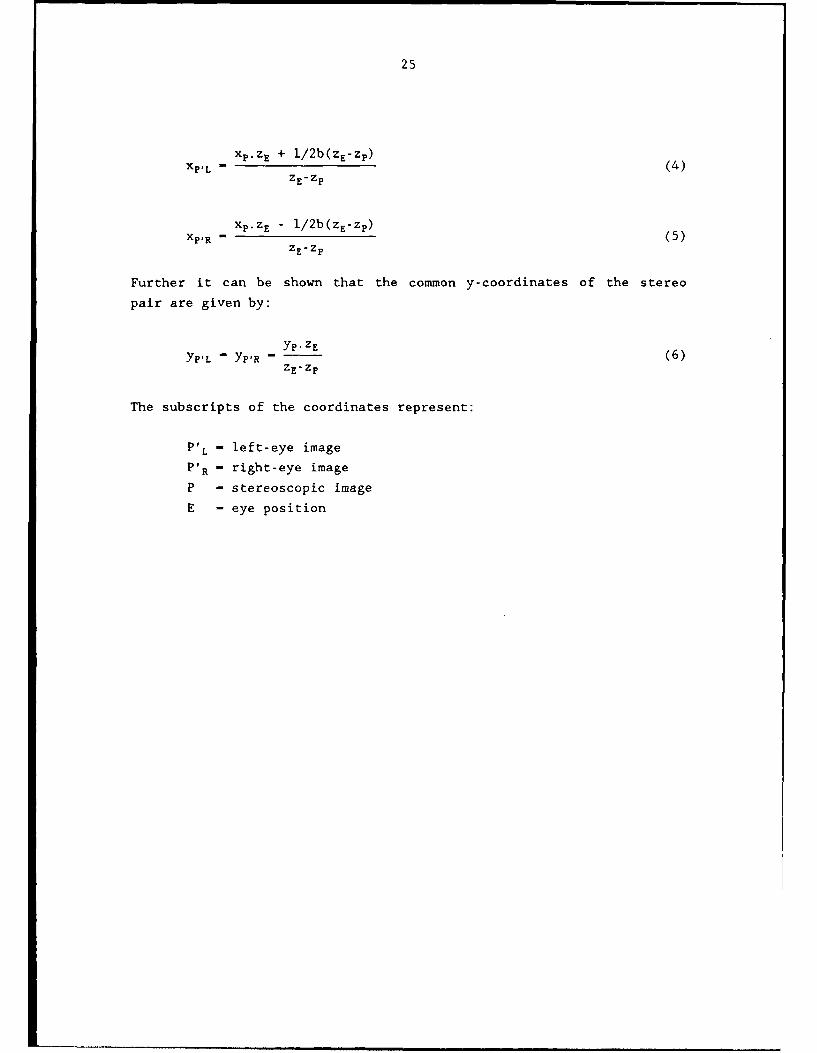
By substituting Eqs. (2) and (3) into Eq. (1) the x,y coordinates of
the stereo pair can be calculated from the coordinates specifying the
point P and the viewing point E. That is,
25
XPL XP.ZE + l/2b(zE-ZP)
ZEZP
XP.ZE - l/ 2 b(ZE-zp)XP.R (5
ZP
Further it can be shown that the common y-coordinates of the stereo
pair are given by:
YP'L - YP'R - YZE(6)ZEZP
The subscripts of the coordinates represent:
PL- left-eye image
PR- right-eye image
P - stereoscopic image
E - eye position

REPORT DOCUMENTATION PAGE
1. DEFENCE REPORT NUMBER (MOO-NL) 2. RECIPIENT'S ACCESSION NUMBER 3. PERFORMING ORGANIZATION REPORTNUMBER
TD 89-4551 IZF 1989-53
4. PROJECT/TASK/WORK UNIT NO. 5. CONTRACT NUMBER 6. REPORT DATE
731.3 B87-17 December 1, 1989
7. NUMBER OF PAGES 8. NUMBER OF REFERENCES 9. TYPE OF REPORT AND DATESCOVERED
25 19 Final
10. TITLE AND SUBTITLE
The effect of stereoscopic presentation on a simulated Air Traffic Control task
11. AUTHOR(S)
J. Watraven and A.D. Hekstra
12. PERFORMING ORGANIZATION NAME(S) AND ADDRESS(ES)
TNO Institute for PerceptionKampweg 53769 DE SOESTERBERG
13. SPONSORING/MONITORING AGENCY NAME(S) AND ADDRESS(ES)
TNO Division of National Defence ResearchKoningin Marialaan 212595 GA DEN HAAG
14. SUPPLEMENTARY NOTES
15. ABSTRACT (MAXIMUM 200 WORDS, 1044 BYTE)
Collision prediction in a simulated Ai.- Traffic Control (ATC) task was compared for conditions in which the
aircraft displacements on the radar display were shown in either two or three dimensions. The imageseparation that is required for stereoscopic (3D) viewing was achieved by both anaglyphic presentation (red-
green glasses) and sequential field stereoscopy (electro-optical shutters). The stimuli consisted of traffic
scenarios that varied in density and complexity. One of the aircraft was singled out to represent the one tobe under control. The observer's task was to judge whether it was on a collision course or not. In the 2D
condition, the (necessary) attitude information was provided in numerical form. In the 3D conditions,
experiments both with and without numerical information were performed.
The results indicate that stereoscopic information by itself, that is, without numerical attitude
information, may already be sufficient for the task under consideration. However, in the condition with
combined stereoscopic and numerical altitude information, the performance was not significantly better than
in the 2D condition employing numerical information only. Nevertheless, subjects preferred the stereoscopicdisplay over the (normal) two-dimensional format.
16. DESCRIPTORS IDENTIFIERS
Stereoscopic Vision Air Traffic ControlVisual Displays 30 (ATC) DisplayAircraft 2D vs 30 PerformanceOperator Performance
17a. SECURITY CLASSIFICATION 171. SECURITY CLASSIFICATION 17c. SECURITY CLASSIFICATION
(OF REPORT)J (OF PAGE) (OF ABSTRACT)
18. DISTRIBUTION/AVAILABILITY STATEMENT 17d. SECURITY CLASSIFICATION(OF TITLES)
Unlimite evaitit
VERZENDLIJ ST
1. Hoofddirecteur van de Hoofdgroep Defensieonderzoek TNO
2. Directie Wetenschappelijk Onderzoek en Ontwikkeling Defeiisie
Hoofd WetenschappeiLijk Onderzoek KL3.
Ply. Hoofd Wetenschappelijk Onderzoek KL
4,5. Haofd Wetenschappelijk Onderzoek KLu
Hoofd Wetenschappelijk Onderzoek KM6.
Ply. Hoofd Wetenschappelijk Onderzoek KM
7. Wnd. Hoofd Afd. Militair Geneeskundig Beleid
8. Inspecteur Ceneeskundige Dienst KLBrig.Cen. -arts B.C. Mels
9. Inspecteur Ceneeskundige Dienst KLuCaire J.Th. Versteeg
10. Inspecteur Geneeskundige Dienst ZeemachtGdr-arts A.J. Noordhoek
11, 12, 13. Hoofd van het Wetensch. en Techn. Doc. - en Inform.Centrun voor de Krijgsmacht
LEDEN WAARNEMINGS CONTACT COMMISSIE14. Maj.Ir. W.C.M. Bouwmans15. LTZARI F.D.J.R. Feunekes16. Dr. N. Cuns17. Drs. C.W. Lamberts18. Ir. P.H. van Overbeek19. Drs. W. Pelt20. Maj. dierenarts H.W. Poen2>. Drs. F.H.J.I. Rameckers22. LTZSD20C KV Drs. M.B.A.M. Scheffers23. Prof.Ir. C. van Schooneveld24. LKo1.Drs. H.W. de Swart25. Ir. M. Vertregt26. Kol. vliegerarts B. Voorslijs
27. Dr. V.D. Hopkin, RAF Institute of Aviation Medicine,Farnborough, Enge land
28. Mr. H. de Vry, Eurocontrol Operations Directorate, Brussel,Belgie
29. Mr. C.L. Gillett, EGATS, Eurocontrol Guild, Beek
30. Dr. J. -P. Menu, CERMA, Parijs, Frankrijk
31. Dr. P. Milgrau, University of Toronto, Canada
32. Ir. J. Rogge, KMA, Afd. Technische Studies, Breda
Extra exeniplaren van dit rapport kunnen worden aan-gevraagd door tussenkonist van de HWOs of de DWOO.