AD-A278 ImIN~lIIhiHJ - DTIC · I Distance between thermocouples in copper block 12 Distance from...
69
WL-TR-93-2128 FUNDAMENTAL STUDIES IN BLOW-DOVN AND CRYOGENIC COOLING AD-A278 967 ImIN~lIIhiHJ L. C. CHOW M. S. SEHMBEY W. F. LU M. R. PAIS 0. J. HAHN UNIVERSITY OF KENTUCKY DEPARTMENT OF MECHANICAL ENGINEERING LEXINGTON KY 40506-0046 SEPTEMBER 1993 INTERIM REPORT FOR 09/01/92-08/01/93 APPROVED FOR PUBLIC RELEASE; DISTRIBUTION IS UNLIMITED. DTIC E•LEcTEaI AEROPROPULSION AND POWER DIRECTORATE WRIGHT LABORATORY AIR FORCE MATERIEL COMMAND WRIGHT PATTERSON AFB OH 45433-7650 (\Pý94-13821 9 !I1 KY 48 I ll II
Transcript of AD-A278 ImIN~lIIhiHJ - DTIC · I Distance between thermocouples in copper block 12 Distance from...
WL-TR-93-2128
FUNDAMENTAL STUDIES IN BLOW-DOVNAND CRYOGENIC COOLING
AD-A278 967ImIN~lIIhiHJ
L. C. CHOW M. S. SEHMBEYW. F. LU M. R. PAIS0. J. HAHN
UNIVERSITY OF KENTUCKYDEPARTMENT OF MECHANICAL ENGINEERINGLEXINGTON KY 40506-0046
SEPTEMBER 1993
INTERIM REPORT FOR 09/01/92-08/01/93
APPROVED FOR PUBLIC RELEASE; DISTRIBUTION IS UNLIMITED.
DTICE•LEcTEaI
AEROPROPULSION AND POWER DIRECTORATEWRIGHT LABORATORYAIR FORCE MATERIEL COMMANDWRIGHT PATTERSON AFB OH 45433-7650 (\Pý94-13821
9 !I1 KY 4 8 I ll II

NOTICE
When Government drawings, specifications, or other data are used forany purpose other than in connection with a definitely Government-relatedprocurement, the United States Government incurs no responsibility or anyobligation whatsoever. The fact that the government may have formulated orin any way supplied the said drawings, specifications, or other data, is notto be regarded by implication, or otherwise in any manner construed, aslicensing the holder, or any other person or corporation; or as conveyingany rights or permission to manufacture, use, or sell any patented inventionthat may in any way be related thereto.
This report is releasable to the National Technical Information Service(NTIS). At NTIS, it will be available to the general public, includingforeign nations.
This technical report has been reviewed and is approved for publica-tion.
J R. BROWN J' BEAM~, Section Chief
Termal Technology Section •ermal Technology SectionPower Technology Branch Power Technology BranchAerospace Power Division Aerospace Power Division
MICHAEL D. BRAYDICH, t Col, USAFDeputy ChiefAerospace ?ower DivisionAero Propulsion and Power Directorate
If your address has changed, if you wish to be removed from our mailinglist, or if the addressee is no longer employed by your organization pleasenotify WL/POOS WPAFB, OH 45433- 7251 to help us maintain a currentmailing list.
Copies of this report should not be returned unless return is required bysecurity considerations, contractual obligations, or notice on a specificdocument.

S Form Approved
REPORT DOCUMENTATION PAGE OM F o. AOv0edO
Public reporting burden for this collection of information is etimate to a Ierage I hour per response. including the time for eviewng ,nstrucions. searching existing data souirces.gathergin and maintaining the data needed, and completing i Wig the coltion of information Snd comments regarding this burden estimate or any other aspea of thiscolleMor to information. including suggestions for reducing this burden. to Washington Headquarters Services. Directorate for information Operations and Reports. 121S JeffersonOavis Highway. Suite 1204. Arhngton. VA 22202-4302. and to the Office of Management and Budget. Paperwor Iteduction Project (0704-0 138). Washington. DC 20503.
1. AGENCY USE ONLY (Leave blank) 12. REPORT DATE I3. REPORT TYPE AND DATES COVERED
I SEP 1993 I INTERIM 09/01/92--08/01/934. TITLE AND SUBTITLE FU-NDAMETAL STUDIES IN BLOW-DOWN 5. FUNDING NUMBERS
AND CRYOGENIC COOLING C F33615-91-C-2152PE 63218
_PR 16016. AUTHOR(S) TA 05
L. C. CHOW M. S. SEHMBEY WU 03W. F. LU M. R. PAIS0. J. HAHN
7I . PERFORMING ORGANIZATION NAME(S) AND ADDRESS(ES) 8. PERFORMING ORGANIZATIONREPORT NUMBER
UNIVERSITY OF KENTUCKYDEPARTMENT OF MECHANICAL ENGINEERING UK-ME-93-04LEXINGTON KY 40506-0046
9. SPONSORING/MONITORING AGENCY NAME(S) AND ADDRESS(ES) 10. SPONSORING/MONITORINGAEROPROPULSION AND POWER DIRECTORATE AGENCY REPORT NUMBER
WRIGHT LABORATORY WL-TR-93-2128AIR FORCE MATERIEL COMMANDWRIGHT PATTERSON AFB OH 45433-7650
11. SUPPLEMENTARY NOTES
1Za. DMSTRIBUTION /AVAILABILITY STATEMENT 12b. DISTRIBUTION CODEAPPROVED FOR PUBLIC RELEASE; DISTRIBUTION ISUNLIMITED.
13. ABSTRACT (Maximum 200 words)
* Experiments were conducted to study the free expansion (blow-down) behavior ofcryogens. Visualization of the phenomena and determination of the final state ofof LN2 during free expansion were the main purposes of the study. Results prese-nted show the effect of nozzle size, upstream pressure and downstream pressure.The second part of the study details the experiments conducted to study the heattransfer characteristics during spray cooling with LN2. Four different nozzlesat various pressures were used to study the variation in spray cooling heat tra-nsfer. Effect of nozzle and flow rate on the critical heat flux and overall heattransfer characteristics are presehedd. Finally an experiment designed to studythe LN2 pool boiling heat transfer from discrete sources in a confined space isdescribed.
:14. SUBJECT TERMS 15. NUMBER OF PAGESBLOW-DOWN, SUPERCRITICAL HYDROGEN, CRYOGENS, 68SPRAY COOLING, JET IMPINGEMENT, FREE EXPANSION, 16. PRICE CODEPOOL BOILING
:17. SECURITY CLASSIFICATION I 18. SECURITY CLASSIFICATION I19. SECURITY CLASSIFICATION 20. LIMITATION OF ABSTRACTOF REPORT OF THIS PAGE OF ABSTRACT
UNCLASSIFIED I UNCLASSIFIED I UNCLASSIFIED ULNSN 7540-01-280-5500 Standard Form 298 (Rev 2-89)
Prescribed by ANSI Std Z39-18298-102
TABLE OF CONTENTS
SECTION PAGE
1. INTRODUCTION 1
2. OBJECTIVES 2
3. BACKGROUND 3
4. FREE EXPANSION 7
4.1 Design Considerations 7
4.2 Design of the Experiment 9
4.3 Experiment Procedure 12
4.4 Results and Discussion 13
5. SPRAY COOLING 25
5.1 Experiment Set-up 25
5.2 Experimental Procedure 28
5.3 Results and Discussion 30
5.3.1 Individual Nozzle Results 30
5.3.2 Comparison of Nozzles 33
6. POOL BOILING HEAT TRANSFER FROM DISCRETE SOURCES IN
CONFINED SPACE 39
6.1 Experimental Design 40
6.2 Experiment Procedure 42
7. CONCLUSIONS AND FUTURE PLANS 44
8. REFERENCES 45
APPENDIX 49
iii

A. 1 Error Analysis: Spray Cooling 49
A.2 Error Analysis: Free Expansion 50
A.3 Free Expansion Study- Additional Data and Photographs 50
AGo@ooCJSo 101'o
G'i RA&I
DIIC TABl]•a•X1fOced
iv
LIST OF ILLUSTRATIONS
FIGURE PAGE
4.1 Blow-Down Process 7
4.2 Schematic of Free Expansion Set-up 9
4.3 Pressurizing Arrangement 10
4.4 Temperature and Pressure in the Blow-Down Tube 13
4.5 Temperature and Pressure in the Blow-Down Tube 14
4.6 Transient Temperature Field 17
4.7 Transient Temperature Field 17
4.8 Temperature and Pressure in the Blow-Down Tube 18
4.9 Temperature and Pressure in the Blow-Down Tube 18
4.10 Transient Temperature Field 19
4.11 Transient Temperature Field 19
4.12 Temperature and Pressure in the Blow-Down Tube 20
4.13 Transient Temperature Field 20
4.14 T-U Diagram for 0.007" Nozzle 21
4.15 T-U Diagram for 0.010" Nozzle 21
4.16 T-U Diagram for 0.014" Nozzle 22
4.17 Mass Flow Rate 22
4.18 Solid Formation Process for Different Nozzle Sizes 24
5.1 Experimental Set-up 25
5.2 Bleed Port Details 26
5.3 Heater Details 27
v

5.4 Spray Cooling 28
5.5 TGO.3 Heat Transfer Characteristics 31
5.6 TGO.5 Heat Transfer Characteristics 32
5.7 TGO.7 Heat Transfer Characteristics 33
5.8 FLNo.13 Heat Transfer Characteristics 34
5.9 Effect of Nozzle and Mass Flow Rate on CHF 35
5.10 Effect of Nozzle on Efficiency 36
5.11 Comparison of Heat Transfer Characteristics 37
5.12 Effect of Flow Rate and Nozzle on Minimum Heat Flux 37
6.1 Experiment Chamber 40
6.2 Heater Arrangement 41
6.3 Heater Case 41
6.4 Data Acquisition and Electrical Circuit 42
A. 1 Temperature and Pressure in Blow-Down Tube 51
A.2 Temperature and Pressure in Blow-Down Tube 51
A.3 Transient Temperature Field 52
A.4 Transient Temperature Field 52
A.5 Temperature and Pressure in Blow-Down Tube 53
A.6 Temperature and Pressure in Blow-Down Tube 53
A.7 Temperature and Pressure in Blow-Down Tube 54
A.8 Transient Temperature Field 54
A.9 Transient Temperature Field 55
A. 10 Temperature and Pressure in Blow-Down Tube 55
A. 11 Temperature and Pressure in Blow-Down Tube 56
vi

A.12 Temperature and Pressure in Blow-Down Tube 56
A. 13 Temperature and Pressure in Blow-Down Tube 57
A.14 Transient Temperature Field 57
A. 15 Transient Temperature Field 58
A.16 Transient Temperature Field 58
A. 17 Solid Nitrogen Being Pushed Out from Tube Nozzle 59
A.18 Spray and Solid Nitrogen Accreting on Thermocouple (d=0.010") 59
A. 19 Large Nitrogen Block Accreted around Tube Nozzle 60
A.20 Solid Nitrogen Being Blown Away from Thermocouple by Spray (d=0.010") 60
vii

NOMENCLATURE
d Diameter of nozzle orifice
k Thermal conductivity
I Distance between thermocouples in copper block
12 Distance from top thermocouple to surface
di Mass flow rate
P Pressure
Q Heat
q" Heat flux
T Temperature
TM Saturation temperature
T.f, Tw Heat transfer surface temperature
"T2 Temperature indicated by top thermocouple in the copper block
U Internal Energy
W Work
5 Uncertainty
p Density
viiI

1. INTRODUCTION
The operation of electronics at liquid nitrogen temperature (LNT) has become very
attractive due to the development of high temperature superconductors and the fact that many
MOS devices operate better at LNT. However, the information regarding the heat transfer
characteristics of liquid nitrogen under various modes of heat transfer is not readily available.
In order for the advantages of LNT operation of electronics to be realized, it is essential that
enough information be available concerning the anticipated heat transfer modes.
This study involves the detailed investigation of heat, removal methods for successful
operation at LNT. In this respect, results from experiments conducted in spray cooling with
liquid nitrogen (LN2) are presented here. Spray cooling was chosen as the first area of
investigation because of its known capability as the highest heat flux removal method known.
In order to examine the possibility of cryogenic cooling in space based systems, it is essentiAl
to study the free expansion (blow-down) process of cryogens. In this study, the liquid nitrogen
free expansion was experimentally studied. The details of the study and the results are presented
in the following chapters. This study will also involve the investigation of the pool boiling heat
transfer to liquid nitrogen from multiple discrete sources in confined space.
The objectives of the study are detailed first, following that the background information for
the motivation of this study is presented. The details of free expansion study containing the
experiment details and results and discussion is presented next. The spray cooling study details
are then presented, this contains details of the experimental results. The background and the
details of the experiment set-up for the pool boiling study is presented after this. Finally, the
conclusions and discussion for this report are presented.
2. OBJECTI'V
The objectives of this study are to obtain information on the heat transfer characteristics
under the conditions of cryogenic cooling in various modes. Another objective is to evaluate the
possibility of space based application for the various heat transfer modes. In order to accomplish
the above, experimental data have to be obtained and analyzed for the heat transfer
characteristics of LN2 under spray cooling, jet impingement cooling, forced convection cooling
and pool boiling. In addition, experimental data are required for the phenomena involved in free
expansion (blow-down) of cryogens into vacuum.
2

3. BACKGROUND
The electronic systems envisioned for LNT operations fall into two categories; first, the
superconducting circuits composed of HTS devices, and second, hybrid circuits containing HTS
and semiconductor devices.
3.1 Superconducting Circuits
Superconducting circuits will consist of HTS devices (logic gates, inverters, memory cells,
etc.) with superconducting interconnects [1]. The main applications of the HTS circuits will be
a) High speed digital logic and memory: gate speeds under 10 ps are easily achievable
using Josephson junctions [1-3]. This will allow the development of faster
supercomputers.
b) Far infrared/high frequency radar detection: very low noise detection in the
microwave and millimeter wave band is possible using Josephson junction device
mixers; well above 100 GHz detection is possible with noise figures lower than 0.3
[1,4,5].
c) Magnetic field sensors: very sensitive magnetometers and voltmeters can be made
using SQUIDs (Superconducting Quantum Interference Devices) [1,6,7]. This
ultrasensitive instrumentation is used for magnetic field geophysical exploration and
biomagnetic studies of human body.
Almost all of the functions performed in high performance electronics can be done by a
superconductor circuit [2]. However, the superconductor circuits cannot handle high power
levels, also, there are no superconducting rectifiers and semiconductors make better amplifiers
and mass memory devices.
A cursory examination of heat transfer requirements in superconducting circuits may lead
one to believe that due to the very nature of superconductivity heat dissipation would not be a
problem. A closer examination, however, reveals how ill-founded that notion is. The main
components in a superconducting circuit are the high speed, low power switches, the Josephson
junctions (also called Superconductor-Insulator-Superconductor devices, SISs) [1-3, 8-10]. The
main advantages of these devices are the low gate delay times and low power dissipation, these
features in combination will allow much higher device packing compared to semiconductor
circuits [1-3]. A typical SIS working at 4.2 K has a power dissipation of 5 W/cm2, this depends
3

on the Josephson critical current density, J, (2000 A/cm2 at 4.2 K) and the gap voltage, V,(4.5
mV for NbN which has T, = 15 K) [9,10]. Hence, a circuit containing SIS devices operating
at 4.2 K is easily handled by proper packaging and immersion in liquid helium. However, the
gap voltage in SISs is directly proportional to the transition temperature of the superconductor
[10]. Also, the critical current for the device will have to scale up in direct proportion to the
operating temperature to ensure stable operation in presence of higher thermal noise [10]. This
means that an SIS device operating at 77 K made from superconductor with T, = 115 K will
have V. = 34 Mv and will have to operate at a critical current about 18 times higher than the
device operating at 4.2 K. This can have two implications:
1) if the SIS device developed for 77 K operation has the same J, as the low
temperature one, then the size of the device will have to be scaled up to increase
the total critical current, this will result in much larger device sizes and a power
dissipation of about 68 W/cm2, this option is not very attractive because larger
device sizes will mean a loss in compactness and, hence, slower operating speeds
2) if the SIS device for 77 K operation are to be about the same size as the one
designed for 4.2 K operation, the Jc will have to increase to about 18 x 2000 =
36000 A/cm2, this results in a power dissipation of about 600 W/cm2 (power = (Vg
x J)J/2, assuming equal times for on and off states of the switch)
Looking at the two options, we see that the first case can probably be handled by proper
packaging and immersing the chip in LN2 (pool boiling CHF = 15 W/cm2), however, this option
does not take advantage of SIS capabilities. The second option is the more attractive one if a
way can be found to remove the power dissipated.
3.2 Hybrid Circuits
It has been reported by many investigators that MOS semiconductor devices show a marked
improvement in performance as the operating temperature is lowered [1,2,8,11,12].
Furthermore, the thermal conductivities of semiconductor substrates and packaging materials
(silicon, germanium, beryllium, alumina ) are seen to increase dramatically as the temperature
is lowered to LNT [13]. The main advantages of low temperature operation are: increased
electron and hole mobilities, lowered interconnection resistivities, reduced leakage currents,
greater subthreshold slope, more efficient heat dissipation, and reduction in thermal noise [11].
4

One of the possible applications of low temperature electronics will be in the area of high
efficiency ac/dc, dc/ac and RF power conversion at the multikilowatt level. As mentioned
earlier, superconducting circuits are not capable of handling high power levels. Hence, MOS
field effect transistors (MOSFErs) can be used in combination with high Q inductors and
capacitors made from HTSs to obtain the zero voltage switching circuits suitable for power
conversion applications. Such an integration will result in a drastic size and weight reduction.
The efficiency of these circuits improves greatly at low temperatures due to the dramatic
reduction in the on-resistance of power MOSFETs [12]. However, the efficiency of these circuits
depends greatly on the Q values of the inductors and capacitors used in the circuit. Hence, it is
necessary to use HTSs for these components to obtain the maximum efficiency. The main hurdle
is the development of these HTS components capable of handling high RF current densities [12].
Other types of hybrid circuits taking advantage of the best features of semiconductors and
superconductors are also under development [1,2,8]. Any hybrid circuit is inherently more prone
to thermal failure due to the presence of high heat dissipation transistors in the vicinity of
superconducting elements. Hence, it is essential that the cooling system is capable of removing
the heat very efficiently. This can probably be done by using bulky heat spreaders and
immersing the circuit in LN2, however, this reduces the size and weight advantage associated
with a hybrid circuit. This again points towards the need to employ a high heat flux removal
method.
3.3 Thermal Management of Circuits at LNT
The possible methods of high heat flux removal for LNT operation are; spray cooling, jet
impingement cooling and forced convection boiling. The overall aim of this study is to undertake
a comprehensive investigation of the heat transfer characteristics of these modes with LN2 as
the coolant. In spite of the advantages associated with high heat flux removal methods, their
applicability is limited. The earliest applications of LNT operation will probably use pool boiling
heat transfer to liquid nitrogen. Hence, in addition to the high heat flux methods, this study also
involves the investigation of pool boiling heat transfer from a multiple heat source bank in a
confined space.
In space based weapon systems, all the operating systems have to be brought from their
idle state to full functionality within a few minutes. Thus, the heat transfer management system
5
has to be rapidly deployed. For cryogenically cooled power electronics, this will mean bringing
up a system from vacuum state to cryocooled state in a very short time. Thus, the blow-down
process for cryogens needs to be studied. In this regard, this study involves the examination of
the free expansion (blow-down) process in cryogens.
6

4. FREE EXPANSION
An experimental set-up was designed and experiments performed to get a better insight
into the thermal and fluid flow phenomena occurring in the blow-down tube (BT), and to obtain
data which is critical to the performance of the system. The experimental objectives were:
1)observe the phenomena during the blow-down process
2)thermodynamically determine the final state
3)obtain knowledge about fluid instabilities in blow-down
4.1 Design Considerations
The thermophysical phenomena occurring in the flow field and within the walls of the
blow-down tube are varied and complex. In order to be able to design and predict the operation
140Critical Point
120Blowdovn Process
Saturated line
S100kd-
40
--200 - 150 -10O0 -50 0 50 1O00
Internal Energy (kJ/kg)
Fig=r 4.1 Blow-Down Process
chaateitics of such a tube, careful considerations are needed. Without losing academic value,
liquid nitrogen was used to substitute liquid hydrogen. To determine the physics of the blow-
7

down procedure, a scale-down model of a blow-down tube was used.
The main focus of the experiment was on the following categories:
l)Visualization: Figure 4.1 shows the thermodynamic path the blow-down process goes
through. Since the final state region is below the triple point, it is expected that during the free
expansion, nitrogen will freeze to form solid nitrogen. Also when nitrogen is near the triple
point region, there will be two-phase flow, either solid-gas, or liquid-gas mixture will be seen
in the blow-down tube. For nitrogen, the critical pressure is 500 psi. There exists a relatively
big pressure drop during the blow-down process, hence, the liquid nitrogen will break and
very small droplets. All these phenomena have never been described in previous research pal
The experimental set-up, thus, had to allow direct visualization of the phenomena.
2)Measurements: The most important parameters to be measured were the pressure and the
temperature of the initial and final state. The final state lies in the two phase region, hence the
final state has to be thermodynamically determined. This is done based on the following analysis.
The liquid nitrogen injector and the blow-down tube can be considered to be a closed system.
The injector is under very high pressure (several hundred psi) while the blow-down tube is under
vacuum. At the very far end of the tube exists a vent connecting to a vacuum pump that can be
ignored for the short period of injection. The system can be treated as a close system at the
instant of nitrogen injection. According to the first law of thermodynamics, the conservation of
energy of the system can be written as:
Q=AU+W (Equation 4.1)
Since the liquid nitrogen will undergo a free expansion process, there is no work done. Also at
the instant of blow-down, the time span is so short that heat transfer can be ignored. Therefore,
Q is equal to zero. The free expansion process can, thus, be regarded as a process where
internal energy U remains constant. If the temperature and pressure of the upstream liquid
nitrogen are measured, its internal energy can be determined. Then on temperature-internal
energy diagram the final thermodynamic state can be determined, provided that its final
temperature or pressure is measured.
Also, it is very important to measure the mass flow rate of liquid nitrogen in free expansion
experiments. It provides critical data for determining the time needed for the cool-down process
of the blow-down tube. This is the key problem in the start-up of the blow-down tube. Different
8
phenomena can also be compared between their corresponding flow rates.
m
Vl
I - Vý ClbH - ondeIII -Nw•sM -PMaPTV -uodSV -ULMDmwaVI -mc'YU - Ya=M PIMM
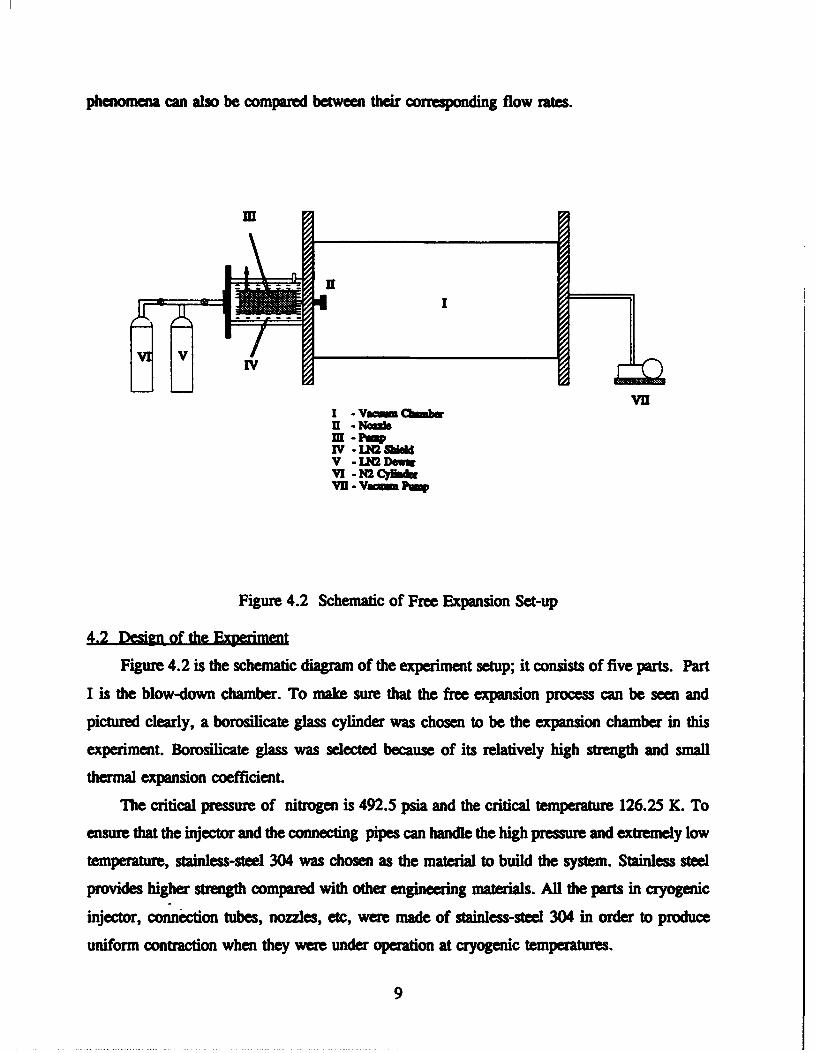
Figure 4.2 Schematic of Free Expansion Set-up
4.2 Design of the Experiment
Figure 4.2 is the schematic diagram of the experiment setup; it consists of five parts. Part
I is the blow-down chamber. To make sure that the free expansion process can be seen and
pictured clearly, a borosilicate glass cylinder was chosen to be the expansion chamber in this
experiment. Borosilicate glass was selected because of its relatively high strength and small
thermal expansion coefficient.
The critical pressure of nitrogen is 492.5 psia and the critical temperature 126.25 K. To
ensure that the injector and the connecting pipes can handle the high pressure and extremely low.temper , stainless-steel 304 was chosen as the material to build the system. Stainless steel
provides higher strength compared with other engineering materials. All the parts in cryogenic
injector, connection tubes, nozzles, etc, were made of stainless-steel 304 in order to produce
uniform contraction when they were under operation at cryogenic temperatures.
9

The pressure range of liquid nitrogen that the experiment would cover was from 100 psig
to 500 psig. Since the experiment focuses on transient processes, the size of the experiment set-
up should be as compact as possible to reduce thermal inertia. The blow-down process lasts
about 30 to 40 seconds, assuming liquid nitrogen at 500 psig is injected into a perfect vacuum,
and also assuming that there is no phase change during the process, the velocity of injection will
be:
VsF (Equation 4.2)
The liquid nitrogen can be treated as saturated. It gives the velocity of injection to be larger than
200 m/s. Suppose the injection period will last about 40 seconds, the volume of liquid nitrogen
needed and the size of the blow-down nozzle can then be determined . Considering other
requirements of the set-up, such as compactness, economy etc, the volume of liquid nitrogen per
test cycle was chosen to be 50 cc and the size of nozzle range from 0.005 in to 0.014 in.
To achieve the very high pressure supercritical nitrogen (above 500 psig) requires, without
losing compactness, a special arrangement was designed (Figure 4.3). The size of the pump was
1 in. in diameter and 6 in. in length ( approximate volume 75 cc). To determine the diameter
of the glass chamber (blow-down tube), the most important consideration is to allow the free
I I i ...........III IV VII I ,
G" Nkm n (High IPrgmu) Liquid Nitrogen
Figure 4.3 Pressurizing Arrangement
10
expansion phenomena to fully develop in the tube. The diameter of the glass tube was chosen
to be 8 inches to allow an expansion rate of more than 600 times (diameter of the tube over that
of the nozzle). The length of the glass chamber was chosen to be 40 inches based on the
consideration that even when 75 cc of liquid nitrogen warms up to 300 K inside the chamber,
the pressure inside the chamber should remain below atmospheric pressure.
The glass cylinder was sealed against the stainless steel flanges by two different methods.
The warm side flange (i.e., the one connected to the vacuum pump) was sealed to the glass by
a silicone O-ring, this was sufficient as the temperature on the warm side was not expected to
go below the operating temperature of silicone. The seal between the cold flange and the glass
was effected by an indium gasket, indium was chosen as the sealant because it remains soft and
pliable below liquid nitrogen temperature. The seals between the various stainless-steel flanges
were made using metal spring energized teflon O-rings; the details of the individual components
and the assembly have been described in report No. UK-ME-92-06 [14].
Thermocouples were used to measure the temperature. The temperature of liquid nitrogen
inside the pump was around 78 K, inside the glass chamber, the temperature ranged form 50 K
to 300 K. For this range, E-type thermocouples were selected. The experiment dealt with
transient process, so the response time of the thermocouples had to be as short as possible, in
other words, their thermal inertia had to be small. Therefore, all the thermocouples used were
self-made by welding the wires in an inert (Argon) environment. The diameter of the
thermocouple wire was 0.003 in. and the thermocouple leads had teflon insulation.
Inside the glass chamber, six thermocouples were arranged in a row along the axis of the
cylinder and nozzle. Thus, the thermocouples were in the trail of the liquid nitrogen spray
ejected from the nozzle. There also was a pair of thermocouples inside the liquid nitrogen pump
to measure the upstream temperature. Since the thermocouples were self-made, calibration was
undertaken to ensure their accuracy. A special silicon-diode probe manufactured and pre-
calibrated by LakeShore Inc. was used for the calibration. The silicon-diode probe has excellent
repeatability: ± 10 mK at 4 K over repeated thermal cycling, and high accuracy: ±0.5 K in 2K
to 100 K range. The calibration set-up consisted of a nitrogen vessel and a vacuum pump. The
vessel was filled with liquid nitrogen and subjected to different vacuum levels and the
temperatures indicated by the thermocouples and the silicone-diode probe were compared for
calibration. The calibration showed that the thermocouples were accurate to within 1 K in the
11
temperature range under consideration.
The pressure inside the glass chamber was measured by a convectron vacuum gauge
connected to vacuum gauge controller (VGC). It can measure pressures from I x 10O Torrs to
1 atm. The pressure readout was available via the front panel display of the VGC along with
an analog output proportional to the common log of the absolute pressure.
All measurement outputs were recorded by a computer via a Fluke Helios II data
acquisition system. The thermocouples and pressure gauge output were hooked up to the data
acquisition which was connected to the computer.
4.3 Experiment Procedure
Referring back to Figure 4.3, the liquid nitrogen storage tank was linked to the pump and
the liquid nitrogen shield via a series of cryogenic valves. Valves II and VI are opened first
to let liquid nitrogen flow through the cooling shield in order to precool the system. Vaporized
nitrogen and air trapped in the cooling shell exits from valve VIII. In the meantime, the vacuum
pump is switched on to evacuate the glass chamber. When the cooling shell is full of liquid
nitrogen, valve IX and vent VII are opened to let the nitrogen fill the pump. Valve I, the
pressure regulator of the nitrogen gas cylinder is adjusted to the desired upstream pressure.
When the pressure inside the glass chamber drops to about 2 mmHg and the pump is full of
liquid nitrogen, the vent valves are closed along with valve IX. Valve III is opened to pressurize
the liquid nitrogen to the required pressure and valve X is opened to inject liquid nitrogen into
the chamber. This process was repeated a few times to let the nozzle and the injector passage
cool down. Then the pressure of the nitrogen gas is adjusted to 100, 200, 300, 400 or 500 psig
(the pressures which were used for this study) and the procedure was repeated to obtain the
pressure and temperature data.
The mass flow rate cannot be measured directly since it was two-phase flow. Hence, the
average flow rate over 5 seconds of the injection was measured. The experiment procedure for
flow rate measurement was similar to that described earlier for the blow-down experiments
except the valve connecting the vacuum pump to the chamber was shut off before the injector
valve was opened. The initial pressure and temperature inside the glass chamber was recorded.
Then the injector valve is opened and sub/supercritical nitrogen is allowed to inject into the
evacuated chamber for 5 seconds before the valve is shut off. The pressure of the chamber is
12

monitored and the final pressure is noted, usually the nitrogen gas inside the chamber reached
room temperature. Assuming the gas nitrogen at this state as ideal gas, we can apply the state
equation:
M -PV (Equation 4.3)
This gives us the total mass injected into the chamber in 5 seconds, the mass flow rate can, thus,
be calculated.
4.4 Results and Discussion
Three different sizes of nozzles were tested, the upstream pressure of the liquid nitrogen
were varied, from 100 psig to 500 psig for each nozzle. When the pressure inside the glass
chamber was above the triple point, i.e., the pressure was higher than 98 mmhg, no freezing
was observed. To simulate the conditions in space, the pressure of the blow-down tube was set
to be as low as possible. Compared with the triple point of nitrogen which is 98 mmhg, the
experimental chamber could go down to 1 or 2 mmhg, which was low enough for the purpose
of this study.
300 80
: = :- 70
2502 -60
0 50Y200 E
3 -40,
M iZ 30
-2010010
50, 00 5 10 1 5 20 25
"Time (s)* -pressureS--temperature
nozzle: d0.007upstream pressure: 5OOpsig1---first thermocouple2---econd thermocouple3--temperature in injector
Figure 4.4 Temperature and Pressure in the Blow-Down Tube
The smallest size (0.007 in.) nozzle was tested first. When the injector valve was opened,
13

solid nitrogen appeared immediately at the nozzle orifice. It was very clear that the solid
nitrogen was forming inside the nozzle since the solid nitrogen came out of nozzle very slowly,
as if being pushed out of the nozzle by the pressure in the injector. The phenomena was much
like squeezing a toothpaste tube. The solid nitrogen accumulated around the nozzle increasing
in size as the experiment progressed. When the upstream pressure was low, i.e., 100 psig or 200
psig, the solid block could grow up to the size of 2 inches in length and 0.7 inch in diameter.
300 * 30
250 2
S200 20
. 150
,50 10 U!.,I-100 -\ 0C
0 0
0 10 20 30 40 50 60 70
Time (s)
o -pressure* -temperature
nozzle d: 0.007"upstream pressure: 300 psig1 -first thermocouple2-second thermocouple3-temperature in injector
Figure 4.5 Temperature and Pressure in the Blow-Down Tube
The temperature of the solid was below triple point (64 K), the pressure inside the chamber rose
to a certain level and remained stable because the solid block could not melt or sublimate
quickly. When the ice block grew so big that it could not support itself anymore, it fell down
to the bottom of the chamber. The temperature of the chamber wall was close to room
temperature, hence, the block of solid nitrogen floated on the wall due to Leidenfrost condition.
New ice block began to form on the rim of the nozzle after the previous block had dropped off.
When the upstream pressure was increased, the ice forming process seemed to accelerate;
larger amount of solid nitrogen was pushed out of the nozzle. But since that the pushing force
was larger, the solid block could not grow to the same size before it was pushed away. The size
of the blocks became smaller while the frequency of generation of the solid blocks became
14

higher. This caused the pressure in the chamber to increase faster. The upstream pressure did
not have strong impact upon solid formation process, it only effected the rate of solid ejection
which is obviously proportional to the upstream pressure. The sublimation/melting process was
very slow. The solid block could stay at the bottom of the chamber for a long time, usually until
the experiment was ended. If the block did not fall to the bottom and touch the superheated wall,
it would remain in solid form for a few minutes. Figures 4.4 and 4.5 show the temperature and
pressure transients in the blow-down tube (the evacuated chamber) for upstream pressure of 500
psig and 300 psig, respectively. Figures 4.6 and 4.7 show the transient temperature field for the
same two cases.
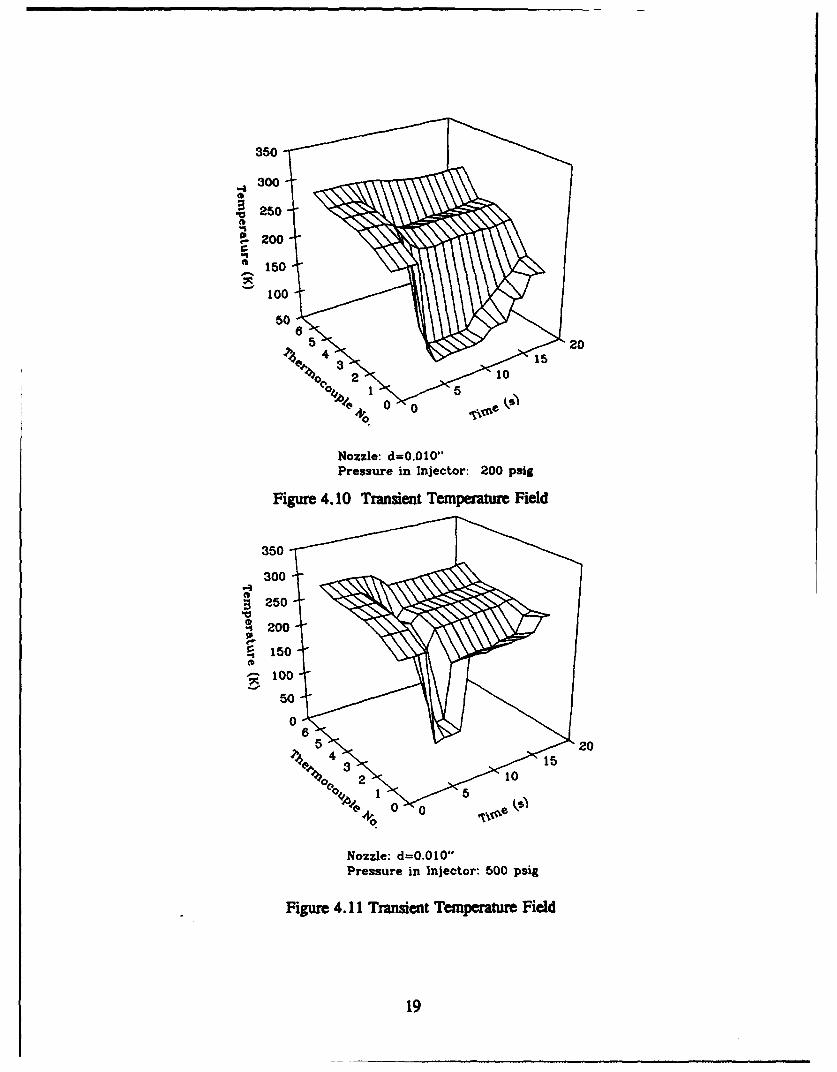
Experiments with the 0.010 in.-diameter nozzle were performed next. The solid formation
phenomenon was very different in this situation. The solid nitrogen would form around the first
thermocouple, there was a small distance between the nozzle exit and the thermocouple (about
1/8 in.). Spray could be seen very clearly, once the nitrogen droplets touched the thermocouple,
solid accreted around the thermocouple. While the spray process went on, the ice block became
bigger, but it could never reach the size of that formed around the small nozzle. Because the
diameter of this nozzle was larger, the spray was much stronger too. When the pressure inside
the injector was 300 psig, the ice block was blown away by the spray regularly. Since the block
was small, it melted into liquid droplets once it touched the bottom of the chamber. The droplets
floated on the wall due to Leidenfrost phenomenon. Figures 4.8 and 4.9 show the temperature
and pressure transients in the blow-down tube for upstream pressures of 100 psig and 500 psig,
respectively. The transient temperature fields for two cases are shown in Figures 4.10 and 4.11.
Finally, the 0.014 in.-diameter nozzle was tested in the system. In this case, the spray was
much stronger. The solid nitrogen hardly formed before it was blown away; the ice block could
grow to about 1 mm at the maximum. The thermodynamic parameters such as temperatures and
pressures in the chamber were still similar to those of the other two nozzles. Figures 4.12 and
4.13 show the transient temperatures, pressure and the temperature field in the blow-down tube
for an upstream pressure of 500 psig. The other results are included in the appendix along with
photographs of the solid formation on the nozzle exit.
In order to determine the final point of the blow-down process in the glass chamber,
temperature-internal energy diagrams were used. As the temperature and pressure in the injector
were obtained, the initial internal energy could be determined. Since the blow-down process was
15

a constant internal energy process, as long as the temperature of the free expansion final state
were measured, the final thermodynamic state could be located on the temperature vs. internal
energy diagram. With increasing upstream pressure, the internal energy of the liquid nitrogen
increases as well, therefore, the constant internal energy line shifts to the right as the pressure
goes up. The experiments results on the temperature-internal energy diagram are shown on
Figures 4.14, 4.15 an 4.16.
From Figures 4.6 to 4.13, it is clear that the cooling effect travelled along the glass
chamber from the nozzle to the other end. Since the distances between each thermocouple could
be measured accurately, the velocity of such cooling effect could be calculated. For the small
nozzle the velocity is around 5 cm/s, when the upstream pressure increased, the velocity
increased slightly. For the biggest nozzle, this velocity was up to 10 cm/s.
The mass flow rates of each different nozzle corresponding to various upstream pressures
were obtained. The result is shown on Figure 4.17. According to fluid mechanics, flow rate of
single phase fluid should be proportional to the square root of the pressure drop. The flow in
the nozzle was two-phase flow which would not exactly obey the laws for single phase fluid. But
the trend in flow rates was comparable.
From the experiments, it was obvious that the solid formation phenomena were very
different when different types of nozzles were used. That is because the conditions for liquid
nitrogen to form solid were quite different. The process of formation of solid nitrogen depends
upon several parameters such as ambient temperature, droplet diameters, icing time and nozzle
geometry. Among them, the most important factor that affects the phenomena of solid formation
in this experiment is the nozzle geometry. When the length of the nozzle is relatively larger than
its diameter, the nozzle is called Tube Nozzle. A nozzle is considered to be tube nozzle when
its length is larger than seven times its diameter [15], i.e.:
Le . 0, (Equation 4.4)Diameter
When tube nozzle was used in the system, the ice formed is called rime ie. Rime ice is a milky
white, porous structure ice. It forms inside the nozzle. The pressure upstream of the nozzle was
very high while the back pressure was only 2 to 3 mmhg. In this case, the liquid nitrogen
flowing into the nozzle forms a flow pattern like the one shown in Figure 4.18. There exists a
16

350
300
B 250
420002
¢15
2 1500
50"
4 "25
315
1 10
Nozzle: d=0.007"Pressure in Injector: 300 psig
Figure 4.6 Transient Temperature Field
350
300
.150
2110
500
Nozzle: d=5.OO70
Pressure in Injector: 500 psig
Figure 4.7 Transient Temperature Field
17

300 120
250 100
80
E / 60E
0a. 4
150 3 0u.100 CL
20
50 0
0 5 10 15 20 25 30 35 40 45
Time (s)
* -pressure* -temperature
nozzle d: 0.010"upstream pressure: 100 psig
1 -first thermocouple2-second thermocouple3-temperature in injector
Figure 4.8 Temperature and Pressure in the Blow-Down Tube
300 140
2 120
100
S200 -o
s m
e- 00..50
0.020
50-0
01 1 -200 5 10 15 20 25
Time (s)
"* -pressure"* -temperature
nozzle d: 0.010"upstream pressure: 500 psig1 -first thermocouple2-second thermocouple3-temperature in injector
Figure 4.9 Temperature and Pressure in the Blow-Down Tube
18
350
300
250
200"
50
5 •20
e 4 3 15
• 2• 104, 0 0
Nozzle: d=0.010"Pressure in Injector: 200 psig
Figure 4.10 Transient Temperature Field
350
300
200
50
00
Nozzle. d=0.0 10"Pressure in Injector: 500 psig
Figure 4.11 Transient Temperature Field
19

300 252
250 20
* 200 15 1E
2 150 10L6.-
100
0 5 10 15 20 25
Time (s)
" -pressure"* -temperature
nozzle d: 0.014"upstream pressure: 500 psig1 -first thermocouple2-second thermocouple
3-temperature in injector
Figure 4.12 Temperature and Pressure in the Blow-Down Tube
350
300S250-
200
-$150
S100"
50
00
5• 4 20
.'0% ot 2 10o 1
00/ 15
Nozzle: d=0.014"Pressure in Injector: 500 psi
Figure 4.13 Transient Temperature Field
20

140
upstream pressure:
1-200 paig ......... ........
120 2-300 psig
3-300 psig
4-400 paig
"5-500 puigiS100
5-
8E-
60-
2
40 i I i
-200 -150 -100 -50 0 50 100
Internal Energy (kJ/kg)
Figure 4.14 T-U Diagram for 0.007" Nozzle
140
upstream pressure:
1-200 psig .....------.--- .
120 2-300 psig3-400 psig4-500 psig
S100
E 80
60 z1 2
40 i I I 1 1
-200 -150 -100 -50 0 50 100
Internal Energy (kJ/kg)
Figure 4.15 T-U Diagram for 0.010" Nozzle
21

140
upstream pressure:1-200 pai& .................
120 2-300 psig3-400 psig4-500 paig
100
S80
60 1 2 34
40 - ' f 1
-200 -150 -100 -50 0 50 100
Internal Energy (kJ/kg)
Figure 4.16 T-U Diagram for 0.014- Nozzle
0.006 , I ,S-- nozzle d=0.007"
* - nozzle d=0.010"
0.005 - nozzle d=0.014"v
0.004
0.003
0.003
0
0.000
0 100 200 300 400 500 600
Pressure (psig)
Figure 4.17 Mass Flow Rate
22

throttle condition inside the nozzle. The velocity of the nitrogen flow increases as the flow cross-
section area becomes smaller. As a result, the pressure of the flow decreases, since the throttle
was inside the nozzle, the triple point pressure would occur somewhere before the throttle plane
which was inside the nozzle. Therefore, ice would form inside the nozzle and be pushed out of
the nozzle by the upstream pressure. For the smallest nozzle in this experiment set-up, the
diameter was 0.007 in. while its length was 0.055 in. The length of the nozzle is more than
seven times as large as its diameter. Thus, the nozzle could be considered a tube nozzle. That
is the reason for the observations during the experiment; it was clearly seen that solid nitrogen
formed inside the nozzle and was pushed out.
The nozzles with diameters of 0.010 and 0.014 in. could not be considered as tube nozzle.
They were ordinary straight nozzles, for these nozzles, there is no throttling inside the nozzle
(Figure 4.18). In these cases, when liquid was sprayed into the glass chamber, it went through
a process of sudden exposure to the vacuum. The liquid nitrogen droplets would form tiny solid
droplets immediately. But neither the liquid nor the solid droplets could be seen since they were
too small in size, so the phenomena appeared as a mist spray. The spray is, in fact, ice droplets
spray. Liquid droplets turned into ice so fast that it could not be seen. The ice droplets hit the
thermocouple and congregated around the thermocouple wire. During the experiments, it was
being watched that ice growing around the thermocouple while the spray still going on. This
process had been theocratically formulated and numerically solved.
The problem of freezing of liquid nitrogen upon a sudden exposure to vacuum has been
studied in Reference [16]. Although the icing time, at which the process takes place, may vary
slightly depending upon the pumping capacity and ultimate pressure attainable for the particular
vacuum system, the icing time was very small for the situation in this study. The space
environment can be regarded as a vacuum system with infinite pumping capacity and
approximately zero ultimate pressure. An experiment was set up to simulate this condition,
however, they found that the liquid nitrogen froze before it reached the nozzle exit.
The same study [16] showed that there existed a maximum stable drop diameter for liquid
nitrogen, 2.7 itm when nitrogen at 77.4 K was subjected to sudden expansion. A temperature
gradient within the droplet is established by cooling of the surface. The solid/liquid interface
moves toward the center of the drop until the sphere became completely solid. The mathematic
model dealing with the above situation is described in [16]. It shows that for liquid nitrogen
23

...... ::.........~ iii~:!ii:':: [ . . .. :::
Figure 4.18 Solid Formation Process for Different Nozzle Sizes
freezing at triple point, the time required is less than 10• second. According to this, we can
conclude that for the ordinary straight nozzle, tiny ice droplets were sprayed onto the
thermocouple and accreted there.
24

5. SPRAY COOLING
The main objective of this part of the study is to obtain the heat transfer characteristics of
liquid nitrogen spray cooling. This was done by obtaining heat transfer data for LN2 spray
cooling under different spray conditions. The following sections describe the experimental set-
up, procedure and results.
5.1 Experiment Set-UP
The detailed design of the various parts of the experimental arrangement has been presented
in report No. UK-ME-92-06 [14]. Hence, a brief description of the overall setup would be
sufficient here. The schematic diagram of the set-up is shown in Figure 5.1 . The experimental
chamber contains the heater, nozzle and view ports for laser-Doppler velocimetry. The high
pressure LN2 dewar is used to supply liquid nitrogen to the nozzle. A heat exchanger between
Flow meter Vent
-ee flow
Subcooler Nozl
Compressed gas Window
Liquid N2-- - Heat
TransferSurface
Helter Instrumntationleads lines
Figure 5.1 Experimental Set-up
25

the dewar and the nozzle is used to subcool the high pressure liquid down to about 78 K. Since
To Bleed I Orifice-meterControl Valve& Mass Flow Meter
Nozzle
Figure 5.2 Bleed Port Details
the chamber is always maintained at atmospheric pressure, the liquid spraying out of the nozzle
is always close to saturation if the upstream temperature is maintained at about 78 K (assuming
isentropic expansion). All the lines are insulated with polyurethane foam to minimize heat gain.
During preliminary experiments, it was found that, at low flow rates, it was very difficult to
maintain a single phase fluid supply into the nozzle inlet, this resulted in violent pressure
fluctuations and eventual disruption of flow. This happened because the heat gain into the line
was sufficient to vaporize a part of the liquid flow at low flow rate. In order to overcome this
problem, a bleed port was provided as shown in Figure 5.2. Thus, the total flow through the line
could be maintained high enough to prevent vaporization. The bleed flow is measured by
vaporizing the bleed flow and measuring the flow rate of gaseous nitrogen by a mass flow meter.
The heater, shown in Figure 5.3, is made out of oxygen free copper. The cartridge heater
inserted inside the copper block provides the heat. The power to the cartridge heater is supplied
by a variac. The heat transfer surface is a 1-cm2 circle on the top of the block. The two
26
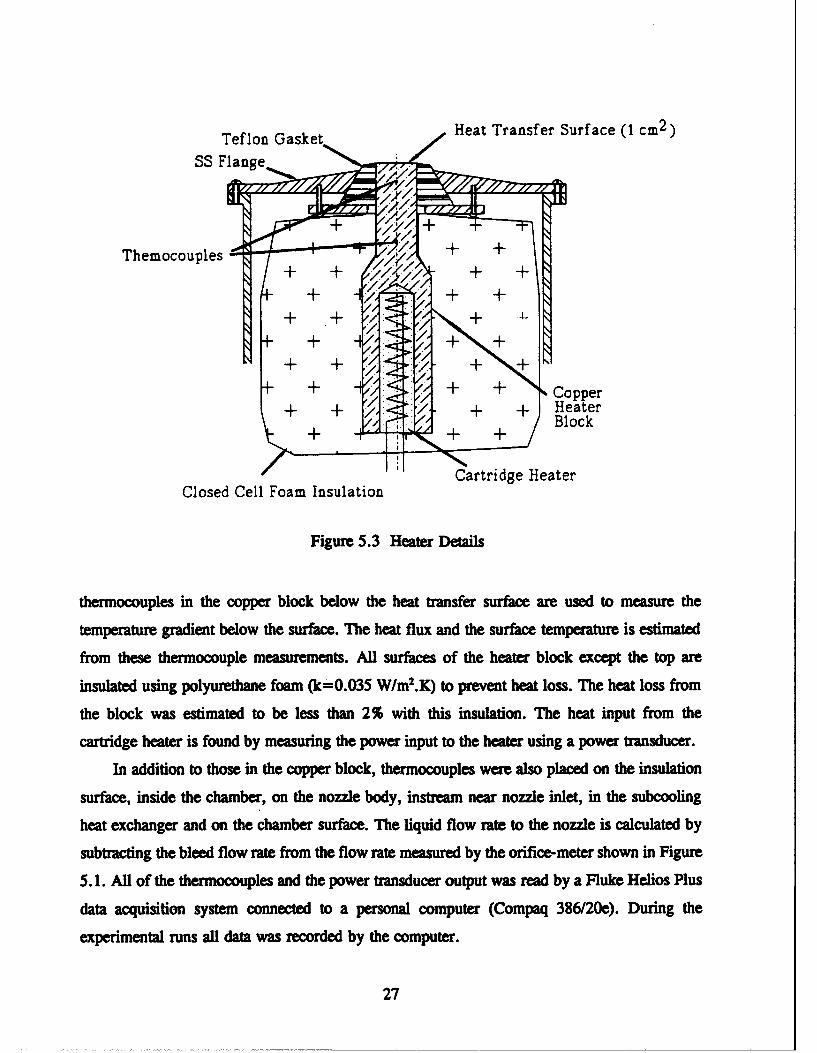
Teflon Gasket Heat Transfer Surface (1 cm 2 )
SS Flange y++Themocouples + +
+ ++
+ ++
+ ++
+ + + + CopperI + ++Heater
Block
Cartridge HeaterClosed Cell Foam Insulation
Figure 5.3 Heater Details
thermocouples in the copper block below the heat transfer surface are used to measure the
temperature gradient below the surface. The heat flux and the surface temperature is estimated
from these thermocouple measurements. All surfaces of the heater block except the top are
insulated using polyurethane foam (k=0.035 W/m2.K) to prevent heat loss. The heat loss from
the block was estimated to be less than 2% with this insulation. The heat input from the
cartridge heater is found by measuring the power input to the heater using a power transducer.
In addition to those in the copper block, thermocouples were also placed on the insulation
surface, inside the chamber, on the nozzle body, instream near nozzle inlet, in the subcooling
heat exchanger and on the chamber surface. The liquid flow rate to the nozzle is calculated by
subtracting the bleed flow rate from the flow rate measured by the orifice-meter shown in Figure
5. 1. All of the thermocouples and the power transducer output was read by a Fluke Helios Plus
data acquisition system connected to a personal computer (Compaq 386/20e). During the
experimental runs all data was recorded by the computer.
27
5.2 Experimental Procedure
An experimental run involves spraying the LN2 at a certain pressure and 78 K through the
nozzle onto the heater surface. The roughness of the heater surface was measured before the
heater was installed in the chamber, this roughness is not changed throughout the spectrum of
experiments presented in this report. The surface was cleaned with a very dilute solution of
hydrochloric acid and then rinsed with deionized distilled water and propanol prior to each set
of experiments. Before beginning the experiment, the chamber is flushed with nitrogen to expel
any air or water vapor. The subcooling heat exchanger shell is then filled with LN2 and the fluid
is allowed to flow from the dewar to the nozzle. The bleed port is kept fully open till the line
cools down to LN2 temperature. This is evidenced by the temperature of the nozzle reaching 78
K. The pressure of the dewar is now set at the desired value by venting the dewar or
pressurizing it from a N2 gas cylinder. The bleed valve is then adjusted till the bleed flow is as
low as possible while still sufficient to maintain the nozzle temperature at 78 K. The nozzle
height and alignment is then adjusted to ensure that the spray covers the whole heat transfer
surface and all the spray impinges the surface.
The power to the heater cartridge is then increased in steps of 5 W till dryout of the surface
occurs. After each step increase in power, sufficient time is allowed for all the temperatures to
reach steady state. The power to the heater is cut off immediately following the dry-out. Dry-out
is evidenced by the rapid increase in temperature readings of the two thermocouples inside the
copper block. Upon dry-out the temperature of the surface usually reaches approximately 200
K because of the thermal inertia of the heater block. The data recording is continued till the
surface temperature falls back to about 80 K under the same spray conditions. Although these
cooldown readings are not at steady state, the correct heat flux and surface temperature can be
estimated by correcting for the temperature transients. The cooldown readings provide the heat
transfer characteristics for LN2 spray cooling in the Leidenfrost point region.
In general, a set of runs were taken consecutively till the LN2 in the dewar ran out or the
nozzle had to be changed. The set of results presented here involved four nozzles, TGO.3,
TGO.5, TGO.7 and FLNo. 13. The TG series nozzles are full cone pressure atomizing nozzles
commercially available from Spraying Systems Co., Wheaton, IL. These nozzles have a flow
swirler before the orifice which creates turbulent flow for effective atomization. The FLNo. 13
is a flat disc shaped nozzle with radial grooves leading to the orifice (for creating turbulence).
28
*
0-
_ 0 Secondary Nuclei
Intense convection 00 entrapped by dropletscaused by 1
impinging *ro lets 10 Evaporation from film
Maximum Nucleation atbubble size surface
0Bubbles swept"0 0 0away prematurely
Heat transfer surface
Figure 5.4 Spray Cooling
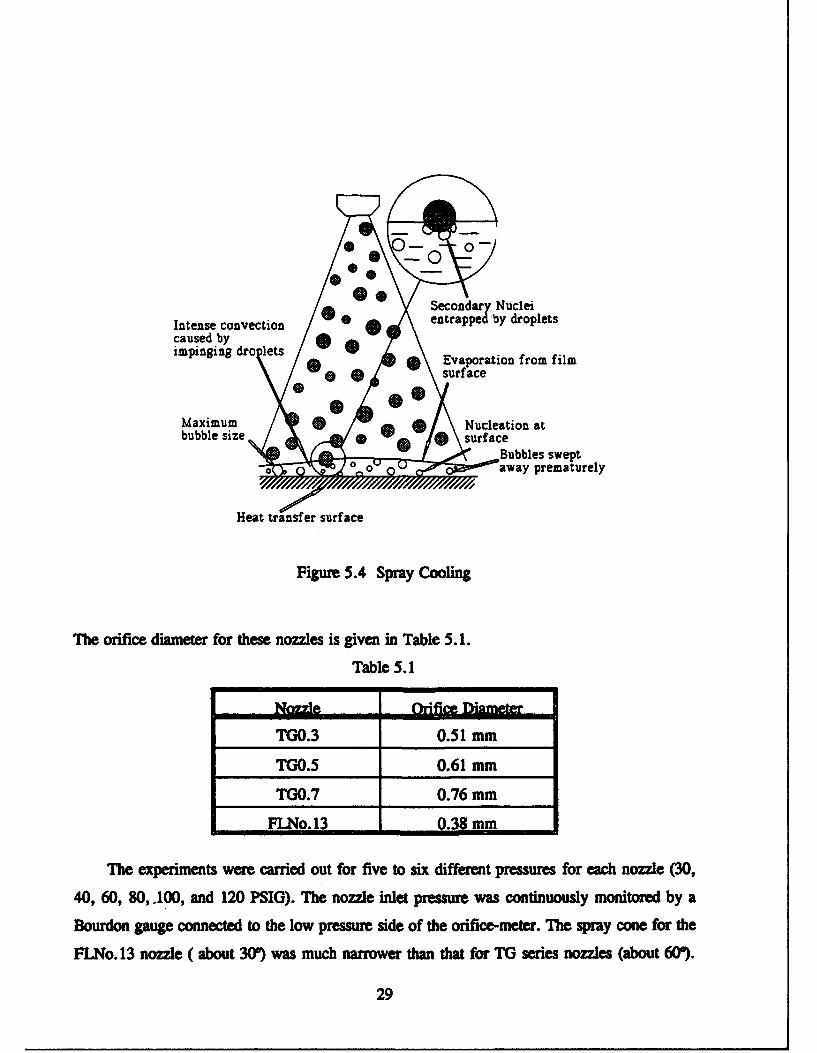
The orifice diameter for these nozzles is given in Table 5.1.
Table 5.1
Nozzle Orifice Diameter
TGO.3 0.51 mm
TGO.5 0.61 mm
TGO.7 0.76 mm
FLUNo. 13 0.38 mm
The experiments were carried out for five to six different pressures for each nozzle (30,
40, 60, 80, .100, and 120 PSIG). The nozzle inlet pressure was continuously monitored by a
Bourdon gauge connected to the low pressure side of the orifice-meter. The spray cone for the
FLNo. 13 nozzle ( about 300) was much narrower than that for TG series nozzles (about 60').
29

The nozzle height above the surface was varied to keep the surface covered with spray, all the
experiments with TG series nozzles had approximately the same nozzle height, 1 cm; the height
for FLNo. 13 nozzle was 2 cm.
5.3 Results and Discussion
A brief discussion of spray cooling theory will provide a better insight into the results
presented here. Figure 5.4 shows the probable mechanisms involved in spray cooling heat
transfer. Convection heat transfer, evaporation from the film surface, nucleate boiling at the
heater surface and secondary nucleation are all thought to be involved in spray cooling. The
intense convection caused by impinging droplets enhances the heat transfer between the heater
surface and the free surface of liquid film, the heat transferred to the film surface goes towards
evaporation of the fluid. Nucleate boiling at the heater surface also helps in increasing the heat
transfer coefficient greatly. And finally, secondary nucleation, which results from the entrapment
of vapor bubbles by impinging droplets, may also play a very important role in spray cooling
[17]. The relative importance of each of these heat transfer mechanisms is unknown to date, but
inspite of the lack of that information, the hypothesis provides a useful tool for evaluating the
experimental results. Also, the experimental data will help in resolving the various issues
involved in the hypothesis.
The results for each nozzle are presented first, and then comparisons are made based on
the mass flow rate and nozzle type. All the TG series nozzles show some degree of
nonuniformity in spray; the spray cone is usually less dense along the axis comparei to the edge.
The implications of this nonuniformity will be discussed.
5.3.1 Individual Nozzle Results
The TGO.3 had the smallest orifice of all the TG series nozzles used in this study. The
spray for this nozzle was very dense and slightly hollow along the axis. Figure 5.5 shows the
superheat (rT-T.,) vs. heat flux data for three different flow rates (or nozzle pressures). In the
figure, the heat transfer curve is made up of three distinct regions. The first is the low superheat
region, here, the heat transfer is probably dominated by forced convection with evaporation from
the film surface, and secondary nucleation.
Nucleate boiling at the surface is absent in the first region because surface nucleation
30

200190
180170
160 - a
150140 - WIN
S130-&120 -
: 110 -100 -
90 0S90-
880-70-
60
50 - Nozzle: TGO.3
40 -30 -a 12.2 kg/hr (120 PSIG)20 v 10.2 kg/hr (80 PSIG)
10 -• * 7.4 kg/hr (40 PSIG)
0 1 1 1 1 1
0 2 4 6 8 10 12 14 16 18 20 22 24
Tw-Tsat K
Figure 5.5 TGO.3 Heat Transfer Characteristics
usually begins at a higher superheat in forced convection situations and is noticeable by a distinct
change in slope [18]. As the superheat is increased, the slopes of the curves show a small jump
at about 9 K superheat, this is probably due to the beginning of nucleate boiling on the heater
surface.
Once the nucleate boiling on the heater surface has begun, the curves in Figure 5.5 show
a definite shift upwards, this second region can be said to have a significant contribution oy
surface nucleation. Upon reaching a superheat of about 15 K, the curves in Figure 5.5 become
almost horizontal, this is due to the partial dry-out of the surface. As mentioned earlier, the
spray is slightly hollow along the axis, hence, the dryout starts on the center of the surface (due
to lower mass flux at the center) and progresses outward. This shows up as a gradual increase
in average surface temperature with almost no increase in heat flux. When the surface is fully
dry, the heat input is cut off, the surface temperature goes to a higher value because of the
thermal inertia of the copper block. The block then begins to cool down under Leidenfrost
31

conditions, the heat flux under these conditions is around 20-30 W for the cases shown in Figure
5.5. The heat flux reaches a minimum value at around 45 K superheat and then starts rising
rapidly as the droplets begin to wet the surface.
200 I I I I I ,190180
170160150
140 - 0 V
130 -o 120
m 110
100. 90
, 80706050 - 18.5 kg/hr (60 PSIG)
40 -a 15.4 kg/hr (40 PSlG)
30 * 13.4 kg/hr (30 PSIG)
2010
01- 00 2 4 6 8 10 12 14 16 18 20 22 24
Tw - Tsat KFigure 5.6 TGO.5 Heat Transfer Characteristics
The influence of mass flow rate on heat transfer characteristics is quite clear from Figure
5.5, the critical heat flux (CHF) and heat transfer coefficient show an increase with increase in
mass flow rate. This effect is more pronounced for CHF, where a more significant increase is
seen with increase in flow rate.
Figure 5.6 shows the heat transfer characteristics for spray cooling with the TGO.5 nozzle.
The trends are similar to those described for the TGO.3 nozzle. The increase of mass flow rate
leads to an increase in heat transfer coefficient and CHF. The spray from this nozzle was a little
less hollower than TGO.3, this results in a shorter third region.
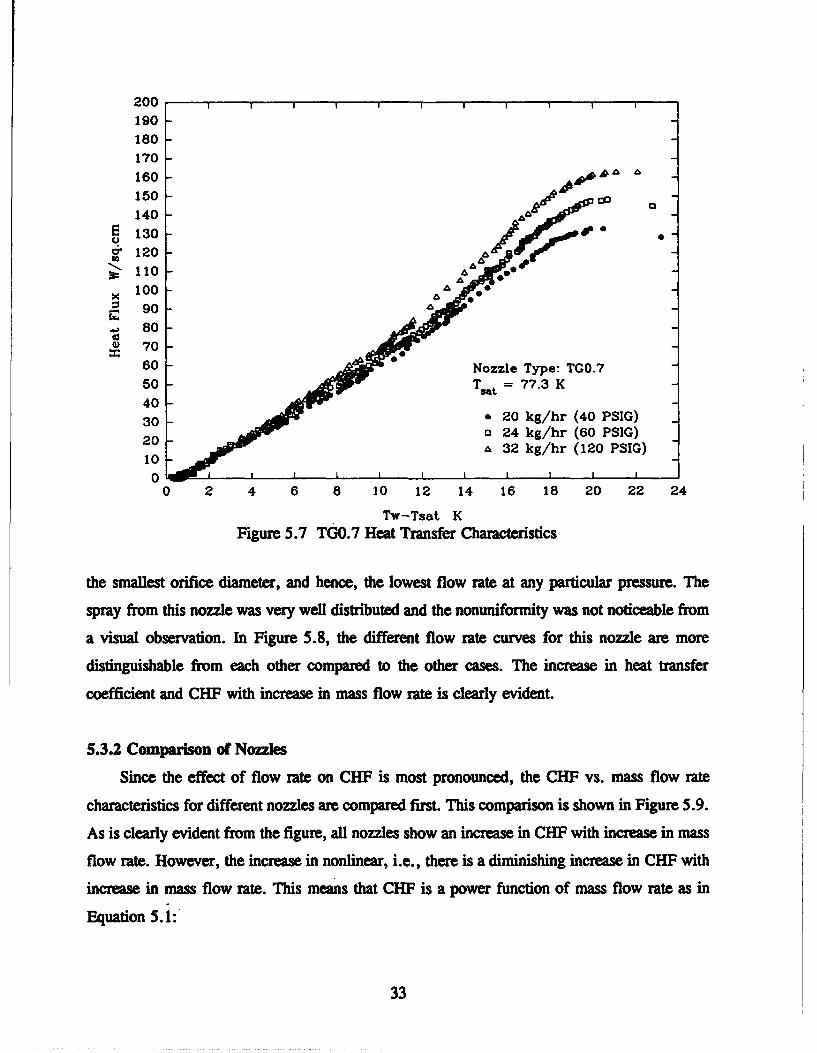
The spray from the TGO.7 nozzle was very dense and slightly hollow in the middle. Figure
5.7 shows the heat transfer characteristics for this nozzle. The trends in the curves and mass
flow rate effect are similar to the previous cases.
Figure 5.8 shows the heat transfer characteristics for the FLNo. 13 nozzle. This nozzle had
32
200
190180
170
160 A# "A -
150 -01405. ---9 A&
120
S120 AO
100 "
800
S90 -
..- 80
S7060 - Nozzle Type: TGO.7
50 Tat = 77.3 K4030 - 20 kg/hr (40 PSIG)
20 a 24 kg/hr (60 PSIG)
10 & 32 kg/hr (120 PSIG)
0 10 2 4 6 8 10 12 14 16 18 20 22 24
Tw-Tsat K
Figure 5.7 TGO.7 Heat Transfer Characteristics
the smallest orifice diameter, and hence, the lowest flow rate at any particular pressure. The
spray from this nozzle was very well distributed and the nonuniformity was not noticeable from
a visual observation. In Figure 5.8, the different flow rate curves for this nozzle are more
distinguishable from each other compared to the other cases. The increase in heat transfer
coefficient and CHF with increase in mass flow rate is clearly evident.
5.3.2 Comparison of Nozzles
Since the effect of flow rate on CHF is most pronounced, the CHF vs. mass flow rate
characteristics for different nozzles are compared first. This comparison is shown in Figure 5.9.
As is clearly evident from the figure, all nozzles show an increase in CHF with increase in mass
flow rate. However, the increase in nonlinear, i.e., there is a diminishing increase in CHF with
increase in mass flow rate. This means that CHF is a power function of mass flow rate as in
Equation 5.1:
33

200190180170160150
140
U2 130 , ¶1'•
. 120 ,==110 t =p 0
100x 00= 90 A
.• 80 D A4 70 - ,-"
60 • 0 I60 )TI•" .=P 6.1 kg/hr (40 PSIG)
50 o a 7.3 kg/hr (60 PSIG)40 A v 8.4 kg/hr (80 PSIG)30- * 10.0 kg/hr (120 PSIG)
20
10
0 2 4 6 8 10 12 14 16 18 20 22 24
Tw-Tsat K
Figure 5.8 FLNo.13 Heat Transfer Characteristics
CHF = a " (Equation 5.1)
The values of a and n based on the data shown in Figure 5.9 are tabulated in Table 5.2. The
Table 5.2
Nozzle Type a n
TGO.7 1617.7 0.48
TGO.5 1155.4 0.39
TGO.3 14943.1 0.80
FLNo.13 56160.0 1.00
table shows that a and n are not the same for all nozzles, hence, it can be safely concluded that
a and n are functions of spray characteristics and possibly of surface roughness as well.
From looking at Figure 5.9, it is apparent that the efficiency of spray cooling increases as the
nozzle size is decreased. Here, efficiency e is defined as:
34

300
200
90 Nozzle Type
80 * TGO.770 e TGO.5
80 . TGO.3A FLNo.13
50 14 5 6 7 8 9 10 20 30 40
Maw Flow Rate, kgfhrFigure 5.9 Effect of Nozzle and Mass Flow Rate on CHF
CHFe = F (Equation 5.2)
Figure 5.10 shows the efficiency vs. flow rate characteristics of all the nozzles used in this
study. The higher efficiency of smaller nozzles is probably due to all or some of the following
reasons:
a) The flow rate obviously decreases with nozzle size, this leads to thinner liquid film with
decrease in nozzle size. The thinner liquid film results in lesser thermal resistance to heat
transfer from the heater surface to the free surface of liquid film, this in turn leads to more
evaporation from the film surface.
b) The velocity of the droplets usually increases with decrease in nozzle size [19], this leads
to higher convection heat transfer.
c) The number of droplets per unit area per unit time increases with decrease in nozzle size
[19,20]. This would probably result in an increase in secondary nucleation and convection in the
liquid film.
35

0.50
0.45 Nam. Ty[e& TG0.'a TO.M
0.40 * 0"
0.35
0.30
U0€.) • .
0.25
0.20
0.15 U
&
0.10 • • A
0.05
0.00 I I I I I I I I I I I
4 6 8 10 12 14 16 18 20 22 24 26 28 30 32 34
Mass Plow Rate kg/hr
Figure 5.10 Effect of Nozzle on Efficiency
The effects mentioned above cannot be quantified till the spray charweristics have been
measured.
The comparison of heat transfer characteristics for any two nozzles is more valid if the
mass flow rates are the same, this eliminates the film thickness effect from consideration. Figure
5.11 shows a comparison of TGO.5 and TGO.3 nozzle at a flow rate of about 12 kg/hr. The heat
transfer coefficient and CHIF is higher for the TGO.3 nozzle, this clearly shows the effect of
spray parameters on heat transfer characteristics and points to the need of
measuring them. The effect of surface parameters also needs to be investigated before a
comprehensive correlation can be formulated.
The effect of flow rate and nozzle type on the heat transfer in Leidenfrost region was also
investigated. Figure 5.12 shows the results. The minimum heat flux in the Leidenfrost region
occurs just before the droplets begin to wet the surface. The figure shows that the minimum heat
flux increases with the mass flow rate for any nozzle. The momentum of the droplets is the most
important parameter in the Leidenfrost region. The higher momentum droplets can get closer
to the surface and, thus, enable higher heat transfer at the surface. The average droplet size
increases as the nozzle size increases (at same nozzle pressure) [19]. Hence, the larger nozzles
36

200190180 a TGO.3 Nozzle
170 * TGO.5 Nozzle
180 Flow Rate: 12-13 kg/h
150/140 7
g 120B 110
100o 90
8~ 0 /5040
302010100 2 4 6 8 10 12 14 16 18 20 22 24
Tw-Tsat K
Figure 5.11 Comparison of Heat Transfer Characteristics
40
A TOO.?
30 aTOM
*WNo.13
20
10
987
44 5 6 7 8 9 10 20 30
Man Flow kg/hr
Figure 5.12 Effect of Flow Rate and Nozzle on Minimum Heat Flux
produce sprays which have droplets with higher momentum. Therefore, the larger nozzles
37

perfom a little better in the Leidenfrost region.
38

6. POOL BOILING HEAT TRANSFER FROM DISCRETE SOURCES IN
CONFINED SPACE
Of all the different methods of heat removal, pool boiling, which occurs when a stationary
liquid cools a heat sink, is the least complicated. Though incapable of removing the high
quantities of heat that spray cooling and flow boiling can, pool boiling is simple, effective, and
relatively inexpensive. This makes it an attractive option in cooling situations where heat
removal requirements are not very large.
One field in which pool boiling has practical applications is electronic cooling. The
numerous benefits of operating electronics at low temperatures have been pointed out by various
researchers: circuits operate faster, semiconductors switch more rapidly, heat removal capacities
increase, the number of thermally-induced device failures decrease, and the noise-to-signal ratios
drop [21-24]. These advantages are usually associated with temperatures between 10 and 100
K, when the thermal and electrical conductivities of common circuit materials, such as copper
and silicon, are maximized [251. One inexpensive coolant whose vaporization point, 77.3 K,
falls into this temperature range is liquid nitrogen (LN2).
A reliable method which could maintain liquid nitrogen temperature (IXM) in circuits
would be of vast importance to the electronics industry. Operating electronics at LNT is very
advantageous. As decreasing the size of integrated circuits becomes more difficult and more
expensive, it has been predicted by some observers that low temperature electronics will become
a very attractive option [26]. In fact, they believe that operation at LNT can improve circuit
performance more than decreasing their size by a factor of 2.
Though extensive studies have been conducted on pool boiling, they have mostly been
done on conventional, open-area boiling. However, the situation in most electronic equipment,
as well as in most heat transfer equipment, is a series of confined areas where bubbles from
several discrete heat sinks may interfere with each other or may be deformed. Very little is
known about how confinement affects pool boiling, and even less is known about its effect on
cryogens, such as liquid nitrogen. Previous experiments that have been conducted on confined
39

pool boiling have used conventional liquids, such as water [27,28], acetone [27], fluorocarbons
[29,30], or Freon [27]. Very little research has been done using LN2, Reference [31] reports
a study of two chips facing each other, with a very small gap, suspended in a pool of LN2. The
purpose of this experiment is to study the change in critical heat flux (CHF) of LN2 as the gap
between a heater and an opposing glass plate decreases. In addition, the effect of neighboring
heat sources on CHP will also be studied.
Port for Instrumentation Lines and LN2 Supply
Vacuum Pump-out Port
D 2-,-Vacuum Insulation
• D 75"
98" 1 4"1
Inner Glass Chamber I
Outer Glass Chamber
D 11"
Figure 6.1 Experiment Chamber
6.1 Experimental Design
Experiments are conducted in a seamless glass cylinder with an inner diameter of 7.50
inches, an outer diameter of 8.00 inches, and a height of 10 inches (Figure 6.1). It will contain
a pool of LN2 during the experiment. To prevent heat transfer from the environment, this
cylinder is placed inside another glass tube with inner diameter 9.45 inches. The space between
the two cylinders is insulated by a pump-maintained vacuum. This allows the experiments to
be observed and videotaped.
40

/W/2
9 Heaters, W x H W=0.875"H=0.688"
Figure 6.2 Heater Arrangement
Nine electrically-powered heaters (0.875 inches by 0.688 inches) on copper blocks are
Sealed Stainless Steel Case
Heater Leads
Heat Transfer Surface
ThermocoupleLeads .
Closed Cell FoamInsulation
Figure 6.3 Heater Case
41
mounted flush with a stainless steel sheet 4.50 inches long, 3.75 inches wide, and 0.10 inches
thick (Figur 6.2). Temperatures in the heaters are monitored by type E thermocouples. The
plate is screwed to a stainless steel case which shields the electric wiring and thermocouple wires
from the LN2. A stainless-steel spacer separates the heaters from a glass plate, which confines
the boiling to the gap between it and the heaters. The entire assembly is fixed to a base to keep
it from moving during experiments and placed within the inner glass cylinder. Figure 6.3 shows
the schematic diagram of the heater box. All data, such as heater temperature and power
dissipation, is collected by IBM PC 386 through a programmed Hewlett Packard 3852A Data
Acquisition/Control Unit equipped with a 5-1/2 digit voltmeter and a 20 channel relay
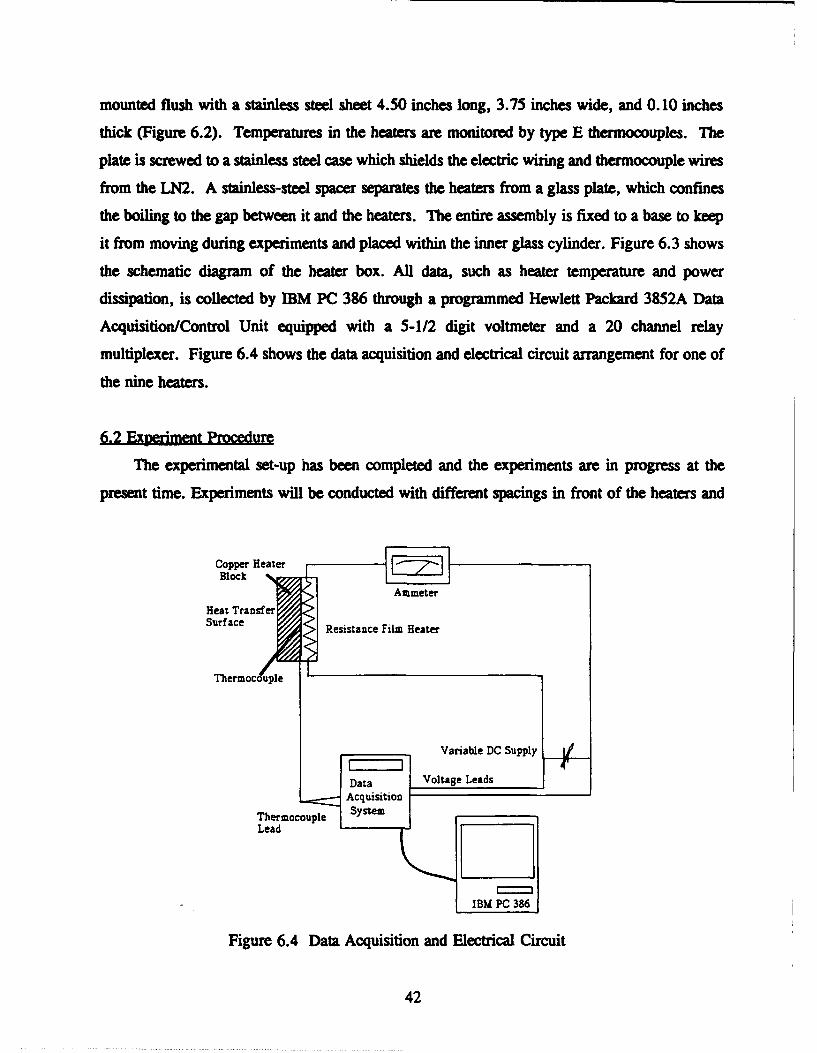
multiplexer. Figure 6.4 shows the data acquisition and electrical circuit arrangement for one of
the nine heaters.
6.2 imerment Procedure
The experimental set-up has been completed and the experiments are in progress at the
present time. Experiments will be conducted with different spacings in front of the heaters and
Copper Heater I tBlockII • • IAmmeter
Heat TransferSurface j Resistance Film Heater
Thermocouple
uple•Variable DC Supply
Data Voltage LeadsAcquisition
Thermocouple systemLead
IBM PC 386
Figure 6.4 Data Acquisition and Electrical Circuit
42

various different heat flux distributions. During an experiment, heat flux to one of the nine
heaters will be varied and its heat transfer characteristics examined while the other eight heaters
are maintained at some fixed heat flux level. This way heat transfer characteristics at each
position on the heater plate will be determined at different environmental conditions (i.e.,
varying bubble generation from the surrounding heaters).
43

7. CONCLUSIONS AND FUTURE PLANS
The free expansion (blow-down) of liquid and supercritical nitrogen was studied at different
upstream pressures, downstream pressures and three different nozzle sizes. It was found that the
nozzle size and geometry had a great influence on the process. For downstream pressures below
triple point, nitrogen exiting the nozzle generally solidified irrespective of the upstream pressure.
Solid nitrogen formed before nozzle exit for the smallest nozzle because of flow throttling, this
resulted in slow oozing out of solid nitrogen from this nozzle. The other two nozzles sprayed
out droplets of nitrogen which solidified in the vacuum chamber and then accreted on the
thermocouples which were in the spray trail. The mass flow rates and the cooling speed for the
three nozzles were also measured.
Spray cooling with liquid nitrogen was carried out for four different nozzle sizes and two
nozzle types. It was found that the heat transfer coefficient and CHF are strong functions of
spray characteristics and possibly surface characteristics. CHFs up to 170 W/sq.cm were
observed, C-F generally occurred at around 95 K. The efficiency of spray cooling ranged from
8% for the TGO.7 nozzle to 30% for the FLNo.13 nozzle. The spray characteristics are
currently being measured and the effect of surface roughness will be studied soon.
The experimental set-up for the pool boiling in confined space study has been completed
and the experiments are currently in progress. Experiments will be carried out for various heat
flux distributions and spacings.
44
8. REFERENCES
1 Nisenhoff, M., "Superconducting electronics: current status and future prospects,"
Cryogenics, Vol. 28, No. 1, pp. 47-56, 1988.
2 Van Duzer, T., "Superconductor-semiconductor hybrid devices, circuits and systems,"
Cryogenics, Vol. 28, No. 8, pp.527-531, 1988.
3 Van Duzer, T., 'Josephson digital devices and circuits," IEEE Trans. on Microwave
Theory and Techniques, Vol. MTT-28, pp. 490-500, 1980.
4 Tucker, J.R., "Quantum limited detection in tunnel junction mixers," IEEE J. of Quannmm
E/ectronics, QE-15, pp. 1234-1258, 1979.
5 McGrath, W.R., Raisanen, A.V., Richards, P.L., Harris, R.E. and Lloyd, F.L, "Accurate
noise measurements of superconducting quasiparticle array mixers," IEEE Trans. on
Magnetics, Vol MAG-21, pp. 212-221, 1985.
6 Clarke, J., "Superconducting quantum interference devkics for low frequency
measurements, superconducting applications," SQUIDs and Machines, Editors: Schwartz,
B.R. and Foner, S., Plenum Press, NY, Ch. 3, pp. 67-124, 1977.
7 Silver, A.H. and Zimmerman, J.E., "Quantum states and transition in weakly connected
superconducting rings," Physics Review, Vol. 157, pp. 317-341, 1967.
8 Flik, M.I and Hijikata, K., "Approximate thermal packaging limit for hybrid
superconductor-semiconductor electronic circuits," Proc. Nimth Int. Heat Transfer Conf.,
Jerusalem, Israel, Vol. 2, pp. 319-324, 1990.
9 Lavine, A.S. and Bai, C., "An analysis of heat transfer in Josephson junction devices," J.
of Heat Transfer, Vol. 113, pp. 535-543, 1991.
45

10 Van Duzer, T., 'Superconductor electronic device application," IEEE J. of Quantum
Electronics, Vol. QE-25, No. 11, pp. 2365-2377, 1989.
11 Fox R.M. and Jaeger R.C., 'MOSFET behavior and circuit considerations for analog
applications at 77 K," IEEE Trans. on Ekearon Devices, Special Issue on Low Temperature
Semiconductor Electronics, Vol. ED-34, No. 1,pp. 114-123, 1987.
12 Mueller, 0., "Cryogenic power conversion: combining HT superconductors and
semiconductors,* AIP Conf. proceedings 251, pp. 746-759, 1991.
13 Touloukian, Y.S., Powell, R.W, Ho, C.Y. and Clemens P.G., Thermophysical Properties
of Mauer The TPRC Data Series, Vol. 1 & 2, IFI/Plenum, NY, 1970.
14 Chow, L.C., Sehmbey, M.S., Pais, M.R., Lu, W.F. and Hahn, O.J., 'Fundamental
Studies in Hydrogen Blowdown and Cryogenic Cooling,- UK-ME-92-06, Interim Report
for September 1991- August 1992, 1992.
15 Pais, M.R., 'Determination of the Local Heat Transfer Characteristics on Glaze-ice
accretions on a Cylinder and a NACA 0012 Airfoil," Ph.D. Dissertation, University of
Kentucky, 1987.
16 Gayle, J.B., Egger, C.T., Bransford, J.W., "Freezing of Liquids on Sudden Exposure to
Vacuum," J. of Spacecraft, Vol.1, No. 3, 1964.
17 Mesler, R. and Bellows, W.S., "Explosive Boiling: A Chain Reaction Involving Secondary
Nucleation," ASME Proc.of 1988 National Heat Transfer Conference, HTD-96, Vol.2,
pp. 246-252, 1976.
18 Rosenhow, W.M., Hartnett, J.P. and Ganid, E.N., Editors, Handbook of Heat Transfer
Fuwd entals, 2nd. Ed., McGraw Hill, Inc., NY, 1985.
46

19 Lefebvre, A.H., Atomiwton and Sprays, Hemisphere Pub. Corp., NY, 1989.
20 Tilton, D.E., "Spray Cooling," Ph.D. Dissertation, University of Kentucky, 1989.
21 Gaensslen, F.H., "MOS devices and Integrated Circuits at Liquid Nitrogen Temperature,"
1980 IEEE ICCD Proceedings, pp. 450-452, 1980.
22 Kirschman, R.K., "Cold Electronics: An Overview," Cryogenics, Vol. 25, pp. 115-122,
1985.
23 Kirschman, R.K., Low Temperature Electronics, IEEE Press, NY, 1986.
24 Jaeger, R.C., "Development of Low Temperature CMOS for High Performance Computer
Systems," IEEE Int. Conf. of Computer Design: VLSI in Computers, pp. 128-130, 1986.
25 Krane, R.J., Bar-Cohen, A., Jaeger, R.C. and Gaensslen, F.H., "MOS Electronics and
Thermal Control for Cryogenically-Cooled Computer Systems," Advances in Thermal
Modeling of Electronic Components and Systems, Vol. 2., Editors: Avram Bar-Cohen and
Allan D. Kraus, ASME Press, NY, 1990.
26 Jaeger, R.C. and Gaensslen, F.H., "Low Temperature Semiconductor Electronics,"
Proceedings of Thermal Phenomena in Electronic Components, I-THERM 1988 Conf., LA,
pp. 106-114, 1988.
27 Yao, S. and Chang, Y., "Pool Boiling Heat Transfer in a Confined Space," Int. J. of Heat
Mass Transfer, Vol. 26, No. 6, pp. 841-848, 1983.
28 Fujita, Y., H. Ohta, S. Uchida, and K. Nishikawa. "Nucleate Boiling Heat Transfer and
Critical Heat Flux in Narrow Space Between Rectangular Surfaces," Int. J. of Heat Mass
Trhnsftr, Vol. 31, No. 2, pp. 229-239, 1988.
47
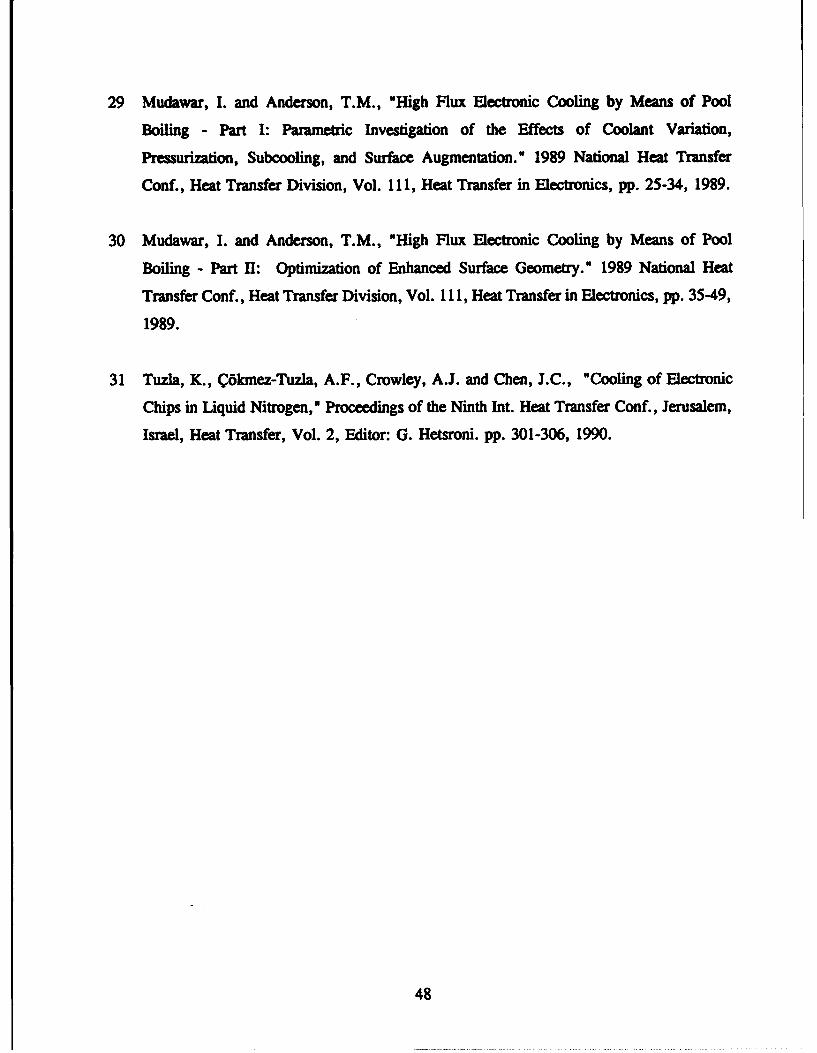
29 Mudawar, I. and Anderson, T.M., -High Flux Electronic Cooling by Means of Pool
Boiling - Part I: Parametric Investigation of the Effects of Coolant Variation,
Pressurization, Subcooling, and Surface Augmentation." 1989 National Heat Transfer
Conf., Heat Transfer Division, Vol. 111, Heat Transfer in Electronics, pp. 25-34, 1989.
30 Mudawar, I. and Anderson, T.M., "High Flux Electronic Cooling by Means of Pool
Boiling - Part 1I: Optimization of Enhanced Surface Geometry." 1989 National Heat
Transfer Conf., Heat Transfer Division, Vol. 111, Heat Transfer in Electronics, pp. 3549,
1989.
31 Tuzla, K., C6kmez-Tuzla, A.F., Crowley, A.J. and Chen, J.C., "Cooling of Electronic
Chips in Liquid Nitrogen," Proceedings of the Ninth Int. Heat Transfer Conf., Jerusalem,
Israel, Heat Transfer, Vol. 2, Editor: G. Hetsroni. pp. 301-306, 1990.
48

APPENDIX
Error analysis for spray cooling and free expansion studies are presented below. Additional
data from the free expansion study is also included.
A. 1 Error Analysis: Spray Cooling
The thermocouples used in the experiment were made from special grade E-type
thermocouple wire manufactured by Omega, CT. The thermocouples were tested by immersing
the bead in LN2 at atmospheric pressure (temperature 77.3 K), the temperatures ranged from
77.0 K to 78.0 K, hence, the error in absolute temperature measurement can be considered to
be ±0.7 K. The two thermocouples installed in the copper block were always within 0.3 K of
each other during calibration, hence, the error in temperature difference used to estimate the heat
flux is ±0.3 K. Since the thermal conductivity of copper is not constant in the range of
tempertur during the experiments, a piecewise polynomial interpolation was used to determine
thermal conductivity, the error in thermal conductivity is 2 % according to [13]. The heat flux
and surface temperature were calculated by a computer program which corrects for the variation
in thermal conductivity with temperature. The uncertainties in estimated heat flux and surface
temperature are given by:
bq"= [(_y (BAT (..6.] (Equation A.1)
[ AT 1]
6T,• [ 8//67S q [( ")2 + (.L)2+('4)2 +(•2)2' (Equation A.2)T..f q" ItT
Substituting the values of uncertainties in length, conductivity, temperature, and temperature
difference gives the uncertainty in heat flux as 4% at 30 W. The uncertainty in heat flux
decreases as the temperature difference between the two thermocouples increases, hence, the
estimate increases in accuracy as the heat flux increases. Similarly, the uncertainty in surface
49

temperature estimate is 4.5 % at 30 W and varies just like the heat flux.
As mentioned in Chapter 5, the mass flow rate is estimated by subtracting the bleed flow
rate from the mass flow rate measured by the orifice-meter. Thus, the uncertainty in mass flow
rate is estimated by combining the uncertainties in: differential pressure reading, orifice-meter
discharge coefficient estimate, orifice diameter and bleed flow rate. The resulting uncertainty
in mass flow rate was about 5 %.
A.2 Error Analysis for Free Expansion
The vacuum gauge (transducer) used in the experiment had an accuracy of ±3% of the
reading. The thermocouples after calibration had an accuracy of ± 1 K in the range of
temperatures covered in this study. The mass flow rate uncertainty is based on the uncertainty
in the stop watch reading and the final pressure reading. Based on these, the uncertainty in mass
flow rate was ±5%.
A.3 Free Expansion Study- Additional Data and Photographs
The following pages contain data and photographs not included in the main part of the
report.
50

250 , , 35
SJ' -. ...... 30
200
25
1s50 20
160.
- 2010
505
01 i I 0
0 10 20 30 40 50 60 70
Time (a)"* -pressure"* -tmperature
nozzle d- 0.007"upstream pressure: 200 psig1-first thermocouple2-temperature in injector
figur A. I Temperature and Pressure in Blow-Down Tube
300 120
110
250 -100
90
80 C%
70 E
60 AS10 -L; 50 *
40 IL
301000
50 10
0 5 10 15 20 25
Time (a)* -pressure* -temperature
nozzle: d0.007?"upstream pressure: 4 0 0 psdg1--first thermocouple2--second thermocouple3--temperature in injector
Figure A.2 Temperature and Pressure in Blow-Down Tube
51

350
300
250
S150
S100
50"
4 35
2'4 45 220 5 30 30,ý°°o6j 1 10
Ia 0 0
Nozzle: d-0.007"Pressure in injector: 200 psig
Figure A.3 Transient TempeMture Field
350
300250
200
S150100
500
"4' 3 20 2
ONCO0 1 5 10 5
Nozzle: d=0.007"Pressure in Injector: 400psig
igure A4 Transient Temperature Field
52

300 . . . 100
S20 o.
250
G0-
200 E40
150 , -2
2 20
0
0 5 10 15 20 25 30 35 40
Time (a)"* -pressure"* -temperature
nozzle d= 0.010"upstream preMure - 200psag1-first thermocouple2-second thermocouple3-temperature in injector
Figure A.5 Temperature and Pressure in Blow-Down Tube
300 1 200
2
250 - 150
S200 • 10OJ
0.
2150 50 s
too 0 .C
50 1 -50
0 5 10 15 20 25 30 35
Time (s)
* -pressure* -temperature
nozzle d- 0.010"upstream presure - 30 0 psig1-first thermocouple2-second thermocouple3-temperature in injector
Figure A.6 Temperature and Pressure in Blow-Down Tube
53

300 200
2
250 /2150
*200 1/o9E
l10 C
50 i-50
0 5 10 15 20 25 30
Time (2)
*-prm.ur* -temperature
nozzle 4- 0.010"upstream premur*- 400psig1-first thermocouple2-second thermocouple3-temperature in injector
Figme A.7 Temperatre and Preure in Blow-Down Tube
300
-3 250S200
*15
100
50
00
5 20
"4, 15'5 ..e o. .2 ' u10.
Nozzle: d=0.010"Pressure in Injector: 300psig
Figmre A.8 Transient Temperatre Field
54

300
-a250
2020
1503 1
1201
500
Nozzle: d=0.010"Pressure in Injector: 400 psig
Figur A,. Transient Temperaure, Feied
300 100
250 so8
60-
I.. 40
150 00
.. 20 C1
100 0
0 5 10 15 20 25 30 35 40
Time (a)"* -pressure"* -tempeature
nozzle d- 0.014"upstream pressure- 100psig1 -first thermocouple2-second thermocouple3-tempersture in injector
Figur A.l1 TeMperAture and Pressue, in Blow-Down Tube
55

300 200
250 150
200 1
g150 O 50
100
s0 -500 5 10 15 20 25 30 35 40
Time (a)
"* -pressure"* -temperature
nozzle d- 0.014"upstream pressure- 200psig1-first thermocouple2-second thermocouple3-temperature In Injector
Figure A. 11 Temperature and Pressure in Blow-Down Tube
300 I200
2/250 - 150
1000
3
50 , -L I , -502
0 5 10 1i 20 25 30
Time (s)* -pressure
* -temperaturenozzle d- 0.014"upstream pressure- 300dpsi1-first thermocouple2-second thermocouple3-temperature in injector
Figure A.12 Tempmature and Pressure in Blow-Down Tube
56

300 , , 502
250- 40
*200 30I. a150 20
100 10
50 0 ,0 5 10 15 20 25 30 35 40
Time (s)"* -Pressure"* -temperature
nozzle d- 0.014"upstream pressure- 400psig1-first thermocouple2-second thermocouple3-temperature in injector
Figure A.13 Tempeatme and Prssure in Blow-Down Tube
350
300
2a0
150*
Nozzle: d=0 014"Pressure in Injector: 10psig
Figur A.14 Trazien Temeatr Field
57

300
250200
150100
50
5 02000
54e 43 15 2
o 2 101 5
Nozzle: d=0.014"Pressure in InjecLor: 200psig
Figure A.15 Transient Tempmture Field
300
250
200
10
100*
508
,.71 4 15 20
"Noo 2 10°04" 15
.Nozzle: d=0.014"Pressure in Injector: 300psig
Fiur A.l1 Transiet Temperature Field
58

Fiure A. 1 7 Solid Nitrogen Being Pushed O foilte ozl
59
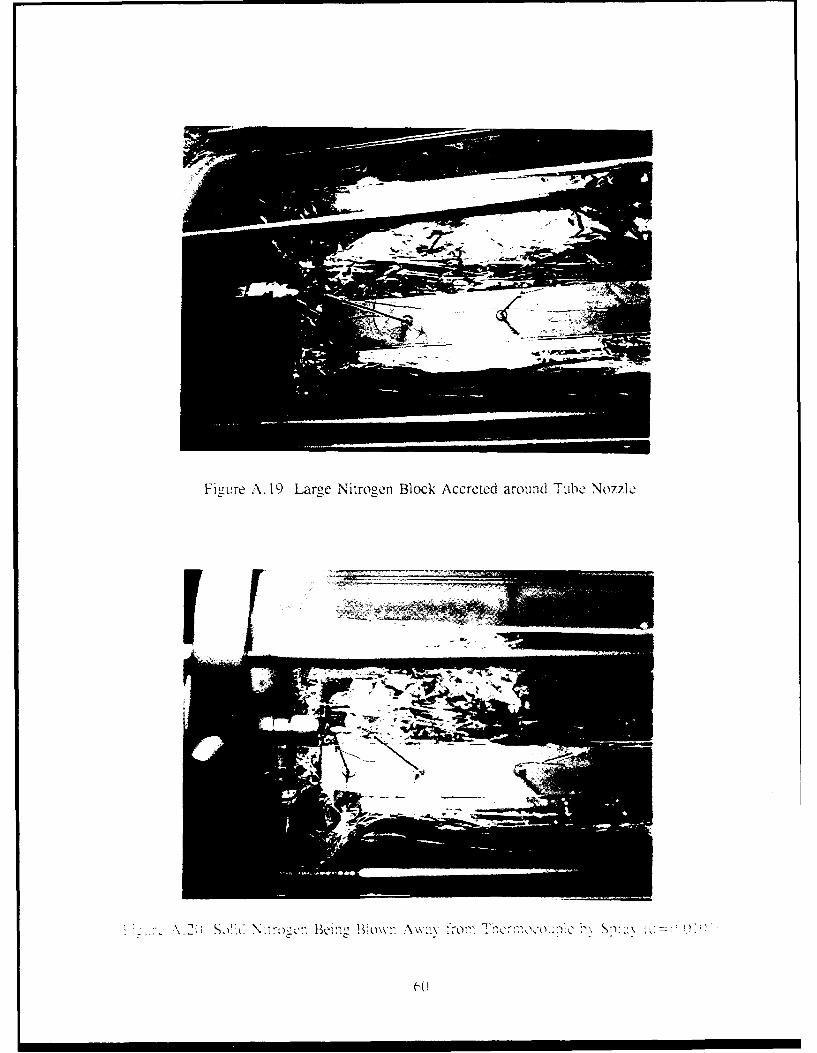
Figure A. 19 Laroe Nitrogen Block Accreted around Tu~be N077le