Pyroelectric Effect
17
PYROELECTRICITY CONTENT 1. Short history of the pyroelectric effect 2. Definitions 3. Simple model of the pyroelectric effect 4. Thermodynamic description of pyroelectricity 5. Theory of pyroelectricity 6. Pyroelectricity and a crystal symmetry 7. Measurements 8. Pyroelectric materials 9. Applications 1. Short history of the pyroelectric effect Pyroelectricity as a phenomenon has been known for 24 centuries—the Greek philosopher Theophrastus probably wrote the earliest known account. He described a stone, called lyngourion in Greek or lyncurium in Latin, that had the property of attracting straws and bits of wood. Those attractions were no doubt the effects of electrostatic charges produced by temperature changes most probably in the mineral tourmaline. Theophrastus and other writers of the two millennia that followed were far more interested in the origin of the stone and its possible therapeutic properties than they were in physical explanations. Theophrastus proposed that lyngourion was formed from the urine of a wild animal [1]. Two thousand years after Theophrastus, tourmaline’s unusual physical properties were reintroduced to Europe through the book entitled “Curious Speculations During Sleepless Nights. It author Johann Georg Schmidt wrote a series of 48 dialogs, one of which contained a section describing hard and glassy bodies that were not magnetic. He described the experiences of Dutch gem cutters when they tested the durability of tourmaline in a fire: “The ingenious Dr. Daumius, chief physician to the Polish and Saxon troops on the Rhine, told me that, in the year 1703, the Dutch first brought from
-
Upload
rafael-triani -
Category
Documents
-
view
322 -
download
21
Transcript of Pyroelectric Effect

PYROELECTRICITY
CONTENT
1. Short history of the pyroelectric effect
2. Definitions
3. Simple model of the pyroelectric effect
4. Thermodynamic description of pyroelectricity
5. Theory of pyroelectricity
6. Pyroelectricity and a crystal symmetry
7. Measurements
8. Pyroelectric materials
9. Applications
1. Short history of the pyroelectric effect
Pyroelectricity as a phenomenon has been known for 24 centuries—the Greek philosopher
Theophrastus probably wrote the earliest known account. He described a stone, called
lyngourion in Greek or lyncurium in Latin, that had the property of attracting straws and bits
of wood. Those attractions were no doubt the effects of electrostatic charges produced by
temperature changes most probably in the mineral tourmaline. Theophrastus and other writers
of the two millennia that followed were far more interested in the origin of the stone and its
possible therapeutic properties than they were in physical explanations. Theophrastus
proposed that lyngourion was formed from the urine of a wild animal [1].
Two thousand years after Theophrastus, tourmaline’s unusual physical properties were
reintroduced to Europe through the book entitled “Curious Speculations During Sleepless
Nights. It author Johann Georg Schmidt wrote a series of 48 dialogs, one of which contained a
section describing hard and glassy bodies that were not magnetic. He described the
experiences of Dutch gem cutters when they tested the durability of tourmaline in a fire:
“The ingenious Dr. Daumius, chief physician to the Polish and Saxon troops
on the Rhine, told me that, in the year 1703, the Dutch first brought from

Ceylon in the East Indies a precious stone called tourmaline, turmale, or trip,
which had the property of not only attracting the ashes from the warm or
burning coals, as the magnet does iron, but also repelling them again.”
In 1717 the chemist and physician Louis Lemery wrote the first scientific paper of
pyroelectricity in a journal. The naturalist Carl von Linné (Linnaeus) was the first to relate the
pyroelectric property of tourmaline to electricity; he called the mineral lapis electricus—
electric stone [2 ]. Experiments on tourmaline during the 18th century by Franz Ulrich
Theodor Aepinus, Johann Karl Wilcke, Benjamin Wilson, Joseph Priestley, John Canton, and
Torben Bergman made major contributions to the rapidly developing field of electrostatics [3].
In 1824 David Brewster, was the first author to use the term “pyroelectricity” [4]. One of the
materials he studied was a “tartrate of soda and potash”—Rochelle salt. John Mothée Gaugain
made the first precise measurements of pyroelectric charges in 1859 [5]. He reached some
important conclusions: The total quantity of electricity produced by a crystal of tourmaline
depends uniquely upon the limits within which its temperature is varied; within those limits,
the amount of electricity produced during heating is the same as that produced during cooling,
but with the signs of the charges reversed; and the amount of charge produced is proportional
to the crosssectional area of the crystal and is independent of its length. William Thomson
(Lord Kelvin) published the first major theoretical treatment of pyroelectricity in 1878; his
paper included a prediction of the electrocaloric effect [6]. Jacques and Pierre Curie proposed
that the electrical effects due to nonuniform heating of quartz crystals might have been caused
by pressure, a speculation that led to their 1880 discovery of piezoelectricity. W. Voigt
established an outstanding school of crystallography, thermodynamics and crystal physics [7].
During the latter part of the 19th century and the early decades of the 20th century, seven
Nobel laureates—Wilhelm Röntgen, Pierre Curie, Gabriel Lippman, Heike Kammerlingh
Onnes, Erwin Schrödinger, Archer J. P. Martin, and Max Born—published papers on
pyroelectricity. In 1938 Yeou Ta published a paper that initiated the great growth that
continues in the field today [8]. In this paper for the first time it was proposed that tourmaline
crystals could be used as IR sensors in spectroscopy. Some research was conducted on
pyroelectric IR detectors during and immediately after World War II in the UK, US, and
Germany, but the results appeared only in classified documents. In 1962 J. Cooper made the
first detailed analysis of the behavior of fast IR detector using BaTiO3 [9]. In the same year,
he proposed the use of pyroelectric devices for measuring temperature changes as small as
0.2µK [10]. In 1969, Le Carvennec proposed the use of pyroelectric elements for thermal

imaging [11]. Pyroelectric devices have been also used for applications in space for example
in Net-flux Radiometer contained in the Galileo Probe [12].
2. Definitions
Pyroelectricity is the property presented by certain materials that exhibit an electric
polarization ∆P when a temperature variation ∆T is applied uniformly:
∆Tγ∆P ⋅= (1)
where γ is the pyroelectric coefficient at constant stress. Pyroelectric crystals actually have
a spontaneous polarization, but the pyroelectric effect can only be observed during
a temperature change.
Pyroelectric coefficient can be expressed as:
TP
γ S
∂∂= (2)
where: PS – spontaneous polarization.
The unit of pyroelectric coefficient is
⋅ Km
C2
.
If a pyroelectric crystal with an intrinsic dipole moment (top) is fashioned into a
circuit with electrodes attached on each surface (FIG. 1), an increase in temperature T
prompts the spontaneous polarization PS to decrease as the dipole moments, on average,
diminish in magnitude. The horizontal tilting of the dipoles, (pictured at bottom of FIG. 1),
signifies the effect. A current flows to compensate for the change in bound charge that
accumulates on the crystal edges.
FIG. 1 Schematic drawing showing the origin of the pyroelectric current.
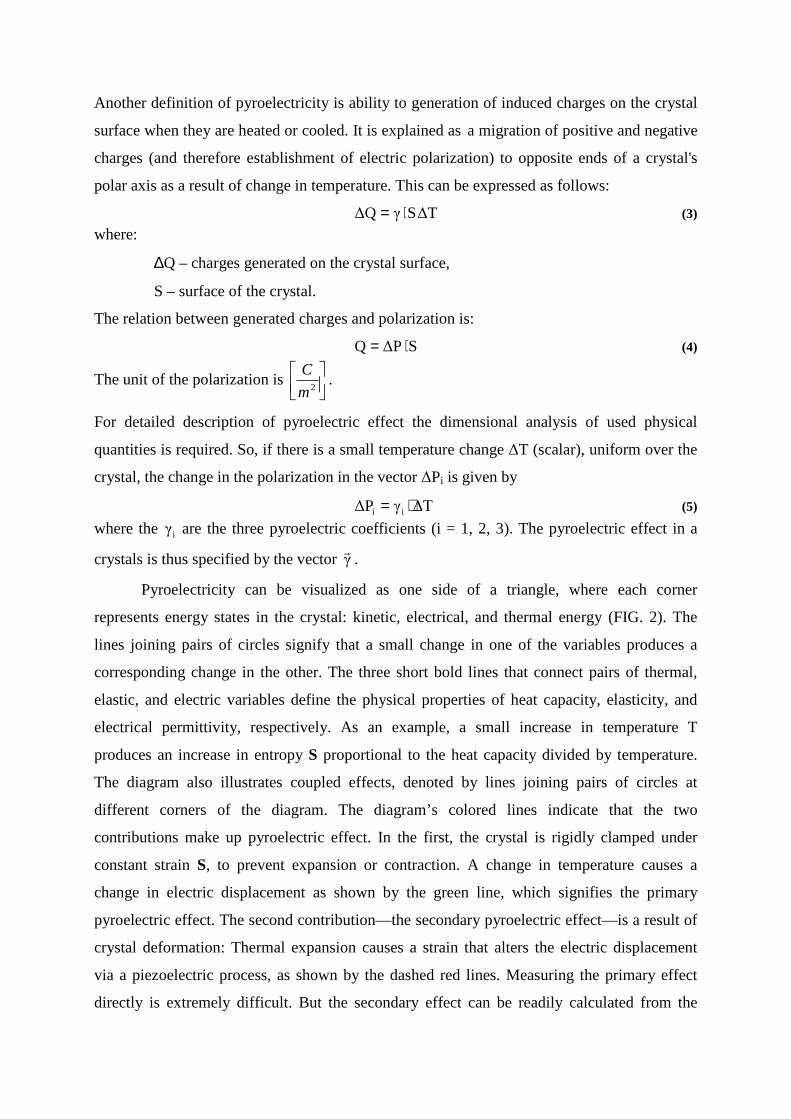
Another definition of pyroelectricity is ability to generation of induced charges on the crystal
surface when they are heated or cooled. It is explained as a migration of positive and negative
charges (and therefore establishment of electric polarization) to opposite ends of a crystal's
polar axis as a result of change in temperature. This can be expressed as follows:
∆TSγ∆Q ⋅= (3)
where:
∆Q – charges generated on the crystal surface,
S – surface of the crystal.
The relation between generated charges and polarization is:
S∆PQ ⋅= (4)
The unit of the polarization is
2m
C.
For detailed description of pyroelectric effect the dimensional analysis of used physical
quantities is required. So, if there is a small temperature change ∆T (scalar), uniform over the
crystal, the change in the polarization in the vector ∆Pi is given by
∆Tγ∆P ii ⋅= (5)
where the iγ are the three pyroelectric coefficients (i = 1, 2, 3). The pyroelectric effect in a
crystals is thus specified by the vector γr
.
Pyroelectricity can be visualized as one side of a triangle, where each corner
represents energy states in the crystal: kinetic, electrical, and thermal energy (FIG. 2). The
lines joining pairs of circles signify that a small change in one of the variables produces a
corresponding change in the other. The three short bold lines that connect pairs of thermal,
elastic, and electric variables define the physical properties of heat capacity, elasticity, and
electrical permittivity, respectively. As an example, a small increase in temperature T
produces an increase in entropy S proportional to the heat capacity divided by temperature.
The diagram also illustrates coupled effects, denoted by lines joining pairs of circles at
different corners of the diagram. The diagram’s colored lines indicate that the two
contributions make up pyroelectric effect. In the first, the crystal is rigidly clamped under
constant strain S, to prevent expansion or contraction. A change in temperature causes a
change in electric displacement as shown by the green line, which signifies the primary
pyroelectric effect. The second contribution—the secondary pyroelectric effect—is a result of
crystal deformation: Thermal expansion causes a strain that alters the electric displacement
via a piezoelectric process, as shown by the dashed red lines. Measuring the primary effect
directly is extremely difficult. But the secondary effect can be readily calculated from the

values of the thermal expansion coefficient, the elastic stiffness, and the piezoelectric strain
constant. So experimentally, the pyroelectric effect under the constraint of constant stress-the
so-called total effect, the sum of red and green lines is what is usually measured [3].
FIG. 2 The triangular diagram illustrating the thermodynamically reversible interactions that may occur among the thermal, mechanical, and electrical properties of a crystal.
3. Simple model of the pyroelectric effect
In the microscopic scale, the pyroelectric effect occurs because of the asymmetric
interaction potential caused by electrically charged atoms within the crystal structure of the
material. This can be viewed schematically as presented in FIG. 3, which shows a two-
dimensional lattice of cations and anions. The cations are displaced relative to the unit cells
“centre” to give rise to an electrical dipole moment (or spontaneous polarization PS along the
line (x1 – x2).
FIG. 3 Schematic two-dimensional presentation of pyroelectricity.

The potential energy of any cation along this line will be an asymmetric form as
illustrated in FIG. 4. Any excitation caused by an increase in lattice temperature will make it
change its quantised energy level (E1 to En) within the well, and lead to a change in its mean
equilibrium position in the lattice along the line A-B in FIG. 4. This gives a change in the
overall electrical dipole moment, which appears as the macroscopic pyroelectric effect [13].
FIG. 4 Potential energy of cation in lattice of FIG. 3 along the line x1-x2, E1 to En represent the quantised energy levels for the cation and the locus A-B is the change in its equilibrium position with change in energy [13].
In dielectrics exhibiting pyroelectricity the dipole moment can arise as a consequence
of the packing in an ionic crystal, because of the alignment of polarized covalent bonds in
molecular crystals or crystalline polymers or because of atomic displacements controlled by
the position of hydrogen ions in a hydrogen bonded crystal [13].
4. Thermodynamic description of pyroelectricity
Polarization of the crystal is a function of temperature, deformation η ij and electric
field Ei:
( )iijkk E,ηT,PP = (6)
On the other hand deformation depends on temperature, mechanical stresses and electric field
( )ilmijij E,σT,ηη = (7777)
If intensity of electric field is equal to zero Ei = 0, then changes of polarization and
deformation can be written as follows:
ij
Tij
k
η
kk dη
η
PdT
T
PdP
ij
∂∂+
∂∂= (8)

lm
Tlm
ij
σ
ijij dσ
σ
ηdT
T
ηη
lm
∂∂
+
∂∂
=d (9)
Assuming that in whole crystals the stresses are uniform constσ lm = , from equations (8) and
(9) the total pyroelectric effect can written as:
lmijijlm σ
ij
Tij
lm
ηlm
k
η
k
σ
k
T
η
η
σ
σ
P
T
P
T
P
∂∂
⋅
∂∂⋅
∂∂+
∂∂=
∂∂
(10)
where:
σ
kσ
k γT
P
lm
=
∂∂
- the total pyroelectric coefficient,
η
ηk
k γT
P
ij
=
∂∂
- the primary pyroelectric coefficient,
η
klm
ηlm
k dσ
P
ij
=
∂∂
- the piezoelectric moduli,
Tlmij
Tij
lm Cη
σ =
∂∂
- elastic compliance coefficients,
σ
ij
σ
ijα
T
η
lm
=
∂∂
- coefficients of thermal expansion.
Hence for a free crystal the total pyroelectric effect in equation (10) can be rewritten as:
σ
ijTlmij
η
klmη
kσ
k αCdγγ ⋅⋅+= (11111111)
Distinctly the secondary pyroelectric coefficient is given by the product consists of ηklmd , TlmijC
and σ
ijα . Though secondary pyroelectricity is due to piezoelectricity, only those piezoelectric
crystals which belong to the ten polar classes are permitted by crystal symmetry to exhibit
secondary pyroelectricity.
5. Theory of pyroelectricity
The first quantum theory of primary pyroelectric effect for the case of ionic crystals was
formulated by Max Born in the year 1945 [14]. In this paper, Born had indicated that primary
pyroelectric coefficient would be proportional to temperature T, though in his later treatise on
lattice dynamics he predicted the T3 law for the pyroelectric coefficient [15]. Successively the
physicists in their papers have proved clearly many interesting features of the theory,
especially the role of mechanical and electrical anharmonicity in primary pyroelectricity
which in fact was not noticed by Born [16, 17, 18].
In principle, in order to understand pyroelectricity in any material, one has to consider the
various mechanisms of the spontaneous polarization (such as ionic, electronic, orientational or
surface charge) and study their variation with temperature. Generally in dielectrics, both the
electronic polarization and the ionic polarization are due mainly to the elastic displacement of
electron clouds and lattice vibrations within the atoms or molecules. Their interaction is an
intramolecular phenomenon, and restoring force against the displacement is relatively
insensitive to temperature, so electronic and ionic polarization processes are only slightly
dependent on temperature. However, orientational polarization is a rotational process, which
includes not only the thermal stimulation, but also mechanical friction processes. The rotation
of a dipole in a material is like a small ball rotating in a viscous fluid. Under an external force,
it tends to change from its original equilibrium state to a new, dynamic equilibrium state, and
when the force is removed, it then relaxes back to its original equilibrium state. This
polarization involves the inelastic movement of particles, and its interaction is an
intermolecular phenomenon; hence, orientational polarization is strongly temperature-
dependent [19].
In the case of ionic crystals, there are two important mechanisms of polarization. One
being responsible for absorption in the infrared i.e. the lattice or ionic polarization and the
other in the ultraviolet i.e. the electronic polarization. In the very simplest and crude model
known as the rigid ion model, the electron cloud around the ion is assumed to be rigid and
consequently there is no contribution from electronic polarization. For such a model, the total
dipole moment of the crystal is given by:
∑=a
aa QαM (12)
where Qa are the active normal coordinates i.e. those which produce uniform polarization in
the direction of M. aα are suitable normalizing constants. Following Szigeti’s procedure the
macroscopic dipole moment M is normalized with the respect to number of moles Nm as p =
M / Nm [16]. This normalization to a mole is better than to unit volume, because in changes of
density one should compare the dipole moment produced by the same amount of material.
In reality the electrons are deformed during the lattice vibrations as they experience
short range forces and also the dipolar field due to ions. The electron deformation is not just
linearly proportional to lattice displacements but involves higher terms as well. Hence when

one takes into consideration the electronic polarization also, the normalized macroscopic
dipole moment of the crystal is given by
∑∑ ++=j'j
j'jj'ja
aa0 QQβQαpp (13)
where p0 is the moment in the undisplaced configuration and the αa and βjj’ are expansion
coefficients. An important point to note is that αa includes both the effects due to lattice
displacements and also the first order effects due to electron deformation. The Qa are the
active normal coordinates, those which produce uniform polarization in the direction of p [16].
The above expression for the dipolemoment clearly implies the presence of electrical
anharmonicity in the crystal.
For the ease of harmonic crystal, the potential energy is proportional to the square of
the normal coordinates. In reality crystals are not harmonic and the mechanical anharmonicity
has to be taken into account. For such a crystal the potential energy involves the cubic and
higher powers of the normal coordinates
++= ∑∑j"j'j
j"j'jj"j'jj
2j
2j QQQbQω
2
1W (14)
The primary pyroelectric coefficients ηγ could be expressed in terms of coefficients
which appear in the expansion of dipole moment and potential energy
2j
j
j a2a
ajjajj
η
ω
C
ω
bαβγ ∑ ∑
−= (15)
Here Cj is the contribution of the jth mode to the specific heat and is given by ( )T/nω jj ∂∂h , jn
being the average occupation number of the phonons with energy jωh [20].
6. Pyroelectricity and a crystal symmetry
By Neumann’s Principle polarization P must conform to the point-group symmetry of the
crystal. It follows immediately that a pyroelectric effect cannot exist in a crystal possessing
a centre of symmetry, a fact which provides a practical method of testing for the absence of
a centre. A little thought shows that a pyroelectric effect can only proceed along a direction in
a crystal which is unique, in the sense that it is not repeated by any symmetry element. If there
should exist in the point group a unique direction which is an axis of symmetry (2-, 3-, 4- or
6-fold), this will necessarily be the direction of P. But the presence of such a unique
symmetry axis is not essential for the existence of a pyroelectric effect. It may be noted, in
passing, that a unique direction as defined above is not synonymous with a polar direction.
A polar direction is any direction of which the two ends are not related by any symmetry
element of the point group. Thus, a diad axis in class 32 is a polar direction, but it is not
a unique direction. All unique direction are polar, but only some polar directions are unique.
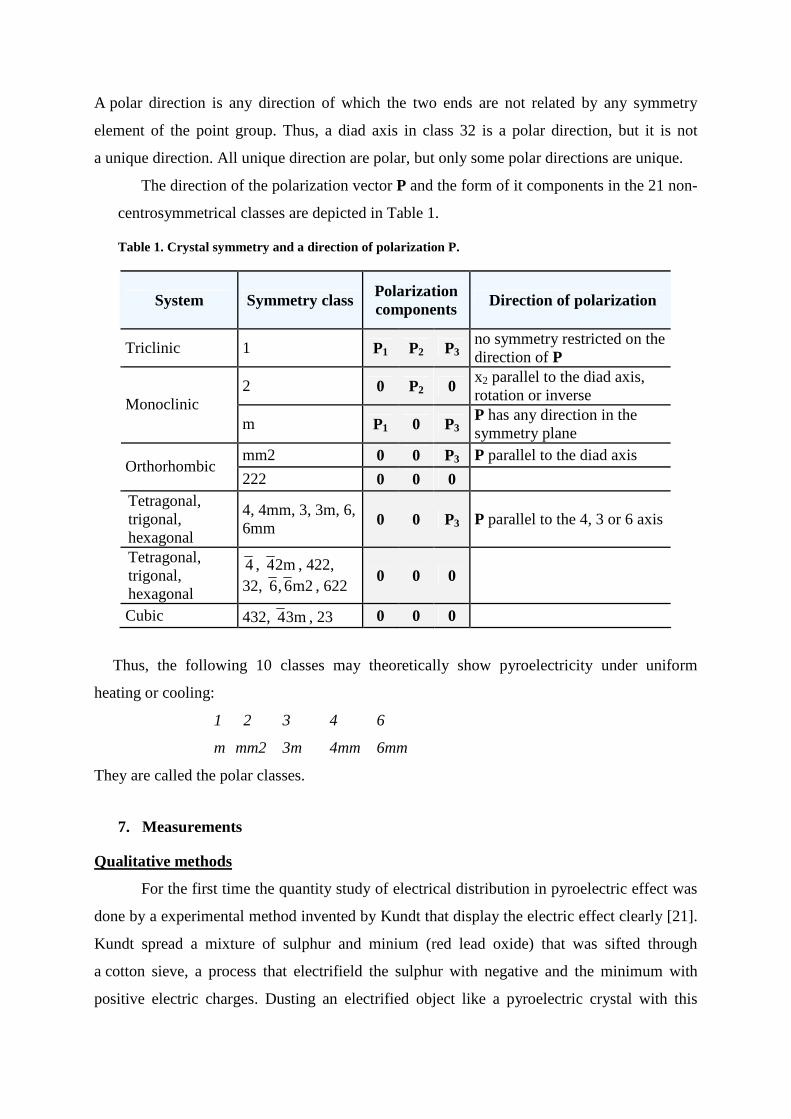
The direction of the polarization vector P and the form of it components in the 21 non-
centrosymmetrical classes are depicted in Table 1.
Table 1. Crystal symmetry and a direction of polarization P.
System Symmetry class Polarization components Direction of polarization
Triclinic 1 P1 P2 P3 no symmetry restricted on the direction of P
2 0 P2 0 x2 parallel to the diad axis, rotation or inverse
Monoclinic m P1 0 P3
P has any direction in the symmetry plane
mm2 0 0 P3 P parallel to the diad axis Orthorhombic
222 0 0 0 Tetragonal, trigonal, hexagonal
4, 4mm, 3, 3m, 6, 6mm 0 0 P3 P parallel to the 4, 3 or 6 axis
Tetragonal, trigonal, hexagonal
4, 2m4 , 422, 32, m26,6 , 622
0 0 0
Cubic 432, 3m4 , 23 0 0 0
Thus, the following 10 classes may theoretically show pyroelectricity under uniform
heating or cooling:
1 2 3 4 6
m mm2 3m 4mm 6mm
They are called the polar classes.
7. Measurements
Qualitative methods
For the first time the quantity study of electrical distribution in pyroelectric effect was
done by a experimental method invented by Kundt that display the electric effect clearly [21].
Kundt spread a mixture of sulphur and minium (red lead oxide) that was sifted through
a cotton sieve, a process that electrifield the sulphur with negative and the minimum with
positive electric charges. Dusting an electrified object like a pyroelectric crystal with this

powder provides a picture of its surface electric tension in red and yellow – the red minium
colors the areas of negative voltage and the yellow sulphur colors the positive parts [22].
Another qualitative method for observing the pyroelectric effect was proposed by
Bleekrode [23]. In this case, the pyroelectric crystal is cooled by vapours of liquid air, and
then it hangs freely in the atmospheric air. Crystal cooled to a low temperature causes
condensation of water vapor in the air and the formation of tiny ice crystals, which settle and
grow on the surface towards the direction of the force lines of the electric field produced by
pyroelectric charges. These ice crystals reach a size of several millimeters. This method can
be used only in case of "strong" pyroelectric effect.
The qualitative method for observing the "weak" pyroelectric effect was developed by
Martin [24]. A small piece of a crystal was hung on a very fine glass capillary near a flat
metal electrode. The temperature of the crystal and the electrodes is reduced by the vapours of
liquid air. If on the crystal surface the pyroelectric charges appears due to the change of its
temperature, the crystal will be attracted to the metal electrodes due to the normal electrostatic
interaction.
Static method
Direct measurement of pyroelectric charges caused by temperature changes is difficult
because each of a tested crystal has a non-zero conductivity. Thus, each measuring method
used in investigations of pyroelectric properties should be design so that during the
measurement of pyroelectric charges, voltage between the electrodes of the test crystal was
practically equal to zero. The first system fulfill all the above conditions was first developed
by the Curie brothers [25]. Diagram of this test method is illustrated in FIG. 5.
FIG. 5 Simplified diagram of the system using static method to study the pyroelectric properties.
The tested crystal with metal electrodes, is in parallel connected to the quartz plate
through an electrometer which plays the role of the zero device. Pyroelectric charges formed
on the crystal surface is compensated by the piezoelectric charges induced on the surface of

a quartz plate under the influence of known external mechanical stress. From the values of the
piezoelectric modulus of quartz and applied mechanical stresses needed for mutual
compensation of piezoelectric and pyroelectric charges, the magnitude of these charges q can
be specified. Knowing the pyroelectric charge q and the surface S of the crystal electrodes, the
change of spontaneous polarization ∆PS crystal can be determined. By measuring the
temperature changes ∆T. which alters the polarization of the crystal, pyroelectric coefficient
can be calculated from the following equation:
∆T∆P
∆TSq
γS
σ == (16)
Dynamic method
Substantial progress in the development of methods testing pyroelectric properties
arisen through Chynoweth research [26], who proposed a simple dynamic method (). This
method is based on the pulse heating pyroelectric crystal with electroded surfaces. The plate is
heated by a modulated light beam intensity. In an external circuit the flow of electric current
induced by pyroelectric charges induced on the surface can be detected.
FIG. 6 Schematic diagram of dynamic method for pyroelectric measurements.
Specifically, it can be described as follows: Light radiation with power W(t) periodically
modulated at a frequency ω
dtdT
CρhSeSWW(t) tiω0 == (17)
is incident on the surface of the pyroelectric crystal plate (area S and thickness d), which has
emissivity η. A square-wave radiation input, for example, will tend to give a current response
of the form shown in FIG. 7.The element has a thermal capacity C and a thermal conductance

to the surroundings G. Then the formed electrical signal is amplified. The temperature
difference between the element and its surroundings, θ, is described by the following Eq. [10]:
tiω01 eWSεGθ
dtdθ
C ⋅=+ (18)
which has the solution
tiω01 eCiωG
WSεθ(t)
+= (19)
On the other hand the generated pyroelectric current is
dtdT
pSdtdT
dTdP
Sdt
dPSI σ
m
Sm
Sm ⋅⋅=== (20)
and thus the pyroelectric current per input power is
CρhdtdT
CρhS
dt
dTS
dt
dP
W(t)I(t)
sσmp== (21)
and hence the pyroelectric coefficient is
CρhI(t)W(t)
pσm ⋅= (22)
FIG. 7 Schematic presentation of measured quantities: W(t) - square-wave shape of radiation input; T(t) – shape of temperature changes; I(t) – typical current response for square-wave radiation modulation.
8. Pyroelectric materials
The highest pyroelectric figures of merit have been observed in ferroelectric materials.
The transition from the paraelectric to ferroelectric states in most of these (the 'proper'
ferroelectrics) can be modeled in terms of an expansion of the free energy in a power series of
the spontaneous polarization [27]. It is possible to derive expressions for γ and ε from this in
terms of the coefficients of the expansion. Liu and Long [28] have done this and concluded
that εγ/ does not vary widely from one ferroelectric to another and that, therefore,

improvements in material performance must be sought in the dielectric loss. To a large extent,
this is borne out by the discussion which follows.
A second important point about the proper ferroelectrics is that both their dielectric
properties and the pyroelectric coefficient tend to diverge as TC is approached. This means
that the ratio εγ/ and hence the pyroelectric responsivity, stay reasonably constant over
a wide temperature range below TC. This is important from a technological point of view as it
means that the devices require no thermal stabilization. The following discussion reviews the
present state of the art in pyroelectric materials and assesses their relative merits for different
applications.
Table 2 summarizes the selected pyroelectric materials studied so far along with their
figures of merit for voltage responsivity and detectivity.
Table 2. Figure of merit for various pyroelectric materials.
Material TC (oC) T (oC) ε γ ( x 10-8) Reference
TGS 49 -25 0 25 40
20 20 35 100
0.44 1.3 4.0 12.0
[29]
BaTiO3 135 25 60 100
135 200 400
1.9 7.0 20.0
[29]
PbTiO3 492 25 142 2.7 [29]
LiNbO 3 1210 -25 25 100
51 30 31
2.1 0.4 0.5
[29]
LiTaO 3 618 0 25 50 100
52 54 56 60
2.2 2.3 2.5 2.7
[29]
NaNO2 163 25 7.4 0.5 [31]
KNO 3
(thin layer 8.9µm)
135
125
180 - 6000 [30]
PZT4 (clevite) 328 -25 1410 4.6 [29]
PLZT (0/65/35) 380 - 515 3.5 [31]
TC (oC) - Curie temperature; T (oC) - temperature in °C at which measurements were made; ε - dielectric permittivity; γ - pyroelectric coefficient in KC/cm2 .

The choice of the pyroelectric material is mainly determined by (a) its figure of merit, (b)
the detector size, (c) availability and durability of the pyroelectric material, (d) environment in
which the material has to operate, (e) the radiation levels to be detected, (f) the purpose for
which the detector is employed, (g) the maximum ambient temperature of operation and the
range over which stable operation is desired. The importance of factors (b) and (c) in the
choice of pyroelectric material does not need much of an explanation. It should be possible to
grow large crystals of pyroelectric material and fabricate them into thin slices. The durability
is also an important factor [20].
9. Applications
Pyroelectric detectors possess a number of characteristics which are of significance when
considering their use in a given application. Their ‘AC coupled’ nature makes them
insensitive to unvarying fluxes of radiation so that they are ideally suited to detecting small
changes in a relatively large background level of incident energy. They can be used over
a large spectral bandwidth, the only requirement being that the energy be absorbed. They can
be used over a wide range of temperatures without recourse to cooling systems. They have
low power requirements and can operate for long periods on battery power, and last, but not
least, they are generally low-cost devices [32].
Movement detector
This is an ideal application for pyroelectric detectors. In the absence of an intruder, the
interior of an unoccupied building present a fairly constant thermal scene. An intruder moving
into the area surveyed by the detector provides a varying flux of IR radiation, which can be
detected and used to trigger an alarm. Most commercial detectors use a series of faceted
mirrors designed to concentrate the radiation and improve the detection efficiency. Signals are
generated as the intruder moves into and out of the areas covered by the mirrors. These
signals are usually in the range 0.1-10 Hz, where the detectors work very well. The alarms
usually operate in the 8 to 14 pm wavelength range, around the emission peak at 10 pm for
bodies at 300 K. Using a filter which blocks all radiation at wavelengths shorter than 6 or 7
pm makes the detector insensitive to visible radiation and prevents false signals from, for
example, sun glint. It is usual to use compensated detectors in this application to prevent false
alarm signals due to environmental temperature changes.

Pollution monitoring and gas analysis
The concentrations of gases in the atmosphere can be measured from the strength of
particular lines in their absorption spectra. For example, CO2 has a strong absorption at 4.3pm.
The analysis systems generally employ a modulated broad-band source of IR illuminating two
pyroelectric detectors equipped with filters at the chosen wavelength. The radiation falling on
one detector is allowed to pass through the gas being analyzed, while that falling on the other
passes through a reference cell. By taking the ratio of the outputs from the detectors, the
concentration of the pollutant can be measured.
Fire alarms
To detect fires, it is normal to operate at shorter wavelengths than for intruder alarms,
typically around 4 pm. The systems usually sense the flicker frequency of the flames, at 5-
40Hz to avoid false alarms.
Pyroelectric thermal imaging
Thermal imaging utilizes the different powers radiated in the far-infrared by objects in
the scene which are at different temperatures [33]. There are two useful atmospheric windows
in the far-IR; 3-5 pm and 8-14 pm. For objects near 300 K, the power radiated at 3-5 pm is
about 6 Wm-2, compared with 150 Wm-2 in the 8-14 pm band. This difference in radiance,
coupled with the better penetration of haze and smoke by the longer wavelengths, has made
operation in the 8 to 14pm band the preferred choice for general-purpose pyroelectric imaging
systems. Nevertheless, the broad-band operation of pyroelectric targets means that, for
specialist applications, similar devices (usually with just a change of window) can be used at
the shorter wavelengths. Such techniques can be used for ‘multi-color’ IR imaging by which
absolute temperatures in the scene can be measured remotely by their radiances in the
different bands. This has application to, for example, industrial process control or, in the
military field, target/decoy discrimination.
[1] S. B. Lang, Sourcebook of Pyroelectricity, Gordon & Breach Science, London (1974).
[2] S. B. Lang, The history of pyroelectricity: From ancient greece to space missions, Ferroelectrics, 230 (1999) 99 -108.
[3] S. B. Lang, Pyroelectricity: From Ancient Curiosity to Modern Imaging Tool, Physics Today, (2005) 31-36.
[4] B. Brewster, Observations on the pyroelectricity of minerals, Edinburgh. J. Sci., 1 (1824), 208-215.
[5] J. M. Gaugain, Mémoire sur l'électricité des tourmalines, Annales de Chimie et de Physique, 57 (1859) 5–39.

[6] W. Thomson (Lord Kelvin), On the thermoelastic, thermomagnetic and pyroelectric properties of matter, Phil. Mag., 5 (1878) 427-442.
[7] W. Voigt. Lehrbuch der Krirtalphysik (1928), reprint by Johnson Reprint Corp.. New York (1966).
[8] Y. Ta, Actions of radiations on pyroelectric crystals, Compt. Rend., 207, (1938) 1042-1044.
[9] J. Cooper, A Fast Response Total-Radiation Detector, Nature 194, (1962) 269 – 271.
[10] J. Cooper, A fast-response pyroelectric thermal detector, J. Sci. Instrum., 39 (1962) 467-472.
[11] F. Le Carvennec, Advances in Electronics and Electron Physics, 28A, ed. J. D. McGee, D. McMullen and E. Kahan (London and New York: Academic Press) 265-72.
[12] L. A. Sromovsky, F. A. Best, H. E. Revercomb and J. Hayden, Galileo Net Flux Radiometer experiment, Space Science, Reviews, 60 (1992) 233-262.
[13] R. W. Whatmore, Pyroelectric devices and materials, Rep. Prog. Phys. 49 (1986) 1335-1386.
[14] M. Born, On the quantum theory of pyroelectricity, Rev. Mod. Phys. 17 (1945) 245-251.
[15] M. Born and K. Huang, Dynamical Theory of Crystal Lattices, Clarendon Press, Oxford, England, 1954.
[16] B. Szigeti, Temperature dependence of pyroelectricity, Phys. Rev. Lett. 35 (1975) 1532-1534.
[17] P. J. Grout and N. H. March, Low-Temperature behavior of Pyroelectricity, Phys. Rev. Lett. 37 (1976) 791-792.
[18] B. Szigeti, Low-Temperature behavior of Pyroelectricity – A reply, Phys. Rev. Lett. 37 (1976) 792-793.
[19] K. C. Kao, Dielectric phenomena in solids, Elsevier Academic Press, San Diego, USA 2004.
[20] M. R. Srinivasan, Pyroelectric materials, Bull. Mater. Sci., 6 (1984) 317-325.
[21] A. Kundt, Uebereine einfache Methode zur Untersuchung der Thermo-, Actino-, und Piezoelectricitat der Krystalle, Ann. Phy., 20 (1883) 592-601.
[22] S. Katzir, The beginning of piezoelectricity, Springer, Netherlands, 2006.
[23] L. Bleekrode, Über einige Versuche mit flüssiger Luft, Ann. Phys. 317 (1903) 218-223.
[24] A. J. P. Martin, On a new method of detecting pyro-electricity, Min. Mag., 22, (1931) 519-523.
[25] P. Curie and J. Curie, Les cristaux hémièdres à faces inclinées, comme sources constantes d'électricité, Comptes Rendus des Séances de l'Académie des Sciences, 93 (1881) 204-207.
[26] A. G. Chynoweth, Dynamic Method for Measuring the Pyroelectric Effect with Special Reference to Barium Titanate, J. Appl. Phys., 27 (1956) 78-84.
[27] M. E. Lines and A. M. Lines, Principles and applications of ferroelectrics and related materials, Clarendon Press, Oxford 1977.
[28] S. T. Liu and D. Long, Pyroelectric detectors and materials, Proc. IEEE 66 (1978) 14.
[29] H. P. Beerman, Investigation of pyroelectric material characteristics for improved infrared detector performance, Infrared Phys. 15 (1975) 225-231.
[30] F. El-Kabbany, W. Badawy, E. H. El-Khwas and N. H. Tahr, Dielectric and pyroelectric properties of
KNO3 thin-layers, J. Mater. Science 23, (1988) 776-781.
[31] L. E. Garn, E. J. Sharp, Pyroelectric vidicon target materials, IEEE Transactions on Parts, Hybrids, and Packaging, vol. PHP-10, Dec. 1974, p. 208-221.
[32]A. Hadni, Applications of the pyroelectric effect, J. Phys. E: Sci. Instrum., 14 (1981) 1233-1240.
[33] P. F. T. C. Stillwell, Thermal imaging, J. Phys. E: Sci. Instrum., 14 (1981) 1113-1138.