Putting America’s Waterways to Work -...
53
Putting America’s Waterways to Work NYSE: KEX March 2018
Transcript of Putting America’s Waterways to Work -...

Putting America’s Waterways to Work NYSE: KEX
March 2018
Statements contained in this presentation with respect to the future are forward-looking
statements. These statements reflect management’s reasonable judgment with respect to
future events. Forward-looking statements involve risks and uncertainties. Actual results
could differ materially from those anticipated as a result of various factors, including cyclical
or other downturns in demand, significant pricing competition, unanticipated additions to
industry capacity, changes in the Jones Act or in U.S. maritime policy and practice, fuel
costs, interest rates, weather conditions and the timing, magnitude and the number of
acquisitions made by Kirby. Forward-looking statements are based on currently available
information and Kirby assumes no obligation to update such statements. A list of additional
risk factors can be found in Kirby’s annual report on Form 10-K for the year ended December
31, 2017.
Kirby reports its financial results in accordance with generally accepted accounting
principles (GAAP). However, Kirby believes that a certain Non-GAAP financial measure is
useful in managing Kirby’s businesses and evaluating Kirby’s performance. This
presentation contains a Non-GAAP financial measure, EBITDA. Please see the Appendix for
a reconciliation of GAAP to the Non-GAAP financial measure, EBITDA.
2
Forward Looking Statements
Non-GAAP Financial Measures

3
Business Segments
Marine Transportation
The largest inland and coastwise tank barge fleets in the United States
60% of 2017 Revenue
Distribution and Services
Nationwide service provider and distributor of engines, transmissions, parts, industrial equipment and oilfield service equipment
40% of 2017 Revenue

Public Market Information
4
NYSE: KEX
Share Price on February 26, 2018 $76.85
Shares Outstanding (as of February 26, 2018)
59.7MM
Market Capitalization $4,586MM
Net Debt $1,408MM
Enterprise Value $5,994MM

Company Overview
5
• Largest combined inland and coastal tank barge operator
– 998 inland tank barges and 302 towboats*
– 56 coastal tank barges and 53 tugboats*
– 75% of inland revenues under term contracts, of which approximately 51% are under time charters
– 80% of coastal revenues under term contracts, of which approximately 85% are under time charters
• Nationwide distributor and service provider for engines, transmissions, reduction gears, and related equipment used in oilfield services, marine, power generation, on-highway, and other industrial applications
• Manufacturer, remanufacturer and service provider of oilfield service equipment
• Provider of rental equipment including generators, material-handling equipment, pumps, and compressors for use in a variety of industrial markets
Successful integration of 34 marine and 19 distribution and services acquisitions
Marine Transportation
Distribution and Services
Return on Capital Driven Investment Decisions
Proven Acquisition Strategy
* As of February 26, 2018
6
Date
Tank
Barges Description
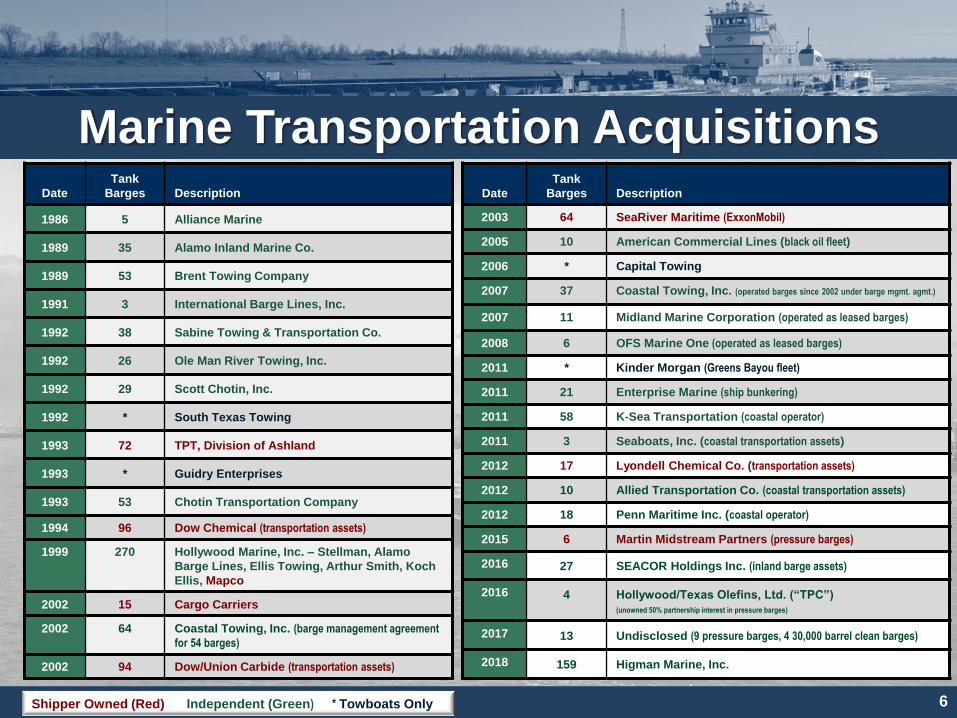
2003 64 SeaRiver Maritime (ExxonMobil)
2005 10 American Commercial Lines (black oil fleet)
2006 * Capital Towing
2007 37 Coastal Towing, Inc. (operated barges since 2002 under barge mgmt. agmt.)
2007 11 Midland Marine Corporation (operated as leased barges)
2008 6 OFS Marine One (operated as leased barges)
2011 * Kinder Morgan (Greens Bayou fleet)
2011 21 Enterprise Marine (ship bunkering)
2011 58 K-Sea Transportation (coastal operator)
2011 3 Seaboats, Inc. (coastal transportation assets)
2012 17 Lyondell Chemical Co. (transportation assets)
2012 10 Allied Transportation Co. (coastal transportation assets)
2012 18 Penn Maritime Inc. (coastal operator)
2015 6 Martin Midstream Partners (pressure barges)
2016 27 SEACOR Holdings Inc. (inland barge assets)
2016 4 Hollywood/Texas Olefins, Ltd. (“TPC”)
(unowned 50% partnership interest in pressure barges)
2017 13 Undisclosed (9 pressure barges, 4 30,000 barrel clean barges)
2018 159 Higman Marine, Inc.
Shipper Owned (Red) Independent (Green) * Towboats Only
Date
Tank
Barges
Description
1986 5 Alliance Marine
1989 35 Alamo Inland Marine Co.
1989 53 Brent Towing Company
1991 3 International Barge Lines, Inc.
1992 38 Sabine Towing & Transportation Co.
1992 26 Ole Man River Towing, Inc.
1992 29 Scott Chotin, Inc.
1992 * South Texas Towing
1993 72 TPT, Division of Ashland
1993 * Guidry Enterprises
1993 53 Chotin Transportation Company
1994 96 Dow Chemical (transportation assets)
1999 270 Hollywood Marine, Inc. – Stellman, Alamo
Barge Lines, Ellis Towing, Arthur Smith, Koch
Ellis, Mapco
2002 15 Cargo Carriers
2002 64 Coastal Towing, Inc. (barge management agreement
for 54 barges)
2002 94 Dow/Union Carbide (transportation assets)
Marine Transportation Acquisitions

Distribution and Services Expansions
7
Acquisitions
1987 National Marine
1991 Ewing Diesel
1995 Percle Enterprises
1996 MKW Power Systems
1997 Crowley (Power Assembly Shop)
2000 West Kentucky Machine Shop
2000 Powerway
2004 Walker Paducah Corp.
2005 TECO (Diesel Services Division)
2006 Global Power Holding Company
2006 Marine Engine Specialists
2007 NAK Engineering (Nordberg Engines)
2007 P&S Diesel Service
2007 Saunders Engine & Equipment Company
2008 Lake Charles Diesel, Inc.
2011 United Holdings LLC
2012 Flag Services & Maintenance, Inc.
2016 Valley Power Systems, Inc.
2017 Stewart & Stevenson LLC
Internal Growth
1989 Midwest
1992 Seattle
2000 Cooper Nuclear

Historical Revenue Growth
8
$327 $366$513 $567 $535
$613$675
$796
$984
$1,173
$1,360
$1,082
$1,110
$1,850 $2,113
$2,242
$2,566
$2,148
$1,771
$2,214
0
200
400
600
800
1,000
1,200
1,400
1,600
1,800
2,000
2,200
2,400
2,600
1998 1999 2000 2001 2002 2003 2004 2005 2006 2007 2008 2009 2010 2011 2012 2013 2014 2015 2016 2017
In M
illi
on
s
Marine Transportation and Distribution and Services Revenue From Continuing Operations
10.6% compound
annual growth
1998-2017

$0.52 $0.63 $0.82 $0.94 $0.82 $0.83
$0.98
$1.33
$1.79
$2.29
$2.91
$2.34 $2.15
$3.35
$3.73
$4.44
$4.93
$4.11
$2.62
$1.99
$3.00
$0.00
$1.00
$2.00
$3.00
$4.00
$5.00
$6.00
1998 1999 2000 2001 2002 2003 2004 2005 2006 2007 2008 2009 2010 2011 2012 2013 2014 2015 2016 2017 2018
1
9
Historical EPS Growth
Earnings per share have been revised to reflect 2-for-1 stock split effective May 31, 2006
Earnings Per Share From Continuing Operations Excluding Non-Recurring Items
7.3% compound
annual growth
1998 - 2017
$2.50
2
2
(2) Based on Kirby's most recently published earnings guidance in the January 31, 2018 press release announcing Q4 2017 earnings. That guidance is shown for convenience only and does not constitute confirming or updating
the guidance, which will only be done by public disclosure.
(1) 2017 earnings per share exclude a one-time deferred tax revaluation benefit of $4.83 per share, and non-recurring after-tax charges including impairments of marine vessels of $1.20 per share.

Higman Marine Acquisition Overview
10
• $419 million in total consideration
• 6.5x – 7.5x multiple of 5-yr prior EBITDA average with synergies
Purchase Price
• EPS neutral in FY 2018
• Accretive in 2019 as inland barge market improves
• Anticipated cost synergies of $10-12 million over one year
Value Created
• All cash purchase
• To be financed through additional borrowings
Financing
• Signed purchase and sale agreement on February 4, 2018
• Closed on February 14, 2018 Timing
11
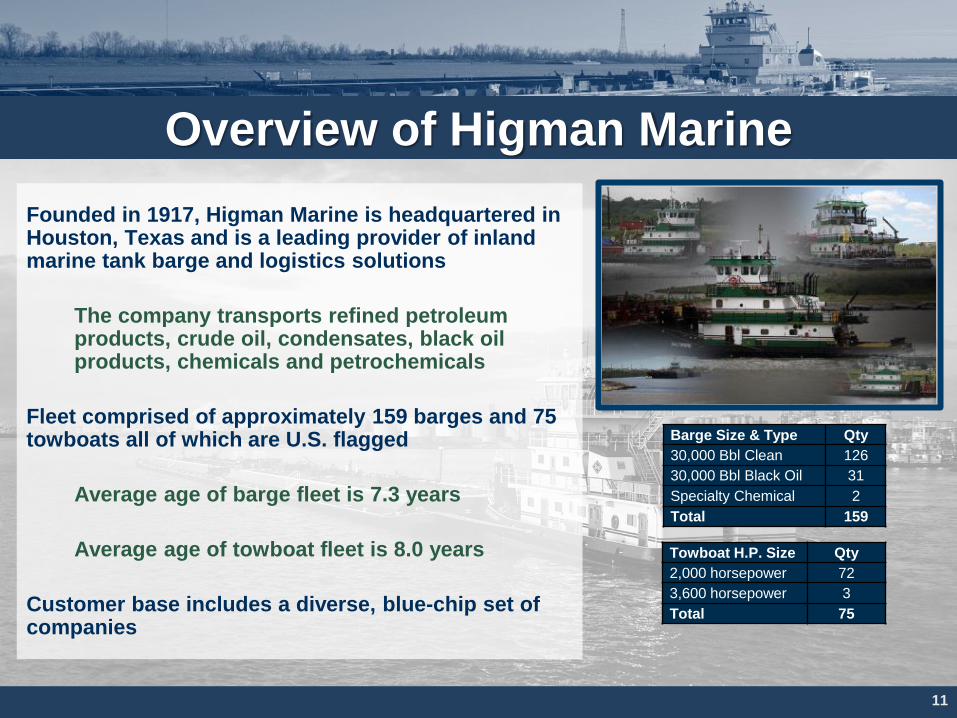
Overview of Higman Marine
Founded in 1917, Higman Marine is headquartered in Houston, Texas and is a leading provider of inland marine tank barge and logistics solutions
The company transports refined petroleum products, crude oil, condensates, black oil products, chemicals and petrochemicals
Fleet comprised of approximately 159 barges and 75 towboats all of which are U.S. flagged
Average age of barge fleet is 7.3 years
Average age of towboat fleet is 8.0 years
Customer base includes a diverse, blue-chip set of companies
Barge Size & Type Qty
30,000 Bbl Clean 126
30,000 Bbl Black Oil 31
Specialty Chemical 2
Total 159
Towboat H.P. Size Qty
2,000 horsepower 72
3,600 horsepower 3
Total 75

12
Rationale for Higman Acquisition
Adding scale in core business
Young, high-quality and well-maintained fleet
Expands business and relationships with existing customers
New capacity and flexibility to better serve customers
Ability to retain high-quality Higman personnel
Attractive time in cycle to acquire assets
Opportunities for cost synergies
Accretive to earnings as market recovers although first year will likely be neutral

13
MARINE TRANSPORTATION

14
U.S. Inland and Coastal Waterway Systems
Texas and Louisiana account for
80% of the total U.S. production of
chemicals and petrochemicals
12,000 miles of navigable
waterways link America’s
heartland to the world

Barge Industry Facts The U.S. barge industry serves the inland waterways, U.S. coastal ports, Alaska and Hawaii
– The inland barge fleet is comprised of approximately 18,000 dry cargo barges and 3,800 liquid tank barges
– The coastal market, including Alaska and Hawaii, encompasses approximately 290 tank barges that are 195,000 barrels or smaller
Kirby is principally in the liquid cargo transportation business
No competition from foreign companies due to a U.S. law known as the Jones Act
Equipment not subject to economic obsolescence because draft, lock and port restrictions limit the size of barges
Barges are mobile, carry wide range of cargoes and service different geographic markets
Water transportation plays a vital role in the U.S. economy
U.S. waterway systems are an environmentally friendly mode of transportation
15

Markets and Products Moved Products Drivers
Petrochemicals and Chemicals
Benzene, Styrene, Methanol, Naphtha,
Acrylonitrile, Xylene, Caustic Soda, Butadiene,
Propylene
Black Oil
Residual Fuel Oil, Coker Feedstock, Vacuum Gas
Oil, Asphalt, Carbon Black Feedstock, Crude Oil,
Natural Gas Condensate, Ship Bunkers Fuel for Power Plants and Ships, Feedstock for
Refineries, Road Construction
Refined Petroleum Products
Gasoline, No. 2 Oil, Jet Fuel, Heating Oil, Diesel
Fuel, Ethanol
Vehicle Usage, Air Travel, Weather, Refinery
Utilization
Agricultural Chemicals
Anhydrous Ammonia, Nitrogen-based Liquid
Fertilizer, Industrial Ammonia
Corn, Cotton, Wheat Production, Chemical
Feedstock Usage
16
Marine Transportation Demand Drivers
30%
70%
Consumer Durables
Consumer Non-Durables
56% 23%
17%
4% Petrochemicals and Chemicals
Black Oil
Refined Petroleum Products
Agricultural Chemicals
Revenue by Product1
1YTD as of December 31, 2017
17
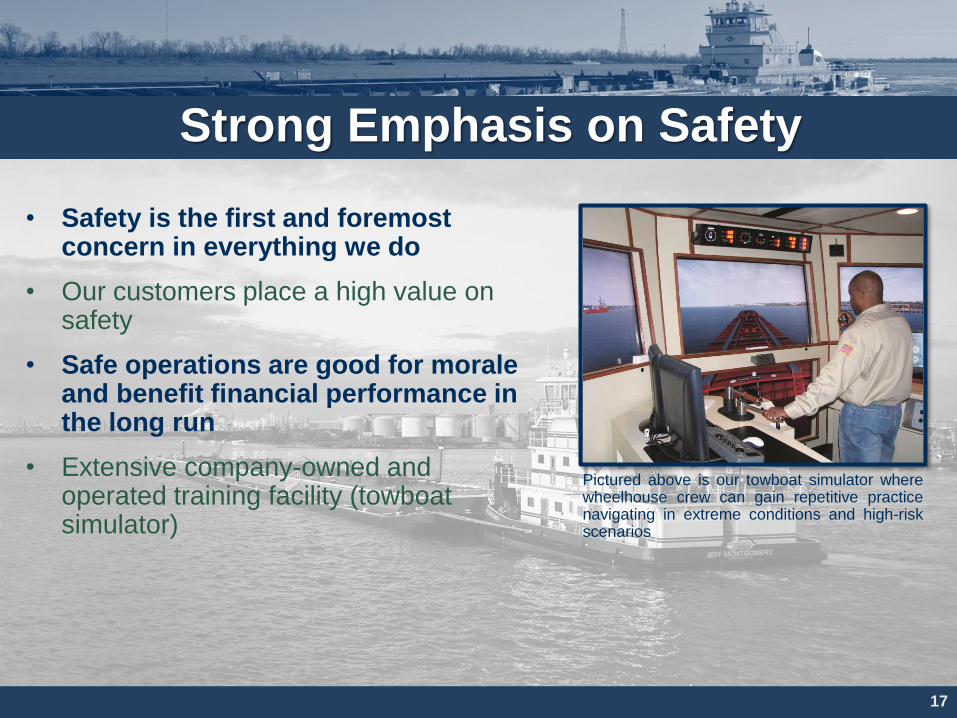
• Safety is the first and foremost concern in everything we do
• Our customers place a high value on safety
• Safe operations are good for morale and benefit financial performance in the long run
• Extensive company-owned and operated training facility (towboat simulator)
Strong Emphasis on Safety
Pictured above is our towboat simulator where wheelhouse crew can gain repetitive practice navigating in extreme conditions and high-risk scenarios
Inland Tank Barge Markets
18
19
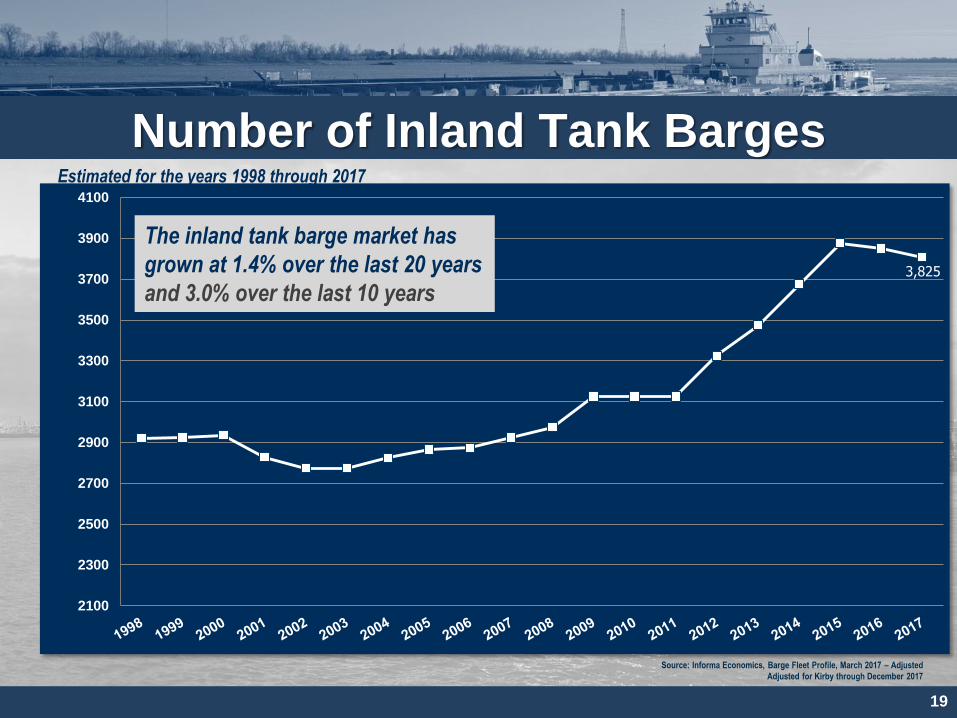
Number of Inland Tank Barges Estimated for the years 1998 through 2017
121 single hull tank
barges industry wide,
9 operated by Kirby
3,825
2100
2300
2500
2700
2900
3100
3300
3500
3700
3900
4100
Source: Informa Economics, Barge Fleet Profile, March 2017 – Adjusted
Adjusted for Kirby through December 2017
The inland tank barge market has
grown at 1.4% over the last 20 years
and 3.0% over the last 10 years

20
Inland Tank Barge Fleet Age Profile
1071
785
516
354 305
140
40
217 255
0
200
400
600
800
1000
1200
0 to 5 5 to 10 10 to 15 15 to 20 20 to 25 25 to 30 30 to 35 35 to 40 > 40
Inland Tank Barge Age Distribution1 (Number of barges by age in years)
Source: Informa Economics, Barge Fleet Profile, March 2017 (1) The total of 3,683 barges in this chart is unadjusted from the Informa Economics, Barge Fleet Profile
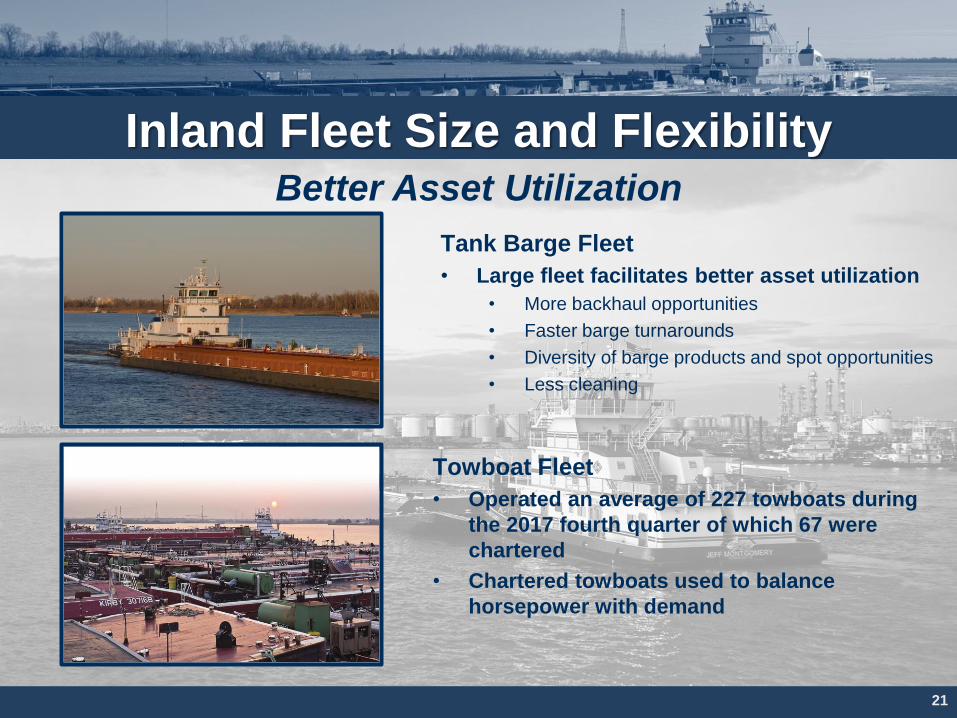
Inland Fleet Size and Flexibility
Towboat Fleet
• Operated an average of 227 towboats during
the 2017 fourth quarter of which 67 were
chartered
• Chartered towboats used to balance
horsepower with demand
21
Tank Barge Fleet
• Large fleet facilitates better asset utilization
• More backhaul opportunities
• Faster barge turnarounds
• Diversity of barge products and spot opportunities
• Less cleaning
Better Asset Utilization
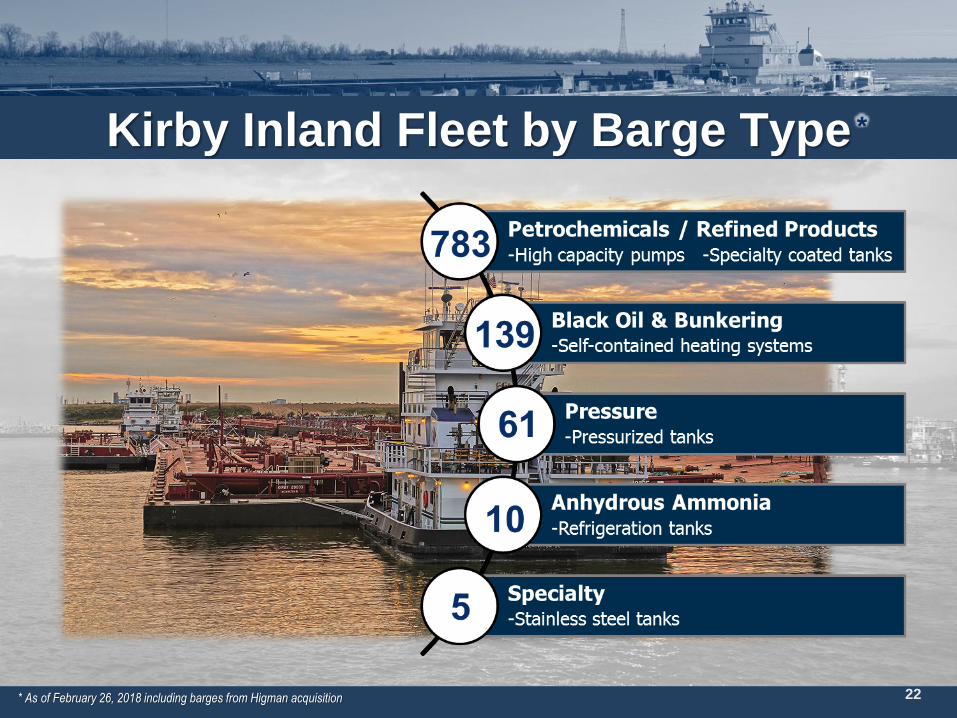
Kirby Inland Fleet by Barge Type
* As of February 26, 2018 including barges from Higman acquisition 22
*
Petrochemicals / Refined Products -High capacity pumps -Specialty coated tanks
Black Oil & Bunkering -Self-contained heating systems
Pressure -Pressurized tanks
Anhydrous Ammonia -Refrigeration tanks
Specialty -Stainless steel tanks
783
139
61
10
5

23
Tank Barges
Operated
Dry Cargo Barges
Operated
John W. Stone Oil 37 -
Martin Midstream Partners 37 -
Buffalo Marine Service, Inc. 36 -
Accu Trans Marine 30 -
Targa 20 -
River City Towing Services 18 -
NGL Energy Partners 18 -
Rhodia, Inc. 18 -
Harley Marine Gulf 14 -
Progressive Barge Line 10 -
Apex Towing Company 9 -
Olin Corporation (Blue Cube) 9 -
Merichem Company 6 -
TW LaQuay Marine, LLC 4 -
Highland Marine 4 -
AgriChem Marine 2
Parker Towing Company 2 293
Oakley Barge Line 2 -
Campbell Transportation 1 698
Other 12 7,825
TOTAL 3,807 18,897
Informa Economics, Barge Fleet Profile, March 2017 – Adjusted
Tank Barges
Operated
Dry Cargo Barges
Operated
Kirby Corporation* 998 -
American Commercial Lines LLC 445 3,346
Canal Barge Company, Inc. 301 403
Ingram Barge Company 223 4,333
Florida Marine 219 218
MPLX (“Hardin St. Marine”) 215 -
Blessey Marine Services 169 -
Enterprise Products Partners 137 -
Magnolia Marine Transport Co. 88
American River Transportation Co. 82 1,781
LeBeouf Brothers Towing Co 81 -
Genesis Energy, L.P. 74
Southern Towing Company 69 -
Savage Inland Marine 63 -
PPG Industries, Inc. 56 -
Golding Barge Lines, Inc. 56 -
Devall Barge Line 53 -
Cenac Towing 52 -
Settoon Towing, LLC 51 -
Westlake Vinyl 44
Chem Carriers, Inc. 42
Shipper Owned Independent
Inland Barge Fleet by Operator
Shipper Owned Independent
* Kirby as of February 26, 2018 including barges from Higman acquisition

Coastal Tank Barge Markets
24
25
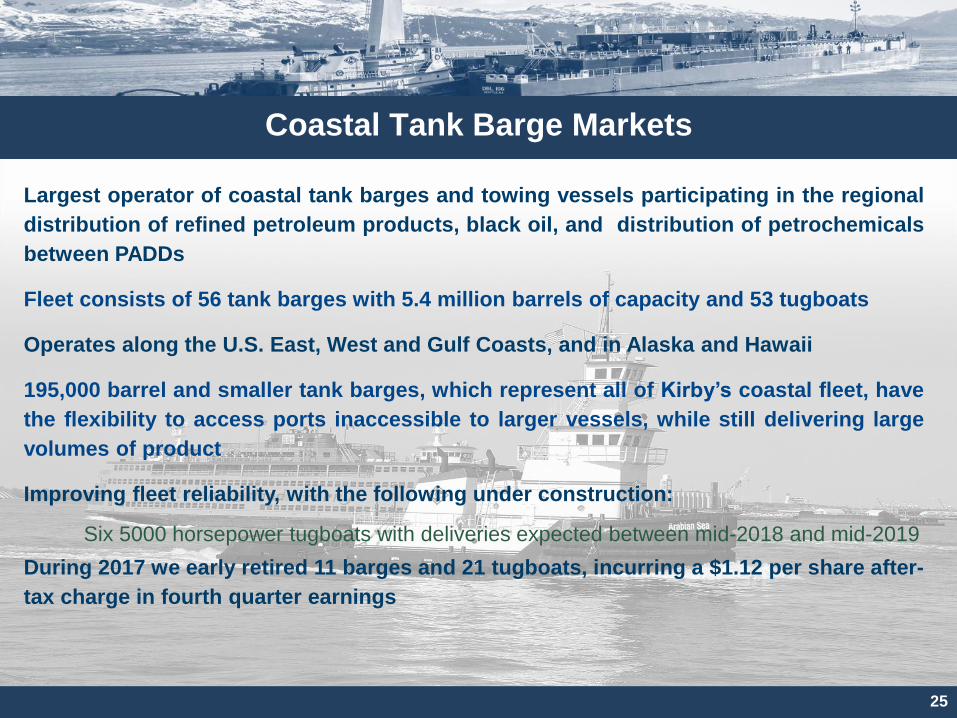
Coastal Tank Barge Markets
Largest operator of coastal tank barges and towing vessels participating in the regional
distribution of refined petroleum products, black oil, and distribution of petrochemicals
between PADDs
Fleet consists of 56 tank barges with 5.4 million barrels of capacity and 53 tugboats
Operates along the U.S. East, West and Gulf Coasts, and in Alaska and Hawaii
195,000 barrel and smaller tank barges, which represent all of Kirby’s coastal fleet, have
the flexibility to access ports inaccessible to larger vessels, while still delivering large
volumes of product
Improving fleet reliability, with the following under construction:
Six 5000 horsepower tugboats with deliveries expected between mid-2018 and mid-2019
During 2017 we early retired 11 barges and 21 tugboats, incurring a $1.12 per share after-
tax charge in fourth quarter earnings

40
61
112
34
19
6 2
19
0
20
40
60
80
100
120
0-5 Years 5-10 Years 10-15 Years 15-20 Years 20-25 Years 25-30 Years 30-35 Years 35+ Years
26
Coastal Tank Barge Age Profile
Nu
mb
er o
f B
arge
s
Coastal Barge Market Age Distribution* Number of barges by age
The average age of the
nation’s coastal tank barge
fleet is ~13 years
* Tank barges with 195,000 barrels capacity or less as of December 31, 2017

Coastal Tank Barge Owners
27
Coastal Tank
Barges Operated *
Estimated Barrel Capacity*
(MM)
Vane Brothers 78 2.8
Kirby Corporation 56 5.4
Harley Marine 42 1.9
Reinauer Transportation 25 2.1
Bouchard Transportation1 23 2.4
Crowley Marine2 15 2.5
Moran Towing 13 1.4
Genesis Energy, L.P. 9 0.9
Saltchuk Resources (Foss Maritime) 9 0.2
Sause Brothers 7 0.6
U.S. Shipping Corporation 4 0.6
Poling & Cutler 4 0.2
Martin Gas Marine 3 0.2
Overseas Shipholding Group3 1 0.2
Seacor 1 0.2
Wawa, Inc. 1 0.2
Occidental Chemical Corporation 1 0.1
Hyak Maritime 1 0.1
293 22.0
* Tank barges with 195,000 barrels capacity or less as of December 31, 2017
Kirby is Well-Positioned in U.S. Coastal Markets
(1) Excludes five vessels over 250,000 barrels (2) Excludes the “750 class”, three ATBs with capacity of 327,000 barrels/ea. (3) Excludes nine ATBs with capacity of 200,000 barrels or greater

28
DISTRIBUTION AND SERVICES
United Holdings Kirby Engine Systems
Stewart & Stevenson
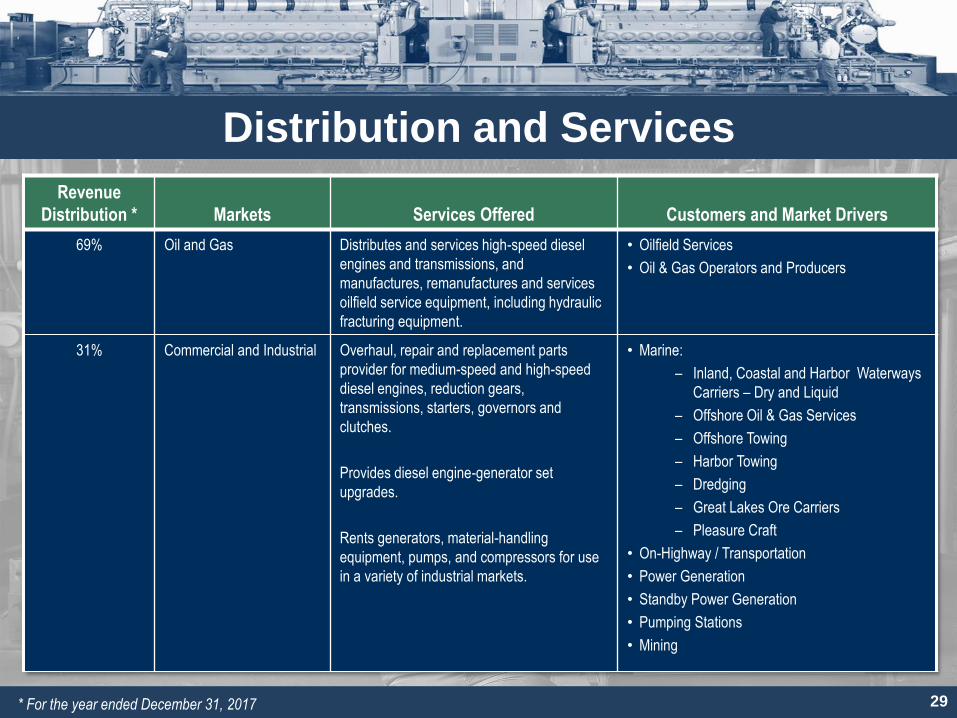
Distribution and Services
Revenue
Distribution *
Markets
Services Offered
Customers and Market Drivers
69% Oil and Gas Distributes and services high-speed diesel
engines and transmissions, and
manufactures, remanufactures and services
oilfield service equipment, including hydraulic
fracturing equipment.
• Oilfield Services
• Oil & Gas Operators and Producers
31% Commercial and Industrial Overhaul, repair and replacement parts
provider for medium-speed and high-speed
diesel engines, reduction gears,
transmissions, starters, governors and
clutches.
Provides diesel engine-generator set
upgrades.
Rents generators, material-handling
equipment, pumps, and compressors for use
in a variety of industrial markets.
• Marine:
– Inland, Coastal and Harbor Waterways
Carriers – Dry and Liquid
– Offshore Oil & Gas Services
– Offshore Towing
– Harbor Towing
– Dredging
– Great Lakes Ore Carriers
– Pleasure Craft
• On-Highway / Transportation
• Power Generation
• Standby Power Generation
• Pumping Stations
• Mining
* For the year ended December 31, 2017 29

Distribution and Services
30
Engines, Transmissions and Reduction Gears
Medium-Speed
– Electro-Motive Diesel (EMD)
– Cooper-Bessemer
– Nordberg
High-Speed
– Caterpillar
– Cummins
– MTU
– Detroit Diesel
– John Deere
– Isuzu
– Deutz
– Volvo Penta
Transmissions/
Reduction Gears
– Allison
– Falk
– Twin Disc

Oil and Gas Market
31
One of the largest distribution and services providers to the land-based
oil services market
Hydraulic fracturing technology has significantly expanded and reduced
the cost of producing U.S. natural gas and oil reserves
Manufacturer and remanufacturer of oilfield equipment used in the hydraulic
fracturing of shale formations
Approximate installed base of 13 million horsepower of frac equipment; most
require some form of major service every three to five years
Heavy duty cycle associated with fracturing drives need for service and parts
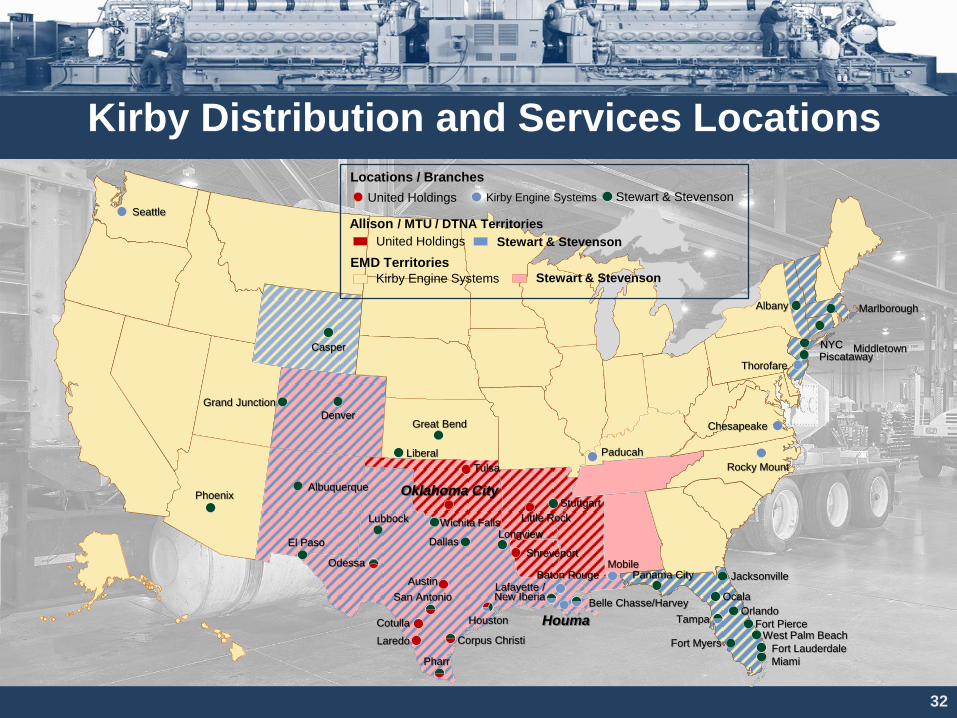
Kirby Distribution and Services Locations
32
Houston
Seattle
Chesapeake
Rocky Mount
Paducah
Tampa
Mobile Shreveport
Baton Rouge Lafayette / New Iberia
Belle Chasse/Harvey
Houma
Little Rock
Oklahoma City
Tulsa
Austin
San Antonio
Laredo
Pharr
Thorofare
Cotulla
Corpus Christi
Odessa
Marlborough
Middletown
Albany
NYC Piscataway
Fort Myers
Miami
Fort Lauderdale
West Palm Beach Fort Pierce
Orlando
Jacksonville
Ocala
Panama City
Stuttgart
Dallas Longview
Wichita Falls Lubbock
Great Bend
Liberal
Denver
Casper
Albuquerque
El Paso
Phoenix
Grand Junction
United Holdings Kirby Engine Systems Stewart & Stevenson
Locations / Branches
Allison / MTU / DTNA Territories
United Holdings Stewart & Stevenson
Kirby Engine Systems Stewart & Stevenson
EMD Territories
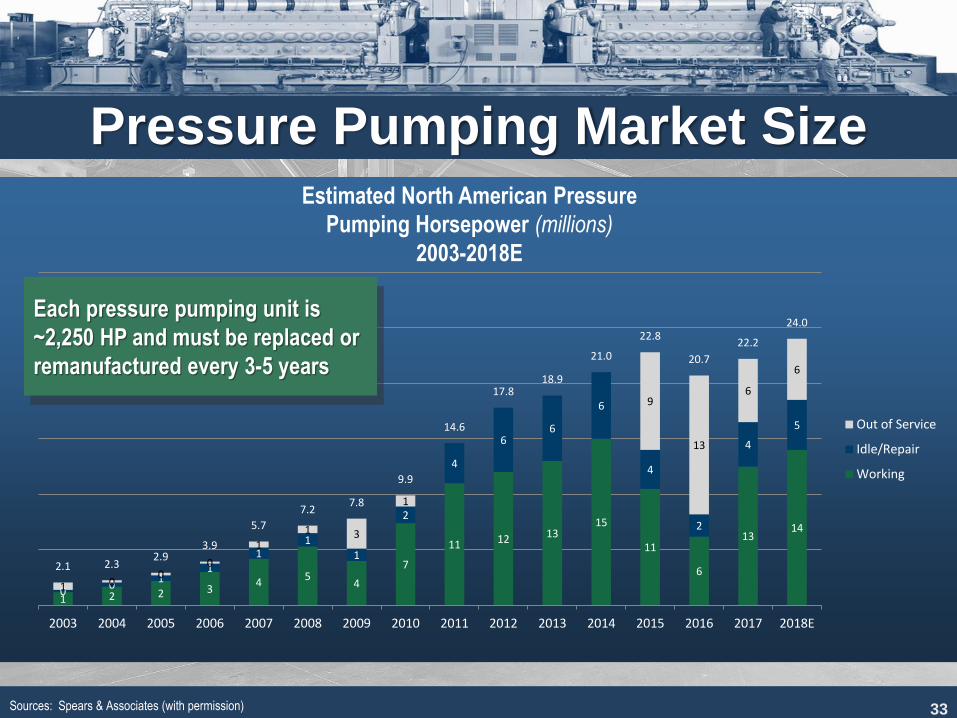
Pressure Pumping Market Size
33 Sources: Spears & Associates (with permission)
1 2 2 3 4
5 4
7
11 12 13 15
11
6
13 14
0 0
1 1
1 1
1
2
4
6 6
6
4
2
4
5
1 0 0
0
1
1 3
1
9
13
6
6
2.1 2.3 2.9
3.9
5.7
7.2 7.8
9.9
14.6
17.8 18.9
21.0
22.8
20.7
22.2
24.0
2003 2004 2005 2006 2007 2008 2009 2010 2011 2012 2013 2014 2015 2016 2017 2018E
Out of Service
Idle/Repair
Working
Each pressure pumping unit is
~2,250 HP and must be replaced or
remanufactured every 3-5 years
Estimated North American Pressure
Pumping Horsepower (millions)
2003-2018E

OUTLOOK
34

35
2018 Guidance Published 2018 first quarter guidance of $0.45 to $0.65(1) per share versus $0.51 for the 2017 first quarter
- Includes $0.08 to $0.12 per share benefit from tax reform
Published 2018 full year guidance of $2.50 to $3.00(1) per share versus to $1.99(2) per share for 2017 excluding one-
time items in the fourth quarter
- Includes $0.40 to $0.50 per share benefit from tax reform
Marine Transportation:
- Inland utilization in the low-90% to mid-90% range
- Coastal utilization in the low-80% to mid-80% range
- Continued pricing pressure on inland and coastal tank barge term contract renewals
- Potential pricing inflection in inland markets in H2 2018
Distribution and Services:
For the land-based market, expect continued demand for pressure pumping remanufacturing and
transmission overhauls, as well as new equipment sales
In the marine market, expect results to improve as customers can no longer afford critical engine overhauls
previously deferred
Power generation is expected to be similar to 2017
(1) Based on Kirby's most recently published earnings guidance in the January 31, 2018 press release announcing Q4 2017 earnings. That guidance is shown for convenience only and does not
constitute confirming or updating the guidance, which will only be done by public disclosure.
(2) 2017 earnings per share exclude a one-time deferred tax revaluation benefit of $4.83 per share, and non-recurring after-tax charges including impairments of marine vessels of $1.20 per share.

FINANCIAL HIGHLIGHTS
36

37
Financial Summary
(1) 2017 earnings per share exclude a one-time deferred tax revaluation benefit and non-recurring after-tax charges including impairments of marine vessels.
Income Statement FY 2017 FY 2016 $ %
Revenues:
Marine transportation $ 1,324.1 $ 1,471.9 $ (147.8) -10%
Distribution and services 890.3 298.8 591.5 198%
Total $ 2,214.4 $ 1,770.7 $ 443.7 25%
Operating income (loss):
Marine transportation $ 136.0 $ 257.1 $ (121.1) -47%
Distribution and services 86.6 3.1 83.5 2694%
Corporate expenses (18.2) (15.0) (3.2) 21%
Total $ 204.4 $ 245.2 $ (40.8) -17%
Net earnings:
Net earnings (GAAP) $ 313.2 $ 141.4 $ 171.8 121%
US tax reform and deferred tax liability remeasurement (269.4) - (269.4)
Impairment of long-lived assets 66.9 - 66.9
Adjusted net earnings (Non-GAAP)1 $ 110.7 $ 141.4 $ (30.7) -22%
GAAP earnings per share $ 5.62 $ 2.62 $ 3.00 115%
Adjusted earnings per share (Non-GAAP)1 $ 1.99 $ 2.62 $ (0.63) -24%
Change

Operating Margins
38
18.9% 18.4%
16.6%
14.6% 15.7%
17.4%
19.0%
21.1%
22.4% 23.6%
21.1% 21.9% 22.1%
23.8% 24.3%
22.5%
17.5%
10.3% 10.0% 10.1% 10.1%
9.5% 9.7%
11.7%
14.9% 15.6%
15.0%
10.5% 10.6% 10.4% 9.4%
8.1% 7.5%
3.9%
1.1%
9.7%
0%
5%
10%
15%
20%
25%
30%
2000 2001 2002 2003 2004 2005 2006 2007 2008 2009 2010 2011 2012 2013 2014 2015 2016 2017
Marine Transportation Distribution and Services
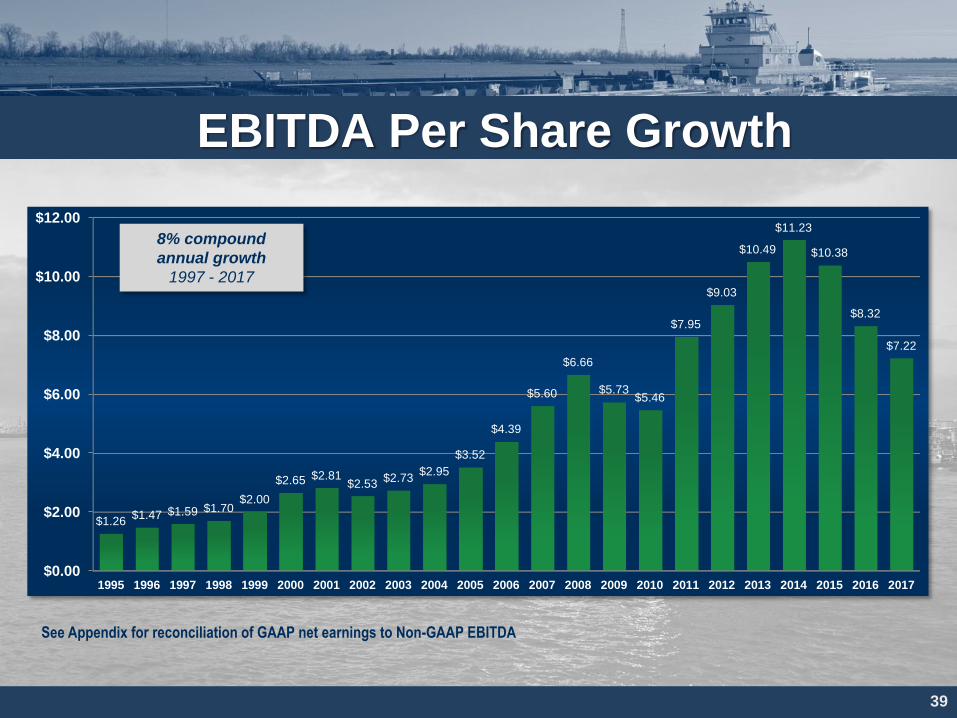
EBITDA Per Share Growth
39
See Appendix for reconciliation of GAAP net earnings to Non-GAAP EBITDA
$0.00
$2.00
$4.00
$6.00
$8.00
$10.00
$12.00
1995 1996 1997 1998 1999 2000 2001 2002 2003 2004 2005 2006 2007 2008 2009 2010 2011 2012 2013 2014 2015 2016 2017
$1.26 $1.47 $1.59 $1.70
$2.00
$2.65 $2.81 $2.53
$2.73 $2.95
$3.52
$4.39
$5.60
$6.66
$5.73 $5.46
$7.95
$9.03
$10.49
$11.23
$10.38
$8.32
$7.22
8% compound
annual growth
1997 - 2017

Cash Flows
40
Expansion Barges
$30
* Unaudited
$83 $97
$73
$112 $127
$142 $150
$236 $246
$319
$245
$312 $326
$601
$439
$524
$416
$353
$48 $59 $48
$72 $94
$122 $139
$164 $173 $193
$137
$226
$312
$253
$355 $345
$231
$177
$215
$0
$100
$200
$300
$400
$500
$600
$700
2000 2001 2002 2003 2004 2005 2006 2007 2008 2009 2010 2011 2012 2013 2014 2015 2016 2017 2018E
In M
illio
ns
Last
Published
Guidance
1
$1951
Operating cash flow Capital expenditures (ex-acquisitions)
(1) Based on Kirby's most recently published earnings guidance in the January 31, 2018 press release announcing Q4 2017 earnings. That guidance is shown for convenience only and does not constitute confirming or updating
the guidance, which will only be done by public disclosure.

0%
10%
20%
30%
40%
50%
60%
Q12001
Q12002
Q12003
Q12004
Q12005
Q12006
Q12007
Q12008
Q12009
Q12010
Q12011
Q12012
Q12013
Q12014
Q12015
Q12016
Q12017
Debt-to-Capital Ratio
of 31.5% post
Higman Acquisition
Capital Structure
41
50.4%
24.2%
Debt-to-Total Capital 2001 – 2017

Financial Strength
42
• Investment grade rating
– Standard & Poor’s: BBB, stable (following Higman acquisition)
– Moody’s: Baa2, negative outlook (following Higman acquisition)
• $500 million unsecured Private Placement
– $150 million 7-year maturity at 2.72% due 2/27/2020
– $350 million 10-year maturity at 3.29% due 2/27/2023
• $850 million Bank Revolving Credit Facility
– Maturity date of June 26, 2022
– ~$408MM outstanding as of February 2018
• $500 million 4.200% Senior Notes
– Maturity date of March 1, 2028
– Used to fund Higman Marine acquisition
WHY INVEST IN KIRBY?
43

Why Invest in Kirby?
44
Long-term record of success
Experienced management teams in both core businesses
Marine Transportation
U.S. feedstock position puts our refinery, chemical, and integrated major customers in a globally competitive position and is driving volume growth
75% of inland revenue under term contracts, of which approximately 51% are under time charters
80% of coastal revenue under term contracts, of which approximately 85% are under time charters
Approximately 70% of petrochemicals moved produce consumer nondurable goods
Distribution and Services Provides essential service to marine, land-based, power generation, and other industrial sectors
Largest geographic footprint of any U.S. distribution and service provider
Strong financial discipline and cash flow

Thank You For Listening to Our Story
Kirby Corporation Putting America’s
Waterways to Work
46
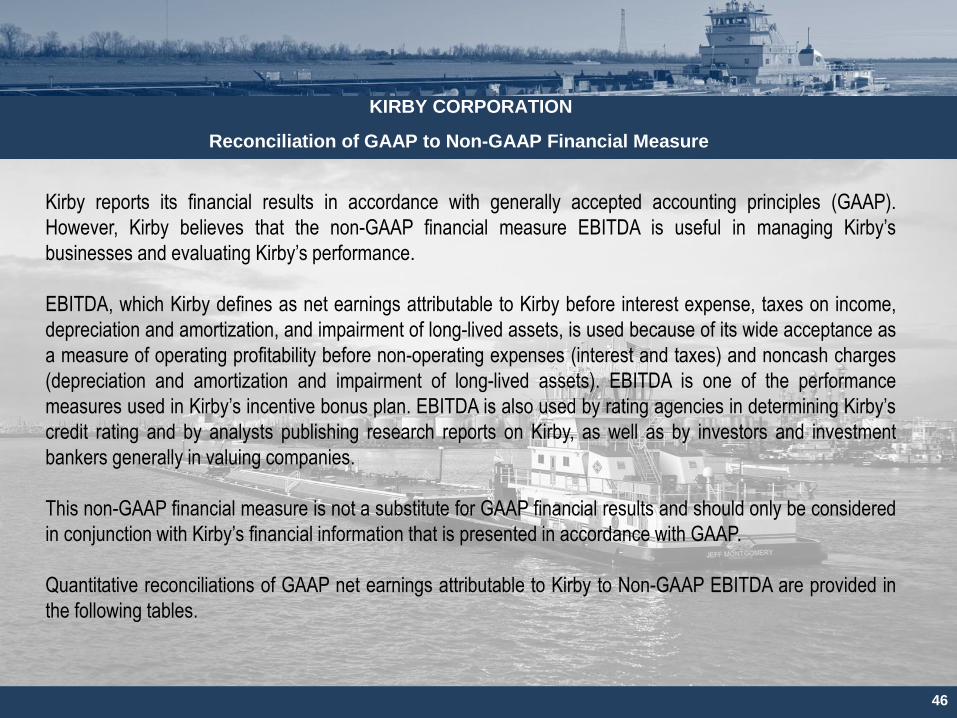
KIRBY CORPORATION
Reconciliation of GAAP to Non-GAAP Financial Measure
Kirby reports its financial results in accordance with generally accepted accounting principles (GAAP).
However, Kirby believes that the non-GAAP financial measure EBITDA is useful in managing Kirby’s
businesses and evaluating Kirby’s performance.
EBITDA, which Kirby defines as net earnings attributable to Kirby before interest expense, taxes on income,
depreciation and amortization, and impairment of long-lived assets, is used because of its wide acceptance as
a measure of operating profitability before non-operating expenses (interest and taxes) and noncash charges
(depreciation and amortization and impairment of long-lived assets). EBITDA is one of the performance
measures used in Kirby’s incentive bonus plan. EBITDA is also used by rating agencies in determining Kirby’s
credit rating and by analysts publishing research reports on Kirby, as well as by investors and investment
bankers generally in valuing companies.
This non-GAAP financial measure is not a substitute for GAAP financial results and should only be considered
in conjunction with Kirby’s financial information that is presented in accordance with GAAP.
Quantitative reconciliations of GAAP net earnings attributable to Kirby to Non-GAAP EBITDA are provided in
the following tables.

47
KIRBY CORPORATION
Reconciliation of GAAP Net Earnings Attributable to Kirby to Non-GAAP EBITDA
2017 2016 2015 2014 2013 2012 2011 2010 2009 2008
Net earnings attributable to Kirby 313.2$ 141.4$ 226.7$ 282.0$ 253.1$ 209.4$ 183.0$ 116.2$ 125.9$ 157.2$
Interest expense 21.5 17.7 18.8 21.5 27.9 24.4 17.9 11.0 11.1 14.1
Provision (benefit) for taxes on income (240.9) 85.0 133.7 169.8 152.3 127.9 109.3 72.3 78.0 97.4
Impairment of long-lived assets 105.7 - - - - - - - - -
Depreciation and amortization 202.9 200.9 192.2 169.3 164.4 145.2 126.0 95.3 94.0 91.2
EBITDA, Non-GAAP 402.4$ 445.0$ 571.4$ 642.6$ 597.7$ 506.9$ 436.2$ 294.8$ 309.0$ 359.9$
KIRBY CORPORATION
Reconciliation of GAAP Net Earnings Attributable to Kirby to Non-GAAP EBITDA
($ in millions)
48
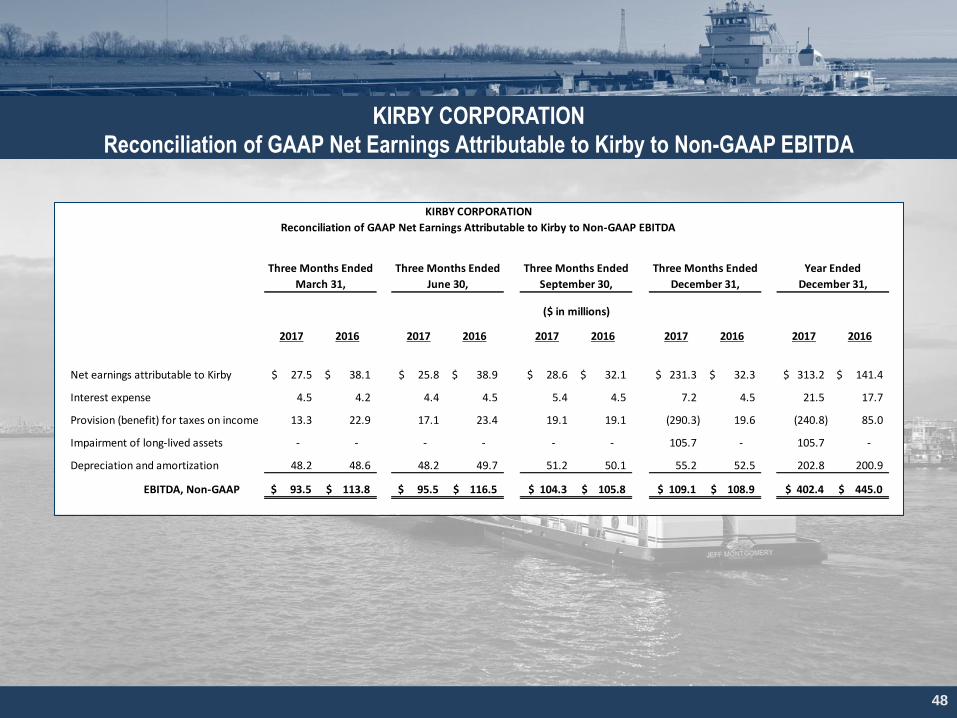
KIRBY CORPORATION
Reconciliation of GAAP Net Earnings Attributable to Kirby to Non-GAAP EBITDA
2017 2016 2017 2016 2017 2016 2017 2016 2017 2016
Net earnings attributable to Kirby 27.5$ 38.1$ 25.8$ 38.9$ 28.6$ 32.1$ 231.3$ 32.3$ 313.2$ 141.4$
Interest expense 4.5 4.2 4.4 4.5 5.4 4.5 7.2 4.5 21.5 17.7
Provision (benefit) for taxes on income 13.3 22.9 17.1 23.4 19.1 19.1 (290.3) 19.6 (240.8) 85.0
Impairment of long-lived assets - - - - - - 105.7 - 105.7 -
Depreciation and amortization 48.2 48.6 48.2 49.7 51.2 50.1 55.2 52.5 202.8 200.9
EBITDA, Non-GAAP 93.5$ 113.8$ 95.5$ 116.5$ 104.3$ 105.8$ 109.1$ 108.9$ 402.4$ 445.0$
KIRBY CORPORATION
Reconciliation of GAAP Net Earnings Attributable to Kirby to Non-GAAP EBITDA
($ in millions)
Three Months Ended
December 31,
Year Ended
December 31,March 31,
Three Months Ended Three Months Ended
June 30,
Three Months Ended
September 30,

49
KIRBY CORPORATION
MARINE TRANSPORTATION PERFORMANCE MEASUREMENTS
(1) Ton miles indicate fleet productivity by measuring the distance (in miles) a loaded inland tank barge is moved. Example: A typical 30,000 barrel inland tank barge loaded with 3,300 tons of liquid cargo is moved 100 miles, thus generating 330,000 ton miles. (2) Inland marine transportation revenues divided by ton miles. Example: 4th quarter 2017 inland marine revenues of $241,951,000 divided by 2,971,000,000 ton miles = 8.1 cents. (3) Towboats operated, is the average number of owned and chartered inland towboats operated during the period. (4) Delay days measures the lost time incurred by an inland tow (inland towboat and one or more inland tank barges) during transit. The measure includes transit delays caused by weather, lock congestion and other navigational factors.
2009 2010 2011 2012 2013 2014 2015
Year Year Year Year Year Year Year 1st
Q 2nd
Q 3rd
Q 4th
Q Year 1st
Q 2nd
Q 3rd
Q 4th
Q Year
Inland Performance
Measurements:
Ton miles (in millions) (1)
11,977 12,957 13,414 12,224 11,754 13,088 12,502 2,748 2,792 2,648 2,973 11,161 2,977 2,818 2,753 2,971 11,519
Revenues/Ton mile (cents/tm) (2)
7.1 6.8 7.6 8.9 9.8 8.8 8.7 8.9 8.8 8.6 7.7 8.5 8.0 7.9 8.0 8.1 8.0
Towboats operated (3)
220 221 240 245 256 251 248 240 241 227 230 234 235 220 215 227 224
Delay days (4)
5,201 5,772 6,777 6,358 7,843 7,804 7,924 2,236 2,035 929 2,078 7,278 2,267 1,367 1,965 1,978 7,577
2016 2017

$135+ Billion of U.S. Petrochemical Investments*
Sources: ICIS, Company announcements, Kirby Corp. *Notes: Date reflects anticipated year in-service, red font reflects construction in progress, green online, unk=unknown
Corpus Christi/Point Comfort, TX Cost ($MM)
Celanese-Mitsui 2020 New methanol 800 Exxon-SABIC JV 2020 New ethylene/derivatives 9,300 Formosa 2018 New polyethylene / MEG 5,000
Formosa 2018 New ethylene 1,700 Formosa 2018 New LD polyethylene
Formosa 2020-21 New PDH
LyondellBasell 2017 Ethylene expansion 350
M&G Group 2018 New PET/PTA 1,000
Oxy/Mexichem J 2017 New ethylene (2 units) 1,500
Freeport – Old Ocean, TX Cost ($MM)
BASF-Yara 2018 New ammonia 600
CP Chemical 2018 New polyethylene 6,000
Dow 2016 New PDH 6,000
Dow 2017 New ethylene
Dow 2017 Polyethylene exp. Dow/MEGlobal JV 2019 Monoethylene Glycol 1,100
Iowa Cost ($MM)
Orascom (OCI) 2017 New fertilizer 3,000
CF Industries 2016 Ammonia expansion 1,900
Pacific Northwest Cost ($MM)
NW Innovation 2020 New methanol 3,600
Tesoro 2018-19 New xylene 400
Houston Ship Channel and surrounding TX Cost ($MM)
Celanese-Mitsui 2015 New methanol 800 Celanese-Mitsui TBD New methanol unk
Celanese 2018 Acetic /VAM expansion unk
Celanese 2018 New methanol unk
CP Chemical 2018 New ethylene (80% done) 5,000
CP Chemical 2017 PAO expansion unk
Enterprise 2017 New PDH unk
Enterprise 2019 New isobutylene 3,000 Exxon Mobil Exxon Mobil
2018
2017 New ethylene
New polyethylene 3,000
unk Flint Hills /Koch TBD New PDH unk
Fund Connell 2019 Methanol expansion 4,500
Ineos/Sasol JV 2018 New polyethylene unk Ineos 2017 Ethylene debottleneck unk
Ineos 2019 New Polyalphaolephin unk
LyondellBasell 2016 Tri-ethylene glycol exp. unk
LyondellBasell 2015 Propylene debottleneck 20 LyondellBasell 2021 Propylene oxide/TBA 2,400 LyondellBasell TBD Polypropylene/PDH 2,000 LyondellBasell 2019 New HDPE 700 LyondellBasell 2017 Ethylene expansion 170
TOTAL/Nova/ Borealis JV
2020 New polyethylene unk
Oklahoma Cost ($MM)
Koch Early -2018 Urea expansion 1,300
LSB Ind. 2016 New ammonia 275
Beaumont/Orange, TX Cost ($MM)
Exxon Mobil 2019 Polyethylene exp. unk
Flint Hills/Koch 2016 Ethylene expansion unk
Huntsman 2016 Ethylene oxide exp. 125
LANXESS 2016 Butadiene rubber unk
Natgasoline (OCI-G2X JV)
Early-2018 New methanol 1,000
TOTAL/Nova/ Borealis JV
2020 Ethylene expansion 1,700
Ohio Cost ($MM)
PTT Global Chem 2021 New ethylene 5,700
PBF 2015 Aromatics exp unk
50
Kentucky Cost ($MM)
Westlake 2017 Ethylene exp. unk
Indiana Cost ($MM)
Midwest Fert. 2022 New ammonia 2,800
Charleston, WV Cost ($MM)
US Methanol 2018 New methanol unk US Methanol TBD New methanol unk
Mobile, AL Cost ($MM)
Huntsman Chem. 2016 Epoxy expansion 65
Baton Rouge – New Orleans Corridor, LA Cost ($MM)
BASF Castleton
2016 2018
Butanediol exp. New methanol
Unk 1,200
CF Industries 2016 Ammonia expansion 1,900
CF Industries 2016 New UAN 1,900
Dow 2017 New polyolefin (2) 2,000 Dyno Nobel 2016 New ammonia 1,000
Eurochem 2018-19 New ammonia 1,500
Formosa 2021 New ethylene 9,400 IGP Methanol 2021 New methanol 4,600 Methanex 2015 Methanol migration 850
Methanex 2015 Methanol migration 550
Shell 2018 New alpha olefins 717
Shintech 2018-19 New EDC/ethylene 1,400
S. LA Methanol 2018-19 New methanol 1,300
Syngas Energy 2020 New methanol 360
Yuhuang Chem 2018 New methanol 1,850
Lake Charles, LA Cost ($MM)
WLK/Lotte JV 2019 New ethylene/MEG 3,000
Dow 2015 Ethylene expansion 1,060 LCM 2021 New methanol 3,800
Indorama 2018 Ethylene restart 175
G2X 2018 Methanol-to-gasoline 1,600
Sasol Sasol
2019
2019
New ethylene New polyethylene
11,000
Westlake 2016 Ethylene expansion 330
Monaca, PA
Cost ($MM)
Shell 2020 New ethylene 6,000

0
500
1,000
1,500
2,000
2,500
2016 2017 2018 2019 2020 2021 2022
51
U.S. Ethylene Feedslate Forecast
Source: Petral Consulting Company, Long Term Forecast to 2022, December 2017
Ethylene Feedstock Volume Thousands of Barrels per Day
Ethane Growth 43%
5-Year CAGR 7%
Product, 2017-2022 Growth and CAGR:
Propane Growth 4%
5-Year CAGR 1%
Butane Growth 8%
5-Year CAGR 1%
Naptha & Gasoil
Growth -7% 5-Year CAGR -1%
~70% of current ethylene
production is from ethane

0
10
20
30
40
50
60
70
2016 2017 2018 2019 2020 2021 2022
All of these Ethylene Plant Coproducts are Moved by Tank Barge
Xylenes & Heavy Aromatics
Growth 11% 5-Year CAGR 2%
52
U.S. Ethylene Plant Coproduct Output
Source: Petral Consulting Company, Long Term Forecast to 2022, December 2017
Ethylene Plant Coproduct Output Millions of Pounds per Day
Propylene Growth 10%
5-Year CAGR 2%
Product, 2017-2022 Growth and CAGR:
Toluene Growth 7%
5-Year CAGR 1%
Benzene Growth 13%
5-Year CAGR 3%
Butadiene & Other C4
Growth 19% 5-Year CAGR 4%

53
Near-Term U.S. Ethylene and Derivative Capacity Additions
-
500
1,000
1,500
2,000
2,500
3,000
3,500
4,000
4,500
2016 2017 2018 2019 2020
mill
ion
to
ns
ann
ual
ly
Ethylene Capacity Derivative Capacity
Source: Bernstein Research (with permission) August 30, 2016
U.S. ethylene derivative capacity is expected to expand ~30% over the
next 5 years
~40% of new derivatives are products that are moved by water
Vinyl Acetate Monomer
1%
Polyethylene61%
Ethylene Oxide19%
Ethylene Dichloride
4%
Ethylbenzene0%
Alpha Olefins15%
Notes: Ethylbenzene – 99% used to make styrene; ethylene dichloride – a key feedstock in the production of PVC; ethylene oxide is a gas used as a raw material for innumerous applications, including cosmetics, fibers, lubricants, paint thinners and plasticizers and, while not carried by barge, the derivatives, such as ethylene glycol are; alpha olefins are building block chemicals; vinyl acetate monomer is used as a feedstock chemical for glues, fabrics, gels, insulation, paints, safety glass and certain plastics