Wachovia Securities 2006 Media and Communications Conference
Upload
cathleen-simonCategory
view
213download
0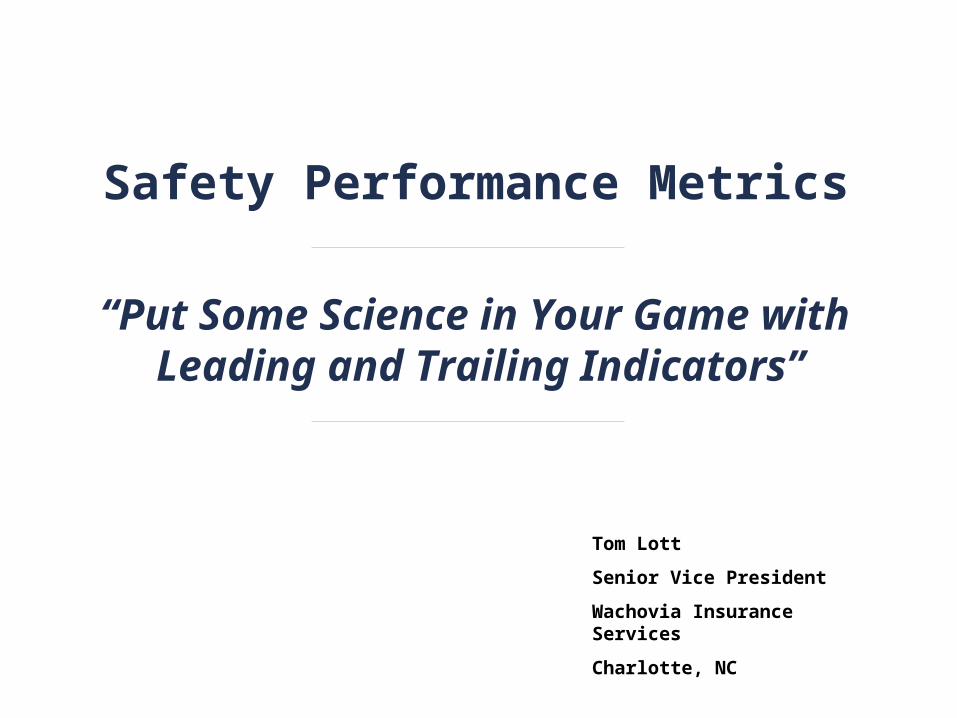
“Put Some Science in Your Game with Leading and Trailing Indicators”
Safety Performance Metrics
Tom Lott
Senior Vice President
Wachovia Insurance Services
Charlotte, NC
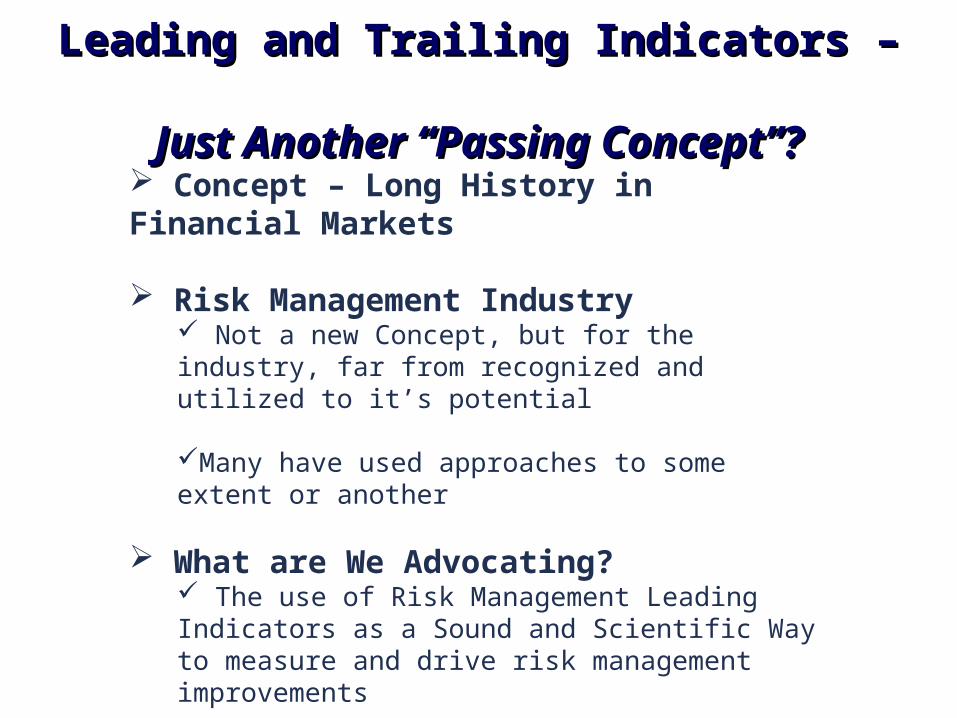
Leading and Trailing Indicators –Leading and Trailing Indicators – Just Another “Passing Concept”?Just Another “Passing Concept”?
Concept – Long History in Financial Markets
Risk Management Industry Not a new Concept, but for the industry, far from recognized and utilized to it’s potential
Many have used approaches to some extent or another
What are We Advocating? The use of Risk Management Leading Indicators as a Sound and Scientific Way to measure and drive risk management improvements
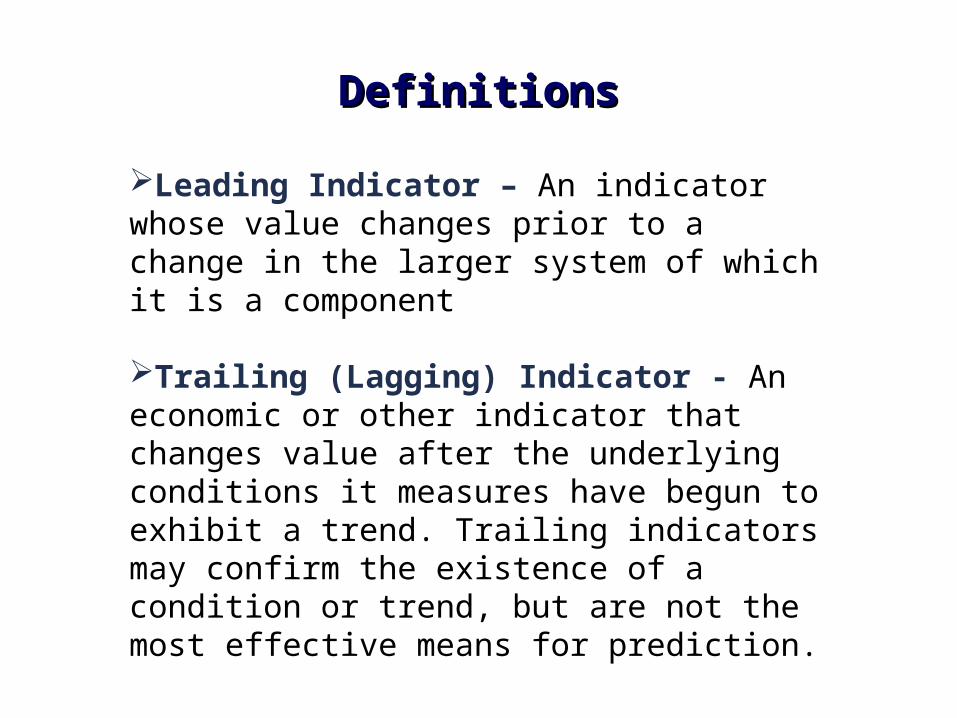
DefinitionsDefinitions
Leading Indicator – An indicator whose value changes prior to a change in the larger system of which it is a component
Trailing (Lagging) Indicator - An economic or other indicator that changes value after the underlying conditions it measures have begun to exhibit a trend. Trailing indicators may confirm the existence of a condition or trend, but are not the most effective means for prediction.

Engineering & Process Design
Training
Loss Prevention Practices
Corporate Culture and Commitment
People
Incident Response & Claims Management
Catastrophic Losses
LossesIncidents & Near Misses
LEADING INDICATORSLEADING INDICATORSTRAILING TRAILING
INDICATORSINDICATORS
““UPSTREAM”UPSTREAM” ““DOWNSTREAM”DOWNSTREAM”
The “Fishbone” TheoryThe “Fishbone” Theory

What Do Leading & Trailing What Do Leading & Trailing Indicators look Like in Action?Indicators look Like in Action?
0.0
1.0
2.0
3.0
4.0
5.0
1Q200
6
2Q200
6
3Q200
6
4Q200
6
1Q200
7
$0.00
$0.01
$0.02$0.03
$0.04
$0.05
$0.06Avg RMQScore
Total Costof Risk / $1 Revenue
Leading and Trailing Indicators
1Q2006 2Q2006 3Q2006 4Q2006 1Q2007
Avg RMQ Score 2.7 2.8 3.1 3.2 3.2
Total Cost of Risk / $1 Revenue $0.05 $0.05 $0.04 $0.035 $0.03
Correlation
Top Level Report Links Leading Indicators with
Trailing Indicators – Safety to Financial
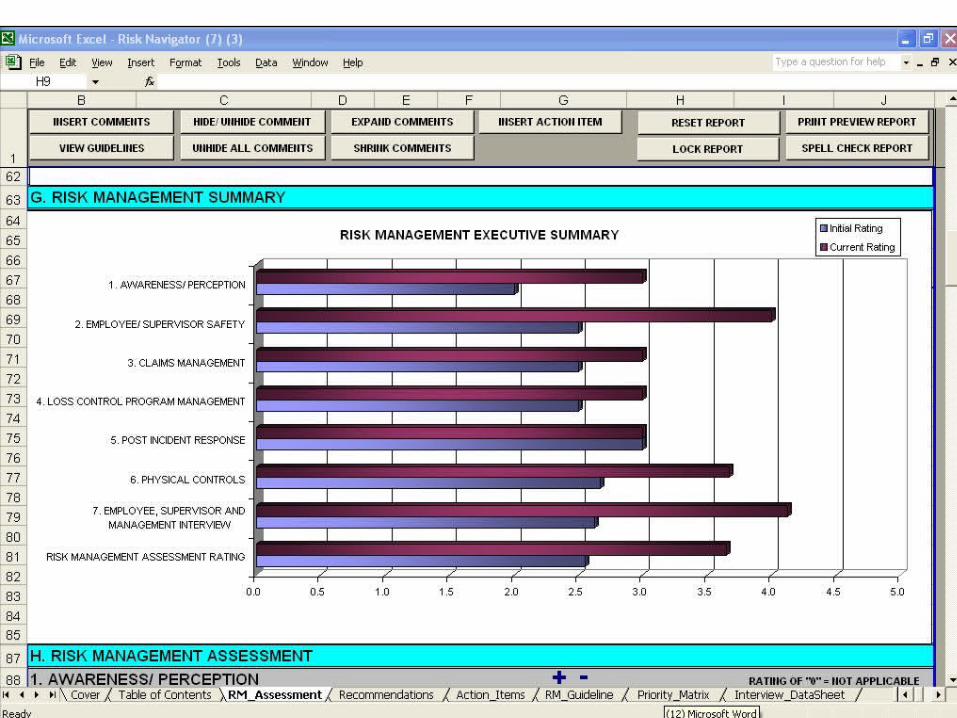

What Do RM Leading What Do RM Leading Indicators look Like?Indicators look Like?

What Do RM Leading & Trailing What Do RM Leading & Trailing Indicators look Like?Indicators look Like?
Category Stage 1Significant
Development issues
Stage 2 Concerns & Opportunitie
s
Stage 3Average
Performance
Stage 4Striving For Excellence
Stage 5Excellence
Measuring Employee Safety Performance
Safety goals and/or performance is not considered in the performance evaluations
There may be a section for safety performance, but it is not used pro-actively or consistently. It is having minimal influence on behavior and performance
Safety is considered in the appraisal through a specific area. There is generally feedback given.
Safety is measured through specific performance criteria. This area is given adequate weight in the overall performance and reward system. There is evidence of corrective action when performance is low.
There is an excellent program in place (Stage 4) and the program has been up and running for a year or more with strong results. Employees fully understand that safety is a critical area of job performance evaluation.
SAMPLE OF QUALITATIVE JUDGEMENT
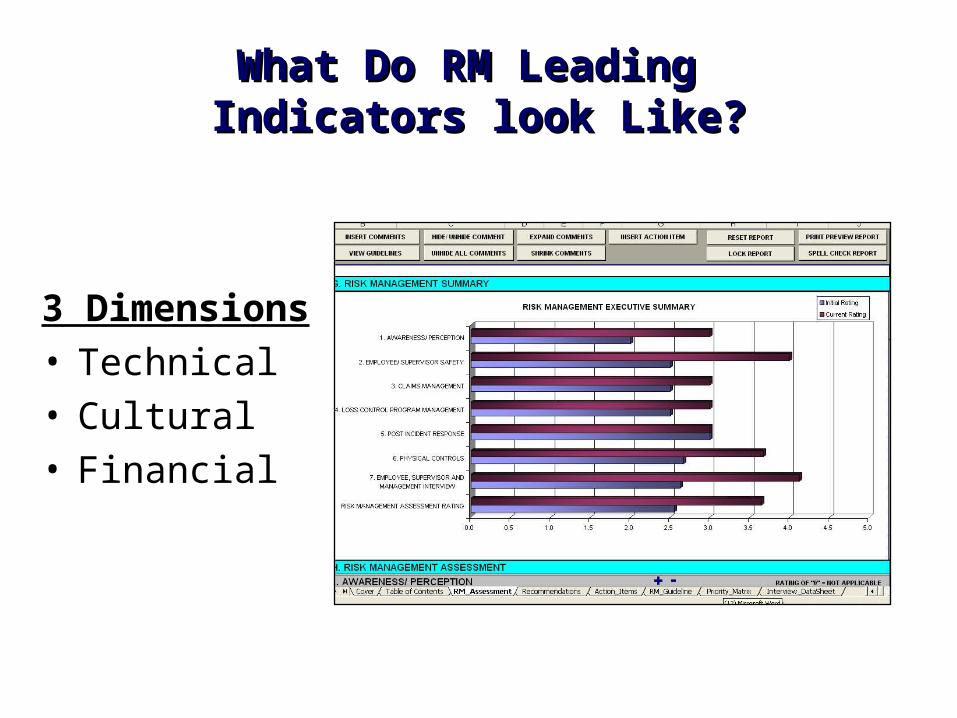
What Do RM Leading What Do RM Leading Indicators look Like?Indicators look Like?
3 Dimensions• Technical• Cultural• Financial
What Do RM Leading & What Do RM Leading & Trailing Trailing
Indicators look Like?Indicators look Like?
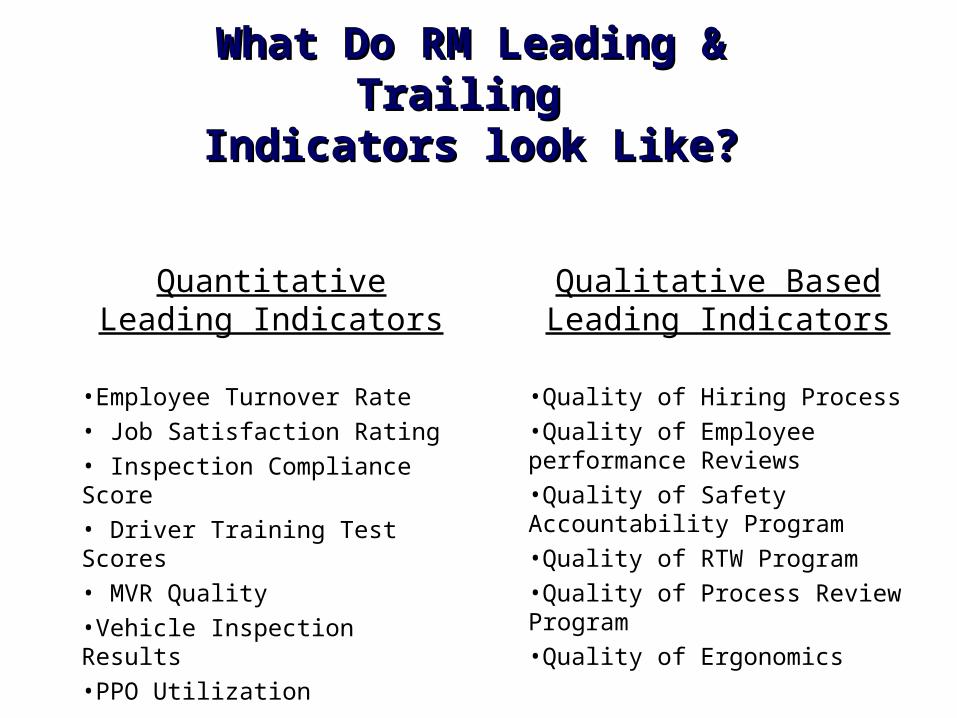
Quantitative Leading Indicators
•Employee Turnover Rate
• Job Satisfaction Rating
• Inspection Compliance Score
• Driver Training Test Scores
• MVR Quality
•Vehicle Inspection Results
•PPO Utilization
Qualitative Based Leading Indicators
•Quality of Hiring Process
•Quality of Employee performance Reviews
•Quality of Safety Accountability Program
•Quality of RTW Program
•Quality of Process Review Program
•Quality of Ergonomics
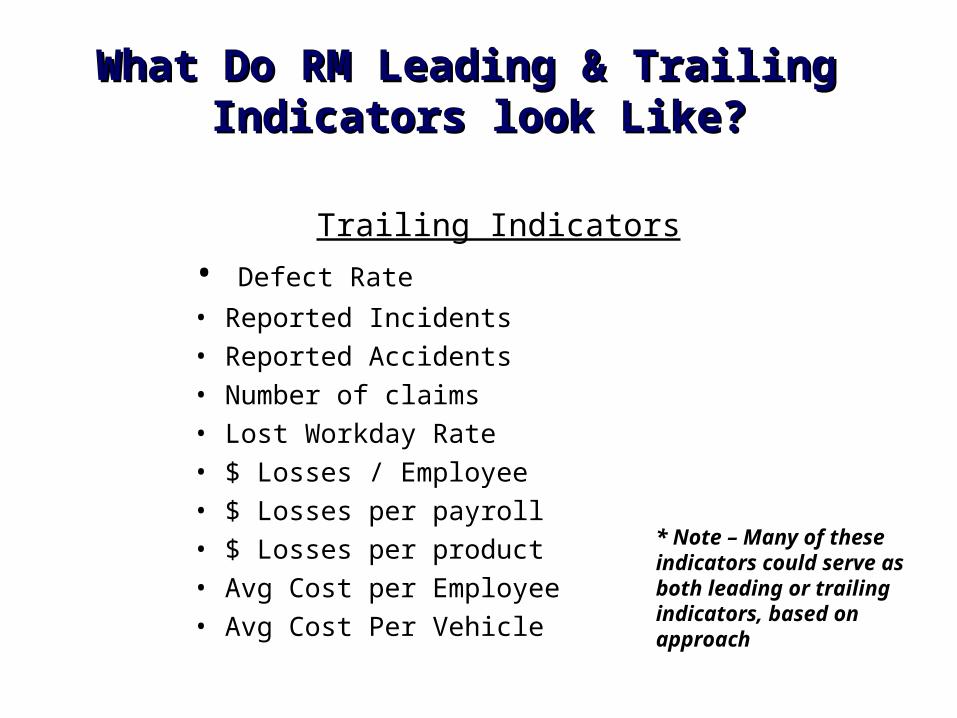
What Do RM Leading & Trailing What Do RM Leading & Trailing Indicators look Like?Indicators look Like?
Trailing Indicators
• Defect Rate
• Reported Incidents• Reported Accidents• Number of claims• Lost Workday Rate• $ Losses / Employee• $ Losses per payroll• $ Losses per product• Avg Cost per Employee• Avg Cost Per Vehicle
* Note – Many of these indicators could serve as both leading or trailing indicators, based on approach

Two Basic Types of Approaches depending on what you are trying to Improve:
Focused – Focus on a specific loss or exposure area (Slips/Falls)
Organizational – Broad application of loss and/or exposure areas
Getting StartedGetting Started

Building Your ApproachBuilding Your Approach
Key Selection Criteria Correlate Leading and Trailing Indicators “Peel Back” from Loss and Exposure Analysis, Accident
Investigations, etc. Thorough Analysis To Select Best Leading Indicators that
will drive positive change (Management Levers) Make this a group effort. People will own the issues and
actions. Continue on a Regular basis Be Comprehensive in Approach (Training w/out
enforcement won’t work) Warning: Watch what you Measure (ex. # good
performance reviews per manager) DRIVE ACCOUNTABILITY and CHAREBACK WITH
LEADING INDICATORS Continuously test, review and Adjust Indicators based on
Results.

What Do RM Leading & What Do RM Leading & Trailing Trailing
Indicators look Like? - Indicators look Like? - ExamplesExamples
Slip Fall Program – Restaurant Chain
•Engineering– Floor Design– Floor Condition– Signs & Warning– Maintenance and Cleaning
• Employees– Training– Accountability– Shoe Program
• Post Incident– Investigation– Claims Management

• Be the Facilitator
• Get Good Cross Section of Organization
• Power of the Employee Interviews
• Managing Expectations
• Using the Guidelines to Determine Next Steps
Importance of the Importance of the AssessmentsAssessments
• Get Group Focused on Outcomes
• Build into Management Accountability
• Use in Chargeback Systems
• Correlate to Overall Results
Using the ResultsUsing the Results

Summary of Key ConceptsSummary of Key ConceptsFocus on Risk Management Quality Leading Indicators
(Culture, Engineering, Training, etc.) to Drive Down Trailing Indicators (Incidents, losses, etc.)
Choose Leading Indicators Carefully Thorough Causal Analysis of Past losses and Potential Exposures Choose indicators that will drive positive behaviors and
improvements Make sure they correlate to the trailing indicators Be comprehensive in approach (training w/out accountability is
worthless)
Be Practical Must choose approach that fits with culture and needs of
organization Measure the “Big ticket” items – The ones that will cause the most
change in trailing indicators. Be outcome focused. (Change Employee Perception)

Questions & AnswersQuestions & Answers
For more information, contact:
Tom Lott
Senior Vice President
National Practices Leader
Wachovia Insurance Services
Charlotte, NC
704-805-6948