
Wachovia Securites Media & Communications Fixed Income Wachovia Securites Media & Communications...
33
Wachovia Securites Wachovia Securites Media & Communications Media & Communications Fixed Income Fixed Income Conference April 14, 2004 April 14, 2004
Transcript of Wachovia Securites Media & Communications Fixed Income Wachovia Securites Media & Communications...
Wachovia SecuritesWachovia Securites
Media & Communications Media & Communications Fixed Income Fixed Income Conference
April 14, 2004April 14, 2004
Mark E. StephanMark E. StephanExecutive Vice President,Executive Vice President,
Chief Financial Officer and TreasurerChief Financial Officer and Treasurer
Safe Harbor Statement
Any statements in this presentation that are not historical facts are forward-Any statements in this presentation that are not historical facts are forward-
looking statements. The words “plan”, “believe”, “expect”, “anticipate”, looking statements. The words “plan”, “believe”, “expect”, “anticipate”,
“estimate” and other expressions that indicate future events and trends identify “estimate” and other expressions that indicate future events and trends identify
forward-looking statements. These forward-looking statements are subject to forward-looking statements. These forward-looking statements are subject to
certain risks and uncertainties that could cause actual results to differ materially certain risks and uncertainties that could cause actual results to differ materially
from historical results or those anticipated. Factors that could have a material from historical results or those anticipated. Factors that could have a material
and adverse impact on actual results are described in the reports and and adverse impact on actual results are described in the reports and
documents Mediacom files from time to time with the Securities and Exchange documents Mediacom files from time to time with the Securities and Exchange
Commission. Mediacom undertakes no obligation to publicly release the results Commission. Mediacom undertakes no obligation to publicly release the results
of any revisions to these forward-looking statements to reflect events or of any revisions to these forward-looking statements to reflect events or
circumstances after today or to reflect the occurrence of unanticipated events.circumstances after today or to reflect the occurrence of unanticipated events.
Company Overview
Network upgrades complete
Launching enhanced broadband products
Redefining our market opportunity
Dramatic improvement in unlevered FCF

Powerful Broadband Network
98% of network upgraded
95% of customers served by 50 largest
headends
Network Capacity Network Scale
95%98%
Cedar Rapids
Moline
Minneapolis
Charleston
Springfield
Peoria
South BendDes Moines
Carbondale
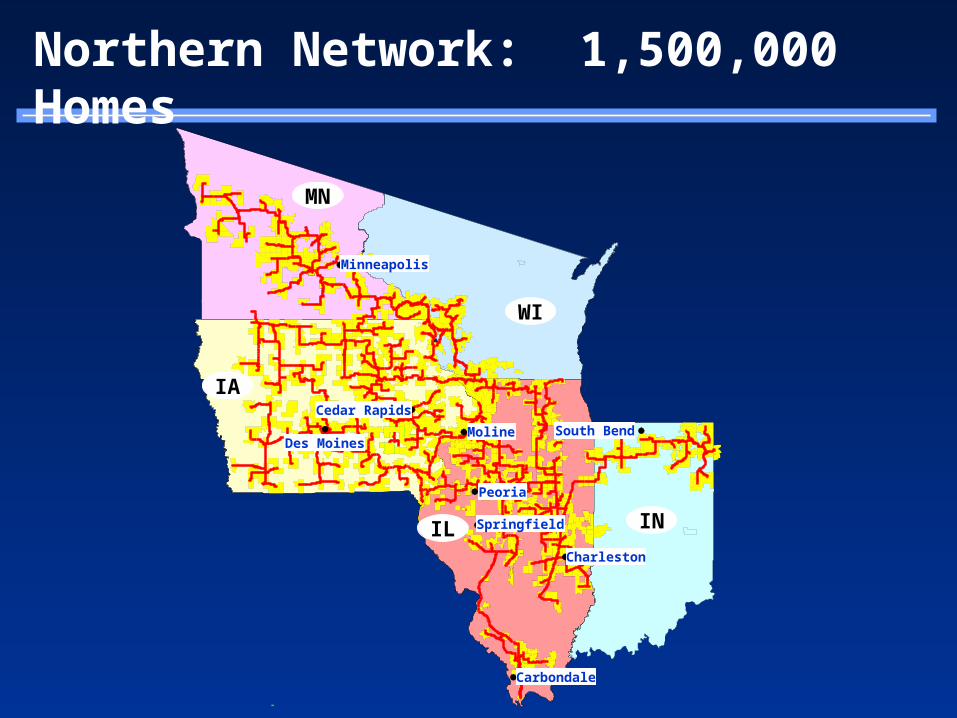
Northern Network: 1,500,000 Homes
MN
WI
IA
IL IN
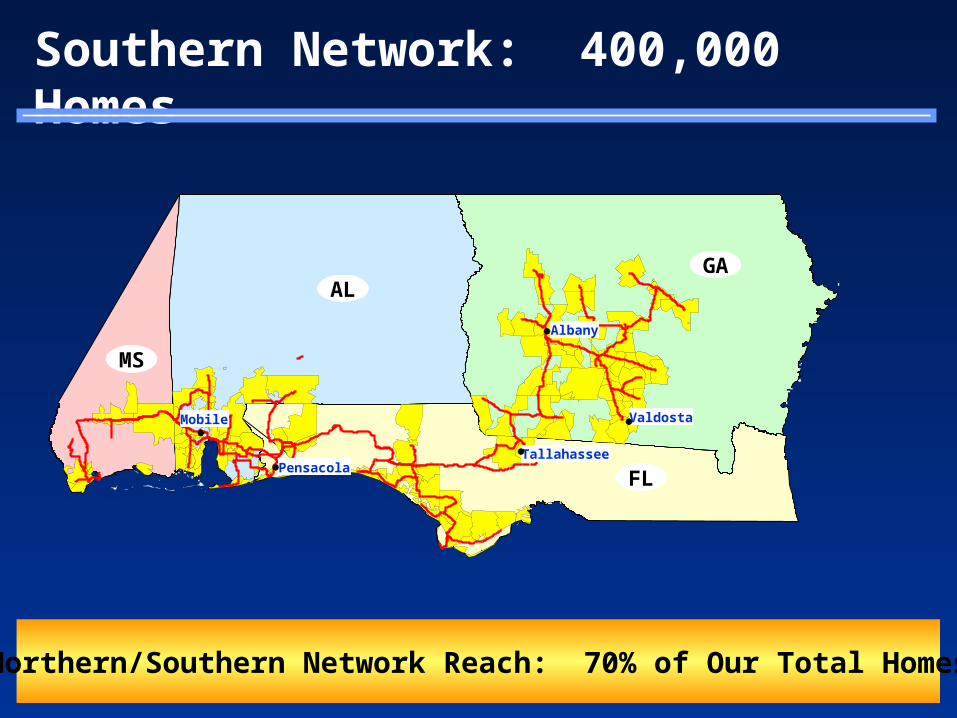
Northern/Southern Network Reach: 70% of Our Total Homes
Southern Network: 400,000 Homes
Mobile
Pensacola
Albany
Valdosta
Tallahassee
MS
FL
GAAL
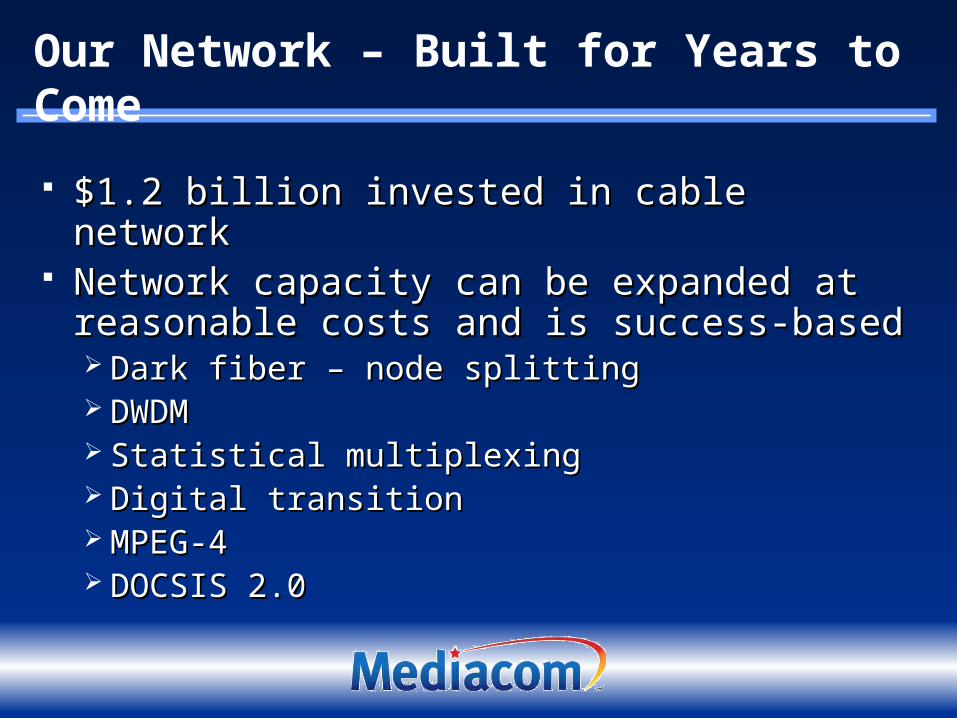
Our Network – Built for Years to Come
$1.2 billion invested in cable network$1.2 billion invested in cable network Network capacity can be expanded at Network capacity can be expanded at
reasonable costs and is success-basedreasonable costs and is success-based Dark fiber – node splittingDark fiber – node splitting DWDMDWDM Statistical multiplexingStatistical multiplexing Digital transitionDigital transition MPEG-4MPEG-4 DOCSIS 2.0DOCSIS 2.0
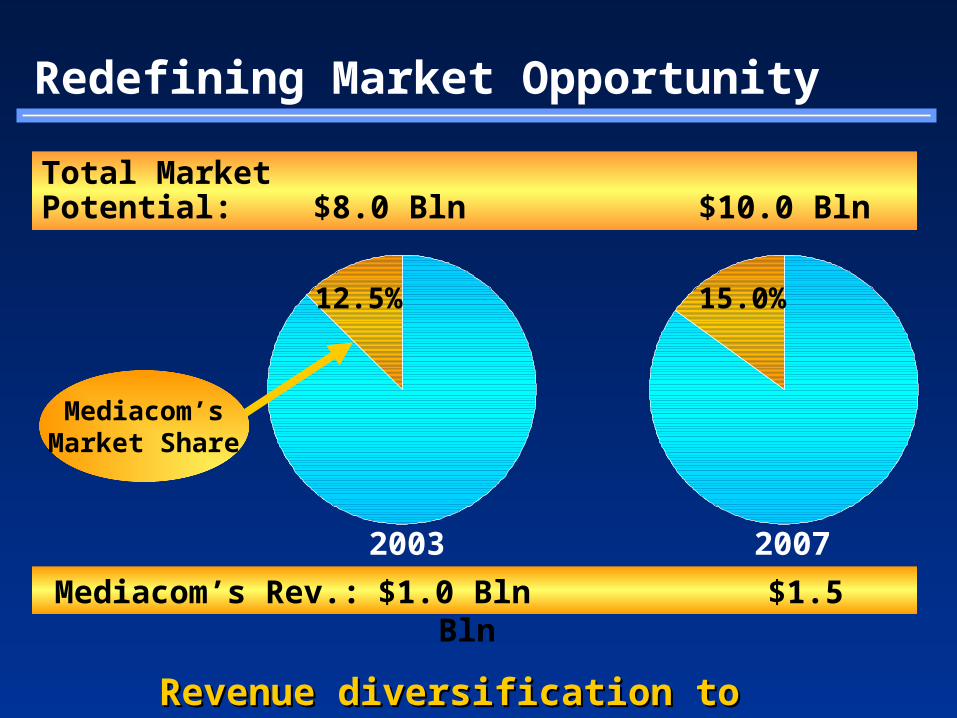
Total Market Potential: $8.0 Bln $10.0 Bln
Redefining Market Opportunity
2003 2007
15.0%12.5%
Mediacom’s Rev.: $1.0 Bln $1.5 Bln
Revenue diversification to accelerateRevenue diversification to accelerate
Mediacom’sMarket Share
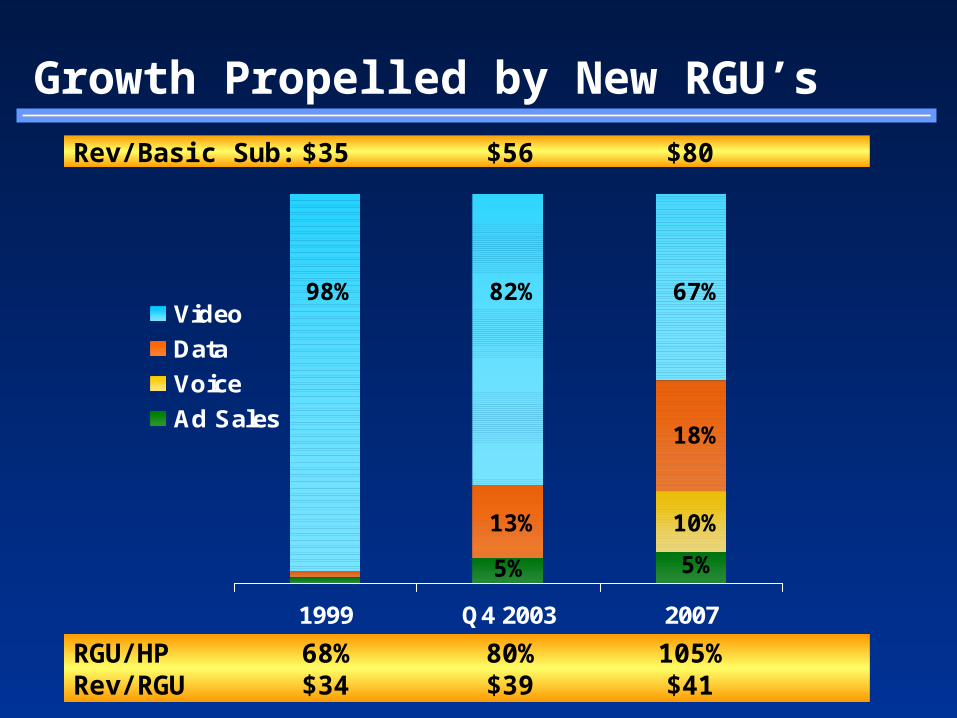
Growth Propelled by New RGU’s
1999 Q4 2003 2007
Video
Data
Voice
Ad Sales
Rev/Basic Sub: $35 $56 $80
RGU/HP 68% 80% 105%Rev/RGU $34 $39 $41
98% 82% 67%
18%
13%
5%5%
10%
2004 Operational Objectives
Enhance video offerings
Continue to invest in localism and customer care
Strengthen HSD product line
Expand commercial data business
Launch VoIP telephony
Core Video Strategy
Continue competitive response to DBS
Leverage our broadband network’s strengths via product enhancements
Intensify retention and customer care efforts
Re-qualify customer base/market footprint
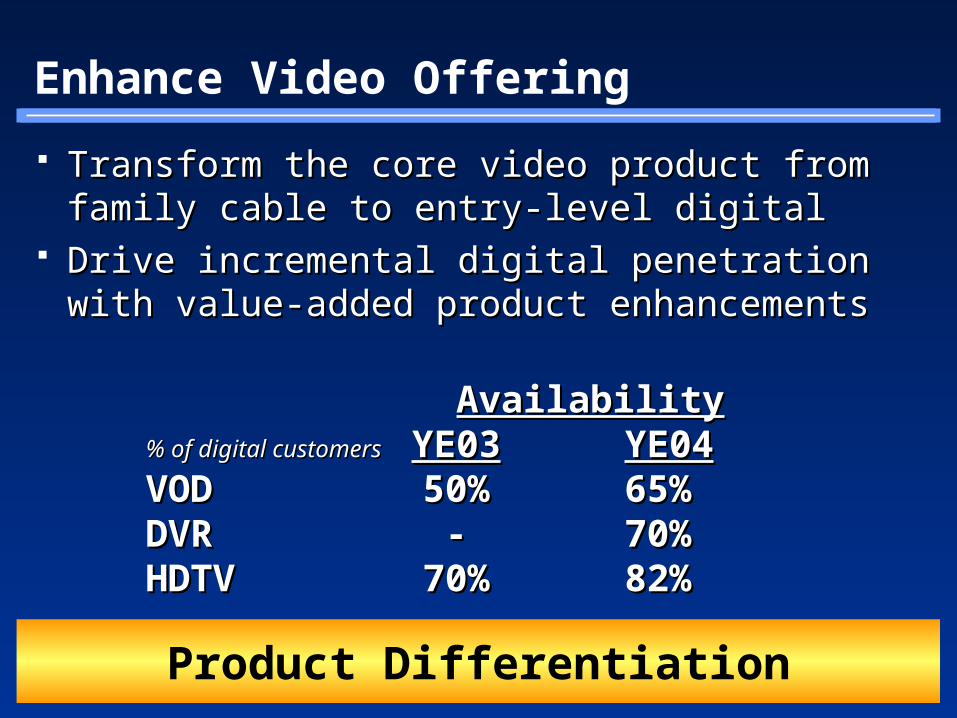
Enhance Video Offering
Transform the core video product from Transform the core video product from family cable to entry-level digitalfamily cable to entry-level digital
Drive incremental digital penetration with Drive incremental digital penetration with value-added product enhancementsvalue-added product enhancements
AvailabilityAvailability% of digital customers% of digital customers YE03YE03 YE04YE04VODVOD 50%50% 65%65%DVRDVR -- 70%70%HDTVHDTV 70%70% 82%82%
Product Differentiation
Localism and Customer Care: Priority #1
Localism is our critical advantage Virtual Contact Center initiative enables re-
routing of calls among call centers Instant access to customer records and
company product information Improves employee productivity
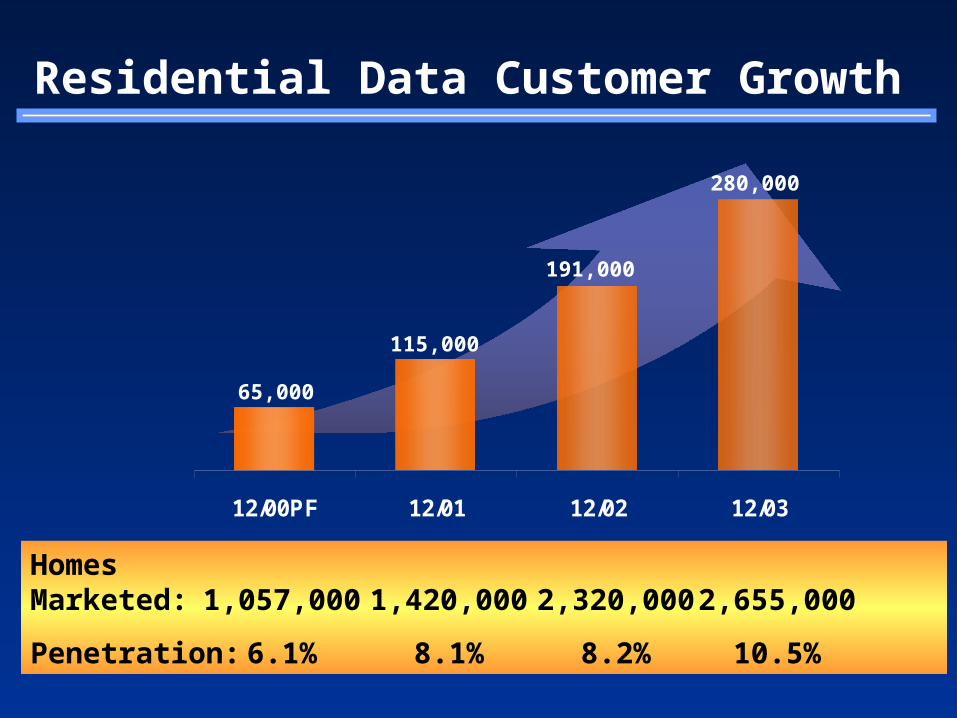
Residential Data Customer Growth
HomesMarketed: 1,057,000 1,420,000 2,320,000 2,655,000
Penetration: 6.1% 8.1% 8.2% 10.5%
12/00PF 12/01 12/02 12/03
65,000
280,000
191,000
115,000
Strengthen HSD Product Line
Flagship product speeds at 3MBFlagship product speeds at 3MB 5MB residential product for heavy users5MB residential product for heavy users ““Lite” product launchLite” product launch Capitalize on comparative advantagesCapitalize on comparative advantages
Core product available to over 95% of footprintCore product available to over 95% of footprint Constrained DSL availabilityConstrained DSL availability
Expand Commercial Data Business
Dedicated in-house division Dedicated in-house division Naturally positioned with regional networks Naturally positioned with regional networks Over 500,000 small- and medium-sized Over 500,000 small- and medium-sized
businesses in our marketsbusinesses in our markets Custom/turnkey high-speed Internet/dataCustom/turnkey high-speed Internet/data Enterprise Networks Powered by MediacomEnterprise Networks Powered by Mediacom
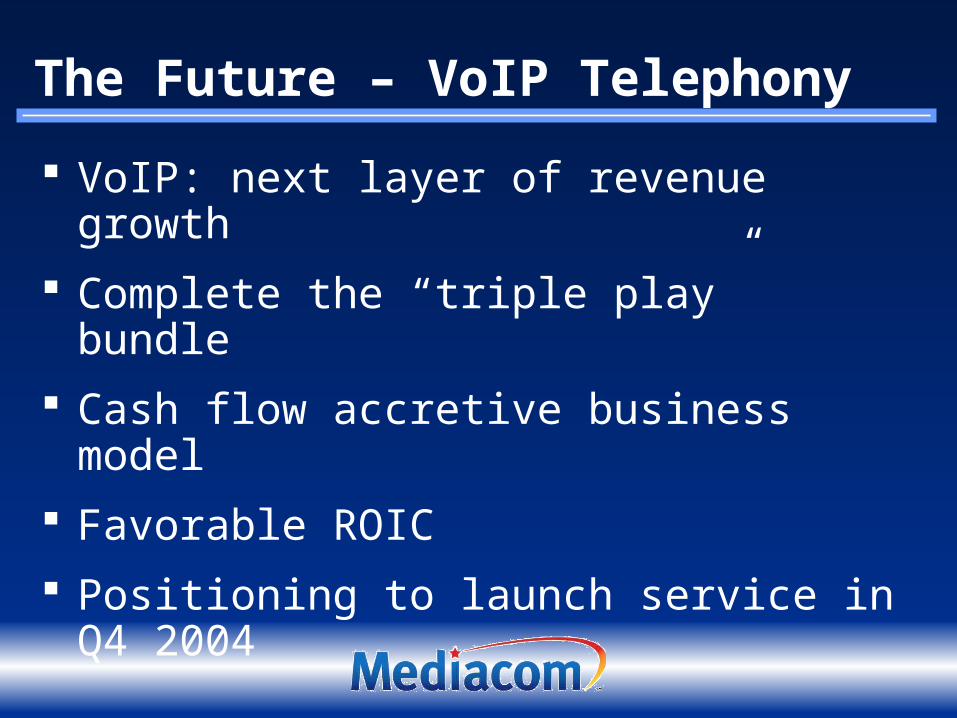
The Future – VoIP Telephony
VoIP: next layer of revenue growth
Complete the “triple play” bundle
Cash flow accretive business model
Favorable ROIC
Positioning to launch service in Q4 2004
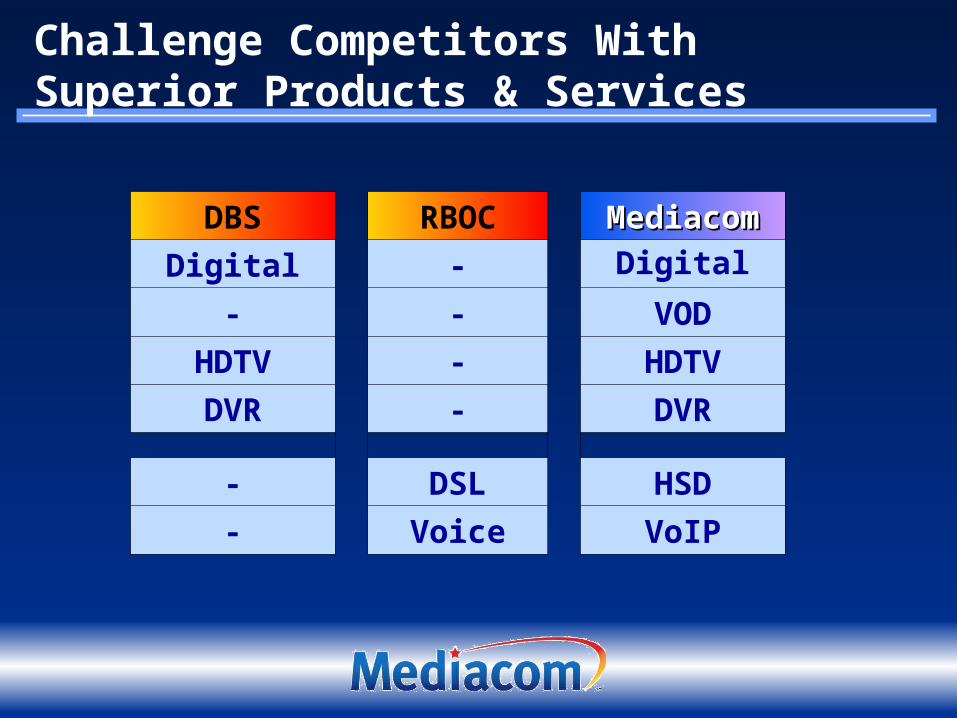
DBS RBOC MediacomMediacom
Digital - Digital
- - VOD
HDTV - HDTV
DVR - DVR
- DSL HSD
- Voice VoIP
Challenge Competitors With Superior Products & Services

FinancialFinancialOverviewOverview
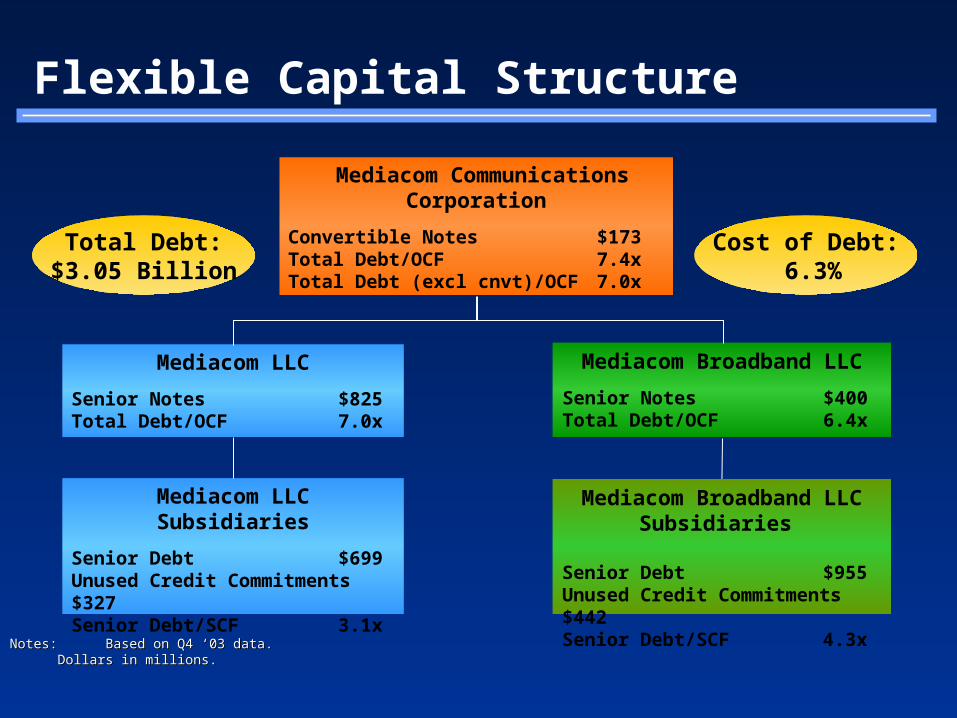
Flexible Capital Structure
Mediacom Broadband LLCSubsidiaries
Senior Debt $955Unused Credit Commitments $442Senior Debt/SCF 4.3x
Mediacom Broadband LLC
Senior Notes $400Total Debt/OCF 6.4x
Mediacom LLCSubsidiaries
Senior Debt $699Unused Credit Commitments $327Senior Debt/SCF 3.1x
Mediacom LLC
Senior Notes $825Total Debt/OCF 7.0x
Mediacom Communications Corporation
Convertible Notes $173Total Debt/OCF 7.4xTotal Debt (excl cnvt)/OCF 7.0x
Notes:Notes: Based on Q4 ‘03 data.Based on Q4 ‘03 data.Dollars in millions.Dollars in millions.
Total Debt:$3.05 Billion
Cost of Debt: 6.3%
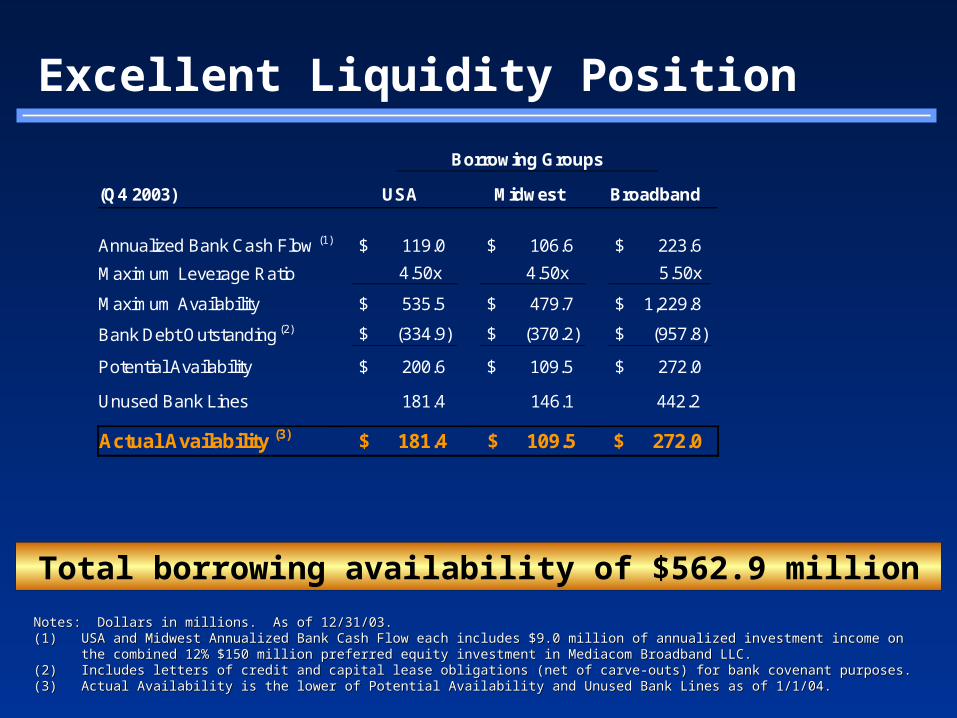
Excellent Liquidity Position
Borrowing Groups
(Q4 2003) USA Midwest Broadband
Annualized Bank Cash Flow (1) $ 119.0 $ 106.6 $ 223.6
Maximum Leverage Ratio 4.50x 4.50x 5.50x
Maximum Availability $ 535.5 $ 479.7 $ 1,229.8
Bank Debt Outstanding (2) $ (334.9) $ (370.2) $ (957.8)
Potential Availability $ 200.6 $ 109.5 $ 272.0
Unused Bank Lines 181.4 146.1 442.2
Actual Availability (3) $ 181.4 $ 109.5 $ 272.0
Notes: Dollars in millions. As of 12/31/03.Notes: Dollars in millions. As of 12/31/03.(1)(1) USA and Midwest Annualized Bank Cash Flow each includes $9.0 million of annualized investment income on the combined 12% $150 million USA and Midwest Annualized Bank Cash Flow each includes $9.0 million of annualized investment income on the combined 12% $150 million
preferred equity investment in Mediacom Broadband LLC.preferred equity investment in Mediacom Broadband LLC.(2)(2) Includes letters of credit and capital lease obligations (net of carve-outs) for bank covenant purposes.Includes letters of credit and capital lease obligations (net of carve-outs) for bank covenant purposes.(3)(3) Actual Availability is the lower of Potential Availability and Unused Bank Lines as of 1/1/04.Actual Availability is the lower of Potential Availability and Unused Bank Lines as of 1/1/04.
Total borrowing availability of $562.9 million
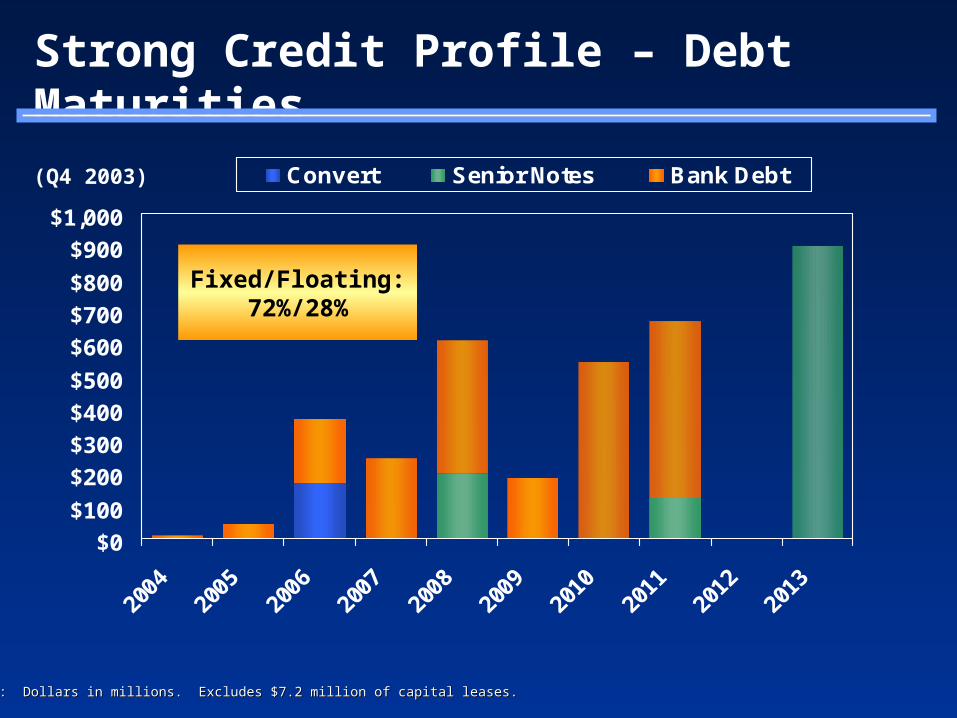
Strong Credit Profile – Debt Maturities
$0
$100
$200
$300
$400
$500
$600
$700
$800
$900
$1,000
Convert Senior Notes Bank Debt(Q4 2003)
Note: Dollars in millions. Excludes $7.2 million of capital leases.Note: Dollars in millions. Excludes $7.2 million of capital leases.
Fixed/Floating:72%/28%
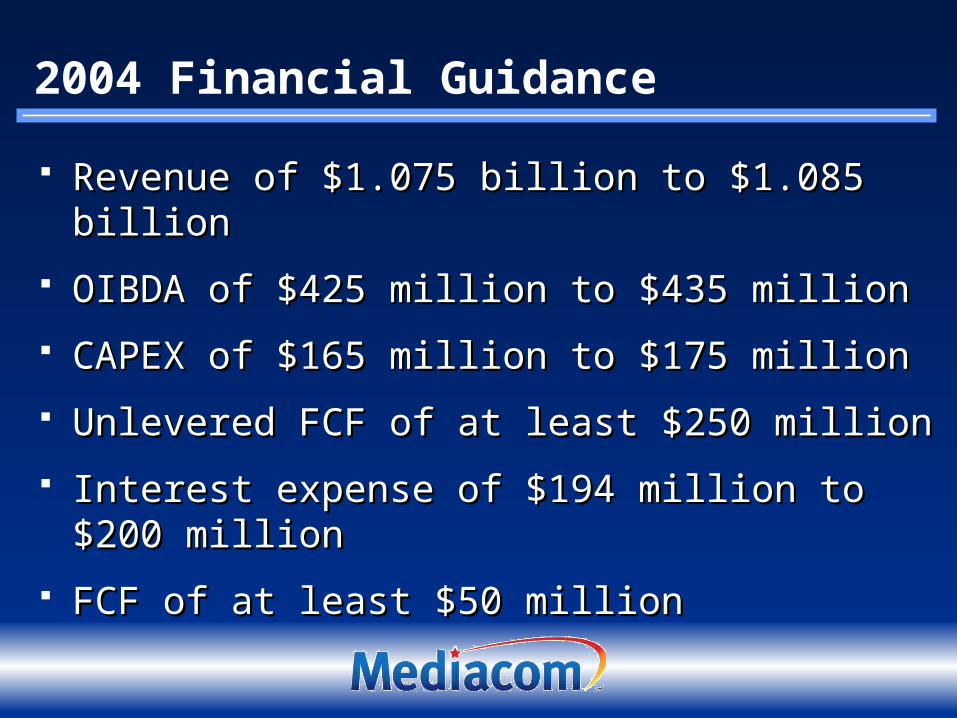
2004 Financial Guidance
Revenue of $1.075 billion to $1.085 billionRevenue of $1.075 billion to $1.085 billion
OIBDA of $425 million to $435 millionOIBDA of $425 million to $435 million
CAPEX of $165 million to $175 millionCAPEX of $165 million to $175 million
Unlevered FCF of at least $250 millionUnlevered FCF of at least $250 million
Interest expense of $194 million to $200 millionInterest expense of $194 million to $200 million
FCF of at least $50 millionFCF of at least $50 million
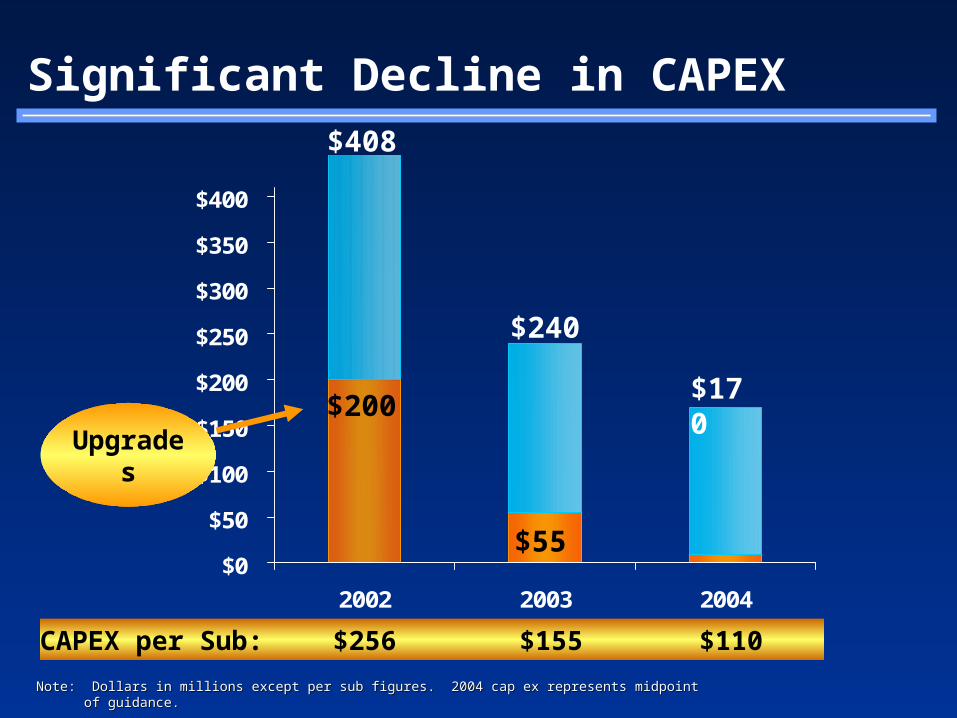
Significant Decline in CAPEX
$0
$50
$100
$150
$200
$250
$300
$350
$400
2002 2003 2004
$408
$240
$170
CAPEX per Sub: $256 $155 $110
Note: Dollars in millions except per sub figures. 2004 cap ex represents midpoint of guidance.Note: Dollars in millions except per sub figures. 2004 cap ex represents midpoint of guidance.
$200
$55
Upgrades
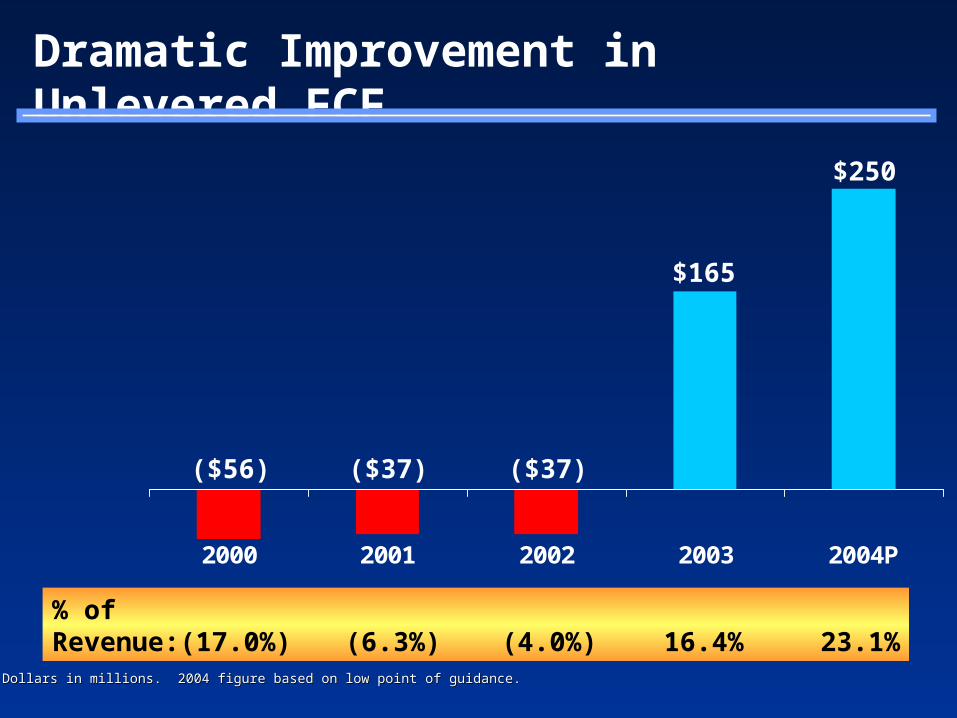
Dramatic Improvement in Unlevered FCF
2000 2001 2002 2003 2004P
($56)
$250
$165
($37)($37)
% ofRevenue: (17.0%) (6.3%) (4.0%) 16.4% 23.1%
Notes: Dollars in millions. 2004 figure based on low point of guidance. Notes: Dollars in millions. 2004 figure based on low point of guidance.
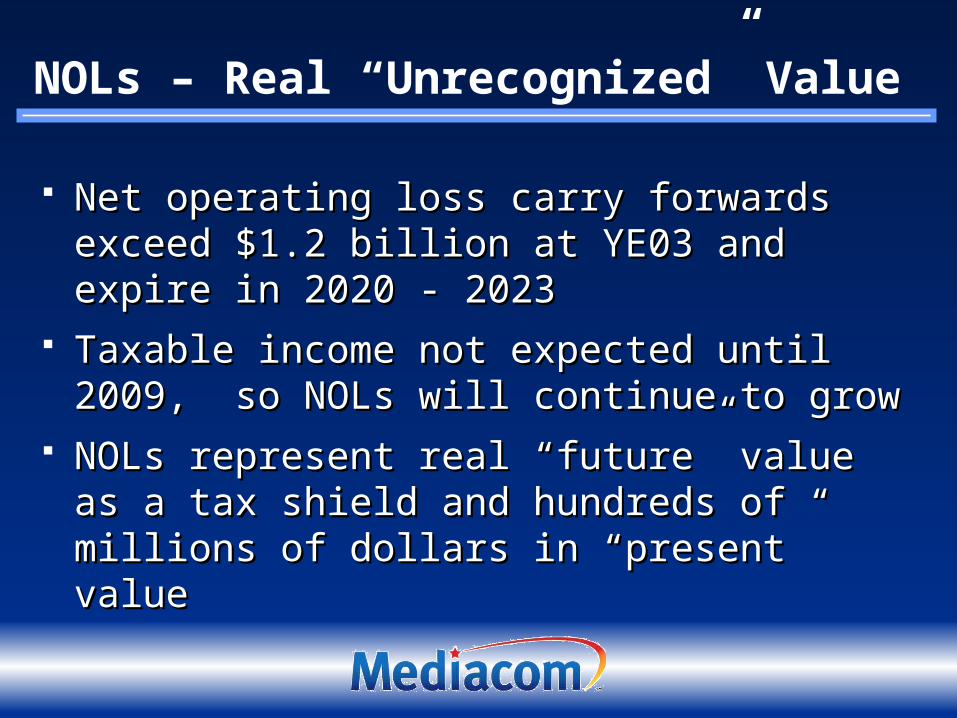
NOLs – Real “Unrecognized” Value
Net operating loss carry forwards exceed Net operating loss carry forwards exceed $1.2 billion at YE03 and expire in 2020 - $1.2 billion at YE03 and expire in 2020 - 20232023
Taxable income not expected until 2009, Taxable income not expected until 2009, so NOLs will continue to growso NOLs will continue to grow
NOLs represent real “future” value as a tax NOLs represent real “future” value as a tax shield and hundreds of millions of dollars in shield and hundreds of millions of dollars in “present” value“present” value
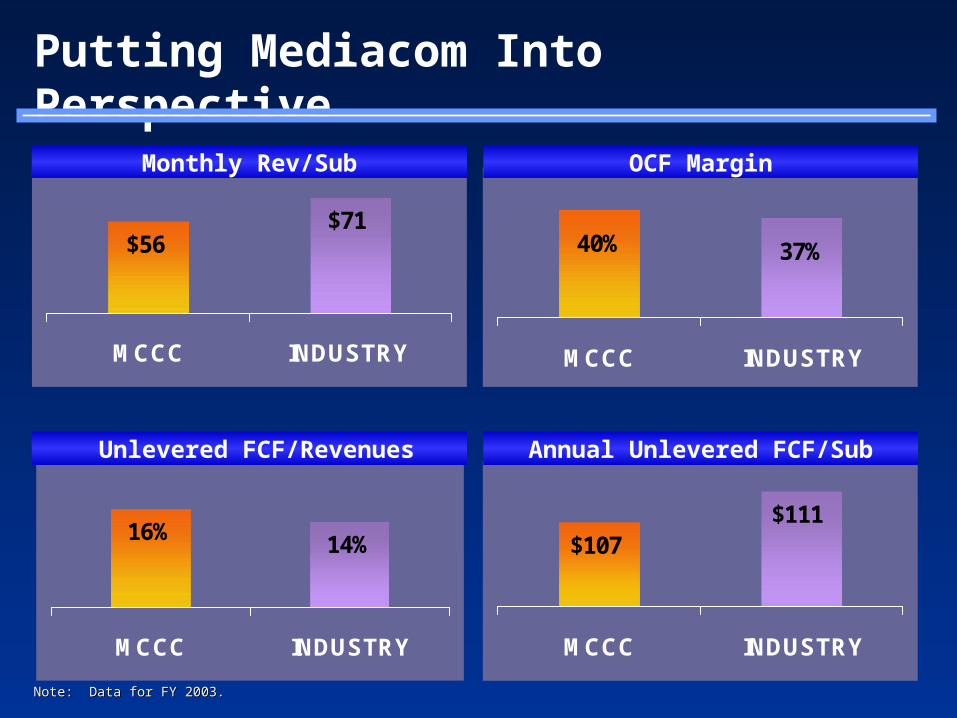
$111$107
MCCC INDUSTRY
14%16%
MCCC INDUSTRY
37%40%
MCCC INDUSTRY
$71$56
MCCC INDUSTRY
Putting Mediacom Into Perspective
Monthly Rev/Sub
Annual Unlevered FCF/Sub Unlevered FCF/Revenues
OCF Margin
Note: Data for FY 2003.Note: Data for FY 2003.
Summary
Leveraging broadband networkLeveraging broadband network
Strengthening competitive video positionStrengthening competitive video position
Broadening data businessBroadening data business
Seizing VoIP opportunitySeizing VoIP opportunity
Accelerating FCF growthAccelerating FCF growth
Use of Non-GAAP Financial MeasuresThis presentation includes the financial measures “operating income before depreciation and This presentation includes the financial measures “operating income before depreciation and amortization,” “unlevered free cash flow” and “free cash flow”, which are not determined in amortization,” “unlevered free cash flow” and “free cash flow”, which are not determined in accordance with generally accepted accounting principles (GAAP) in the United States. The accordance with generally accepted accounting principles (GAAP) in the United States. The Company defines unlevered free cash flow as operating income before depreciation and Company defines unlevered free cash flow as operating income before depreciation and amortization less capital expenditures, and free cash flow as operating income before amortization less capital expenditures, and free cash flow as operating income before depreciation and amortization less interest expense, net and capital expenditures. depreciation and amortization less interest expense, net and capital expenditures.
Operating income before depreciation and amortization is one of the primary measures used Operating income before depreciation and amortization is one of the primary measures used by management to evaluate the Company’s performance and to forecast future results. The by management to evaluate the Company’s performance and to forecast future results. The Company believes this measure is useful for investors because it enables them to assess the Company believes this measure is useful for investors because it enables them to assess the Company’s performance in a manner similar to the method used by management, and Company’s performance in a manner similar to the method used by management, and provides a measure that can be used to analyze, value and compare the companies in the provides a measure that can be used to analyze, value and compare the companies in the cable television industry, which may have different depreciation and amortization policies. A cable television industry, which may have different depreciation and amortization policies. A limitation of this measure, however, is that it excludes depreciation and amortization, which limitation of this measure, however, is that it excludes depreciation and amortization, which represents the periodic costs of certain capitalized tangible and intangible assets used in represents the periodic costs of certain capitalized tangible and intangible assets used in generating revenues in the Company’s business. Management uses a separate process to generating revenues in the Company’s business. Management uses a separate process to budget, measure and evaluate capital expenditures. budget, measure and evaluate capital expenditures.
Use of Non-GAAP Financial MeasuresFree cash flow is used by management to evaluate the Company’s ability to service its debt and Free cash flow is used by management to evaluate the Company’s ability to service its debt and to fund continued growth with internally generated funds. The Company believes this measure to fund continued growth with internally generated funds. The Company believes this measure is useful for investors because it enables them to assess the Company’s ability to service its is useful for investors because it enables them to assess the Company’s ability to service its debt and to fund continued growth with internally generated funds in a manner similar to the debt and to fund continued growth with internally generated funds in a manner similar to the method used by management, and provides a measure that can be used to analyze, value and method used by management, and provides a measure that can be used to analyze, value and compare companies in the cable television industry. The Company’s definition of free cash flow compare companies in the cable television industry. The Company’s definition of free cash flow eliminates the impact of quarterly working capital fluctuations, most notably the timing of semi-eliminates the impact of quarterly working capital fluctuations, most notably the timing of semi-annual cash interest payments on the Company’s senior notes. The only difference between annual cash interest payments on the Company’s senior notes. The only difference between the terms free cash flow and unlevered free cash flow is that unlevered free cash flow does not the terms free cash flow and unlevered free cash flow is that unlevered free cash flow does not subtract interest expense, net. The Company’s definitions of free cash flow and unlevered free subtract interest expense, net. The Company’s definitions of free cash flow and unlevered free cash flow may not be comparable to similarly titled measures used by other companies.cash flow may not be comparable to similarly titled measures used by other companies.
Operating income before depreciation and amortization, unlevered free cash flow and free cash Operating income before depreciation and amortization, unlevered free cash flow and free cash flow should not be regarded as alternatives to either operating income or net loss as indicators flow should not be regarded as alternatives to either operating income or net loss as indicators of operating performance or to the statement of cash flows as measures of liquidity, nor should of operating performance or to the statement of cash flows as measures of liquidity, nor should they be considered in isolation or as substitutes for financial measures prepared in accordance they be considered in isolation or as substitutes for financial measures prepared in accordance with GAAP.with GAAP.
Use of Non-GAAP Financial Measures
The Company believes that operating income is the most directly comparable The Company believes that operating income is the most directly comparable GAAP financial measure to operating income before depreciation and amortization, GAAP financial measure to operating income before depreciation and amortization, and that net cash flows provided by operating activities is the most directly and that net cash flows provided by operating activities is the most directly comparable GAAP measure to unlevered free cash flow and free cash flow. comparable GAAP measure to unlevered free cash flow and free cash flow.
Any applicable reconciliation of historical non-GAAP financial measures included in Any applicable reconciliation of historical non-GAAP financial measures included in this presentation to the most directly comparable GAAP financial measures is this presentation to the most directly comparable GAAP financial measures is available at the Press Releases link in the Investor Relations section of the available at the Press Releases link in the Investor Relations section of the Company’s website at www.mediacomcc.com. The Company is unable to reconcile Company’s website at www.mediacomcc.com. The Company is unable to reconcile operating income before depreciation and amortization, unlevered free cash flow operating income before depreciation and amortization, unlevered free cash flow and free cash flow to their most directly comparable GAAP measures on a forward-and free cash flow to their most directly comparable GAAP measures on a forward-looking basis primarily because it is impractical to project the timing of certain items, looking basis primarily because it is impractical to project the timing of certain items, such as the initiation of depreciation relative to network construction projects, or such as the initiation of depreciation relative to network construction projects, or changes in working capital.changes in working capital.