Electroluminescence pulse shape and electron diffusion in ...

DOI 10.1140/epja/i2016-16070-9
Special Article – Tools for Experiment and Theory
Eur. Phys. J. A (2016) 52: 70 THE EUROPEANPHYSICAL JOURNAL A
Pulse shape analysis and position determination in segmentedHPGe detectors: The AGATA detector library
B. Bruyneel1,2, B. Birkenbach1,a, and P. Reiter1
1 Institut fur Kernphysik, Universitat zu Koln, 50937 Koln, Germany2 CEA Saclay, Service de Physique Nucleaire, F-91191 Gif-sur-Yvette, France
Received: 18 December 2015 / Revised: 16 February 2016Published online: 29 March 2016 – c© Societa Italiana di Fisica / Springer-Verlag 2016Communicated by A. Gade
Abstract. The AGATA Detector Library (ADL) was developed for the calculation of signals from highlysegmented large volume high-purity germanium (HPGe) detectors. ADL basis sets comprise a huge amountof calculated position-dependent detector pulse shapes. A basis set is needed for Pulse Shape Analysis(PSA). By means of PSA the interaction position of a γ-ray inside the active detector volume is determined.Theoretical concepts of the calculations are introduced and cover the relevant aspects of signal formationin HPGe. The approximations and the realization of the computer code with its input parameters areexplained in detail. ADL is a versatile and modular computer code; new detectors can be implemented inthis library. Measured position resolutions of the AGATA detectors based on ADL are discussed.
1 Introduction
For more than five decades, High-Purity Germanium(HPGe) detectors have been at the heart of powerful spec-trometers which allow ever growing insight into the atomicnucleus [1]. Latest developments of HPGe detector tech-nology, instrumentation of data acquisition and processinghave led to a refined detection technology which allows todeduce position information from signals of these semicon-ductor detectors. Especially the digitization of the detec-tor pulses with high resolution, high bandwidth and highsampling frequency over a meaningful time period enablesto acquire the pulse shapes of the detector signals. Thisadditional information is exploited to determine the po-sition of charge generation inside the detector volume. Inorder to localize the scattering sequence following a γ-rayinteraction inside a segmented HPGe detector, the exper-imental pulse shapes are compared to a basis data set ofposition dependent pulses. For pulse shape analysis (PSA)a huge amount of pulses have to be provided for typicallymore than 40000 basis sites per crystal assuming a Carte-sian grid which is needed to cover the volume of a largeHPGe detector.
The reference pulse shapes are collected in lookup li-braries. The detailed comparison between reference pulseshapes and measured pulse shapes is in fact the task ofPSA algorithms [2–5] which have to identify the mostprobable interaction position within the active detector
a e-mail: [email protected]
material. Meanwhile the two γ-ray tracking spectrome-ters AGATA [6] and GRETINA [7] are based on PSA ofsignals from segmented HPGe detectors to obtain positioninformation on the interaction of γ-rays.
There exist two different procedures to generate thebasis set of pulse shapes: it can be obtained from exper-iment with the existing detectors or the pulses are theresult of a calculation which takes all the relevant aspectsfor a final comparison with measured information into ac-count. For the experimental solution dedicated scanningtables have been developed for the large HPGe detectorsin recent years. The scanning table uses a heavily colli-mated γ-ray source, usually a very strong 137Cs sourceproducing a pencil beam of gamma-rays to select interac-tions taking place at a particular position inside the de-tector volume. The x, y-coordinate of the collimator posi-tion defines one part of the coordinates of the interactions,whereas the coincident detection of a Compton scatteredγ-ray inside a secondary collimation system completes theevent selection. The interaction position in the z-directioninside the germanium is then defined by the intersectionof both collimator openings. Multiple interactions are sup-pressed by requiring additional conditions on the detectedenergy. Such scanning systems have been built in Liv-erpool [8, 9], Orsay [10], Salamanca and Strasbourg [6].At GSI, Darmstadt a technique based on positron anni-hilation was suggested [11, 12]. However, such scanningmethods are very time consuming, such that until now,the required reference pulse shape libraries could not beentirely established by measurement alone. Development

Page 2 of 11 Eur. Phys. J. A (2016) 52: 70
of faster characterization procedures [13,14] are thereforestill of high interest. After such characterization, the errorbetween simulation and experiment can be brought downto less than 2% of the full energy signal [15]. However,the extremely time consuming nature of the experimentalscanning methodology favours the more practical way togenerate a full basis of pulses by calculation.
The AGATA spectrometer employs PSA to determinethe positions of the interaction points with a much higherposition resolution than the physical segmentation of thedetector volume [16]. A γ-ray causes typically a chain ofinteractions in the germanium detectors (e.g. 3–4 interac-tion points at an energy of 1.3MeV). There can be morethan one interaction in one segment of a detector and theγ-ray can be scattered to another segment of the samecrystal or to an adjacent detector. A high precision ofthe interaction positions is required in order to performthe subsequent γ-ray tracking with high accuracy [17,18].For the design of AGATA a position resolution of 5mm(FWHM) was assumed [19]. The preamplifier signals ofall 36 segments and the core electrode of every detectorare digitized using a 14 bit analogue to digital converterwith a rate of 100MHz. The large dataset from the singlecrystal are compared to the calculated existing set of sig-nal pulses. This comparison includes the signal of the coreelectrode, the signal of the hit segment electrode and thesignals from the neighboring segment electrodes for ev-ery interaction. This is needed because the size and shapeof the bipolar transient signals induced in the neighbor-ing segment electrodes contain the important informationfor the angular and z position of the interaction. In thecase of AGATA, a detector crystal has a large volume of∼= 380 cm3 and a weight of ∼= 2kg. The required PSA li-braries typically contain over 105 reference pulse shapes.Combined with the segmentation of the capsule, the PSAachieves position resolutions of about 4mm FWHM [20]for the AGATA detectors.
In order to generate a data base for looking up theindividual positions inside the Ge detector volume thepulses are calculated by performing an elaborate detectorcharacterization which includes a minimum of input pa-rameters to simulate the complete detector response afterthe γ-ray interaction. For this reason simulation codes forHPGe detector have been developed within the AGATACollaboration: the Matlab based Multi Geometry Simula-tion code (MGS) [21,22], the Java AGATA Signal Simula-tion toolkit (JASS) [23] and the AGATA Detector Library(ADL) which is subject of this publication. ADL data ba-sis were employed for PSA of all in-beam experiments withthe AGATA detectors up to now.
In the first part of the paper the general concepts andbasic assumptions are introduced. The following sectionsexplain the calculations of electrical fields, charge carriermobilities and mirror charges. The experimental impact ofthe response function and the crosstalk contributions areexplained next. Main part of the paper is the section onthe ADL code describing its structure, the detailed calcu-lations of the various subroutines and the determinationof accurate input parameters for individual Ge crystals.
At the end the achieved results on position resolution arepresented and discussed.
2 Simulating HPGe detectors
Semiconductors in general are described by the Van Roos-broek equations [24] which, aside from the Poisson equa-tion for the electrical field, also comprises continuity equa-tions for the electron and hole densities. For the siliconindustry, commercial packages like Silvaco [25] and Syn-opsys [26] are available to solve these equations. However,even for experts, solutions to the Van Roosbroeck equa-tions are generally not trivial to obtain. Convergence ofthe solution is often critically related to a proper choiceof grid, which already implies a fair knowledge in advanceon the expected solution. Luckily, for the simulation oflarge volume germanium detectors for gamma-ray detec-tion, several approximations can be applied, which sim-plify the problem drastically.
2.1 Delta interactions
Radiation interacts with the active detector material bycreating electron hole pairs. Depending on the type andthe energy of the radiation the volume of the createdcharge cloud changes. For example a single interaction of a1MeV γ-ray in germanium knocks out fast electrons thatloose their energy by creating electron-hole pairs resultingin a charge cloud with a radius of 0.5mm [23]. For γ-rayenergies above 250 keV, independent of the initial gamma-ray energy, the initial energy will be statistically broken upin energy deposits of 100 to 250 keV due to Compton scat-tering [17]. This energy interval is defined by the regionwhere the Compton cross section is taking over from thephoto absorption. The range of a 100 keV photo-electronin germanium is only 44μm [27]. Even in the statisticallyunlikely event of a 1MeV photo absorption, the range ofthe 1MeV photo electron is still only 1.2mm, which isstill less but comparable to the achievable position resolu-tion. Thus all interactions by γ radiation can typically beconsidered as point like interactions, as the range of theelectrons cannot be resolved.
2.2 Plasma erosion time
However, a partial shielding from the external field occursin the detector immediately after the creation of electronhole pairs, that causes a tiny time delay required to sep-arate the electrons and holes. This shielding effect signifi-cantly affects the PSA for particle identification in silicondetectors [28]. It roughly scales with the stopping poweralong the particle track and is inverse proportional to theexternal applied field. In silicon particle detectors, the ion-ization density along particle tracks is so high that partialshielding from the external field occurs. As a consequencean increase in the rise time is observed due to the addi-tional time required to separate electrons and holes from

Eur. Phys. J. A (2016) 52: 70 Page 3 of 11
the initial plasma. Typical values for the plasma erosiontime τpl are 1–3 ns for alpha particles and 2–5 ns for heavyions [29]. The plasma erosion time scales proportional tothe square root of the stopping power along the parti-cle track, and inverse proportional to the external appliedfield E0 [28]:
τpl ∝1
E0·√
dE
dx. (1)
Although the quoted time constants are already smallcompared to the typical collection times of several 100 nsin large volume HPGe detectors, the effect will be evenmore reduced considering the stopping power of photo-electrons in germanium is about two orders of magnitudesmaller than for alpha particles at 100 keV. From this weconclude it should be safe to neglect plasma erosion times.
2.3 Diffusion
Under action of diffusion, initial delta distributions willbe transformed into a Gaussian distribution of size
σ =√
2Dt. (2)
The diffusion coefficient for electrons and holes at LN2temperatures in germanium [30] is less than D < 300 cm2/s. Typically collection times in an AGATA detector willnot surpass 0.6μs. This gives an upper limit of σmax <0.2mm. The image charges induced in each electrode bysuch Gaussian profiles will not differ substantially fromthe image charges induced from a delta distribution. Dif-fusion effects are therefore neglected in ADL. Exceptionsexist when the charge collection is happening in the vicin-ity of a segmentation border. The gap between segmentshas been measured to vary between 0.09mm and 0.72mmon AGATA detectors [31]. Diffusion should be included toproperly describe the charge sharing between both elec-trodes in these cases.
2.4 Quasi-static field approximation
In all our calculations, the finite speed of light is neglected,such that image charges at electrodes in the detector arecreated instantaneously in response to charges created inthe bulk of the detector. At any point in time the detec-tor is therefore considered to be in an electrostatic equi-librium. A sufficient condition for this to be true is thatthe time required for light to cross the detector volumeis negligible compared to the timing accuracy required inthe calculation. The quasi-static approximation is readilyassumed in the Van Roosbroeck equations, and is, further,also a prerequisite for the Ramo theorem (discussed fur-ther in the text) to be valid. Furthermore, it is assumedthat the extra field generated by the charges created bythe gamma radiation is negligible compared to the exter-nal applied collection field.
In summary, electrons and holes created by γ radiationin large volume germanium detectors are approximated
as traveling independently in a fixed applied field, andwithout appreciable diffusion, which represents a seriousreduction in complication.
3 Ingredients of signal calculation
According to the introduced approximations the require-ments for numerical signal calculation are separable: i)Calculation of the fixed electric field in the reverse biaseddetector. ii) The mobility of electrons and holes are neededto calculate their respective trajectories under action ofthe external field. iii) Calculation of the instantaneouslyinduced image charge in any electrode of the detector as afunction of the positions of free electrons and holes in thedepleted region of the detector. iv) The different inputs(potentials, mobility, mirror charges, response functions)have to be generated and combined for the final calcu-lation of the electric signals in the detector. The variousparts are introduced and explained in the following sub-sections.
3.1 Electrical field
First the electrical field inside the detector has to be cal-culated. Depending on the geometry of the detector, thisis done analytically or numerically. An analytical exampleis the true coaxial detector1 which resembles the AGATAdetector to a major fraction. The Possion equation,
Δφ = −ρ
ε, (3)
in cylindrical coordinates becomes
d2φ
dr2+
1r
dφ
dr= −ρ
ε.
The core electrode of a true coaxial detector defines theinner radius r1 and the outer electrode the outer radius r2.The boundary condition is the applied voltage V betweenthe two electrodes φ(r2)−φ(r1) = V . Solving the equationfor E(r) = −dφ
dr results in
−E(r) = − ρ
2ε+
V +(
ρ4ε
)(r2
2 − r21)
r ln r2r1
,
assuming the space charge as constant.The solution to the Poisson equation for a more com-
plex geometry is obtained numerically by a finite differ-encing technique on a cubic grid. The cubic grid was cho-sen as it fits well with most geometries and has somenon-negligible advantages compared to irregular meshes.It simplifies drastically the equations after discretization,which in addition results in more numerical stable solvers.The structured grid allows for a fast lookup and interpo-lation of the values compared to irregular meshes.
1 See, for example, [29] page 422.

Page 4 of 11 Eur. Phys. J. A (2016) 52: 70
Homogeneous Neumann boundary conditions are ap-plied to the array boundaries. The potentials have no gra-dient component tangential to the array boundaries. Thehomogeneous boundary condition is typically also usedfor the passivated layer on the backside of the AGATAcrystals. However, this is a convenient approximation. Thecorrect boundary equation for passivated areas is given by:
n · ε0(ε1E1 − ε2E2) = ρs, (4)
with n, a local unit vector normal to the surface. E1, ε0ε1is the field and the permittivity near the boundary onthe inside of the detector. E2, ε0ε2 are similar quanti-ties just outside the detector. The boundary conditionthus relates the field component normal to the detectorboundary surface to the field outside the detector, and aninfluence due to the encapsulation exists. Moreover, pas-sivation layers possess a surface charge density ρs. Thissurface charge density on the passivation layer is difficultto be controlled during manufacturing, and is very tem-perature dependent [32]. Details of the passivation layer(geometrical size, thickness and charge density) are notavailable from the manufacturer2 after encapsulation ofthe HPGe crystal.
For these reasons, the passivated surface is approxi-mated by a homogeneous Neumann condition:
n · E1 = 0. (5)
Under this approximation, small deviations between simu-lation and experiment are expected for example in the risetime profiles. This was observed as a result of an 241Amsource scan where the cylindrical surface at about 1 cmfrom the back of the passivated layer was irradiated withvery low energy γ-rays (for details see [15]). The mobilityat the passivated surface boundaries is known to be muchbelow the bulk mobility [33], also enhanced trapping anddiffusion is expected to play a significant role for the signalformation. Fortunately this behavior is limited to the veryback of the long Ge crystal and only a minor fraction ofthe deposited γ-ray energies are affected by these effects.
3.2 Charge carrier mobility models
In contrast to planar detectors, the anisotropic behavior ofthe moving charge carriers is of high importance in largecoaxial detectors. The field orientation can take any di-rection with respect to the crystal orientation. Differencesin mobility between fields along different crystallographicaxes differ up to about 30% in the high field regime. Acorrect description of the mobility is therefore key to aprecision simulation of HPGe detectors.
Rise time measurements [34] are performed to char-acterize the crystal orientation of the detector. The ori-entation of the asymmetric AGATA crystals were mea-sured [34]. The method is based on the use of a collimated400 kBq 241Am source emitting 60 keV γ-rays in combi-nation with a small lead collimator of 1.5mm radius and
2 CANBERRA Industries Inc.
0°
Experimental dataFit
150
200
250
60°120°
180°
240°
Rise Time [ns]
Fig. 1. Aligned masks for scanning the crystal axis (left) andrise times depending on the angular position of the collimatorfor the asymmetric AGATA detector B002 (right).
1 cm length. The low energy γ-rays deposit their energywithin a few millimetres of the active detector material.The created holes are collected immediately and only thedrifting electrons form the signal.
The crystal is scanned from the front over a circle witha fixed radius of 2.35 cm. The differences in rise time be-tween different angles result mainly from the crystal inter-nal structure. The impact of the hexagonal shape of thecrystals is reduced. A mask, see left picture in fig. 1, indi-cating 32 different scanning angles was placed at the frontface of the detector. The mask was aligned by request-ing that the count rates of two neighbouring segments areequal when the collimated source is placed on the corre-sponding segmentation line and that at the centre of themask all front segments showed nearly equal count rates.The data acquisition recorded the energy and the full tracesignals of every event. In the analysis the signals were fil-tered for total energy deposition and an average trace wasbuild for every scan position. An example for the resulting10% to 90% rise time is shown in the right plot of fig. 1for the AGATA detector B002. The applied fit function is
T 9010 (θ) = A · (1 + R4 · cos(4 · (θ − θ4)))
·(1 + R2 · cos(2 · (θ − θ2))),
with A, R4, R2, θ4 and θ2 as fit parameters. The largestcontribution comes from the second factor that models the4 fold symmetry of the anisotropic mobility. θ4 describesthe crystal orientation. The R2 term corrects for smallobserved deviations of the 4 fold symmetry caused by theasymmetric shape of the detector. The results show clearlythe orientation of the axis. We observed this orientationto be the same for all detectors.
Both electrons and holes move fastest in the directionof the crystallographic 〈100〉 axis (near 45◦ - see rightplot of fig. 1). Moreover, this asymmetry in the drift ve-locity causes components in the drift velocity tangentialto the applied field. The orientation of these tangentialcomponents is always oriented towards the nearest 〈100〉axis. However, for symmetry reasons, when the field isapplied in the direction of a crystallographic symmetryaxis, these components vanish. For the required mobilityas function of field strength, full three dimensional mo-bility models were developed both for electrons [35] and

Eur. Phys. J. A (2016) 52: 70 Page 5 of 11
holes [36]. These models are specific to mobility in germa-nium near liquid nitrogen temperature (77K).
3.3 Mirror charges
Once the trajectories of all free charges in the detector arecalculated in function of the time, the induced signals ineach of the electrodes can be determined. Hereto one cal-culates the weighting potential for each of the electrodesof interest, for every position in the sensitive volume ofthe detector. By definition, this weighting potential φi(x)equals the induced charge Qind in electrode i for a unit ofcharge placed at position x in the detector. For a chargeq at this position, we therefore get, by definition,
Qind,i = −qφi(x). (6)
The Ramo theorem [37] provides a very attractive so-lution to the problem of calculating these weighting po-tentials. It assumes that all electrodes are kept at fixedpotential, such that in a small AC signal perturbationapproach, these electrodes can be considered grounded.Under these circumstances, the weighting potentials areobtained as solution to the Laplace equation:
∇2φi(x) = 0 φi|Sj = δi,j . (7)
The boundary conditions to this problem can be readilyextracted from the definition: If a charge is closely posi-tioned to the electrode with surface Si, the total of inducedcharge in that electrode will be Qind = −q, or the weight-ing potential at electrode i should take the homogeneousDirichelet condition Φi|Si = 1. If, on the contrary, thecharge q is placed close to another electrode j �= i, thenthe total image charge will be induced in electrode j. Thishas as consequence that all other electrodes will see no netcharge in the detector as the charge q is totally screenedby the image charge. Therefore the boundary conditionfor any other electrode j �= i should take the homoge-neous dirichelet condition Φi|Sj = 0. This explains theuse of the delta function in eq. (7).
In this picture the time evolution of the inducedcharge, and thus the integral of the current flown intothis electrode is given simply by the charge weighted sumof the weighting potential evaluated at the momentaryposition of the free charges:
Qind,i(t) = −Σqqφi(xq(t)). (8)
By differentiation of eq. (8) it can be proven that the in-duced current by the movement of charge q is given by
Iind,i = −qvd · ∇φi(x), (9)
with vd the momentary drift velocity of the charge q.The inverted gradient of the weighting potential is calledweighting field. Within ADL, eq. (8) is preferred overeq. (9) in the calculation of the induced signals, as usuallycharge sensitive preamplifiers are used. Moreover, even incase current sensitive preamplifiers are used, this method
is preferred, since the evaluation of the gradient in eq. (9)is introducing unnecessary calculation errors in the simu-lation.
It has been proven [38] that the weighting potentialsare not affected by the possible presence of space charge inthe medium. Hence the right-hand side of eq. (7) is zero.This can also be simply argued: the image charges gener-ated to deplete the space charge were generated while bias-ing the detector, and therefore do not need considerationin the small signal AC equivalent scheme which describesthe perturbation of the steady state of the detector.
It was silently assumed that the detector medium wasuniform. In case different materials are used, the Ramotheorem will need modification. If furthermore resistivematerials are used (for instance the detector is not fullydepleted), then the modified equation to solve is [39]
∇(ε(x) + σ(x)/s)∇φi(x, s) = 0, (10)
where the ε and σ represent the position-dependent per-mittivity and conductivity of the detector medium. Theparameter s is a complex frequency as used in the La-place transform. Upon inverse Laplace transformation, theweighting potential becomes now time dependent.
3.4 Electronic response and crosstalk
The charge signal as calculated using the Ramo theorem,will need convolution with a realistic response function ofthe acquisition electronics. The response function of thepreamp can usually be measured by injection of a cleanfast rectangular pulse in the preamplifiers pulser input. Byusing eq. (8) rather than eq. (9), we took already the timeintegration into account, such that we only have to convo-lute with the time derivative of the measured preamplifierresponse to obtain realistic signals.
However, since all channels in a highly segmented de-tector are not grounded, but connected to a preamplifier,the ideal Ramo currents, as described by eq. (9), will notstrictly apply and needs modification. This effect is on theorigin of fundamental cross talk in segmented detectorsand can be described by an extension to the Ramo the-ory [38]. This model was worked out in the particular caseof AGATA detectors [40], and found in good agreementwith experimental results.
For AGATA detectors, the crosstalk has been observedto contribute two types: the proportional crosstalk, whichcreates a crosstalk signal in neighboring electrodes propor-tional to the capacities between the electrodes involved.This type of crosstalk can be described by assuming thepreamplifier acts at low frequencies as a large (Millerequivalent) capacitance on the collecting electrode. Ac-curate routines were developed to measure and correct forthis type of crosstalk within AGATA [41].
Proportional crosstalk in AGATA detectors createsadditional contributions to the charge carrier signals inneighboring electrodes which is proportional to the timederivative of the driving signal. This type of crosstalk canbe described by the fact that at higher frequencies, the

Page 6 of 11 Eur. Phys. J. A (2016) 52: 70
ElectricalField
Calculate Traces
Induced charges in electrodes
Convolute Signal
Path of charge carriers
WeightingPotential
PositionsGeometry,
Material
SpaceCharge
Signal Basis
TransferFunction
Crosstalk
PoissonSolver
Crystals axisorientation
Mobilities
Fig. 2. Block diagram of the routines (green) and the input(blue) for an ADL simulation.
input of the preamplifier starts acting as a resistor. Mea-surement of derivative crosstalk in practice is oft very dif-ficult as it is usually superposed on real transient signals.Nevertheless, also this type of crosstalk is growing propor-tional to the capacities between the electrodes involved,and shows correlation with the proportional crosstalk [42].
4 AGATA Detector Library
The AGATA Detector Library is written in the computerlanguage C. It is used for realistic simulations of semi-conductor detectors in nuclear physics in general. In thefollowing discussions the focus concentrates on highly seg-mented HPGe coaxial detectors, although many pointscan be transferred to different geometries or semiconduc-tor materials.
4.1 Layout of the ADL software
In fig. 2 a block diagram of the ADL is shown. The rou-tines are colored in green and the user provided input iscolored blue. The main routine called Calculate Tracesconsists of three subroutines and takes the interaction po-sition as input. The first subroutine calculates the path ofthe charge carriers through the detector material for ev-ery time step. It needs the electrical field and a mobilitymodel of the charge carriers as an input. The second sub-routine calculates for every time step the induced chargesin all electrodes. It needs the weighting potentials to dothis. The last subroutine convolutes the signal with prede-fined functions. The routines and their input parameterswill be described in detail within the next sections.
ADL intents to be flexible and extendable. The libraryhas a special registration of the routines and input param-eters controlled by template files. An overview of the partsof ADL is given in table 1.
4.2 Calculating the weighting potentials and theelectrical field
First the electrical field and the weighting potentials [43]have to be calculated. The ADL library provides basic ge-ometries like the true coaxial or a planar detector. More
Table 1. Components of the ADL software which is controlledby template files.
Parts Description
ADL Main setup file
CONVOLUTION Convolution of transfer function
DRIFT Charge carrier mobility models
EVENT Basic event information
FIELDS Geometries, weighting
and electrical fields
READWRITE Input and output
TIME Timing filter settings
TRACES Calculation of traces
TRAPPING Trapping sensitivities
and path length
complex geometries are provided as SIMION [44] poten-tial arrays. The user can easily add new geometries asSIMION potential arrays or implement new routines toadd different formats.
The weighting potentials are determined by a 3D Pois-son solver which is implemented in the library to calculatethe fields. It is based on the established technique of suc-cessive over relaxation [45]. For this reason the detectoris split into many small cubes called voxels. Each voxel iseither an electrode or active detector material. To calcu-late the weighing potential for one electrode, this electrodeis set to 1V and all other electrodes are set to 0V. Thesolver now iterates over all voxels. If the voxel is activematerial, it takes the average of the values of the 6 neigh-bouring voxels as its new value plus some over relaxationparameter for faster convergence. If the voxel is an elec-trode, it is not changed. The value change is monitoredand if it becomes small enough the calculation stops. Thefield solutions are stored in a format compatible with thecommercial code SIMION.
In order to check the reliability of the numerical re-sults, the numerical solution of the solver was comparedto the analytic one. The comparison shows only small de-viations in the per mille range at the boundaries.
Different parameters can be adjusted in the templatefiles depending on the type of input. For the analyticalsolvable geometries the applied high voltage, the impurityconcentration, geometric details and the relative permit-tivity of the medium are set. For the SIMION files thedifferent weighting potentials for all electrodes and thecontribution of the impurity concentration must be givenas file input.
For all AGATA geometries SIMION files were cal-culated and are available from the IKP AGATA web-page [46]. To create a full simulation of an AGATA detec-tor the weighting potential for all 36 segment and the coreelectrode have to be calculated. An example of a weightingpotential of detector A001 as calculated by the ADL rou-tines is shown in fig. 3. On the top panel, a slice through

Eur. Phys. J. A (2016) 52: 70 Page 7 of 11
Fig. 3. Weighting potentials for the core electrode (top) andsegment electrode A4 (bottom) of detector A001. The slices aretaken at 40.5 mm from the front of the detector. The completeregion outside the active germanium material are marked aselectrodes with a fix potential of 1V. The units of the z-scaleare Volt.
the weighting potential of the sixfold segmented detectorin the coaxial part of the detector is depicted. On thebottom plot, the weighing potential of segment A4 is pre-sented. From the weighting potential values on the bound-ary between the nearest neighbour and second nearestneighbour of A4 it can be seen that the amplitude of tran-sient signals will be limited to 2–3% of the hit segment sig-nal for second nearest neighbours. The plot demonstratesthat nearest neighbouring segments contribute predomi-nantly to a detectable amplitude in transient signals.
The electrical field is the weighting potential of thecore electrode scaled by the applied bias voltage plus thefield created by the space charge distribution. The spacecharge is the uncompensated net impurity charge densityof the germanium material. The contribution of the spacecharge to the electrical field is the calculated electricalfield of the distribution for the boundary electrodes set to0V.
Table 2. Parameters for the mobility of electrons and holesin germanium according to the parametrization given in [15](see eq. (7)). The inter valley scattering rate for the electronmobility is the second-order expansion of eq. (8) in [36].
Electron mobility parameters
Mobility along 〈100〉 Inter valley scattering rate
E0 [V/cm] 507.7 E0 [V/cm] 1200
β 0.804 ν0 0.459
μ0 [cm2/V s] 37165 ν1 0.0294
μn [cm2/V s] −145 ν2 0.000054
Hole mobility parameters
Mobility along 〈100〉 Mobility along 〈111〉E0 [V/cm] 181.9 E0 [V/cm] 143.9
β 0.735 β 0.749
μ [cm2/V s] 62934 μ [cm2/V s] 62383
For the simulations of the AGATA detectors the im-purity profiles provided by the manufacturer are used. Asit is possible to measure the impurity concentration of en-capsulated germanium crystals [47–49], the informationof the manufacturer were verified by independent pulsermeasurements for the first asymmetric AGATA detectorsystems [50].
4.3 Calculation of pulse shapes
Radiation interacts within the active detector material bycreating electron-hole pairs. For the simulation the inter-action positions and the deposited energies are given as aninput. A simple event structure is implemented that allowsto set the maximum number of simultaneous interactionsper event, the number of electrodes, the number of timesteps and the time resolution (step size). Once the chargesare created inside the active Ge material, they travel alongthe electric field of the reversed biased semiconductor de-tector and induce a signal in the electrodes. The quasi-static field approximation is applied, such that the inducedsignals at all electrodes of the detector are instantaneouslycreated. The time to collect all charge carriers is dependingon the geometry of the detector, the applied voltage andthe impurity concentration of the semiconductor material.The two charge carriers have different mobilities resultingin different collection times for electrons and holes. Dif-ferent models are provided by the library for the mobility.A basic model assumes a constant mobility. Another im-plemented model, see [29] p. 434, assumes an empiricaldependence of the drift velocities with the electrical fieldstrength. However electron and hole mobilities in germa-nium are not isotropic, but depend on the orientation ofthe crystallographic axis of the cubic centred germaniumcrystal structure with respect to the electrical field. Re-cent publications [15, 35, 36] show, that such anisotropictreatment of electron and hole mobilities is crucial in non-planar coaxial detectors. A realistic model of the mobilityinside germanium crystals is implemented. The parame-ters described in [15,36] are listed in table 2.
Page 8 of 11 Eur. Phys. J. A (2016) 52: 70
The routines that calculate the path of the charge car-riers along the electrical field are based on the 5th-orderRunge Kutta integration method with adaptive step sizecontrol (from [45] chapt. 16.2, p. 714). The induced signalsfor every electrode of the detector are calculated depend-ing on the drift of the electrons and holes to the elec-trodes. For every time step and for each interaction theweighting field evaluated at the position of the electronsis subtracted from the weighting field evaluated at the po-sition of the holes. These differences are multiplied by thecharge produced at the individual interaction. The sum ofall interactions results in the signal set for the given event.
Finally these traces are convoluted with realistic be-haviour of the detector system. The different polarity ofthe preamplifiers are set up as a convolution function. Thetransfer function of the preamplifier or the cross talk ofsegmented crystals could be taken into account. Actuallyin the online analysis of AGATA these functions are foldedin the signals of the library, as they could vary for differentdetector and digitizer configurations.
Additionally the library provides routines to calculatethe trapping sensitivities relevant for neutron damage cor-rection as described in [51]. The trapping sensitivities areadded to the PSA bases and are used in the neutron dam-age correction of the AGATA online analysis.
4.4 Building AGATA PSA bases
In the following example a simulation for the detectorA001 is described in more detail. The computer programthat calculates a PSA base for AGATA iterates over theactive detector volume with a defined grid size. In AGATAa 3D grid size of 2mm is used. For an A type detector47156 positions inside the detector volume are calculated.The applied high voltage for the detector is 5000V. To cal-culate the charge collection process the anisotropic mobil-ity model is used including the measured axis orientation.Single interactions are calculated with an energy deposi-tion of 1 keV. The trace length is set to 600 ns with a 5 nsstep width. In addition to the trace signals the trappingsensitivities for the online neutron damage correction arecalculated for every position.
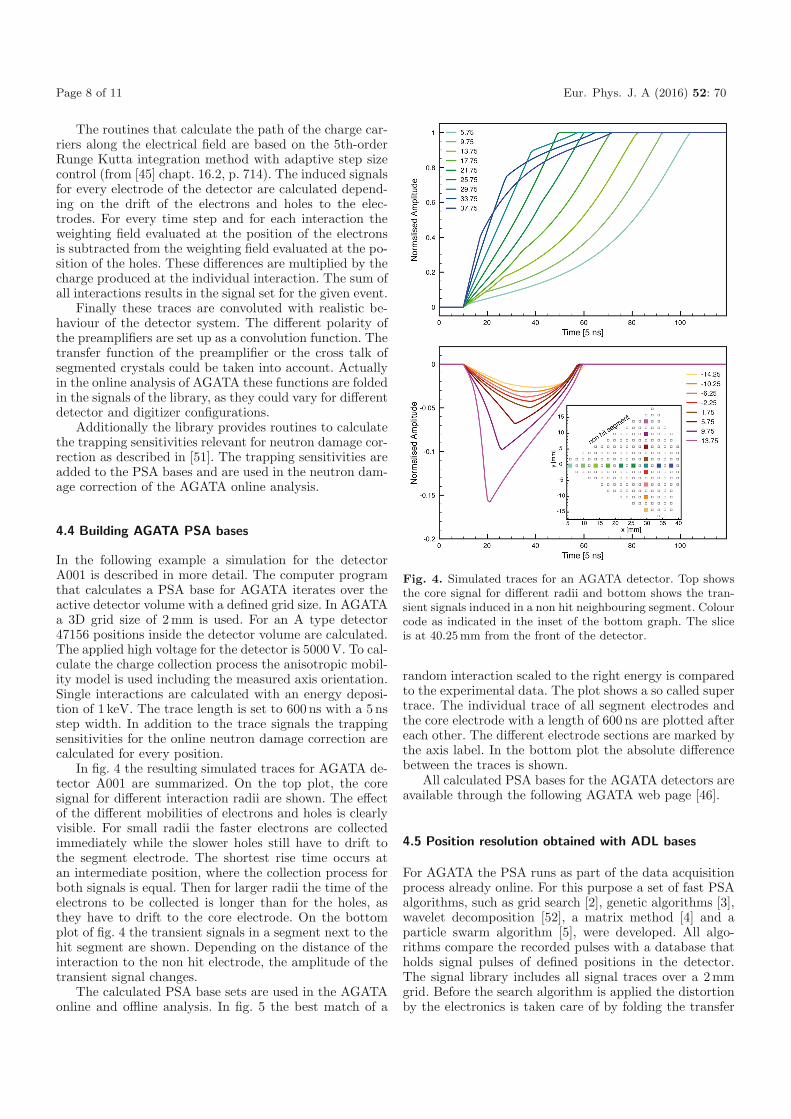
In fig. 4 the resulting simulated traces for AGATA de-tector A001 are summarized. On the top plot, the coresignal for different interaction radii are shown. The effectof the different mobilities of electrons and holes is clearlyvisible. For small radii the faster electrons are collectedimmediately while the slower holes still have to drift tothe segment electrode. The shortest rise time occurs atan intermediate position, where the collection process forboth signals is equal. Then for larger radii the time of theelectrons to be collected is longer than for the holes, asthey have to drift to the core electrode. On the bottomplot of fig. 4 the transient signals in a segment next to thehit segment are shown. Depending on the distance of theinteraction to the non hit electrode, the amplitude of thetransient signal changes.
The calculated PSA base sets are used in the AGATAonline and offline analysis. In fig. 5 the best match of a
Fig. 4. Simulated traces for an AGATA detector. Top showsthe core signal for different radii and bottom shows the tran-sient signals induced in a non hit neighbouring segment. Colourcode as indicated in the inset of the bottom graph. The sliceis at 40.25 mm from the front of the detector.
random interaction scaled to the right energy is comparedto the experimental data. The plot shows a so called supertrace. The individual trace of all segment electrodes andthe core electrode with a length of 600 ns are plotted aftereach other. The different electrode sections are marked bythe axis label. In the bottom plot the absolute differencebetween the traces is shown.
All calculated PSA bases for the AGATA detectors areavailable through the following AGATA web page [46].
4.5 Position resolution obtained with ADL bases
For AGATA the PSA runs as part of the data acquisitionprocess already online. For this purpose a set of fast PSAalgorithms, such as grid search [2], genetic algorithms [3],wavelet decomposition [52], a matrix method [4] and aparticle swarm algorithm [5], were developed. All algo-rithms compare the recorded pulses with a database thatholds signal pulses of defined positions in the detector.The signal library includes all signal traces over a 2mmgrid. Before the search algorithm is applied the distortionby the electronics is taken care of by folding the transfer

Eur. Phys. J. A (2016) 52: 70 Page 9 of 11
0
200
400
600
800
1000A
mpl
itude
[keV
]Experimental
Calculated
-60
-30
0
30
60
Am
plitu
de [k
eV]
ExperimentalCalculated
0
10
20
30
0 1 2 3 4 5 6 7 8 9 10 11 12 13 14 15 16 17 18 19 20 21 22 23 24 25 26 27 28 29 30 31 32 33 34 35 Co
Am
plitu
de [k
eV]
Segment ID (Time [10ns])
Abs. Difference
Fig. 5. The best match determined by the grid search algorithm of a random interaction scaled to the right energy comparedto experimental data. The horizontal axis is split in 37 sections, each containing a 600 ns trace of the corresponding electrode.Top plot is scaled to full energy deposition. Middle plot is zoomed to emphasize the transient signals. Bottom plot shows theabsolute difference between simulation and measurement.
function of the acquisition electronics and the differentialcrosstalk in the signals of the library.
Up to now the quality of the ADL signal basis is sur-veyed by several in-beam and source measurements whichare sensitive to the position resolution deduced from thesignal shapes. The final position resolution depends crit-ically on the quality of the calculated signal bases. Toobtain an experimental position resolution different tech-niques were employed and up to now a final resolution be-low 5mm (FWHM) is obtained for a gamma energy above1MeV. The technique described in [53] compares a MonteCarlo simulations of the detector response with an exper-iment performed at the IKP Cologne. In the experiment a48Ti beam with 100MeV impinged on a deuterated tita-nium target. The reaction 48Ti(d,p)49Ti was investigatedin inverse kinematics. The γ-rays were measured with thefirst symmetric AGATA triple. To reconstruct the veloc-ity vector of the scattered nucleus a double-sided siliconstrip detector (DSSSD) was used to detect the emittedproton. The performance of the Doppler correction wascompared to simulations taking into account the differentcontributions that cause a broadening of the peak. Thefinal position resolution is of the order of 5mm at an en-ergy of 1382 keV. This first result was already close to thedesign performance of 4mm for AGATA and was clearlyimproved in the following years.
Another technique employs the imaging capability ofAGATA to determine the position resolution of a singleAGATA detector [54] and assesses a mean position reso-lution of 5mm in an energy range from 300 keV to 1MeV.
A third approach uses the annihilation of the positronemitted by a 22Na source to extract the position resolu-tion [55]. As the two γ-rays emitted by the annihilationprocess have opposite directions two AGATA detectors atdifferent locations were used to perform a source mea-surement. Based on the comparison of Monte Carlo simu-lations and experimental data different methods were de-veloped to measure mean and individual position resolu-tions. A position resolution of 3.5mm was determined foran energy of 511 keV.
A recent publication is based on the Doppler broad-ening method [20]. The experiment was one of the firstcommissioning experiments performed with the AGATAsetup at LNL. The results show that the FWHM of theinteraction position resolution varies nearly linearly as afunction of γ-ray energy. For a low γ-ray energy of 250 keVthe position resolution is 8.5mm. However the value is im-proving at higher energies and reaches 4mm at 1.5MeV;this value stays constant up to 4MeV.
In the near future a detailed comparison between aset of measured position-dependent pulses and the ADLcalculations will allow a refined and direct inspection.

Page 10 of 11 Eur. Phys. J. A (2016) 52: 70
5 Summary
New detector arrays for γ-ray spectroscopy are based onsegmented HPGe crystals and implement the new methodof γ-ray tracking. For this purpose PSA algorithms areemployed to obtain the needed position information ofthe individual γ-ray interactions. PSA algorithms com-pare experimental and pre-determined data sets. ADL isa computer code used for computation of the vast amountof position-dependent pulses for such libraries. The basicconcepts of the signal calculations are presented includ-ing experimental details on the measuring of the inputparameters like the axis orientation of an AGATA de-tector. Meaningful approximations are exploited and dis-cussed in this work. The layout of the program packageand the different steps needed to calculate a PSA database are described in detail. The achieved results of theexperimentally determined position resolution unambigu-ously demonstrate that ADL is successfully utilized forspectroscopic investigations which are performed with theAGATA spectrometer.
This research was supported by the German BMBF underGrants 06K-167, 06KY205I and 05P12PKFNE TP4. AGATAwas supported by the European funding bodies and the EUContract RII3-CT-2004-506065.
References
1. J. Eberth, J. Simpson, Prog. Part. Nucl. Phys. 60, 283(2008).
2. R. Venturelli, D. Bazzacco, Adaptive Grid Search as PulseShape Analysis Algorithm for γ-Tracking and Results, LNLAnnual Report (2004).
3. Th. Kroll, D. Bazzacco, Nucl. Instrum. Methods A 565,691 (2006).
4. A. Olariu et al., Nucl. Sci. IEEE Trans. 53, 1028 (2006).5. M. Schlarb, R. Gernhauser, S. Klupp, R. Krucken, Eur.
Phys. J. A 47, 131 (2011).6. S. Akkoyun et al., Nucl. Instrum. Methods A 668, 26
(2012).7. S. Paschalis et al., Nucl. Instrum. Methods A 709, 44
(2013).8. L. Nelson et al., Nucl. Instrum. Methods A 573, 153
(2006).9. A.J. Boston et al., Nucl. Instrum. Methods A 604, 48
(2009).10. T.M.H. Ha et al., Nucl. Instrum. Methods A 697, 123
(2013).11. C. Domingo-Pardo et al., Nucl. Instrum. Methods A 643,
79 (2011).12. N. Goel et al., Nucl. Instrum. Methods A 652, 591 (2011).13. F.C.L. Crespi et al., Nucl. Instrum. Methods A 593, 440
(2008).14. P. Desesquelles, Nucl. Instrum. Methods A 654, 324
(2011).15. B. Bruyneel, P. Reiter, G. Pascovici, Nucl. Instrum. Meth-
ods A 569, 774 (2006).16. A. Wiens, H. Hess, B. Birkenbach, B. Bruyneel, J. Eberth,
D. Lersch, G. Pascovici, P. Reiter, H.-G. Thomas, Nucl.Instrum. Methods A 618, 223 (2010).
17. J. van der Marel, B. Cederwall, Nucl. Instrum. Methods A437, 538 (1999).
18. G.J. Schmid et al., Nucl. Instrum. Methods A 430, 6(1999).
19. E. Farnea, F. Recchia, D. Bazzacco, Th. Kroll, Zs. Pod-olyak, B. Quintana, A. Gadea, Nucl. Instrum. Methods A621, 331 (2010).
20. P.-A. Soderstrom et al., Nucl. Instrum. Methods A 638,96 (2011).
21. P. Medina et al., http://www.iphc.cnrs.fr/-MGS-.html.22. I. Mateu, P. Medina, J.P. Roques, E. Jourdain, Nucl. In-
strum. Methods A 735, 574 (2014).23. M. Schlarb, R. Gernhauser, S. Klupp, R. Krucken, Eur.
Phys. J. A 47, 132 (2011).24. G. Lutz, Semiconductor Radiation Detectors, first edition
(Springer, Berlin-Heidelberg-New York, 1999).25. http://www.silvaco.fr/.26. http://www.synopsys.com/.27. National Institute of Standards and Technology, Stopping-
power and range tables for electrons, protons, and heliumions (2009).
28. G. Pausch, W. Bohne, D. Hilscher, Nucl. Instrum. MethodsA 337, 573 (1994).
29. Glenn F. Knoll, Radiation Detection and Measurement,third edition (John Wiley & Sons, 2000).
30. C. Jacoboni, F. Nava, C. Canali, G. Ottaviani, Phys. Rev.B 24, 1014 (1981).
31. S. Aydin et al., Effective size of segmentation lines of anAGATA crystal, LNL Annual Report (2007).
32. E.L. Hull et al., Nucl. Instrum. Methods A 364, 488(1995).
33. P. Mullowney et al., Nucl. Instrum. Methods A 662, 33(2012).
34. B. Bruyneel et al., Determination of the Crystal Orienta-tion of the AGATA Detectors, LNL Annual Report (2010).
35. L. Mihailescu, W. Gast, R.M. Lieder, H. Brands, H. Jager,Nucl. Instrum. Methods A 447, 350 (2000).
36. B. Bruyneel, P. Reiter, G. Pascovici, Nucl. Instrum. Meth-ods A 569, 764 (2006).
37. W. Blum, W. Riegler, W. Rolandi, Particle Detection withDrift Chambers, first edition (Springer, Berlin, Heidelberg,2008).
38. E. Gatti, G. Padovini, V. Radeka, Nucl. Instrum. Methods193, 651 (1982).
39. W. Riegler, Nucl. Instrum. Methods A 535, 287 (2004).40. B. Bruyneel, P. Reiter, A. Wiens, J. Eberth, H. Hess, G.
Pascovici, N. Warr, D. Weisshaar, Nucl. Instrum. MethodsA 599, 196 (2009).
41. B. Bruyneel et al., Nucl. Instrum. Methods A 608, 99(2009).
42. B. Bruyneel, Pulse shape analysis with the AGATA demon-strator (Germanium Workshop Berkeley, 2010).
43. B. Bruyneel, PhD thesis, Institut fur Kernphysik der Uni-versitat zu Koln (2006).
44. http://www.simion.com.45. W.H. Press, B.P. Flannery, S.A. Teukolsky, W.T. Vetter-
ling, Numerical Recipes in C: The Art of Scientific Com-puting, second edition (Cambridge University Press, 1992).
46. http://www.ikp.uni-koeln.de/agata/.47. B. Birkenbach, B. Bruyneel, G. Pascovici, J. Eberth, H.
Hess, D. Lersch, P. Reiter, A. Wiens, Nucl. Instrum. Meth-ods A 640, 176 (2011).

Eur. Phys. J. A (2016) 52: 70 Page 11 of 11
48. B. Bruyneel, B. Birkenbach, P. Reiter, Nucl. Instrum.Methods A 641, 92 (2011).
49. B. Birkenbach, Raumladungsverteilungen in hochsegmen-tierten HPGe-Detektoren, Diplomarbeit (2009).
50. B. Birkenbach et al., Determination of the Space ChargeDistributions in the AGATA Detectors, LNL Annual Re-port 2010 (2010) p. 68.
51. B. Bruyneel et al., Eur. Phys. J. A 49, 61 (2013).
52. T. Beck, PhD thesis, Fachbereich Physik Johann WolfgangGothe-Universitat in Frankfurt am Main (2007).
53. F. Recchia et al., Nucl. Instrum. Methods A 604, 555(2009).
54. F. Recchia et al., Nucl. Instrum. Methods A 604, 60(2009).
55. S. Klupp, Master’s thesis, Technical University Munich(2011).