![benchmark April 2012 - NAFEMS · 2018-05-03 · Simulation Knowledge Management in GKN Driveline. NAFEMS Wiesbaden, Germany 2009. [8] KIM, Daniel. Implementation Frameworks of SDM](https://static.fdocuments.in/doc/165x107/5ece68645cf50f40cb4e0396/benchmark-april-2012-nafems-2018-05-03-simulation-knowledge-management-in-gkn.jpg)
Pull Production System Improvements In GKN Driveline AB ...577307/FULLTEXT01.pdf · Pull Production...
68
Pull Production System Improvements In GKN Driveline AB Xiaoyan Wang Report code: KPP231 Commissioned by: GKN Driveline AB Köping Tutor (company): Ekrem Güclü, GKN Driveline AB Köping Tutor (university): Mats Jackson, Mälardalen University Examiner: Sabah Audo, Mälardalen University GKN Driveline
Transcript of Pull Production System Improvements In GKN Driveline AB ...577307/FULLTEXT01.pdf · Pull Production...

Pull Production System Improvements
In GKN Driveline AB
Xiaoyan Wang
Report code: KPP231
Commissioned by: GKN Driveline AB Köping
Tutor (company): Ekrem Güclü, GKN Driveline AB Köping
Tutor (university): Mats Jackson, Mälardalen University
Examiner: Sabah Audo, Mälardalen University
GKN Driveline

2(68)
ABSTRACT
As the effort of today’s industries to continuously move towards lean production, pull
production system has been developed as one possible solution of lean. It is popularly known in
the industry world, and is indeed a proven technique to achieve substantial savings on
inventory, production cost incurred by manufactures all over the world. However, a careful
understanding of pull production systems is required to access its suitability to a particular
production setup. It is necessary to develop a proper way to implement pull production
systems.
This study is based on a real life scenario in a leading driveline manufacturing company. The
production system is studied in detail as regard to its production characteristic. A theoretical
review is first made as research foundation. A careful analysis study within the company is
conducted with all the existing constrains to figure out improvement opportunities. Eventually,
from the applicability point of view, proposals of future pull production system implementation
have been developed. The objective of the proposals is to minimize the identified weaknesses
of the current system, including long lead time, low flexibility and unconnected flow.
Keywords: Lean, Pull production system, Push production system, Heijunka, Leveling,
Kanban, CONWIP, Takt time, Pacemaker, FIFO, Supermarket.

3(68)
ACKNOWLEDGEMENTS
This master thesis is submitted in partial fulfillment of the requirements for the master degree
of Mälardalen University (MDH). The work has been carried out at GKN Driveline AB in
Köping.
Behind this thesis there is a long path of master thesis supervising, projects and teaching. These
highly professional and technical relevant activities have helped to give me the confidence to
deliver this work. Thanks to all the professors and classmates in MDH I have been in contact
with during these years.
I am grateful to be offered the opportunity to conduct this project in GKN Driveline Köping,
Thanks to all the staff that has supported me during this work. Thanks for their time,
information and patient explanation. This had not been possible without them.
Special thanks to Ekrem Güclü who has been my supervisor and the direct cause for my
accomplishment of this thesis. Thanks for his always open discussion and carefully considered
contributions. Also thanks so much for his great personality, his support and guidance. His
experience from previous academic and practical work has given me the motivation to push on
during this process.
Finally I will send my biggest thanks ever to my family and friends who have all supported me
during this period.
Eskilstuna, January 2012
Xiaoyan Wang

4(68)
CONTENTS 1. INTRODUCTION ................................................................................................................................................ 8
1.1 BACKGROUND .................................................................................................................................................. 8 1.1.1 Company description ............................................................................................................................... 8 1.1.2 The background of pull system implementation....................................................................................... 9
1.2 PROBLEM STATEMENT AND RESEARCH OBJECTIVE ........................................................................................... 9 1.3 SUB OBJECTIVES ............................................................................................................................................... 9 1.4 EXPECTED RESULTS ........................................................................................................................................ 10 1.5 DELIMITATION ............................................................................................................................................... 10
2. RESEARCH METHODOLOGY...................................................................................................................... 11
2.1 METHODOLOGICAL APPROACH ....................................................................................................................... 11 2.1.1 Scientific research approach ................................................................................................................. 11
2.2 APPLIED RESEARCH METHODS ........................................................................................................................ 12 2.2.1 Literature review ................................................................................................................................... 12 2.2.2 Interview ................................................................................................................................................ 12 2.2.3 Shop floor visiting .................................................................................................................................. 12
2.3 RESEARCH PROCEDURE .................................................................................................................................. 12 2.3.1 Phase 1 .................................................................................................................................................. 13 2.3.2 Phase 2 .................................................................................................................................................. 13 2.3.3 Phase 3 .................................................................................................................................................. 13
3. THEORETICAL FRAMEWORK ................................................................................................................... 14
3.1 PRODUCTION CONTROL SYSTEM .................................................................................................................... 14 3.1.1 Definition ............................................................................................................................................... 14 3.1.2 Objective ................................................................................................................................................ 14
3.2 PUSH PRODUCTION SYSTEM ........................................................................................................................... 14 3.2.1 Material Requirement Planning (MRP) ................................................................................................ 15 3.2.2 Material Resource Planning (MRPⅡ) .................................................................................................. 16
3.3 PULL PRODUCTION SYSTEM ........................................................................................................................... 16 3.3.1 Comparison of Pull and Push ................................................................................................................ 17 3.3.2 Just-In-Time system ............................................................................................................................... 18 3.3.3 Kanban system ....................................................................................................................................... 19 3.3.4 CONWIP system .................................................................................................................................... 20 3.3.5 Some other pull production systems ...................................................................................................... 21 3.3.6 Comparison of Kanban and CONWIP................................................................................................... 21
3.4 IMPLEMENTATION METHODOLOGY ................................................................................................................. 22 3.4.1 Lean Principles ...................................................................................................................................... 22 3.4.2 Pull system ............................................................................................................................................. 25
3.5 FRAMEWORK .................................................................................................................................................. 26
4. CURRENT SITUATION DESCRIPTION ...................................................................................................... 27
4.1 PRODUCT ........................................................................................................................................................ 27 4.1.1 High Mixed Products ............................................................................................................................. 28 4.1.2 Axle Product family ............................................................................................................................... 29
4.2 PRODUCTION .................................................................................................................................................. 29 4.2.1 Production process ................................................................................................................................ 29 4.2.2 Production condition ............................................................................................................................. 31
4.3 PULL PRODUCTION SYSTEM ........................................................................................................................... 32 4.3.1 Production planning process ................................................................................................................. 33 4.3.2 Production control process ................................................................................................................... 34
4.4 CURRENT STATE MAP .................................................................................................................................... 36 4.4.1 Value Chain overview ............................................................................................................................ 36 4.4.2 Value- Stream- Mapping based description .......................................................................................... 38
5. CURRENT SITUATION ANALYSIS ............................................................................................................. 40
5.1 STRENGTHS .................................................................................................................................................... 40
5(68)
5.1.1 Flow design ........................................................................................................................................... 40 5.1.2 Leveling ................................................................................................................................................. 40 5.1.3 Kanban cards control ............................................................................................................................ 41 5.1.4 FIFO ...................................................................................................................................................... 41 5.1.5 Finished–goods supermarket ................................................................................................................. 42 5.1.6 AXXOS ................................................................................................................................................... 42 5.1.7 Holistic Production Control System ...................................................................................................... 42
5.2 WEAKNESSES ................................................................................................................................................. 43 5.2.1 Long Lead time ...................................................................................................................................... 43 5.2.2 Low Flexibility ....................................................................................................................................... 46 5.2.3 Disconnected flow.................................................................................................................................. 47
5.3 CONCLUSION OF ANALYSIS............................................................................................................................. 49
6. IMPROVEMENT SUGGESTIONS ................................................................................................................. 50
6.1 SOLUTION PROPOSAL ..................................................................................................................................... 50 6.2 IMPLEMENTATION .......................................................................................................................................... 51
6.2.1 Step 1, Identify the pacemaker process and set the Takt time ................................................................ 51 6.2.2 Step 2, Mix leveling and pacemaker scheduling .................................................................................... 55 6.2.3 Step3, Identify where breaks in flow occur and create through processes outside the pacemaker. ...... 60
6.3 THE FUTURE-STATE MAP ............................................................................................................................... 62
7. CONCLUSION AND FUTURE WORK .......................................................................................................... 64
7.1 CONCLUSION .................................................................................................................................................. 64 7.2 RESEARCH CONTRIBUTION ............................................................................................................................. 65 7.3 VALIDITY ....................................................................................................................................................... 65 7.4 FUTURE STUDY ............................................................................................................................................... 65
REFERENCE ......................................................................................................................................................... 67

6(68)
LIST OF FIGURES Figure 1 PTU and RDU Products ............................................................................................... 8 Figure 2 Thesis Process ............................................................................................................. 13
Figure 3 Push Production System .............................................................................................. 15 Figure 4 Material Requirements Planning System .................................................................... 16 Figure 5 Pull Production System .............................................................................................. 17 Figure 6 Kanban type of Pull Production Control .................................................................... 19 Figure 7 CONWIP type of Pull Production Control .................................................................. 20
Figure 8 Lean Implementation Steps ........................................................................................ 23 Figure 9 CONWIP Loops in GKN Driveline ............................................................................. 27 Figure 10 Axle Product and Proportion of variations ............................................................... 28
Figure 11 Daily Demand of Axle products ................................................................................ 28 Figure 12 Axle Product Family Matrix ...................................................................................... 29 Figure 13 Production Process of Axles ..................................................................................... 30 Figure 14 Machine Availability (2011-01-01 00:00:00 - 2011-11-08 09:26:15) ...................... 32
Figure 15 Information flow and material flow in CONWIP system .......................................... 34 Figure 16 CONWIP line using card ........................................................................................... 35
Figure 17 Current State of Value Stream Mapping of PTU ...................................................... 37 Figure 18 Current State of Value Stream Mapping of R60 ........................................................ 37
Figure 19 Current State of Value Stream Mapping of GAP ...................................................... 38 Figure 20 Proportion of Inventory ............................................................................................. 39 Figure 21 Root Causes of Weaknesses ....................................................................................... 43
Figure 22 Comparison of Daily Demand and Batch size .......................................................... 45 Figure 23 Cycle time of PTU ..................................................................................................... 52
Figure 24 Production Process of R60 and GAP ........................................................................ 53
Figure 25 Cycle time of R60 hard cell and GAP hard cell ........................................................ 55
Figure 26 Time for Changeover ................................................................................................. 56 Figure 27 Pacemaker cell Balancing of GAP ........................................................................... 58
Figure 28 Heijunka Box for Axle ............................................................................................... 59 Figure 29 Pacemaker Scheduling .............................................................................................. 60 Figure 30 Future State Map of PTU .......................................................................................... 62 Figure 31 Future State Map of R60 ........................................................................................... 62 Figure 32 Future State Map of GAP .......................................................................................... 63

7(68)
LIST OF TABLES
Table 1 Comparison of Pull and Push ....................................................................................... 18 Table 2 Lead Time and Cycle Time ............................................................................................ 38
Table 3 Cycle Time of PTU ........................................................................................................ 53 Table 4 Takt time of R60 and GAP ............................................................................................ 54 Table 5 Cycle time and change over time of R60 ....................................................................... 57 Table 6 Cycle time and Changeover time of GAP ..................................................................... 58

8(68)
1. INTRODUCTION
This chapter introduces and describes the background of this thesis project. The objective of
the research is presented, and the sub objectives are listed along with the delimitations of the
research. The chapter is concluded by presenting the expected results of this project.
1.1 Background
1.1.1 Company description
GKN is a global engineer group, its technologies and products are used in vehicles and aircraft
produced by the world’s leading manufactures. GKN has four business sectors: Automotive, Powered
Metallurgy, Land systems and Aerospace. There are approximately 40,000 people work in GKN
companies and joint ventures in more than 30 countries.
GKN Driveline is one of the subsidiaries of GKN. In October 2011, GKN Driveline was bought from
Getrag All Wheel Driveline in Köping during this thesis project is conducted. GETRAG All Wheel
Drive AB located in Köping was one of the affiliates of GETRAG Corporate Group; it has a long
history that started in 1856 as Köping Mekaniska Verkstad. It was founded as a joint venture company
between GETRAG, Dana and Volvo Cars Corporation in 2004; currently, there are 700 employees in
GKN Driveline; the turnover was 2 billion SEK in 2010.
GKN Driveline’s customers are the car manufacture companies all over the world; they are including
Volvo, Land Rover, Ford, GM, BMW, Porsche and so on. The production produced includes production
of rear drive units (RDUs), power take-off units (PTUs), chassis parts and components.
Figure 1 PTU and RDU Products
PTU (Power Take-off Unit): It is connected to the transmission and distributes the power back to the
Haldex unit. RDU (Rear Drive Unit): It distributes the power between the back wheels.

9(68)
1.1.2 The background of pull system implementation
GKN Driveline has been working actively for long time to improve the production flow at the
manufacturing departments and looking forward for more continuous develop the production lines,
become more“Lean” and meet the global competition.
Before the year of 2006, GKN’s production plan was forecasted or scheduled by the sales history and
the planners’ experience. It was the typical push production system; the information flowed from
upstream (planner) to downstream (customer).The Pull production system was implemented in 2006.
A first step of an implementation a pull system was initiated by a CONWIP concept. The CONWIP data
base supported by computer was developed, and the production plan was triggered by the customer
orders, when the customer orders received, the order information was transferred to new production
order and provides the information to the first station of the production line, and the whole production
line will follow the production order from upstream.
The second step was the implementation of FIFO (First In, First Out) lanes between the production
stations to visualize the articles produce sequence and buffer size, that means what comes in first should
be handled first, what comes in later waits until finish the previous one. And if the FIFO is filled, the
upstream station should be stopped.
GKN takes continuous improvement as an iterative work and the company found the current production
system is needed to be thoroughly overviewed since many new problems were generated. This
condition requires an overall study work on what and how is going on with the pull system for
continuous improvement, this thesis project was formulated in this situation.
1.2 Problem statement and research objective
A well-function production system is crucial to the overall function of organisation. The company has
benefited by the implementation of CONWIP, FIFO lanes, and supermarkets. The company believes the
potential benefits of a pull system and continuous improvements are great. Therefore, an overall
analysis and evaluation of the company’s production control system will be necessary to obtain more
effective lean shop flow. Thus; the main objective of the thesis project is to
”Contribute to an improvement opportunity study of how the current Pull Production System
can be developed to create more efficient lean shop flow in the particular production unit of
GKN Driveline”
1.3 Sub objectives
In order to fulfill the objective, the following three sub objectives are formulated.
Contribute to an increased understanding of pull production control system including different
methods and tools.
Analysis and evaluate the running CONWIP control System based on lean philosophy.
Provide improvement suggestion according to thoroughly evaluation and assessment.

10(68)
1.4 Expected results
This research presented in this thesis is expected to generate both a scientific contribution to the
research company and a practical contribution to giving the improvement suggestions.
The expected scientific contribution is to review the knowledge of what pull production system
included and how it could be viewed and developed with different methods. Theoretical study of
different production systems will be presented.
The expected practical contribution of this research is to provide the research company with
improvement suggestions; by defining and analysing the weakness in the current system, overall
process of the running CONWIP system will be mapped and audited.
1.5 Delimitation
The first delimitation is that the collected data is only conducted in particular production unit. In this
case, it is hard to reflect the overall complexity of the production process. However, this way easies the
analysis process to highlight the main characteristics of the pull system. For the security and privacy,
some data will not be available in the report.
The result of the thesis are generated from the particular production unit in GKN Driveline, it doesn’t
have precisely compatibility to other companies. It might be able to provide some practical experiment
for the field of pull production system.
Limited time scope (September 2011 to January 2012) available for the project which is undertaken by
the author in partial fulfilment of requirements for the master degree in “Product and Process
Development – Production and Logistics” at Mälardalen University

11(68)
2. RESEARCH METHODOLOGY
In this chapter the methodology of the thesis is described. It stars with the
methodological method, followed by the practical method, finally the research
procedure is outlined and each step is explained.
2.1 Methodological approach
This thesis report is focusing on a single case/project that in the field of manufacturing system. The
purpose is to describe an engineering object and to evaluate and develop. It stars from a theoretical view
to do an overview understanding and analysis; therefore it is expected to be supported by both scientific
and applied research approaches.
2.1.1 Scientific research approach
Production control system could be seen as a manufacturing system which has its planning structure and
implementing structure. As an on process project, production planning process is an open and dynamic
system either to external or internal environments. According to Arbnor & Bjerke (2009), there are
some scientific approaches could be applied:
System approach
System approach rooted from three main overlapping philosophies- system theory, holism and
structuralism. (Arbnor & Bjerke, 2009) A system contains more or less distinguishable components.
And the system could use these components to show its potential functions or phenomenon. A system
has the adaptability to its environment. It is, to some extent, plastic and adaptable so that it would act
interactive continuously to the events within the environment. Meanwhile, a system cannot avoid
intension and conflicts which enable system the ability to obtain new information about what is
happening and to create new idea, more purposeful arrangement. And sometimes when talking about a
system without talking about its components, it is about its objectives. (Arbnor & Bjerke, 2009)
Analytical approach
The analytical approach is to point out the variation and invariant which interact and change regarding
of their environment. It needs to answer two questions consistently: what are the facts; and how to
explain the facts? (Arbnor & Bjerke, 2009) One important concept within analysis is hypothesis. Not all
analytical studies start with the formulation of hypotheses. There are a number of studies which are of
descriptive character. However the hypotheses could include possible patterns which guide or template
that provide structure to purely descriptive studies.
Analytical approach with a high ambition is to find explanations. The type of data collected for
analytical studies is to confirm or reject the formulated question. It is attempting to find the best way to
organize data for analysis. Analytical studies are also appearing in system and actor approaches, the
close connection to theory is missing to some extent.

12(68)
In this project, the objective is to describe the current system in a clear way and hope to get the
shortness of the system and find the improvement solutions. The attention is on both of the system
description and the logical structure. System approach is used to recognize the whole running
production system; and the analytical approach is used to analyze and diagnose the details of
components and how the changes of these components will affect the whole system. Hence, these two
scientific approaches are not independent; both of them would be used more or less in different phases
of this project.
2.2 Applied research methods
As mentioned before, this research is both project-oriented and practical-oriented. It could be
considered as project research. There are some practical research methods which help to perform this
project in practice. In this project research, the practical methods used are literature review, interview
and shop floor visiting.
2.2.1 Literature review
Literature review is an essential step for this project research. Since this project is a particular case with
its unique characteristics, it is necessary to get general theories and methods for guiding and suggestion.
Literature reviews could provide a solid background for a research paper's investigation. A
comprehensive literature review could provide comprehensive angles to analyze and evaluate this
unique topic. The literature mainly comes from books, reports and articles in periodicals.
2.2.2 Interview
The interview method of research, typically, involves a face-to-face meeting in which a researcher
(interviewer) asks an individual a series of questions. This is the most used applied method for this
research. In this project, interview is the mainly way to do the quantitative and qualitative empirical
data. The supervisor is the main interviewee. The interview is mostly going as a face to face meeting.
2.2.3 Shop floor visiting
Shop floor visiting is the best way to show how everything is going on in the daily work. It always goes
with interview when something could not be clarified. The shop-floor visiting method could be seen as
a common used and scientific one; it is the main inputs of this research.
It is necessary to mention that discussion is a very important ingredient of the interview and shop-floor
visiting. It furthers the understanding about each question and inspires new questions. It is interactive
and brings the project research into the right way.
2.3 Research Procedure
According to the objectives, listed in chapter 1.3, the thesis includes three phases that illustrated in
figure 2. The objective is to work as a catalyst during the time of the thesis.

13(68)
Figure 2 Thesis Process
2.3.1 Phase 1
The first phase is to get an overview of GKN Driveline by information from supervisor Ekrem Güclü.
After a brief understanding of the organization and structure, shop floor visiting in the target production
unit is scheduled.
Interviews are held at different stations in the targeted production unit. Information is gathered about
present situation concerning material control method, material supply method, information flow,
equipment, labor resources and so on. Visits to the production plant are made to get a deeper
understanding about working processes, culture and organization. Meanwhile, theoretical study is
conducted to guide the better understanding.
2.3.2 Phase 2
This phase intends to increase the knowledge of understanding of the current state of material flow and
information flow. It is very important in terms of data gathering. The information is gathered via
interviews, observations and internal documentary. Old studies are also used to accelerate the learning
about the present situation. For an effective analysis it is important to map the present situation and
identify areas of improvement.
To get a deeper knowledge on related theories and science, regarding area lean tools study is made
parallel within the phase. This can be used to underline the following suggestions and solution.
2.3.3 Phase 3
Iterative discussion and the implementation theory are most contributed to the final development of the
improvement proposals. Useful information derives from discussions with persons involved in the
different areas and from documents along with empirical findings. Due to the scope of this thesis no
simulation or optimization modeling will be used. Instead, the problem formulation will be approached
in another pragmatic way of working.

14(68)
3. Theoretical Framework
This chapter presents the theoretical framework of this project; it defines the conceptual basis of push
and pull in the scientific discussion clearly, followed by the discussion of various pull control systems.
Final part is the implementation methodology.
3.1 Production Control System
Production is a process whereby raw material is converted into semi-finished products and thereby adds
to the value of utility of products, which can be measured as the difference between the value of inputs
and value of outputs (Abha Kumar, 2004). According to this definition, Production processes can be
conceived in at least three different ways: 1) as a process of converting inputs to outputs, 2) as a flow of
materials and information through time and space, and 3) as a process for generating value for
customers.
3.1.1 Definition
Production control may be defined as “the process of planning production in advance of operations;
establishing the exact route of each individual item, part of assembly; setting and finishing dates for
each important item, assembly and the finished products, and releasing the necessary orders as well as
initiating the required follow-up to effective the smooth functioning of the enterprises.
(http://www.mbaknol.com/operations-management/production-control-definition-objectives-levels-and-
factors/)
Henry Fayol (1916) also defined production control and which is more general and could be applied in
nowadays; production control is the art and science of ensuring that all which occurs is in accordance
with the rules established and the instructions issued”. Thus, production control regulates the orderly
flow of materials in the manufacturing process from the raw material stage to the finished product.
3.1.2 Objective
Production control aims at achieving production targets, optimum use of available resources, increased
profits through productivity, better and more economic goods and services etc. Effective production
control systems are those that produce the right parts, at the right time, at a competitive cost.
Production control systems can be broadly be classified into two types based on the control techniques
adopted: Push and Pull systems, the traditional Material Requirement Planning (MRP) represents the
push type of production control. One the other hand, just-in-time (JIT) is an effective and proven pull
type of production system. (Kelkar, 1999)
3.2 Push production system
Push System: In a push system, releases are scheduled. So, throughput is determined by an exogenously
set release rate (given by the Master Production Schedule). Since the releases are linked to orders (or

15(68)
forecasts), a push system is controlled by upstream information and is inherently make-to-order. In
terms of our nomenclature, open lines are push systems because they have no endogenous restriction on
releases to the line. (Spearman, 2000)
Figure 3 Push Production System
This system works on Master Production Schedule (MPS) and a continuous updating of the central
computer database is carried out for each activity completed. As a result, quick and easy tracking of job
progress can be done from any user terminal in the plant. Work in process (WIP) is used as a means of
absorbing uncertainties in processes and the changes in the demand. In practice, however, this system
often creates one or both of the theses problems (Singh, 1996)
It may lead to starvation and excessive stocks simultaneously at the different stages because
of the imbalance of stocks between various stages.
It may lead to conditions where, manufacture employs excessive capacities of equipment
and/or manpower.
Even with these problems, it is considered robust and conservative when compared with pull production
system in some aspect like provision for buffer stock, availability of user-friendly software, savings on
investments of designing pull type setup times.
3.2.1 Material Requirement Planning (MRP)
MRP (Materials Requirements Planning), MRP is the basic process of translating a production schedule
for an end product (MPS or Master Production Schedule) to a set of time based requirements for all of
the subassemblies and parts needed to make that set of finished goods.
Computer integrated Manufacturing (CMI) represents the culmination of manufacturing computer
involvement that began with material requirement planning, a suggest improvement over older reorder
point system, in the early 1970s. Before MRP, the production control was based on some variant of
statistic reorder points. Essentially, this meant that production of any part, finished products or
component was triggered by inventory for that part falling below a specified level.

16(68)
Figure 4 Material Requirements Planning System
MRP is the classic push system. The MRP system computes production schedules for all levels based
on forecasts of sales of end items. Once produced, subassemblies are pushed to next level whether
needed or not MRP system works by taking a production forecast and turning it into a serious of
component forecast, by using the Bill of material (BOM) and routers, which break down each finished
goods into its basic components. The mechanic of MRP start with breaking the time frame into time
buckets and exploding BOM into various levels, then aggregate capacity calculations are balanced via
occupied resources times by all components demand quantities in all the time buckets. The scheduled
receipts from suppliers are also consider to fit into the overall horizon, the final schedule is obtain
stratifying all of these constraints ,and it might show some excess capacity in some time buckets or
might ask for overtime work and/or sub-contracting.
3.2.2 Material Resource Planning (MRPⅡ)
The expansion of MRP to include more control apart from only planning was a next step for the
manufacturing engineers; production system is coupled with other dependent requirements like machine
hours, labor hours and capital. Shop floor progress and vendor information are also considered to
finalize the output quantity and time. All departments can have access to MRPⅡ database and few
changes in manufacturing practices are enhanced in it. Commercial MRPⅡ softwares are composed of
a manufacturing part (bills of material, part routings etc.) and a control part for the production process.
It is rightly called a closed loop MRP system.(Amod. S, 1999)
3.3 Pull production system
Pull System: In a pull system, releases are authorized. That is, there is an endogenous signal based on
system status that determines whether a release is allowed or not. In particular, the system status that
triggers releases is based on stock voids, which means that a pull system is controlled by downstream
information and is inherently make-to-stock. In our nomenclature, closed lines are pull systems,
because buffer spaces act as stock voids to trigger releases. (Spearman, 2000)

17(68)
Figure 5 Pull Production System
This is a simplified control technique, which is designed to response quickly to the demand changes; it
needs minimized record keeping and simple method. The downstream machines pull the production
form the upstream ones bases on the demands created at their output buffers. Some kind of signal is sent
(in the form of kanban cards, containers, tags, etc.) to the upstream machines to indicate the demand for
a particular component. So the product flow and information flow are in opposite directions to each
other, the prior ones being in the forward direction.
In a pull type of production control, MPS is used only as a broad outline of the requirements for
resources at the different work centers. As regard to the usage of the MPS, this is used for the broad
outlining and not for the individual workstation’s production rate. The built or triggered schedules move
to the backward direction with the help of some form of signals.
3.3.1 Comparison of Pull and Push
It can be simply summarized that the difference between pull and push system is the difference between
producing to order and producing to schedule. According to Sperman (2000), push system will be that
where production jobs are scheduled. Pull system, are those where the start of the one job is triggered by
the completion of another.
The controversial discussion of pull and push systems found in publication in the field of production
and inventory management in the beginning of 80’s can be seen as the starting point for an ongoing
discussion on an increasing boarder. The comparison study is summarized as Table 1.
18(68)
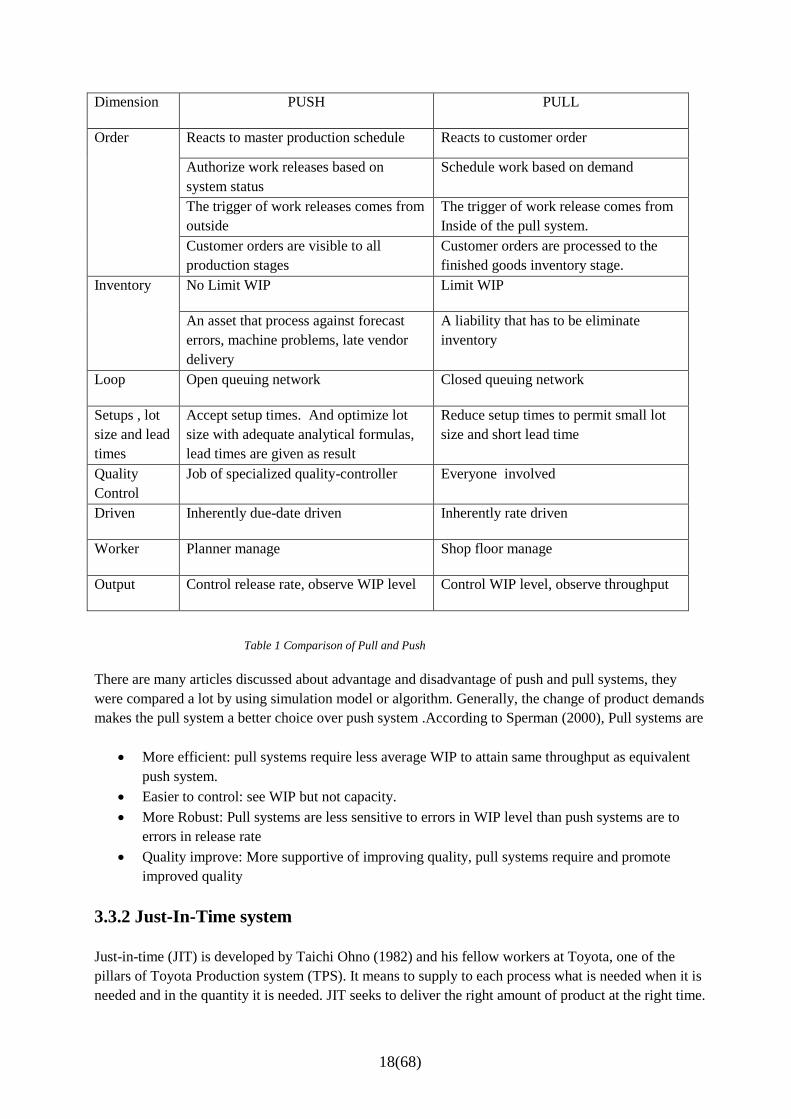
Dimension PUSH PULL
Order Reacts to master production schedule Reacts to customer order
Authorize work releases based on
system status
Schedule work based on demand
The trigger of work releases comes from
outside
The trigger of work release comes from
Inside of the pull system.
Customer orders are visible to all
production stages
Customer orders are processed to the
finished goods inventory stage.
Inventory No Limit WIP Limit WIP
An asset that process against forecast
errors, machine problems, late vendor
delivery
A liability that has to be eliminate
inventory
Loop Open queuing network Closed queuing network
Setups , lot
size and lead
times
Accept setup times. And optimize lot
size with adequate analytical formulas,
lead times are given as result
Reduce setup times to permit small lot
size and short lead time
Quality
Control
Job of specialized quality-controller Everyone involved
Driven Inherently due-date driven Inherently rate driven
Worker Planner manage Shop floor manage
Output Control release rate, observe WIP level Control WIP level, observe throughput
Table 1 Comparison of Pull and Push
There are many articles discussed about advantage and disadvantage of push and pull systems, they
were compared a lot by using simulation model or algorithm. Generally, the change of product demands
makes the pull system a better choice over push system .According to Sperman (2000), Pull systems are
More efficient: pull systems require less average WIP to attain same throughput as equivalent
push system.
Easier to control: see WIP but not capacity.
More Robust: Pull systems are less sensitive to errors in WIP level than push systems are to
errors in release rate
Quality improve: More supportive of improving quality, pull systems require and promote
improved quality
3.3.2 Just-In-Time system
Just-in-time (JIT) is developed by Taichi Ohno (1982) and his fellow workers at Toyota, one of the
pillars of Toyota Production system (TPS). It means to supply to each process what is needed when it is
needed and in the quantity it is needed. JIT seeks to deliver the right amount of product at the right time.

19(68)
JIT is the classic pull system. The basic mechanism is that production at one level only happens when
initiated by a request at the higher level. That is, units are pulled through the system by request.
JIT is a manufacture philosophy, is often confused with Kanban, Kanban is one of the varieties of
method which are used to implement JIT to meet its objectives. The JIT philosophy encompasses not
only kanban but also totally quality control, set-up reduction, and worker participation.
The main objective of JIT manufacturing is to reduce manufacturing lead times which is primarily
achieved by drastic reductions in work-in-process (WIP). There are three main kind of stockholding:
incoming material, work-in-process and finished goods. JIT aims to reduce each of them through a
holistic principle. The result is a smooth, uninterrupted flow of small lots of products throughout
production. These stock reductions will be accompanied by sufficiently great improvements in quality
and production to result in unheard-of cost reductions.
JIT philosophy has proved to be a reliable tool , but it also true that JIT is not equal beneficial to every
type of industry and it takes considerable time and study to determine the correct JIT scheme for a given
industry.
3.3.3 Kanban system
The kanban system is an element of just-in-time system that has captured the most attention of
researchers. Kanban is a Japanese word that means“visible sign”or card. The kanban system is
viewed as an information system. The kanban contains information such as the kanban type, component
name and number, the station location and the destination station .The function of kanban includes:
Controls the amounts of raw material amounts and of material in Work In Process
Smooths the out flow, if sized properly
Tells when and where there is a problem in the process
Assures there is always just enough material on hand to make what is needed
(James Chapados and Agnieszka Perlinska, 2009)
An advantage of the kanban system is its ability to control production. Other advantages include its
simplicity in production scheduling, reduced burden on operators, and ease of identification of parts by
the kanbans attached to the containers and substantial reduction in paper work.
Figure 6 Kanban type of Pull Production Control

20(68)
Monden (1993) and Suzaki (1987) discuss the different types of kanbans and their functions. These
include withdrawal kanbans, production kanbans, supplier kanbans, and signal kanbans, common
kanbans, tunnel kanbans, express kanbans and emergency kanbans. Different kinds of kanbans generate
different function in the given condition. But the common operation rules of kanban can be summarized
as following.
Downstream operations come to withdraw parts from upstream operations.
Make only the exact quantity indicate on Kanban
Demands are replaced on upstream operations by means of cards or other signals
Only active parts are allowed at the workplace, active parts should have specific locations.
Authorization to produce is by card (or signal) only.
Each Kanban card circulates between a particular pair of workstations only.
Quality at Source is a requirement. Only good item are sent downstream.
The number of Kanban should be reduced as problems decrease.
3.3.4 CONWIP system
CONWIP stands for Constant Work in Progress. Sperman et al. (1990) introduce the CONWIP system.
CONWIP is considered to be one of pull mechanisms that demonstrate an ability to be effective in
utilizing the production resources in fulfilling the customer requirements. It is a production release
method that uses cards for continuous regulation of the flow of work. It is a kanban philosophy applied
to a group of machines considered as a single kanban cell. (Kelkar, 1999)
In CONWIP controlled production system, customer’s need of finished products is fulfilled from the
buffer inventory in front of the last workstation at the end of the line. Once a product from the finished
products inventory is withdrawn by the customer, cards are detached from it and transferred upstream to
the first workstation according to predetermined priorities of the backlog list. Then parts are processed
as quickly as possible until they returned in the last buffer as finished goods. A production order is just
questioned when a finished product is withdrawn out of the production line.
Figure 7 CONWIP type of Pull Production Control

21(68)
3.3.5 Some other pull production systems
There are some other JIT techniques developed by researchers, they are presented in the following text.
Drum buffer system
It is a scheduling method develop by Goldratt (1988),in which the flow of production is balanced in
such a way that bottleneck stages are fully utilized and other stages are forced to produce in
synchronization with them, the mechanism force them to produce at the pace of the bottlenecks aiming
at synchronous production.
Basestock system
The basestock system control limits the amount of inventory between each production stage and the
demand process (Kimball, 1988). Each machine tries to maintain a certain amount of material in its
output buffer, subtracting backlogged finished goods demand, if any, this amount is called basestock
level of the machine, to operate, the end process transfers demand information to all the machines for
which are separate cards. Hence, if there is only one machine, it is same as Kanban system.
Periodic Pull system
In this system, manual information processing time of a kanban method is replaced by online
computerized processing, this results in reduced lead times and inventory and faster system response.
(Kim, 1985)
Long pull system
The triggering mechanism for this method works in same way as that for a Pull system. However the
control of this method encompasses more than one workstation, in this system, one unit is allowed to
enter the system at the same time one unit is pulled at the end of pull line, the individual buffer
capacities are not restricted, but the total number of unit in the span of a long pull is limited. Once job
enters at the first machine in the span (after signalled by the last machine), it is pushed through the
middle stages. (Lambrecht and Segaert, 1990)
3.3.6 Comparison of Kanban and CONWIP
Many comparisons of CONWIP and Kanban can be found conducted by simulation; generally, for the
purpose of controlling a single production line, kanban and CONWIP share many characteristic. Many
of the environmental and psychological effects of kanban will be present in a CONWIP system. The
motivation of the CONWIP policy is that pull based systems works well with shorter flow times and
reduce inventory levels compared to push system, but in the kanban system, it is hard to implement in
production environments with a high number of part number or a significant amount of setups (Pull
system control types chapters 3.2 P60).
According to Spearman (2000), CONWIP is more general than kanban in several respects:

22(68)
Under CONWIP, WIP is not maintained for each part number. In particular, production
lines which produce many different parts face serious practical problems, there simply
is not enough room to have a stand container of each part number present, and if there
were, WIP levels would be higher than necessary. CONWIP can solve this problem in
many cases because the backlog allows explicit control over which parts are produce
and in which sequence.
CONWIP allows explicit sequencing of part production so set-ups can be incorporated
in the planning process. In production environments where it is not economically
feasible to eliminate significant set-ups, kanban is generally thought to be inappropriate
(Hall 1983).
CONWIP allows sequencing of job to be done by production control personnel when
appropriate. This is in contrast to KANBAN where the sequencing is done on the shop
floor. Sequences may need to be controlled when job have different priorities.
With the distinct bottleneck system, CONWIP will tend to collect WIP at the bottleneck,
which will tend to produce higher utilization of the bottleneck, and therefore greater
throughput than kanban, since there will be generally be WIP at the process centers
upstream from the bottleneck at all times.
3.4 Implementation methodology
The modern manufacturing industry is facing the rapid growth of competition in the global market.
There is a pressing need to develop integrated manufacturing systems which can respond flexibly to
market demands and still maintain high productivity. It is a challenge for the organization to find the
most applicable and effective system, and the chosen system need to be reviewed and continuous
improvement by time.
3.4.1 Lean Principles
The implementation method is one of the expected outcomes of this project; the implementation of pull
production system is based on the Lean philosophy. The five-step thought process for
guiding the implementation of lean techniques is easy to remember, but not always easy to achieve:

23(68)
Figure 8 Lean Implementation Steps
1. Specify value from the standpoint of the end customer by product family.
The critical starting point for lean thinking is value. It is expected to specify value from the standpoint
of the end customer. It is only meaningful when products meet the customer´s needs at a specific price
and specific time. Value is created by the producer. However it is hard for producers to accurately
define the values. In order to come over the difficulties and specify value, producers should firstly
challenge traditional definitions of “value”. It means that producers should not just simply fall on lower
cost, increased product variety and instant delivery. It is expected more to see what is really needed. The
second thing producers need to do is to define value in terms of the whole product. The whole supply
chain thinking should be paid enough attention by each single producer. Then it requires producers to
talk with its customers in a new ways to rethink value. The final element in value definition is to
determine a target cost. To determine a target cost is based on the amount of resources and effort
required to make a product of given specification and capabilities if all the currently visible muda were
removed from the process. (Womack and Jones, 1996) There are eight typical non-value-adding wastes
described by TPS (Liker, 2004):
Overproduction
Waiting
Unnecessary transport
Over processing
Excess inventory
Unnecessary movement
Defects
Unused employee creativity
The main non-value-adding waste is overproduction, because it could generate other wastes. However,
making flow does simply mean to eliminate waste one by one. It needs much preparation work and a
holistic vision which guides a strategy towards flow.
2. Identify all the steps in the value stream for each product family, eliminating whenever possible
those steps that do not create value.

24(68)
The value stream is the set of all the specific actions required to bring a specific product through the
three critical management tasks of any business. (Womack and Jones, 1996) identifying the entire value
stream for each product is the next step in lean thinking. Lean thinking must go beyond the firm to look
at the whole. Creating lean enterprises requires a new way to think about firm-to-firm relations, some
simple principles for regulating behavior between firms, and transparency regarding all the steps taken
along the value stream so each participant can verify that the other firms are behaving in accord with the
agreed principles.
3. Make the value-creating steps occur in tight sequence so the product will flow smoothly toward
the customer.
The third principle is Flow. Once value has been specified, the value stream for a specific product fully
mapped and obvious wastes eliminated, it is time to make the remaining, value-creating steps flow.
However the traditional “functions” and “departments” concepts always block producers realizing real
flow. The performing tasks in batches are always thought as best. The batches and queues are common
used by most manufacturers blinding other common senses. The lean thinking is to redefine the work of
functions, departments, and firms so they can make a positive contribution to value creation and to
speak to the real needs of employees at every point along the stream so it is actually in their interest to
make value flow. There are three steps to make value flow.
The first step, once value is defined and the entire value stream is identified, is to focus on the actual
object and never let it out of sight from start to finishing. The second step is to ignore the traditional
boundaries of jobs, careers, functions and firms to form a lean enterprise removing all impediments to
the continuous flow of specific product or product family. The third step is to rethink specific work and
tools to eliminate backflows, scrap, and stoppages of all sorts so that the design, order and production of
the specific product can proceed continuously. (Womack and Jones, 1996)
There are also some practical techniques to prepare for flow (John, 2004):
Level out workloads and pace production by Takt time/pitch time;
5S;
Standardizing work and operating procedures;
Total productive maintenance;
Visualize management;
Reduce changeover;
Avoid monuments and think small
4. As flow is introduced, let customers pull value from the next upstream activity.
The subjective of pull is customer orders. Let the customer pull the product rather than pushing products
onto the customer. It means short-term response to the rate of customer demand without overproduction.
There are two levels which express the meaning of pull. On the macro level, the production process
should be triggered by customer demand signals. The trigger point is expected to be pushed further and
further upstream. On the micro level, there is responding to pull signals from an internal customer that
may be the next process step I the case of Kanban or an important stage in the case of Drum/Buffer.

25(68)
5. As value is specified, value streams are identified, wasted steps are removed, and flow and pull
are introduced, begin the process again and continue it until a state of perfection is reached in
which perfect value is created with no waste. (James P. Womack ,1996)
The five powerful ideas in the lean tool kit needed to convert firms and value streams from a
meandering morass of muda to fast-flowing value, defined and then pulled by the customer. And it
reveals the inherent thinking to pursue perfection. The techniques themselves and the philosophy are
inherently egalitarian and open. Transparency in everything is a key principle.
3.4.2 Pull system
Pull system design is a late step in Lean implementation; there is a lot to do before introduce Just-in-
time, Kanban or CONWIP, reducing demand amplification, reducing changeover, creating more stable
work through standard work, reducing the defect rate, and reducing disruptions through breakdowns.
According to Nicholas (1998) a number of conditions need to be fulfilled to make implementation of a
pull-based system successful. The requirements are:
Decentralized responsible for planning and controlling
Pull-based production is dependent of supervisors and production personnel to have some
responsible regarding planning and controlling production.
Focus on consumer based production
A fundamental requirement is that production can only be initiated when actual demand exists.
Never initiate manufacturing because available time exists at line.
High quality and preventive maintenance
Production with low inventory levels requires a high level of availability and that material are
sent to the next step, which has to hold desirable quality.
Short setup times
Small batch sizes are necessary for production with low inventory levels, which also requires
short setup time.
Flow shop layout
In order to synchronies production processes some sort of connection needs to be established
between disjoint working stations and production cells with remaining production steps.
Furthermore, capacity and possibility to produce according to tact time needs to be leveled
across all stations to be able to even out the material flow.
John Bicheno (2008) summarized the necessary steps for pull system design as below.
Ensure demand is smoothed as far as possible
Product family identification by analysis
Value stream mapping identification of constraints
Strategy and subcontract issues
Segment the map into Value stream loops
Calculate takt time
Identify constraints convergence and variation

26(68)
Decide container size or move quantity
Decide takt time or pitch time
Build to finished goods or directly
Investigate continuous flow possibilities
Locate supermarket
Decide on the pacemaker
Level production at the pacemaker
Calculate batch size at changeover stages
Design Kanban loops
Design material handling routes
Form cells and line design
Kaizen
3.5 Framework
The main part of theoretical framework introduces some basic theory of production control systems, the
purpose of this chapter is to build the foundation and guide line to the future research through holistic
view, and it shows the production control systems are able to facility the production system efficient
and competitive. The implementation methodology part share some general concept of implementing
method which enables the theory and technique become the practical technology in production control
area.
Based on the above theoretical discussion, a conceptual production system framework is built;
reviewing the revolution of production system brings better understanding of the objective of this
project, the discussion of various pull production helps to analysis of the real scenario. And the
implementation method guides to generate the practical improvement suggestion.

27(68)
4. Current Situation Description
This chapter illustrates background according to the problem attempted to solve in this project.
The current production condition is presented first. Following the production system within
GKN is described. The value stream mapping assists to clarify the description. The detail of
this part is strongly coupled to the quality of the following chapters.
In the modern industry, there are a lot of companies are using lean philosophy to revolutionize their
production system to gain more competitive advantages. There are existing practical experiences of pull
system, but no one can be mature enough to be implemented in different kind of manufacture
environment. The manufacturing environment itself may have a greater impact in system performance
than the type of control strategy used. It is important to analysis environment factors related to
production control strategies.
As a Lean-thinking automotive manufacture, GKN Driveline has its unique production condition. Some
benefits were generated after the CONWIP design had been implemented from 2006; however, new
problems and challenge are pushing the organization to further its development. The process is a
forward iterative developing: diagnose problem, propose improvement action plan, implementation
method and over and over again to reach Kaizen (Continuous Improvement).
4.1 Product
The main products in GKN Driveline are rear drive units, power take-off units. And the main sub
components of the final products which manufactured by company include crown wheel, pinjong,
alumina housing and axle. They are assembled with other parts in the assembly line according to
customers’ specification. The production system targeted by this study is the axle manufacturing unit.
Figure 9 CONWIP Loops in GKN Driveline
The Figure 9 presents the general relation of the production units from upstream to downstream. Think
of the flow instead of discrete production process, the whole plant is linked by several pull loops. In
each loop, the CONWIP system was implemented. These loops are linked by several supermarkets. The
production is expected to trigger by customer orders, the goods are drawn from the finished goods
inventory to meet the customer demand, and the shortage of the finished goods inventory will trigger
the assembly line to assemble more to fill the inventory to the fixed level. Meanwhile, the intermediate
inventory will be consumed and trigger the welding unit and Pinjong unit. The welding unit must draw
the manufactured parts in the intermediate inventory which trigger the manufacturing departments
produce more, and the raw material shortage is needed to be filled. The inventories in the table include

28(68)
three common items, raw material inventory, WIP, finished good inventory. The raw material is blank
axle. The WIP includes two types of in-process product: products in the waiting queue followed by each
processes and products in the intermediate inventory, which built as supermarkets in GKN Driveline.
4.1.1 High Mixed Products
The Figure 10 is one picture of the PTU axles. There are totally 15 kinds of axle manufactured in GKN
Driveline, from both of customer’s attribution and the production technology process; the products
could be grouped into 3 product families: PTU, R60 and GAP. The proportion of three variations can
be found in Figure 10.
Figure 10 Axle Product and Proportion of variations
GKN Driveline’s axle products are high mixed, each product family has several categories; there are 8
varieties of PTU, 5 varieties of R60 and 2 varieties of GAP respectively. Meanwhile, according to the
Demand Pattern illustrate in Figure 11, there has huge demand variation.
Figure 11 Daily Demand of Axle products
PTU 60%
R60 14%
GAP 26%
Daily demand

29(68)
The blank axles are outsourced from suppliers. All the products are highly customized; but they have
similar manufacture process on the similar machinery. All products are based upon technical
specification and each axle is unique, the production process is challenged to produce the mixed product
families.
4.1.2 Axle Product family
A family is a group of products that pass through similar processing steps and over common equipment
in the downstream processes. The Figure 12 shows how the axle product families grouped; one axis
shows the operation steps and equipment and the other axis shows the products.
Figure 12 Axle Product Family Matrix
4.2 Production
The characteristics of the current production mainly reflect on its product and production process, the
production process and condition of the axle are necessarily reviewed before introduce its production
control system.
4.2.1 Production process
The part goes to the production process, roughly, the axles are processed by the sequence of soft
process, heat treatment process and hard process. Here the production planning process would not be
covered. Since each axle has its own characteristic, they are not following the same process exactly, and
some process must be worked in the specified station. The following production flow chart could be
helpful to understanding production process of axles.
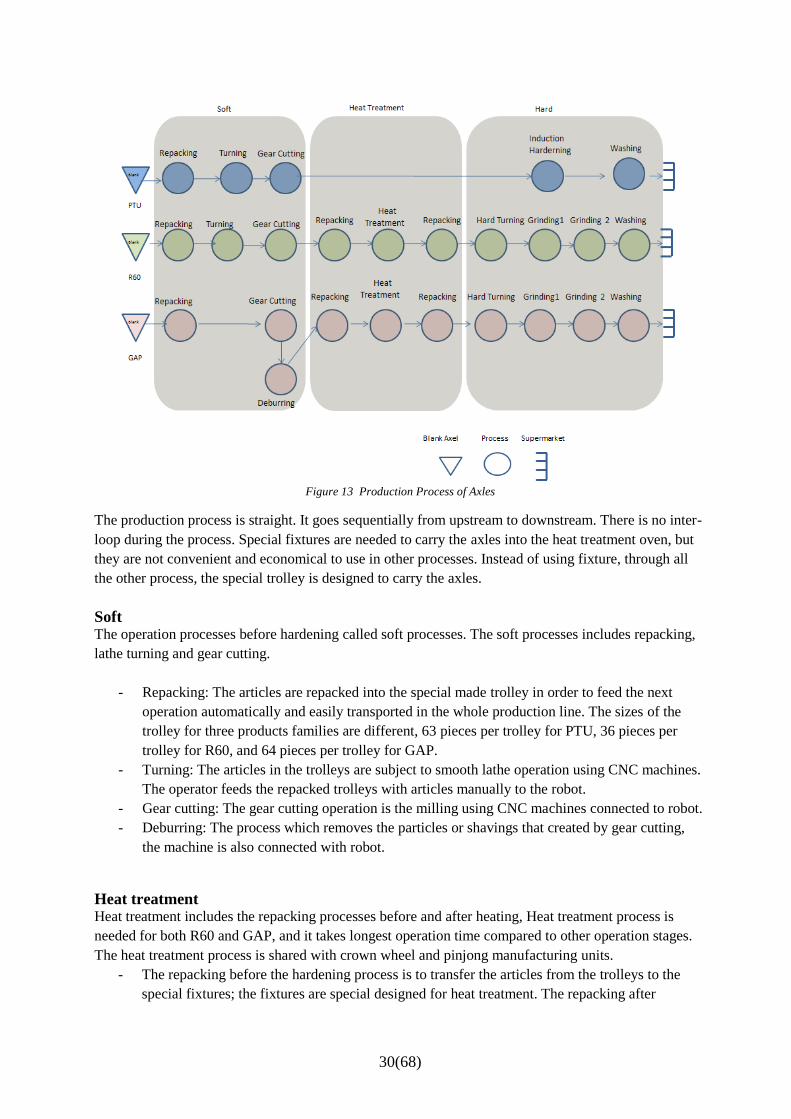
Figure 13 illustrates the production sequence for the axle production unit. The company separates the
plant into the soft process area and hard process area and heat treatment. That means, the processes
before heat treatment called soft, and the processes after heat treatment called hard. The three colors
represent three product families which have been grouped. Blue is for PTU group, Green is for R60
group and red is for Gap group; the entire blank axles are stored in the warehouse, and finally after
manufacturing process, they will be delivered to the supermarket and waiting for welding.
30(68)
Figure 13 Production Process of Axles
The production process is straight. It goes sequentially from upstream to downstream. There is no inter-
loop during the process. Special fixtures are needed to carry the axles into the heat treatment oven, but
they are not convenient and economical to use in other processes. Instead of using fixture, through all
the other process, the special trolley is designed to carry the axles.
Soft The operation processes before hardening called soft processes. The soft processes includes repacking,
lathe turning and gear cutting.
- Repacking: The articles are repacked into the special made trolley in order to feed the next
operation automatically and easily transported in the whole production line. The sizes of the
trolley for three products families are different, 63 pieces per trolley for PTU, 36 pieces per
trolley for R60, and 64 pieces per trolley for GAP.
- Turning: The articles in the trolleys are subject to smooth lathe operation using CNC machines.
The operator feeds the repacked trolleys with articles manually to the robot.
- Gear cutting: The gear cutting operation is the milling using CNC machines connected to robot.
- Deburring: The process which removes the particles or shavings that created by gear cutting,
the machine is also connected with robot.
Heat treatment Heat treatment includes the repacking processes before and after heating, Heat treatment process is
needed for both R60 and GAP, and it takes longest operation time compared to other operation stages.
The heat treatment process is shared with crown wheel and pinjong manufacturing units.
- The repacking before the hardening process is to transfer the articles from the trolleys to the
special fixtures; the fixtures are special designed for heat treatment. The repacking after

31(68)
hardening is to take the articles back from fixtures to trolleys in order to release fixtures and
prepare for the following processes.
- At hardening station, articles from other two manufacturing units arrives (pinions and crown
wheel), the logic used is to enter fixtures in the long convey.
- The induction hardening for PTU is another kind of heat treatment which processed by
induction hardening machine with short cycle time, it is different with the heat treatment for
R60 and GAP which are heated in the oven.
Hard The processes after hardening process which includes hard turning, grinding and washing.
- Hard turning: After the hardening operation, form change can happened to the articles, thus a
hard lathe operation using CNC machines, after finishing the operation, a measure control
performed.
- Grinding: The precision of gears are affected by the hardening process, thus a grinding
operation using CNC machine is to achieve a minimum friction.
- Washing: The articles are washed to remove all the unwanted previous operations results before
the axles can be connected to the crown wheel.
4.2.2 Production condition
Machine group
Most of manufacturing process is considered by a group of machines, e.g. Six turning lathes, five gear
cutting machines, etc. each machine could process one axle at the same time. And most of machine has
the flexibility to process different axles.
Machine capacity
Load of machines is required by calculating run time of working time per week. Demand and cycle time
to get capacity hours per working day times of a machine.
Capacity load = (requirement of product x cycle time of machine)/ Standard working time
By comparing the calculate capacity load with the standard capacity load to check if the requirement of
product could be met.
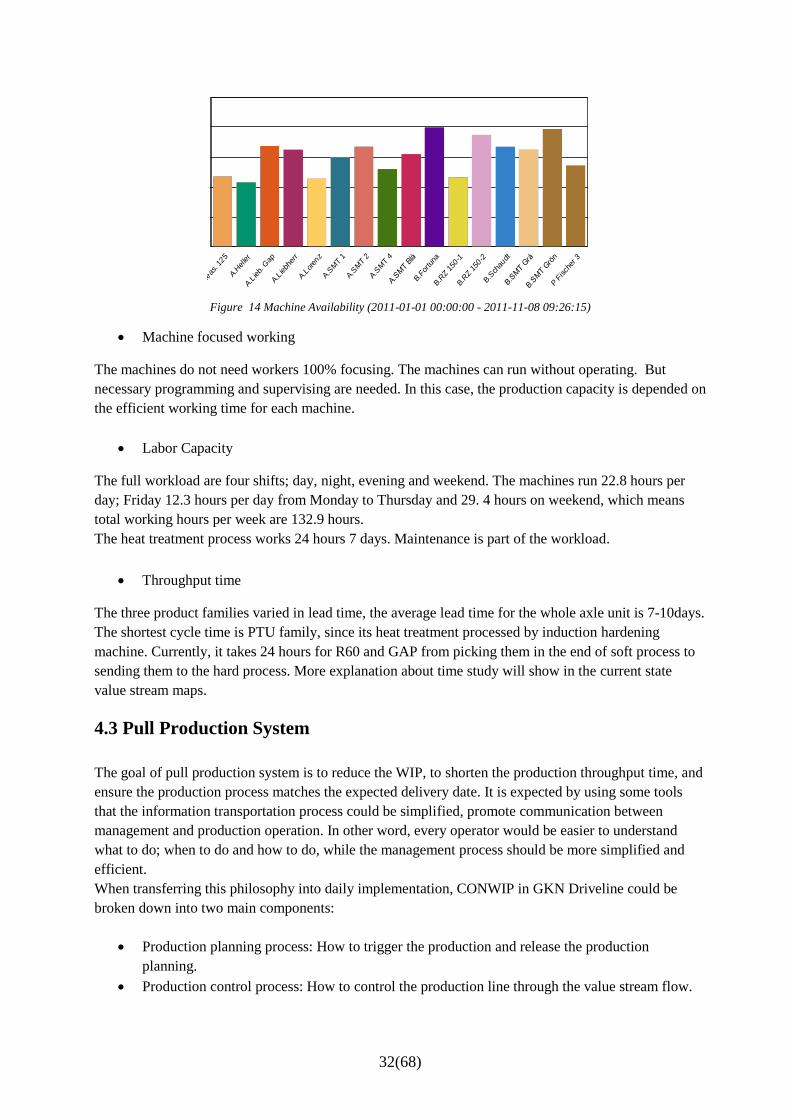
Machine Availability
The target machine availability rate is 77%, assistant by AXXOS, the actual result of the machines
availability rate could be found in Figure 14.
32(68)
Figure 14 Machine Availability (2011-01-01 00:00:00 - 2011-11-08 09:26:15)
Machine focused working
The machines do not need workers 100% focusing. The machines can run without operating. But
necessary programming and supervising are needed. In this case, the production capacity is depended on
the efficient working time for each machine.
Labor Capacity
The full workload are four shifts; day, night, evening and weekend. The machines run 22.8 hours per
day; Friday 12.3 hours per day from Monday to Thursday and 29. 4 hours on weekend, which means
total working hours per week are 132.9 hours.
The heat treatment process works 24 hours 7 days. Maintenance is part of the workload.
Throughput time
The three product families varied in lead time, the average lead time for the whole axle unit is 7-10days.
The shortest cycle time is PTU family, since its heat treatment processed by induction hardening
machine. Currently, it takes 24 hours for R60 and GAP from picking them in the end of soft process to
sending them to the hard process. More explanation about time study will show in the current state
value stream maps.
4.3 Pull Production System
The goal of pull production system is to reduce the WIP, to shorten the production throughput time, and
ensure the production process matches the expected delivery date. It is expected by using some tools
that the information transportation process could be simplified, promote communication between
management and production operation. In other word, every operator would be easier to understand
what to do; when to do and how to do, while the management process should be more simplified and
efficient.
When transferring this philosophy into daily implementation, CONWIP in GKN Driveline could be
broken down into two main components:
Production planning process: How to trigger the production and release the production
planning.
Production control process: How to control the production line through the value stream flow.
1
20
40
60
80
100
A.G
leas
. 125
A.H
eller
A.L
ieb. G
ap
A.L
iebh
err
A.L
oren
z
A.S
MT 1
A.S
MT 2
A.S
MT 4
A.S
MT B
lå
B.F
ortuna
B.R
Z 150
-1
B.R
Z 150
-2
B.S
chau
dt
B.S
MT G
rå
B.S
MT G
rön
P F
isch
er 3

33(68)
So far, GKN Driveline realizes the concept of CONWIP or other production control system is a
business tactical philosophy which involves the firm’s manufacturing strategy as well as its business
strategy, it is not just using some visual tools.
4.3.1 Production planning process
Even the best schedule is only a plan of what should happen, not a guarantee of what will happen.
Schedules are prepared relatively infrequently compared to shop floor activity; the schedule may
regenerated weekly, while material flow, machine failure, and so forth happen in real time.
Manufacturing planning address decisions on the acquisition, utilization and allocation of production
resources to satisfy customer requirements in the most efficient and effective way.
Currently, the customers are requested to send 90 day forecast, which are revised once a month. In
addition, they send weekly delivery plan to the company for the next week’s shipping requirement.
What happens to the information sent from the customer once it reaches GKN Driveline? Currently, the
monthly schedule is fed over into the MRP, which sends instruction by Monday morning to each
department--- crown wheel, axle, pinjong and assembly---about what to make the coming week. As
each department reports back periodically to the production planning system what is actually did that
week (because the production does not go exactly as scheduled), the weekly production schedules are
continually adjusted to bring what is making into synchronize with what the customer wants.
Leveling
The production scheduling process begins with the takt decision; it is a weekly management agreement
of request demand and the fulfillment of capacity. The decision levels the actual customer orders and
provides a production pace which reflects the frequency of customer demands.
The interval of takt decision is one week that means that every week the takt is revised by management.
The fixed customer demand comes monthly; the logistics department transfers the customer demand
into the weekly production target to fulfill the customers’ requirements by leveling. The weekly
meeting on every Monday shows weekly production goal of all manufacturing unit. By which, the
manufacturing unit could arrange the working shifts. Also based on the weekly goal, the planner
calculates the daily demand and total backlog and then updated the information in the system. The takt
decision is not only a forward leveling process, but also retrospection to the previous takt decision and
its fulfilled situation.
Computerized CONWIP systems
The production planner maintains two computerized CONWIP systems to supported operation to
identify what to do and how many. One of them is named LIPS. Its interface shows the total demand,
WIP and Finished inventory. The logic is to enter the highest priority lot of articles, the priority is
calculated by the following formula (1), less consuming days considered as the higher priority. The less
consuming days means more urgent. Then if the finished goods inventory is consumed, the priority will
be changed, by this way, it triggered the new lots. The operator in the first station of the CONWIP loop
initials the new lot by following the priority in LIPS.
(1)

34(68)
And the other electronic information system named Qlikview whose information is based on LIPS. It
gives the information about the status of the inventory level, which compared the stock level with the
target stock level. If the stock level is lower than the target level, the number will be highlighted by red
color. Meanwhile the percentages of stock level priorities the sequence, which supports the operator to
understand which one should be processed first if several articles share one station. The formula (2)
explains the logic.
(2)
4.3.2 Production control process
In GKN Driveline, CONWIP has been implemented from 2006, which is totally different from the
previous push production system which is more focused upon output volume. After the production
planning process is completed. The generated takt decision in the leveling process is transferred into
computerized CONWIP systems; shop floor follows the working rules of the systems. There are several
rules used in GKN driveline: CONWIP loop, Kanban card, FIFO and supermarket. These rules are
expected to work as a holistic system to enable the production flow.
CONWIP Loop
As explained how the production is triggered. It is not difficult to find the flow in the plant is looped by
several production unit, manufacturing, welding and assembly. Each production unit can be seen as one
big CONWIP loop. There are three loops in manufacturing; they are axle, crown wheel and Pinjong
respectively.
Figure 15 Information flow and material flow in CONWIP system
Take axle manufacturing for example, it is one CONWIP loop where production is triggered by the
shortage of the intermediate inventory before welding. It is expected that send the inventory refill
information to the first station of the axle production unit, the production is expected to initiated by the
refill information which tells what and how many to do. This is assisted by the Lips system as
described. After the first stage is triggered, the following process follows the FIFO (first in first out) or
checking the inventory level in the Qlikview till finish all the downstream process in the loop and fill
the inventory level.
Physical kanbans
Local information board

35(68)
The table called local information board is weekly follow-up variant which located in each production
unit to show the takt decision. Since the weekly takt decision is transferred to daily takt, the table is
filled daily. The comparison of daily throughput and the takt is made, if the output meets the takt
decision, it will be labeled green, and otherwise, it will be labeled red.
In the real production process, the board is to present an overview of the whole production throughput;
it shows the daily planned outcomes and real outcomes, which facilities the managers monitor the
production. The daily takt decision is also transferred to each shift; another table in the same board
shows the expected output of each shift in each day. The tables are filled by the leader of each shift
every day.
Visual Cards
There is one operation card go with trolley through production line, it is generated by the LIPS system
only when the quantity of waiting is more than the batch size. This card illustrates the operation process
of each article, the quantity of the articles in the trolley and operated time of every process. It is easy for
operator to check the status of the article, if any quality problem happens, it can be traced.
Kanban card is used in GAP group, it is a colored paper attached to the trolley through production line,
it circulates from last station of soft area through the heat treatment to the first station of the hard area.it
can be seen as a small CONWIP loop. When the trolleys of articles are taken by the downstream
process out of the loop, the cards will be removed and returned to the first station of the loop, the figure
could be help to explain how the kanban card works. The number of cards for each product are limited
which depends on the level of the intermediate inventory and batch sizes.
Figure 16 CONWIP line using card
The cards which are used in axle unit are applied by two products, the instruction of how to use the
cards is explained in the card, and also it shows the total volume of the cards which controls the WIP.
FIFO and Supermarket
FIFO means first in first out. The term is used in accounting as a method of calculating the cost of
inventory and in warehousing as a means of rotating stock and managing inventory. FIFO lanes employ
the same first in, first out concept to regulate and manage the job flow in a manufacturing operation;
they are established and sized to hold a limited number of jobs.
The sized and positioned FIFO lanes are established in the shop floor of axle unit. The size and position
are marked by the black lines next to the stations. The operators withdraw the articles in the trolley from
the FIFO lanes which are filled by the upstream operator in sequence. And send the trolley to the down

36(68)
stream’s FIFO lane. If the FIFO lane is fully occupied, it is expected that operators stop filling and
producing that article till the available vacancy in the lanes.
Similar as FIFO lane, supermarket is where items are stocked and replenished when inventory reaches a
predetermined level. Where it is not the store clerk but the customer himself who goes to get what he
needs in the store. When a worker from the downstream process, called "material handler", comes to the
store and picks up newly finished parts, it also returns a signal of production - i.e. the downstream pulls
things from the upstream and at the same time pushes information to the upstream via Kanban cards.
This is needed, because the upstream process is expected never produces parts without instruction from
the downstream process.
The supermarket is set between the axle production unit and welding unit. That means the welding
operator is the material handler who will pull the articles. The supermarket is also sized and positioned,
the operator in the downstream process of the axle unit is responsible for fill the supermarket, he or she
is also expected to stop filling and producing when the supermarket is fully filled till the welding
operator withdraw the articles and vacancies are available. The inventory level is subcontracted and
informed the first stage of the production line via LIPS.
By explaining the production planning process and production control process, it is clear to understand
how CONWIP is designed to works on daily level in GKN Driveline, even though they are described
separately, they work as a holistic system and the coordinate with each other to realize the goals.
4.4 Current State Map
To better understand the current status of axle production unit, the value stream mapping (VSM) is used
as tool which can combine material processing steps with information flow as well as other important
related data. VSM is arguably one of the most powerful lean tools for an organization wanting to plan,
implement and improve on its lean journey. This tool allows users to create a solid implementation plan
that will make the most of their available resources. The value stream is mapped in order to future
analysis to reduce the waste in processes, enable flow, and move the process towards the ideal of rapid
response to customer pull.
4.4.1 Value Chain overview
This project is mainly focus on the axle production unit, the three products families are grouped in
Figure 13, here mapping the value stream mapping for three product families respectively, which
illustrate the daily production processes were able to realize by the information flow and physical flows.
On the three mappings, the information processes are same. The value chains start with order taking
process which begins when company obtains order from customer and ends when the orders are
fulfilled are delivery. It excludes the quoting and orders confirm process. For order taking, the company
applies Build to Order (BTO) which is the most appropriate approach for pulling system. For
purchasing process, it is based on customer order and production schedule, the forecast and delivery
schedule is provided to supplier monthly. When the material is purchased, they are stored next the soft
production area, and follows FIFO to withdraw the material.

37(68)
The internal production process are similar of the three mappings, the physics flows start with the
feedback from the supermarket , goes through sequence production processes at ending and pulled by
the welding which is the next production unit. For better explain and analysis, the R60 family group is
illustrated by dividing into input axle processes and intermediate axle process. These value stream maps
are the baseline for improvement and for future state value stream mapping.
Figure 17 Current State of Value Stream Mapping of PTU
Figure 18 Current State of Value Stream Mapping of R60

38(68)
Figure 19 Current State of Value Stream Mapping of GAP
4.4.2 Value- Stream- Mapping based description
Value added activities
The value added activities are which help creates conformance to the customer’s specifications. It is
something which the customer would be willing to pay for.
Non value added activities
Here illustrate some essential data drawn from the value stream maps, they help to identify and
understand in the process. Waste is defined as any non-added value to final products.
Lead Time Cycle Time
PTU 16.2 days 4.8-5.3 Minutes
R60 Input 32.6 days 13.7 Hours
R60Intermediate 19.4 days 13.9 Hours
GAP 38.8 days 13.7 Hours
Table 2 Lead Time and Cycle Time
According to this table, the TPT ranges from 16.2 days to 38.8 days. Including 4.8 minutes to 13.9
hours value added time. Thus the non- value adding time is extremely long. That means there would be
a huge achievement for GKN Driveline if TPT could be shorted. The data result from the VSM could
reflect the realistic working condition.

39(68)
Inventory, in the form of raw materials, work-in-progress (WIP), or finished goods, represents a capital
outlay that has not yet produced an income either by the producer or for the consumer. Any of these
three items not being actively processed to add value is waste.
The Figure 20 shows the inventory proportion according the value stream mapping, the non- value
added inventories are most built by raw material and the finished goods in supermarket as well as the
WIP ,Especially the raw material inventory it occupied 60% of the inventory. Followed by WIP exclude
in hardening stage and finished goods in supermarket, The WIP in hardening process should be
highlighted as it occupied most of WIP.
Figure 20 Proportion of Inventory
As the inventory is built in different form in these processes, a large part of an individual product's life
is spent on waiting to be worked on, In the axle production unit, the raw materials waiting in the
warehouse, the WIP waiting in the FIFO lanes and the finished goods waiting in the supermarket. The
waiting is taken as non-value added activities, the more waiting time, the longer lead time. The forklift
is used in some processes as the physics layout limitation, and when the articles moved by the forklift,
the FIFO lanes are disturbed. All these kinds of wasting do not make any transformation to the product
that the consumer is supposed to pay for.
This non-value added actives are just the intuitive result of mapping, the following more specific
analysis of the whole production system will be conducted to present the essence of the current
situation.
60% 17%
21%
2%
Raw Material
Finished Goods
WIP (ExcludeHarderning)
Harderning

40(68)
5. Current Situation Analysis
Analysis of current situation is conducted in this chapter which is the process to search
the improvement opportunity; it is also one of the main objectives of this thesis project.
It starts with strengths of the production control that has been achieved, and then the
weaknesses with the root causes are illustrated.
5.1 Strengths
The strength is to summary what CONWIP in GKN Driveline has been delivered to the current
production system, and these strengths are expected to bring more competitive advantages to the
company.
5.1.1 Flow design
Instead of design the layout by function, where equipment was grouped by type of machines. The
production process is organized by the working flow production. It has the flow production line split
into a number of self-contained units. Each unit is responsible for a significant part of the finished
article and, rather than each person only carrying out only one very specific task, team members are
skilled at a number of roles and manage more than one processes.
GKN Driveline’s production lines are mostly designed by production flow. The axle production unit can
be split into three production subunits, soft cell, heat treatment cell and hard cell. Here they are called
cells since they fit cellular manufacturing, equipment and workstations are arranged in a sequence that
supports a smooth flow of material and components through process, with minimal transport or delay.
The cells deal with each as if they were customers. And take responsibility for its own area. It naturally
reduces the inventory, improve the quality and communication and save space.
Benefits of flow design
Closeness of workers should improve communication, avoiding confusion arising from
misunderstood or non-received messages
Workers become multi-skilled and more adaptable to the future needs of a business. Greater
worker motivation, arising from variety of work, team working and more responsibility
Workers can manage the output pace in their own area.
5.1.2 Leveling
Leveling is in order to meet the customer’s uncontrollable demand; the weekly goal decision is a
leveling process for production work load from the customer order which company can’t change. It
provides a pace for whole plant. According to the goal decision, the whole factory are scheduled to
produce products in a synchronized pace. It also provides a benchmark for the production leader to
speed or slow the production process. The weekly goal decision is updated weekly by logistics
department, and then sent to the production leader, after it will be transferred to daily goal and shift goal

41(68)
by each production unit. It is expected to limit the WIP in planning stage. The goal decision is informed
to operators by the local information board.
What leveling delivered could be summarized as,
Levels production workload (customer orders) and provide a pace for the whole plant’s
production process.
It also provides the reference limit the WIP at the planning stage.
5.1.3 Kanban cards control
Kanban cards are implemented in GAP family during this thesis project. The cards circulate from the
upstream to the downstream, from the last station of soft area, through the hardening process to the first
satiation of the hard area. When the operator in the hard area receives the cards, he or she sends it back
to the soft area. The operator in the last station of soft area withdraws the articles from FIFO, and sends
to downstream attach with kanban cards; the upstream is able to see the vacancy of the FIFO which is
the refill signal.
The Kanban Cards is newly implemented in one of axle during process the project. The benefit can be
summarized as below:
Connect the flow before and after hardening process
Limit the WIP by the limit of cards
Visualize the re-order point with FIFO.
5.1.4 FIFO
FIFO is one way to regulate a queue between two decoupled processes when supermarket or continuous
flows are impractical. A FIFO queue is filled by the supplying process and emptied by the customer
process. When FIFO queue gets full, the supplying process must stop producing until the customer
process has used up some of the inventory.
There have stabilized FIFO lanes next to most of the stations, by implementing FIFO lanes to limit the
WIP between two processes, these FIFO lanes are expected to deliver the outcomes as below:
Enhance security of supply
Stabilize the throughput time
Narrow buffers
Clearer feed
Freeing up time for operators
Better satisfied customer
Visual flow and visual production

42(68)
5.1.5 Finished–goods supermarket
The supermarket belongs to the supplying process and used to schedule that process. The ‘customer’
process’s material handler then comes to the supplier’s supermarket and withdraw what is needed, these
withdraws deducted from the stock in LIPS system, where the new production instruction is triggered.
At GKN Driveline, axle is one of the machinery parts that have 15 variants, to make sure meet the
customer, welding department’s demand. Average of 2 days finished goods inventory is the level of
supermarket.
The purpose of the supermarket is to give the accurate production instruction to the upstream process,
without trying to predict the downstream demand and scheduling the upstream process. Currently, the
benefit achieved from finished –goods supermarket has:
Better satisfied the customer by safety stock level
Visualize the availability of finished goods and utilization of the customer
It is expected to limit the overproduction
5.1.6 AXXOS
Most of the equipment’s are installed AXXOS system to follow-up real-time production, it is used to
support key information and statistic of the machines connected to it, the system is based on standard
hardware components. The basic function of the system is monitor of the performance of machines to
support maintenance, it supports the machines capacity.
5.1.7 Holistic Production Control System
These respective components do not work isolated but integrated, it is necessary to overview the current
holistic production system, some functions are delivered by collaboration of respective components
which support the whole system.
Comparatively robust production
Whatever chooses which production systems; meet the customers’ requirement is the basic demand of
any industry. In despite of it is not totally reliable, but the production in GKN driveline is comparatively
robust enough to meet the customer demand normally.
Comparatively Reduced inventory
Compare to the push system, the inventory has been reduced than before. The most significant benefit
of the pull system is the overproduction reducing, the mass production operates as an isolated island,
producing and pushing product forward according to schedules it receives from production control
instead of the actual needs of the downstream customer process. Because this material output is not yet
needed, it must be handled, counted, and stored, and so on. Defects remain hidden in the inventory until
the downstream processes finally use the parts and discover the problem. After CONWIP loop built
between the manufacture units, these problems which are generated by over production are
comparatively reduced.

43(68)
Visualized the production process
The physical kanban, FIFO lanes and supermarket are all have function of visualizing and clarifying the
works, these components are expected to inform the operator what to do , when to do and how is going
as well.
5.2 Weaknesses
The weakness analysis is one of the most significant outcomes of this thesis project, these diagnose
process helps to identify major disadvantages of the current production pulling system and lead to
propose improvement solutions in the later chapter.
Root cause analysis is used to identifying the current weakness’ causes and revealing the current
problems. According to observation and study, three main weaknesses are diagnosed. Long lead time,
this can be found in current VSM by comparing with the real cycle time. The more flexible flow is
desired by the mangers, since the managers found the small demand components always are delayed
and it is not flexible enough to meet the customer demand change. The interrupted flow was found and
it was showed in the current VSM. These weaknesses impair the production system in the same time.
The root causes are needed to be diagnosed .By using the root causes analysis in Figure 21, the
relationship between the causes and results can be illustrated.
Figure 21 Root Causes of Weaknesses
5.2.1 Long Lead time
In the comparison to the short processing time, the lead time is extremely long as the current state of
VSM illustrated. The extra lead time is created by big amount of raw material, WIP and finished goods.
This problem has been explained in the previous chapter, the following explanation is to reveal the
sources, or ‘root causes’ of this problem.

44(68)
Over stocked raw material
The raw material takes 60% inventory (Figure 20). The blank axle suppliers are mainly in USA and
Thailand, the order sent to suppliers monthly and the goods are delivered weekly, and the average of the
delivery time is 7 days, which means the reasonable stock level is 7 days. But currently, according to
the current map, the stock level is much higher than the reasonable level, the high level stock does not
only just longer the pay to paid time but also need handled, counted stored and so on. The lead time can
be shorter by better managing the order and delivery of raw material.
Overproduction
In the comparison to the push system, after running the CONWP, the overproduction is comparatively
reduced; however, there still has a long way to go in GKN driveline. Overproduction is one of the
significant problems which build the long lead time, that means producing more, sooner, or faster than
is required by the customer. There is no clue to find how the company controls WIP; though the system
named CONWIP which stands for constant WIP .The actual finished goods are high level stocked more
than the designed average 2 days safety stock level. That means the finished products need to stay in the
supermarket more than the expected time. The total time spends getting through the axle manufacturing
process is also longer. Overproduction causes many kinds of waste, not only built the long throughout
time, which impairs the flexibility to respond to the customer requirements, but also excess inventory
must be stored, requiring storage space, handled, and sorted. Overproduction can results the shortage,
because process are busy making the wrong things that means you need extra operators and equipment
capacity.
1) Overproduced WIP
In the push system, it controls throughput, observes WIP; the pull system controls WIP, observes
throughput. Pull systems deliberately establish a limit on WIP.
Though the WIP is designed to control by the size of FIFO lanes and the supermarkets. But in reality,
the WIP is not well controlled; it is easier to conclude that because the operators do not follow the rule
which is stopping produce if FIFO lanes and supermarket are filled. It can be one of the factors,
Through the analysis, the other reasons can be explanation of the root causes of building the WIP and
also can be the reason of why operator could not follow the rule.
Large Production batch problem
The production batch is constrained by the raw material container of blank axle, when the production
order is given from the LIPS system, the container of the blank axle is taken from the stock, the whole
container of blank axles will be putted into the production process in the first production stage, to avoid
to send any rest of the blank axles back to the stock .However, there are big gaps between the container
sizes and the daily demand from the customer, welding department. The Figure 22 shows the gap
clearly, some of the parts have quite low demand, but the batch sizes are several times bigger than the
daily demand. For example: PTU -E, PTU –F,PTU -G and R60-D ,From this point, it is quite obvious
that the WIP can be built by the big production batch.

45(68)
Figure 22 Comparison of Daily Demand and Batch size
It is true that the operator could stop producing when the FIFO lane is filled, however, with the big
batch size; the new production is likely to be got during he or she stop running the machine. The
sequence is put all the rest of the articles in the process and then run the new order. This way makes the
WIP out of control and violates the pull systems’ logic that includes control WIP and measure the
throughput and only produces what is needed.
Batch-producing will increase the impact of problems, lengthen the lead time, and mean that the
supermarket supplied parts has to be ready to meet sudden demand surges. “Being ready” means
keeping more batched process parts in inventory in the supermarket, which again increases lead
time, obscures quality problems and, in general, causes all those wastes associated with overproduction.
Also it not only generates long lead time, meanwhile brings swelling inventories, great opportunities for
defects and excess idle time and overtime.
Unfollowed Takt decision
It is a strength that GKN Driveline makes the takt decision and update weekly through leveling process,
the work load is leveled to meet the customer requirement. However, it only used for board outlining for
set the pace of whole plant, but not for the individual workstation production rate. It can be better used
as a benchmark of the production throughout target. One of the most important functions of the takt
decision is pace the production. The takt time is often calculated to monitor the production, if produce
faster than the takt time, it will over produced, if slower it would not meet the customer demand.
In the axle manufacturing unit, the takt decision informs the operator in information board every
Monday. every operator knows the throughput target, however, no matter how far they are faster than
the target, they will not stop but keep producing, so the axle production unit does not follow the takt
decision to control the pace, the result is overproduction. And without using the calculate takt time, the
manager lose its advantage of giving operator a sense for the rate at which a process should be
producing by a reference time.
Daily demand
Batch Size
Gap

46(68)
2) Over produced finished goods
Because of the big production batch size and without followed pace working, the unlimited WIP
overproduced in the production process, and then the articles transferred to the finished goods stocked
in the stock build overproduction finished goods. In another words, the overproduced WIP is the source
of the high stock of finished goods.
In despite of designed size supermarket in the factory floor, the finished goods stocked over the
supermarket level can be seen, if the supermarket without strict limitation, it will be a chaos in reality
and could not be used to schedule the process. The operator also could not follow the rule of the
supermarket, the reason is also that the big production size of articles were produced in the upstream of
the process, instead of producing the withdraw quantity from the supermarket. If the WIP without
limitation, it is impossible for downstream operators to follow the supermarket rule.
The operators in the upstream keep sending the big batch size of articles to the downstream that close to
the supermarket. The downstream operators keep produce what they get and send to the supermarket.
The whole flow does not use the advantage of the supermarket as expected. Actually, though the
downstream operators check the status of the supermarket to priorities the produce sequence. But the
reason of checking the supermarket is because the production sequence was lost from upstream. The
operator in the downstream has no clue of which article should be prioritized when more than one kind
of articles comes same time, so one method is visual check the supermarket, the other is check the
inventory status of Qlikview. This problem results the schedule goes more than one point in one
CONWIP loop which related to the integrated flow that will explain later.
5.2.2 Low Flexibility
The production often busy with the wrong article could not adapt the customer demand change in the
first time, which means low flexibility. In axle production unit, slow response to customer requirement
changes was found, whether predicted or unpredicted. The poor flexibility can be considered into two
causes, one is process flexibility, and the other is machines flexibility.
Here the machines flexibility is the ability to be changed to produce new product types. The process
flexibility highly depends on the machines flexibility; in axle production unit, most of the machines are
multifunctional, can manufacture more than one kind of axle. According to the report of AXXOS
system, comparatively long setup time is needed in some of processes, such as lathe turning, Gear
cutting and grinding. That results the poor machines flexibility. Some machines are less advanced and
being used many years. Ideally, it will be perfect production environment if the process performance
and cost are independent of setup time. In this project, the machines flexibility will be mentioned but
not thoroughly analyzed. Before short the setup time, the flexible system must be built first. The low
process flexibility is the weakness of axle production unit, since the current system is not adaptable to
the pull production systems with the inefficient way of responding to the customers changes. It is
caused by the LIPS system which brings wrong priority production sequence and without the quantity
information.

47(68)
No quantity information in the reorder point from LIPS
The new production order is triggered when the waiting amount (Total= Waiting+ WIP + the finished
goods) is more than the start point (batch size / container size); the operator in the first stage generates
the new order and withdraws the blank axles. But the released trigger does not give the information of
how many should be putted into the production processes. So instead of following the customer
requirements, Operator follows the start point amount by putting the total big batch size which is the
container size of the raw material from supplier. In this way, the operators could not well response to
customers change. No matter how long the setup time is, machines will keep producing one article at
least one batch before change to another one. So the over large production batch not just results in
overproduction and long lead time, it impairs the flexibility to respond to customer requirements.
Because processes are busy on making the wrong things. It is difficult to get the process make what
customers want.
Wrong production priority
The other cause of low flexibility is the LIPS priority could not present customer’s requirements
correctly. The logic of generate the new order is enter the highest priority lot of article, the priority is
calculated by the following formula, thus the less consuming days, the higher priority.
The production priority in pull system depends on the sequence of customer withdraw from the stock,
the first withdraw the first produce. This formulate does not has this function, it keeps production line
produce the wrong article. The result calculated by this formula is how many days the articles in the
stock and WIP can be consumed, but it could not be the baseline of production priority. The daily
demand varies a lot as explained; it makes the low demand article always with the lowest priority. That
is the reason why the supermarket often lacks of low daily demand articles to provide to the welding
department.
5.2.3 Disconnected flow
The flow means production of product moves from one stage to the next, The ideal production flow is
able to link all process, from the downstream final customer to upstream raw material without detours
and blocks that generates the shortest lead time, highest quality and low cost. Disconnected flow bakes
the waste of overproduction and the waste of waiting time; also makes it difficult to notice production
problems as they happen. When a problem occurs the rest of stations keep on working, by the end of a
shift the unnoticed problems add up and the production volume falls short of the target.
The axle production unit is designed as one CONWIP loop, the flow is expected to goes from the first
station after it receives the production order from LIPS, to the next downstream stations by FIFO lanes.
However, according to the VSMs show, the flow is not smooth from upstream to downstream in one
CONWIP loop, if FIFO lanes connect all the processes in the loop, the flow is possible to go from
upstream to downstream, which could avoid the schedule more than one point in one loop. As the

48(68)
VSM show, the reorder information is not only goes to the first station; it also goes to another point of
downstream station. The two reasons are described as following.
Schedule more than one point
The schedule information is usually goes to the first station in one CONWIP loop; the article flows by
assist of FIFO. Since the flow is interrupted in the axle production and there is no other signals in the
flow, such as kanban cards. The operator goes to the schedule point to reprioritizes in the same pull
loop.
The reprioritization is trying to produce what customer wants in time, however, the articles come from
the upstream after the long processing time, including the value added time and non-value added time.
When the articles reach to the downstream where it is reprioritized, the refill requirement of
supermarket may change already, and the sequence of production demand may not correct. This
problem can generate delays for the customer and create pressure of production.
Lost sequence and Interrupted FIFO flow
GKN Driveline chooses to implement FIFO lanes in CONWIP LOOP to control production sequence
and overproduction, The FIFO lanes are expected to goes from the upstream to downstream welding
department. If the flow is interrupted, the next process could not know which sequence should be
followed.
By reviewing the VSMs, the FIFO flow is always interrupted when the forklift transportation is used
before and after hardening process. The heat treatment process is not close to the soft and hard cell.
That means shipping one trolley at one time is not economical. The trolleys are delivered into the
hardening process and loaded in the repacking area, if there is no enough room, the trolleys that full of
articles will be putted into the shelves next to the repacking area, and the second transportation deliver
them back to the repacking area when the space available. The sequence is totally missed in this point.
There is no sequence to follow, operator in repacking process just randomly repacks the articles to
fixtures send to heat oven, sometimes the leader tell operator which one should be priorities. After the
hardening process, the articles will be repacked back to the trolley and sent to the hard cell, since the
flow is already interrupted, the hard cell could not follow the sequence either, the operator sometimes
ask the leader who could get information from welding or assembly department, or they check the stock
level in Qlikview to decide which product should be produced.
Physics layout can be the factor that interrupted the flow, but should not be the root cause. Since in the
VSM of R60, the gear cutting process is located in the soft area that the same place with the previous
turning process. The articles from lathe turning will be in the FIFO line, but the operator in the gear
cutting checks the Qlickview also.

49(68)
5.3 Conclusion of analysis
The production control works systematically, the respective explanation of the strength or weakness
does not mean they are isolated to each other. According to analysis, it can be found that the function of
the production control system of GKN driveline is far short fall of the possible. The root causes of the
weaknesses helped to diagnose the problems, which also impair the possible strengths.
The problems which need to be solve can be conclude,
Wrong batch size
Unfollowed takt decision
Wrong information from LIPS
Schedule goes to more than one point
Lost production sequence
If these root causes can be solved; the way to strength the advantage and weak the disadvantage in
current production situation could be reached. There should be a great achievement to the axle
production unit in GKN Driveline, which is the objective of this thesis. By trying to get one process to
make only what next process needs when needs it. Linking all processes from the consumer back to raw
material in a smooth flow without detours that generates the shortest lead time, highest quality, and low
cost .This is also the objective of lean production control. The detail of improve method will be
explained in the next chapter.

50(68)
6. Improvement Suggestions
Improvement suggestion is the main objective of this project; the solution proposal is
explained step by step based on the pre-study and analysis. And the implementation
methods are illustrated to explain how the suggested solution can be delivered in the
future.
6.1 Solution Proposal
As the problems which impair the system were diagnosed in the previous chapter, this chapter presents
the solutions to solve these problems and deliver the improvement of the system. The solutions are not
isolated and suggested to be implemented step by step.
Step 1: Identify the pacemaker process and determine Takt time 1
One of the lean guideline is to schedule only one point in the value stream. Work flows downstream
from this point to the customer, and before this point we pull from shared resources. This point at which
we schedule work is called the pacemaker. In a lean value stream, the pacemaker must be identified to
regulate production through the value stream. The pacemaker determines the speed at which the value
stream will operate. Increasing the speed of the pacemaker should result in more products being
produced through the value stream. Slowing down the pacemaker means that fewer products will be
produced.
Having decided what process is the pacemaker, takt time of the pacemaker is needed to be determined,
take time is a reference number that is needed to help match the rate of production in pacemaker process
to the rate of customer demand, it is to balance the pacemaker processes to a constant speed in order to
create flow. Takt time is calculated by dividing the effective working time by the total demand for all
the demand running through the pacemaker; it guides how quickly the flow should produce.
Since the machine cycles time may be fixed and not easily changed, perform a quick check to make sure
they have right amount of equipment in pacemaker capable to support the takt time.
Step 2: Mix leveling and scheduling the pacemaker
To achieve continuous flow and a lean value stream, to this point, it is necessary to design a suitable
information flow from the customer. It is not realistic to expect either the customer demand to be
completely smooth or its product types demand to be constant. Instead of adding more inventories with
large batch size, both volume leveling and mix leveling are needed. The volume leveling made by the
logistic department and sent to each manufacturing unit weekly in GKN Driveline. However, with many
product variants, it is unpractical to produce the larger batches supply the customer. Here in the axle
production unit, there are 15 products grouped by 3 three families, mix leveling is necessary to be
implemented to reduce the batch size, inventory and increase the flexibility.
1 Takt time=Available work time per shift/ Customer demand per shift
51(68)
For leveling mix, first the time interval must be selected. Interval is known as EPEI, which stands for
every part every interval, in short, how long it will take to produce every part in the product family.
Selecting the interval is not a one-time work, it is an iterative process. As continuous improvement
activities take place, the interval can be reduced. Creating the small interval requires quick changeover
and high machine reliability, what setup times are needed to support the interval need to be checked.
But it brings flexible flow and low inventory.
After decide the suitable interval, secondly, the pitch time2 should be measured since all the products
are moving by the trolleys. Based on the pitch time and interval, company can establish a material
handler route through the plant. Every pitch time he or she will bring the next pitch times schedule for
the pacemaker process and simultaneously take away one pitch times of production. This allows
managers always know the production target within one pitch time, check progress regularly to stop and
quick response abnormalities.
To realize the leveling and scheduling, thirdly, two visual approaches need to be used, one is Heijunka
box (leveling box), and the other is kanban card. A typical Heijunka box has horizontal rows for each
member of a product family, a vertical column for identical time intervals of production, production
control kanban cards are placed in the slots, in the proportion to the number to be built (Lean Lexicon).
As customer pulls from finished goods supermarket, the kanban cards are removed from trolleys and
placed into the load leveling box for the pacemaker process in a level mix. The material handler
withdraws kanban from the box at the pitch time and delivers them to the pacemaker to trigger
production.
Step3: Identify where a break in flow occurs and create through processes outside the pacemaker.
The disconnected flow is a big problem which explained in the previous chapter, and where the break
occurs has been identified in the value stream map. How to connect the flow is needed to answer in this
step.
The lean guideline could be followed is that work flows downstream from pacemaker to the customer,
and before the pacemaker, pull from shared resources. To realize this, from the pacemaker point back
up the stream, parts are replenished at supermarkets by means of simple pull loops from upstream; the
supermarket needs to be settled. And downstream from the pacemaker, FIFO lanes can assist and
support the value stream flows. The logic of the supermarket and FIFO has been explained in previous
chapter. They are the useful tools to assist the work flows.
6.2 Implementation
6.2.1 Step 1, Identify the pacemaker process and set the Takt time
At GKN Driveline’s axle production unit, the products are grouped three product families by the
production process, PTU, R60 and GAP. PUT’s flow is shorter than others as it does not get through the
2 Pitch time=Takt time* Container size

52(68)
heat treatment. Both of the R60 and GAP’s flows get through soft processes, heat treatment and hard
process. Because each product family has it is own production processes, the pacemaker for each
product family is different with each other, and balance each of process to their own constant speed by
the Takt time in order to create flow.
PTU
For the PTU products, the most downstream washing process and the drilling process are shared with
other products, meanwhile only one article in PTU family through the drilling process. Therefore, they
cannot be dedicated to the PTU family. Since gear cutting process does not cover all the PTU family,
one of the articles goes through the drilling instead of this station. Therefore it could not be the
pacemaker either. The pacemaker should be chosen from the repacking, turning and induction
hardening processes. Since it is expected to flows downstream from the pacemaker and pulls before it.
Because the totally cycle time is not very long, the author choose the turning process as the pacemaker
for the PTU product family.
If the totals demand for parts in turning station are 7705 units per week of eight different products. This
gives 1541 units per day. And the effective working time in turning station is 1368 minutes three shifts
per day (subtract 30 minutes break for morning and afternoon shift, 20 minutes for night shifts). As a
result, the takt time is equal to 54 seconds. This is the average takt time for PUT product family, in
other words, welding department (customer) are able to take products from axle production unit at the
rate of every 54 seconds.
Figure 23 Cycle time of PTU
However, if review the cycle time which means how frequently a finished goods actually comes off the
end of the pacemaker, it is quite obvious that the cycle time 164seconds in turning process is much
faster than the takt time 54seconds. It is impossible for the turning catch the pace. One solution makes
0
20
40
60
80
100
120
140
160
180
Takt time=54s
cycle Time

53(68)
it possible is there are more than one turning machines available for the PTU family. As the Table 3
shows there are totally 68.17 hours (245404 seconds) needed to produce one day demand. If the up time
is 90%, along with the available working time is 22.8 hours (82080 seconds), it can determine 3.3
turning machines are needed. In reality, the SMT1, SMT2 and SMT 3 are dedicated to PTU family, the
Finsher 3 and SMT 4 can be used also, that makes sure the equipment capacity is able to support the
takt time.
Part Number Cycle Time (C/T) Demand
(Per day)
C/T*
Demand(Sec)
PTU-A 217 488 105896
PTU-B 109 147 16023
PTU-C 129 451 58179
PTU-D 153 259 39627
PTU-E 217 25 5425
PTU-F 109 43 4687
PTU-G 129 83 10707
PTU-H 108 45 4860
Sum(C/T* Demand) of Time Needed 68.17H
Up time 90%
Available working time 22.8H
Machines Required 3.3
Table 3 Cycle Time of PTU
Another way to ensure the capacity support the takt time is increase the working time, or reduces the up
time; In this case, choose to change the working time if only three lathe machines (SMT1, SMT2, and
SMT3) can be used. It needs 2.5 hours extra to support the takt time if the uptime does not change, it
can be realized by longer the shifts.
R60 and GAP
For R60 and GAP products, though there are two family groups, however, their similarity makes it
possible for illustrate their pacemakers together. Since the axle production unit is designed by flow.
There are three production cells. The common ground of these two products family is both of them get
through soft cell, heat treatment and hard cell ,and inside the three cells, the FIFO lanes are used,
whereas between the two cells. And the flows are interrupted in the same way for both R60 and GAP.
The Figure 24 could explain the current situation.
Figure 24 Production Process of R60 and GAP

54(68)
In this case, the heat treatment is the constrains of the whole flow with its longest cycle time, it is
unreasonable to pace the whole output by the constraint process, so it can not be the pacemaker. Since it
is expected to flows downstream from the pacemaker and pulls before it. if choose the soft cell as the
the pacemaker, the long process time might be the effect the throughput time. it is difficult to flow to
the downstream process. Therefore, it can not be the pacemaker either. The downstream hard cell could
be the best choice as the pacemaker for both R60 and Gap families.
For the R60 input axles, the pacemaker will be comprised of grinding and washing process; for the R60
intermediate axles and GAP, the pacemaker inclueds hard turning, grinding and washing processes. The
processes in one cell must be balanced to a constant speed in order to create flow.
The best speed of balance is the takt time,the Table 4 shows the result of caculated takt time for R60
and GAP respectively. The effective working time in hard cell station is 16 hours if two shifts per day,
22.8 hours if three shifts per day (deduct 30 minutes break in both morning and afternoon shift, 20
minutes break in night shift). The daily demand of R60 is 368 units per day for each and the demand of
GAP is 650 unit per day. As a result, the takt time is calculated and shown in the Table 4.
Table 4 Takt time of R60 and GAP
Once identify the pacemaker and establish takt time, Since machines’ cycle time maybe fixed and not
easily changed, labor time is flexible, the cycle time need to be checked to esure the enough capacity
used at the pacemaker can support the takt time. The Figure 25 shows the cycle time of the pacemaker
of R60 and GAP. For the R60 family, both of takt times are much longer than the cycle time,That
means takt time can be supportted anyway. For the GAP family, If the takt time is 126.28 which is
longer than all the cycle time of machines in hard cell. If the takt time is 88.62 seconds, that is shorter
than the cycle time of hard turning. but it is possible to support the demand by balance the cell ,which
will be explained in the next step.
Demand
(Per day)
Takt Time
(2 shifts=16hours)
Takt Time
(3 shifts =22.8hours)
R60 368 156.52 Seconds 223.04 Seconds
Gap 650 88.62 Seconds 126.28 Seconds

55(68)
Figure 25 Cycle time of R60 hard cell and GAP hard cell
6.2.2 Step 2, Mix leveling and pacemaker scheduling
For the takt time and pacemaker are selected for each product family in the previous step, in this step,
the takt time will be used to determine the interval and pitch time which are the necessary elements for
mix leveling , the selected pacemaker will be the schedule point as a herat beat of the whole flow, the
sutibale levling box and kanban will be designed in this step.
Interval and Pitch time
Mix Levling is realized by the Heijunka box with kanban, The interval time needs to be determined first,
it is a balance act of demand, availble equipment resources cycle time and work hours. the smaller
interval brings quicker response and better flexibility. And in this case ,the articles are packed by
trolleys, the pitch time is also need to cauluated. here explain how to set for interval and pitch time, then
follows the design of Heijunka box for each product family.
PTU
Interval
An approprotate interval for PTU families pacemaker process is “Every -part -every- day”. That means
the flow need to produce every part in the family in one day. the goal for the comapny should be have
the interval as small as possible. It could be “ Every -part -every- shift” in the future,however, currently
based on the demand and equipments’ condition, if PTU product family could use this one day
inteveal ,it will be a big step of lean.
If setup times could support the interval should be checked. the effective available time for the turning
station is 22.8 hours (82080 seconds) per day(per interval). the uptime is 90%, From the step 1, if there
58 67
25
127
63
115
25
0
20
40
60
80
100
120
140
92
54
67
25
0102030405060708090
100
GAP
Takt Time
Takt time
Cycle T
ime
R60 Input R60 Intermediate

56(68)
are 4 machines, the total time needed with uptime to support is 1136 minutes (68167.8 seconds)3. As the
Figure 26 illurstate ,that leaves 231minutes (13912 seconds) for changeovers.
Figure 26 Time for Changeover
To produce each product of PTU in one day, there needs to go through maximum eight times
changeovers. 231minutes (13912 seconds) divided by 8 products is 29 minutes. The current average
changeover is 24 minutes, the one day interval allows 29 minutes changeover, that makes one day
inteval can be realized by the current equipment changeover. If the changeovers could not support the
selected inteval, the inteval time has to temporailly increased. On the contrary, if the changeover could
be reduced in the future, the interval could be correspondly shrinked.
Pitch time
For PTU product family, the pack quantity is 64 piece per trolley, the welding department withdraw
finished goods trolley by trolley. From the previous setp , the takt time of the PTU is 54 seconds, so the
pith time is 57.6 minutes (3456 seconds). This would be the basic schedule inrement for PTU ‘s
pacemaker process. For easier implement, 1 hour is used as pitch time, that means in the turning process,
3.3 machines could prouce 64 piece of PTU in 1 hour, if one machine ,there would be 3.3 hours needed.
In this case, three hours is choosen as the schedule increment. The over working time will be used to
cover the 0.3 hours gap.Meanwhile ,there are two more lathe turning machines are installing ,that
ensures the capacity could meet the demand without the overtime working in the future.
R60
Interval
One day inteval is selected for R60 ,which stands for every-part-every-day. There are totally 5 variants
of R60 with totally demand 368 units, 184 units input axles, 184 units intermediate axles. Since the hard
celling is chosen as the pacemaker for R60 family, that means its output rate of the whole cell determine
the pace of the value stream. By comparing the total time needed in each station in the cell as illustrated
in the Table 5, the Grinding 2 staion needs the longest time demand, 38103 seconds with 90% up time.
So only if this station could support the one day interval, the hard cell could support the one day inteval.
The availble time is 2 shifts,(16 hours or 57600 Seconds), that leaves 19496 seconds changeover time,
3 The table 3 illustrates, the total time of 4 machines produce the PTU product family with 90% up time needs 68.17Hours(Total cycle time
demand)/90%=75.74Hours, so each machine needs to runs 75.74 hours/4=68167 Seconds. Available working time is22.8Hours (82080 Seconds) per machine; the remaining changeover time is 82080-68167=13912 Seconds (231minutes).

57(68)
divided by 5 variants, the change over frequency is more than 1.08 hour, that can support the inteval if
refer to the setup time in current state VSM.
For the current demand of R60 family, it is very likely to save the working time resources by balance
the hard cell, since the availble one change over time is much longer than the needed set up time. that
can be the next goal for axle manufatuing department if the customer demand does not increase.
Pitch time
For R60 product family, the pack quantity is 36 piece per trolley, the takt time is caculated is 157
seconds in the previous step, the pitch time is 1.5 hours (157sec*36 piece).This mean the flow of R60
should produce one trolley of products in every 1.5 hours. This would be the basic schedule inrement
for R60’s pacemaker process.
GAP
Interval
For easily implementation, the possibility of one day interval time is checked first. The hard cell is the
pacemaker for GAP family,according to Table 6, the total time demand with the 90% uptime is 15622
seconds (Exclude the short cycle time of washing process), compare with the avaible time, there are
16578 seconds left for change over, and since there are two vairants of the GAP family, each machine
has to reset up once. The average changeover availble time is up to 92 Minutes. The current average of
set up time is 80 mintes, (116 miutes for hard turning, 81minutes for Grinding1 and 41 minutes for
Grinding 2). That means demanded setup time for 2 variants could be supported in the hard cell, it is
able to set the one day inteval for GAP product family.
Part Number Daily Demand Hard Turning CT Grinding 1 CT Grinding 2 CT
R60-A 122 128 s 60 s 125 s
R60 -C 62 124 s 56 s 105s
R60 -B 62 66 s 57 s
R60 -E 83 69 s 76 s
R60 -D 39 56 s 69 s
Total Time Demand(Seconds) 23304 22795 34293
Uptime (90%) 25893.33 25327.78 38103.33
Available Time(2 Shifts) 57600 57600 57600
Total Changeover Time (Seconds) 31706.67 32272.22 19496.67
One Changeover time (Hours) 4.4 1.79 1.08
Table 5 Cycle time and change over time of R60

58(68)
Demand
Hard Turning
CT(Sec)
Grinding 1
CT(Sec)
Grinding 2
CT(Sec)
GAP-A 510 92 54 66
GAP-B 140 101 53 78
Total Time Need (Sec) 140600
Up time 90% (Sec) 156222
Available time 57600*3=172800
Total Changeover time (Sec) 16578
Average changeover time (Min) 16578 Seconds/3 times/60=92Minutes ,
Table 6 Cycle time and Changeover time of GAP
Pitch time
The takt time of GAP family is caulated on both 2 shifts and 3 shifts working time. however, as the
Figure 25 shows, the 2 shift’s takt time 88.6 seconds can not support the hard turning process which
with the 92 seconds cycle time. if the 3 shifts takt time 126 seconds, the working time will not be used
efficiently .
Figure 27 Pacemaker cell Balancing of GAP
The balance work for the hard cell is needed to help balance the work content per station to takt time,
as the Figure 27 illustrated, if the hard turning staion loaded 23 seconds to the Grinding 1 station, in
other word, the hard turning station use 23 seconds in the Grinding 1 station. the work in the hard cell
is balanced and all stations could catch the takt time. The balancing work explains 88.6 seconds can be
used as the takt time that is the customer demand rate.
If the takt time is 88.6 seconds, and the trolley size of the GAP is 63 pieces. So the pith time is 93
miutes. That means in every 93 miutes one trolley of GAP should be produced in the flow.
Heijunka box
To this point, interval and pitch time are decided, how to use the determined prerequisite control the
production to esnures the levlling is consistently achieved. The heijunka box(or leveling box) can be
implemented in the axle production unit.
92
54
78
25
0
20
40
60
80
100
HardTurning
Grinding 1 Grinding 2 Washing
88.6 80
66
78
25
0
20
40
60
80
100
HardTurning
Grinding1
Grinding2
Washing

59(68)
Based on the demand on Figure 11, and the selected interval and pitch time, the Heijunka box can be
designed as the Figure 28. The horizontal rows for each member of product family, the three product
families with 15 variants are inclued. and the vertical columes for time interval of production, the
inteval time for PTU is 3 hours, for GAP and R60 is 1.5 hours. The production control kanban cards are
placed in the created slots. Each kanban indicates one type of the produt with information of part
number, quanitity ,supermarket address and pacemaker address.
Figure 28 Heijunka Box for Axle
Here take PTU PTU A for example, if the daily demand is 484 pieces ,with the trolley size is 64, it
means to produce 7.6 trolleyes could meet the demand, as caculated, in every three hours one trolley is
produced, so the 7.6 piece of kanban cards should be located in the slots. X indicated one card.
In the case of PTU production group, the shift starts at 6 AM. kanbans are withdrawn by a material
handler every 3 hours for distribution to the turning station along the value stream. in the first three
hours, the value stream will produce one kanban of PTU-A,one kanban of PTU-C, and one kanban of
PTU-D, in the second three hours of afternoon shift, it produce ½ kanban of PTU-A and ½ kanban of
PTU-B. one changeover happens here. Because there needs 3.3 machines to meet , only three machines
are assigned here, the capacity is not enough to meet the demand, three kanbans of PTU –A are
produced in the weekend to cover the gap. It ensures small daily demand products could be produced
regularly. For GAP and R60 group, the pitch time are 1.5 hours , one kanban card which indicates the
type and quanity is taken to the hard cell every 1.5 hours. If the card shows new part number,the reset
up is needed. This table illurstates the three product families together, the company could separate the
three families into three boxes and establish in the sutiable place of its own flow.
As times goes and progress is made in reducing changeover times, it is possible to incoporate more and
more products into the steady sequence of each product each cycle, and as the experience grows, its
also possible to vary the volumes and the cycle to more closely match the customer demands, this is a
process to leveled production and one-piece flow.

60(68)
Pacemaker scheduling
The logic of using levling box illustrated by the Figure 29. The purpose is to ensure the flow produces
to replenish what was withdrawn by the production controller in customer (welding department) from
finished goods supermarket.
Once the goods are withdrawned in the finished goods supermarket, The kanban cards are removed
from the trolleys and placed on into the levling box. Then the material handler serving the pacemaker
process withdraws kanban from the slots at the pitch increment(3 hours for PTU, 1.5 hours for R60 and
GAP ) and delivers them to the pacemaker to trigger the production. The kanban cards will be attached
to the trolley from the pacemaker process through the flow. After the produts finished in the flow, the
operator sents the finished goods trolleys with kanban cards to the supermarket.
It is acceptale for axle production unit set one day stock in the finished goods supermarket, then the
production controller in the welding department can withdraw its daily demand amount randomly. If the
mangers prefer to as less inventory as possible, how the welding department withdraws the finished
products is need to be discussed ,because it determines the production order information of axle
production unit.
Figure 29 Pacemaker Scheduling
6.2.3 Step3, Identify where breaks in flow occur and create through processes
outside the pacemaker.
The objective of this step is to connected the flow, the pacemaker has been selected and scheduled. It is
the heart point which determines how the vaule stream flows. To assist the pacemaker regulate and
control the production flow, continous flow, FIFO lanes and pull based supermarket will be
implemented.
PTU
The vaule stream is interputted between the gear cutting and the induction hardering process. since the
upstream turning process is chosen as the pacemaker in step1, and the turning process is close to the
most upstream process which is next to the raw material inventory. the most upstream repacking process

61(68)
can be pulled by the turning process with continous flow. it is not necessary to bulid any FIFO lanes or
supermarket before the turning process.
The reason of interruption of PTU is because of the long distance and transportation, the solution of this
problem is , after finished in gear cutting process ,deliver the finished goods in trolley immediately and
set one FIFO before the induction harderning process. In this case, it is worth to increasing the
necessary moving times. Or derliver four trolleys once but determine the sequence before delivery.
In addition, setting the FIFO lanes between processes from the pacemker to the customer, one purpose
is to set the First in First out sequence. The other is to avoid the overproduction, if the downstream
FIFO lane is filled, the upstream process should be stopped. The FIFO lanes between turning and gear
cutting process is because there are three turning machines working same time, every three hours, one
trolley could be produced in each turning machine. It needs to clear the sequence of many variants
from different machines. Between the gear cutting process and the induction harderning process,
since the cycle time of induction harderning and washing are much short than upstream processes, it is
quite possible to reduce one shift for these two stations, the necessary inventory could be built because
of waiting. The FIFO before the drilling process is because it’s a shared machine with other product
family. The FIFO between induction harderning and washing is also because the washing manchine is
shared with crown wheel. The sizes of FIFO lanes refer to the current sizes.
R60 and GAP
For the R60 and GAP product families, both of their flows are through three designed machine cells ,
soft, heat treatment and hard respectively. However, the function of the machine cell does not efficient
utilized . It is likely to use the three cells to better connect the flows by implemeting continous flow
inside each cell instead of building buffer in FIFO lanes, each cell is taken as one unit instead of station
by station.
Both the flows of R60 and GAP are broken before and after the heat treatment cell, and both of the
flows are rescheduled in the first station of hard cell. For one product of GAP group, the kanban card is
used to circulate from the last staion of the soft cell to the first station of hard cell, it controls the WIP as
it expected, but meanwhile it definitly impairs the productivity, since it sets the heat treatment as the
pacemaker which is the constraint of the flow.
In this step, the pull based supermarkets are setted before the hard cells for both R60 and GAP. Since
the heat treatment is the shared resources with pinjon and crown wheel department, which is difficlut to
pull from the heat treatment directly. The upstream flows before the supermarket is setted as one pull
loop and kanban cards are used to send the signal from the supermarket to the soft cell. One FIFO lane
is setted between the soft cell and heat treatment cell to show the sequence and avoid overproduction.
And because of the long distance, the continous flow in unpractical. The downstream after the
supermarket is taken as another loop which pulled by the finished goods supermarket with kanban cards
after leveling. And another FIFO lane is also setted between the heat treatment cell and hard cell to
control the sequence. To this point, it is possible for the pacemaker heat treatment controls the pace of
the output to meet the customer demands. the flows of R60 and GAP are connected.

62(68)
6.3 The Future-State map
According to the implementation instruction, the future value stream maps for three product families are
mapped respectively as below. Compare the current state maps and future state maps, the future state
maps are able to slove the problems which has been diagnose .
Figure 30 Future State Map of PTU
Figure 31 Future State Map of R60

63(68)
Figure 32 Future State Map of GAP
In particluar, due to leveling production in the pacemaker , the right information sent from the Heijunka
box with the right quanitity information and right sequence.the flexibilty of axle production unit can be
highly increased. The big production batch size is also avoid. And it is possible for the company to
further improve by short the changeover time and maintaining the equipment realibility.
With the shortend production lead times through the pacemaker process operating consitenly to pitch
time,and follow the right Kanban information.The over production could be reduced. The company can
also reduce the amount of raw material it holds to average one week according to delivery time. The
lead time will be shorted in the future.
With the pull based supermarket,and continous flow, the flows could be connected without interruption
and schdeuled in one point in one pace. This correct produciton signal ensures the whole flow operate
the correct products in the right pace.
To this point, it is able to conclude that the five mian diagoned problems are possible to solve
systemtically. Develop the capacity to make every part every interval ,produce to takt time produce
differernt products at a uniform rate; Right schedule information nased on the pacemaker operation;
develop continous flow and use supermakets make sure the work flows. The solution not only slove the
weaknesses root causes, but also get stronger strenthtnes, to facility the entire production system
functions in a better way.

64(68)
7. Conclusion and Future work
This chapter presents the overall conclusion and contribution from this thesis research.
Further, the discussion about validity and this chapter concludes with a discussion of
possible future research topics.
7.1 Conclusion
In this project, the main objective is to contribute an improvement opportunity study of how the current
Pull System can be developed to create more effective lean shop flow in the axle production unit of the
company.
A theoretical study provides a theoretical foundation for the research. The most recently frameworks of
reference were reviewed and inspired the empirical study.
To understand the complex CONWIP situation in the company, thoroughly investigation of the current
production system was performed. Through the better understanding, the strengths and weaknesses of
the current situation in company were identified, especially in terms of weaknesses was emphasised in
this project since which could generate the improvement opportunities that the company could benefit
from. The weaknesses have been summarised as long lead time, low flexibility and unconnected flow.
For future problem solving, the reasons of these weaknesses have been diagnosed. The root causes
approach were used and explained level to level. Besides, Value stream mapping has been very helpful
through the whole project, and since the different of the three product family, more than one maps have
been illustrated for better understanding.
As result of these efforts, the proposals were provided in this phrase, with the instructions which were
explained step by step that could assist the company’s implementation. The proposals aim to solve the
root causes, the detailed instructions aim to future implementation, meanwhile, it was the process of
validation and verification. The developed solution proposals can also be used in other similar
production units in the case company.
The three sub objectives formulated in section 1.3 can be considered to be fulfilled; the research
reviewed the pull production control systems. The evaluation of the running CONWIP control System
was conducted based on lean philosophy. And finally provide improvement suggestion according to
evaluation and assessment.
The research believes the company will benefit from the new production system. The axle production
line can be improved in the future.

65(68)
7.2 Research contribution
This research presented in this thesis expected to generate both a scientific contribution to the research
topic and a practical contribution to solving the identified problems. The main contributions made by
author are presented below.
Scientific contribution
The research has been focused on the area of manufacturing control system; it contributes by
reviewing the different production control system and their relationships. The research includes the
implementation which was developed in collaboration with the company, provides input to
available theory.
Practical contribution
This research has been focused on providing a practical contribution that facilitates the improvement of
production control system based on lean philosophy. The research has generated a proposal instruction
after identified the problems. A three-step frame work for how to conduct the improvement process in
the company was developed.
7.3 Validity
There are many possible ways to assess and evaluate the quality of a performed task; in this case, the
research work is undertaken in a limited environment, the research was mainly based on the empirical
study. It is therefore difficult to measure or compare the outcome of the any other similar projects.
Therefore, the best way to evaluate the research might be not only just focus on the result, but also the
research process.
Possible critique of this research might be related to the author’s interpretations of the studied
phenomena and collected data, which may influence the conclusion.
7.4 Future study
During the research process, one remain problem and several potential areas for future research wok
were identified, some of these areas described below.
FIFO and Kanban Design
The FIFO queues are sized in axle production unit, it not only set the sequence, but also gives the signal
to keep running or stop the supplying process. The right size of the queue is necessary to be studied.
The Kanban cards are suggested to be used, the details of how the kanban circulate in the loops are
needed to be defined, and it determines how the signal flows.
Maintaining the equipment, master the quick change
During this research, it is clear that many stations have quite long change over time, and it is clear that
the change over time affects the productive and planning system. Therefore, a framework for how to
conduct an improvement process in maintain the equipment and master the quick change over is

66(68)
recommended. This potential direction of research could with benefit be combined with the previous
described changeover frequency and smaller batch size.
Formulation of implementation plan
The continuous improvement suggestion and a structure for developing were proposed, there is a need
to develop this structure future and to test it for further adjustments. This could be dome through an
implementation plan.
A possible study in this area could include two parts, the first part would include the simulation
analysing, test how the result could affect the current systems. The second part would include any
necessary plan for one plot product variant or product family and further to creating a new production
control strategy for the company.
Continuous improvement
CI involves an extended journey, gradually building up skills and capabilities within the organization to
find and solve problems. With the future implementation, more feedbacks and outcome would come
out. The future research could focus on collecting the feedback to build other continuous improvement
study to make evaluation and development to responds the change of the organization

67(68)
REFERENCE
Bhim Singh, S. G. (2010). Lean implementation and its benefits to production industry.
International Journal of Lean Six Sigma, 157-168.
Bicheno, J. (2004). The new lean toolbox: towards fast, flexible flow. Buckingham.
Duggan, K. J. (2002). Creating Mixed Model Value Streams: Practical Lean Techniques for
Building to Demand.
F. Bohnen, M. B. (n.d.). Systematic Procedure for Leveling of Low Volume and High Mix
Production.
James P. Womack, D. T. (2003). Lean Thinking: Banish Waste and Create Wealth in Your
Corporation,.
Jose M. Framinan, P. L.-U. (Nov 2010). The CONWIP production control system: Review and
research issues. England: Taylor & Francis.
Kartik Ramachandran, L. W. (n.d.). Criteria for determining the push – pull boundary. Wichita
State University.
Kelkar, A. S. (1999). A JIT Implementation using Hybird Kanban-Conwip Modeling Approach.
University of Regina.
Lee-Mortimer, A. (2008). A continuing lean journey: an electronic manufacture's adopting of
Kanban. Emerald Group Publishing Limited.
Mark L. Spearman, D. L. (1990 ). CONWIP: a pull alternative to Kanban. Taylor & Francis
Ltd.
Mark L. Spearman, W. J. (2008). Factory Physics. Mcgraw-Hill Publ.Comp.
Mike Rather, J. S. (2003). Learning To See: Value Stream Mapping to Creat Value and
Eliminate Muda. Cambridge: Lean Enterprise Institue.
Mike Rother, R. H. (2001). Creating Contious Flow: An action guide for maagers, engineers &
production associates. Cambridge: Lean Enterprise Institue.
Miller, J. (2004). Know Your Takt Time. Gemba Research LL.
Palekar, N. P. (n.d.). Job Sequencing & WIP level determination in a cyclic, CONWIP
flowshop with blocking .
Pettersen, J.-A. (2010). Pull Based Production Systems: Performance,Modelling and Analysis.
Luleå University of Technology.
Peyronnet, F. (1988). Improving Flow in the Workshop. Logistics World, 135-139.

68(68)
R. Carvalho, A. A. (2011, July 6 - 8). Principles and Practices of Lean Production. Proceedings
of the World Congress on Engineering 2011 Vol I.
Renna, P. (2010, September). Dynamic Control Card in a Production System Controlled by
Conwip Approach. Jordan Journal of Mechanical and Industrial Engineering.
Ronald F. Perry, S. M.-T. (1999, Nov 10). Flexible kanban system. International Journal of
Operations and Production Management, pp. 1065-1093.
Spear, S. J. (1999). 5 Rules for Designing, Operating, and Improving Actives, Activity-
Connections and Flow-Paths. Harvard University.
Svensson, G. (2001). Just-in-time: the reincarnation of past theory and practice. Management
Decision, 866-879.
Yenradee, P. V. (1991). A Comparative Study of Push and pull production planning strategies
in Hard Disk Manufacturing Company .
Zazanis, M. L. (1992, May). Push and pull production system: Issues and Comparisons.
Operations Research, Vol. 40, No. 3, pp. 521-532.
http://www.factoryphysics.com/Principle/Station/Asynch/Open/InfinOpen/IBOL_PushPull.htm.
(u.d.). Hämtat från Factory Physics.
http://www.mbaknol.com/operations-management/production-control-definition-objectives-
levels-and-factors/. (u.d.). Hämtat från MBA Knowledge Base.
Kumar, A. (u.d.). http://www.du.ac.in/fileadmin/DU/Academics/course_material/EP_08.pdf.