Published in Electrophoresis. 2014 Jun;...
27
Published in Electrophoresis. 2014 Jun; 35(11):1644-5 1 SEPARATION AND CHARACTERIZATION OF PHLOROTANNINS FROM 1 BROWN ALGAE Cystoseira abies-marina BY COMPREHENSIVE TWO- 2 DIMENSIONAL LIQUID CHROMATOGRAPHY. 3 Lidia Montero, Miguel Herrero*, Elena Ibáñez, Alejandro Cifuentes 4 Laboratory of Foodomics, Institute of Food Science Research (CIAL, CSIC), Nicolas 5 Cabrera 9, Campus de Cantoblanco, 28049 Madrid, Spain. 6 7 8 Abbreviations: D1, first dimension; D2, second dimension; DMBA, 2,4- 9 dimethoxybenzaldehyde; LC × LC, comprehensive two-dimensional liquid 10 chromatography; n c2D , two-dimensional peak capacity; PFP, pentafluorophenyl; PGE, 11 phloroglucinol equivalents; PGU, phloroglucinol units; TOC, total organic carbon. 12 13 Keywords: brown algae, Cystoseira abies-marina, LC × LC, polymeric polyphenols, 14 phlorotannins. 15 16 17 18 *Corresponding author (Miguel Herrero, PhD): 19 [email protected] 20 tel: +34 910 017 946 21 fax: +34 910 017 905 22
Transcript of Published in Electrophoresis. 2014 Jun;...
Published in Electrophoresis. 2014 Jun; 35(11):1644-5
1
SEPARATION AND CHARACTERIZATION OF PHLOROTANNINS FROM 1
BROWN ALGAE Cystoseira abies-marina BY COMPREHENSIVE TWO-2
DIMENSIONAL LIQUID CHROMATOGRAPHY. 3
Lidia Montero, Miguel Herrero*, Elena Ibáñez, Alejandro Cifuentes 4
Laboratory of Foodomics, Institute of Food Science Research (CIAL, CSIC), Nicolas 5
Cabrera 9, Campus de Cantoblanco, 28049 Madrid, Spain. 6
7
8
Abbreviations: D1, first dimension; D2, second dimension; DMBA, 2,4-9
dimethoxybenzaldehyde; LC × LC, comprehensive two-dimensional liquid 10
chromatography; nc2D, two-dimensional peak capacity; PFP, pentafluorophenyl; PGE, 11
phloroglucinol equivalents; PGU, phloroglucinol units; TOC, total organic carbon. 12
13
Keywords: brown algae, Cystoseira abies-marina, LC × LC, polymeric polyphenols, 14
phlorotannins. 15
16
17
18
*Corresponding author (Miguel Herrero, PhD): 19
tel: +34 910 017 946 21
fax: +34 910 017 905 22
Published in Electrophoresis. 2014 Jun; 35(11):1644-5
2
ABSTRACT. 23
Phlorotannins are an important class of polyphenolic compounds only found in brown 24
algae. The chemical analysis of these bioactive polyphenols is rather difficult due to the 25
great chemical variability and complexity of the natural composition of these 26
components in algae, forming large phloroglucinol polymers. In the present work, a new 27
approach based on the use of comprehensive two-dimensional liquid chromatography 28
(LC × LC) is shown to analyze this complex family of compounds. The developed LC × 29
LC methodology is based on the coupling of a HILIC-based separation in the first 30
dimension and a RP-based separation in the second dimension. The employment of this 31
on-line coupling together with diode array detection (DAD) and tandem mass 32
spectrometry (MS/MS) allowed the separation and identification of more than 50 33
compounds in a Cystoseira abies-marina brown alga extract. Phlorotannins containing 34
from 5 to 17 phloroglucinol units were identified in this sample by HILIC × RP-DAD-35
MS/MS. Besides, using the 2,4-dimethoxybenzaldehyde (DMBA) assay, it was possible 36
to determine that the total amount of phlorotannins present in the extract was 40.2 mg 37
phloroglucinol equivalents per g of extract. To our knowledge, this work is the first 38
demonstration of the usefulness of HILIC × RP-DAD-MS/MS for the determination of 39
phlorotannins. 40
41
42
Published in Electrophoresis. 2014 Jun; 35(11):1644-5
3
1. INTRODUCTION. 43
Brown algae (Phaeophyceae) contain a typical kind of secondary metabolites which are 44
classified within the phenolic compounds family, called phlorotannins. These 45
compounds, that may reach a high percentage of the algae dry mass (up to 15 %) [1], 46
are formed as polymers of phloroglucinol (1,3,5-trihydroxybenzene) of different size 47
and composition. There exist four main classes of phlorotannins: fuhalols and 48
phlorethols, containing an ether linkage; fucols, containing a phenyl linkage; 49
fucophlorethols, with an ether and a phenyl linkage; and eckols, which possess a 50
benzodioxin linkage [2]. Besides, it is also possible to find quite complex chemical 51
variability with compounds containing different degree of polymerization as well as 52
structure (linearly linked or branched). It is widely accepted that phlorotannins are 53
components of the algal cell walls that may be forming complexes with alginic acid, 54
although it is not completely clear if they exert a chemical defense function or just an 55
influence on cell wall construction [2]. The genus Cystoseira comprises more than 30 56
species and it is one of the most-important brown algae genera found in the 57
Mediterranean Sea and Atlantic Ocean ecosystems. Cystoseira abies-marina is one of 58
the species already identified as possessing some interesting compounds, such as 59
meroterpenoids [3] and fucoxanthin [4], although it is also a good potential source of 60
phenolic compounds, including phlorotannins. 61
These latter compounds have recently raised attention as algae have been pointed out as 62
a potential source of bioactive compounds potentially useful for the food and 63
pharmaceutical industries [5]. In this regard, some researches have already hinted that 64
phlorotannins may confer with different bioactivities, including antibacterial [6,7], anti-65
diabetic [8], anti-proliferative [9], anti-inflammatory [10], antioxidant [11-13] as well as 66
chemopreventive activity [14]. Consequently, there is a great interest in determining 67
Published in Electrophoresis. 2014 Jun; 35(11):1644-5
4
these compounds in the different species of brown algae that may contain them. Due to 68
the huge chemical variability already mentioned, the analysis of these components is 69
quite complex, and it is rather common to roughly estimate the phlorotannins content in 70
algae by using colorimetric methods [10,15-17]. To partially solve the problems 71
associated to those methods, mainly, the little information on chemical composition that 72
they provide as well as the relatively low accuracy associated to most colorimetric 73
methods, some approaches involving the use of liquid chromatography-based methods 74
have been developed [17-20], frequently using MS-based detection. Considering the 75
high degree of hydrophilicity of these polymeric compounds, hydrophilic-interaction 76
liquid chromatography (HILIC) methods have also been recently applied [2,21] with the 77
aim to increase the resolution among the different phlorotannins contained in complex 78
algal samples. Despite these efforts, the chemical characterization of brown algae in 79
terms of phlorotannins composition is not well-known yet [22]. 80
The use of multidimensional techniques, such as comprehensive two-dimensional LC 81
(LC × LC) may be an effective alternative to carry out this kind of characterization of 82
very complex samples. In fact, this technique has already been shown to possess a great 83
potential to analyze complex food and natural samples [23,24]. LC × LC is based on the 84
on-line coupling of two independent separation mechanisms through which the whole 85
sample is analyzed. In this sense, different couplings may be employed in the two 86
dimensions, including e.g., reversed phase, normal phase or HILIC-based separations 87
[25]. Our group has previously presented two novel LC × LC approaches to separate 88
and identify procyanidins, which are also polymeric phenolic compounds, from 89
complex food matrices such as grape seeds [26] and apples [27], combining the use of a 90
HILIC separation in the first dimension (D1) and a RP approach in the second 91
dimension (D2) together with the employment of tandem MS/MS detection. This type 92

Published in Electrophoresis. 2014 Jun; 35(11):1644-5
5
of approach allowed the separation in terms of degree of polymerization in the D1 and 93
according to differential hydrophobicity in the D2. Following, this idea, the aim of the 94
present work is to develop a new method based on a HILIC × RP-DAD-MS/MS 95
coupling to separate and identify the phlorotannins present in Cystoseira abies-marina 96
brown algae. To the best of our knowledge, this is the first time that a LC × LC method 97
is developed and used to analyze phlorotannins. 98
99
2. MATERIALS AND METHODS 100
2.1. Samples and chemicals 101
Cystoseira abies-marina brown algae were obtained from the Spanish Bank of Algae 102
(Marine Biotechnology Center, University of Las Palmas de Gran Canaria, Gran 103
Canaria, Spain). Algae were sun-dried and stored protected from oxygen, light and 104
moisture until use. 105
Acetonitrile, methanol, dichloromethane and 2-propanol were of HPLC-grade and 106
acquired from VWR Prolabo (Barcelona, Spain), whereas acetone was from Lab-Scan 107
(Dublin, Ireland). Acetic acid, formic acid and 2,4-dimethoxybenzaldehyde (DMBA) 108
were obtained from Sigma Aldrich (Madrid, Spain). Hydrochloric acid was acquired 109
from Probus (Barcelona, Spain), whereas ammonium acetate was supplied from Panreac 110
(Barcelona, Spain). Ultra-pure water quality (resistivity of 18.2 MΩcm at 25 °C) with 111
1–5 ppb total organic carbon (TOC) was produced in-house using a laboratory water 112
purification Milli-Q Synthesis A10 system from Millipore (Billerica, MA, USA). 113
Phloroglucinol and quercetin rutinoside reference standards were purchased from 114
Extrasynthèse (Genay, France). 115
116
2.2. Sample preparation. 117
Published in Electrophoresis. 2014 Jun; 35(11):1644-5
6
The extraction of the phenolic compounds from Cystoseira abies-marina was carried 118
out employing a previously described protocol slightly modified [21]. Briefly, the alga 119
was freeze-dried (LyoBeta 15, Telstar, Terrassa, Spain) and ground. 30 g of the dried 120
powder were extracted with 300 mL of acetone/water (70:30, v/v) by magnetic stirring 121
during 45 min in darkness. Afterwards, the supernatant was decanted and the remaining 122
residue was extracted three times more with 100 mL of solvent. The supernatants were 123
pooled and the acetone was removed by rotary evaporation (Rotavapor R-210, Buchi 124
Labortechnik AG, Flawil, Switzerland). Next, the aqueous extract was defatted three 125
times with dichloromethane (1:1, v/v), collecting the aqueous phases. The phenolic 126
fraction of the aqueous extract was concentrated using Discovery DSC-18 6 mL solid 127
phase extraction (SPE) cartridges (Supelco, Bellefonte, PA, USA). SPE cartridges were 128
conditioned with 12 mL of methanol and with 18 mL of water. Then, 12.5 mL of 129
sample were loaded in the SPE cartridge, rinsed with 20 mL of water, and finally, the 130
polyphenols were eluted with 30 mL of acetone/water (70:30, v/v). Lastly, acetone was 131
evaporated again by rotary evaporation, and the remaining aqueous extract was 132
lyophilized. 133
134
2.3. Determination of total phlorotannins. 135
To estimate the amount of total phlorotannins content in the brown alga, the 2,4-136
dimethoxybenzaldehyde (DMBA) colorimetric assay was employed [10]. Briefly, a 137
DMBA solution was prepared just prior use by mixing equal volumes of 2% DMBA 138
reagent in acetic acid (m/v) and 6% hydrochloric acid in acetic acid (v/v). 50 µL of 139
sample (0.075 mg mL-1
) were mixed with 250 µL of DMBA solution in a 96-well 140
microplate. The reaction was conducted at room temperature in the dark for 60 min. 141
After this time, the absorbance was read at 515 nm using a microplate 142
Published in Electrophoresis. 2014 Jun; 35(11):1644-5
7
spectrophotometer reader Powerwave XS (Bio Tek, Winooski, VT). Blanks with 50 µL 143
of water instead of sample and a control samples without DMBA solution were also 144
included. All samples, blanks and controls were prepared in triplicate. The 145
concentration of total phlorotannins was estimated from a calibration curve using 146
phloroglucinol (0.98 – 62.5 g mL−1
). Data were presented as the average of triplicate 147
analyses expressed as mg phloroglucinol equivalents (PGE) g−1
dry matter. 148
149
2.4. Comprehensive two-dimensional liquid chromatography (LC × LC) analysis of 150
phlorotannins. 151
2.4.1. Instruments. 152
LC × LC analyses were carried out on an Agilent 1200 series liquid chromatograph 153
(Agilent Technologies, Santa Clara, CA) equipped with a diode array detector and an 154
autosampler. A Protecol flow splitter (SGE Analytical Science, Milton Keynes, UK) 155
was placed between the first dimension pumps and the autosampler in order to have 156
robust and reproducible low flow rates and gradients in the D1. Besides, an additional 157
LC pump (Agilent 1290 Infinity) was coupled to this instrument to perform the second 158
dimension separations, hyphenated through an electronically-controlled two-position 159
ten-port switching valve. An Agilent 6320 Ion Trap mass spectrometer equipped with 160
an electrospray interface was coupled on-line and operated in negative ionization mode 161
using the following conditions: dry temperature, 350ºC; mass range, m/z 90–2200 Da; 162
dry gas flow rate, 12 L min−1
; nebulization pressure, 40 psi. The LC data were 163
elaborated and visualized in two and three dimensions using LC Image software 164
(version 1.0, Zoex Corp., Houston, TX). 165
166
2.4.2. LC × LC separation conditions. 167

Published in Electrophoresis. 2014 Jun; 35(11):1644-5
8
Samples were prepared at 12 mg mL-1
of the extract obtained as described in section 2.2 168
in MeOH/ACN, 3:7 (v/v) and filtered through 0.45 µm nylon syringe filters (Análisis 169
vínicos, Tomelloso, Spain) before injection. 170
In the D1, a Lichrospher diol-5 (150 × 1.0 mm, 5 µm d.p., HiChrom, Reading, UK) 171
column was employed with a precolumn with the same stationary phase. The flow rate 172
employed was 15 µL min−1
. The mobile phases were (A) acetonitrile/acetic acid (98:2, 173
v/v) and (B) methanol/water/acetic acid (95:3:2, v/v/v) used according to the following 174
gradient: 0 min, 0% B; 3 min, 0% B; 5 min, 7% B; 30 min, 15% B; 70 min, 15% B; 75 175
min, 25% B; 85 min, 25% B. The injection volume was 20 µL. 176
In the D2, two different columns were tested, namely, an Ascentis Express C18 partially 177
porous column (50 × 4.6 mm, 2.7 µm d.p., Supelco, Bellefonte, CA) with a C18 178
precolumn, and a Kinetex PFP partially porous particles column (50 × 4.6 mm, 2.6 µm 179
d.p., Phenomenex, Torrance, CA). During the whole LC × LC separation, 78 s-180
repetitive D2 gradients were employed, being also 78 s the modulation time 181
programmed in the switching valve. The wavelength used to monitor the separations 182
was 280 nm, although UV–Vis spectra were collected from 190 to 550 nm during the 183
whole analysis using a sampling rate of 20 Hz in the DAD. The MS was operated under 184
negative ESI mode. The mobile phases employed in the D2 analysis of both columns 185
consisted of water (0.1% formic acid, A) and acetonitrile (B) eluted according to the 186
following gradients: 0 min, 0% B; 0.1 min , 10% B; 0.6 min , 30% B; 0.8 min , 50% B; 187
0.9 min , 70% B; 1 min , 90%; 1.01 min , 0% B; 1.3 min , 0% B for the C18 column, and 188
0 min , 0% B; 0.1 min , 5% B; 0.3 min , 20% B; 0.8 min , 40% B; 0.9 min, 70% B; 1 189
min, 90%; 1.01 min, 0% B; 1.3 min , 0% B for de PFP column. The flow rate employed 190
was always 3 mL min−1
. The flow eluting from the D2 column was splitted before 191

Published in Electrophoresis. 2014 Jun; 35(11):1644-5
9
entering the MS instrument, so that the flow rate introduced in the MS detector was 600 192
µL min−1
. 193
194
3. RESULTS AND DISCUSSION 195
Phorotannins estimation is commonly carried out by using colorimetric methods 196
[10,15,16]. In this work, the DMBA assay was used as a starting point to determine the 197
phlorotannins content in the Cystoseira abies-marina extract (see section 2.3). Using 198
this approach, the amount of phlorotannins determined was 40.2 mg phloroglucinol 199
equivalents g-1
extract. As mentioned above, comprehensive two-dimensional coupling 200
using a HILIC-based separation in the D1 and a RP-based separation in the D2 could 201
potentially solve many of the problems commonly encountered when analyzing 202
phlorotannins. This combination is characterized by providing a high degree of 203
orthogonality [26] at the same time that completely miscible mobile phases are 204
employed in the two dimensions. Besides, the capabilities of HILIC followed by RP-LC 205
to separate complex mixtures of polymeric phenolic compounds have been already 206
shown, both using on-line [26,27] and off-line couplings [28,29]. Moreover, the on-line 207
approach followed by the direct hyphenation to several detectors, such as DAD and MS 208
detectors, gives rise to a powerful analytical system whose use is mandatory if complex 209
samples have to be analyzed. In this work a HILIC × RP-DAD-MS/MS approach is 210
proposed to characterize the phlorotannins composition from brown algae. Since the 211
sample as well as the target compounds have not been previously studied using this 212
approach, a complete optimization of the separation and coupling conditions was firstly 213
needed. 214
215
3.1. HILIC-based D1 separation optimization. 216

Published in Electrophoresis. 2014 Jun; 35(11):1644-5
10
The LC × LC instrument set-up employed in this work is based on the use of two 217
identical injection loops installed in a 10-port 2-position switching valve that is used as 218
modulator. This device makes possible the physical coupling between both dimensions. 219
Under this configuration, one of the injection loops injects the eluate collected from the 220
D1 to the D2 whereas the other loop is collecting new eluate, so that the complete 221
collection and transfer of the whole effluent from the D1 to the D2 is performed. This 222
implies that each D2 separation should be completely finished before the collecting 223
injection loop is filled with the D1 eluate. For this reason, in this kind of couplings, the 224
use of microbore columns in the first dimension is highly recommended. By using this 225
kind of columns, a very low D1 flow rate can be employed, in order to give enough time 226
for the D2 separation to be completed while the transfer volume is maintained as small 227
as possible. To perform the HILIC separation in the first dimension, a microbore 228
column with diol particles was selected. 229
To carry out the optimization of the separation, the whole phlorotannins purified extract 230
from Cystoseira abies-marina was injected and the conditions previously employed to 231
separate the complete profile of apple polyphenols were used [27]. As expected, under 232
these conditions, using a flow rate of 15 l min-1
, the separation obtained was not 233
satisfactory. Next, different new gradients using the same mobile phases (A, 234
ACN/acetic acid 98:2, v/v; B, methanol/water/acetic acid 95:3:2, v/v/v) as well as other 235
different mobile phases were tested. Namely, 10 mM ammonium acetate pH 9 was also 236
tested as mobile phase B as well as other different proportions of methanol and water in 237
that mobile phase. After a close study to the profiles obtained, the mobile phases 238
ACN/acetic acid 98:2, v/v (A) and methanol/water/acetic acid 95:3:2, v/v/v (B), were 239
selected optimizing next the gradient in order to obtain a better separation of this 240
complex sample (see section 2.4.2.). In Figure S1 (supplementary information), a 241

Published in Electrophoresis. 2014 Jun; 35(11):1644-5
11
comparison is shown between the initial (Figure S1A) and the final selected conditions 242
for the D1 analysis (Figure S1B). As can be observed, the separation of the complex 243
profile obtained is not completely resolved. It is interesting to mention that, at this stage 244
of the LC × LC optimization, a complete baseline separation of all the components in 245
the D1 is not aimed, but to obtain a good distribution of all of them in the time, in order 246
to be able to collect those peaks and be injected and their components separated in the 247
D2. 248
249
3.2. RP-based D2 separation optimization. 250
For the second dimension, two different types of stationary phases and columns were 251
studied with the aim to compare their performances under LC × LC conditions. Namely, 252
a partially porous C18 short column which had already shown its potential in LC × LC 253
[26,27,30,31] and a partially porous pentafluorophenyl (PFP) short column, that has 254
been pointed out as a possible new alternative for the efficient separation of phenolic 255
compounds [32, 33]. In this regard, the optimization of the final analytical conditions in 256
each case was carried out separately. To do that, the whole sample was directly injected 257
in the second dimension column. Although these analytical conditions are not exactly 258
equal to those taking place during the LC × LC analysis, in which only fractions of the 259
sample will be separated in each D2 analysis, this step injecting the whole sample will 260
provide important information on the D2 conditions that produce a better separation of 261
the sample components. Once these conditions are selected, further confirmation or fine 262
tuning of the separation conditions are needed directly performing two-dimensional 263
analyses. 264
The mobile phases selected were water (0.1% formic acid, A) and acetonitrile (B) for 265
both C18 and PFP columns, although different gradients were chosen. The use of other 266
Published in Electrophoresis. 2014 Jun; 35(11):1644-5
12
solvents in the mobile phase B, such as 2-propanol in different proportions or mixtures 267
between acetonitrile and methanol did not improve the separations obtained and 268
significantly increased the backpressure obtained (mainly when 2-propanol was used). 269
270
3.3. Overall HILIC × RP optimization and method performance. 271
Once the two dimensions were optimized separately, the fine tuning of the coupling 272
conditions was performed. To do that, two identical 30 l internal volume injection 273
loops were installed in the 10-port 2-position switching valve acting as modulator. This 274
internal volume allowed the complete transfer of eluate from the D1 to the D2 in each 275
modulation period (1.3 min, 19.5 l). In this regard, it is worth to mention that although 276
20 l loops would have been enough to collect all the effluent in the modulation time, 277
we have previously observed a beneficial influence when the injection volume in the D2 278
of HILIC × RP methods was slightly increased [26]. These observations were also 279
confirmed in the present approach. In fact, the dilution of the eluent from the D1 with 280
D2 mobile phase (up to 30 l) just before the injection permitted to minimize the 281
negative effects on band broadening and retention derived of using as injection solvent a 282
stronger solvent than the initial mobile phase. It is necessary to remark that under LC × 283
LC conditions, being an on-line system, the injection solvent in the D2 is fixed by the 284
D1 and cannot be modified. Moreover, the set-up was completed by coupling a MS 285
detector at the exit of the DAD after the D2 separation. Considering the high flow rates 286
used in the D2, the inclusion of a flow splitter was necessary in order to reduce the flow 287
rate entering the ESI interface to 600 l min-1
, which is more suitable for a proper 288
ionization of the target compounds. 289
Subsequently, the Cystoseira abies-marina phlorotannins extract was injected and 290
analyzed using the two different optimized set-ups, namely diol × C18 and diol × PFP 291

Published in Electrophoresis. 2014 Jun; 35(11):1644-5
13
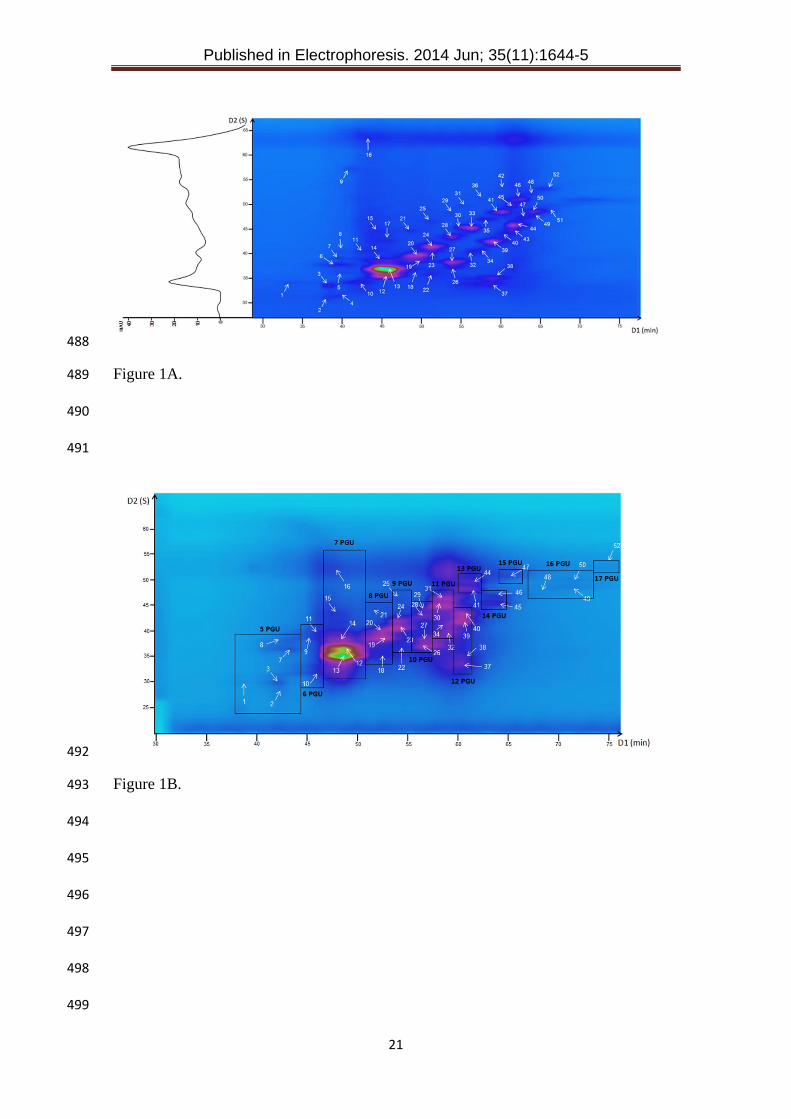
configurations. Figure 1 shows the obtained 2D-plots corresponding to both 292
configurations. As it can be observed in that figure, both set-ups were able to provide 293
adequate separations of such a complex mixture. The separation in the first dimension 294
(same conditions for both configurations) was produced according to the degree of 295
polymerization of phlorotannins, whereas in the D2, the separation was obtained in 296
terms of relative hydrophobicity. It is possible to observe in the figures how the use of 297
LC x LC permits the resolution of co-elutions in both dimensions, such as the coelution 298
of peaks 12, 13, 14 and 17 in the first dimension, or the coelution of peaks 21, 30, 33 299
and 44 in the second dimension (see Figure 1A), making possible the separation of 300
components that, otherwise, would not be separated using monodimensional 301
separations. 302
Although the separation mode and mobile phases were the same, it can be clearly 303
observed how the two tested columns produced different profiles under the selected 304
conditions, showing differential retention. This is mainly due to the use in the PFP short 305
column of fluorine atoms in the periphery of a phenyl ring which are highly 306
electronegative, in contrast to the long C18 alkyl chain. As it can be appreciated in the 307
figure, using the C18 column a better separation among the different peaks could be 308
obtained in the D2 (Figure 1A), compared to the PFP column (Figure 1B). To the best 309
of our knowledge this is the first application of a PFP column in LC × LC, showing 310
acceptable capabilities for its coupling to HILIC separations. Comparing the two 311
separations, different peak capacities values can be obtained. It is important to remark 312
that this value is just a theoretical measure of the performance of the system that does 313
not necessarily describes what actually happens in practice. In fact, although there are 314
several methods for measuring peak capacity in a LC × LC system, normally, it is 315
assumed that the peaks are homogeneously distributed across the 2D plane, which is 316

Published in Electrophoresis. 2014 Jun; 35(11):1644-5
14
obviously a great source of error. Anyhow, this value helps to compare different LC × 317
LC set-ups or methods. In this regard, the peak capacity (nc2D) was measured for the two 318
instrumental set-ups under the optimized conditions, obtaining values of theoretical 319
peak capacity [34] of 1248 and 902 for the diol × C18 and diol × PFP configurations, 320
respectively. Following the approach developed by Li et al. [35] that considers the D2 321
time cycle as well as the influence of undersampling of the D1 eluate, the values 322
obtained for the diol × C18 and diol × PFP were 992 and 739, respectively, showing the 323
great potential capabilities of both developments. Peak capacity values also show the 324
better performance of the C18 column in the D2 compared to the PFP column under the 325
selected conditions. 326
327
3.4. Cystoseira abies-marina phlorotannins characterization. 328
As already mentioned, the main difficulty to analyze phlorotannins is the great 329
heterogeneity and chemical variability within this family of compounds due to the 330
differential degree of polymerization as well as the diverse bonds between monomers. 331
In this regard, the use of LC × LC allows the attainment of a distribution along the D1 332
in order to separate smaller groups of components into the D2. Table 1 summarizes the 333
information corresponding to the assigned compounds. As it can be observed in Table 1, 334
phlorotannins from a degree of polymerization of 5 phloroglucinol units (PGU) up to 17 335
PGU were separated and assigned. In total, 43 different phlorotannins were tentatively 336
identified according to their MS and MS/MS spectra as well as their position in the 2D 337
plane. Besides, a flavonoid, quercetin rutinoside, was also found in the extract. 338
Additionally, 8 other compounds were detected in the sample, although no proper 339
identification of these compounds was possible. The highest number of compounds of a 340
same degree of polymerization corresponded to 5 PGU (peaks 1-8), whereas the most-341

Published in Electrophoresis. 2014 Jun; 35(11):1644-5
15
intense compound was a phlorotannin containing 7 PGU (peak 13). Phorotannins of less 342
than 5 PGU were not detected, in line with the phlorotannins composition in other 343
brown algae, where just high degree of polymerization phlorotannins were found [21]. 344
Phlorotannins assignment was performed thanks to the detection of typical [M-H]- ions 345
together with MS/MS fragments corresponding to phlorotannin structures. 346
Phlorotannins containing 5 PGU were detected as [M-H]- at m/z 621, with typical 347
fragments of m/z 603 corresponding to the loss of water, m/z 495, in agreement with the 348
loss of a phloroglucinol, m/z 373 assigned to the loss of 2 PGU and m/z 228 that 349
corresponded to a dehydrated fragment containing 2 PGU. Figure 2 shows the MS 350
spectra as well as the MS/MS fragmentation pattern of peak 3 as well as its tentative 351
chemical structure (branching not unequivocally confirmed). Similar losses and 352
fragments were detected for phlorotannins with 6-11 PGU, except in the compounds 353
containing 7 PGU from which no fragments were clearly produced beyond the loss of a 354
water molecule. 355
On the other hand, phlorotannins having 13-17 PGU were detected as doubly charged 356
ions, as can be observed in Table 1. The different ion charge states were detected thanks 357
to the presence of specific ions in the MS spectra, as it is highlighted in Figures 2 and 3 358
(see in the MS spectra the isotopes of the molecular ion separated by a difference of 1 or 359
0.5 for the singly-charged or doubly-charged, respectively). These latter multi-charged 360
compounds were also identified according to the detection of different fragments 361
corresponding to phlorotannin fragments of smaller PGU, which allow confirming the 362
identifications. For example, in the case of phlorotannins of 13 PGU, a doubly-charged 363
ion was detected at m/z 807 indicating the possible presence of this type of polymer. 364
The fragmentation pattern of that ion produced ions at m/z 1365 (11 PGU), 1115 (9 365
PGU), 993 (8 PGU), 975 (8 PGU dehydrated), 867 (7 PGU), 745 (6 PGU), 619 (5 PGU) 366
Published in Electrophoresis. 2014 Jun; 35(11):1644-5
16
and 228 (2PGU dehydrated) that completed the identification. The same behavior was 367
observed for one of the phlorotannins containing 12 PGU (peak 39), as shown in Figure 368
3. Moreover, as previously indicated, the relative position of each peak in the 2D plane 369
helped to conclude the identification; as can be observed in Figure 1B, the different 370
polymers were clearly separated according to their degree of polymerization along the 371
D1 analysis time, being the compounds of a similar size grouped together. 372
373
4. CONCLUDING REMARKS. 374
This contribution shows the first application of LC × LC to analyze phlorotannins, a 375
family of complex algal polyphenolic compounds. The coupling between a HILIC-376
based separation in the D1 and a RP-based separation in the D2 provides a high degree 377
of orthogonality at the same time that produces a distribution according the degree of 378
polymerization of phlorotannins in the D1 that facilitates their separation in the D2. The 379
optimized HILIC × RP-DAD-MS/MS approach has been demonstrated to be useful for 380
the separation and identification of more than 50 compounds in a Cystoseira abies-381
marina brown alga extract. Besides, two different set-ups, involving different D2 382
columns were tested. Although partially porous C18 column produced the best results in 383
terms of separation capabilities, a partially porous PFP column was also applied for the 384
first time in a LC × LC development, with acceptable results. Once this method has 385
been developed and its applicability demonstrated, it can be expected its future use for 386
the determination of phlorotannins in different brown algae as well as to determine the 387
influence of the algal growing conditions on the composition of these bioactive 388
compounds, which currently is an important analytical challenge. 389
390
391
Published in Electrophoresis. 2014 Jun; 35(11):1644-5
17
ACKNOWLEDGEMENTS. 392
M.H. would like to thank MICINN for his “Ramón y Cajal” research contract. Authors 393
thank the BEA (Banco Español de Algas, Las Palmas de Gran Canaria, Spain) for 394
providing the Cystoseira samples. The authors want to thank Projects AGL2011-29857-395
C03-01 (MINECO, Spain) and ALIBIRD, S2009/AGR-1469 (Comunidad de Madrid) 396
for the financial support. 397
398
Authors declare no conflict of interest. 399

Published in Electrophoresis. 2014 Jun; 35(11):1644-5
18
5. REFERENCES. 400
[1] Koivikko, R., Loponen, J., Pihlaja, K., Jormalainen, V., Phytochem. Anal. 2007, 18, 401
326-332. 402
[2] Kim, S. M., Kang, S. W., Jeon, J. S., Jung, Y. J., Kim, W. R., Kim, C. Y., Um, B. 403
H., Food Chem. 2013,138, 2399-2406. 404
[3] Gouveia, V. L. M., Seca, A. M. L., Barreto, M. C., Neto, A. I., Kijjoa, A., Silva, A. 405
M. S., Phytochem. Lett. 2013, 6, 593-597. 406
[4] Moraes, E. P., Ruperez, F. J., Plaza, M., Herrero, M., Barbas, C., Electrophoresis. 407
2011, 32, 2055-2062. 408
[5] Ibañez, E., Cifuentes, A., J. Sci. Food Agric. 2013, 93, 703-709. 409
[6] Sandsdales, E., Haug, T., Stensvag, K., Styrvold, O. B., World J. Microbiol. 410
Biotechnol. 2003, 19, 777-782. 411
[7] Lopes, G., Pinto, E., Andrade, P. B., Valentao, P., PLOS One 2013, 8, e72203. 412
[8] Lee, S. H., Jeon, Y. J., Fitoterapia 2013, 86, 129-136. 413
[9] Nwosu, F., Morris, J., Lund, V. A., Stewart, D., Ross , H. A., McDougall, G. J., 414
Food Chem. 2011, 126, 1006-1012. 415
[10] Lopes, G., Sousa, C., Silva, L. R., Pinto, E., Andrade, P. B., Bernardo, J., Mouga, 416
T., Valentao, P., PLOS One 2012, 7, e31145. 417
[11] Wang, T., Jonsdottir, R., Liu, H., Gu, L., Kristinsson, H. G., Raghavan, S., 418
Olafsdottir, G., J. Agric. Food Chem. 2012, 60, 5874-5883. 419
[12] Tierney, M. S., Smyth, T. J., Hayes, M., Soler-Vila, A., Croft, A. K., Brunton, N., 420
Int. J. Food Sci. Technol. 2013, 48, 860-869. 421
[13] Kang, S. M., Lee, S. H., Heo, S. J., Kim, K. N., Jeon, Y. J., Nutr. Res. Pract. 2011, 422
5, 495-502. 423
[14] Parys, S., Kehraus, S., Krick, A., Glombitza, K. W., Carmeli, S., Klimo, K., 424
Gerhauser, C., Konig, G. M., Phytochem. 2010, 71, 221-229. 425
[15] Stern, J. L., Hagerman, A. E., Steinberg, P. D., Winter, F. C., Estes, J. A., J. Chem. 426
Ecol. 1996, 22, 7. 427
[16] Parys, S., Rosenbaum, A., Kehraus, S., Reher, G., Glombitza, K., König, G. M., J. 428
Nat. Prod. 2007, 70, 1865-1870. 429
[17] Koivikko, R., Eränen, J. K., Loponen, J., Jormalainen, V., J. Chem. Ecol. 2008, 34, 430
54-64. 431

Published in Electrophoresis. 2014 Jun; 35(11):1644-5
19
[18] Ferreres, F., Lopes, G., Gil-Izquierdo, A., Andrade, P.B., Sousa, C., Mouga, T., 432
Valentao, P., Mar. Drugs 2012, 10, 2766-2781. 433
[19] Liu, H., Gu, L., J. Agric. Food Chem. 2012, 60, 1326-1334. 434
[20] Tierney, M. S., Soler-Vila, A., Rai, D. K., Croft, A. K., Brunton, N. P., Smyth, T. 435
J., Metabolomics, in press, DOI: 10.1007/s11306-013-0584-z. 436
[21] Steevenz, A. J., Mackinnon, S. L., Hankinson, R., Craft, C., Connan, S., Stengel, 437
D. B., Melanson, J. E., Phytochem. Anal. 2012, 23, 547-553. 438
[22] Isaza Martinez, J. H., Torres Castañeda, H. G., J. Chromatogr. Sci. 2013, 51, 825-439
838. 440
[23] Dugo, P., Kumm, T., Cacciola, F., Dugo, G., Mondello, L., J. Liq. Chromatogr. 441
Rel. Technol. 2008, 31, 1758-1807. 442
[24] Herrero, M., Ibañez, E., Cifuentes, A., Bernal, J., J. Chromatogr. A 2009, 1216, 443
7110-7129. 444
[25] Donato, P., Cacciola, F., Tranchida, P. Q., Dugo, P., Mondello, L., Mass Spectrom. 445
Rev. 2012, 31, 523-559. 446
[26] Montero, L., Herrero, M., Prodanov, M., Ibáñez, E., Cifuentes, A., Anal. Bioanal. 447
Chem. 2013, 405, 4627-4638. 448
[27] Montero, L., Herrero, M., Ibáñez, E., Cifuentes, A., J. Chromatogr. A 2013, 1313, 449
275-283. 450
[28] Kalili, K. M., de Villiers, A., J. Chromatogr. A 2009, 1216, 6274-6284. 451
[29] Kalili, K. M., de Villiers, A., J. Chromatogr. A 2013, 1289, 58-68. 452
[30] Dugo, P., Cacciola, F., Herrero, M., Donato, P., Mondello, L., J. Sep. Sci. 2008, 31, 453
3297-3308. 454
[31] Dugo, P., Cacciola, F., Donato, P., Airado-Rodriguez, D., Herrero, M., Mondello, 455
L., J. Chromatogr. A 2009, 1216, 7483-7487. 456
[32] Regos, I., Treutter, D., J. Chromatogr. A 2010, 1217, 6169-6177. 457
[33] Manns, D. C., Mansfield, A. K., J. Chromatogr. A 2012, 1251, 111-121. 458
[34] Neue, U. D., J. Chromatogr. A 2005, 1079, 153-161. 459
[35] Li, X., Stoll, D. R., Carr, P. W., Anal. Chem. 2009, 81, 845-850. 460
461
462
Published in Electrophoresis. 2014 Jun; 35(11):1644-5
20
FIGURE LEGENDS. 463
464
Figure 1. Two-dimensional plot (280 nm) of the Cystoseira abies-marina phlorotannins 465
extract obtained using the optimized diol × C18 set-up (A) and the diol × PFP set-up (B). 466
Areas marked correspond to phlorotannins containing the same number of 467
phloroglucinol units (PGU). For peak identification, see Table 1. 468
469
Figure 2. MS spectrum and MS/MS fragmentation pattern of peak 3 (phlorotannin with 470
5 PGU) as well as the tentatively proposed chemical structure. 471
472
Figure 3. MS spectrum and MS/MS fragmentation pattern of peak 39 (phlorotannin 473
with 12 PGU) as well as the tentatively proposed chemical structure. 474
475
Figure S1 (Supplementary information). Chromatograms (280 nm) corresponding to 476
the Cystoseira abies-marina phlorotannins extract obtained in first dimension under 477
initial (A) and optimized (B) HILIC conditions. 478
479
480
481
482
483
484
485
486
487
Published in Electrophoresis. 2014 Jun; 35(11):1644-5
21
488
Figure 1A. 489
490
491
492
Figure 1B. 493
494
495
496
497
498
499

Published in Electrophoresis. 2014 Jun; 35(11):1644-5
22
500
Figure 2. 501
502
503
504
505
506
507
508
509
510
511
512
513
514
515
516
517
518

Published in Electrophoresis. 2014 Jun; 35(11):1644-5
23
519 Figure 3. 520
521
522
523
524
525
526
527
528
529
530
531
532
533
534
535
536
537

Published in Electrophoresis. 2014 Jun; 35(11):1644-5
24
Figure S1 (Supplementary information). 538
539
540

Published in Electrophoresis. 2014 Jun; 35(11):1644-5
25
Table 1. Peak assignments of the purified Cystoseira abies-marina phlorotannins extract analyzed using the diol x C18 set-up under optimized conditions. For peak numbers, 541 see Figure 1. PGU, phloroglucinol units. 542
Peak Identification Total tR
(min) D2 tR(s) ± sd [M−H]
− [M−2H]
2− Main MS/MS fragments
1 Phlorotannin - 5 PGU 33.07 34.10 ± 0.22 621.6
603, 495, 373, 229
2 Phlorotannin - 5 PGU 38.22 31.08 ± 0.14 621.4
603, 479, 353, 247, 229
3 Phlorotannin - 5 PGU 38.26 33.33 ± 0.13 621.0
603, 495, 373, 247, 229
4 Phlorotannin - 5 PGU 39.52 31.17 ± 0.15 621.7
603, 246, 229
5 Phlorotannin - 5 PGU 39.60 35.83 ± 0.16 621.8
603, 495, 230
6 Phlorotannin - 5 PGU 39.63 37.60 ± 0.15 621.3
601, 495, 371, 229
7 Phlorotannin - 5 PGU 39.65 38.90 ± 0.10 621.3
601, 495, 371, 229
8 Phlorotannin - 5 PGU 39.67 40.30 ± 0.10 621.5
601, 495, 229
9 Not identified 41.25 56.98 ± 0.32 941.3
897, 855, 693 , 400, 319
10 Phlorotannin - 6 PGU 42.17 34.02 ± 0.26 745.4
728, 229
11 Phlorotannin - 6 PGU 43.57 40.13 ± 0.15 745.2
727, 601, 479, 353, 229
12 Phlorotannin - 7 PGU 44.79 34.88 ± 0.64 869.4
853
13 Phlorotannin - 7 PGU 44.81 36.63 ± 0.10 869.4
852
14 Phlorotannin - 7 PGU 44.84 38.45 ± 0.10 869.2
851
15 Quercetin rutinoside 44.94 44.23 ± 0.14 609.2
301, 270, 178
16 Not identified 45.26 63.50 ± 0.18 955.9
937, 849, 794
17 Phlorotannin - 7 PGU 46.21 42.30 ± 0.10 869.2
852
18 Phlorotannin - 8 PGU 48.71 36.70 ± 0.13 993.5
975, 849, 743
19 Phlorotannin - 8 PGU 48.74 38.33 ± 0.13 993.9
975, 849
20 Phlorotannin - 8 PGU 48.76 39.48 ± 0.13 993.5
975, 849, 743, 621
21 Phlorotannin - 8 PGU 48.84 44.38 ± 0.08 993.3
975, 849, 743, 621
22 Phlorotannin - 9 PGU 51.29 35.58 ± 0.08 1117.5
1099, 1081, 869, 851, 727, 603
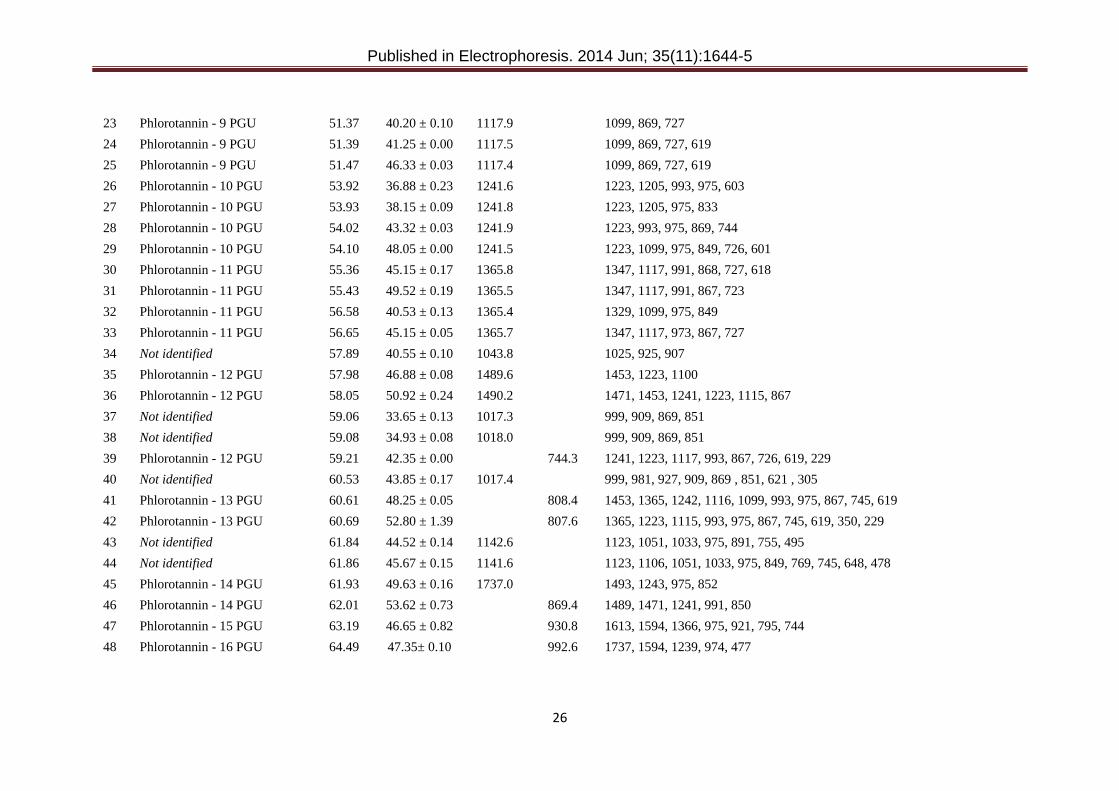
Published in Electrophoresis. 2014 Jun; 35(11):1644-5
26
23 Phlorotannin - 9 PGU 51.37 40.20 ± 0.10 1117.9
1099, 869, 727
24 Phlorotannin - 9 PGU 51.39 41.25 ± 0.00 1117.5
1099, 869, 727, 619
25 Phlorotannin - 9 PGU 51.47 46.33 ± 0.03 1117.4
1099, 869, 727, 619
26 Phlorotannin - 10 PGU 53.92 36.88 ± 0.23 1241.6
1223, 1205, 993, 975, 603
27 Phlorotannin - 10 PGU 53.93 38.15 ± 0.09 1241.8
1223, 1205, 975, 833
28 Phlorotannin - 10 PGU 54.02 43.32 ± 0.03 1241.9
1223, 993, 975, 869, 744
29 Phlorotannin - 10 PGU 54.10 48.05 ± 0.00 1241.5
1223, 1099, 975, 849, 726, 601
30 Phlorotannin - 11 PGU 55.36 45.15 ± 0.17 1365.8
1347, 1117, 991, 868, 727, 618
31 Phlorotannin - 11 PGU 55.43 49.52 ± 0.19 1365.5
1347, 1117, 991, 867, 723
32 Phlorotannin - 11 PGU 56.58 40.53 ± 0.13 1365.4
1329, 1099, 975, 849
33 Phlorotannin - 11 PGU 56.65 45.15 ± 0.05 1365.7
1347, 1117, 973, 867, 727
34 Not identified 57.89 40.55 ± 0.10 1043.8
1025, 925, 907
35 Phlorotannin - 12 PGU 57.98 46.88 ± 0.08 1489.6
1453, 1223, 1100
36 Phlorotannin - 12 PGU 58.05 50.92 ± 0.24 1490.2
1471, 1453, 1241, 1223, 1115, 867
37 Not identified 59.06 33.65 ± 0.13 1017.3
999, 909, 869, 851
38 Not identified 59.08 34.93 ± 0.08 1018.0
999, 909, 869, 851
39 Phlorotannin - 12 PGU 59.21 42.35 ± 0.00
744.3 1241, 1223, 1117, 993, 867, 726, 619, 229
40 Not identified 60.53 43.85 ± 0.17 1017.4
999, 981, 927, 909, 869 , 851, 621 , 305
41 Phlorotannin - 13 PGU 60.61 48.25 ± 0.05
808.4 1453, 1365, 1242, 1116, 1099, 993, 975, 867, 745, 619
42 Phlorotannin - 13 PGU 60.69 52.80 ± 1.39
807.6 1365, 1223, 1115, 993, 975, 867, 745, 619, 350, 229
43 Not identified 61.84 44.52 ± 0.14 1142.6
1123, 1051, 1033, 975, 891, 755, 495
44 Not identified 61.86 45.67 ± 0.15 1141.6
1123, 1106, 1051, 1033, 975, 849, 769, 745, 648, 478
45 Phlorotannin - 14 PGU 61.93 49.63 ± 0.16 1737.0
1493, 1243, 975, 852
46 Phlorotannin - 14 PGU 62.01 53.62 ± 0.73
869.4 1489, 1471, 1241, 991, 850
47 Phlorotannin - 15 PGU 63.19 46.65 ± 0.82
930.8 1613, 1594, 1366, 975, 921, 795, 744
48 Phlorotannin - 16 PGU 64.49 47.35± 0.10
992.6 1737, 1594, 1239, 974, 477
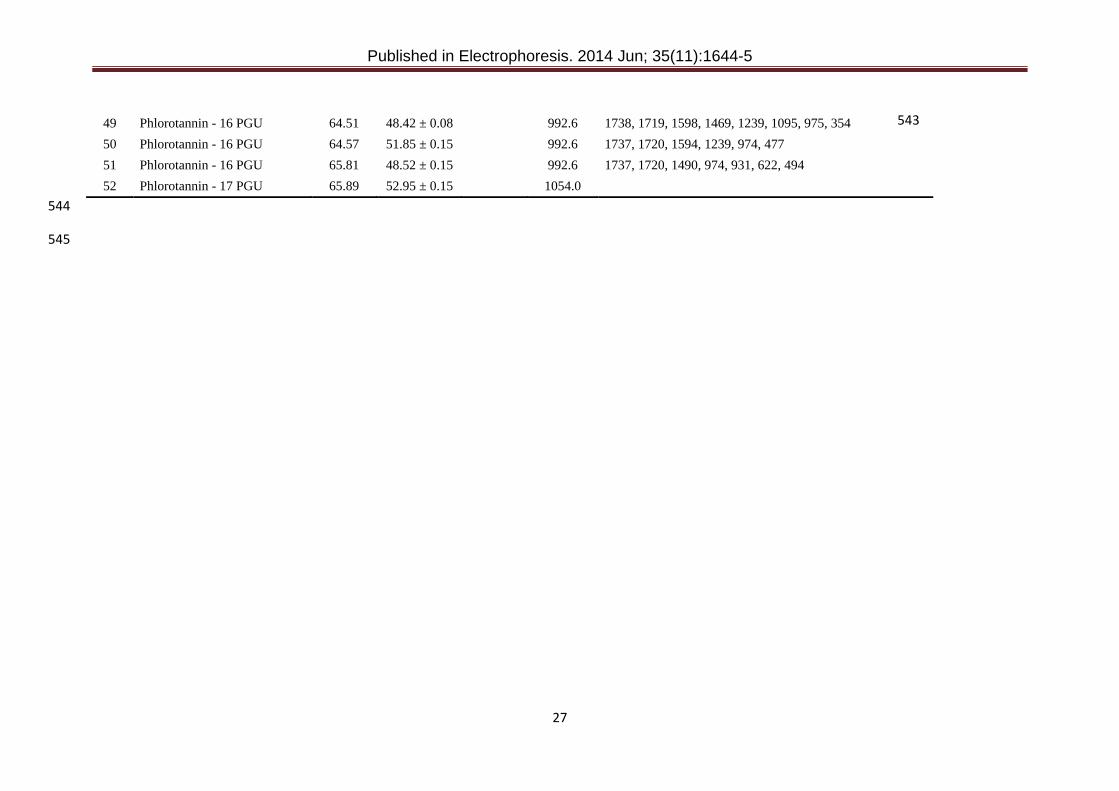
Published in Electrophoresis. 2014 Jun; 35(11):1644-5
27
543
544
545
49 Phlorotannin - 16 PGU 64.51 48.42 ± 0.08
992.6 1738, 1719, 1598, 1469, 1239, 1095, 975, 354
50 Phlorotannin - 16 PGU 64.57 51.85 ± 0.15
992.6 1737, 1720, 1594, 1239, 974, 477
51 Phlorotannin - 16 PGU 65.81 48.52 ± 0.15
992.6 1737, 1720, 1490, 974, 931, 622, 494
52 Phlorotannin - 17 PGU 65.89 52.95 ± 0.15
1054.0


![Gedichten. Deel 4: 1644-1652 - dbnl · 2016. 3. 7. · 1 [1644] InSassamGandavensem,eodemexsoloinstaurarietmuniricoeptam quoexpugnatafuit1)+. Prosuperi,quibusHispanosuntperditaglebis](https://static.fdocuments.in/doc/165x107/60bafdd2ca6511078c780736/gedichten-deel-4-1644-1652-dbnl-2016-3-7-1-1644-insassamgandavensemeodemexsoloinstaurarietmuniricoeptam.jpg)