Published by Raymond James & Associates PESA Oil … · Published by Raymond James & Associates ......
60
U.S. Research September 2016 Please read disclosure/risk information and Analyst Certification beginning on slide 57. Published by Raymond James & Associates Raymond James Energy Group (800) 945-6275 Raymond James Energy Group (800) 945-6275 Energy Markets We are at the Tail End of a Supply Driven Downturn PESA Oil and Gas 101 [email protected] [email protected] © 2016 Raymond James & Associates, Inc., member New York Stock Exchange/SIPC. All rights reserved. International Headquarters: The Raymond James Financial Center | 880 Carillon Parkway | St. Petersburg, Florida 33716 | 800 -248-8863
Transcript of Published by Raymond James & Associates PESA Oil … · Published by Raymond James & Associates ......

U.S. Research
September 2016
Please read disclosure/risk information and Analyst Certification beginning on slide 57.
Published by Raymond James & Associates
Raymond James Energy Group(800) 945-6275
Raymond James Energy Group(800) 945-6275
Energy Markets
We are at the Tail End of a Supply
Driven Downturn
PESA Oil and Gas 101
[email protected]@RaymondJames.com
© 2016 Raymond James & Associates, Inc., member New York Stock Exchange/SIPC. All rights reserved.
International Headquarters: The Raymond James Financial Center | 880 Carillon Parkway | St. Petersburg, Florida 33716 | 800 -248-8863

© 2013 Raymond James & Associates, Inc., member New York Stock Exchange/SIPC. All rights reserved.
International Headquarters: The Raymond James Financial Center | 880 Carillon Parkway | St. Petersburg, Florida 33716 | 800 -248-8863 2
We turned bearish on crude in mid-2012
Worried about surging U.S. supply
Numbers said $65 was correct
equilibrium oil price
We were wrong for two years as OPEC
supply fell by 2.5 million bpd
Oil prices fell when outages stabilized
Published by Raymond James & Associates
U.S. Research
© 2016 Raymond James & Associates, Inc., member New York Stock Exchange/SIPC. All rights reserved.
International Headquarters: The Raymond James Financial Center | 880 Carillon Parkway | St. Petersburg, Florida 33716 | 800 -248-8863
RJ Energy Outlook: Historical Perspective

© 2013 Raymond James & Associates, Inc., member New York Stock Exchange/SIPC. All rights reserved.
International Headquarters: The Raymond James Financial Center | 880 Carillon Parkway | St. Petersburg, Florida 33716 | 800 -248-8863
Supply Interruptions Important…
3
U.S. ResearchPublished by Raymond James & Associates
U.S. Research
© 2016 Raymond James & Associates, Inc., member New York Stock Exchange/SIPC. All rights reserved.
International Headquarters: The Raymond James Financial Center | 880 Carillon Parkway | St. Petersburg, Florida 33716 | 800 -248-8863

© 2013 Raymond James & Associates, Inc., member New York Stock Exchange/SIPC. All rights reserved.
International Headquarters: The Raymond James Financial Center | 880 Carillon Parkway | St. Petersburg, Florida 33716 | 800 -248-8863 4
♦ OPEC flooding the market (Saudi, Iraq, Iran)
♦ U.S. supply posting huge growth
First time in 40 years
♦ Supply was the problem
U.S. ResearchPublished by Raymond James & Associates
U.S. Research
© 2016 Raymond James & Associates, Inc., member New York Stock Exchange/SIPC. All rights reserved.
International Headquarters: The Raymond James Financial Center | 880 Carillon Parkway | St. Petersburg, Florida 33716 | 800 -248-8863
Why Did Energy Prices Collapse in 2014/15?

© 2013 Raymond James & Associates, Inc., member New York Stock Exchange/SIPC. All rights reserved.
International Headquarters: The Raymond James Financial Center | 880 Carillon Parkway | St. Petersburg, Florida 33716 | 800 -248-8863 5
• Very bullish on oil prices relative to futures strip:
Crude prices move much higher in 2017
• Natural gas rebounds in in 2017: N.E. gas keeps a
lid long-term prices – volatile differentials
• Oilfield has overcorrected in 2015/16: Expect a
sharp rebound in 2017/18
Current Energy Overview
© 2016 Raymond James & Associates, Inc., member New York Stock Exchange/SIPC. All rights reserved.
International Headquarters: The Raymond James Financial Center | 880 Carillon Parkway | St. Petersburg, Florida 33716 | 800 -248-8863
U.S. ResearchPublished by Raymond James & Associates
© 2013 Raymond James & Associates, Inc., member New York Stock Exchange/SIPC. All rights reserved.
International Headquarters: The Raymond James Financial Center | 880 Carillon Parkway | St. Petersburg, Florida 33716 | 800 -248-8863 6
No excess oil capacity – first time in 40 years
U.S. has become lowest cost producer for oil &
gas
– Most underestimate the U.S. efficiency gains
– Extraction cost falling rapidly
– U.S. oil supply is cheap, resilient, and substantial
U.S. growth displaces offshore/international
Published by Raymond James & Associates
U.S. Research
© 2016 Raymond James & Associates, Inc., member New York Stock Exchange/SIPC. All rights reserved.
International Headquarters: The Raymond James Financial Center | 880 Carillon Parkway | St. Petersburg, Florida 33716 | 800 -248-8863
How has the Oil & Gas World Changed?

© 2013 Raymond James & Associates, Inc., member New York Stock Exchange/SIPC. All rights reserved.
International Headquarters: The Raymond James Financial Center | 880 Carillon Parkway | St. Petersburg, Florida 33716 | 800 -248-8863 7
U.S. ResearchPublished by Raymond James & Associates
U.S. Research
© 2016 Raymond James & Associates, Inc., member New York Stock Exchange/SIPC. All rights reserved.
International Headquarters: The Raymond James Financial Center | 880 Carillon Parkway | St. Petersburg, Florida 33716 | 800 -248-8863
Problem #1: Iraq’s Production Surge
2.69
2.92
3.073.12
3.03
3.16
3.043.08
3.293.33
3.22
3.48 3.5
3.94
4.25 4.28 4.28 4.294.35
4.404.45 4.45 4.45 4.45
1Q12 2Q12 3Q12 4Q12 1Q13 2Q13 3Q13 4Q13 1Q14 2Q14 3Q14 4Q14 1Q15 2Q15 3Q15 4Q15 1Q16 2Q16 3Q16E 4Q16E 1Q17E 2Q17E 3Q17E 4Q17E
Iraq Crude Production, 2012-2017E (MMbpd)
IEA Reported Iraq Crude Production Raymond James ForecastSource: IEA, Bloomberg, Raymond James Research
Up ~1 million bpd!
© 2013 Raymond James & Associates, Inc., member New York Stock Exchange/SIPC. All rights reserved.
International Headquarters: The Raymond James Financial Center | 880 Carillon Parkway | St. Petersburg, Florida 33716 | 800 -248-8863 8
U.S. ResearchPublished by Raymond James & Associates
U.S. Research
© 2016 Raymond James & Associates, Inc., member New York Stock Exchange/SIPC. All rights reserved.
International Headquarters: The Raymond James Financial Center | 880 Carillon Parkway | St. Petersburg, Florida 33716 | 800 -248-8863
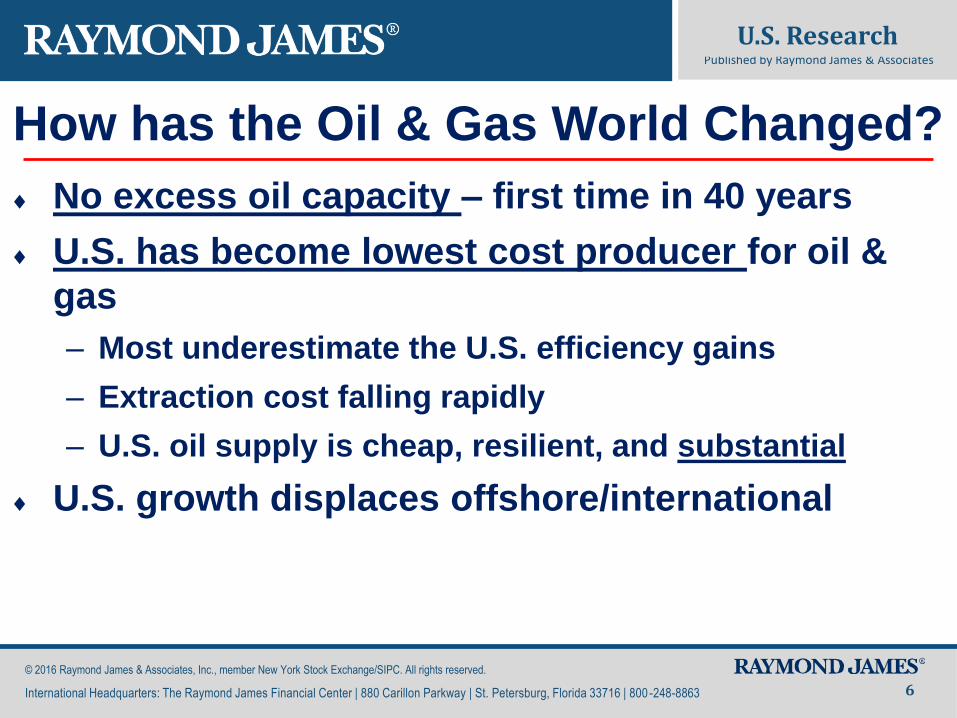
Problem #2: Iran Returns to Market
3.633.65
3.533.51
3.37
3.14
2.81
2.71 2.702.68
2.64
2.71
2.812.84
2.79 2.802.82
2.852.87
2.89
3.15
3.61
3.65
3.60 3.60 3.60 3.60 3.60
1Q11 2Q11 3Q11 4Q11 1Q12 2Q12 3Q12 4Q12 1Q13 2Q13 3Q13 4Q13 1Q14 2Q14 3Q14 4Q14 1Q15 2Q15 3Q15 4Q15 1Q16 2Q16 3Q16E 4Q16E 1Q17E 2Q17E 3Q17E 4Q17E
Iran Crude Production, 2011-2017E (MMbpd)
IEA Reported Iran Crude Production Raymond James ForecastSource: IEA, Raymond James Research
EU embargois announced
Final nuclear agreement is announced
Up 720,000 bpd!

© 2013 Raymond James & Associates, Inc., member New York Stock Exchange/SIPC. All rights reserved.
International Headquarters: The Raymond James Financial Center | 880 Carillon Parkway | St. Petersburg, Florida 33716 | 800 -248-8863 9
U.S. ResearchPublished by Raymond James & Associates
U.S. Research
© 2016 Raymond James & Associates, Inc., member New York Stock Exchange/SIPC. All rights reserved.
International Headquarters: The Raymond James Financial Center | 880 Carillon Parkway | St. Petersburg, Florida 33716 | 800 -248-8863
Problem #3: Saudi Production Surged
8.55
8.9
9.34 9.37
9.65
9.77
9.6
9.23
8.99
9.27
9.82
9.49 9.469.5
9.629.53
9.77
10.29 10.2710.18 10.21
10.31
10.60
10.35
10.25
10.35
10.65
10.40
1Q11 2Q11 3Q11 4Q11 1Q12 2Q12 3Q12 4Q12 1Q13 2Q13 3Q13 4Q13 1Q14 2Q14 3Q14 4Q14 1Q15 2Q15 3Q15 4Q15 1Q16 2Q16 3Q16E 4Q16E 1Q17E 2Q17E 3Q17E 4Q17E
Saudi Arabia Crude Production (excl. Neutral Zone), 2011-2017E (MMbpd)
IEA Reported Saudi Arabia Crude Production Raymond James ForecastSource: IEA, Raymond James ResearchSource: IEA, Raymond James ResearchSource: IEA, Raymond James Research
Up ~800,000 bpd!

© 2013 Raymond James & Associates, Inc., member New York Stock Exchange/SIPC. All rights reserved.
International Headquarters: The Raymond James Financial Center | 880 Carillon Parkway | St. Petersburg, Florida 33716 | 800 -248-8863 10
If they have it, …
Why haven’t we seen it?
Published by Raymond James & Associates
U.S. Research
© 2016 Raymond James & Associates, Inc., member New York Stock Exchange/SIPC. All rights reserved.
International Headquarters: The Raymond James Financial Center | 880 Carillon Parkway | St. Petersburg, Florida 33716 | 800 -248-8863
Does Saudi Really Have 2 MMbpd More?
275,000
285,000
295,000
305,000
315,000
325,000
335,000
Sau
di C
rud
e O
il In
ven
tori
es
(Mb
bls
)
Saudi Crude Oil Inventories
Source: JODI
Why Are Saudi OilInventories Falling?
Why are Saudi
inventories
falling?

© 2013 Raymond James & Associates, Inc., member New York Stock Exchange/SIPC. All rights reserved.
International Headquarters: The Raymond James Financial Center | 880 Carillon Parkway | St. Petersburg, Florida 33716 | 800 -248-8863
The Oil Truck Has No Shock Absorbers
U.S. ResearchPublished by Raymond James & Associates
© 2016 Raymond James & Associates, Inc., member New York Stock Exchange/SIPC. All rights reserved.
International Headquarters: The Raymond James Financial Center | 880 Carillon Parkway | St. Petersburg, Florida 33716 | 800 -248-8863 11
0
2
4
6
8
10
12
14
16
1970
1971
1972
1973
1974
1975
1976
1977
1978
1979
1980
1981
1982
1983
1984
1985
1986
1987
1988
1989
1990
1991
1992
1993
1994
1995
1996
1997
1998
1999
2000
2001
2002
2003
2004
2005
2006
2007
2008
2009
2010
2011
2012
2013
2014
2015
2016E
Excess C
ap
acit
y(M
Mb
ls/d
ay)
Excess OPEC Capacity
OPEC Excess CapacitySources: IEA, RJ&A, Bloomberg
16 MMBbls/d in '83 v.s. Almost None Today
15 Yr Bear Market For Oil

© 2013 Raymond James & Associates, Inc., member New York Stock Exchange/SIPC. All rights reserved.
International Headquarters: The Raymond James Financial Center | 880 Carillon Parkway | St. Petersburg, Florida 33716 | 800 -248-8863 12
U.S. ResearchPublished by Raymond James & Associates
U.S. Research
© 2016 Raymond James & Associates, Inc., member New York Stock Exchange/SIPC. All rights reserved.
International Headquarters: The Raymond James Financial Center | 880 Carillon Parkway | St. Petersburg, Florida 33716 | 800 -248-8863
Total OPEC and U.S. Production
6.00
8.00
10.00
12.00
14.00
16.00
18.00
30.00
32.00
34.00
36.00
38.00
40.00
42.00
Tota
l U.S
. Cru
de
Pro
du
ctio
n in
mm
bp
d
To
tal O
PEC
Cru
de
Pro
du
ctio
n in
mm
bp
d
OPEC and U.S. Total Oil Production
OPEC United States - total
Forecast

© 2013 Raymond James & Associates, Inc., member New York Stock Exchange/SIPC. All rights reserved.
International Headquarters: The Raymond James Financial Center | 880 Carillon Parkway | St. Petersburg, Florida 33716 | 800 -248-8863 13
Efficiency Gains are Driving Growth
U.S. ResearchPublished by Raymond James & Associates
U.S. Research
© 2016 Raymond James & Associates, Inc., member New York Stock Exchange/SIPC. All rights reserved.
International Headquarters: The Raymond James Financial Center | 880 Carillon Parkway | St. Petersburg, Florida 33716 | 800 -248-8863
-
2,000
4,000
6,000
8,000
10,000
12,000
-
200
400
600
800
1,000
1,200
Mar
-07
Jul-
07
No
v-0
7
Mar
-08
Jul-
08
No
v-0
8
Mar
-09
Jul-
09
No
v-0
9
Mar
-10
Jul-
10
No
v-1
0
Mar
-11
Jul-
11
No
v-1
1
Mar
-12
Jul-
12
No
v-1
2
Mar
-13
Jul-
13
No
v-1
3
Mar
-14
Jul-
14
No
v-1
4
Mar
-15
Jul-
15
No
v-1
5
Mar
-16
Nat
ura
l gas
Pro
du
ctio
n (
Mcf
/day
)
Oil
Pro
du
ctio
n (
Bb
l/d
ay)
Production by Rig by PlayBakken
Eagle Ford
Niobrara
Permian
Marcellus*
Utica*
Haynesville*
Marcellus*
Bakken
Utica*
Eagle Ford
Niobrara
Haynesville*
Permian
* On Secondary AxisSources: EIA and Raymond James Research

© 2013 Raymond James & Associates, Inc., member New York Stock Exchange/SIPC. All rights reserved.
International Headquarters: The Raymond James Financial Center | 880 Carillon Parkway | St. Petersburg, Florida 33716 | 800 -248-8863
Well Productivity Growth Should Slow in 2017/18
14
U.S. ResearchPublished by Raymond James & Associates
U.S. Research
© 2016 Raymond James & Associates, Inc., member New York Stock Exchange/SIPC. All rights reserved.
International Headquarters: The Raymond James Financial Center | 880 Carillon Parkway | St. Petersburg, Florida 33716 | 800 -248-8863
37%
35%
31%
38%
36%
14%
7%
0
100
200
300
400
500
600
700
20
11
20
12
20
13
20
14
20
15
E
20
16
E
20
17
E
20
18
E
IP-3
0s
(Bp
d/w
ell)
U.S. Oil Productivity Gains
Sources: EIA, HPDI, and Raymond James Research
Moving up the Learning Curve:1. Shift from Verticals to Horizontals2. Longer Laterals3. More Stages
Accelerating Efficiencies:1. Continued Trends from Previous Years2. High-grading to Most Productive Portions of the Plays
Decelerating Efficiencies:1. Previous Trends Contribute Less Growth2. Low-grading to Fringe Portions of the Plays

© 2013 Raymond James & Associates, Inc., member New York Stock Exchange/SIPC. All rights reserved.
International Headquarters: The Raymond James Financial Center | 880 Carillon Parkway | St. Petersburg, Florida 33716 | 800 -248-8863 15
U.S. Oil Growth Potential Still Staggering!
U.S. ResearchPublished by Raymond James & Associates
U.S. Research
Source: HPDI, EIA, Raymond James Research
© 2016 Raymond James & Associates, Inc., member New York Stock Exchange/SIPC. All rights reserved.
International Headquarters: The Raymond James Financial Center | 880 Carillon Parkway | St. Petersburg, Florida 33716 | 800 -248-8863
4,000
5,000
6,000
7,000
8,000
9,000
10,000
11,000
12,000
13,000
14,000
Jan
-19
85
May
-19
86
Sep
-19
87
Jan
-19
89
May
-19
90
Sep
-19
91
Jan
-19
93
May
-19
94
Sep
-19
95
Jan
-19
97
May
-19
98
Sep
-19
99
Jan
-20
01
May
-20
02
Sep
-20
03
Jan
-20
05
May
-20
06
Sep
-20
07
Jan
-20
09
May
-20
10
Sep
-20
11
Jan
-20
13
May
-20
14
Sep
-20
15
Jan
-201
7
May
-20
18
Sep
-20
19
Long-Term U.S. Crude Production Forecast
Forecast
MMBbl/d

© 2013 Raymond James & Associates, Inc., member New York Stock Exchange/SIPC. All rights reserved.
International Headquarters: The Raymond James Financial Center | 880 Carillon Parkway | St. Petersburg, Florida 33716 | 800 -248-8863
8,500
9,000
9,500
10,000U.S. Oil Production (MBbl/d)
Total U.S. Crude
MBbl/d
Source: EIA, HPDI, Raymond James Research
U.S. Oil Supply Bottoms in Late-2016
16
U.S. ResearchPublished by Raymond James & Associates
U.S. Research
© 2016 Raymond James & Associates, Inc., member New York Stock Exchange/SIPC. All rights reserved.
International Headquarters: The Raymond James Financial Center | 880 Carillon Parkway | St. Petersburg, Florida 33716 | 800 -248-8863
Estimates
* Assuming 500 Average
U.S. Rigs in 2016

© 2013 Raymond James & Associates, Inc., member New York Stock Exchange/SIPC. All rights reserved.
International Headquarters: The Raymond James Financial Center | 880 Carillon Parkway | St. Petersburg, Florida 33716 | 800 -248-8863
What is U.S. Supply Sensitivity to Activity?
17
U.S. ResearchPublished by Raymond James & Associates
U.S. Research
© 2016 Raymond James & Associates, Inc., member New York Stock Exchange/SIPC. All rights reserved.
International Headquarters: The Raymond James Financial Center | 880 Carillon Parkway | St. Petersburg, Florida 33716 | 800 -248-8863
U.S. Rigs U.S. Oil Supply Growth
U.S. Rig Count Forecast Y/Y
Change
Rig Count Assumption Y/Y % ∆
0% -20% Base +20% Base
2014 1,858 6%
2015 976 -47%
2016E 406 507 608 -48%
2017E 640 800 960 58%
2018E 880 1,100 1,320 38%
Source: EIA, HPDI, Raymond James
U.S. Liquids Production Growth
(y/y growth in MBbl/d)
Impact from Rig Count Change
0% -20% Base +20%
2014 1,665
2015 966
2016E (426) (337) (234)
2017E (171) 222 631
2018E 767 1,127 1,490
Source: EIA, HPDI, Raymond James Research

© 2013 Raymond James & Associates, Inc., member New York Stock Exchange/SIPC. All rights reserved.
International Headquarters: The Raymond James Financial Center | 880 Carillon Parkway | St. Petersburg, Florida 33716 | 800 -248-8863
Rig Count Largest Driver of Production Changes
18
U.S. ResearchPublished by Raymond James & Associates
U.S. Research
© 2016 Raymond James & Associates, Inc., member New York Stock Exchange/SIPC. All rights reserved.
International Headquarters: The Raymond James Financial Center | 880 Carillon Parkway | St. Petersburg, Florida 33716 | 800 -248-8863
Consensus?
Impossible Rig Count
-600
-400
-200
0
200
400
600
800
1000
400 500 600 700 800 900 1000 1100 12002017 Average Rig Count
2017 Y/Y U.S. Liquids Production Growth Under Various Rig Count Scenarios
Source: RJ Estimates, EIA, Drilling InfoAssumes 2016 rig count remains unchanged from current estimateAssumes oil rig percentage of 80%
MBbl/d

© 2013 Raymond James & Associates, Inc., member New York Stock Exchange/SIPC. All rights reserved.
International Headquarters: The Raymond James Financial Center | 880 Carillon Parkway | St. Petersburg, Florida 33716 | 800 -248-8863 19
U.S. Oil Service Industry is Dying at “Strip” Prices
U.S. ResearchPublished by Raymond James & Associates
U.S. Research
© 2016 Raymond James & Associates, Inc., member New York Stock Exchange/SIPC. All rights reserved.
International Headquarters: The Raymond James Financial Center | 880 Carillon Parkway | St. Petersburg, Florida 33716 | 800 -248-8863
$0
$20,000
$40,000
$60,000
$80,000
$100,000
$120,000
$140,000
$160,000
$180,000
$200,000
Cas
h F
low
in M
illio
ns
U.S. Oilfield Cash Flow and Capex
Operating Cash Flow Total Capex
Source: Raymond James Research; Spears & Associates; EIA; Company Reports; Bloomberg
U.S. E&P Capex
U.S. E&P Cash Flows

© 2013 Raymond James & Associates, Inc., member New York Stock Exchange/SIPC. All rights reserved.
International Headquarters: The Raymond James Financial Center | 880 Carillon Parkway | St. Petersburg, Florida 33716 | 800 -248-8863 20
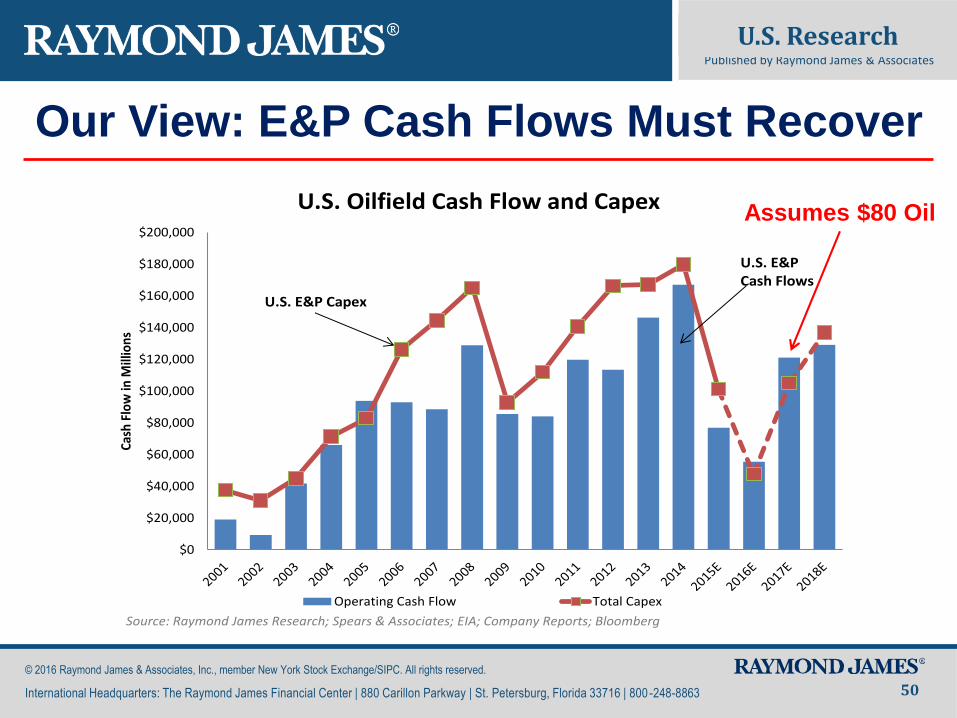
E&P Cash Flows Must Recover
U.S. ResearchPublished by Raymond James & Associates
U.S. Research
© 2016 Raymond James & Associates, Inc., member New York Stock Exchange/SIPC. All rights reserved.
International Headquarters: The Raymond James Financial Center | 880 Carillon Parkway | St. Petersburg, Florida 33716 | 800 -248-8863
$0
$20,000
$40,000
$60,000
$80,000
$100,000
$120,000
$140,000
$160,000
$180,000
$200,000
Cash
Flo
w in
Mill
ion
s
U.S. Oilfield Cash Flow and Capex
Operating Cash Flow Total Capex
Source: Raymond James Research; Spears & Associates; EIA; Company Reports; Bloomberg
U.S. E&P Capex
U.S. E&P Cash Flows
Assumes $80 Oil

© 2013 Raymond James & Associates, Inc., member New York Stock Exchange/SIPC. All rights reserved.
International Headquarters: The Raymond James Financial Center | 880 Carillon Parkway | St. Petersburg, Florida 33716 | 800 -248-8863
U.S. ResearchPublished by Raymond James & Associates
Non-U.S. Supply Assumptions Very Conservative
© 2016 Raymond James & Associates, Inc., member New York Stock Exchange/SIPC. All rights reserved.
International Headquarters: The Raymond James Financial Center | 880 Carillon Parkway | St. Petersburg, Florida 33716 | 800 -248-8863 21
Sources: IEA, Raymond James Research
1,181 1,179
1,026
1,375
2016E 2017E 2018E 2019E
MB
bls
/d
Oil Project Delays and Cancellations, by Start Year
466
-739
-90
75
2015 2016E 2017E 2018E
MB
bls
/d
Non-OPEC/Non-U.S. Y/Y Oil Production Change
Source: IEA, Raymond James estimates

© 2013 Raymond James & Associates, Inc., member New York Stock Exchange/SIPC. All rights reserved.
International Headquarters: The Raymond James Financial Center | 880 Carillon Parkway | St. Petersburg, Florida 33716 | 800 -248-8863 22
Global Capex Down 30+% Two Years in a Row ?
U.S. ResearchPublished by Raymond James & Associates
U.S. Research
© 2016 Raymond James & Associates, Inc., member New York Stock Exchange/SIPC. All rights reserved.
International Headquarters: The Raymond James Financial Center | 880 Carillon Parkway | St. Petersburg, Florida 33716 | 800 -248-8863
Source: IEA, Raymond James Research
$0
$100,000
$200,000
$300,000
$400,000
$500,000
$600,000
2010 2011 2012 2013 2014 2015 2016E
$ M
M
Capital Spending of Large-Cap Oil and Gas Companies
Based in the U.S.
Based Outside the U.S.
Source: Company filings, Raymond James research
Global Spending Down +/- 50%!

© 2013 Raymond James & Associates, Inc., member New York Stock Exchange/SIPC. All rights reserved.
International Headquarters: The Raymond James Financial Center | 880 Carillon Parkway | St. Petersburg, Florida 33716 | 800 -248-8863 23
U.S. ResearchPublished by Raymond James & Associates
U.S. Research
© 2016 Raymond James & Associates, Inc., member New York Stock Exchange/SIPC. All rights reserved.
International Headquarters: The Raymond James Financial Center | 880 Carillon Parkway | St. Petersburg, Florida 33716 | 800 -248-8863
Geopolitical Disruption
Nigeria Venezuela

© 2013 Raymond James & Associates, Inc., member New York Stock Exchange/SIPC. All rights reserved.
International Headquarters: The Raymond James Financial Center | 880 Carillon Parkway | St. Petersburg, Florida 33716 | 800 -248-8863 24
U.S. ResearchPublished by Raymond James & Associates
U.S. Research
© 2016 Raymond James & Associates, Inc., member New York Stock Exchange/SIPC. All rights reserved.
International Headquarters: The Raymond James Financial Center | 880 Carillon Parkway | St. Petersburg, Florida 33716 | 800 -248-8863
Structural Declines
China Colombia

© 2013 Raymond James & Associates, Inc., member New York Stock Exchange/SIPC. All rights reserved.
International Headquarters: The Raymond James Financial Center | 880 Carillon Parkway | St. Petersburg, Florida 33716 | 800 -248-8863 25
U.S. ResearchPublished by Raymond James & Associates
U.S. Research
© 2016 Raymond James & Associates, Inc., member New York Stock Exchange/SIPC. All rights reserved.
International Headquarters: The Raymond James Financial Center | 880 Carillon Parkway | St. Petersburg, Florida 33716 | 800 -248-8863
Structural Declines (Continued)
Angola Mexico

© 2013 Raymond James & Associates, Inc., member New York Stock Exchange/SIPC. All rights reserved.
International Headquarters: The Raymond James Financial Center | 880 Carillon Parkway | St. Petersburg, Florida 33716 | 800 -248-8863
OIL DEMAND HAS
NOT BEEN THE PROBLEM
26
U.S. ResearchPublished by Raymond James & Associates
U.S. Research
© 2016 Raymond James & Associates, Inc., member New York Stock Exchange/SIPC. All rights reserved.
International Headquarters: The Raymond James Financial Center | 880 Carillon Parkway | St. Petersburg, Florida 33716 | 800 -248-8863

© 2013 Raymond James & Associates, Inc., member New York Stock Exchange/SIPC. All rights reserved.
International Headquarters: The Raymond James Financial Center | 880 Carillon Parkway | St. Petersburg, Florida 33716 | 800 -248-8863 27
U.S. ResearchPublished by Raymond James & Associates
U.S. Research
© 2016 Raymond James & Associates, Inc., member New York Stock Exchange/SIPC. All rights reserved.
International Headquarters: The Raymond James Financial Center | 880 Carillon Parkway | St. Petersburg, Florida 33716 | 800 -248-8863
0.0
0.5
1.0
1.5
2.0
2.5
3.0
3.5
4.0
4.5
19
60
19
65
19
70
19
75
19
80
19
85
19
90
19
95
20
00
20
05
20
10
20
15E
Oil Consumption Intensity - China vs. India
China India
Bb
ls o
f O
ilp
er
$1,0
00
GD
P
Source: EIA, IEA, IMF, World Bank
0.0
0.2
0.4
0.6
0.8
1.0
1.2
1.4
1.6
19
60
19
64
19
68
19
72
19
76
19
80
19
84
19
88
19
92
19
96
20
00
20
04
20
08
20
12E
Oil Consumption Intensity - Select Developed Countries
Germany Japan
U.S. UK
Bb
ls o
f O
ilp
er
$1,0
00 G
DP
(2000$)
Source: EIA, IEA, World Bank, CIA World Factbook
Japan
U.S.
UK
Germany
Long-Term Efficiency Trends Are Real, But…

© 2013 Raymond James & Associates, Inc., member New York Stock Exchange/SIPC. All rights reserved.
International Headquarters: The Raymond James Financial Center | 880 Carillon Parkway | St. Petersburg, Florida 33716 | 800 -248-8863 28
U.S. ResearchPublished by Raymond James & Associates
U.S. Research
© 2016 Raymond James & Associates, Inc., member New York Stock Exchange/SIPC. All rights reserved.
International Headquarters: The Raymond James Financial Center | 880 Carillon Parkway | St. Petersburg, Florida 33716 | 800 -248-8863
Cheap Gasoline is Slowing U.S. Efficiency Trend
22.5
23.0
23.5
24.0
24.5
25.0
25.5
26.0
Average MPG for New Vehicles Sold
Source: University of Michigan Transportation Research Institute
Downward trend after oil price crash

© 2013 Raymond James & Associates, Inc., member New York Stock Exchange/SIPC. All rights reserved.
International Headquarters: The Raymond James Financial Center | 880 Carillon Parkway | St. Petersburg, Florida 33716 | 800 -248-8863 29
Driving Trends Are Changing
U.S. ResearchPublished by Raymond James & Associates
U.S. Research
© 2016 Raymond James & Associates, Inc., member New York Stock Exchange/SIPC. All rights reserved.
International Headquarters: The Raymond James Financial Center | 880 Carillon Parkway | St. Petersburg, Florida 33716 | 800 -248-8863
175
200
225
250
275
Ve
hic
le-m
ile
s (i
n b
illio
ns)
U.S. Vehicle-Miles Traveled (Monthly Average)
Source: U.S. Department of Transportation
Vehicle miles driven up3.5% in 2015, and up 3.3% YTD 2016!
Why the Stagnation?
- Urbanization?
- Demographics?
- Low Employment?
- High Gasoline Prices?
- Internet?

© 2013 Raymond James & Associates, Inc., member New York Stock Exchange/SIPC. All rights reserved.
International Headquarters: The Raymond James Financial Center | 880 Carillon Parkway | St. Petersburg, Florida 33716 | 800 -248-8863
2016 Gasoline Prices Lower Than 2015
Published by Raymond James & Associates
U.S. Research
© 2016 Raymond James & Associates, Inc., member New York Stock Exchange/SIPC. All rights reserved.
International Headquarters: The Raymond James Financial Center | 880 Carillon Parkway | St. Petersburg, Florida 33716 | 800 -248-8863 30
$1.00
$1.50
$2.00
$2.50
$3.00
$3.50
$4.00
2012 2013 2014 2015 2016E 2017E
Average Annual Gasoline Price
Source: EIA, RJ Research
Down ~28%
Down ~24%

© 2013 Raymond James & Associates, Inc., member New York Stock Exchange/SIPC. All rights reserved.
International Headquarters: The Raymond James Financial Center | 880 Carillon Parkway | St. Petersburg, Florida 33716 | 800 -248-8863
-0.18%
2.70%2.57%
1.50%
2005-2014 Average 2015 Actual 2016 YTD Actual 2016 RJ Estimate
2016 U.S. Gasoline Demand (% Change)
Source: EIA
So, U.S. Gasoline Demand Is Responding!
Published by Raymond James & Associates
U.S. Research
© 2016 Raymond James & Associates, Inc., member New York Stock Exchange/SIPC. All rights reserved.
International Headquarters: The Raymond James Financial Center | 880 Carillon Parkway | St. Petersburg, Florida 33716 | 800 -248-8863 31
Too Low?

© 2013 Raymond James & Associates, Inc., member New York Stock Exchange/SIPC. All rights reserved.
International Headquarters: The Raymond James Financial Center | 880 Carillon Parkway | St. Petersburg, Florida 33716 | 800 -248-8863 32
Gasoline Now “Driving” Chinese Demand
U.S. ResearchPublished by Raymond James & Associates
U.S. Research
© 2016 Raymond James & Associates, Inc., member New York Stock Exchange/SIPC. All rights reserved.
International Headquarters: The Raymond James Financial Center | 880 Carillon Parkway | St. Petersburg, Florida 33716 | 800 -248-8863
Gasoline19%
Jet Fuel4%
Diesel36%
Fuel Oil13%
Other (Naphtha, Heating Oil, LPG,
Asphalt, Miscellaneous)
28%
2006 Chinese Oil Demand Breakdown
Total average annual oil demandwas 7.2 MMBbls/d
Middle class transportation accounts for ~23%
Source: Bloomberg, IEA, National Bureau of Statistics of China, Raymond
Gasoline26%
Jet Fuel6%
Diesel34%
Fuel Oil5%
Other (Naphtha,
Heating Oil, LPG, Asphalt,
Miscellaneous)29%
2015 Chinese Oil Demand Breakdown
Total average annual oil demand was 11.24 MMBbls/d
Middle classtransportation accounts for ~32%
Source: Bloomberg, IEA, National Bureau of Statistics of China, Raymond

© 2013 Raymond James & Associates, Inc., member New York Stock Exchange/SIPC. All rights reserved.
International Headquarters: The Raymond James Financial Center | 880 Carillon Parkway | St. Petersburg, Florida 33716 | 800 -248-8863 33
China Oil Demand Problem Overstated !
U.S. ResearchPublished by Raymond James & Associates
U.S. Research
© 2016 Raymond James & Associates, Inc., member New York Stock Exchange/SIPC. All rights reserved.
International Headquarters: The Raymond James Financial Center | 880 Carillon Parkway | St. Petersburg, Florida 33716 | 800 -248-8863
0.89
0.48
0.59
0.44
0.36
0.63
0.37
0.00
0.10
0.20
0.30
0.40
0.50
0.60
0.70
0.80
0.90
1.00
Chinese Demand Growth by Product (Million Bpd)
Other
Middle Class Transportation (Gas/Jet)
Estimates
Total
Source: Bloomberg, IEA, National Bureau of Statistics of China, RJ Research
0.29
Transportation accounts for 66% of 3 yr avg. growth

© 2013 Raymond James & Associates, Inc., member New York Stock Exchange/SIPC. All rights reserved.
International Headquarters: The Raymond James Financial Center | 880 Carillon Parkway | St. Petersburg, Florida 33716 | 800 -248-8863
Chinese SUV Sales Steadily Climbing
34
Published by Raymond James & Associates
U.S. Research
© 2016 Raymond James & Associates, Inc., member New York Stock Exchange/SIPC. All rights reserved.
International Headquarters: The Raymond James Financial Center | 880 Carillon Parkway | St. Petersburg, Florida 33716 | 800 -248-8863
-
100,000
200,000
300,000
400,000
500,000
600,000
700,000
800,000
China SUV Sales
Source: National Bureau of Statistics of China, Bloomberg
Average annual growth of almost 37% from 2011 through 2015.

© 2013 Raymond James & Associates, Inc., member New York Stock Exchange/SIPC. All rights reserved.
International Headquarters: The Raymond James Financial Center | 880 Carillon Parkway | St. Petersburg, Florida 33716 | 800 -248-8863 35
Lower Oil Prices Have Stimulated Demand
U.S. ResearchPublished by Raymond James & Associates
U.S. Research
Source: IEA, Raymond James Research
© 2016 Raymond James & Associates, Inc., member New York Stock Exchange/SIPC. All rights reserved.
International Headquarters: The Raymond James Financial Center | 880 Carillon Parkway | St. Petersburg, Florida 33716 | 800 -248-8863
70
75
80
85
90
95
100
1Q
99
3Q
99
1Q
00
3Q
00
1Q
01
3Q
01
1Q
02
3Q
02
1Q
03
3Q
03
1Q
04
3Q
04
1Q
05
3Q
05
1Q
06
3Q
06
1Q
07
3Q
07
1Q
08
3Q
08
1Q
09
3Q
09
1Q
10
3Q
10
1Q
11
3Q
11
1Q
12
3Q
12
1Q
13
3Q
13
1Q
14
3Q
14
1Q
15
3Q
15
1Q
16
3Q
16
E
Global Oil Demand
"Old School"
1.0 MMBPD Y/Y Growth
$100 Oil
1.4 MMBPD Y/Y Growth
1.5 MMBPD Y/Y Growth
$55 Oil

© 2013 Raymond James & Associates, Inc., member New York Stock Exchange/SIPC. All rights reserved.
International Headquarters: The Raymond James Financial Center | 880 Carillon Parkway | St. Petersburg, Florida 33716 | 800 -248-8863 36
U.S. ResearchPublished by Raymond James & Associates
U.S. Research
© 2016 Raymond James & Associates, Inc., member New York Stock Exchange/SIPC. All rights reserved.
International Headquarters: The Raymond James Financial Center | 880 Carillon Parkway | St. Petersburg, Florida 33716 | 800 -248-8863
We Think Global Oil Demand is Stout!
Region 2015 2016E 2017E 2018E
North America 0.9% 1.0% 0.0% 0.0%
Europe 1.9% 0.4% -1.0% -1.0%
Pacific (mainly Japan) -0.3% 0.0% -1.0% -1.0%
CIS (mainly Russia) -1.0% 1.8% 0.5% 0.5%
China 6.4% 3.2% 2.5% 2.5%
Other Asia 4.1% 4.9% 3.7% 3.7%
Latin America -0.7% -0.7% 1.0% 1.0%
Middle East 1.8% 0.8% 2.0% 2.0%
Africa 3.7% 2.6% 1.9% 1.9%
Total Demand Growth* (Jan. 2016) 1.8 MMbpd 1.4 MMbpd 1.2 MMbpd 1.2 MMbpd
Total Demand % Growth* (Jan. 2016) 2.0% 1.4% 1.2% 1.2%
Total Demand Growth* (Current) 1.8 MMbpd 1.7 MMbpd 0.9 MMbpd 1.0 MMbpd
Total Demand % Growth* (Current) 2.0% 1.8% 0.9% 1.0%
IEA Estimate (MMbpd) 1.9 MMbpd 1.2 MMbpd 1.2 MMbpd
IEA Estimate (%) 2.0% 1.3% 1.3%
Source: IEA, IMF, Raymond James research * After missing barrels
Oil Demand: Year-Over-Year Changes

© 2013 Raymond James & Associates, Inc., member New York Stock Exchange/SIPC. All rights reserved.
International Headquarters: The Raymond James Financial Center | 880 Carillon Parkway | St. Petersburg, Florida 33716 | 800 -248-8863 37
U.S. ResearchPublished by Raymond James & Associates
U.S. Research
© 2016 Raymond James & Associates, Inc., member New York Stock Exchange/SIPC. All rights reserved.
International Headquarters: The Raymond James Financial Center | 880 Carillon Parkway | St. Petersburg, Florida 33716 | 800 -248-8863
Where Does That Leave Our Global Oil Model?(Assumes No Additional Interruptions)
Source 2014A 2015A 2016E 2017E 2018E
Previous Year Build/Draw -0.7 0.4 1.4 -0.3 -0.6
U.S. Supply Growth 1.8 1.0 -0.3 0.3 1.2
Other Non-OPEC Non-U.S. -0.2 0.5 -0.6 -0.1 0.1OPEC Supply Growth 0.7 1.3 1.0 0.4 0.2
Saudi Arabia 0.1 0.6 0.2 0.0 0.0
Iraq 0.3 0.7 0.3 0.1 0.0
Iran 0.1 0.0 0.6 0.1 0.0
Total Global Supply 2.4 2.8 0.0 0.6 1.4
RJ Demand (incl. "Missing Bbls") 1.2 1.8 1.7 0.9 1.0
IEA Demand Estimate 1.3 1.6 1.4 1.3 N/A
Inventory Build Est. 0.4 1.4 -0.3 -0.6 -0.2
Source: IEA, Raymond James research
Current Model
Oil Supply-Demand: Year-Over-Year Changes
(MMbpd)

© 2013 Raymond James & Associates, Inc., member New York Stock Exchange/SIPC. All rights reserved.
International Headquarters: The Raymond James Financial Center | 880 Carillon Parkway | St. Petersburg, Florida 33716 | 800 -248-8863
0.42
1.42
-0.28
-0.58
-0.25
-0.7
-0.4
-0.1
0.2
0.5
0.8
1.1
1.4
2014 2015 2016E 2017E 2018E
Impl
ied
Build
(Dra
w) -
Aft
er M
issi
ng B
arre
ls (M
Mbp
d)
Est. Quarterly Global Petroleum Inventory Builds (Draws)
CurrentBuild (Draw) Est.
Source: IEA, Raymond James research
38
U.S. ResearchPublished by Raymond James & Associates
U.S. Research
© 2016 Raymond James & Associates, Inc., member New York Stock Exchange/SIPC. All rights reserved.
International Headquarters: The Raymond James Financial Center | 880 Carillon Parkway | St. Petersburg, Florida 33716 | 800 -248-8863
Supply Cycle’s Final Stages?

© 2013 Raymond James & Associates, Inc., member New York Stock Exchange/SIPC. All rights reserved.
International Headquarters: The Raymond James Financial Center | 880 Carillon Parkway | St. Petersburg, Florida 33716 | 800 -248-8863
Bearish:
• Will U.S. Efficiency Gains Continue?
• Does Saudi Have More Capacity?
• Hyperbolic U.S. $ Risk?
Bullish:
• Will OPEC Cut?
• Non-US, Non-OPEC Supply Decline?
• Middle East Production Risk Still Exists!
U.S. ResearchPublished by Raymond James & Associates
© 2016 Raymond James & Associates, Inc., member New York Stock Exchange/SIPC. All rights reserved.
International Headquarters: The Raymond James Financial Center | 880 Carillon Parkway | St. Petersburg, Florida 33716 | 800 -248-8863
Where Could We Be Wrong on Oil?
39

© 2013 Raymond James & Associates, Inc., member New York Stock Exchange/SIPC. All rights reserved.
International Headquarters: The Raymond James Financial Center | 880 Carillon Parkway | St. Petersburg, Florida 33716 | 800 -248-8863 40
Gas Should Rally in 2017—
Plenty of U.S. Gas Sub-
$3.00 Long-Term
U.S. ResearchPublished by Raymond James & Associates
U.S. Research
© 2016 Raymond James & Associates, Inc., member New York Stock Exchange/SIPC. All rights reserved.
International Headquarters: The Raymond James Financial Center | 880 Carillon Parkway | St. Petersburg, Florida 33716 | 800 -248-8863

© 2013 Raymond James & Associates, Inc., member New York Stock Exchange/SIPC. All rights reserved.
International Headquarters: The Raymond James Financial Center | 880 Carillon Parkway | St. Petersburg, Florida 33716 | 800 -248-8863
-2.1-2.6
-0.8-0.7-0.7
-0.3-0.2
0.10.5
1.51.4
-3.0 -2.5 -2.0 -1.5 -1.0 -0.5 0.0 0.5 1.0 1.5 2.0
TotalWeatherMexicoCanada
LNGLiquids
IndustrialBase Power
Nuke/HydroCswitching
Supply
Bcf/day
2017 Nov/Nov Theoretical Change in StorageTIGHTER LOOSER
BULLISH BEARISH
Ending Storage Estimates: Winter: 1,931 Bcf Summer: 3,761Bcf
Source: HPDI, EIA, Raymond James Estimates
2017 Gas Outlook Very Bullish
U.S. ResearchPublished by Raymond James & Associates
© 2016 Raymond James & Associates, Inc., member New York Stock Exchange/SIPC. All rights reserved.
International Headquarters: The Raymond James Financial Center | 880 Carillon Parkway | St. Petersburg, Florida 33716 | 800 -248-8863 41
This assumes
$3.25 Gas

© 2013 Raymond James & Associates, Inc., member New York Stock Exchange/SIPC. All rights reserved.
International Headquarters: The Raymond James Financial Center | 880 Carillon Parkway | St. Petersburg, Florida 33716 | 800 -248-8863
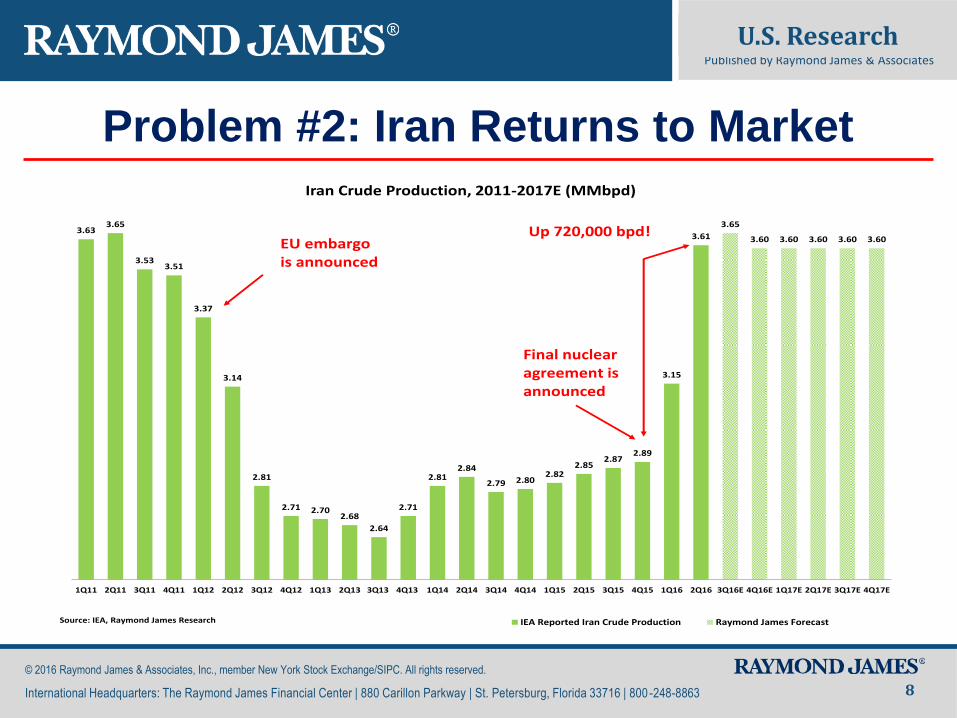
Pipelines Are Key to U.S. Gas Supply
U.S. ResearchPublished by Raymond James & Associates
© 2016 Raymond James & Associates, Inc., member New York Stock Exchange/SIPC. All rights reserved.
International Headquarters: The Raymond James Financial Center | 880 Carillon Parkway | St. Petersburg, Florida 33716 | 800 -248-8863 42
-5.0
-3.0
-1.0
1.0
3.0
5.0
7.0
9.0
Total Dry Gas Production Y/Y Growth
Dry Gas Plays Wet Gas Plays Oil Plays Other NE Pipe Adds Total DUCs and Shut-ins
Source: HPDI, EIA, Raymond James Estimates
Bcf/d
Production from dry gas plays rolls over in mid-2016
Associated gas production
Planned Northeast pipeline additions are not incorporated into our model and help boost production in 2016 and 2017.
gas production from non-major plays
© 2013 Raymond James & Associates, Inc., member New York Stock Exchange/SIPC. All rights reserved.
International Headquarters: The Raymond James Financial Center | 880 Carillon Parkway | St. Petersburg, Florida 33716 | 800 -248-8863
NE Takeaway Capacity Staggering for Next 3 Years
43
U.S. ResearchPublished by Raymond James & Associates
© 2016 Raymond James & Associates, Inc., member New York Stock Exchange/SIPC. All rights reserved.
International Headquarters: The Raymond James Financial Center | 880 Carillon Parkway | St. Petersburg, Florida 33716 | 800 -248-8863

© 2013 Raymond James & Associates, Inc., member New York Stock Exchange/SIPC. All rights reserved.
International Headquarters: The Raymond James Financial Center | 880 Carillon Parkway | St. Petersburg, Florida 33716 | 800 -248-8863 44
U.S. ResearchPublished by Raymond James & Associates
U.S. Research
© 2016 Raymond James & Associates, Inc., member New York Stock Exchange/SIPC. All rights reserved.
International Headquarters: The Raymond James Financial Center | 880 Carillon Parkway | St. Petersburg, Florida 33716 | 800 -248-8863
Northeast Price Differentials Improve, For Now

© 2013 Raymond James & Associates, Inc., member New York Stock Exchange/SIPC. All rights reserved.
International Headquarters: The Raymond James Financial Center | 880 Carillon Parkway | St. Petersburg, Florida 33716 | 800 -248-8863
Demand Tailwinds Exist for Gas
45
U.S. ResearchPublished by Raymond James & Associates
U.S. Research
© 2016 Raymond James & Associates, Inc., member New York Stock Exchange/SIPC. All rights reserved.
International Headquarters: The Raymond James Financial Center | 880 Carillon Parkway | St. Petersburg, Florida 33716 | 800 -248-8863

© 2013 Raymond James & Associates, Inc., member New York Stock Exchange/SIPC. All rights reserved.
International Headquarters: The Raymond James Financial Center | 880 Carillon Parkway | St. Petersburg, Florida 33716 | 800 -248-8863
LNG: 7+ Bcf/d of Potential Exports by 2020
46
U.S. ResearchPublished by Raymond James & Associates
© 2016 Raymond James & Associates, Inc., member New York Stock Exchange/SIPC. All rights reserved.
International Headquarters: The Raymond James Financial Center | 880 Carillon Parkway | St. Petersburg, Florida 33716 | 800 -248-8863
0
2
4
6
8
3Q15 4Q15 1Q16 2Q16 3Q16 4Q16 1Q17 2Q17 3Q17 4Q17 1Q18 2Q18 3Q18 4Q18 1Q19 2Q19 3Q19 4Q19
Bcf
/d
U.S. LNG Export Forecast (Bcf/d)
Cameron LNG Corpus Christi Cove Point Elba Island Freeport Sabine PassSource: Company reports, Raymond James research

© 2013 Raymond James & Associates, Inc., member New York Stock Exchange/SIPC. All rights reserved.
International Headquarters: The Raymond James Financial Center | 880 Carillon Parkway | St. Petersburg, Florida 33716 | 800 -248-8863 47
U.S. ResearchPublished by Raymond James & Associates
U.S. Research
© 2016 Raymond James & Associates, Inc., member New York Stock Exchange/SIPC. All rights reserved.
International Headquarters: The Raymond James Financial Center | 880 Carillon Parkway | St. Petersburg, Florida 33716 | 800 -248-8863
Natural Gas Rally in 2017!
2016 Q1 16A Q2 16A Q3 16E Q4 16E 2016E
Bloomberg Consensus $2.01 $2.13 $2.33 $2.50 $2.24
NYMEX Futures $2.01 $2.13 $2.91 $3.12 $2.54
Old RJ Gas $2.01 $2.13 $2.05 $2.30 $2.12
New RJ Gas $2.01 $2.13 $2.75 $3.00 $2.47
2017 Q1 17E Q2 17E Q3 17E Q4 17E 2017E
Bloomberg Consensus $2.90 $2.80 $2.90 $3.05 $2.91
NYMEX Futures $3.41 $3.05 $3.08 $3.17 $3.18
Old RJ Gas $2.70 $2.60 $2.55 $2.75 $2.65
New RJ Gas $3.50 $3.25 $3.00 $3.25 $3.25
2018 Q1 18E Q2 18E Q3 18E Q4 18E 2018E
Bloomberg Consensus $3.00 $3.00 $3.00 $3.00 $3.00
NYMEX Futures $3.34 $2.86 $2.90 $3.00 $3.02
Old RJ Gas $2.50 $2.50 $2.50 $2.50 $2.50
New RJ Gas $3.25 $3.00 $2.75 $3.00 $3.00
2019 (+) Long-Term Forecast
Bloomberg Consensus $3.01
NYMEX Futures $3.24
Old RJ Gas $2.50
RJ Long-Term Gas $2.50
Source: Bloomberg, Thomson Reuters, Raymond James research
RJ&A Henry Hub Natural Gas Price Forecast (as of July 2016)

© 2013 Raymond James & Associates, Inc., member New York Stock Exchange/SIPC. All rights reserved.
International Headquarters: The Raymond James Financial Center | 880 Carillon Parkway | St. Petersburg, Florida 33716 | 800 -248-8863
How Will Oilservice Cycle Unfold?
48
U.S. ResearchPublished by Raymond James & Associates
U.S. Research
© 2016 Raymond James & Associates, Inc., member New York Stock Exchange/SIPC. All rights reserved.
International Headquarters: The Raymond James Financial Center | 880 Carillon Parkway | St. Petersburg, Florida 33716 | 800 -248-8863

© 2013 Raymond James & Associates, Inc., member New York Stock Exchange/SIPC. All rights reserved.
International Headquarters: The Raymond James Financial Center | 880 Carillon Parkway | St. Petersburg, Florida 33716 | 800 -248-8863 49
U.S. Oil Service Industry is Dying at “Strip” Prices
U.S. ResearchPublished by Raymond James & Associates
U.S. Research
© 2016 Raymond James & Associates, Inc., member New York Stock Exchange/SIPC. All rights reserved.
International Headquarters: The Raymond James Financial Center | 880 Carillon Parkway | St. Petersburg, Florida 33716 | 800 -248-8863
$0
$20,000
$40,000
$60,000
$80,000
$100,000
$120,000
$140,000
$160,000
$180,000
$200,000
Cas
h F
low
in M
illio
ns
U.S. Oilfield Cash Flow and Capex
Operating Cash Flow Total Capex
Source: Raymond James Research; Spears & Associates; EIA; Company Reports; Bloomberg
U.S. E&P Capex
U.S. E&P Cash Flows
© 2013 Raymond James & Associates, Inc., member New York Stock Exchange/SIPC. All rights reserved.
International Headquarters: The Raymond James Financial Center | 880 Carillon Parkway | St. Petersburg, Florida 33716 | 800 -248-8863 50
Our View: E&P Cash Flows Must Recover
U.S. ResearchPublished by Raymond James & Associates
U.S. Research
© 2016 Raymond James & Associates, Inc., member New York Stock Exchange/SIPC. All rights reserved.
International Headquarters: The Raymond James Financial Center | 880 Carillon Parkway | St. Petersburg, Florida 33716 | 800 -248-8863
$0
$20,000
$40,000
$60,000
$80,000
$100,000
$120,000
$140,000
$160,000
$180,000
$200,000
Cash
Flo
w in
Mill
ion
s
U.S. Oilfield Cash Flow and Capex
Operating Cash Flow Total Capex
Source: Raymond James Research; Spears & Associates; EIA; Company Reports; Bloomberg
U.S. E&P Capex
U.S. E&P Cash Flows
Assumes $80 Oil

© 2013 Raymond James & Associates, Inc., member New York Stock Exchange/SIPC. All rights reserved.
International Headquarters: The Raymond James Financial Center | 880 Carillon Parkway | St. Petersburg, Florida 33716 | 800 -248-8863 51
U.S. ResearchPublished by Raymond James & Associates
U.S. Research
© 2016 Raymond James & Associates, Inc., member New York Stock Exchange/SIPC. All rights reserved.
International Headquarters: The Raymond James Financial Center | 880 Carillon Parkway | St. Petersburg, Florida 33716 | 800 -248-8863
U.S. Supply Constraints
Balance Sheets, Labor, Frac Equipment
4%
5%
6%
7%
8%
9%
10%
U.S. Unemployment Rate, 2006-present
Source: Bureau of Labor Statistics, U.S. Department of Labor
High 2010 unemployment eased search for oil & gas workers in last downturn
This oil & gas downturn, U.S.
unemployment is only 5%
4
6
8
10
12
14
16
18
4Q141Q152Q153Q154Q151Q162Q163Q164Q161Q172Q173Q174Q171Q182Q183Q184Q18
Mil
lio
n H
ors
ep
ow
er
U.S. Pressure Pumping Fleet vs. Demand
Supply Denotes Active and Available HHP with Minimal Incremental CapexSource: Company Reports, IHS, Baker Hughes, Raymond James Research
Pressure Pumpers Regain Pricing Power in 2017 to Incentivize Restoration and Repair of Stacked
Equipment
Implied 2018 HP Shortfall
U.S. Horsepower Supply Range
Frac HP Demand

© 2013 Raymond James & Associates, Inc., member New York Stock Exchange/SIPC. All rights reserved.
International Headquarters: The Raymond James Financial Center | 880 Carillon Parkway | St. Petersburg, Florida 33716 | 800 -248-8863 52
U.S. ResearchPublished by Raymond James & Associates
U.S. Research
© 2016 Raymond James & Associates, Inc., member New York Stock Exchange/SIPC. All rights reserved.
International Headquarters: The Raymond James Financial Center | 880 Carillon Parkway | St. Petersburg, Florida 33716 | 800 -248-8863
Legacy Equipment Must be Rebuilt
0
5
10
15
20
Mill
ion
Ho
rse
po
we
r
U.S. Pressure Pumping Fleet
Source: Company Reports, Raymond James Estimates
Marketable Legacy Equipment
Stacked, Refurbishable
Permanently Retired
Newbuilds
Refurbs
Black line designates total marketable equipment

© 2013 Raymond James & Associates, Inc., member New York Stock Exchange/SIPC. All rights reserved.
International Headquarters: The Raymond James Financial Center | 880 Carillon Parkway | St. Petersburg, Florida 33716 | 800 -248-8863 53
Offshore Will Take Much Longer
U.S. ResearchPublished by Raymond James & Associates
U.S. Research
© 2016 Raymond James & Associates, Inc., member New York Stock Exchange/SIPC. All rights reserved.
International Headquarters: The Raymond James Financial Center | 880 Carillon Parkway | St. Petersburg, Florida 33716 | 800 -248-8863
0
50
100
150
200
250
300
1Q13 2Q13 3Q13 4Q13 1Q14 2Q14 3Q14 4Q14 1Q15 2Q15 3Q15 4Q15 1Q16E 2Q16E 3Q16E 4Q16E 1Q17E 2Q17E 3Q17E 4Q17E 1Q18E 2Q18E 3Q18E 4Q18E
Floater Supply vs. Demand
Sources: IHS Petrodata, RJ Estimates
Already Contracted Rigs
Idled Capacity and Potential Stacking
Contracted Newbuilds
Incremental Demand
© 2013 Raymond James & Associates, Inc., member New York Stock Exchange/SIPC. All rights reserved.
International Headquarters: The Raymond James Financial Center | 880 Carillon Parkway | St. Petersburg, Florida 33716 | 800 -248-8863
Conclusions
• Supply cycle is in its late stages
• U.S. can find a lot of oil @ $60+ and
takes market share
• U.S. rig activity surges in 2017/18
• Gas gets bounce in 2017, but remains
challenged long-term
54
U.S. ResearchPublished by Raymond James & Associates
© 2016 Raymond James & Associates, Inc., member New York Stock Exchange/SIPC. All rights reserved.
International Headquarters: The Raymond James Financial Center | 880 Carillon Parkway | St. Petersburg, Florida 33716 | 800 -248-8863

© 2013 Raymond James & Associates, Inc., member New York Stock Exchange/SIPC. All rights reserved.
International Headquarters: The Raymond James Financial Center | 880 Carillon Parkway | St. Petersburg, Florida 33716 | 800 -248-8863 55
U.S. ResearchPublished by Raymond James & Associates
U.S. Research
© 2016 Raymond James & Associates, Inc., member New York Stock Exchange/SIPC. All rights reserved.
International Headquarters: The Raymond James Financial Center | 880 Carillon Parkway | St. Petersburg, Florida 33716 | 800 -248-8863
World Oil Supply 365 365 90 91 92 92 365 90 91 92 92 365 365 (Mill ions of barrels per day)
SUPPLY 2014 YOY% 2015 YOY% 1Q16 2Q16E 3Q16E 4Q16E 2016E YOY% 1Q17E 2Q17E 3Q17E 4Q17E 2017E YOY% 2018E YOY%
United States - non-bio 11.99 17.2% 12.94 7.9% 12.77 12.62 12.33 12.25 12.49 -3.5% 12.36 12.57 12.85 13.23 12.75 2.1% 14.16 11.0%
United States - bio 1.02 2.8% 1.05 2.8% 1.05 1.11 1.11 1.12 1.10 4.8% 1.12 1.13 1.13 1.14 1.13 3.2% 1.13 0.0%
North America 20.09 10.9% 20.97 4.4% 20.94 20.16 20.49 20.45 20.51 -2.2% 20.67 20.32 21.05 21.48 20.88 1.8% 22.26 6.6%
Europe 3.33 0.3% 3.46 4.0% 3.62 3.35 3.17 3.44 3.39 -2.0% 3.47 3.22 3.05 3.31 3.26 -3.9% 3.12 -4.4%
Pacific 0.51 4.6% 0.47 -8.3% 0.45 0.45 0.51 0.48 0.47 1.1% 0.43 0.43 0.49 0.46 0.46 -3.5% 0.44 -3.5%
Total OECD 23.93 9.2% 24.90 4.1% 25.00 23.96 24.17 24.37 24.37 -2.1% 24.58 23.98 24.59 25.25 24.60 0.9% 25.82 5.0%
CIS 13.87 0.5% 14.00 0.9% 14.20 13.97 13.92 14.05 14.03 0.3% 14.17 14.06 14.15 14.30 14.17 1.0% 14.49 2.3%
Other Europe 0.14 0.0% 0.14 0.0% 0.14 0.14 0.14 0.14 0.14 0.0% 0.14 0.14 0.14 0.14 0.14 0.0% 0.14 0.0%
China 4.25 1.7% 4.33 1.8% 4.18 4.06 4.05 4.05 4.08 -5.6% 4.03 4.03 4.03 4.03 4.03 -1.4% 4.07 1.0%
Other Asia 2.63 -25.9% 2.73 3.8% 2.75 2.67 2.57 2.68 2.67 -2.3% 2.69 2.63 2.54 2.64 2.62 -1.7% 2.55 -2.6%
Latin America 4.96 6.4% 5.16 4.1% 4.50 5.03 5.19 4.93 4.91 -4.8% 4.39 4.96 5.17 4.93 4.86 -1.0% 4.87 0.1%
Middle East 1.32 -2.9% 1.25 -5.1% 1.27 1.27 1.27 1.27 1.27 1.6% 1.24 1.24 1.24 1.24 1.24 -2.6% 1.21 -2.6%
Africa 2.28 0.1% 2.26 -1.0% 2.17 2.16 2.15 2.13 2.15 -4.6% 2.13 2.11 2.10 2.09 2.11 -2.1% 2.08 -1.2%
Total NON-OECD 29.45 -1.7% 29.86 1.4% 29.21 29.29 29.29 29.25 29.26 -2.0% 28.78 29.17 29.35 29.36 29.17 -0.3% 29.41 0.8%
Other Biofuels 0.66 16.6% 0.67 1.5% 0.70 0.68 0.68 0.68 0.68 2.0% 0.71 0.70 0.70 0.70 0.70 2.0% 0.74 6.8%
Processing Gains 2.21 1.1% 2.24 1.4% 2.27 2.24 2.24 2.24 2.24 0.0% 2.27 2.24 2.24 2.24 2.24 0.0% 2.24 0.0%
Total Non-OPEC 56.25 3.0% 57.67 2.5% 57.18 56.17 56.38 56.54 56.56 -1.9% 56.34 56.08 56.87 57.54 56.70 0.3% 58.21 2.7%
Saudi Arabia 9.53 1.4% 10.13 6.3% 10.21 10.25 10.30 10.20 10.24 1.1% 10.21 10.25 10.30 10.20 10.24 0.0% 10.24 0.0%
Iran 2.81 4.8% 2.86 1.7% 3.15 3.60 3.60 3.60 3.49 22.2% 3.60 3.60 3.60 3.60 3.60 3.1% 3.63 0.8%
Venezuela 1.96 -1.8% 1.90 -3.2% 1.86 1.81 1.79 1.76 1.80 -5.1% 1.74 1.71 1.69 1.66 1.70 -5.9% 1.60 -5.9%
Iraq 3.33 8.2% 3.99 19.9% 4.28 4.30 4.35 4.40 4.33 8.5% 4.40 4.40 4.40 4.40 4.40 1.5% 4.40 0.0%
Nigeria 1.90 -2.7% 1.80 -5.2% 1.76 1.36 1.55 1.65 1.58 -12.3% 1.65 1.75 1.75 1.75 1.73 9.3% 1.63 -5.8%
United Arab Emirates 2.76 -0.1% 2.88 4.4% 2.81 2.81 2.81 2.81 2.81 -2.3% 2.81 2.81 2.81 2.81 2.81 0.0% 2.81 0.0%
Kuwait 2.61 2.3% 2.75 5.4% 2.83 2.70 2.80 2.80 2.78 1.3% 2.80 2.80 2.80 2.80 2.80 0.6% 2.80 0.0%
Libya 0.46 -48.7% 0.40 -12.7% 0.36 0.36 0.36 0.36 0.36 -11.8% 0.36 0.36 0.36 0.36 0.36 0.0% 0.36 0.0%
Angola 1.66 -3.4% 1.76 6.4% 1.77 1.76 1.75 1.74 1.76 -0.3% 1.72 1.70 1.68 1.66 1.69 -3.7% 1.61 -4.7%
Algeria 1.12 -2.8% 1.11 -0.9% 1.10 1.10 1.10 1.10 1.10 -1.1% 1.09 1.09 1.09 1.09 1.09 -1.0% 1.07 -2.0%
Qatar 0.71 -3.4% 0.66 -7.2% 0.66 0.66 0.66 0.66 0.66 0.6% 0.66 0.66 0.66 0.66 0.66 0.0% 0.66 0.0%
Neutral Zone 0.38 -26.1% 0.07 -81.6% 0.00 0.15 0.30 0.30 0.19 166.9% 0.30 0.30 0.30 0.30 0.30 59.0% 0.30 0.0%
Ecuador 0.55 5.7% 0.54 -1.8% 0.54 0.54 0.52 0.53 0.53 -1.8% 0.52 0.52 0.50 0.51 0.52 -3.0% 0.50 -3.0%
Indonesia 0.70 0.69 -1.0% 0.71 0.69 0.69 0.68 0.69 0.5% 0.68 0.68 0.68 0.68 0.68 -1.9% 0.68 0.0%
OPEC Crude 30.48 1.7% 31.55 3.5% 32.06 32.10 32.59 32.60 32.34 2.5% 32.55 32.64 32.62 32.49 32.58 0.7% 32.29 -0.9%
OPEC NGLs 6.50 3.9% 6.68 2.7% 6.77 6.81 6.81 6.81 6.81 2.0% 6.91 6.95 6.95 6.95 6.95 2.0% 7.08 2.0%
Total OPEC 36.98 2.1% 38.23 3.4% 38.83 38.91 39.39 39.41 39.15 2.4% 39.45 39.58 39.57 39.43 39.52 1.0% 39.37 -0.4%
TOTAL SUPPLY 93.23 2.6% 95.90 2.9% 96.01 95.08 95.78 95.95 95.70 -0.2% 95.80 95.66 96.44 96.98 96.22 0.5% 97.58 1.4%
Implied Inv. Build/(Draw)-RJ Est. 0.36 1.17 0.84 -0.64 -1.14 -1.41 -0.60 -0.25 -0.72 -1.62 -1.30 -0.98 -0.61
Implied Inv. Build/(Draw)-After Missing Bbl Adj. 0.22 0.99 0.43 -0.86 -1.36 -1.62 -0.81 -0.46 -0.94 -1.83 -1.51 -1.19 -0.83
Source: IEA, RJ&A Estimates

© 2013 Raymond James & Associates, Inc., member New York Stock Exchange/SIPC. All rights reserved.
International Headquarters: The Raymond James Financial Center | 880 Carillon Parkway | St. Petersburg, Florida 33716 | 800 -248-8863 56
U.S. ResearchPublished by Raymond James & Associates
U.S. Research
© 2016 Raymond James & Associates, Inc., member New York Stock Exchange/SIPC. All rights reserved.
International Headquarters: The Raymond James Financial Center | 880 Carillon Parkway | St. Petersburg, Florida 33716 | 800 -248-8863
World Oil Demand 365 365 90 91 92 92 365(Mill ions of barrels per day) 3.2%
DEMAND 2014 YOY% 2015 YOY% 1Q16 2Q16E 3Q16E 4Q16E 2016E YOY% 1Q17E 2Q17E 3Q17E 4Q17E 2017E YOY% 2018E YOY%
North America 24.14 0.2% 24.36 0.9% 24.21 24.41 24.85 24.93 24.61 1.0% 24.21 24.17 25.10 24.93 24.61 0.0% 24.61 0.0%
Europe 13.45 -1.2% 13.71 1.9% 13.47 13.63 14.21 13.75 13.77 0.4% 13.34 13.49 14.07 13.61 13.63 -1.0% 13.56 -0.5%
Pacific (mainly Japan) 8.13 -2.5% 8.10 -0.3% 8.57 7.65 7.78 8.42 8.10 0.0% 8.49 7.57 7.70 8.34 8.02 -1.0% 7.99 -0.4%
Total OECD 45.72 -0.7% 46.17 1.0% 46.26 45.69 46.84 47.10 46.48 0.7% 46.04 45.23 46.87 46.88 46.26 -0.5% 46.16 -0.2%
CIS (mainly Russia) 4.92 4.3% 4.87 -1.0% 4.85 4.91 5.08 4.99 4.96 1.8% 4.87 4.94 5.10 5.02 4.98 0.5% 5.01 0.5%
Other Europe 0.67 2.4% 0.70 3.7% 0.70 0.69 0.71 0.71 0.70 0.7% 0.70 0.69 0.71 0.71 0.70 0.0% 0.70 0.0%
China 10.70 3.4% 11.39 6.4% 11.54 11.79 11.83 11.87 11.76 3.2% 11.83 12.08 12.12 12.16 12.05 2.5% 12.35 2.5%
Other Asia 12.05 2.6% 12.54 4.1% 13.11 13.17 12.88 13.46 13.16 4.9% 13.60 13.65 13.36 13.96 13.64 3.7% 14.07 3.2%
Latin America 6.80 2.6% 6.76 -0.7% 6.53 6.74 6.82 6.76 6.71 -0.7% 6.59 6.80 6.88 6.82 6.78 1.0% 6.84 1.0%
Middle East 8.03 1.4% 8.17 1.8% 7.78 8.38 8.63 8.16 8.24 0.8% 7.93 8.55 8.81 8.32 8.40 2.0% 8.57 2.0%
Africa 3.97 2.2% 4.12 3.7% 4.25 4.22 4.13 4.31 4.23 2.6% 4.33 4.30 4.21 4.39 4.31 1.9% 4.42 2.5%
Total NON-OECD 47.15 2.7% 48.55 3.0% 48.75 49.90 50.07 50.25 49.75 2.5% 49.85 51.02 51.19 51.39 50.87 2.2% 51.97 2.2%
TOTAL DEMAND (RJ Est.) 92.87 1.0% 94.72 2.0% 95.01 95.59 96.91 97.35 96.22 1.6% 95.89 96.25 98.06 98.26 97.13 0.9% 98.12
Actual Missing Barrels 0.28 0.10 0.30 0.08
Missing Bbls Adjustment (1/2 actual) 0.14 0.19 0.23 0.23 0.23 0.23 0.23 0.23 0.23 0.23 0.23 0.23 0.23
TOTAL RJ DEMAND (inc. Miss. Bbls Adj) 93.01 1.2% 94.91 2.0% 95.54 95.81 97.14 97.58 96.45 1.6% 96.11 96.48 98.28 98.49 97.35 0.9% 98.35 1.0%
IEA DEMAND EST 92.88 1.1% 94.73 2.0% 95.01 95.29 96.67 96.79 95.94 1.3%
Y/Y bbl/day Change (IEA Est.) 0.97 1.85 1.41 1.17 1.00 1.31 1.21
Y/Y % Change (IEA Est.) 1.1% 2.0% 1.5% 1.2% 1.0% 1.4% 1.3%
Y/Y bbl/day Change (Before Missing Bbl Adj.) 0.94 1.85 1.41 1.46 1.25 1.88 1.50 0.88 0.66 1.15 0.91 0.90 1.00
Y/Y % Change 1.0% 2.0% 1.5% 1.6% 1.3% 2.0% 1.6% 0.9% 0.7% 1.2% 0.9% 0.9% 1.0%
Y/Y bbl/day Change (After Missing Bbl Adj.) 1.07 1.90 1.75 1.50 1.29 1.92 1.54 0.58 0.66 1.15 0.91 0.90 1.00
Y/Y % Change 1.2% 2.0% 1.9% 1.6% 1.3% 2.0% 1.6% 0.6% 0.7% 1.2% 0.9% 0.9% 1.0%
World Real GDP Growth 3.4% 3.1% 3.4% 3.6%
Source: IEA, RJ&A Estimates

© 2016 Raymond James & Associates, Inc., member New York Stock Exchange/SIPC. All rights reserved.
International Headquarters: The Raymond James Financial Center | 880 Carillon Parkway | St. Petersburg, Florida 33716 | 800 -248-8863 57
Raymond James & Associates (RJA) is a FINRA member firm and is responsible for the preparation and distribution of research created in the United States. Raymond James & Associates is located at The Raymond James Financial Center, 880 Carillon Parkway, St. Petersburg, FL 33716, (727) 567-1000. Non-U.S. affiliates, which are not FINRA member firms, include the following entities that are responsible for the creation and distribution of research in their respective areas: in Canada, Raymond James Ltd. (RJL), Suite 2100, 925 West Georgia Street, Vancouver, BC V6C 3L2, (604) 659-8200; in Latin America, Raymond James Argentina S.A., San Martin 344, 22nd Floor, Buenos Aires, C10004AAH, Argentina, +54 11 4850 2500; in Europe, Raymond James Euro Equities SAS (also trading as Raymond James International), 40, rue La Boetie, 75008, Paris, France, +33 1 45 64 0500, and Raymond James Financial International Ltd., Broadwalk House, 5 Appold Street, London, England EC2A 2AG, +44 203 798 5600.
This document is not directed to, or intended for distribution to or use by, any person or entity that is a citizen or resident of or located in any locality, state, country, or other jurisdiction where such distribution, publication, availability or use would be contrary to law or regulation. The securities discussed in this document may not be eligible for sale in some jurisdictions. This research is not an offer to sell or the solicitation of an offer to buy any security in any jurisdiction where such an offer or solicitation would be illegal. It does not constitute a personal recommendation or take into account the particular investment objectives, financial situations, or needs of individual clients. Past performance is not a guide to future performance, future returns are not guaranteed, and a loss of original capital may occur. Investors should consider this report as only a single factor in making their investment decision.
For clients in the United States: Any foreign securities discussed in this report are generally not eligible for sale in the U.S. unless they are listed on a U.S. exchange. This report is being provided to you for informational purposes only and does not represent a solicitation for the purchase or sale of a security in any state where such a solicitation would be illegal. Investing in securities of issuers organized outside of the U.S., including ADRs, may entail certain risks. The securities of non-U.S. issuers may not be registered with, nor be subject to the reporting requirements of, the U.S. Securities and Exchange Commission. There may be limited information available on such securities. Investors who have received this report may be prohibited in certain states or other jurisdictions from purchasing the securities mentioned in this report. Please ask your Financial Advisor for additional details and to determine if a particular security is eligible for purchase in your state.
The information provided is as of the date above and subject to change, and it should not be deemed a recommendation to buy or sell any security. Certain information has been obtained from third-party sources we consider reliable, but we do not guarantee that such information is accurate or complete. Persons within the Raymond James family of companies may have information that is not available to the contributors of the information contained in this publication. Raymond James, including affiliates and employees, may execute transactions in the securities listed in this publication that may not be consistent with the ratings appearing in this publication.
Additional information is available on request.
Analyst Information
Registration of Non-U.S. Analysts: The analysts listed on the front of this report who are not employees of Raymond James & Associates, Inc., are not registered/qualified as research analysts under FINRA rules, are not associated persons of Raymond James & Associates, Inc., and are not subject to NASD Rule 2711 and NYSE Rule 472 restrictions on communications with covered companies, public companies, and trading securities held by a research analyst account.
Analyst Holdings and Compensation: Equity analysts and their staffs at Raymond James are compensated based on a salary and bonus system. Several factors enter into the bonus determination including quality and performance of research product, the analyst's success in rating stocks versus an industry index, and support effectiveness to trading and the retail and institutional sales forces. Other factors may include but are not limited to: overall ratings from internal (other than investment banking) or external parties and the general productivity and revenue generated in covered stocks.

© 2016 Raymond James & Associates, Inc., member New York Stock Exchange/SIPC. All rights reserved.
International Headquarters: The Raymond James Financial Center | 880 Carillon Parkway | St. Petersburg, Florida 33716 | 800 -248-8863 58

© 2016 Raymond James & Associates, Inc., member New York Stock Exchange/SIPC. All rights reserved.
International Headquarters: The Raymond James Financial Center | 880 Carillon Parkway | St. Petersburg, Florida 33716 | 800 -248-8863 59

© 2016 Raymond James & Associates, Inc., member New York Stock Exchange/SIPC. All rights reserved.
International Headquarters: The Raymond James Financial Center | 880 Carillon Parkway | St. Petersburg, Florida 33716 | 800 -248-8863 60
Additional Risk and Disclosure information, as well as more information on the Raymond James rating system and suitability categories, is available at rjcapitalmarkets.com/Disclosures/index. Copies of research or Raymond James’ summary policies relating to research analyst independence can be obtained by contacting any Raymond James & Associates or Raymond James Financial Services office (please see raymondjames.com for office locations) or by calling 727-567-1000, toll free 800-237-5643 or sending a written request to the Equity Research Library, Raymond James & Associates, Inc., Tower 3, 6
th Floor, 880 Carillon Parkway, St. Petersburg, FL 33716.
For clients in the United Kingdom:
For clients of Raymond James & Associates (London Branch) and Raymond James Financial International Limited (RJFI): This document and any investment to which this document relates is intended for the sole use of the persons to whom it is addressed, being persons who are Eligible Counterparties or Professional Clients as described in the FCA rules or persons described in Articles 19(5) (Investment professionals) or 49(2) (High net worth companies, unincorporated associations etc.) of the Financial Services and Markets Act 2000 (Financial Promotion) Order 2005 (as amended) or any other person to whom this promotion may lawfully be directed. It is not intended to be distributed or passed on, directly or indirectly, to any other class of persons and may not be relied upon by such persons and is therefore not intended for private individuals or those who would be classified as Retail Clients.
For clients of Raymond James Investment Services, Ltd.: This report is for the use of professional investment advisers and managers and is not intended for use by clients.
For purposes of the Financial Conduct Authority requirements, this research report is classified as independent with respect to conflict of interest management. RJA, RJFI, and Raymond James Investment Services, Ltd. are authorised and regulated by the Financial Conduct Authority in the United Kingdom.
For clients in France:
This document and any investment to which this document relates is intended for the sole use of the persons to whom it is addressed, being persons who are Eligible Counterparties or Professional Clients as described in “Code Monétaire et Financier” and Règlement Général de l’Autorité des Marchés Financiers. It is not intended to be distributed or passed on, directly or indirectly, to any other class of persons and may not be relied upon by such persons and is therefore not intended for private individuals or those who would be classified as Retail Clients.
For institutional clients in the European Economic Area (EEA) outside of the United Kingdom:
This document (and any attachments or exhibits hereto) is intended only for EEA institutional clients or others to whom it may lawfully be submitted.
For Canadian clients:
This report is not prepared subject to Canadian disclosure requirements, unless a Canadian analyst has contributed to the content of the report. In the case where there is Canadian analyst contribution, the report meets all applicable IIROC disclosure requirements.
Proprietary Rights Notice: By accepting a copy of this report, you acknowledge and agree as follows:
This report is provided to clients of Raymond James only for your personal, noncommercial use. Except as expressly authorized by Raymond James, you may not copy, reproduce, transmit, sell, display, distribute, publish, broadcast, circulate, modify, disseminate or commercially exploit the information contained in this report, in printed, electronic or any other form, in any manner, without the prior express written consent of Raymond James. You also agree not to use the information provided in this report for any unlawful purpose. This is RJA client releasable research
This report and its contents are the property of Raymond James and are protected by applicable copyright, trade secret or other intellectual property laws (of the United States and other countries). United States law, 17 U.S.C. Sec.501 et seq, provides for civil and criminal penalties for copyright infringement. No copyright claimed in incorporated U.S. government works.