Public Works Succession Planning - APWAcolorado.apwa.net/Content/Chapters/colorado.apwa... ·...
88
Who’s Next? Who’s Next? Public Works Succession Planning Public Works Succession Planning Who’s Next? Who’s Next? Public Works Succession Planning Public Works Succession Planning APWA Colorado Chapter APWA Colorado Chapter APWA Colorado Chapter APWA Colorado Chapter Where will we find our next leaders? Denver Tech Center Denver Tech Center October 13, 2014 October 13, 2014 Denver Tech Center Denver Tech Center October 13, 2014 October 13, 2014 leaders? H B ll H B ll H B ll H B ll Harry Brull Harry Brull MountainView MountainView Consulting Consulting Harry Brull Harry Brull MountainView MountainView Consulting Consulting @yahoo.com @yahoo.com 612.414.8998 612.414.8998 @yahoo.com @yahoo.com 612.414.8998 612.414.8998
Transcript of Public Works Succession Planning - APWAcolorado.apwa.net/Content/Chapters/colorado.apwa... ·...

Who’s Next?Who’s Next?Public Works Succession PlanningPublic Works Succession Planning
Who’s Next?Who’s Next?Public Works Succession PlanningPublic Works Succession Planning
APWA Colorado ChapterAPWA Colorado ChapterAPWA Colorado ChapterAPWA Colorado Chapter Where will we find our next leaders?
Denver Tech CenterDenver Tech Center
October 13, 2014October 13, 2014
Denver Tech CenterDenver Tech Center
October 13, 2014October 13, 2014
leaders?
,,
H B llH B ll
,,
H B llH B llHarry BrullHarry Brull
MountainViewMountainView ConsultingConsulting
Harry BrullHarry Brull
MountainViewMountainView ConsultingConsulting
612.414.8998612.414.8998
612.414.8998612.414.8998
Succession ManagementSuccession Management
The process by which business leaders th h th i ht t l t t hiensure they have the right talent to achieve
strategic goals. This includes
Ensuring the availability of ready successors … in the right place … at the right timeB ildi b h t th f k lBuilding bench strength for key rolesAligning ready talent with the strategic
direction of the larger organizationd ect o o t e a ge o ga at oFilling key openings from within, without
delay, and with confidence to maximize business results
1 Copyright © 2005, Personnel Decisions International Corporation. All Rights Reserved.
business results
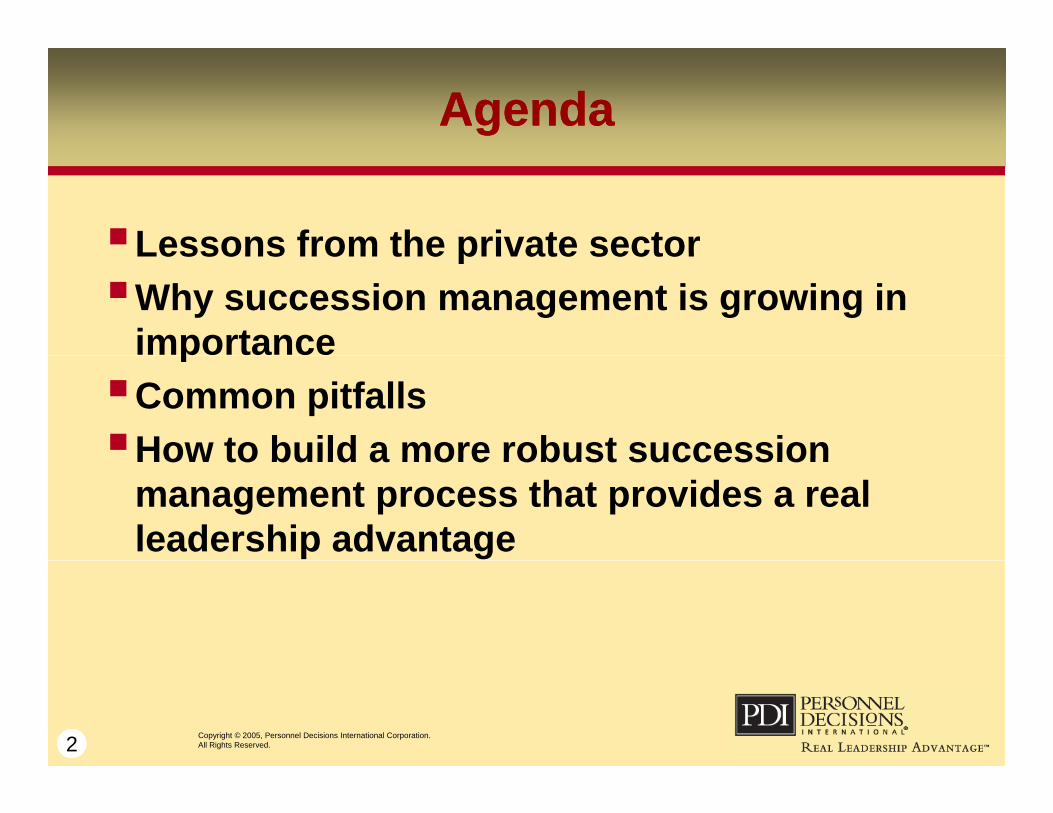
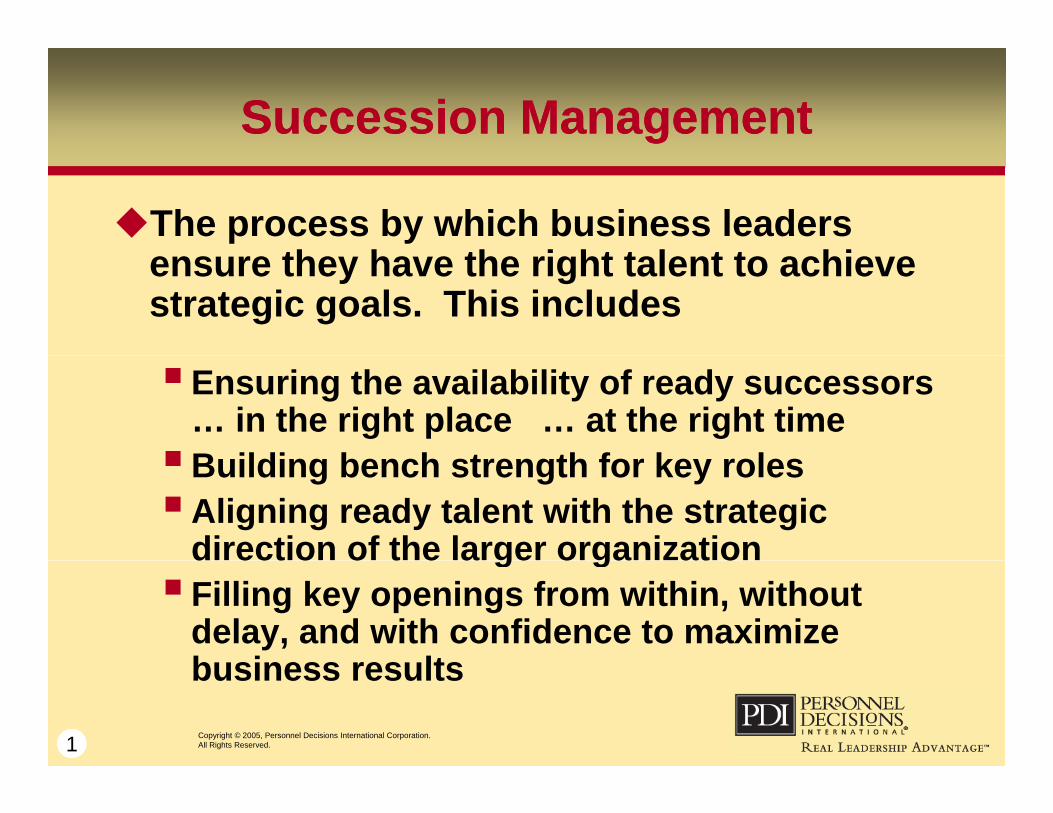
AgendaAgenda
Lessons from the private sectorLessons from the private sectorWhy succession management is growing in
importancepCommon pitfallsHow to build a more robust successionHow to build a more robust succession
management process that provides a real leadership advantage
2 Copyright © 2005, Personnel Decisions International Corporation. All Rights Reserved.

Why the Increased Focus on Succession Management?
Why the Increased Focus on Succession Management?Management?Management?
More recognition that:gHaving the right talent is criticalThere are not enough of them aroundThere are not enough of them around They are more likely to leaveN t h i th i tlNot having them is very costly
So organizations that identify buildSo, organizations that identify, build, retain, and optimally deploy strong talent will have a distinct leadership advantage
3 Copyright © 2005, Personnel Decisions International Corporation. All Rights Reserved.
g
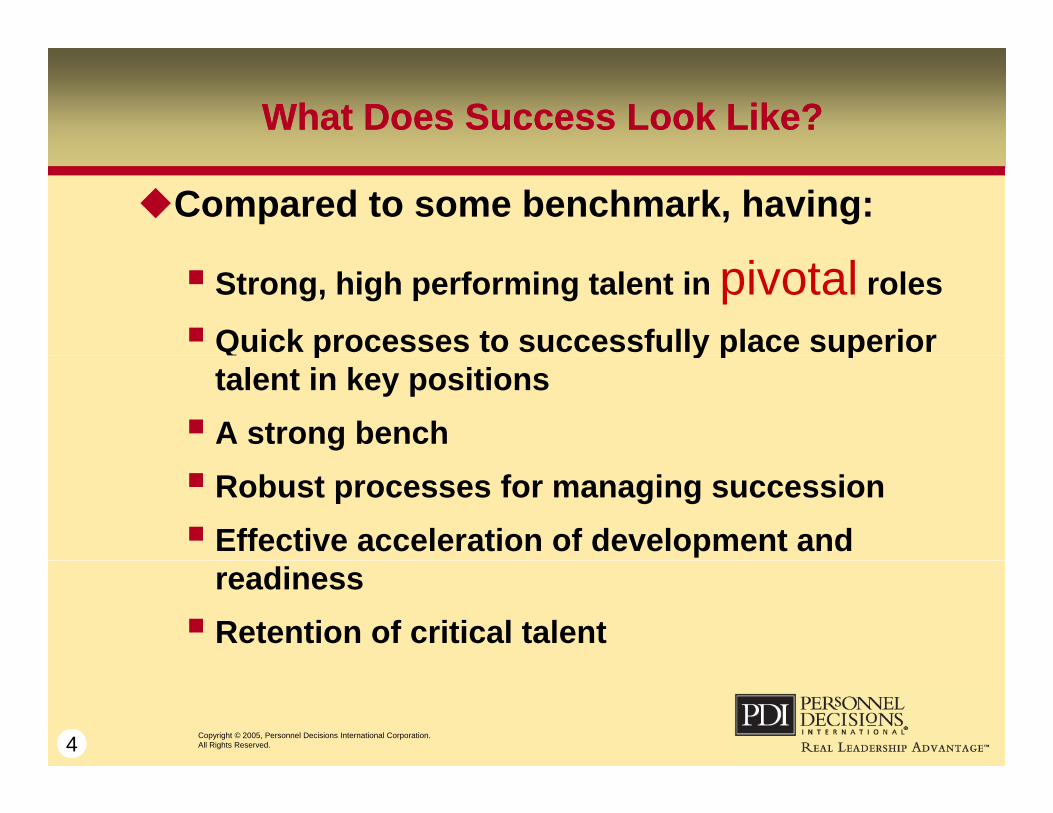
What Does Success Look Like?What Does Success Look Like?
Compared to some benchmark, having:
Strong, high performing talent in pivotal roles
Quick processes to successfully place superior p y p ptalent in key positions A strong bench Robust processes for managing succession Effective acceleration of development and
readiness Retention of critical talent
4 Copyright © 2005, Personnel Decisions International Corporation. All Rights Reserved.
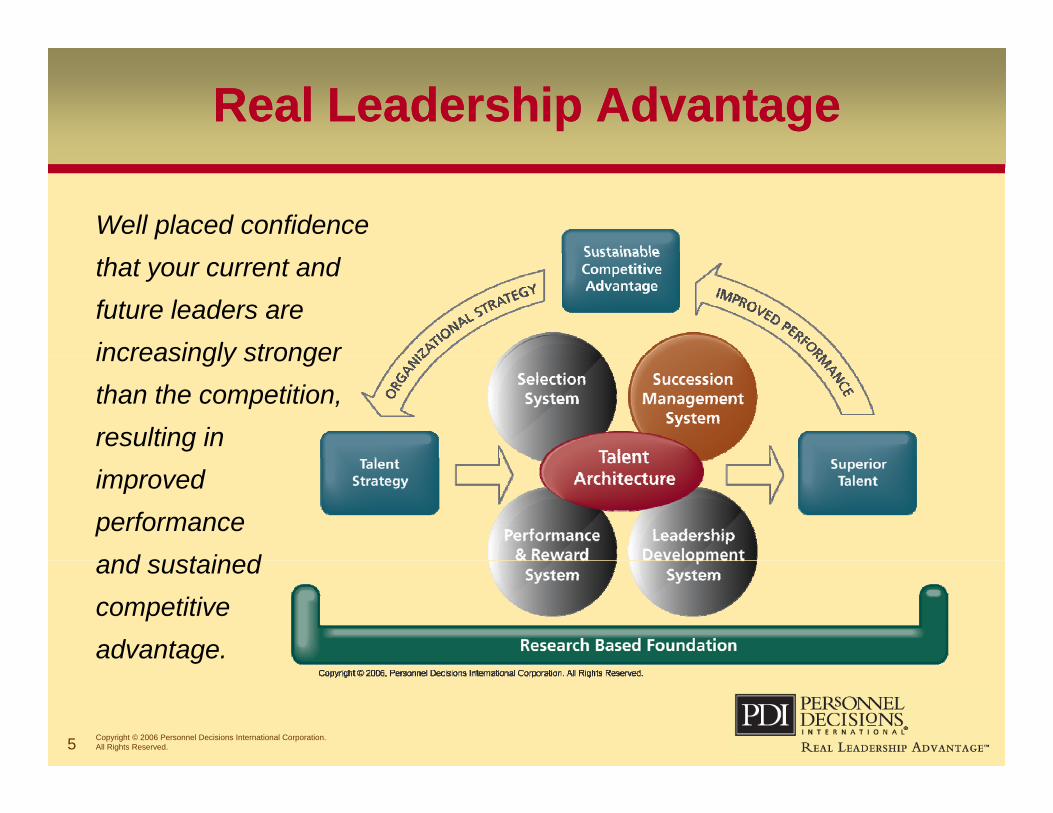
Real Leadership AdvantageReal Leadership Advantage
Well placed confidence that your current and future leaders are increasingly strongerincreasingly stronger than the competition, resulting in improved performance and sustainedand sustained competitive advantage.
5 Copyright © 2006 Personnel Decisions International Corporation. All Rights Reserved.
g
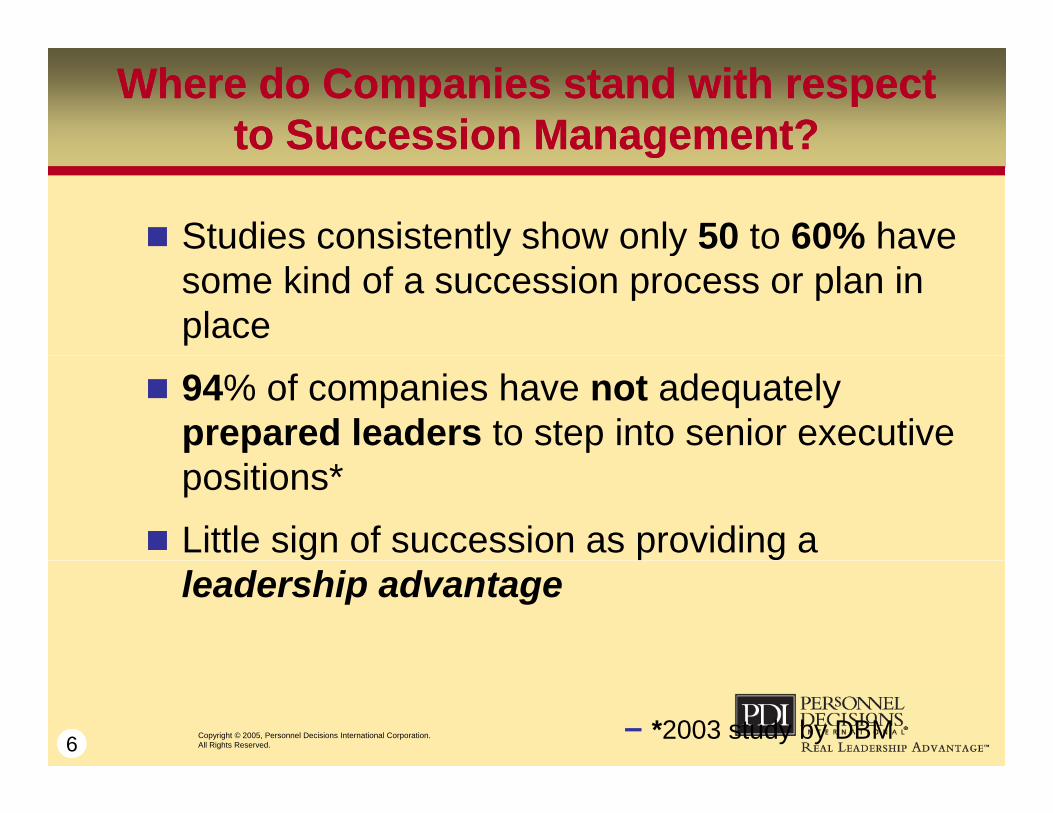
Where do Companies stand with respect to Succession Management?
Where do Companies stand with respect to Succession Management?gg
Studies consistently show only 50 to 60% have y ysome kind of a succession process or plan in place
94% of companies have not adequately prepared leaders to step into senior executive positions*
Little sign of succession as providing a leadership advantage
6 Copyright © 2005, Personnel Decisions International Corporation. All Rights Reserved.
– *2003 study by DBM

The Public SectorUS Dept. of Labor Statistics
The Public SectorUS Dept. of Labor Statisticspp
We’re getting old: 45-64 group growing faster than g g g p g gany other
Government folks even older: 44% age 45+ (private t 30% OF )sector 30% OFs)
Fewer young’ns: Government 27 % under 35 (private sector 43%)sector 43%)
10 years of drought: Government ownsizing means fewer younger workers
Fewer of them: Supply of 25-34s slowed to 11% growth (compared to 14% a decade ago)
7 Copyright © 2005, Personnel Decisions International Corporation. All Rights Reserved.
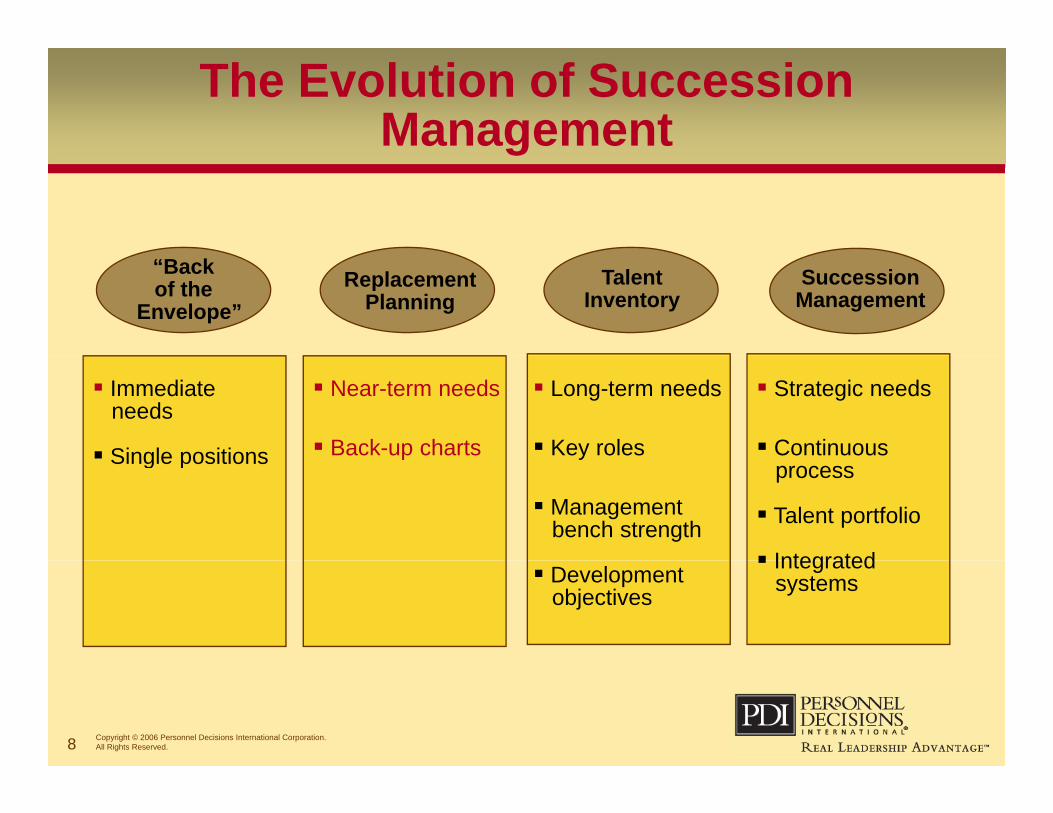
The Evolution of Succession Managementg
ReplacementPlanning
TalentInventory
“Back of the
Envelope”SuccessionManagement
Near-term needs
Back-up charts
Long-term needs
Key roles
Immediateneeds
Single positions
Strategic needs
Continuous p y
Managementbench strength
Single positions process
Talent portfolio
Integrated Development
objectives Integrated
systems
8 Copyright © 2006 Personnel Decisions International Corporation. All Rights Reserved.

Where Does your Organization Stand?Where Does your Organization Stand?
Quick SurveyQuick SurveyDiscussion: How well is your organization’s successionHow well is your organization s succession
management process working?What are the biggest challenges in your
i i ’ i ?organization’s succession process?
9 Copyright © 2005, Personnel Decisions International Corporation. All Rights Reserved.
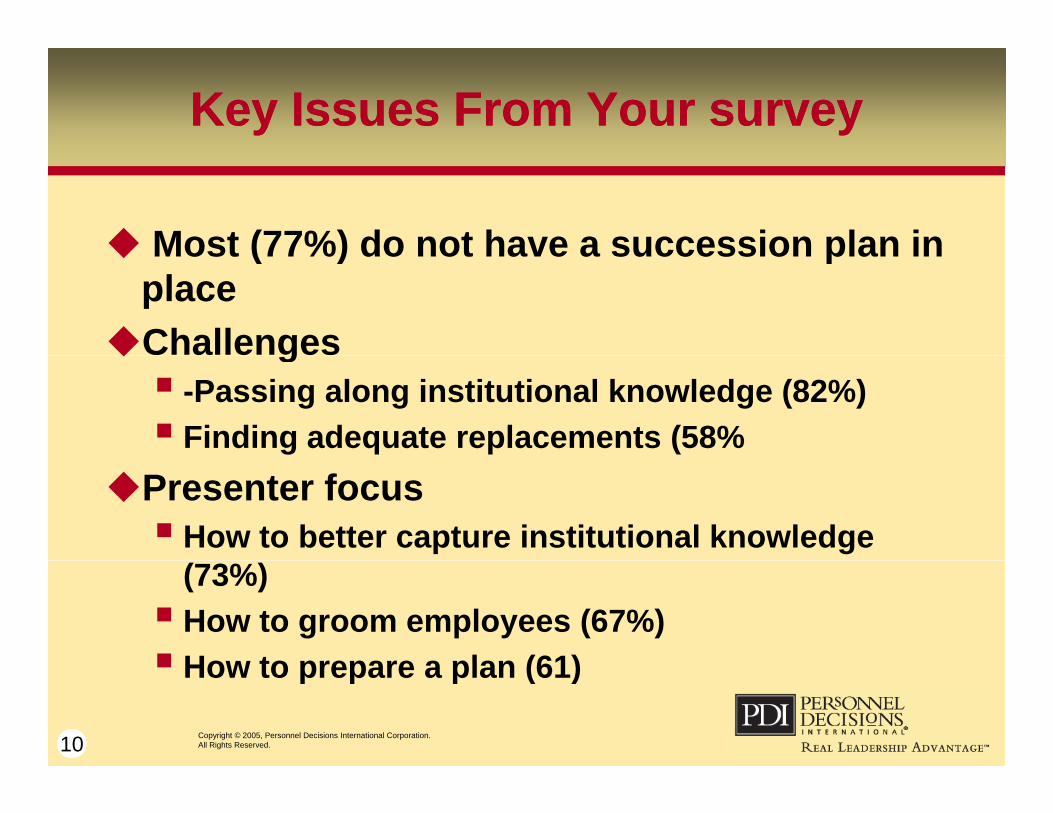
Key Issues From Your surveyKey Issues From Your survey
Most (77%) do not have a succession plan in Most (77%) do not have a succession plan in place
Challenges g -Passing along institutional knowledge (82%) Finding adequate replacements (58%
Presenter focus How to better capture institutional knowledge
(73%) How to groom employees (67%) How to prepare a plan (61)
10
How to prepare a plan (61)
Copyright © 2005, Personnel Decisions International Corporation. All Rights Reserved.
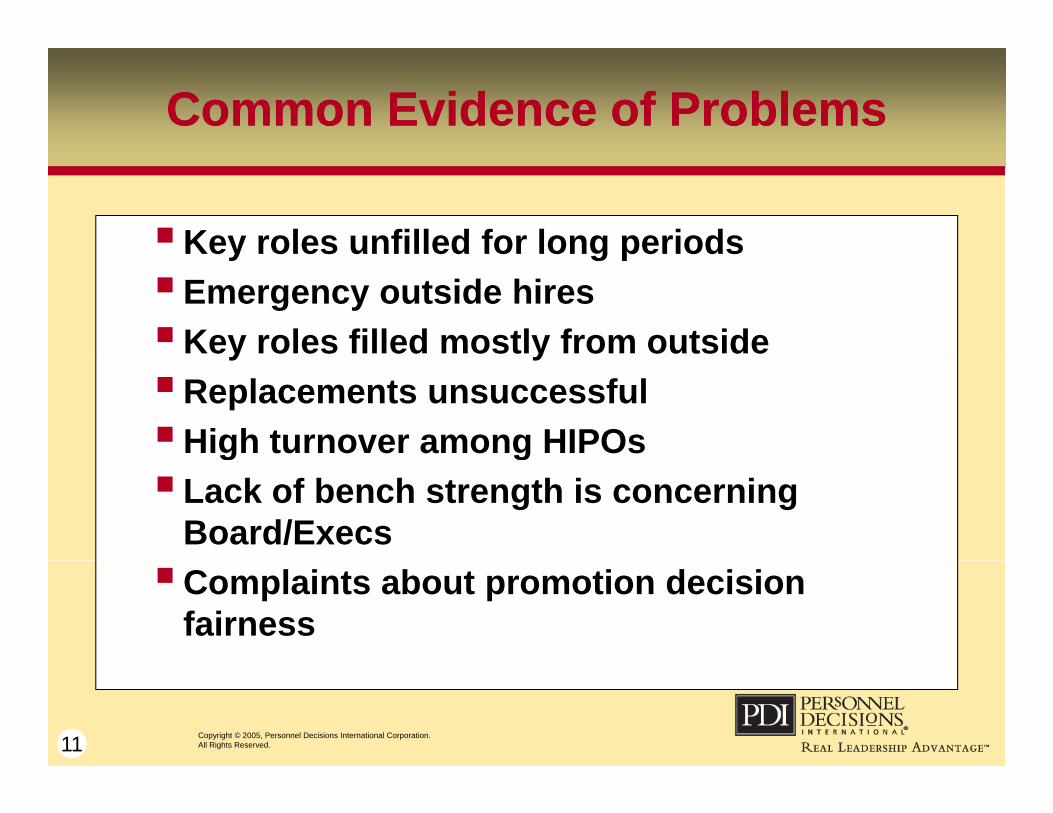
Common Evidence of ProblemsCommon Evidence of Problems
Key roles unfilled for long periodsKey roles unfilled for long periodsEmergency outside hiresKey roles filled mostly from outsidey yReplacements unsuccessfulHigh turnover among HIPOsg gLack of bench strength is concerning
Board/ExecsComplaints about promotion decision
fairness
11 Copyright © 2005, Personnel Decisions International Corporation. All Rights Reserved.
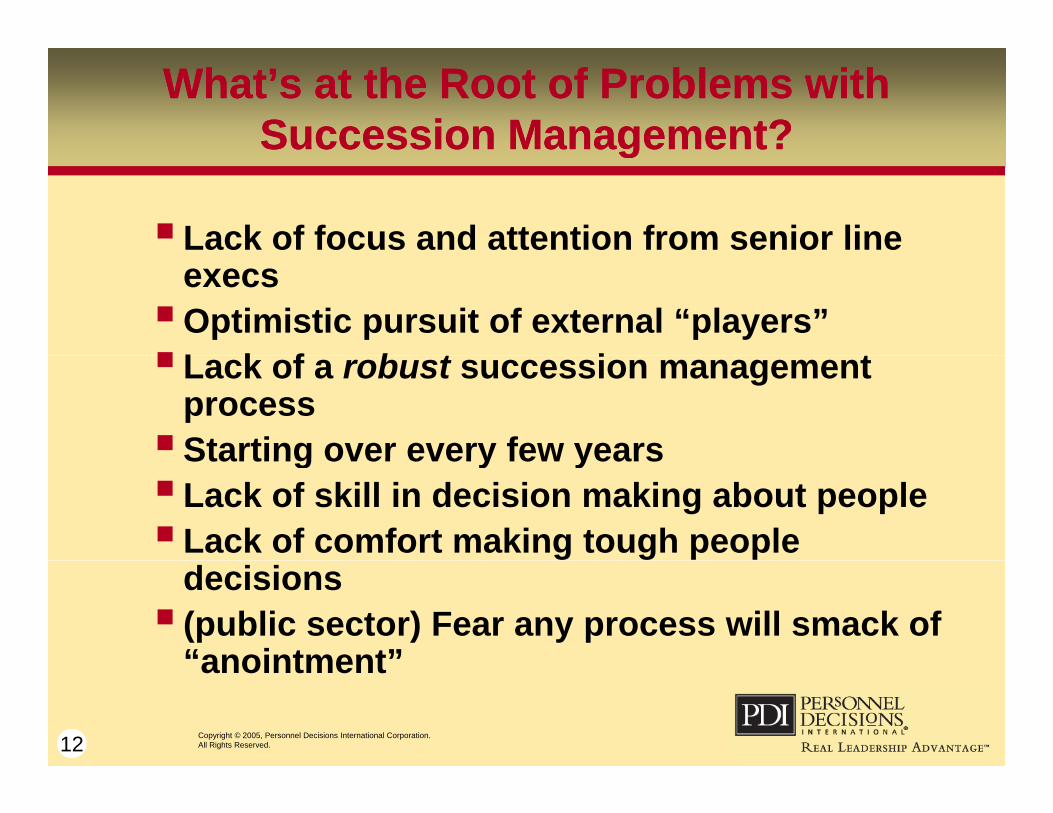
What’s at the Root of Problems with Succession Management?
What’s at the Root of Problems with Succession Management?gg
Lack of focus and attention from senior line execsOptimistic pursuit of external “players”L k f b t i tLack of a robust succession management
processStarting over every few yearsStarting over every few yearsLack of skill in decision making about peopleLack of comfort making tough people
decisions (public sector) Fear any process will smack of
“anointment”
12 Copyright © 2005, Personnel Decisions International Corporation. All Rights Reserved.
anointment
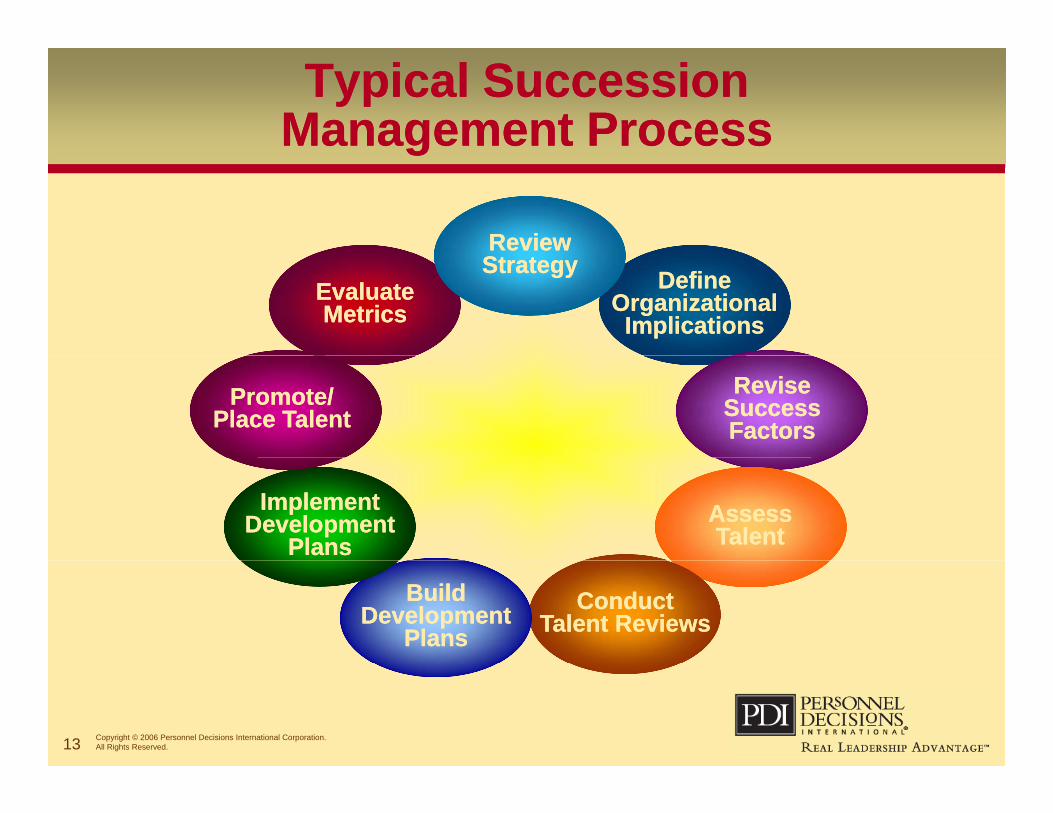
Typical Succession Management ProcessTypical Succession
Management Processgg
Review Review Define
Organizational Implications
Define Organizational
ImplicationsEvaluate Metrics
Evaluate Metrics
Strategy Strategy
Revise Success Factors
Revise Success Factors
Promote/ Place Talent
Promote/ Place Talent
Assess Talent
Assess Talent
Implement Development
Plans
Implement Development
Plans
Conduct Talent Reviews
Conduct Talent Reviews
Build Development
Plans
Build Development
Plans
13 Copyright © 2006 Personnel Decisions International Corporation. All Rights Reserved.
Taking It to the Next LevelTaking It to the Next Level
Six keys to a more robust succession ymanagement process and building a leadership pipeline for sustained p p p
advantage
14 Copyright © 2005, Personnel Decisions International Corporation. All Rights Reserved.
Six Keys to a Robust Succession Management Process
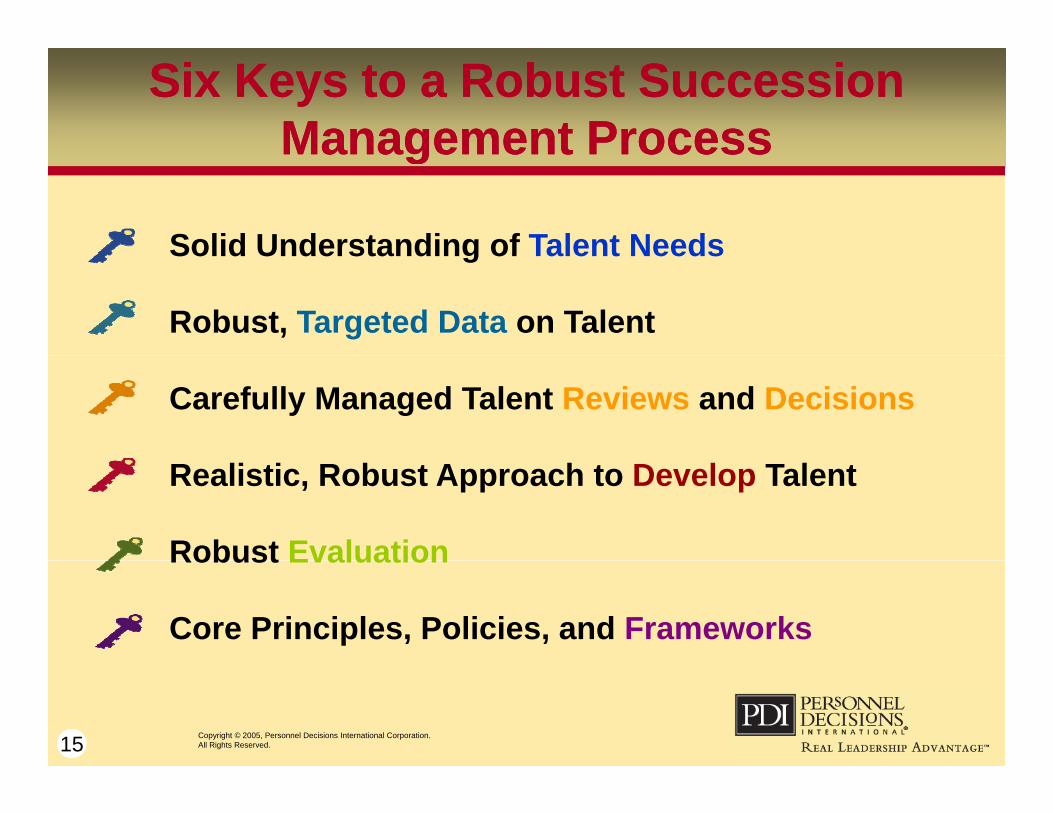
Six Keys to a Robust Succession Management ProcessManagement ProcessManagement Process
Solid Understanding of Talent NeedsSolid Understanding of Talent Needs
Robust, Targeted Data on Talent
Carefully Managed Talent Reviews and Decisions
Realistic, Robust Approach to Develop Talent
Robust EvaluationRobust Evaluation
Core Principles, Policies, and Frameworks
15 Copyright © 2005, Personnel Decisions International Corporation. All Rights Reserved.
Key #1: Solid Understanding of Talent Needs
Key #1: Solid Understanding of Talent Needs
1111
16 Copyright © 2006 Personnel Decisions International Corporation. All Rights Reserved.
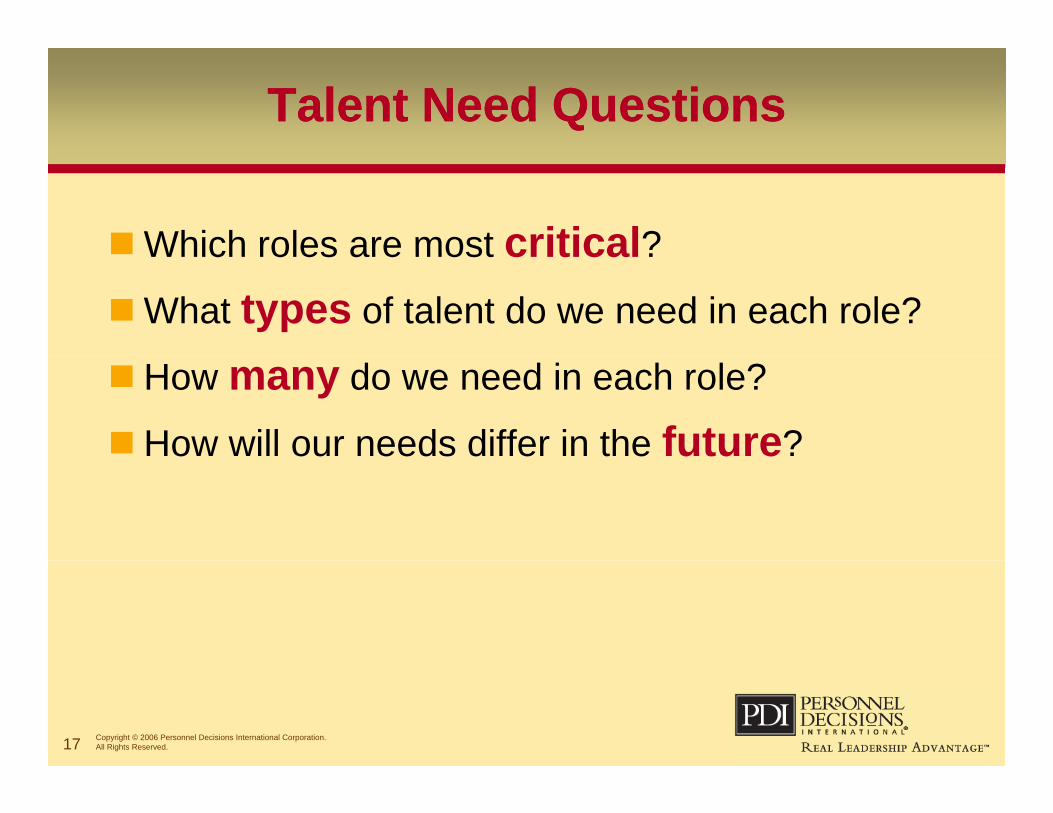
Talent Need QuestionsTalent Need Questions
Which roles are most critical?Which roles are most critical?What types of talent do we need in each role?
How many do we need in each role?
How will our needs differ in the future?
17 Copyright © 2006 Personnel Decisions International Corporation. All Rights Reserved.
Typical PitfallsTypical Pitfalls
Review of needs doesn’t adequately consider the longer-term
All roles treated as equally important Performance requirements are too generic,
not aligned with changing business needsCompetencies not differentiated among
various roles or levels
18 Copyright © 2006 Personnel Decisions International Corporation. All Rights Reserved.
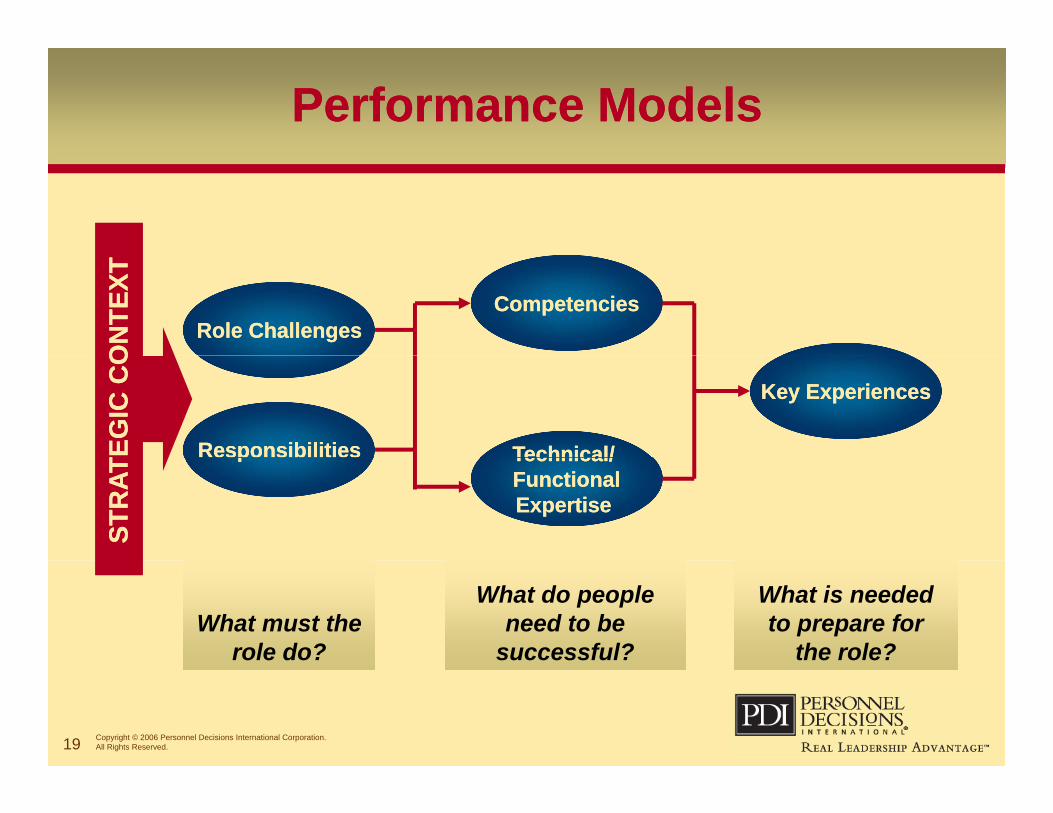
Performance ModelsPerformance ModelsO
NTE
XTO
NTE
XT
Role ChallengesRole ChallengesCompetenciesCompetencies
TEG
IC C
OTE
GIC
CO
ResponsibilitiesResponsibilities Technical/Technical/
Key ExperiencesKey Experiences
STR
ATST
RAT
pp Technical/ Technical/ FunctionalFunctionalExpertise Expertise
What must the role do?
What do people need to be
successful?
What is needed to prepare for
the role?
19 Copyright © 2006 Personnel Decisions International Corporation. All Rights Reserved.
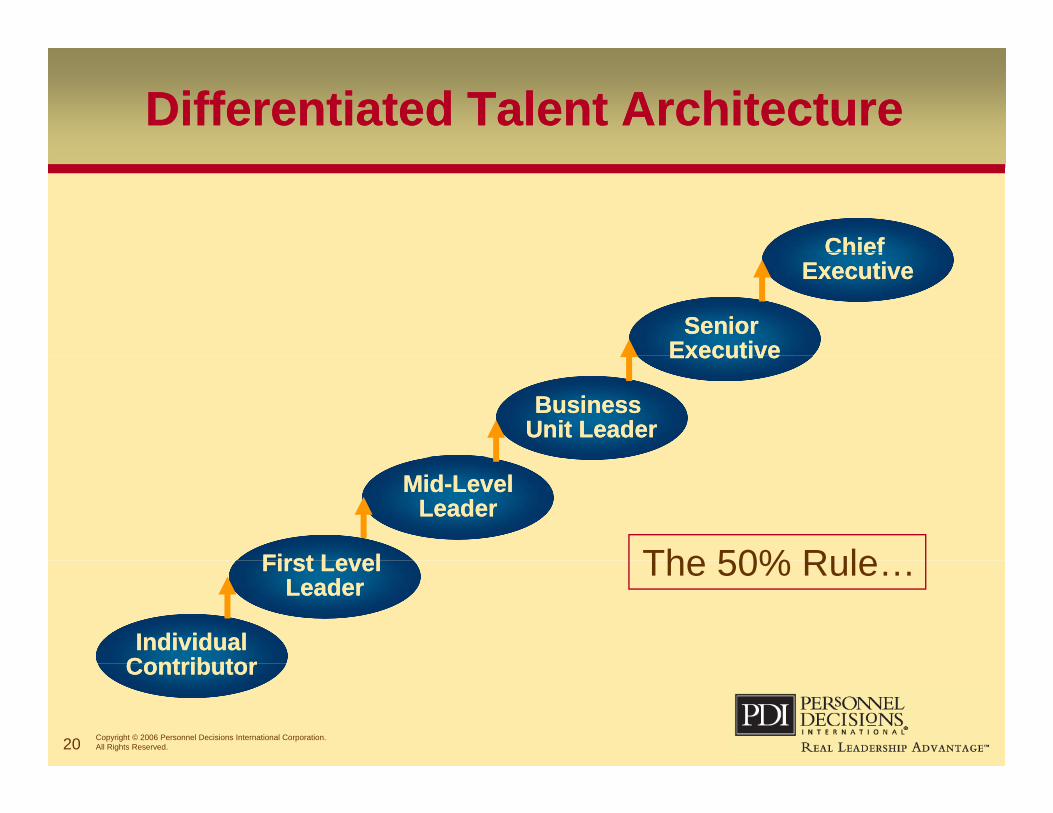
Differentiated Talent ArchitectureDifferentiated Talent Architecture
ChiefChief
Senior Senior ExecutiveExecutive
Chief Chief ExecutiveExecutive
ExecutiveExecutive
Business Business Unit LeaderUnit Leader
MidMid--LevelLevelLeaderLeader
First LevelFirst Level The 50% Rule
IndividualIndividualContributorContributor
First Level First Level LeaderLeader
The 50% Rule…
20 Copyright © 2006 Personnel Decisions International Corporation. All Rights Reserved.
ContributorContributor
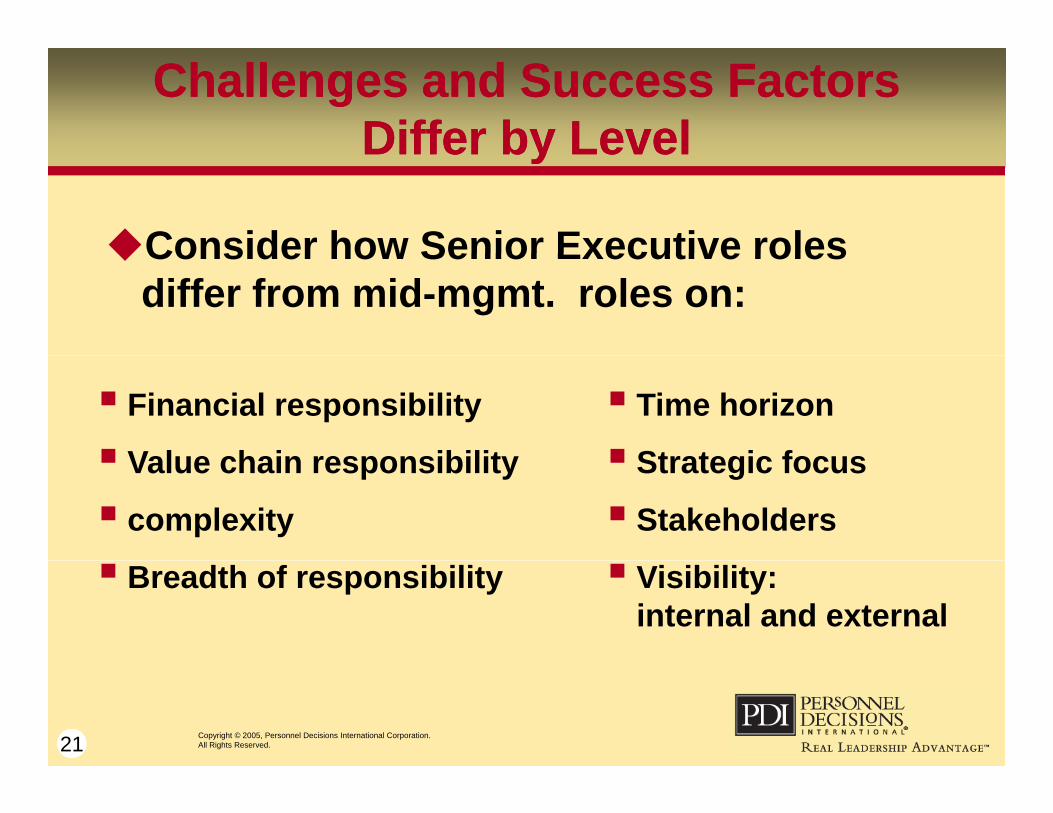
Challenges and Success Factors Differ by Level
Challenges and Success Factors Differ by LevelDiffer by LevelDiffer by Level
Consider how Senior Executive rolesConsider how Senior Executive roles differ from mid-mgmt. roles on:
Financial responsibility
Value chain responsibility
Time horizon
Strategic focus Value chain responsibility
complexity
Strategic focus
Stakeholders
Breadth of responsibility Visibility: internal and external
21 Copyright © 2005, Personnel Decisions International Corporation. All Rights Reserved.

Leadership Competency Architecture (LCA)Leadership Competency Architecture (LCA)
22 Copyright © 2006 Personnel Decisions International Corporation. All Rights Reserved.
Key #2: Robust, Targeted Data on TalentKey #2: Robust, Targeted Data on Talent
2222
23 Copyright © 2006 Personnel Decisions International Corporation. All Rights Reserved.
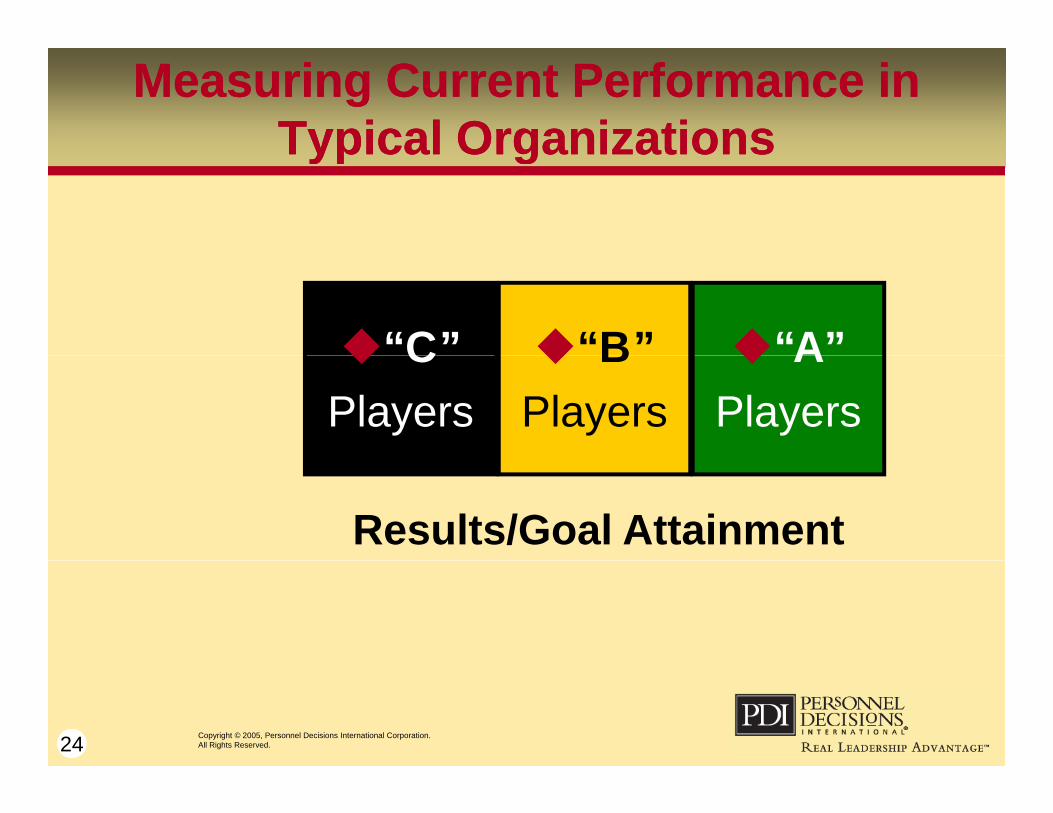
Measuring Current Performance in Typical Organizations
Measuring Current Performance in Typical OrganizationsTypical OrganizationsTypical Organizations
“B” “A”“C” BPlayers
APlayers
CPlayers
Results/Goal Attainment
24 Copyright © 2005, Personnel Decisions International Corporation. All Rights Reserved.

Differentiating Performers on What and How: Performance²
Differentiating Performers on What and How: Performance²
A Players
cies orm
ance
)
High
B Players
ompe
tenc
ow o
f Per
fo
Average
C Players
Co
(The
Ho
Low
Results(Th Wh t f P f )
Misses Targets Meets Targets Exceeds Targets
25 Copyright © 2006 Personnel Decisions International Corporation. All Rights Reserved.
(The What of Performance)
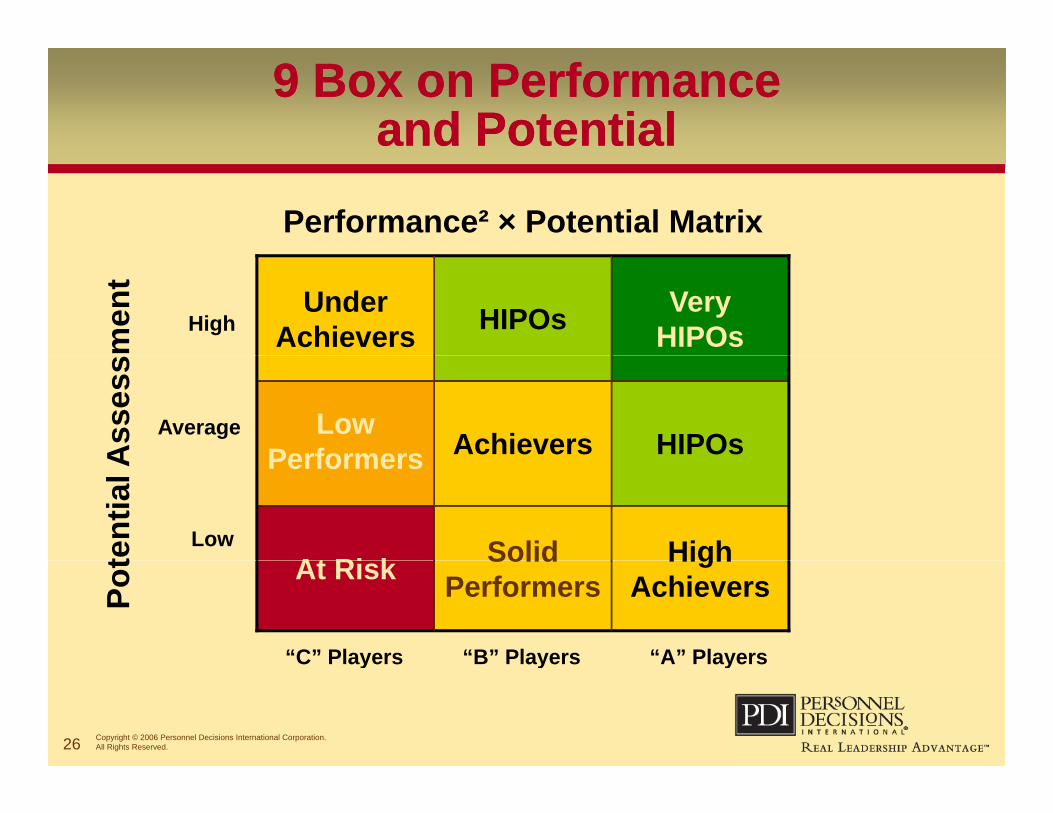
9 Box on Performance and Potential
9 Box on Performance and Potential
Performance² × Potential Matrix
men
t
VeryHIPOsHIPOsUnder
AchieversHigh
Ass
ess
HIPOsAchieversLow Performers
Average
tent
ial A
HighSolidAt Ri k
Performers
Low
Pot
“A” Players
HighAchievers
Solid PerformersAt Risk
“B” Players“C” Players
26 Copyright © 2006 Personnel Decisions International Corporation. All Rights Reserved.
A PlayersB PlayersC Players
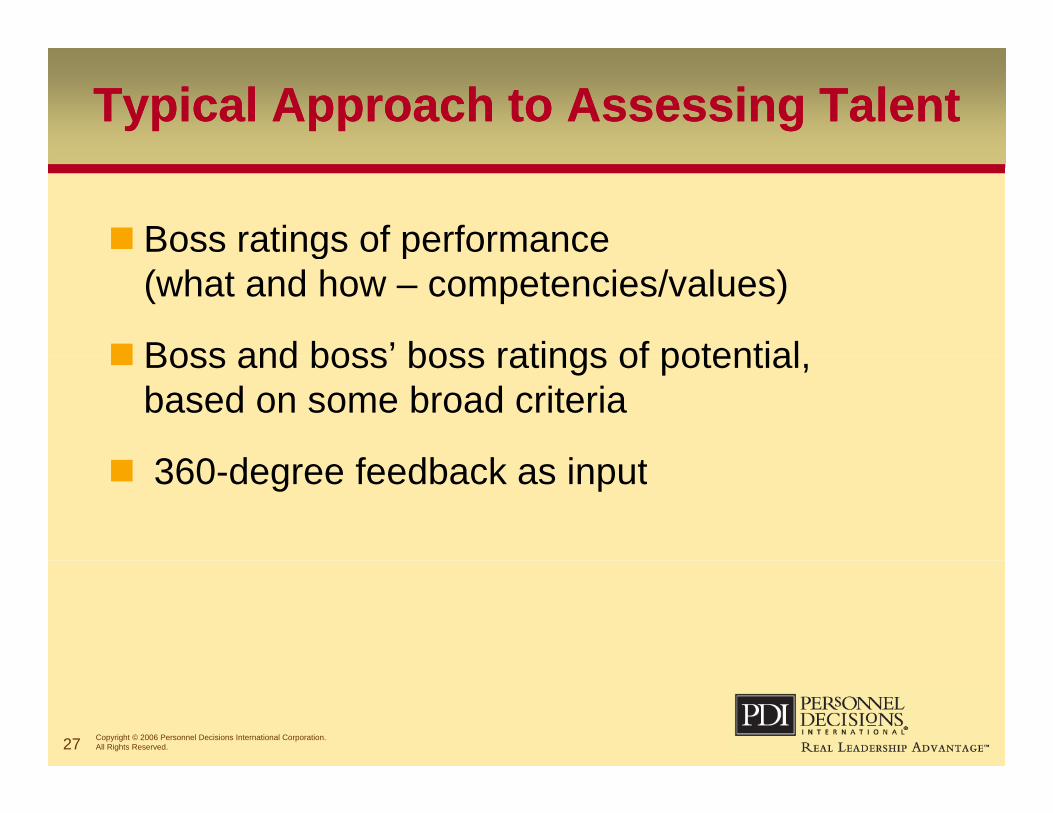
Typical Approach to Assessing TalentTypical Approach to Assessing Talent
Boss ratings of performance g p(what and how – competencies/values)
Boss and boss’ boss ratings of potential Boss and boss boss ratings of potential, based on some broad criteria
360 d f db k i t 360-degree feedback as input
27 Copyright © 2006 Personnel Decisions International Corporation. All Rights Reserved.
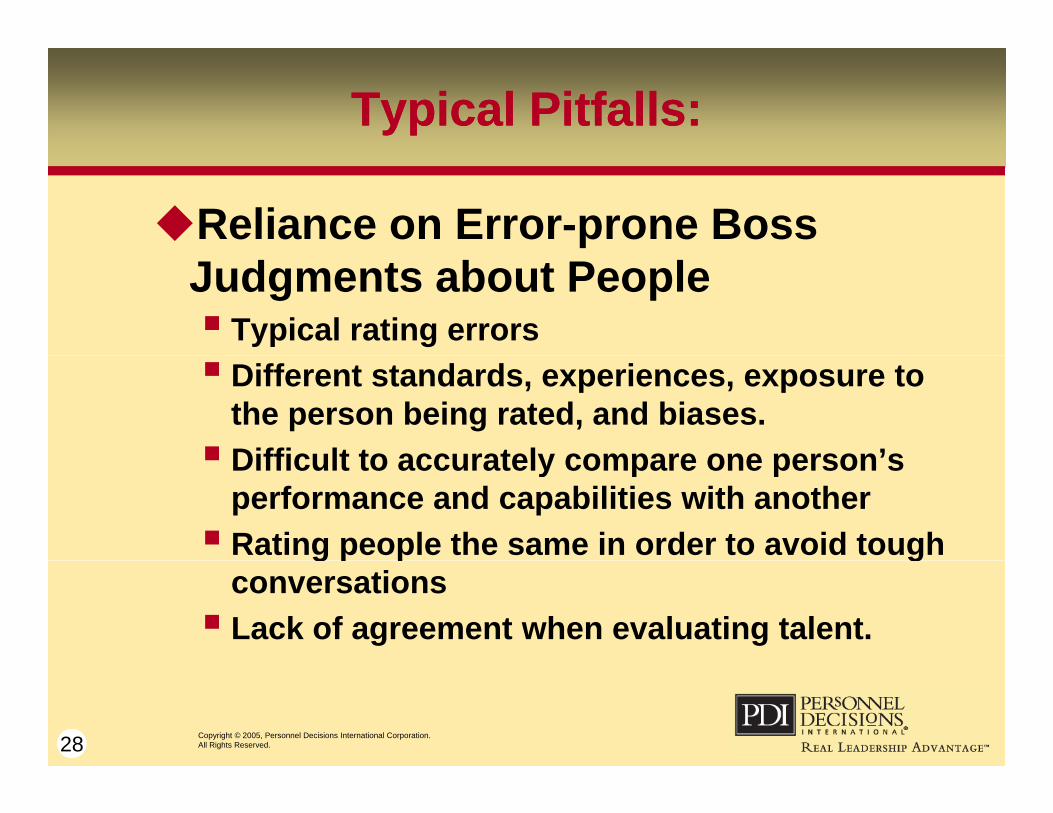
Typical Pitfalls:Typical Pitfalls:
Reliance on Error-prone Boss Judgments about People Typical rating errors Different standards, experiences, exposure to
the person being rated, and biases. Difficult to accurately compare one person’s Difficult to accurately compare one person s
performance and capabilities with another Rating people the same in order to avoid tough g p p g
conversations Lack of agreement when evaluating talent.
28 Copyright © 2005, Personnel Decisions International Corporation. All Rights Reserved.
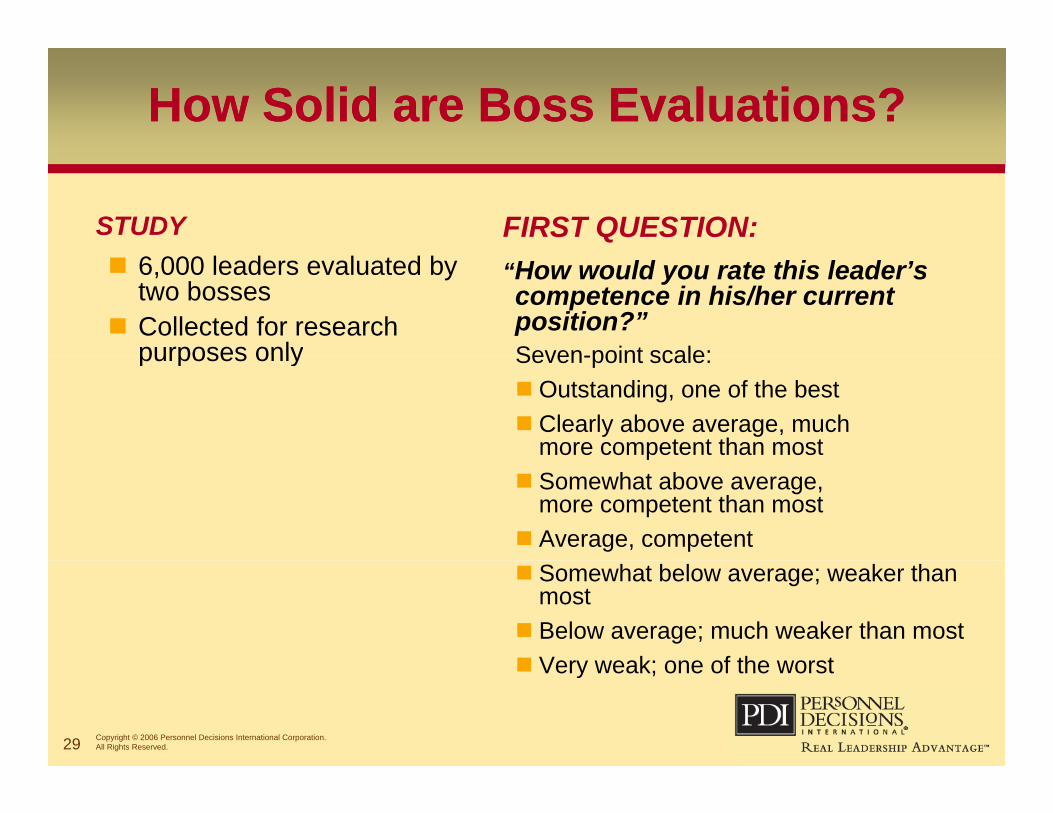
How Solid are Boss Evaluations?How Solid are Boss Evaluations?
STUDY FIRST QUESTION: 6,000 leaders evaluated by
two bosses Collected for research
purposes only
“How would you rate this leader’s competence in his/her current position?”Seven point scale:purposes only Seven-point scale: Outstanding, one of the best Clearly above average, much
more competent than mostp Somewhat above average,
more competent than most Average, competent Somewhat below average; weaker than
most Below average; much weaker than most Very weak; one of the worst
29 Copyright © 2006 Personnel Decisions International Corporation. All Rights Reserved.
Very weak; one of the worst
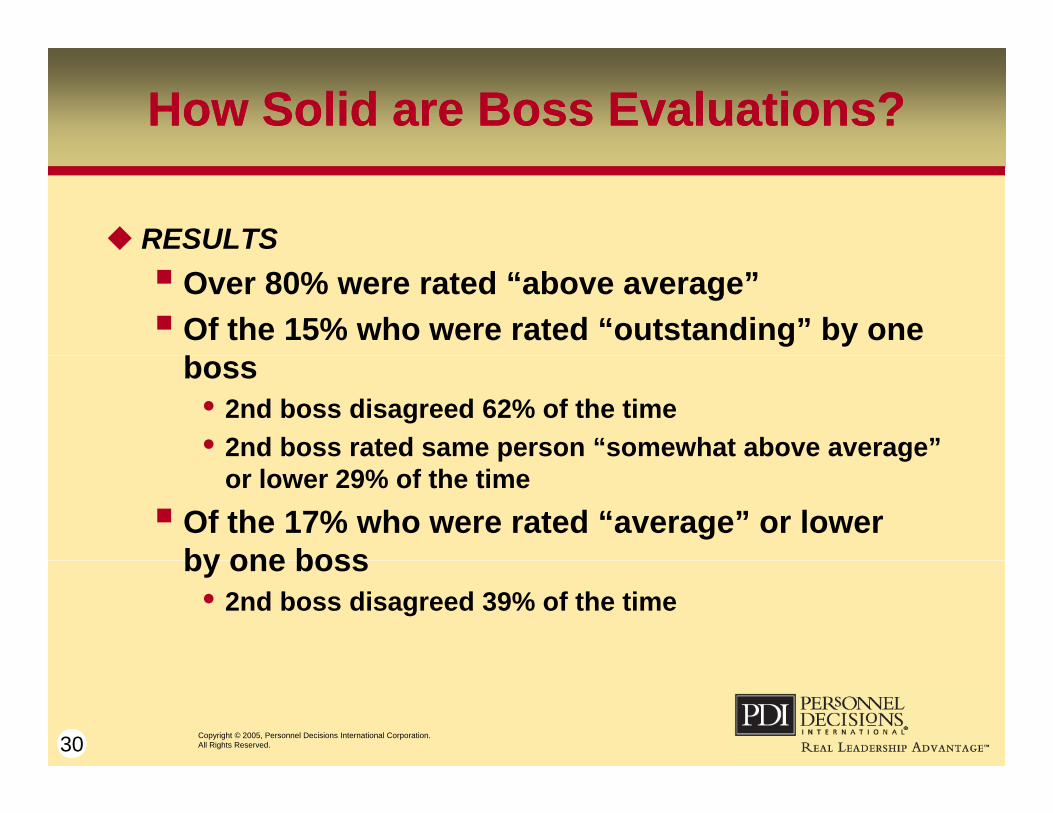
How Solid are Boss Evaluations?How Solid are Boss Evaluations?
RESULTS Over 80% were rated “above average” Of the 15% who were rated “outstanding” by one
bboss 2nd boss disagreed 62% of the time 2nd boss rated same person “somewhat above average” p g
or lower 29% of the time Of the 17% who were rated “average” or lower
by one bossby one boss 2nd boss disagreed 39% of the time
30 Copyright © 2005, Personnel Decisions International Corporation. All Rights Reserved.

How Solid are Boss Evaluations?How Solid are Boss Evaluations?
SECOND QUESTION
“How would you rate this leader’s long-range advancement potential?” Seven-point scale CEO/President Senior executive Senior executive Executive Upper Middle managementpp g Middle management Front-line management N t it d f t
31 Copyright © 2005, Personnel Decisions International Corporation. All Rights Reserved.
Not suited for management
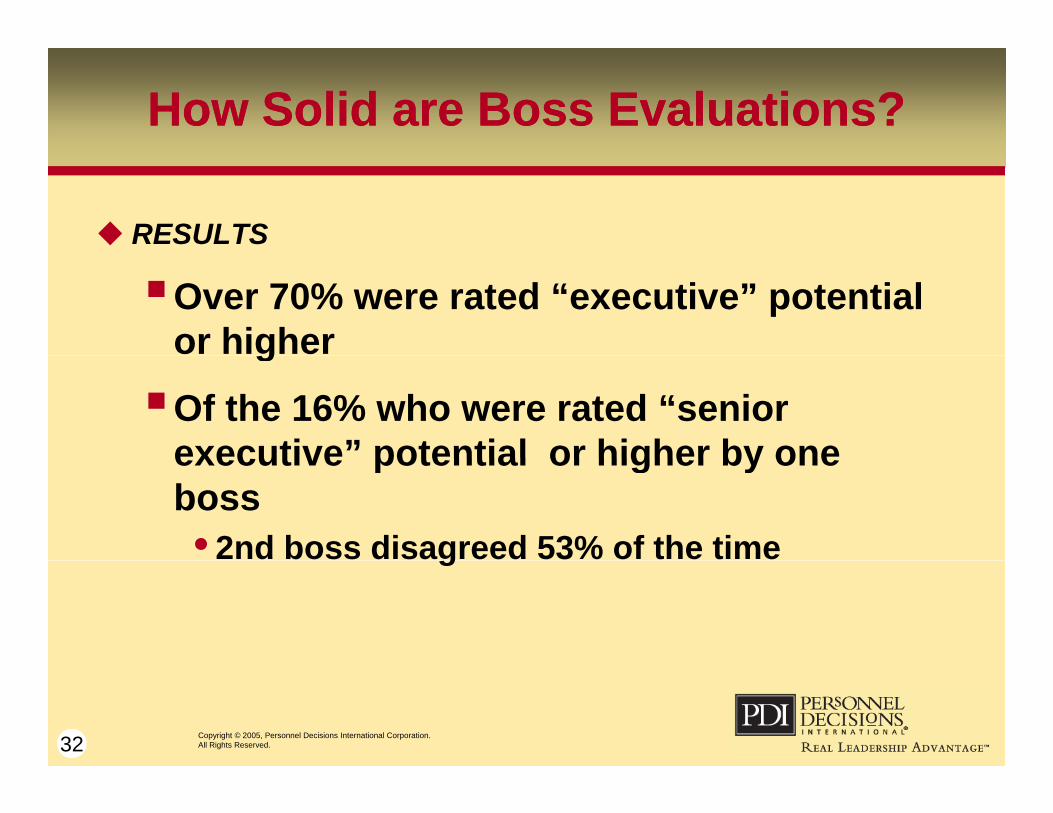
How Solid are Boss Evaluations?How Solid are Boss Evaluations?
RESULTS
Over 70% were rated “executive” potential or higherg
Of the 16% who were rated “senior executive” potential or higher by oneexecutive potential or higher by one boss 2nd boss disagreed 53% of the timeg
32 Copyright © 2005, Personnel Decisions International Corporation. All Rights Reserved.
How Solid are Boss Evaluations?How Solid are Boss Evaluations?How Solid are Boss Evaluations?How Solid are Boss Evaluations?
How confident are you in your “talent evaluators?”How can you be sure you are identifying and
investing in the right talent? g g
33 Copyright © 2005, Personnel Decisions International Corporation. All Rights Reserved.

Different Data for Assessing Performance, Potential, Readiness, and Fit
Different Data for Assessing Performance, Potential, Readiness, and Fit
ChiefChief
Senior Senior ExecutiveExecutive
Chief Chief ExecutiveExecutive
ExecutiveExecutive
Business Business Unit LeaderUnit Leader
MidMid--LevelLevelLeaderLeader
FitFirstFirst LevelLevel Readiness
Performance
FirstFirst--Level Level LeaderLeader
IndividualIndividualContributorContributor
34 Copyright © 2006 Personnel Decisions International Corporation. All Rights Reserved.
ContributorContributor
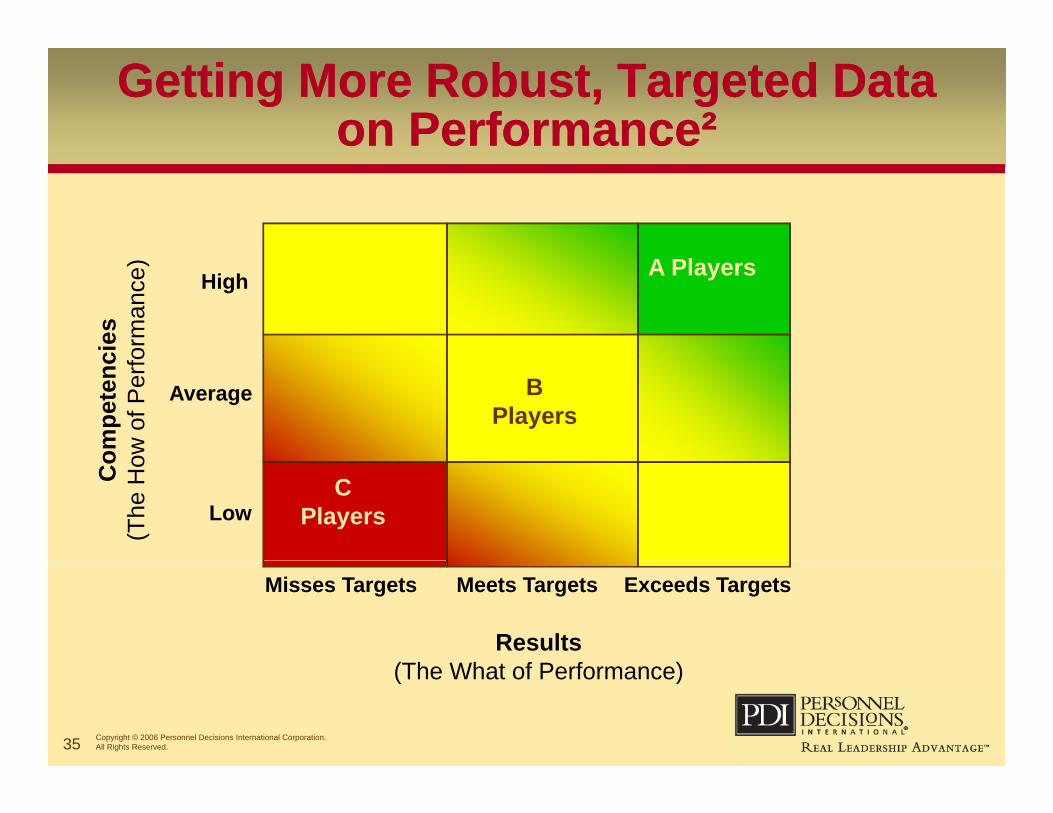
Getting More Robust, Targeted Data on Performance²
Getting More Robust, Targeted Data on Performance²
A Players
cies orm
ance
)
High
B Players
ompe
tenc
ow o
f Per
fo
Average
C Players
Co
(The
Ho
Low
Results(Th Wh t f P f )
Misses Targets Meets Targets Exceeds Targets
35 Copyright © 2006 Personnel Decisions International Corporation. All Rights Reserved.
(The What of Performance)
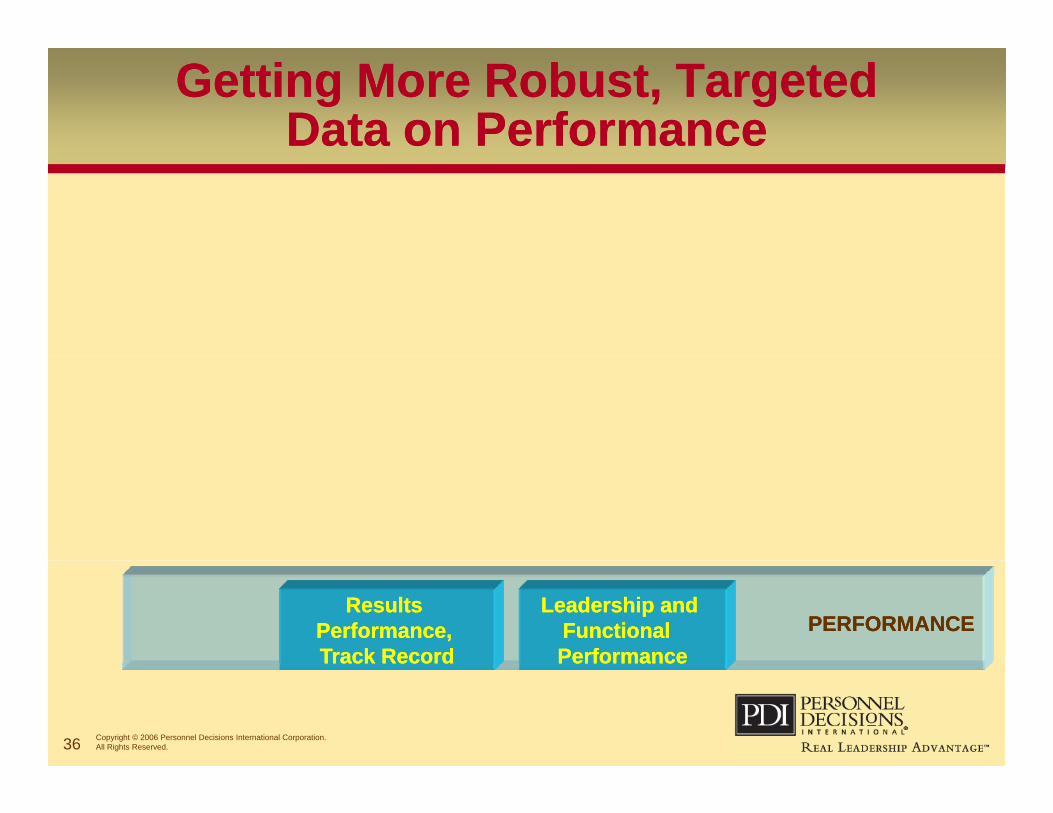
Getting More Robust, Targeted Data on Performance
Getting More Robust, Targeted Data on Performance
PERFORMANCEPERFORMANCEResults Results
Performance, Performance, Track RecordTrack Record
Leadership and Leadership and Functional Functional PerformancePerformance
36 Copyright © 2006 Personnel Decisions International Corporation. All Rights Reserved.
Track RecordTrack Record PerformancePerformance

A More Robust Measure of the “How” of Performance:
TalentView ™
A More Robust Measure of the “How” of Performance:
TalentView ™
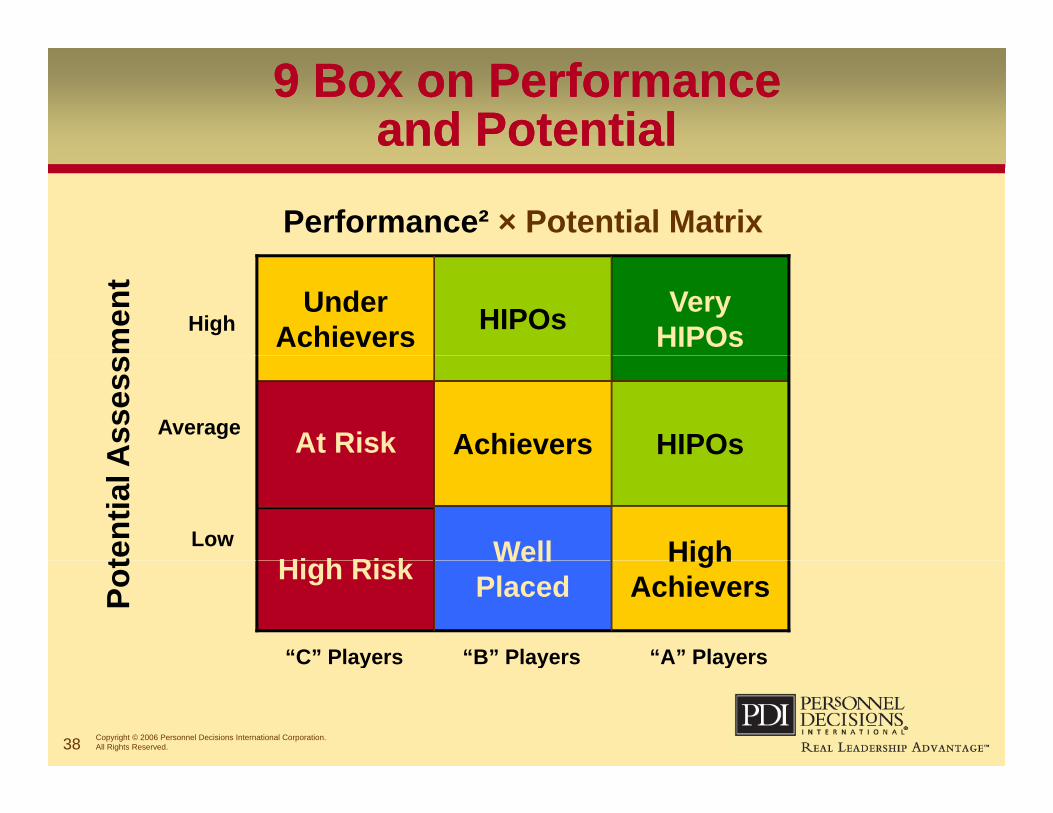
9 Box on Performance and Potential
9 Box on Performance and Potential
Performance² × Potential Matrix
men
t
VeryHIPOsHIPOsUnder
AchieversHigh
Ass
ess
HIPOsAchieversAt RiskAverage
tent
ial A
HighWellHi h Ri kLow
Pot
“A” Players
HighAchievers
WellPlacedHigh Risk
“B” Players“C” Players
38 Copyright © 2006 Personnel Decisions International Corporation. All Rights Reserved.
A PlayersB PlayersC Players
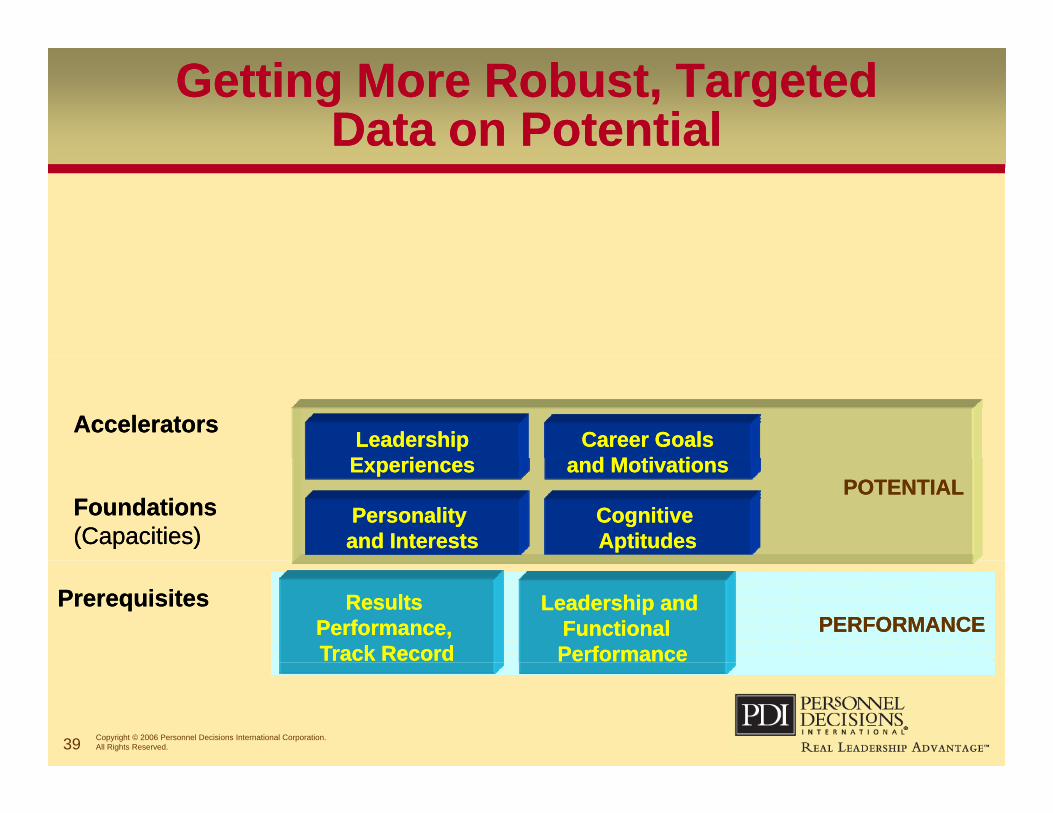
Getting More Robust, Targeted Data on Potential
Getting More Robust, Targeted Data on Potential
LeadershipLeadershipE iE i
Career GoalsCareer Goalsd M ti tid M ti ti
AcceleratorsAccelerators
POTENTIALPOTENTIALPersonality Personality and Interestsand Interests
Cognitive Cognitive AptitudesAptitudes
ExperiencesExperiences and Motivationsand Motivations
Foundations(Capacities)Foundations(Capacities)
PERFORMANCEPERFORMANCEPERFORMANCEPERFORMANCEResults Results
Performance, Performance, Track RecordTrack Record
Leadership and Leadership and Functional Functional PerformancePerformance
PrerequisitesPrerequisites
39 Copyright © 2006 Personnel Decisions International Corporation. All Rights Reserved.
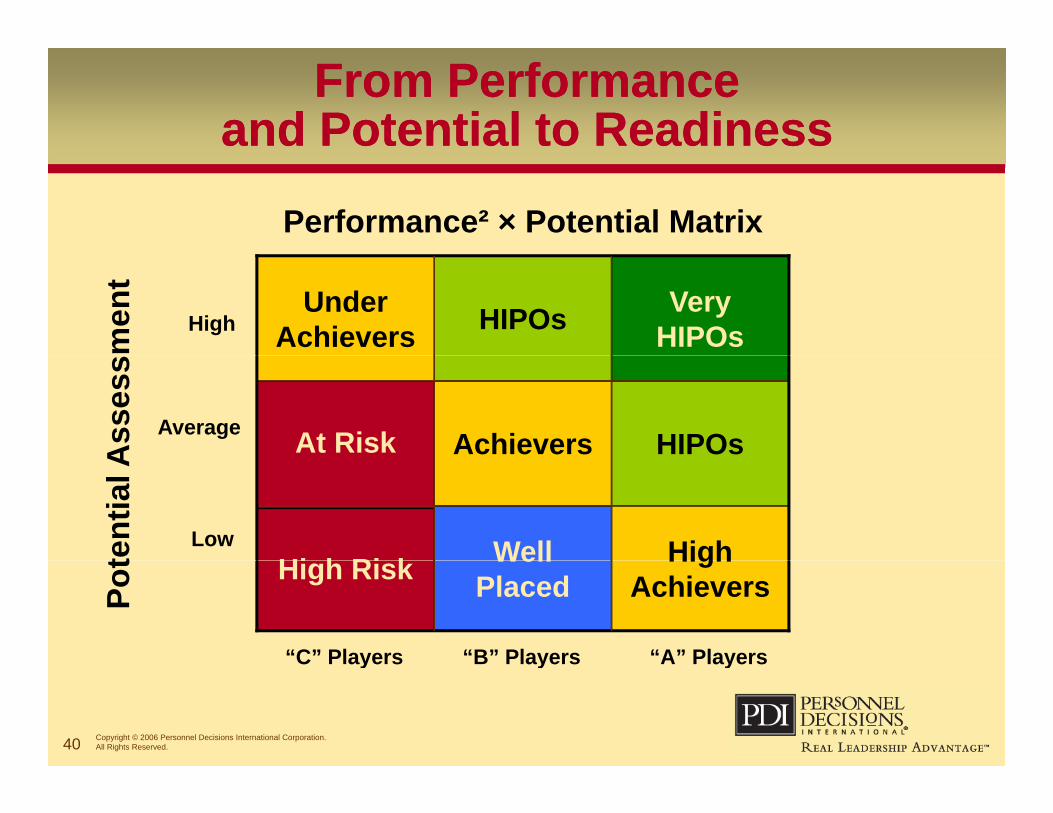
From Performance and Potential to Readiness
From Performance and Potential to Readiness
Performance² × Potential Matrix
men
t
VeryHIPOsHIPOsUnder
AchieversHigh
Ass
ess
HIPOsAchieversAt RiskAverage
tent
ial A
HighWellHi h Ri kLow
Pot
“A” Players
HighAchievers
WellPlacedHigh Risk
“B” Players“C” Players
40 Copyright © 2006 Personnel Decisions International Corporation. All Rights Reserved.
A PlayersB PlayersC Players
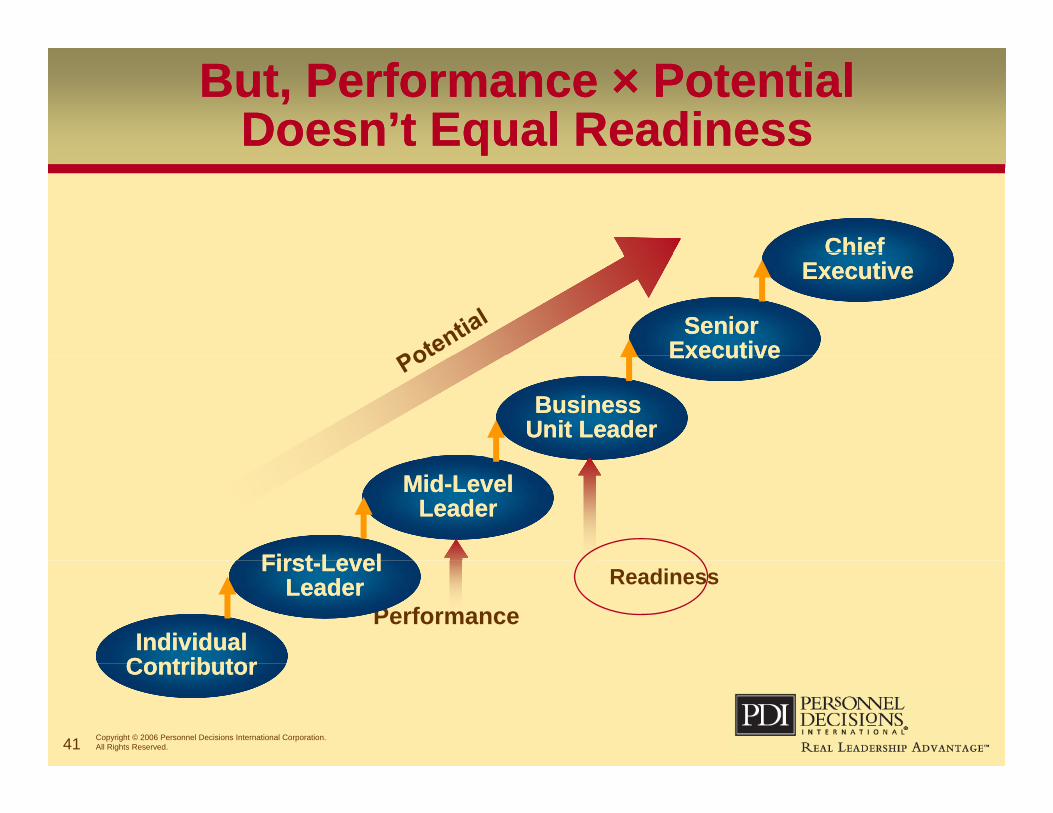
But, Performance × Potential Doesn’t Equal Readiness
But, Performance × Potential Doesn’t Equal Readinessqq
ChiefChief
Senior Senior ExecutiveExecutive
Chief Chief ExecutiveExecutive
ExecutiveExecutive
Business Business Unit LeaderUnit Leader
MidMid--LevelLevelLeaderLeader
FirstFirst LevelLevel Readiness
Performance
FirstFirst--Level Level LeaderLeader
IndividualIndividualContributorContributor
41 Copyright © 2006 Personnel Decisions International Corporation. All Rights Reserved.
ContributorContributor
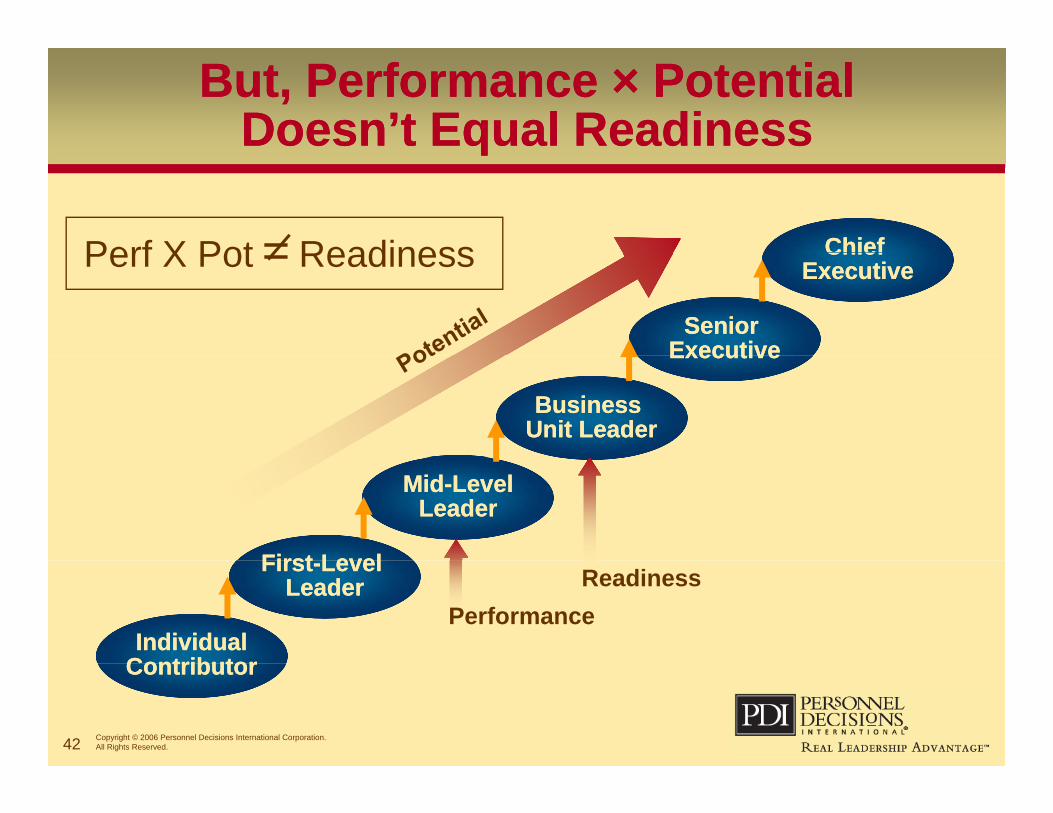
But, Performance × Potential Doesn’t Equal Readiness
But, Performance × Potential Doesn’t Equal Readinessqq
ChiefChiefPerf X Pot = Readiness
Senior Senior ExecutiveExecutive
Chief Chief ExecutiveExecutivePerf X Pot = Readiness
ExecutiveExecutive
Business Business Unit LeaderUnit Leader
MidMid--LevelLevelLeaderLeader
FirstFirst LevelLevel ReadinessPerformance
FirstFirst--Level Level LeaderLeader
IndividualIndividualContributorContributor
42 Copyright © 2006 Personnel Decisions International Corporation. All Rights Reserved.
ContributorContributor
The Transition to a New LevelThe Transition to a New Level
Big jump in responsibilityBig jump in responsibilityNeed to contend with new challengesOften require new or higher levels ofOften require new, or higher levels of
capabilityNeed to let go of the previous job (e.g.,Need to let go of the previous job (e.g.,
the 50% rule)
43 Copyright © 2005, Personnel Decisions International Corporation. All Rights Reserved.
We Must Get More Robust About Assessing Readiness
We Must Get More Robust About Assessing ReadinessAssessing ReadinessAssessing Readiness
It drives one of the two the “big ticket” talent It drives one of the two the “big ticket” talent decisions – who to promotePerformance and potential evaluations havePerformance and potential evaluations have
less significant consequencesUnless the size of the jump is small potentialUnless the size of the jump is small, potential
does not assure success
44 Copyright © 2005, Personnel Decisions International Corporation. All Rights Reserved.
A More Robust Measure of Readiness: Formal Assessment
A More Robust Measure of Readiness: Formal AssessmentReadiness: Formal AssessmentReadiness: Formal Assessment
Measures of experience, cognitive ability, and p , g y,work style/motivationsBusiness simulations of the unique challenges g
in the next level roleMultiple, objective, highly trained assessorsSpecific performance standardsBenchmarking of talent—comparison to theBenchmarking of talent comparison to the
broader market
45 Copyright © 2005, Personnel Decisions International Corporation. All Rights Reserved.
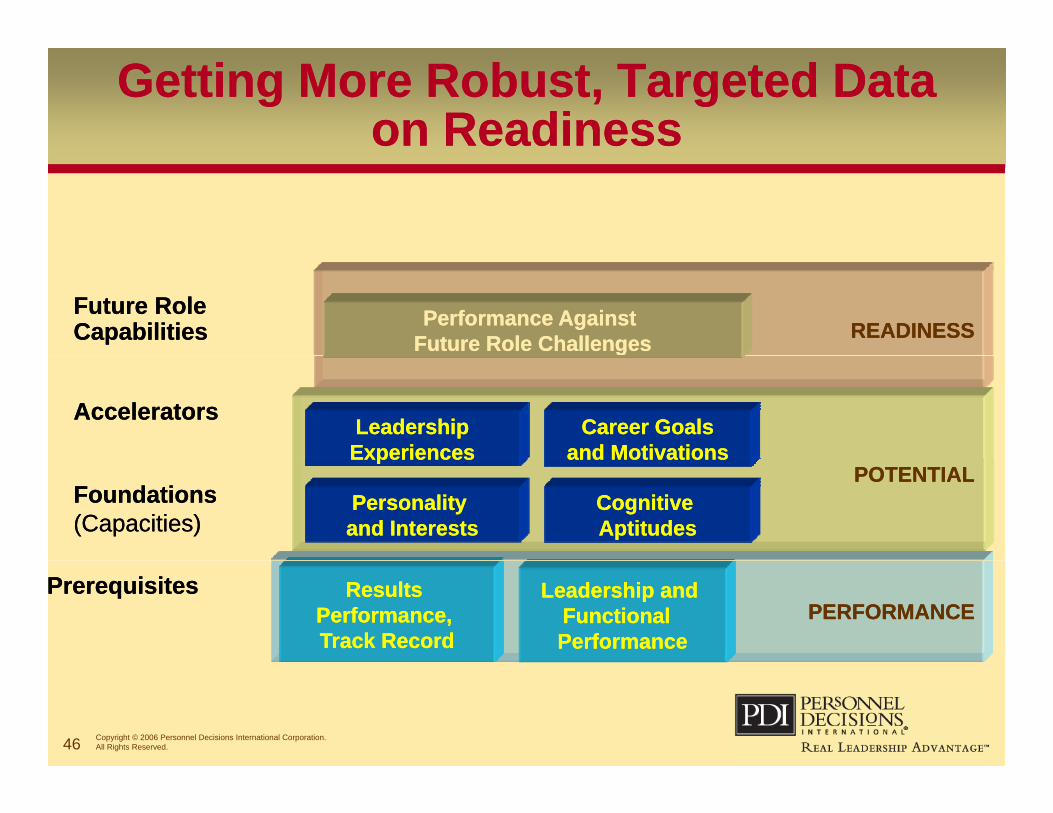
Getting More Robust, Targeted Data on Readiness
Getting More Robust, Targeted Data on Readiness
READINESSREADINESSPerformance Against Performance Against Future Role ChallengesFuture Role Challenges
Future Role CapabilitiesFuture Role Capabilities
LeadershipLeadershipExperiencesExperiences
Career GoalsCareer Goalsand Motivationsand Motivations
AcceleratorsAccelerators
POTENTIALPOTENTIALPersonality Personality and Interestsand Interests
Cognitive Cognitive AptitudesAptitudes
ExperiencesExperiences and Motivationsand Motivations
Foundations(Capacities)Foundations(Capacities)
PERFORMANCEPERFORMANCEResults Results
Performance, Performance, Track RecordTrack Record
Leadership and Leadership and Functional Functional PerformancePerformance
PrerequisitesPrerequisites
46 Copyright © 2006 Personnel Decisions International Corporation. All Rights Reserved.
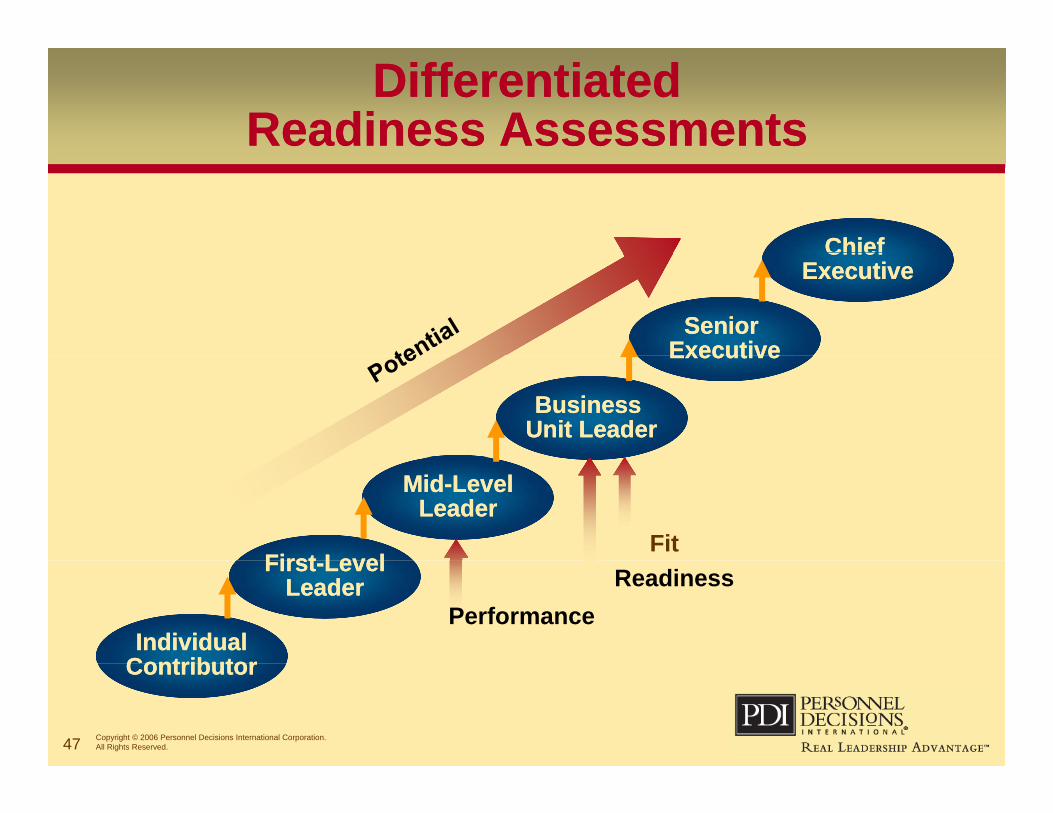
Differentiated Readiness Assessments
Differentiated Readiness Assessments
ChiefChief
Senior Senior ExecutiveExecutive
Chief Chief ExecutiveExecutive
ExecutiveExecutive
Business Business Unit LeaderUnit Leader
MidMid--LevelLevelLeaderLeader
FitFirstFirst LevelLevel Readiness
Performance
FirstFirst--LevelLevelLeaderLeader
IndividualIndividualContributorContributor
47 Copyright © 2006 Personnel Decisions International Corporation. All Rights Reserved.
ContributorContributor
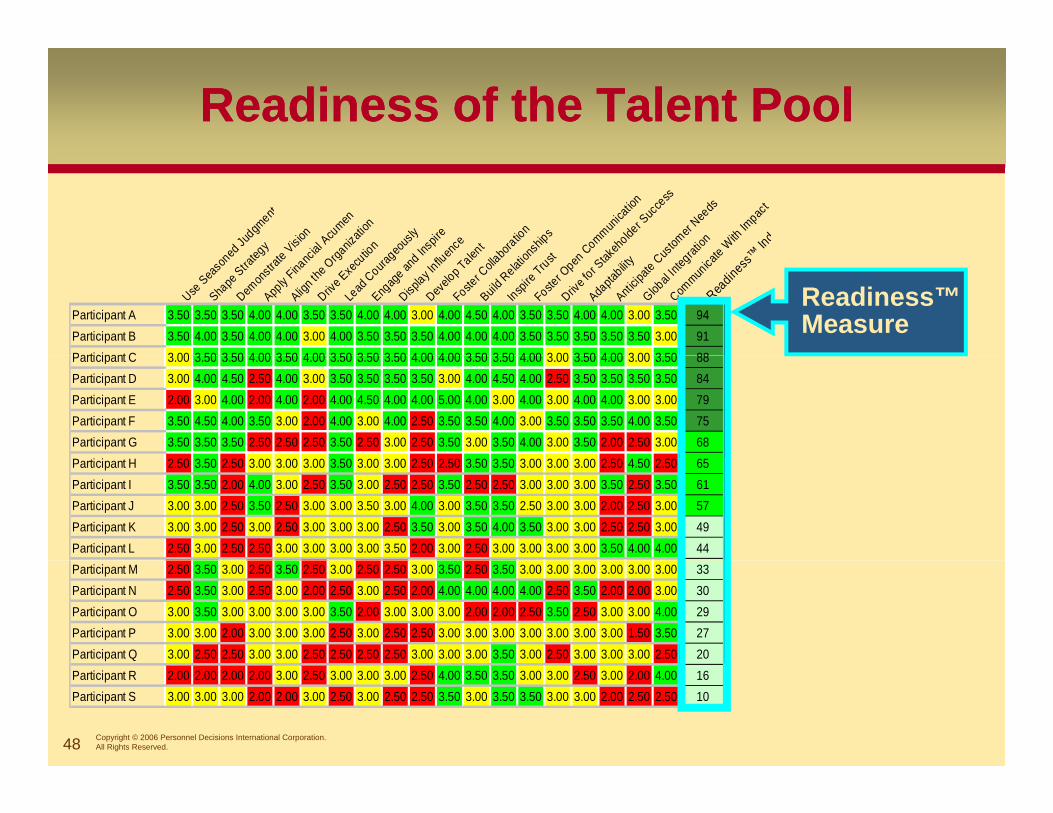
Readiness of the Talent Pool Readiness of the Talent Pool
ed Ju
dgment
egy
e Vision
cial A
cumen
ganiz
ation
tion
geous
lyIns
pire
ence
ent
boratio
non
ships
t Communica
tion
keho
lder S
ucce
ssCus
tomer
Needs
ration
te With
Impac
t™ In
de
Use Sea
soned
Shape
Strateg
Demon
strate
V
Apply F
inanc
ia
Align th
e Orga
Drive E
xecu
tioLe
ad Coura
geEng
age an
d In
Display In
fluen
Develo
p Talen
Foster C
ollabo
Build Relati
onInspi
re Trust
Foster O
pen C
Drive f
or Stak
Adapta
bilityAnti
cipate
Cus
Global I
ntegra
Commun
icate
Readiness™
Participant A 3.50 3.50 3.50 4.00 4.00 3.50 3.50 4.00 4.00 3.00 4.00 4.50 4.00 3.50 3.50 4.00 4.00 3.00 3.50 94Participant B 3.50 4.00 3.50 4.00 4.00 3.00 4.00 3.50 3.50 3.50 4.00 4.00 4.00 3.50 3.50 3.50 3.50 3.50 3.00 91Participant C 3 00 3 50 3 50 4 00 3 50 4 00 3 50 3 50 3 50 4 00 4 00 3 50 3 50 4 00 3 00 3 50 4 00 3 00 3 50 88
Readiness™ Measure
Participant C 3.00 3.50 3.50 4.00 3.50 4.00 3.50 3.50 3.50 4.00 4.00 3.50 3.50 4.00 3.00 3.50 4.00 3.00 3.50 88Participant D 3.00 4.00 4.50 2.50 4.00 3.00 3.50 3.50 3.50 3.50 3.00 4.00 4.50 4.00 2.50 3.50 3.50 3.50 3.50 84Participant E 2.00 3.00 4.00 2.00 4.00 2.00 4.00 4.50 4.00 4.00 5.00 4.00 3.00 4.00 3.00 4.00 4.00 3.00 3.00 79Participant F 3.50 4.50 4.00 3.50 3.00 2.00 4.00 3.00 4.00 2.50 3.50 3.50 4.00 3.00 3.50 3.50 3.50 4.00 3.50 75Participant G 3.50 3.50 3.50 2.50 2.50 2.50 3.50 2.50 3.00 2.50 3.50 3.00 3.50 4.00 3.00 3.50 2.00 2.50 3.00 68Participant H 2.50 3.50 2.50 3.00 3.00 3.00 3.50 3.00 3.00 2.50 2.50 3.50 3.50 3.00 3.00 3.00 2.50 4.50 2.50 65Participant I 3.50 3.50 2.00 4.00 3.00 2.50 3.50 3.00 2.50 2.50 3.50 2.50 2.50 3.00 3.00 3.00 3.50 2.50 3.50 61Participant J 3.00 3.00 2.50 3.50 2.50 3.00 3.00 3.50 3.00 4.00 3.00 3.50 3.50 2.50 3.00 3.00 2.00 2.50 3.00 57Participant K 3.00 3.00 2.50 3.00 2.50 3.00 3.00 3.00 2.50 3.50 3.00 3.50 4.00 3.50 3.00 3.00 2.50 2.50 3.00 49Participant L 2.50 3.00 2.50 2.50 3.00 3.00 3.00 3.00 3.50 2.00 3.00 2.50 3.00 3.00 3.00 3.00 3.50 4.00 4.00 44Participant M 2.50 3.50 3.00 2.50 3.50 2.50 3.00 2.50 2.50 3.00 3.50 2.50 3.50 3.00 3.00 3.00 3.00 3.00 3.00 33Participant N 2.50 3.50 3.00 2.50 3.00 2.00 2.50 3.00 2.50 2.00 4.00 4.00 4.00 4.00 2.50 3.50 2.00 2.00 3.00 30Participant O 3.00 3.50 3.00 3.00 3.00 3.00 3.50 2.00 3.00 3.00 3.00 2.00 2.00 2.50 3.50 2.50 3.00 3.00 4.00 29Participant P 3.00 3.00 2.00 3.00 3.00 3.00 2.50 3.00 2.50 2.50 3.00 3.00 3.00 3.00 3.00 3.00 3.00 1.50 3.50 27Participant Q 3.00 2.50 2.50 3.00 3.00 2.50 2.50 2.50 2.50 3.00 3.00 3.00 3.50 3.00 2.50 3.00 3.00 3.00 2.50 20
48 Copyright © 2006 Personnel Decisions International Corporation. All Rights Reserved.
Participant R 2.00 2.00 2.00 2.00 3.00 2.50 3.00 3.00 3.00 2.50 4.00 3.50 3.50 3.00 3.00 2.50 3.00 2.00 4.00 16Participant S 3.00 3.00 3.00 2.00 2.00 3.00 2.50 3.00 2.50 2.50 3.50 3.00 3.50 3.50 3.00 3.00 2.00 2.50 2.50 10
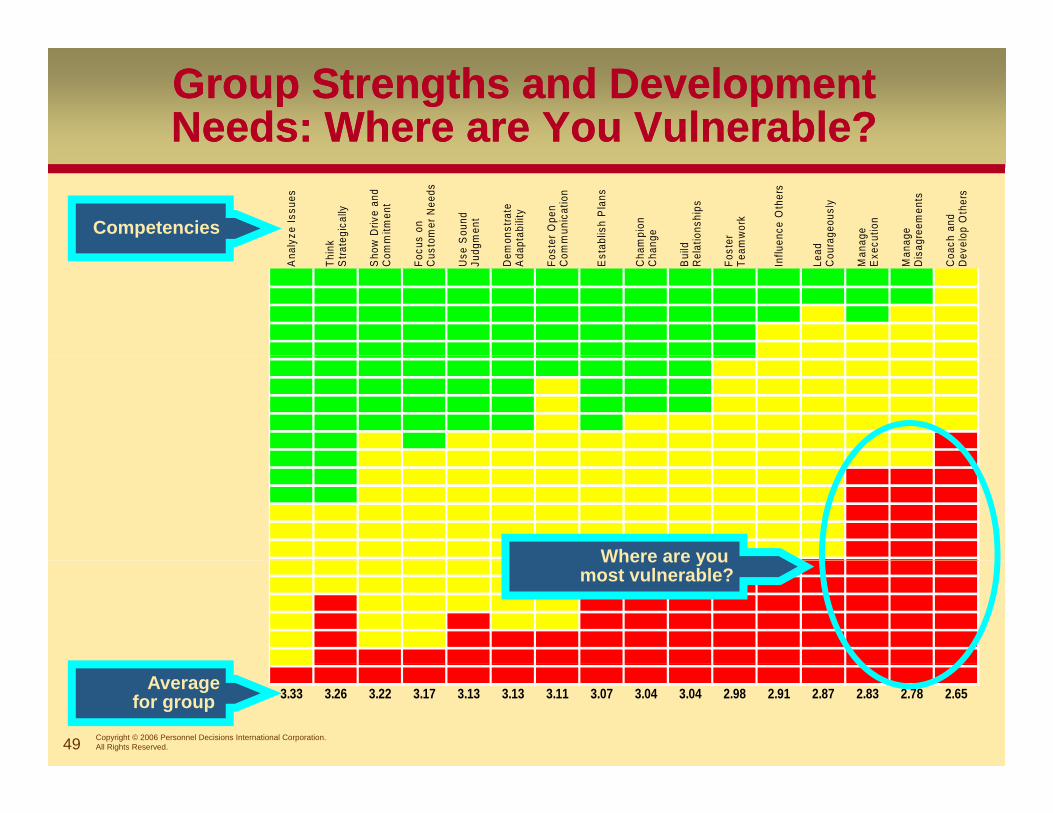
Group Strengths and Development Needs: Where are You Vulnerable?Group Strengths and Development Needs: Where are You Vulnerable?
alyz
e Is
sues
ink
rate
gica
lly
ow D
rive
and
mm
itmen
t
cus
on
stom
er N
eeds
e S
ound
dg
men
t
mon
stra
te
apta
bilit
y
ster
Ope
n m
mun
icat
ion
tabl
ish
Pla
ns
ampi
on
ange
ild
latio
nshi
ps
ster
am
wor
k
luen
ce O
ther
s
ad
urag
eous
ly
anag
e ec
utio
n
anag
e sa
gree
men
ts
ach
and
velo
p O
ther
s
Competencies
An
Thi
Str
Sh
Co
Foc
Cu
Us
Jud
De
Ad
Fos
Co
Es
Ch
Ch
Bu
Re
Fos
Tea
Infl
Lea
Co
Ma
Ex
Ma
Dis
Co
De
Where are youWhere are you most vulnerable?
49 Copyright © 2006 Personnel Decisions International Corporation. All Rights Reserved.
3.33 3.26 3.22 3.17 3.13 3.13 3.11 3.07 3.04 3.04 2.98 2.91 2.87 2.83 2.78 2.65Averagefor group
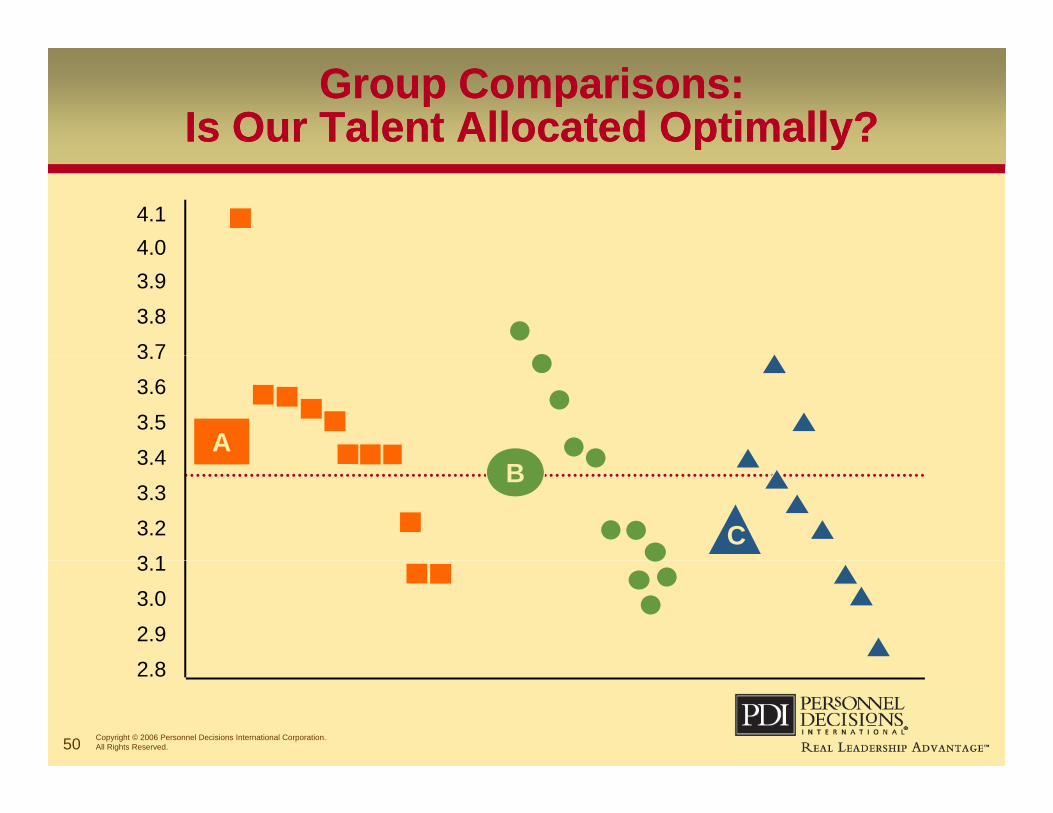
Group Comparisons: Is Our Talent Allocated Optimally?
Group Comparisons: Is Our Talent Allocated Optimally?yy
4.14.04.03.93.83 73.73.63.53 4 A3.43.33.23 1
B
C3.13.02.92 8
50 Copyright © 2006 Personnel Decisions International Corporation. All Rights Reserved.
2.8
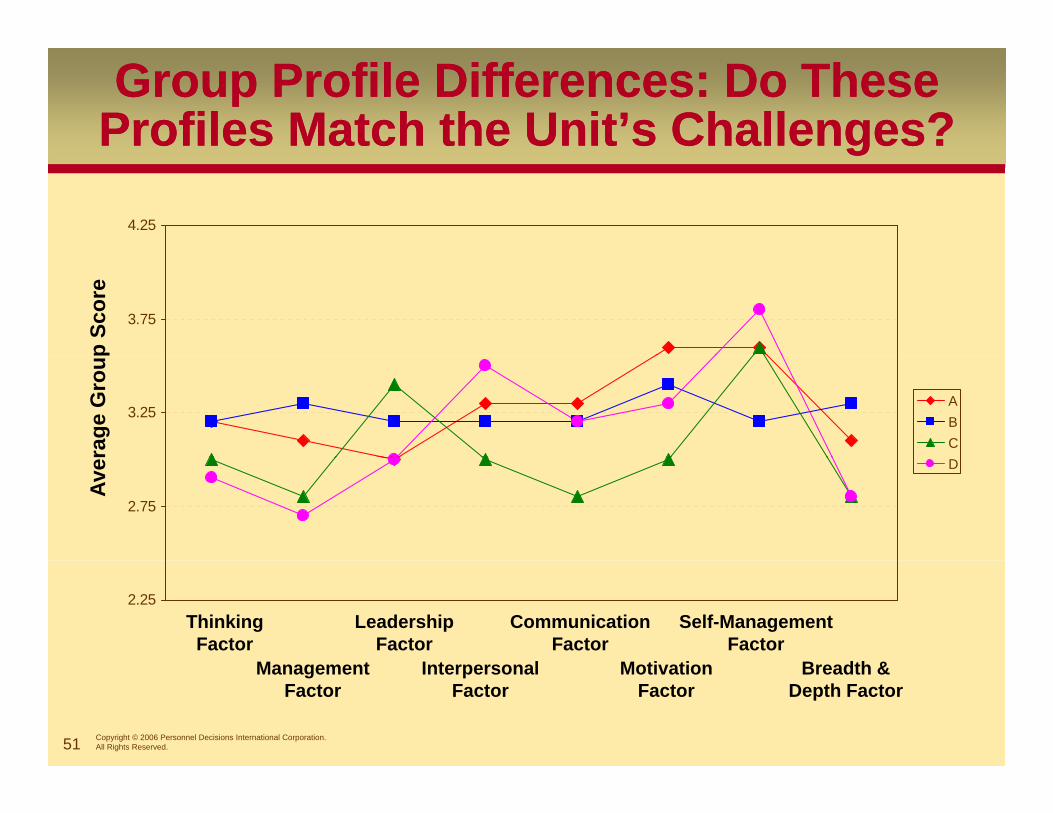
Group Profile Differences: Do These Profiles Match the Unit’s Challenges?Group Profile Differences: Do These
Profiles Match the Unit’s Challenges?gg
4.25
3.75
p Sc
ore
3.25ABCra
ge G
roup
2.75
D
Ave
2.25Thinking Factor
Leadership Factor
Communication Factor
Self-Management Factor
M t I t l M ti ti B dth &
51 Copyright © 2006 Personnel Decisions International Corporation. All Rights Reserved.
Management Factor
Interpersonal Factor
Motivation Factor
Breadth & Depth Factor

Which Strategic Challenges are at Most Risk?
Which Strategic Challenges are at Most Risk?
Cross-functional collaboration, communication and trust
3.11and trust
Integration & alignment of structures, systems, and processes
Streamlined and timely decision making and systems thinking
3.15
2.96
Further penetrate global marketsProactive & calculated risks, greater
innovationEnd-to-end strategic marketing 3.05
3.01
2.87
g g
Balancing needs of both customers and channels
Larger, more complex customer accounts
3.17
3.13
Build, engage, & retain the best talent 2.67
2.50 2.60 2.70 2.80 2.90 3.00 3.10 3.20 3.30
Competency Average
52 Copyright © 2006 Personnel Decisions International Corporation. All Rights Reserved.
Competency Average
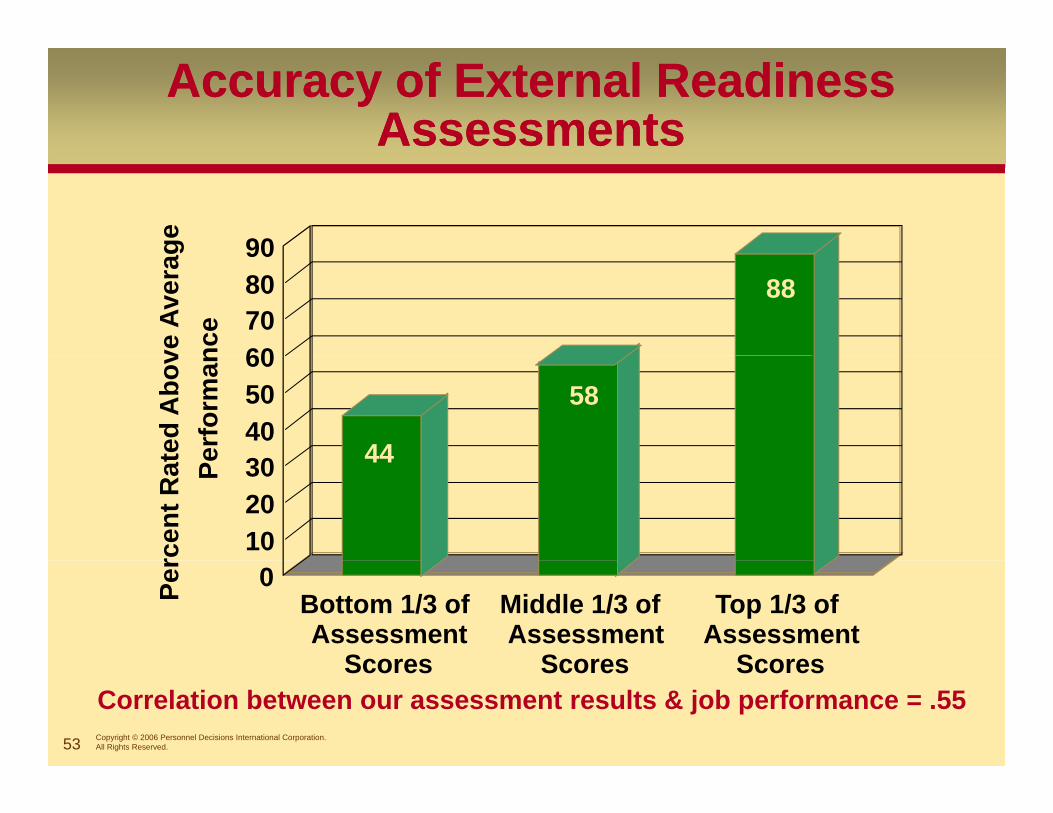
Accuracy of External Readiness Assessments
Accuracy of External Readiness Assessments
90ge
88
60708090
ve A
vera
gnc
e
44
58
30405060
ted
Abo
ver
form
an
44
102030
rcen
t Rat Pe
0Per
Bottom 1/3 ofAssessment
Scores
Middle 1/3 ofAssessment
Scores
Top 1/3 ofAssessment
Scores
53 Copyright © 2006 Personnel Decisions International Corporation. All Rights Reserved.
Scores Scores ScoresCorrelation between our assessment results & job performance = .55
How Solid is Your Data?How Solid is Your Data?
Discussion:Discussion:What pitfalls do you see in evaluating talent
in your organization?in your organization? Share an example of where you’ve seen
these pitfalls at workthese pitfalls at workHow do these pitfalls impact the accuracy of
talent decisions?talent decisions?
54 Copyright © 2005, Personnel Decisions International Corporation. All Rights Reserved.
Key #3: Carefully Managed Talent Reviews and Decisions
Key #3: Carefully Managed Talent Reviews and Decisions
3333
55 Copyright © 2006 Personnel Decisions International Corporation. All Rights Reserved.
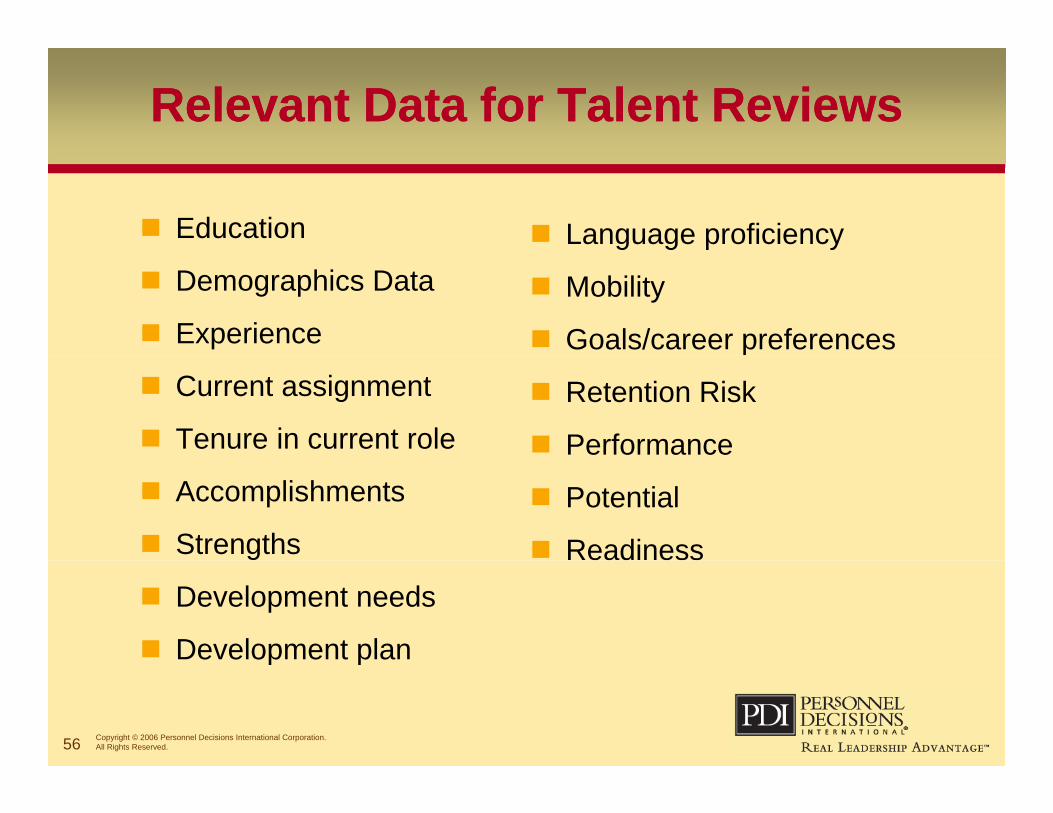
Relevant Data for Talent ReviewsRelevant Data for Talent Reviews
Education Language proficiency Demographics Data
Experience Mobility
Goals/career preferences Current assignment
Tenure in current role Retention Risk
Performance Accomplishments
Strengths Potential
Readiness Development needs
Development plan
56 Copyright © 2006 Personnel Decisions International Corporation. All Rights Reserved.
p p
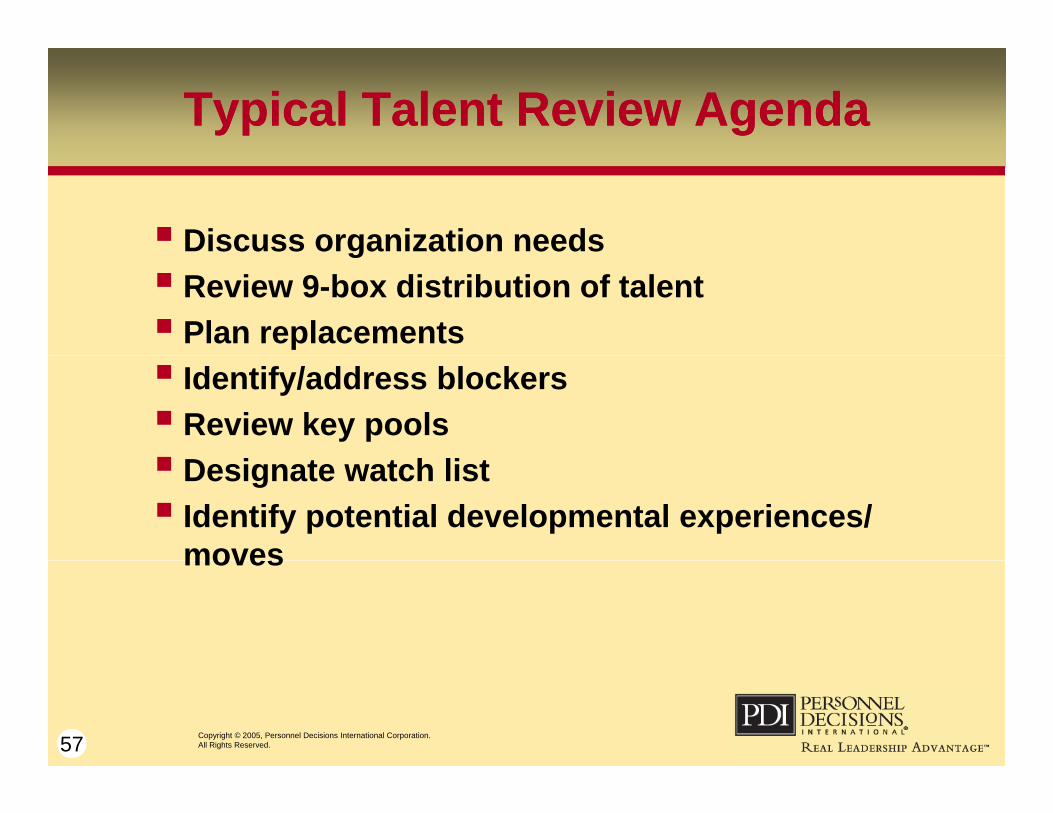
Typical Talent Review AgendaTypical Talent Review Agenda
Discuss organization needsg Review 9-box distribution of talent Plan replacements Identify/address blockers Review key pools Designate watch list Identify potential developmental experiences/
movesmoves
57 Copyright © 2005, Personnel Decisions International Corporation. All Rights Reserved.
Talent ReviewsTalent Reviews
Discussion:Discussion:How do these discussions work in your
organization? gDo they happen?What ends up driving the decisions?What ends up driving the decisions? How robust is the decision-making
process?p ocess
58 Copyright © 2005, Personnel Decisions International Corporation. All Rights Reserved.
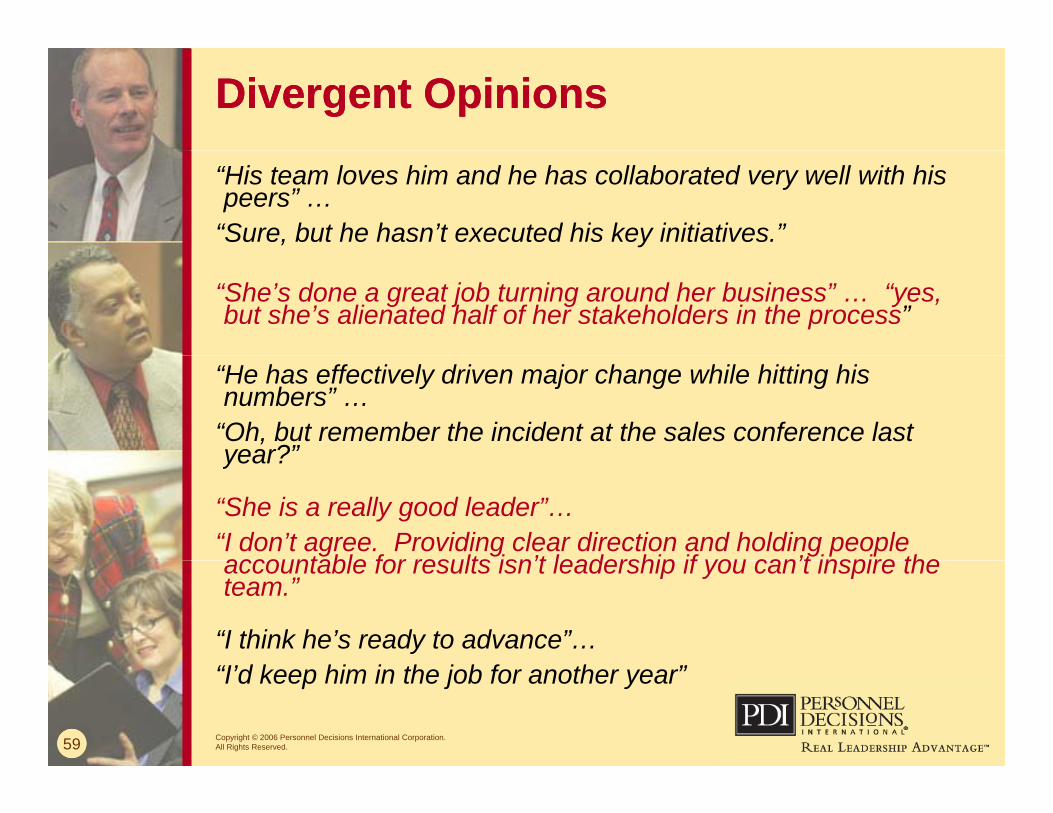
Divergent OpinionsDivergent Opinions
“His team loves him and he has collaborated very well with his peers” …
“Sure, but he hasn’t executed his key initiatives.”
“She’s done a great job turning around her business” … “yes, but she’s alienated half of her stakeholders in the process”
“He has effectively driven major change while hitting his numbers” …
“Oh, but remember the incident at the sales conference last year?”year?
“She is a really good leader”… “I don’t agree. Providing clear direction and holding people accountable for results isn’t leadership if you can’t inspire theaccountable for results isn’t leadership if you can’t inspire the team.”
“I think he’s ready to advance”…
59 Copyright © 2006 Personnel Decisions International Corporation. All Rights Reserved.
“I’d keep him in the job for another year”
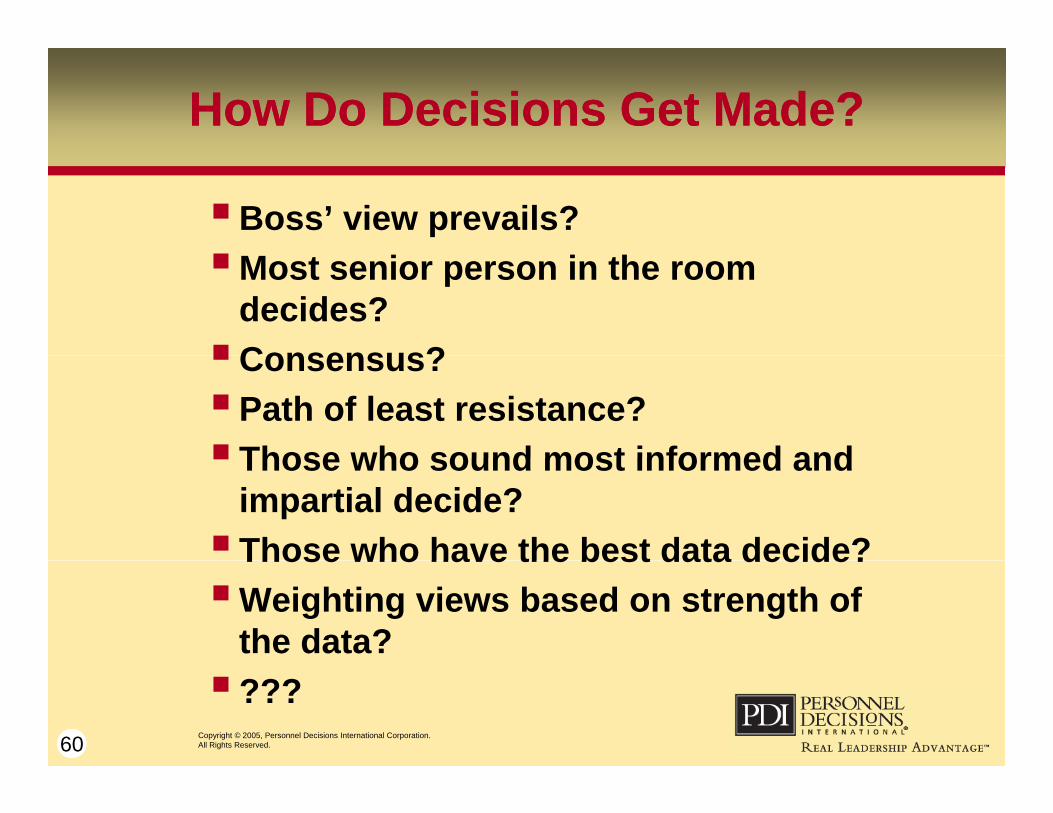
How Do Decisions Get Made?How Do Decisions Get Made?
Boss’ view prevails?Most senior person in the room
decides?Consensus?Consensus? Path of least resistance? Those who sound most informed andThose who sound most informed and
impartial decide? Those who have the best data decide?Those who have the best data decide?Weighting views based on strength of
the data?
60 Copyright © 2005, Personnel Decisions International Corporation. All Rights Reserved.
???
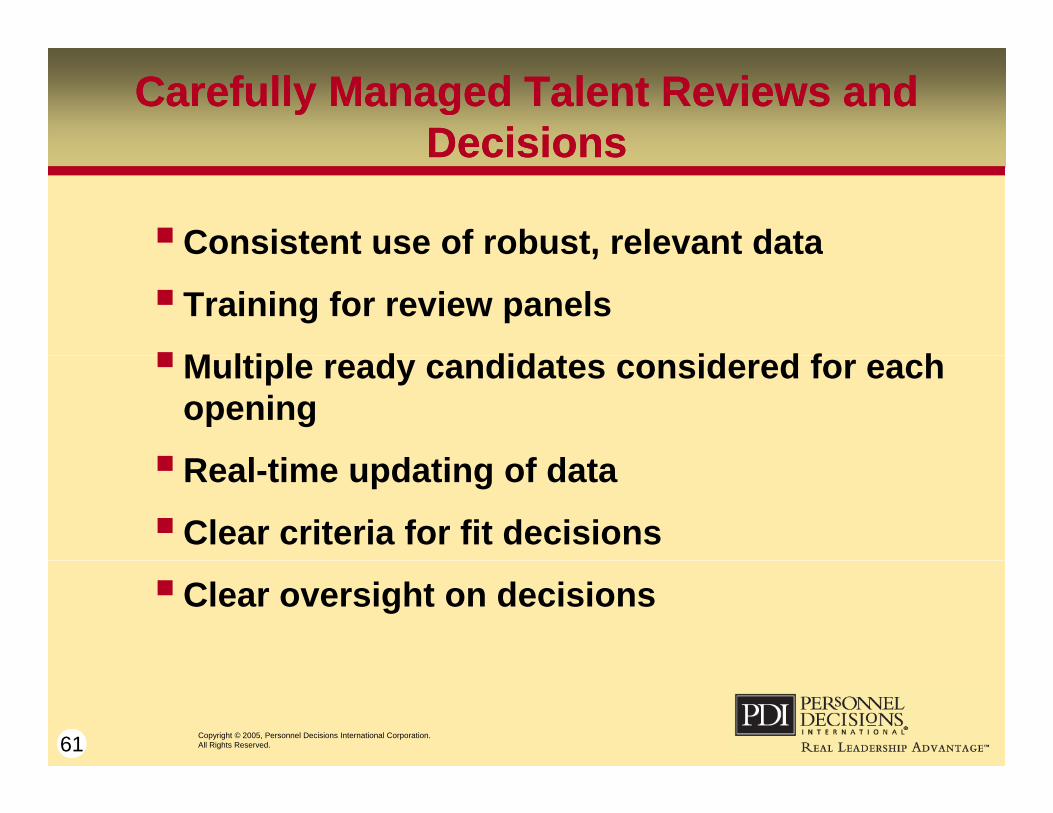
Carefully Managed Talent Reviews and Decisions
Carefully Managed Talent Reviews and DecisionsDecisionsDecisions
Consistent use of robust, relevant dataConsistent use of robust, relevant data
Training for review panels
M lti l d did t id d f hMultiple ready candidates considered for each opening
R l ti d ti f d tReal-time updating of data
Clear criteria for fit decisions
Clear oversight on decisions
61 Copyright © 2005, Personnel Decisions International Corporation. All Rights Reserved.
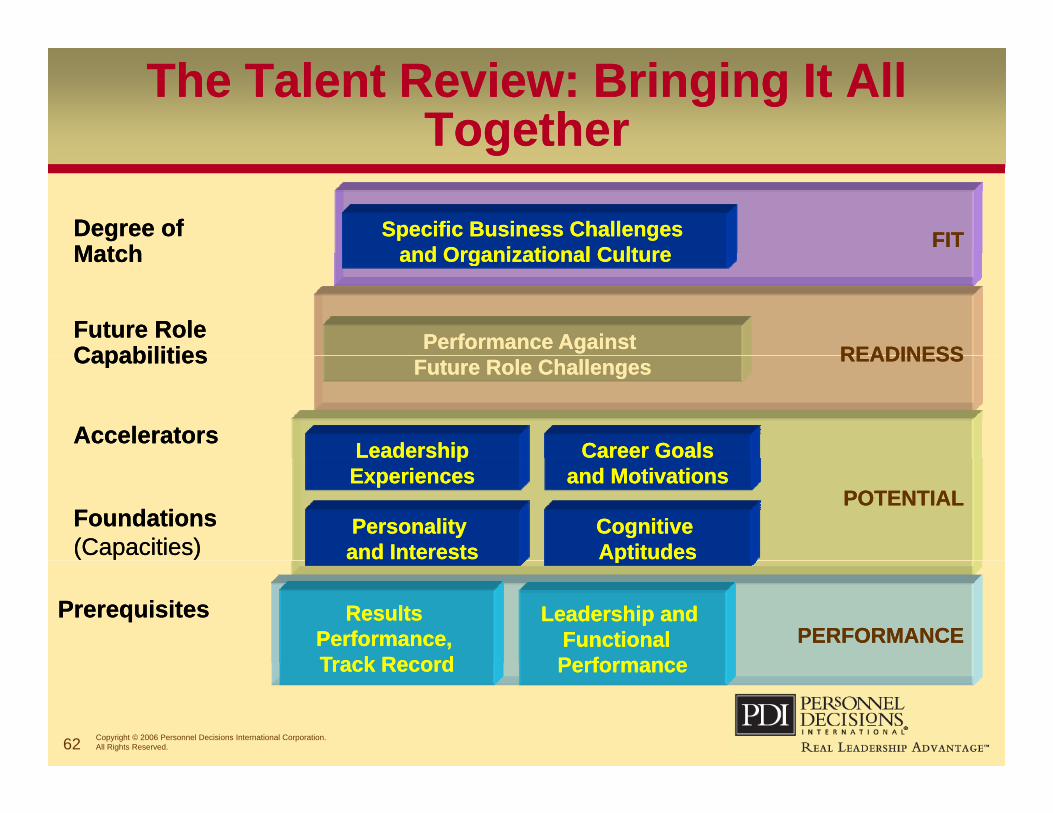
The Talent Review: Bringing It All Together
The Talent Review: Bringing It All Together
FITFITSpecific Business Challenges Specific Business Challenges and Organizational Cultureand Organizational Culture
gg
Degree of MatchDegree of Match
READINESSREADINESSPerformance Against Performance Against
and Organizational Cultureand Organizational Culture
Future Role CapabilitiesFuture Role Capabilities
MatchMatch
READINESSREADINESSFuture Role ChallengesFuture Role Challenges
LeadershipLeadership Career GoalsCareer GoalsAcceleratorsAccelerators
CapabilitiesCapabilities
POTENTIALPOTENTIALPersonality Personality and Interestsand Interests
Cognitive Cognitive AptitudesAptitudes
ppExperiencesExperiences and Motivationsand Motivations
Foundations(Capacities)Foundations(Capacities)
PERFORMANCEPERFORMANCE
pp
Results Results Performance, Performance, Track RecordTrack Record
Leadership and Leadership and Functional Functional PerformancePerformance
PrerequisitesPrerequisites
62 Copyright © 2006 Personnel Decisions International Corporation. All Rights Reserved.
Track RecordTrack Record PerformancePerformance
Key #4: Realistic, Robust Approach to Develop Talent
Key #4: Realistic, Robust Approach to Develop Talentpp
4444
63 Copyright © 2006 Personnel Decisions International Corporation. All Rights Reserved.
Development in Your OrganizationDevelopment in Your Organization
Discussion:Discussion:How does your organization develop potential?
Readiness?Readiness? What aspects of development work best? How often do people actually develop in theHow often do people actually develop in the
ways people had planned or hoped? What pitfalls are at work in your developmentWhat pitfalls are at work in your development
processes? What are the consequences of these?
64 Copyright © 2006 Personnel Decisions International Corporation. All Rights Reserved.
these?
Developing TalentDeveloping Talent
TYPICAL PITFALLS
Inadequate Perspectives:
“Just provide theJust provide the right experiences, don’t focus on competencies.”
65 Copyright © 2006 Personnel Decisions International Corporation. All Rights Reserved.
Developing TalentDeveloping Talent
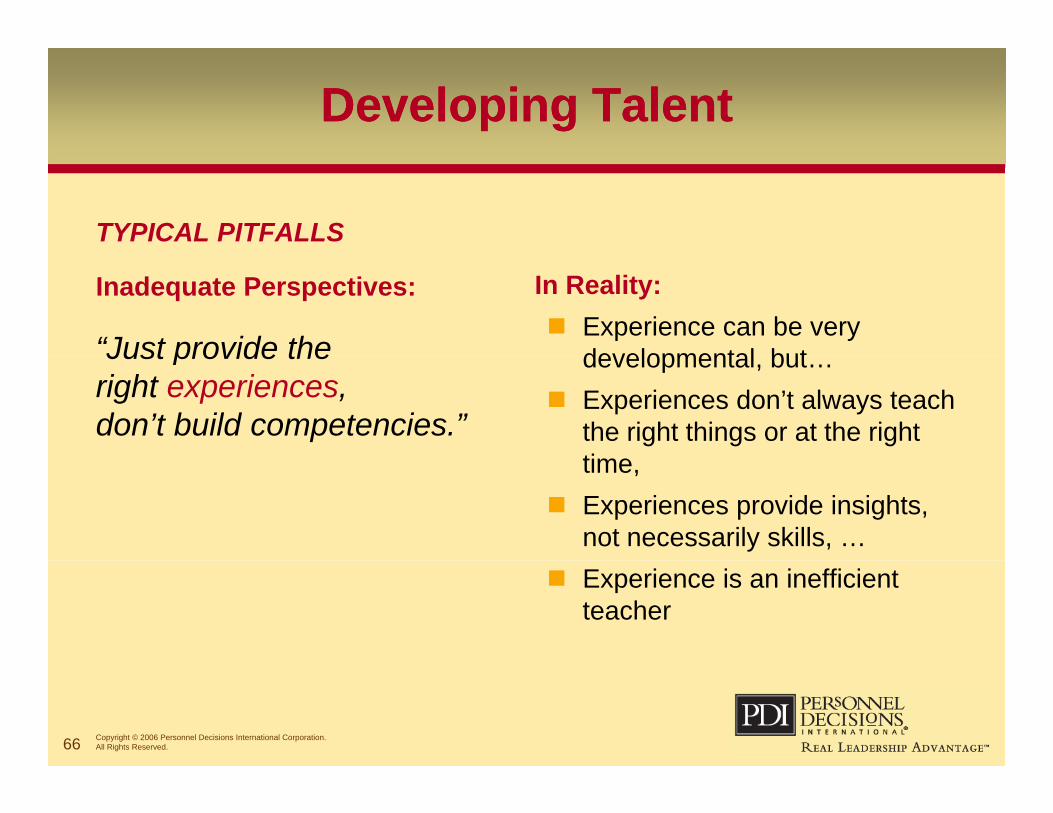
TYPICAL PITFALLS
Inadequate Perspectives:
“Just provide the
In Reality: Experience can be very
developmental butJust provide the right experiences, don’t build competencies.”
developmental, but… Experiences don’t always teach
the right things or at the right titime,
Experiences provide insights, not necessarily skills, …
Experience is an inefficient teacher
66 Copyright © 2006 Personnel Decisions International Corporation. All Rights Reserved.
Developing TalentDeveloping Talent
TYPICAL PITFALLS
Inadequate Perspectives:
“Just leverage peoples’Just leverage peoples strengths, don’t address weaknesses.”
67 Copyright © 2006 Personnel Decisions International Corporation. All Rights Reserved.

Developing TalentDeveloping Talent
TYPICAL PITFALLS
Inadequate Perspectives:
“Just leverage peoples’
In Reality: It’s very important to leverage
strengths particularly rare onesJust leverage peoples strengths, don’t address weaknesses.”
strengths, particularly rare ones However, not developing in weak
areas is risky business People don’t change their “hard-
wired” personalities or abilities, but they can and do improve their skills
d b h i l tand behavior a lot Developing weaker areas builds
versatility and reduces risk
68 Copyright © 2006 Personnel Decisions International Corporation. All Rights Reserved.
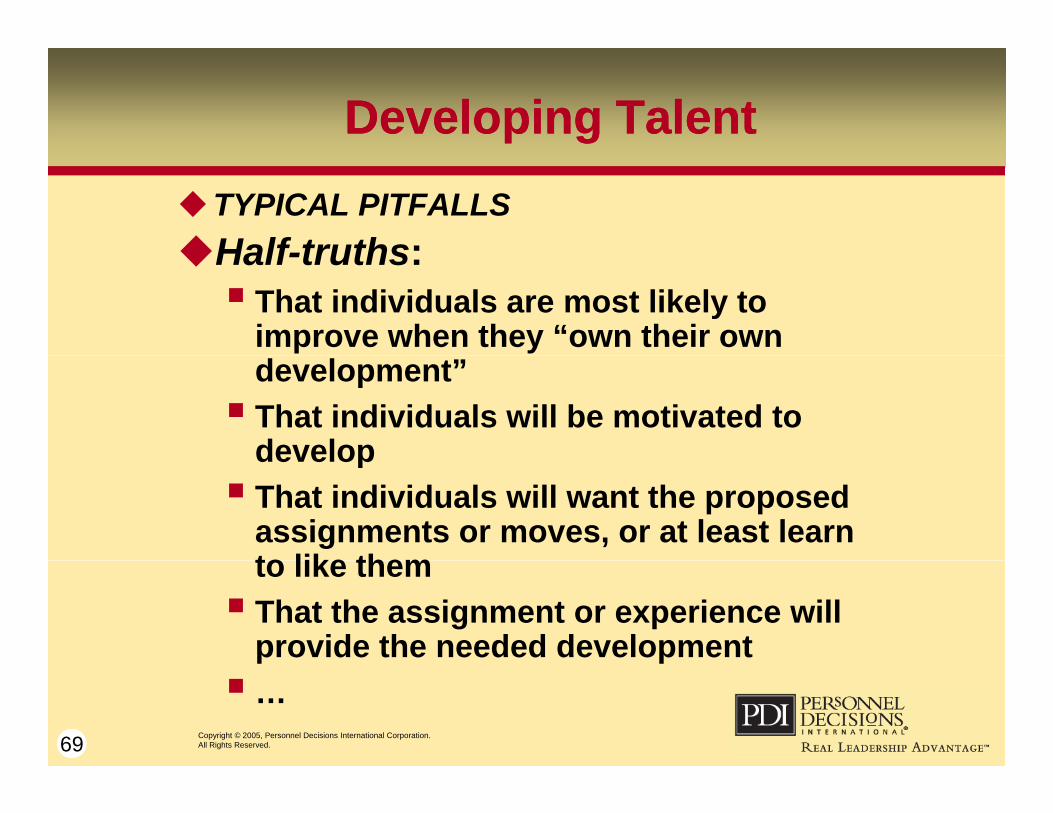
Developing TalentDeveloping TalentTYPICAL PITFALLSHalf-truths:Half-truths: That individuals are most likely to
improve when they “own their own development” That individuals will be motivated to
developdevelop That individuals will want the proposed
assignments or moves, or at least learn to like themto like them That the assignment or experience will
provide the needed development
69 Copyright © 2005, Personnel Decisions International Corporation. All Rights Reserved.
p p…
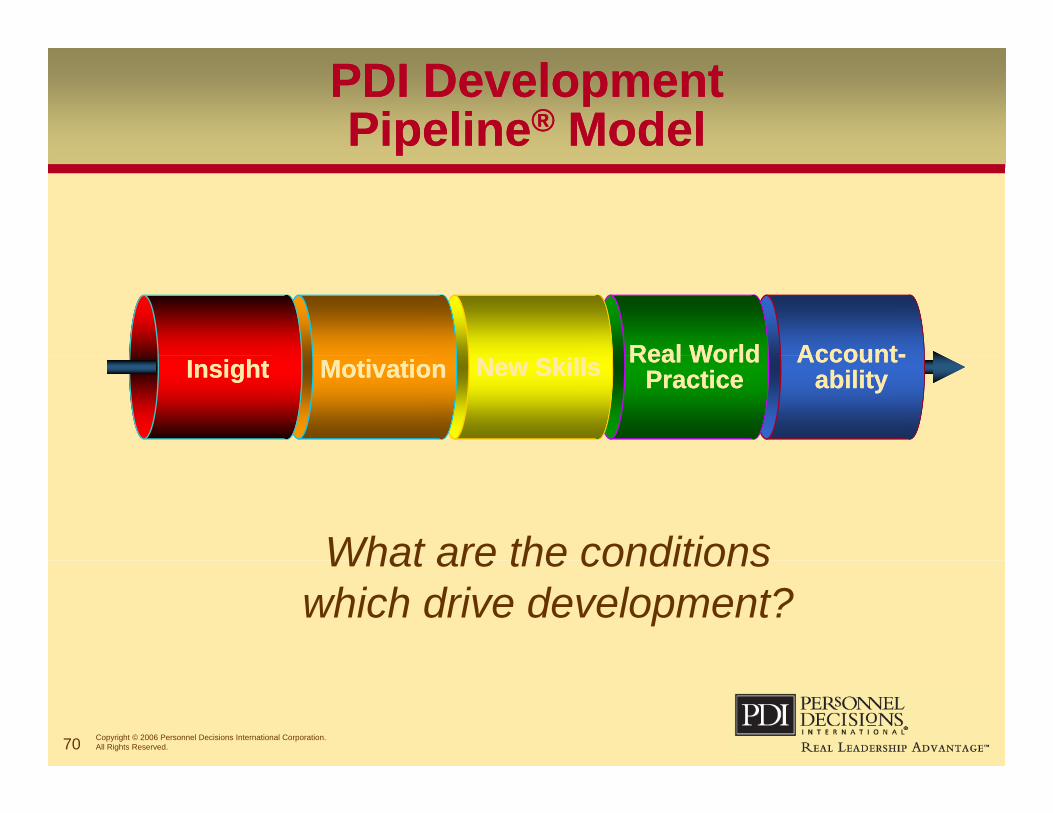
PDI Development Pipeline® Model
PDI Development Pipeline® Modelpp
Real WorldReal World Account-Account-InsightInsight New SkillsNew Skills Real WorldPractice
Real WorldPractice
Account-ability
Account-abilityMotivationMotivation
What are the conditionsWhat are the conditions which drive development?
70 Copyright © 2006 Personnel Decisions International Corporation. All Rights Reserved.

PDI Development Pipeline® Model
PDI Development Pipeline® Modelpp
Real WorldReal World Account-Account-InsightInsight New SkillsNew Skills Real WorldPractice
Real WorldPractice
Account-ability
Account-abilityMotivationMotivation
71 Copyright © 2006 Personnel Decisions International Corporation. All Rights Reserved.
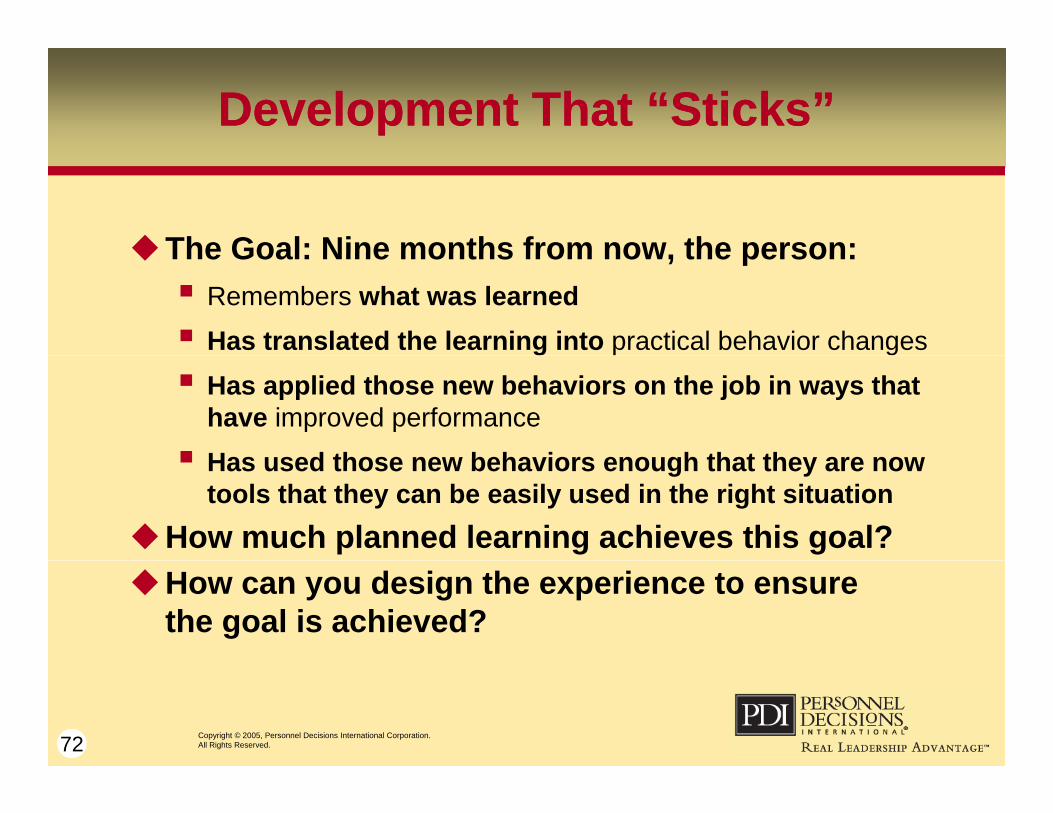
Development That “Sticks”Development That “Sticks”
The Goal: Nine months from now the person:The Goal: Nine months from now, the person: Remembers what was learned Has translated the learning into practical behavior changes
Has applied those new behaviors on the job in ways that have improved performance
Has used those new behaviors enough that they are now Has used those new behaviors enough that they are now tools that they can be easily used in the right situation
How much planned learning achieves this goal?How can you design the experience to ensure
the goal is achieved?
72 Copyright © 2005, Personnel Decisions International Corporation. All Rights Reserved.
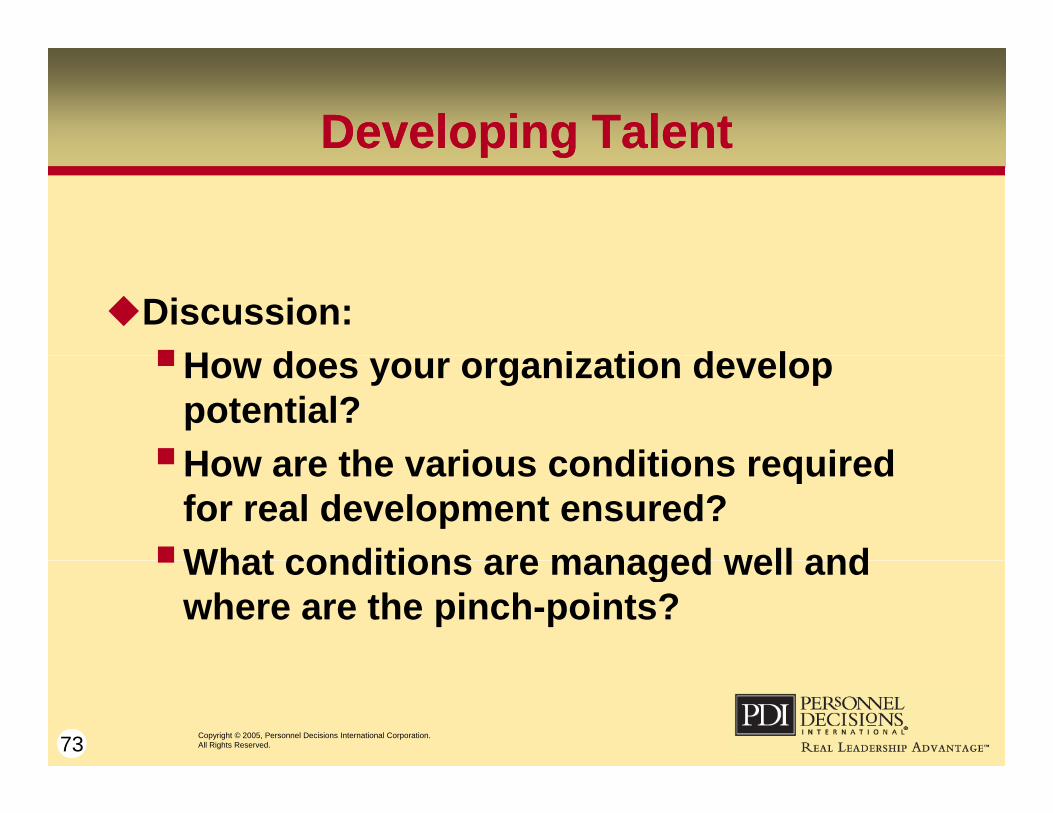
Developing TalentDeveloping Talentp gp g
Discussion:H d i ti d lHow does your organization develop
potential?How are the various conditions requiredHow are the various conditions required
for real development ensured? What conditions are managed well andWhat conditions are managed well and
where are the pinch-points?
73 Copyright © 2005, Personnel Decisions International Corporation. All Rights Reserved.
Key #5: Robust EvaluationKey #5: Robust Evaluation
5555
74 Copyright © 2006 Personnel Decisions International Corporation. All Rights Reserved.
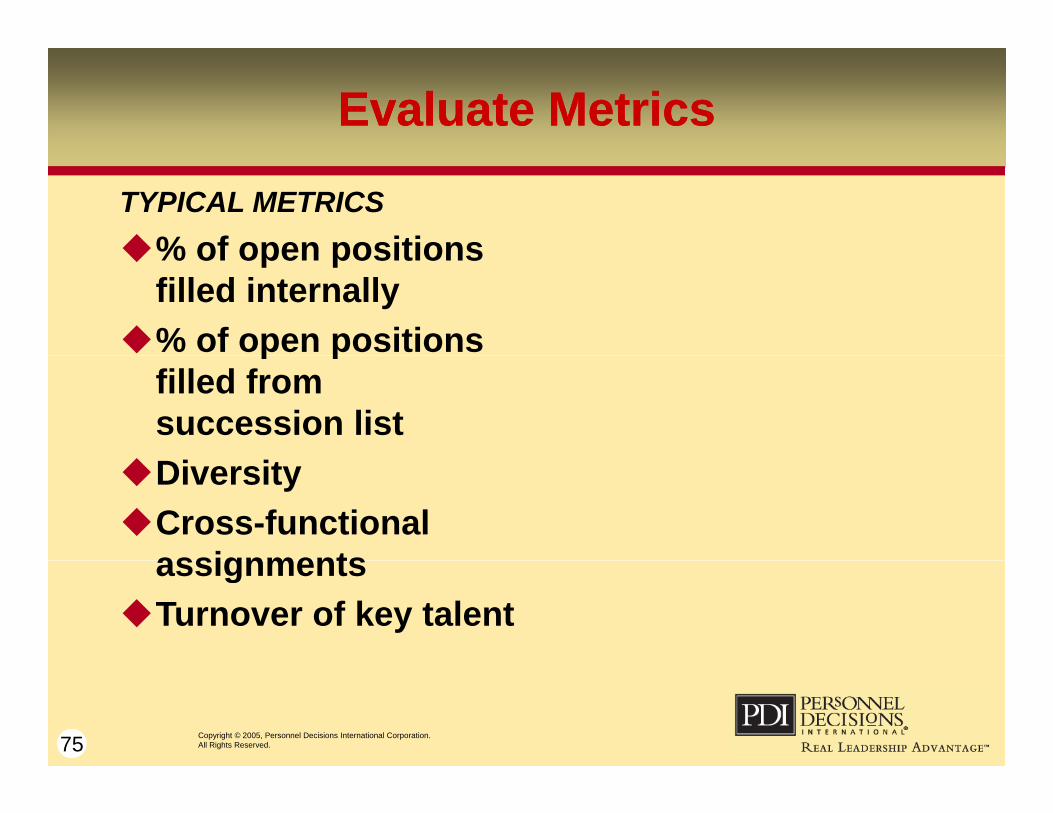
Evaluate MetricsEvaluate Metrics
TYPICAL METRICS% of open positions% of open positions
filled internally% of open positions p p
filled from succession list
DiversityCross-functional
assignmentsassignmentsTurnover of key talent
75 Copyright © 2005, Personnel Decisions International Corporation. All Rights Reserved.
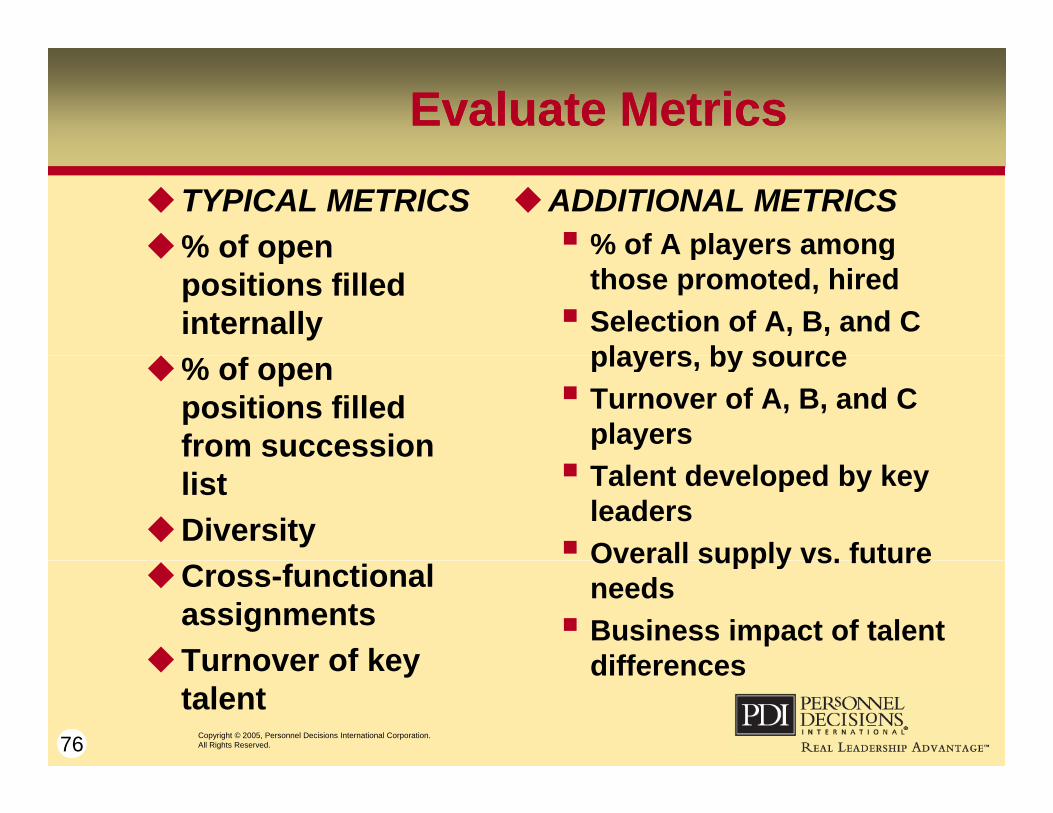
Evaluate MetricsEvaluate Metrics
TYPICAL METRICS% of open
ADDITIONAL METRICS % of A players among% of open
positions filled internally
% of A players among those promoted, hired Selection of A, B, and C
players by source% of open positions filled from succession
players, by source Turnover of A, B, and C
players
listDiversity
Talent developed by key leaders Overall supply vs. future
Cross-functional assignments
Turnover of key
Overall supply vs. future needs Business impact of talent
differences
76 Copyright © 2005, Personnel Decisions International Corporation. All Rights Reserved.
Turnover of key talent
differences
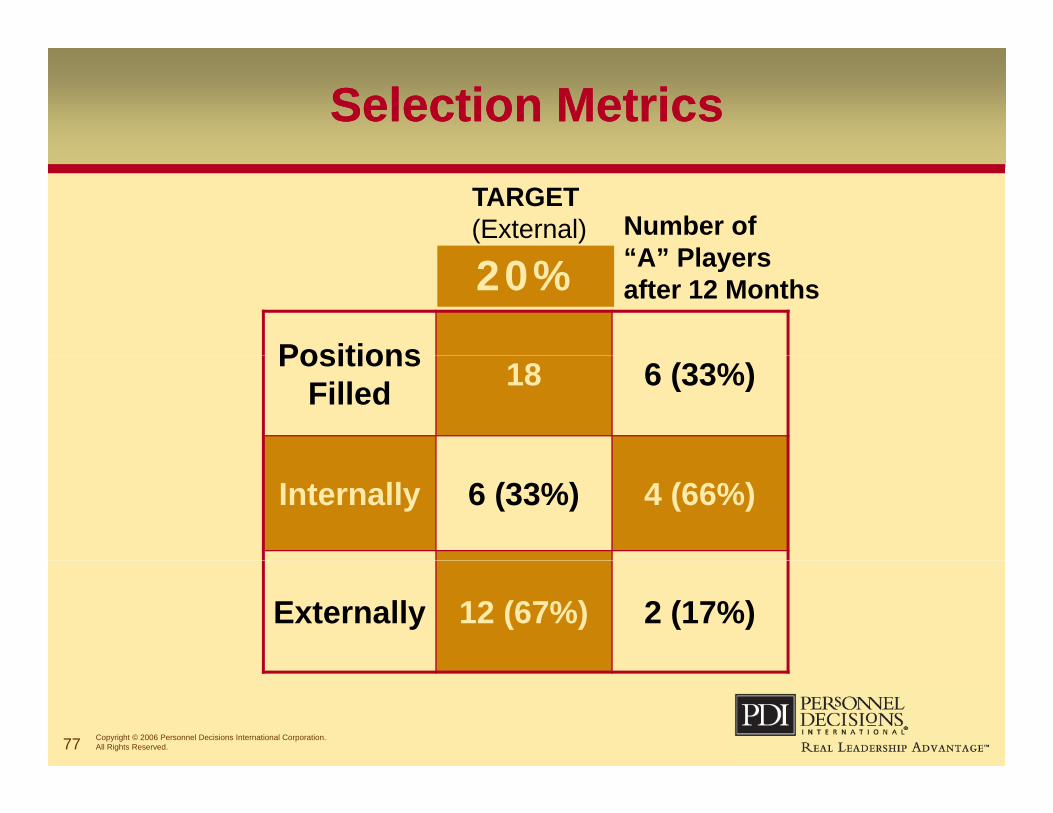
Selection MetricsSelection Metrics
Number of “A” Players
TARGET(External)
“A” Players after 12 Months
Positions
20%
Positions Filled 18 6 (33%)
Internally 6 (33%) 4 (66%)
Externally 12 (67%) 2 (17%)
77 Copyright © 2006 Personnel Decisions International Corporation. All Rights Reserved.
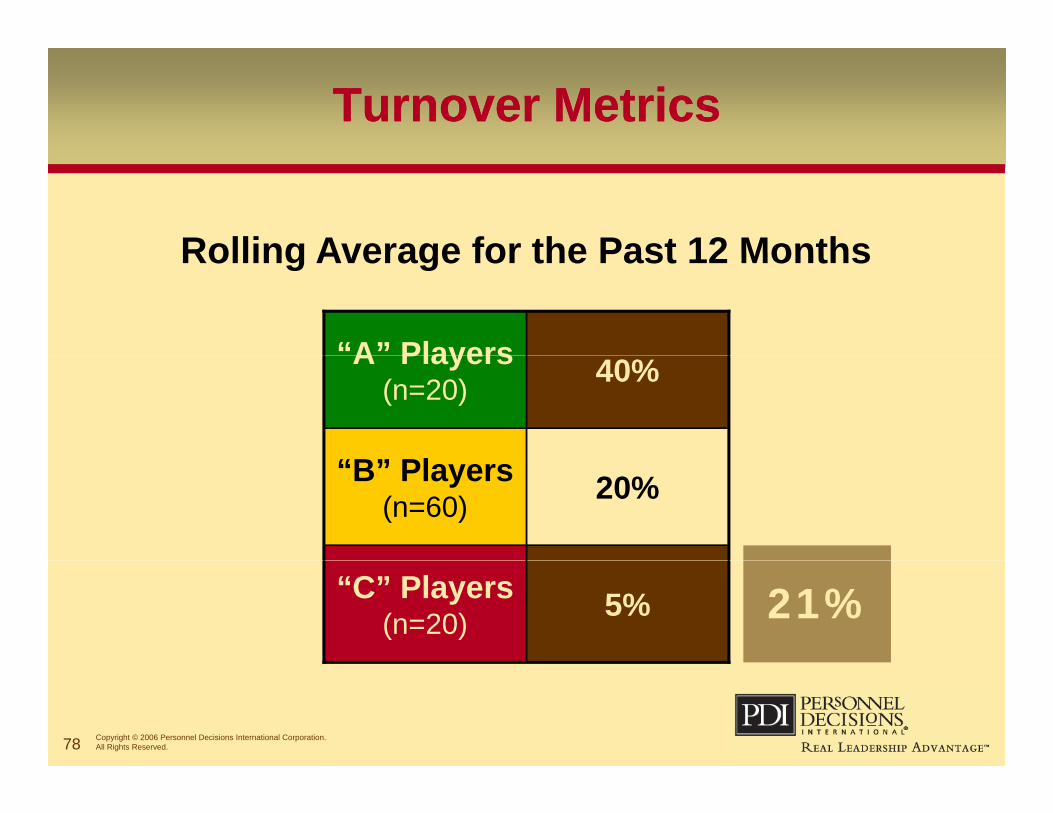
Turnover MetricsTurnover Metrics
Rolling Average for the Past 12 Months
“A” Players
Rolling Average for the Past 12 Months
“
40%A Players(n=20)
20%“B” Players(n=60)
5%“C” Players(n=20) 21%
78 Copyright © 2006 Personnel Decisions International Corporation. All Rights Reserved.
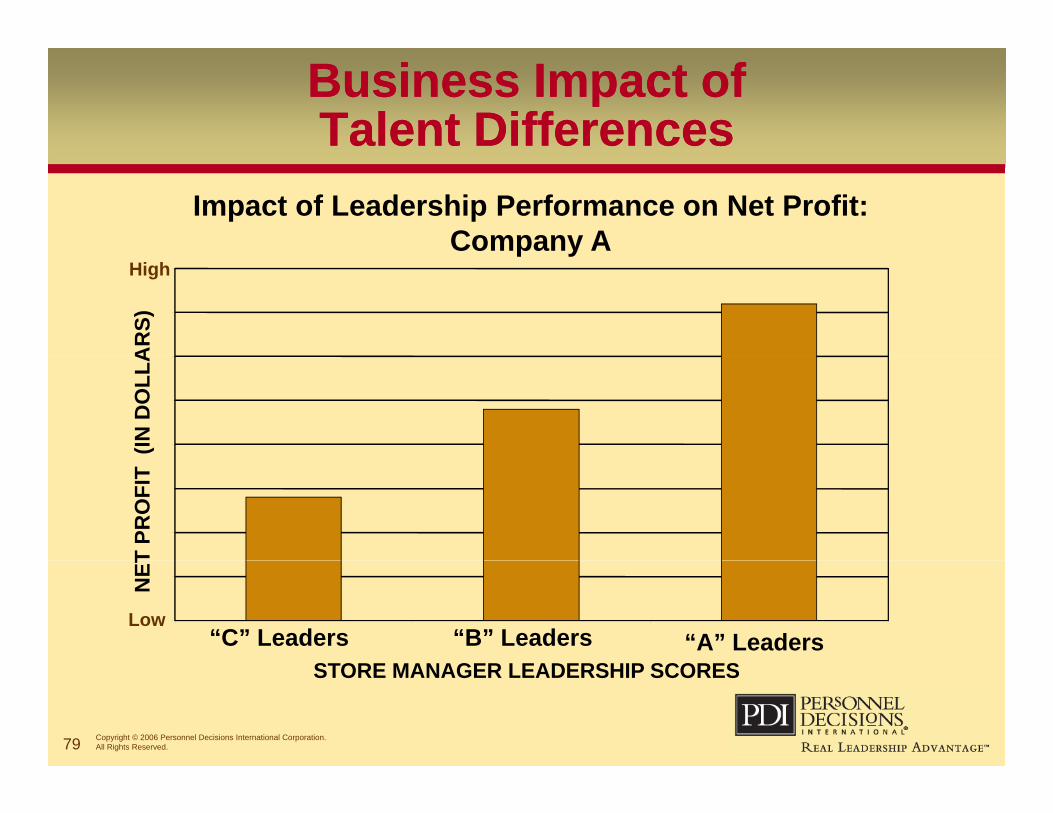
Business Impact of Talent DifferencesBusiness Impact of Talent Differences
Impact of Leadership Performance on Net Profit: Company Ap y
AR
S)
High
(IN D
OLL
AT
PRO
FIT
N
ET
Low“A” Leaders
STORE MANAGER LEADERSHIP SCORES“B” Leaders“C” Leaders
79 Copyright © 2006 Personnel Decisions International Corporation. All Rights Reserved.
STORE MANAGER LEADERSHIP SCORES
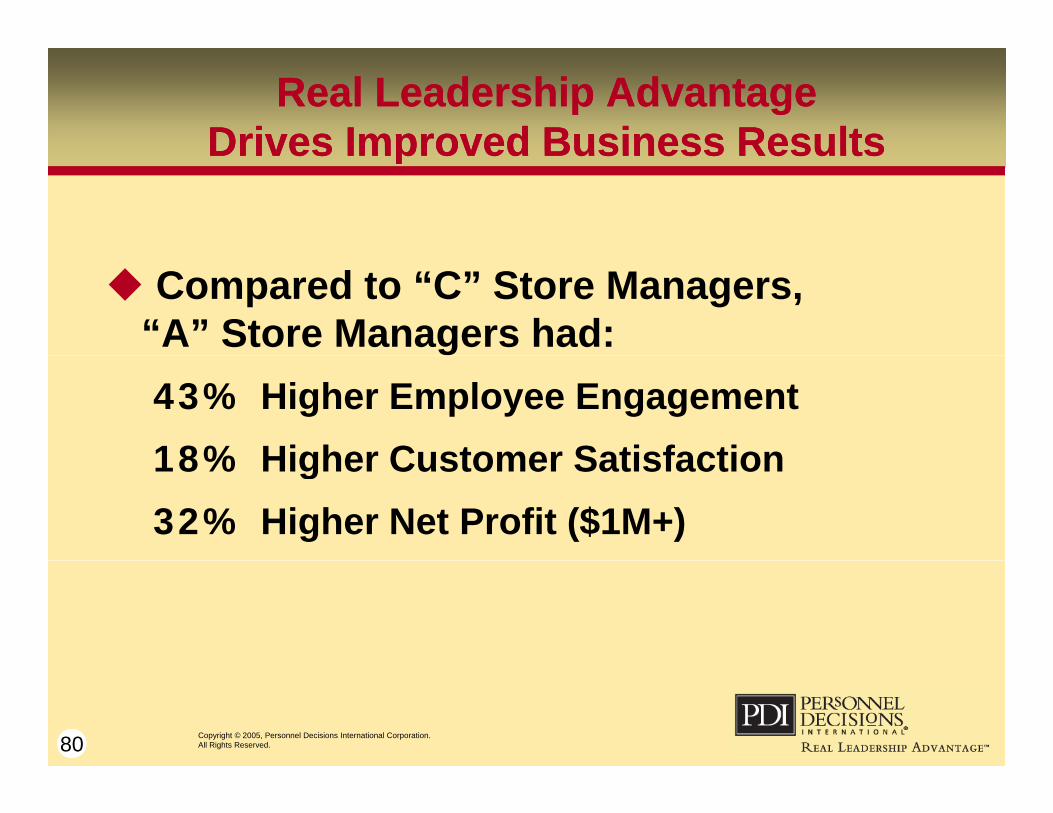
Real Leadership Advantage Drives Improved Business Results
Real Leadership Advantage Drives Improved Business ResultsDrives Improved Business ResultsDrives Improved Business Results
Compared to “C” Store Managers, “A” Store Managers had:43% Higher Employee Engagement18% Higher Customer Satisfaction18% Higher Customer Satisfaction32% Higher Net Profit ($1M+)
80 Copyright © 2005, Personnel Decisions International Corporation. All Rights Reserved.
Key #6: Core Principles, Policies, and Frameworks
Key #6: Core Principles, Policies, and Frameworks
6666
81 Copyright © 2006 Personnel Decisions International Corporation. All Rights Reserved.
Core Principles, Policies, and Frameworks
Core Principles, Policies, and Frameworks
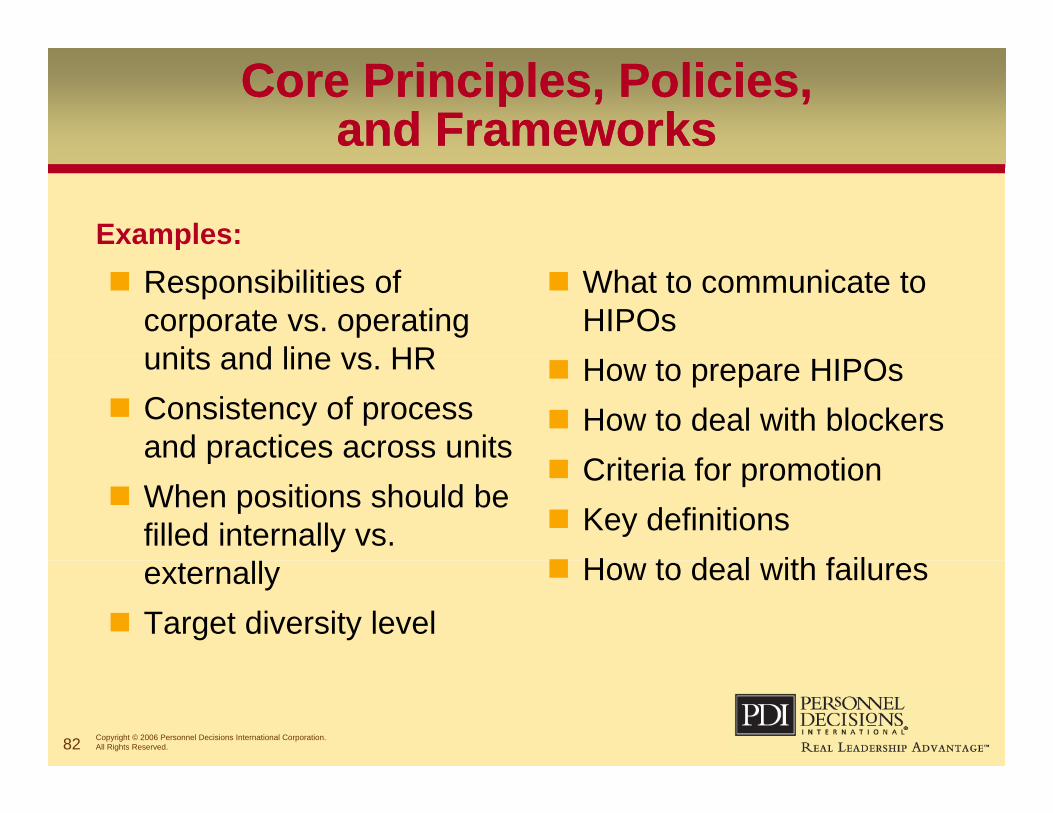
Examples: Responsibilities of
corporate vs. operating units and line vs HR
What to communicate to HIPOs
units and line vs. HR Consistency of process
and practices across units
How to prepare HIPOs How to deal with blockers
C i i f ip
When positions should be filled internally vs.
Criteria for promotion Key definitions H t d l ith f ilexternally
Target diversity level
How to deal with failures
82 Copyright © 2006 Personnel Decisions International Corporation. All Rights Reserved.

Core Principles, Policies, and Frameworks
Core Principles, Policies, and Frameworksand Frameworksand Frameworks
Typical consequences when theyTypical consequences when they are absent: Inconsistency lack of integrationInconsistency, lack of integration InefficiencyConfusionConfusion ConsternationC fli tConflictSub-optimization
83 Copyright © 2005, Personnel Decisions International Corporation. All Rights Reserved.
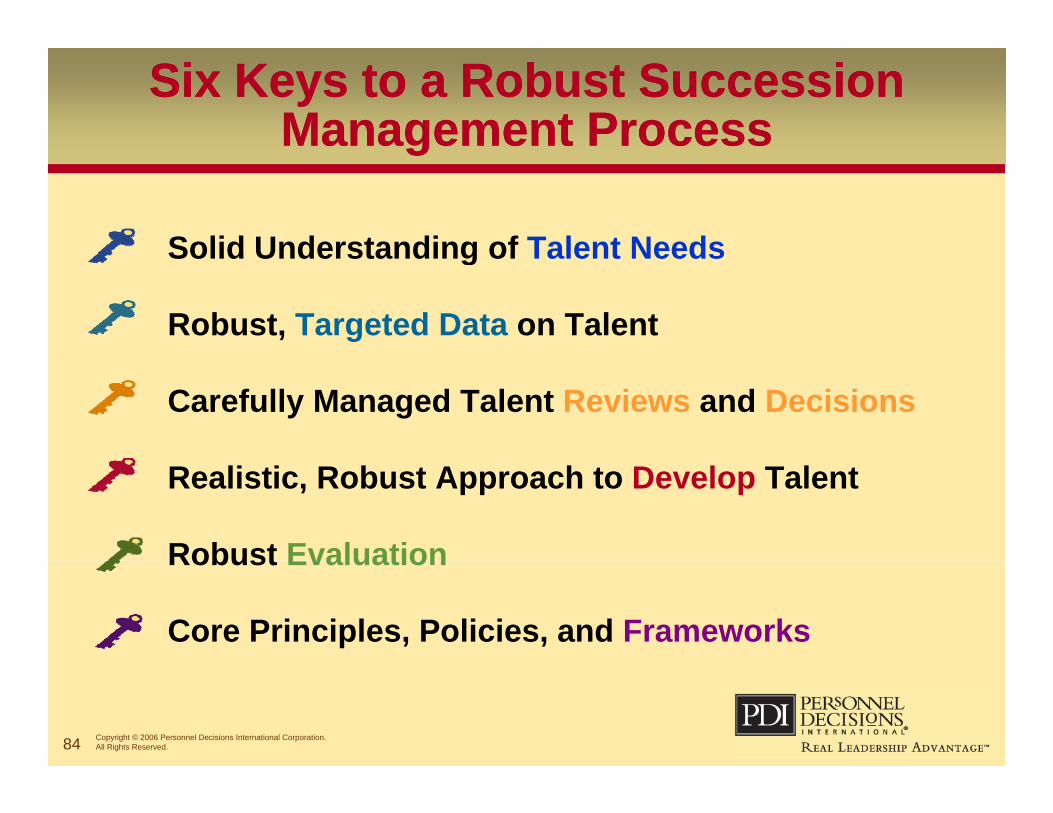
Six Keys to a Robust Succession Management Process
Six Keys to a Robust Succession Management Processgg
Solid Understanding of Talent NeedsSolid Understanding of Talent Needs
Robust, Targeted Data on Talent
Carefully Managed Talent Reviews and Decisions
Realistic, Robust Approach to Develop Talent
Robust EvaluationRobust Evaluation
Core Principles, Policies, and Frameworks
84 Copyright © 2006 Personnel Decisions International Corporation. All Rights Reserved.

Program RoadmapArapahoe County
Program RoadmapArapahoe County
1:1 mentorconversations/check in
Online, Blended Learning Courses
Planning Sessions Program Assessment(s)
Execute Action Plan• Coaching• Active Leader• Action Learning • On the Job Assignments • Learning Resources• Transfer to Work
Sessions Road Map Participant Selection
ProgramLaunch
Assessment(s)• Profilor
• Inventories• Simulations
INDIVIDUAL: Feedback & Action Planning
• Application• TLT
• Supervisor input
• Interview?
GROUP: Analyze Group Strengths and
Dev Areas
Accountability: Time2Change
Classroom/Workshops/Training
Executive Sponsorship - check in
85 85
Action :earning,Learning Communities/Cohort Support
Potential Program ComponentsPotential Program Components
Blended Learning coursesBlended Learning courses Mentoring
360° F db k 360° Feedback Individual development planning Action Learning
86 86
Thank youThank you
87 Copyright © 2005, Personnel Decisions International Corporation. All Rights Reserved.