Public Private Partnerships in Urban Water Supply · Gourishankar Ghosh. IAS (Retd.), Former...
71
1| Public Private Partnerships in Urban Water Supply Potential and Strategies Public Private Partnerships in Urban Water Supply
Transcript of Public Private Partnerships in Urban Water Supply · Gourishankar Ghosh. IAS (Retd.), Former...

1| P u b l i c P r i v a t e P a r t n e r s h i p s i n U r b a n W a t e r S u p p l y
Potential and Strategies
Public Private Partnerships
in Urban Water Supply

ii| P u b l i c P r i v a t e P a r t n e r s h i p s i n U r b a n W a t e r S u p p l y i n I n d i a

iii| P u b l i c P r i v a t e P a r t n e r s h i p s i n U r b a n W a t e r S u p p l y i n I n d i a
© All Rights Reserved, Athena Infonomics
The information contained in this report prepared by Athena Infonomics India Pvt. Ltd. is furnished for
information purposes only. While every effort has been made to ensure the accuracy of information
presented in the report, Athena Infonomics India Pvt. Ltd. makes no representations or warranties regarding
the accuracy or completeness of such information and expressly disclaims any liabilities based on such
information or on omissions there from. The material presented in the report can be used in academic or
professional work with appropriate citation.

iv| P u b l i c P r i v a t e P a r t n e r s h i p s i n U r b a n W a t e r S u p p l y i n I n d i a
This report has been prepared with support from the British High Commission,
through its Prosperity Fund, India Programme

v| P u b l i c P r i v a t e P a r t n e r s h i p s i n U r b a n W a t e r S u p p l y i n I n d i a

vi| P u b l i c P r i v a t e P a r t n e r s h i p s i n U r b a n W a t e r S u p p l y i n I n d i a
CONTENTS
Contents ................................................................................................................................................ vi
List of Exhibits ...................................................................................................................................... vii
List of Figures ....................................................................................................................................... vii
List of Boxes......................................................................................................................................... viii
Acknowledgements ............................................................................................................................... ix
Methodology .......................................................................................................................................... x
Abbreviations ........................................................................................................................................ xi
Executive Summary ............................................................................................................................. xiii
1. Evolution of Urban Water Supply Sector ............................................................................................ 0
1.1 URBAN Water Supply Sector in India .......................................................................................... 0
1.2 Institutional Framework .............................................................................................................. 0
1.3 Policy Framework ........................................................................................................................ 5
1.4 Water Supply Value Chain ........................................................................................................... 7
1.5 Chronicle of Public Private Partnerships in Urban Water Supply ................................................ 8
2. Current State of the Urban Water Sector ......................................................................................... 12
2.1 Service Level Benchmarks ......................................................................................................... 12
2.3 Non-Revenue Water (NRW) ...................................................................................................... 16
3. Future Potential for PPPs in Urban Water ........................................................................................ 19
3.1 Future Investment Requirements ............................................................................................. 19
3.2 Sources of Financing ................................................................................................................. 22
4. Strategic Framework for successful PPPs in Urban Water Sector ..................................................... 24
4.1 Role of Public Sector ................................................................................................................. 25
4.2 Role of Private Sector .............................................................................................................. 27
4.3 Community Participation ......................................................................................................... 27
4.4 Risk Allocation ......................................................................................................................... 30
4.5 Financial Sustainability ............................................................................................................ 31
5. Conclusion ....................................................................................................................................... 33
Appendix I │Case Studies ..................................................................................................................... 34
1. The Tirupur Water Supply Project ............................................................................................... 34

vii| P u b l i c P r i v a t e P a r t n e r s h i p s i n U r b a n W a t e r S u p p l y i n I n d i a
2. The Karnataka Urban Water Supply Improvement Project ......................................................... 39
3. The Khandwa Water Supply Project ............................................................................................ 47
References ............................................................................................................................................ 53
LIST OF EXHIBITS
Exhibit 1.1:Institutional Framework of Urban Water Sector .................................................................... 1
Exhibit 1.2: Components of JnNURM ...................................................................................................... 2
Exhibit 1.3: Sample Institutional Structure of a State (Tamil Nadu) ......................................................... 4
Exhibit 1.4: Broadening Scope of National Water Policy ......................................................................... 6
Exhibit 1.5: Value Chain of Urban Water Supply ...................................................................................... 8
Exhibit 1.6: Evolution of Private Sector Participation in the Urban Water Sector .................................... 9
Exhibit 2.1: Service Level Benchmarks and Average Performance of ULBs ........................................... 13
Exhibit 2.2: Potential Annual Revenue Lost due to Non-Revenue Water ............................................... 18
Exhibit 4.1: Strategic Framework for Successful PPP Implementation .................................................. 25
Exhibit 4.2: Stakeholder Map of Byrraju Foundation Model of Drinking Water Supply .......................... 28
LIST OF FIGURES
Figure 1.1: UIG Funds Allocation ............................................................................................................. 3
Figure 1.2: UIDSSMT Funds Allocation .................................................................................................... 3
Figure 1.3: Investment Outlay and Source of Financing Urban Infrastructure in the 11th Plan ................ 11
Figure 2.1: Sources of Drinking Water for India's Urban Households ..................................................... 15
Figure 2.2: Sources of Drinking Water in India (2011) ............................................................................ 16
Figure 2.3: Non Revenue Water Supply in a Typical Urban City in India ..................................................17
Figure 3.1: Investment Requirements in the Urban Water Sector (In Rs. Crores) ................................... 19
Figure 3.2: Total Investments Required for Sewage Systems ................................................................ 19
Figure 3.3: Per Capita Investment Required for Different City Classes (In Rs.) ....................................... 20

viii| P u b l i c P r i v a t e P a r t n e r s h i p s i n U r b a n W a t e r S u p p l y i n I n d i a
Figure 3.4: Investment Requirement in Class IA and IB Cities ................................................................ 22
Figure 3.5: Sources of Financing ............................................................................................................ 23
LIST OF BOXES
Box 1.1: Regulatory Institutions............................................................................................................... 5
Box 1.2: 24x7 Water Supply is Possible .................................................................................................. 10
Box 4.3: Water Health Centers .............................................................................................................. 30
Box 4.4: Pricing of Water....................................................................................................................... 32

ix| P u b l i c P r i v a t e P a r t n e r s h i p s i n U r b a n W a t e r S u p p l y i n I n d i a
ACKNOWLEDGEMENTS
This report would not have been possible without the cooperation of experts and practitioners of Public
Private Partnerships in the Urban Water Sector of India. Their willingness to share their experiences has
helped us ground this report in practical insights.
In particular we would like to thank all the participants at the ‘National Conference on Public Private
Partnerships in Urban Water Sector’, held in Chennai on 20th March, 2012. These include, Dr. K.P.
Krishnan, Secretary, Economic Advisory Council to the Prime Minister of India; Mr. Suresh Prabhakar
Prabhu, Member of Parliament & Former Chairman, Task Force for Interlinking of Rivers; Mr. S.
Krishnan (IAS), Secretary to Government, Finance Department (Expenditure), Government of Tamil
Nadu; Prof. Ashwin Mahalingam, Assistant Professor, IIT Madras; Mr. R. Raghuttama Rao, Managing
Director, ICRA Management Consulting Services Ltd.; Prof. V. Srinivas Chary, Director, Centre for
Energy, Environment, Urban Governance, Administrative Staff College of India; Mr. K.. Rajivan, IAS
(Retd.), Former Managing Director & CEO, Tamil Nadu Urban Infrastructure Financial Services Ltd.; Mr.
A. Rajagopal, Project Director, PRIA Foundation for Research & Development; Mr. Anand Madhavan,
Head – Urban and Infrastructure Finance, ICRA Management Consulting Services Ltd.; Mr.
Gourishankar Ghosh. IAS (Retd.), Former Executive Director, Water Supply and Sanitation
Collaborative Council, WHO, Geneva; Mr. VibhuNayar, IAS, Project Director, Irrigated Agriculture
Modernization & Water Bodies Restoration and Management and Ex-Officio Secretary, Public Works
Department, Government of Tamil Nadu; Mr. R. Ragunathan, Chairman, Indian Water Works
Association, Chennai Centre; Mr. Madhu Krishnamoorthy, Head – Business Development, Water Health
India Private Limited; Ms. Aparna Rajkumar, Member, Siruthuli, Coimbatore; Ms. Thangam
Sankaranarayanan, IAS (Retd.), Chairman, New Tirupur Area Development Corporation Ltd.; Mr.
Raman, IAS, Former Chairman and Managing Director, Ennore Port Ltd.; Mr. K.A. Joseph, Regional
Director, Veolia Water India Pvt. Ltd; Mr. J. Venkatesh, Deputy General Manager, Fitchner Consulting
Engineers India Private Ltd.; Mr. L.V. Keshav, Director, Ion Exchange Enviro Farms Ltd. and Mr. Pranab
Kumar Majumdar, General Manager, VA Tech Wabag Ltd.
We would also like to thank Mr. M. J. R. Chowdary, Zonal Manager, Veolia Water India Private Ltd. and
Mr. K.S.N. Rao, Vice President (Projects), Vishwa Infrastructures.

x| P u b l i c P r i v a t e P a r t n e r s h i p s i n U r b a n W a t e r S u p p l y i n I n d i a
METHODOLOGY
This study began with extensive research on existing literature concerning different facets of the urban
water sector in India. This encompassed the evolution of urban water supply and sewerage practices in
India, the changes in the policy & institutional framework and the underlying problems in the sector,
with special emphasis on the role of Public Private Partnerships in the delivery of urban water supply In
order to assess the challenges and opportunities associated with the use of Public Private Partnership
models in Urban Water supply, a series of experts such as the private concessionaires, operators,
financiers, academicians, transaction advisors and among others were interviewed in addition to the
collection and analysis of secondary information from previous case studies and documents.Further, to
understand the potential and strategies for such public private partnership models in the urban water
supply and sewerage sector, a national conference on ‘Public- Private Partnerships in Urban Water
Supply’ was conducted on 20th March 2012 in Chennai. 25 experts including policy makers, private
water management companies, consultants, financial institutions, and non – profit organizations
presented their thoughts and shared their experiences in this sector. There were four panel discussions
on different themes, focusing on policies and governance issues, financial sustainability of the project,
relevance of community participation and project procurement and implementation issues. This report
is an output of the various efforts described above.

xi| P u b l i c P r i v a t e P a r t n e r s h i p s i n U r b a n W a t e r S u p p l y i n I n d i a
ABBREVIATIONS
BOT Build-Operate-Transfer
CPHEEO Central Public Health Environment and Engineering Organization
DBFOT Design-Build-Finance-Operate-Transfer
DSRF Debt Service Reserve Fund
EPC Engineering-Procurement-Construction
GoI Government of India
GoK Government of Karnataka
GoMP Government of Madhya Pradesh
GoTnN Government of Tamil Nadu
HPEC High Powered Expert Committee
HUDCO Housing & Urban Development Corporation
IBRD International Bank for Reconstruction and Development
IRR Internal Rate of Return
JnNURM Jawaharlal Nehru National Urban Rural Mission
KMC Khandwa Municipal Corporation
KUIDFC Karnataka Urban Infrastructure Development Finance Corporation
KUWASIP Karnataka Urban Water Supply Infrastructure Project
KUWSDB Karnataka Urban Water Supply & Drainage Board
Lpcd Liters per capita per day
MLD Million Liters per Day
MoU Memorandum of Understanding
MoUD Ministry of Urban Development
NRW Non-Revenue Water
NTADCL New Tirupur Area Development Company Limited
O&M Operations & Management/Maintenance
PCI Per Capita Investments
PI Priority Investments
PPCP Public Private Community Partnership
PPP Public Private Partnership
PSP Private Sector Participation
SICS Social Intermediation & Communication Strategy
SLB Service Level Benchmark
SPV Special Purpose Vehicle
TACID Tamil Nadu Corporation for Industrial Infrastructure Development
TADP Tirupur Area Development Project
TAP Transparency Accountability Participation
TEA Tirupur Exporters Association
TMC Tirupur Municipal Corporation
TNUDF Tamil Nadu Urban Development Fund
TWIC Tamil Nadu Water Investment Company
UIDSSMT Urban Infrastructure Development Scheme in Small and Medium Towns
ULB Urban Local Body
WSPF Water Shortage Period Fund

xii| P u b l i c P r i v a t e P a r t n e r s h i p s i n U r b a n W a t e r S u p p l y i n I n d i a
Public Private Partnerships in
Urban Water Sector
Potential and Strategies
Public Policy Team, Athena Infonomics
Arslan Aziz
Saloni Ketan Shah
May, 2012

xiii| P u b l i c P r i v a t e P a r t n e r s h i p s i n U r b a n W a t e r S u p p l y i n I n d i a
EXECUTIVE SUMMARY
Urban Water Supply in India
The state of the urban water sector in India is
abysmal – a study undertaken by the Ministry
of Urban Development (MoUD) on a sample of
28 cities observed that most cities received an
average of 3.3 hours of water per day compared
to a benchmark of 24 hours and also scored
poorly on parameters such as coverage, quality
and efficiency.
With urbanization rates expected to witness a
steep rise, the problem of delivering reliable
and affordable water supply services in urban
areas is expected to further deteriorate.
Observations from secondary research display
that the number of urban households, in India,
grew at a Compounded Annual Growth Rate
(CAGR) of 3.92% between 2001 and 2011. The
recently released National Sample Survey
Organisation (NSSO),2011 data on household
amenities shows that in order to meet the
requirement of the additional households over
the last decade, the provision of drinking water
via different sources increased at a CAGR of 4.2
% for tap water, 1.69 % for well water, 3.62 %
from hand pumps and tube wells and 4.9 %
from other sources1. Even though the number
of access points for tap water has exhibited a
higher growth rate than the rate of growth of
urban households, only 60-70% of the
households in the urban areas have access to
tap water. This implies that while the number
of urban households has been growing at 3.9%
per annum, on average the provision of
1Other sources of water include spring water, river/canal,
ponds, lakes, private tanks and bottled water.
drinking water grew by 3.6% per annum 2 ,
resulting in a growing deficit in the provision of
urban drinking water supply.
Another standard indicator used to assess the
state of urban water supply is the percentage of
water produced that does not reach the end
consumers also popularly known as Non-
Revenue Water (NRW). On an average, the
extent of non-revenue water (NRW) in India is
44.1%. This is much higher than the NRW of
15% in developed countries and the 20% that is
set as the benchmark for Indian cities by the
MoUD. These statistics, among others, point to
the need for a significant intervention in the
urban water supply sector, to improve resource
allocation, enhance service delivery and alter
the current management paradigm.
Institutional Initiatives
In India, the implementation of the water policy
through programs and schemes identified by
the central government, such as development
of water infrastructure, operating, maintaining
and regulating the water supply system and
setting and collecting water tariffs, is carried
out by the state governments and by parastatal
agencies such as the Urban Local Bodies
(ULBs). However the devolution of the
responsibility for urban governance to urban
local bodies has not happened to the extent
desired, which has led to the performance
improvement being limited or absent. This in-
turn traces itself to the lack of adequate
capacity building and the non-accountability of
2 Source: NSSO Data (2011) MOSPI, GOI.

14| P u b l i c P r i v a t e P a r t n e r s h i p s i n U r b a n W a t e r S u p p l y i n I n d i a
urban local bodies in implementing reforms
successfully. While the central government has
attempted to drive the necessary reforms
through conditional allocation of funds through
the Jawaharlal Nehru National Urban Renewal
Mission (JnNURM) program, a revised and
upgraded JnNURM, with additional guidelines
for ULB reforms that are aligned to the new
Water Policy 3 , currently in the draft form,
would be necessary to provide a much needed
impetus for achieving Service Level
Benchmarks in water supply and sewerage. .
Public Private Partnerships: An Alternate tool
Public Private Partnerships (PPPs) are complex
arrangements involving multiple stakeholders
with divergent interests. Before embarking on a
project through the PPP mode, the project
objectives must be set through a careful
assessment of the current state of physical
infrastructure and the level of service delivery
and achievement of service level benchmarks in
a phased manner must be planned in detail.
Next, the roles of the different stakeholders in a
PPP – government, private sector, community,
financiers, consultants etc. - need to be clearly
defined and enforced through an incentive and
penalty structure that aligns with project
objectives. Viability of the project and
appropriate risk allocation and mitigation
mechanisms must be put in place.
3 The policy framework governing the usage of water and
development of the requisite infrastructure has evolved and broadened over the years. The current draft National Water Policy, broader in scope than earlier versions, recommends treating water as two distinct goods based on its usage – a minimum quantity per capita that is necessary for subsistence should be provided at a heavily subsidized rate or for free, while water over and above this is treated as a scarce economic good with a corresponding price
A successful PPP project in the water and
sewerage sector would require that the entire
capital costs, and as much of the operating
costs as possible, be covered by central and
state grants. Under the JnNURM, the total
availability of funds depends on the size of the
city. The deficit can be generated via user
charges for those who can afford them.
Anecdotal evidence suggests that the poor
often pay much more for water, in absolute
terms and in terms of opportunity cost, than
the rich. A system that cross-subsidizes costs
but provides uniform and high quality service,
and is managed, governed and regulated by an
urban local body, is necessary to eliminate such
inequities.
Way Forward
Much work needs to be done to revamp the
crumbling urban infrastructure in the country
and provide universal access to basic services
such as water and sanitation. PPPs in the urban
water sector, if undertaken in a well-planned
manner, and for the right reasons, is a viable
alternative for solving some of the chronic
problems faced by the sector.
PPPs, as has been emphasized in this report,
are not appropriate for every situation and
should not be implemented indiscriminately.
Selection of the appropriate model of private
sector participation – either through
Engineering – Procurement – Construction
(EPC) and management contracts or through
Build – Operate- Transfer (BOT) Toll/Annuity
models – is an important step in the project
identification phase, but one that often does
not receive the necessary attention. A detailed
process of arriving at the appropriate model of
private sector participation that includes
exhaustive assessment of existing physical

15| P u b l i c P r i v a t e P a r t n e r s h i p s i n U r b a n W a t e r S u p p l y i n I n d i a
infrastructure, current performance on service
delivery benchmarks, and the technical,
operational and financial capability of the
ULBs, needs to be developed.
Further, realizing the potential of PPPs require
a strong focus on execution from all the
stakeholders. It is particularly important to
undertake intensive capacity building of urban
local bodies and implement reforms that make
them accountable and responsible for
achieving service level benchmarks in water
supply and sewerage.
A programmatic approach that integrates
planning for urban water supply and sewerage
at the state level, which is further broken into
targets and objectives for cities that are
stratified according to their size, is the
overarching method of implementing change.
Full achievement of the service level
benchmarks should occur in a phased manner,
where intermediate targets are set, based on a
number of parameters, such as the state of
existing physical infrastructure, the technical
and operational capacity of the ULBs and the
private sector, availability of finance, etc.
The next phases of our research will develop an
approach to identify the appropriate private
sector participation model and develop
guidelines for phase-wise implementation for
PPPs at the urban local body level.

1| P u b l i c P r i v a t e P a r t n e r s h i p s i n U r b a n W a t e r S u p p l y
1. EVOLUTION OF URBAN WATER SUPPLY SECTOR
1.1 URBAN WATER SUPPLY SECTOR IN INDIA
India’s record of providing access to safe and reliable drinking water to its citizens has been very poor,
even when compared with other developing countries. No major Indian city has a 24 hour water supply,
and a sample of 28 cities averaged just 3.3 hours of water supply per day.4 Other quality metrics —
accessibility, affordability, cost recovery, extent of metering, extent of non-revenue water – all
underperform vis-à-vis the set standards by a considerable degree.
The reasons for such chronic underperformance are complex and deep-rooted. Without attempting to
list the reasons exhaustively or solve them comprehensively, this report focuses on the potential of one
particular mechanism – the Public Private Partnership – to solve some of the problems associated with
the delivery of reliable and affordable urban water supply. The report begins by tracing the evolution of
the institutional and policy framework governing urban water supply and then goes on to present a
description of the trends in Public Private Partnerships (PPPs) undertaken over the years. In Section 2,
the current status of urban water supply and sewerage in is presented through an assessment of Service
Level Benchmarks (SLBs). We provide an analytical description of a few pressing problems that have
the potential to be addressed through the PPP mechanism. In Section 3, we briefly describe the funding
requirement for improvements in urban infrastructure and the different sources of funds, highlighting
the deficit that would need to be addressed, in part through private sector financing. In Section 4, we
present a framework for successful PPPs developed through our research and describe individual
features that have specific relevance to the urban water supply and sewerage sector. We present three
case studies in the Appendix and have drawn on them extensively to provide evidence for our
arguments.
1.2 INSTITUTIONAL FRAMEWORK
Water is constitutionally a state subject, listed under Entry 17 in the State List, but with the provision for
the center to intervene in case of management of inter-state rivers under Entry 56 of the Union List. Yet
the understanding of water and its related issues has evolved considerably since the drafting of the
constitution. While water, in the constitution, originally referred to the management of rivers and
irrigation, it is now more broadly understood to include all water bodies, aquifers, ground water, urban
and rural water supply, sewerage, sanitation, etc.
As such, currently in India, the central government is responsible for laying down the policy framework
and for funding and monitoring schemes related to the provision and management of water resources.
The implementation of the water policy through programs and schemes identified by the central
government, such as development of water infrastructure, operating, maintaining and regulating the
4Please refer to ‘Service Level Benchmark’ MOUD, GOI (2010) for further details

1| P u b l i c P r i v a t e P a r t n e r s h i p s i n U r b a n W a t e r S u p p l y i n I n d i a
water supply system and setting and collecting water tariffs, is carried out by the state governments
and by parastatal agencies such as the Urban Local Bodies (ULBs).
A brief outline of the role of the state and the central governments across different functions of the
urban water sector is given in the table below:
Exhibit 1.1:Institutional Framework of Urban Water Sector
Features Central Government State Government Urban Local Bodies
Policy &
Regulation
Ministry of Water Resources,
Central Public Health
Environmental & Engineering
Organization (CPHEEO), Ministry
of Urban Development,
Government of India
• Department of Water Resources
(State Government)
• State Level Water Regulatory
Authorities (E.g., Maharashtra
Water Resources Regulatory
Authority & Uttar Pradesh Water
Management and Regulatory
Commission)
Not Applicable
Funding
Jawaharlal Nehru National Urban
Renewal Mission (JnNURM) &
Urban Infrastructure Development
Scheme in Small & Medium Towns
(UIDSSMT); Schemes under the
Ministry of Urban Development,
Government of India
Statutory Bodies of the State
Government, such as the
Infrastructure Development
Corporations. E.g., Tamil Nadu
Urban Finance & Infrastructure
Development Corporation
Metropolitan Level
Specialist Agency/
Specialist Municipal
Undertaking
Capital Works
Not Applicable Public Health Engineering
Department / Public Works
Department (State Government)
Metropolitan Level
Specialist Agency
Operations &
Maintenance
Not Applicable State Level Specialist Agencies/
Metropolitan Level Specialist
Agencies
Specialist Municipal
Undertaking
Source: Various Government websites & Athena Research
Role of the Center
Apart from laying down the policy framework, the central government provides funds for financing
urban infrastructure development through various schemes and programs. The Jawaharlal Nehru
National Urban Renewal Mission (JnNURM) is a central government sponsored urban modernization
program with an allocation of over Rs. 1,00,000 crore spread over a period of seven years for 700 cities
and towns. The JnNURM was introduced in 2005-06 and aims to provide grants-in-aid to urban local
2| P u b l i c P r i v a t e P a r t n e r s h i p s i n U r b a n W a t e r S u p p l y i n I n d i a
bodies to increase the access of urban infrastructure to the people and the quality of the services
delivered, with a special focus on the improvement of the livelihoods of the urban poor. Under the
mission, 50% of the funds were to come from the Central Government and the other 50% was to be
shared between the beneficiary states and the ULBs.5 However, in subsequent years the Central
Government increased its share by over Rs. 16,000 crore to avoid any shortage of funds. Major sub-
components of JnNURM are described in the following exhibit.
Exhibit 1.2: Components of JnNURM
Components of JnNURM Approved Project Cost*
In Rs. crores Scope of the Sub-Scheme
Urban Infrastructure &
Governance (UIG) 60,704
Urban Infrastructure Projects relating to Water
Supply, Sewerage, Solid Waste Management and
Roads in 65 Mission cities.
Basic Services to the Urban
Poor (BSUP) 13,498.61
Housing and Slum Development Projects in 65
Mission Cities.
Urban Infrastructure and
Development Scheme for
Small & Medium Towns
(UIDSSMT)
28,983.65
Urban Infrastructure Projects relating to Water
Supply, Sewerage, Solid Waste Management and
Roads in cities and towns excluded in the 65
Mission Cities
Integrated Housing and
Slum Development
Programme (HSDP)
10,997.35 Housing and Integrated Slum Development in
non-mission cities and towns.
* The figures shown are as on 2011. Source: DMU Report – UIG, UIDSSMT, BSUP and HSDP,
JnNURM, MOUD, (2011)
A disaggregation of the project cost based on the share of the central, state and the ULB shows that the
share of the Central Government across the four sub schemes varies between 46% (UIG) and 81%
(UIDSSMT). The state government’s share ranges from 10% (UIDSSMT) to 32% (BSUP) while that of
the ULBs lies between 9% (UIDSSMT) and 37% (UIG). On average, the share of the Central
Government, state government and the ULBs in the entire four sub – schemes/components is 53%, 21%
and 26%, respectively.
5It is to be noted that the Central Government Funds under the JnNURM are released under the head of ‘Additional Central
Assistance’ (ACA). Please see DMU – UIG/UIDSSMT (2011), JnNURM, MOUD for further details.

3| P u b l i c P r i v a t e P a r t n e r s h i p s i n U r b a n W a t e r S u p p l y i n I n d i a
Figure 1.1: UIG Funds Allocation
Source: JnNURM – Status of Implementation of Projects (December, 2011)
The UIDSSMT scheme under the JnNURM was introduced for those cities that were not covered under
the UIG scheme. Allocations under the UIDSSMT scheme are shown in the figure below.
Figure 1.2: UIDSSMT Funds Allocation
Source: “State/town/sector-wise release status of projects under UIDSSMT,” as on 31st
August, 2010, MOUD
Other than the JnNURM, external support agencies have also contributed funds for project
development and capacity building in this sector. In the last decade (2001-10), World Bank fundedfor
one project worth USD 48 Million, Japan International Corporation Agency funded nine projects worth
USD 2,195 Million and Asian Development Bank (ADB) funded six projects worth USD 1,307 Million. The
ADB has also been working with the state and the central governments to fund the development of
0
1,000
2,000
3,000
4,000
5,000
6,000
IA IB IC III
Rs.
Lak
hs
Water Supply
Central State ULB
0
500
1,000
1,500
2,000
2,500
3,000
3,500
4,000
4,500
IA IB IC III
Rs.
Lak
hs
Sewerage
Central State ULB
0
500
1,000
1,500
2,000
North South East West
Rs.
La
kh
s
Water Supply Sewerage

4| P u b l i c P r i v a t e P a r t n e r s h i p s i n U r b a n W a t e r S u p p l y i n I n d i a
PPP toolkits and guidebooks and to conduct capacity building workshops for ULB/State Government
officials involved in drafting PPP contracts. A revision of the JnNURM, called as JnNURM Phase II is
under formulation, and is expected to take over the Phase I from the beginning of the financial year of
2013 and would expand its scope to cover all the urban regions of the country.
Role of the States
The role of the states in governing water supply has also changed over the years. The 74th
Constitutional Amendment Act (CAA), enacted in 1992, required the state governments to empower
the Urban Local Bodies (ULBs) with ‘such powers and authority as may be necessary to enable them to
function as institutions of self-governance’.6 The JnNURM stipulates certain mandatory reforms on the
ULBs as ‘core municipal functions’ that includes water supply, drainage and sewerage and solid waste
management. It requires the ULBs to own ‘the political accountability’ and to share the ‘technical,
financial and administrative responsibility’ with others as appropriate.
Exhibit 1.3: Sample Institutional Structure of a State (Tamil Nadu)
Source: Athena Research
6 Retrieved from ‘http://jnnurm.nic.in/wp-content/uploads/2011/01/Mandatory_Primer_1-2-
Implementation_CAA_Planning.pdf’
State Government (Government of
Tamil Nadu)
State Level Specialist Agency (Tamil Nadu Water Supply & Drainage
Board)
Specialist Municipal Undertaking (Urban Local Body for each of the cities)
Specialist Municipal Undertaking (Urban Local Body for each of the cities)
Metropolitan Level Specialist Agency (Chennai Metro Water
Supply & Sewerage Board)
Specialist Municipal Undertaking (Urban Local Body for each of the cities)

5| P u b l i c P r i v a t e P a r t n e r s h i p s i n U r b a n W a t e r S u p p l y i n I n d i a
Box 1.1: Regulatory Institutions
Only two states have a state level regulatory body for water management. Responsibilities are listed
below
Maharashtra Water Resources Regulatory Authority
Determine, regulate and enforce the distribution of bulk water supply to various categories of use
(agriculture, industries, power, drinking and sanitation)
Establish water tariffs at a level which enables self-sustainable management of service delivery
Review and clear water projects which meet the requirements of Integrated State Water Plan
(ISWP, which implies efficient use of both ground and surface water)
Uttar Pradesh Water Management and Regulatory Commission
The commission will be responsible for the regulation of water resources, optimally allocating it for
different purposes and for fixing water rates.
Source: Athena Research
1.3 POLICY FRAMEWORK
Over the last two decades, the concept of water supply and management has acquired greater
meaning, as reflected in the various National Water Policies that have been formulated till date (Refer
Exhibit. 1.4). The first National Water Policy, formulated in 1987, had little emphasis or no mention of
aspects such as interstate water distribution, pricing of water and private sector participation. The
National Water Policy that was subsequently revised in 2002, retained the earlier emphasis on drinking
water, modernization, quality and efficient use, with added emphasis on interstate water distribution
and began recognizing the need for private sector participation and pricing mechanisms. A new Draft
National Water Policy, 2012 is currently available for comments and suggestions from stakeholders and
citizens. Though not without its critics, it has viewed water, over and above the minimum quantity
required for sustenance of human life, as a scarce economic good that needs to be conserved, managed
and priced to ensure efficient usage.

6| P u b l i c P r i v a t e P a r t n e r s h i p s i n U r b a n W a t e r S u p p l y i n I n d i a
Exhibit 1.4: Broadening Scope of National Water Policy
Source: Athena Research
Other notable additions in the draft National Water Policy, 2012 are:
Water Framework Law
A need for a national legal framework to lay down the general principles that could lead to the framing
of suitable water laws, regulations and policies at the state level.

7| P u b l i c P r i v a t e P a r t n e r s h i p s i n U r b a n W a t e r S u p p l y i n I n d i a
Regulatory Authority
Each state should have a water regulatory authority to fix and regulate water tariffs, monitor the
operations, review performance and suggest policy changes.
Water Charges
Water charges should aim to recover at least the operation and maintenance cost of the water supply
network. Cross subsidies through differential pricing should be incorporated into the water charges
where necessary after considering the views of the beneficiaries. Further, the newly envisaged pricing
system encourages the integration of the urban water supply system and sewerage system i.e., the
water bills are directed to include sewage treatment charges.
Public – Private Partnerships (PPPs)
Appropriate use of PPP models by transferring water related services to a private developer and/or the
community should be encouraged.
Shift in the Policy Framework to promote greater Private Sector Participation
With the policy framework gradually allowing private sector participation, the urban water sector has
witnessed a gradual shift from public procurement to private sector participation in different forms. The
private sector has been involved in all parts of the value chain by either financing projects, undertaking
capital works or by operating the water supply and sewerage networks in cities and towns. In India,
private sector participation in the urban water sector started with Engineering – Procurement –
Construction (EPC) and service contracts. With an increasing number of PPPs in the commercial
infrastructure sectors such as roads and ports, a similar approach was adopted in the urban water
sector. PPPs in this sector began with long term Build – Operate – Transfer (BOT) projects, where in
many cases the private sector was expected to finance more than 50% of the project cost. However,
due to poor commercial viability of such projects, the focus shifted to management contracts where
funds were provided by the government and the private sector brought in its expertise, along with the
on-going EPC and service contracts.
1.4 WATER SUPPLY VALUE CHAIN
The value chain of urban water supply is broadly composed of three segments – (i) Sourcing, treatment
and transmission, (ii) Distribution and (iii) Waste Water treatment.
8| P u b l i c P r i v a t e P a r t n e r s h i p s i n U r b a n W a t e r S u p p l y i n I n d i a
Exhibit 1.5: Value Chain of Urban Water Supply
Each of the steps in the value chain have seen differing levels of private sector participation as will be
discussed in the next section.
1.5 CHRONICLE OF PUBLIC PRIVATE PARTNERSHIPS IN URBAN WATER SUPPLY
To understand the evolution of different forms of public private partnerships – both, in terms of the
segments of the value chain, as well as the role played by the private sector – we map out all the 18 PPP
projects that have been undertaken in the urban water sector and have witnessed some degree of
progress in implementation. This excludes projects that failed or were abandoned at an early stage of
the project planning phase.
PPPs in the 1990s
In the 1990s, several PPP projects were planned based on long-term concession agreements that
focused on bulk water supply. All projects initiated in this period were based on BOT/ Build-Own-
Operate-Transfer (BOOT) models and were primarily funded by private sources. Efforts were made to
implement such projects in Pune, Bangalore and Goa. However, over a period of time, most of these
projects were abandoned for various reasons such as lack of commitment from the government,
commercial non-viability and objections from the local community. Of the five PPP projects planned,
only one could be successfully awarded. This was the Tirupur Industrial Water Supply project in 2000
with a project cost of Rs. 1,023 crore.

9| P u b l i c P r i v a t e P a r t n e r s h i p s i n U r b a n W a t e r S u p p l y i n I n d i a
Exhibit 1.6: Evolution of Private Sector Participation in the Urban Water Sector
Source: Public Private Partnerships India Database, Department of Economic Affairs, Ministry of Finance,
Government of India and Athena Research
The Tirupur PPP was meant to supply water to over 1000 textile units and 1.6 million households. In
order to be commercially viable, a cross-subsidization scheme charging higher user charges to
industries and lower charges for households was embedded in the business model. In spite of being well
planned, the Tirupur PPP project faced losses owing to the complex interplay of a number of factors
such as reduced demand for water from textile industries after the recession and the shutting down of
several dyeing units (which consumed a lot of water) due to environmental legislation. Factors leading
to the Tirupur PPP have been further elaborated in the case studies given in Appendix I.
PPPs under the Tenth Five Year Plan
In the early 2000s, the primary form of PPPs proposed and implemented were management contracts
for the rehabilitation of existing water distribution systems and/or their operations & maintenance

10| P u b l i c P r i v a t e P a r t n e r s h i p s i n U r b a n W a t e r S u p p l y i n I n d i a
(O&M). Another important trend observed in this period was the change in financing mechanisms from
private financing to financial assistance from Central/State governments or multilateral agencies,
thereby reducing the cost of PPP projects. During this period, emphasis was laid on increasing private
sector participation for efficient delivery of services and introducing technological innovations, rather
than for financing projects.
Several attempts were made in Maharashtra and Karnataka to initiate PPP projects in the water sector,
but the first management contract awarded during the Tenth Five Year Plan was the World Bank
assisted Karnataka Urban Water Sector Improvement Project (KUWASIP). The success of this project,
has led to the implementation of a number of such management contracts in the country. Details of the
KUWASIP case study can be found in Appendix I.
Box 1.2: 24x7 Water Supply is Possible
PPPs under the Eleventh Five Year Plan
The success of PPPs in the water and sewerage sector increased during the Eleventh Five Year Plan and
subsequently, a number of contracts were awarded to the private sector in the following years. PPPs
during this period were adopted across the value chain of water and sewerage, including bulk water
supply to both, domestic and industrial consumers, improvement of the distribution systems and
Operations and Management/Maintenance (O&M) of the entire water supply system. Both, BOT and
management contracts were awarded.
The continuity of water supply is abysmally poor in most cities. To prove that 24x7 water supply is possible in the Indian context, a pilot project, KUWASIP, was funded by World Bank covering 10 % of the populations in three cities in Karnataka – Hubli Dharwad, Gulbarga and Belgaum.
The results have been impressive. Key achievements are as follows:
24x7 water supply in every household in the coverage area High water pressure 100 % metering High Collection efficiency High Cost recovery
Further details of this case study are given in Appendix I.

11| P u b l i c P r i v a t e P a r t n e r s h i p s i n U r b a n W a t e r S u p p l y i n I n d i a
Figure 1.3: Investment Outlay and Source of Financing Urban Infrastructure in the 11th
Plan7
Source: Mid-Term Appraisal of the 11th
Five Year Plan, Planning Commission, GoI, (2011)
In keeping with the trends observed during the Tenth Five Year Plan period, financing was undertaken
mainly by the government or by multilateral agencies. In the Eleventh Five Year Plan, the government
estimated an expenditure of Rs. 53,666 crore and Rs. 53,168 crore respectively for urban water supply
and sewerage. The main sources of funding for this sector during the Plan were the Central government
(54 %) and the State government (27 %), with only 3.27 % of the investment coming from the private
sector.
7Here, the urban infrastructure includes only solid waste management, water supply and sewerage and storm
water drainage.
41010
35
129 70
0
20
40
60
80
100
120
140
To
tal E
xpen
dit
ure
Cen
tral
Sec
tor
Ou
tlay
Sta
te S
ecto
r O
utl
ay
Inst
itu
tio
nal
Fin
anci
ng
Ass
ista
nce
fro
m e
xter
nal
su
pp
ort
ag
enci
es
FD
I an
d P
riva
te S
ecto
r
Rs.
Th
ou
san
d C
rore
s

12| P u b l i c P r i v a t e P a r t n e r s h i p s i n U r b a n W a t e r S u p p l y i n I n d i a
2. CURRENT STATE OF THE URBAN WATER SECTOR
2.1 SERVICE LEVEL BENCHMARKS
Until recently, while there existed plenty of anecdotal evidence regarding the poor performance of
ULBs in providing urban water supply, there were no clear benchmarks set by the government against
which this performance could be rigorously assessed on a regular basis. This critical necessity for any
service quality improvement plan – the establishment of Service Level Benchmarks (SLBs) – was
undertaken by the Ministry of Urban Development (MoUD) in 2009. SLBs on a number of performance
parameters for water supply, sewerage, solid waste management and storm water drainage were
developed and baseline data was collected from a sample of 28 cities, spread across 14 states and
different city sizes.
As can be seen from the Exhibit 2.1, the performance of ULBs on most parameters have indeed been
poor. In particular, there have been deficiencies in the continuity of water supply and the extent of
metering and extent of non-revenue water, with a shortfall of more than 50% from the target on both
parameters. In exhibit 2.1, the performance of the sample cities across key service level benchmarks has
been presented.

13| P u b l i c P r i v a t e P a r t n e r s h i p s i n U r b a n W a t e r S u p p l y i n I n d i a
Exhibit 2.1: Service Level Benchmarks and Average Performance of ULBs
S/N Performance Indicator Service Level Benchmark
Current Average Performance
Water Supply
1 Coverage of Water Supply Connections 100% 66.6%
2 Per Capita Supply of Water 135 litres/capita-
day 126.4 litres/capita-
day
3 Continuity of Water Supply 24 hours per day 3.3 hours per day
4 Quality of Water Supplied 100% 67.2%
5 Efficiency in Redressal of Customer Complaints 80% 80.4%
6 Extent of Metering of Water Connections 100% 49.8%
7 Extent of Non – Revenue Water 20% 44.1%
8 Cost-Recovery in Water Supply Services 100% 67.2%
9 Efficiency in Collection of Water Supply Related Charges
90% 78.8%
Sewerage
1 Coverage of Toilets 100% 87.9%
2 Coverage of Sewage Network Services 100% 52.6%
3 Collection Efficiency of Sewage Network 100% 75.7%
4 Adequacy of Sewage Treatment Capacity 100% 76.5%
5 Quality of Sewage Treatment 100% 91.3%
6 Extent of Reuse and Recycling of Sewage 20% 14.8%
7 Extent of Cost Recovery in Sewage Management 100% 65.9%

14| P u b l i c P r i v a t e P a r t n e r s h i p s i n U r b a n W a t e r S u p p l y i n I n d i a
8 Efficiency in Collection of Sewage – Related Charges 90% 76.5%
9 Efficiency in redressal of complaints 80% 83.1%
Source: Service Level Benchmarking Data book: Improving Service Outcomes 2008–09, Ministry of Urban
Development, Government of India
2.2 Sources of Drinking Water
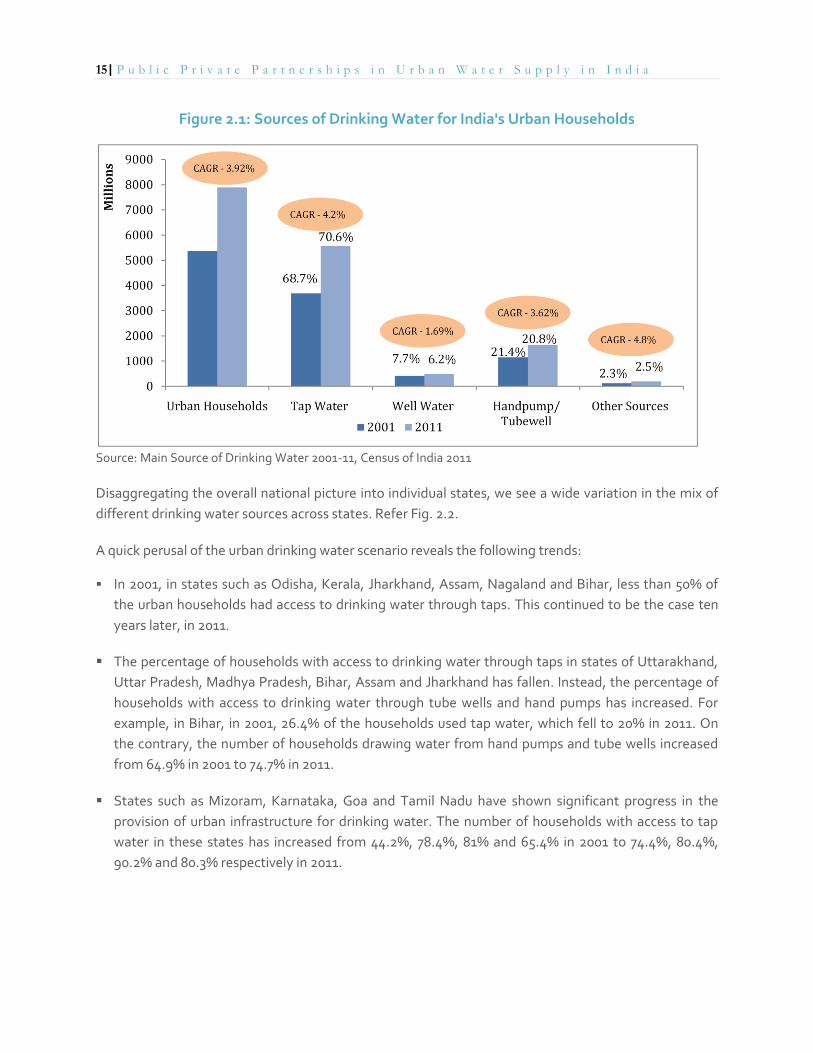
The number of urban households grew at a compounded annual growth rate (CAGR) of 3.92% between
2001 and 2011. The recently released National Sample Survey Organisation (NSSO), 2011 data on
household amenities shows that in order to meet the requirement of the additional households over
the last decade, the provision of drinking water via different sources increased at a CAGR of 4.2 % for
tap water, 1.69 % for well water, 3.62 % from hand pumps and tube wells and 4.9 % from other
sources8. Even though the number of access points for tap water has exhibited a higher growth rate
than the rate of growth of urban households, only 60-70% of the households in the urban areas have
access to tap water. This implies that while the number of urban households has been growing at 3.9%
per annum, on average the provision of drinking water grew by 3.6% per annum9, resulting in a growing
deficit in the provision of urban drinking water supply. The figure below shows the percentage of
households with access to drinking water through different sources for the years 2001 and 2011.
8Other sources of water include spring water, river/canal, ponds, lakes, private tanks and bottled water.
9 Source: NSSO Data (2011) MOSPI, GOI.
Legend
Target met Target missed by 26-50 %
Target missed by 1-10 % Target missed by over 50 %
Target missed by 11-25 %
15| P u b l i c P r i v a t e P a r t n e r s h i p s i n U r b a n W a t e r S u p p l y i n I n d i a
Figure 2.1: Sources of Drinking Water for India's Urban Households
Source: Main Source of Drinking Water 2001-11, Census of India 2011
Disaggregating the overall national picture into individual states, we see a wide variation in the mix of
different drinking water sources across states. Refer Fig. 2.2.
A quick perusal of the urban drinking water scenario reveals the following trends:
In 2001, in states such as Odisha, Kerala, Jharkhand, Assam, Nagaland and Bihar, less than 50% of
the urban households had access to drinking water through taps. This continued to be the case ten
years later, in 2011.
The percentage of households with access to drinking water through taps in states of Uttarakhand,
Uttar Pradesh, Madhya Pradesh, Bihar, Assam and Jharkhand has fallen. Instead, the percentage of
households with access to drinking water through tube wells and hand pumps has increased. For
example, in Bihar, in 2001, 26.4% of the households used tap water, which fell to 20% in 2011. On
the contrary, the number of households drawing water from hand pumps and tube wells increased
from 64.9% in 2001 to 74.7% in 2011.
States such as Mizoram, Karnataka, Goa and Tamil Nadu have shown significant progress in the
provision of urban infrastructure for drinking water. The number of households with access to tap
water in these states has increased from 44.2%, 78.4%, 81% and 65.4% in 2001 to 74.4%, 80.4%,
90.2% and 80.3% respectively in 2011.

16| P u b l i c P r i v a t e P a r t n e r s h i p s i n U r b a n W a t e r S u p p l y i n I n d i a
Figure 2.2: Sources of Drinking Water in India (2011)
Source: Main Source of Drinking Water 2001-11, Census of India 2011.
The recently released NSSO data on household amenities for 2011 further shows that only 62% and
1.7% of the urban households have access to treated tap water and covered wells respectively for
drinking purposes.
2.3 NON-REVENUE WATER (NRW)
On an average, the extent of Non-Revenue Water (NRW) in India is 44.1%. This is much higher than the
NRW of 15% in developed countries and the 20% that is set as the SLB for Indian cities by the MoUD.
Only four of the 28 cities under study reported less than 20% NRW. Cities such as Shimla and Pimpri–
Chinchwad have an NRW of 23.7% and 24.3% respectively, which is close to the SLB set but higher than
the NRW of developed countries.
Non Revenue Water comprises of three components:
1. Physical Losses
These include leakages in the water supply infrastructure such as the distribution and transmission
pipelines, storage reservoirs, overhead tanks and taps.
2. Commercial/Apparent Losses

17| P u b l i c P r i v a t e P a r t n e r s h i p s i n U r b a n W a t e r S u p p l y i n I n d i a
These are caused due to the inefficient monitoring of the flow of water. Commercial losses include
inefficient metering, data errors and theft. The physical and commercial losses together are called
“Unaccounted ForWater” (UFW) losses.
3. Unbilled Authorized Consumption
The service providers usually supply free water to the beneficiaries who cannot afford to pay. The
sources of water for these people are tube wells and hand pumps. The water supplied through these
sources is authorised consumption but is unbilled, and hence contributes to non revenue water.
Figure 2.3: Non Revenue Water Supply in a Typical Urban City in India
Source: Athena Research based on data available in HPEC Report (2011)
The main reason for high NRW in Indian cities is the inadequate number and poor quality of pipelines
for transmission and distribution and the low number of metered connections. Reduction in NRW is
important to ensure the recovery of capital and O&M costs incurred in providing water supply and
sewerage services. The exhibit provided below compares the extent of NRW across different types of
countries and also depicts the total potential revenue that is lost due to NRW.

18| P u b l i c P r i v a t e P a r t n e r s h i p s i n U r b a n W a t e r S u p p l y i n I n d i a
Exhibit 2.2: Potential Annual Revenue Lost due to Non-Revenue Water
Supplied
Population
(Million)
Water Consumption
(lpcd)
Non Revenue
Water (%)
Total Potential
Revenue lost (USD
Billions per year)
Developed 744.8 300 15 5.30
Eurasia (CIS) 178 500 30 3.50
Developing 837.2 250 35 5.80
Source: Kingdom; Bill, Roland Liemberger and Phillippe Marin, The Challenge of Reducing Non – Revenue Water
(NRW) in Developing Countries, How the Private Sector Can Help: A Look at Performance – Based Service
Contracting, World Bank, (2008). lpcd: Litres per capita daily

19| P u b l i c P r i v a t e P a r t n e r s h i p s i n U r b a n W a t e r S u p p l y i n I n d i a
3. FUTURE POTENTIAL FOR PPPS IN URBAN WATER
3.1 FUTURE INVESTMENT REQUIREMENTS
The High – Powered Expert Committee (HPEC) estimates pertaining to the total investment
requirement for water supply and sewerage for the next 20 years are Rs. 8.7 lakh crore and Rs. 4.8 lakh
crore, respectively. Figure 3.1 and 3.2 show the break-up of the total investment requirements into
capital expenditures and operating expenditures. For urban water supply, approximately 37% of the
total investment required is for capital expenditure while the remaining 63% is required for operation
and maintenance. For sewerage systems, about half the total investment is used for capital expenditure
and the other half for operation and maintenance.
Figure 3.1: Investment Requirements in the Urban Water Sector (In Rs. Crores)
Source: HPEC Report, GoI(2011)
Figure 3.2: Total Investments Required for Sewage Systems
Source: HPEC Report, GoI(2011)
867 546
321 148
119
26 290
200
400
600
800
1,000
To
tal
Inve
stm
ent
Req
uir
emen
t
To
tal O
&M
E
xpen
dit
ure
To
tal C
apit
al
Exp
end
itu
re
Cap
ital
E
xpen
dit
ure
fo
r U
nm
et D
eman
d
Cap
ital
E
xpen
dit
ure
fo
r A
dd
itio
nal
D
eman
d
Cap
ital
E
xpen
dit
ure
fo
r R
epla
cem
ent
Cap
ital
E
xpen
dit
ure
fo
r In
du
stri
al
Dem
and
Rs.
Th
ou
san
ds
480 237
243 108
99
35
0
200
400
600
To
tal
Inve
stm
ent
Req
uir
emen
t
To
tal O
&M
E
xpen
dit
ure
To
tal
Cap
ital
E
xpen
dit
ure
Cap
ital
E
xpen
dit
ure
fo
r U
nm
et
Dem
and
Cap
ital
E
xpen
dit
ure
fo
r A
dd
itio
nal
D
eman
d
Cap
ital
E
xpen
dit
ure
fo
r R
epla
cem
en
t
Rs.
Th
ou
san
ds

20| P u b l i c P r i v a t e P a r t n e r s h i p s i n U r b a n W a t e r S u p p l y i n I n d i a
City-wise Investment Requirements
The above mentioned investment requirements for reforming urban water supply and sewerage
utilities are further broken down into per capita investment requirements for each of the city class
types. The HPEC has provided these estimates based on certain assumptions.
The assumptions that were made to estimate the investment requirements in water are:
On an average, 80% of the distribution network pipes are to be replaced for delivering continuous
water supply for all city size classes.
For cities with population of 500000, industrial water production is assumed to account for about
20% of the total water production and demand is assumed to grow at 7% per annum.
Storage requirement is assumed to be 45lpcd (equivalent to one-third of the daily water demand).
Cost of connection and metering per household is assumed to be Rs.2500.
Fore estimation of replacement cost, the service life of assets is assumed to be 30years.
The assumptions for estimates of investment requirements in sewerage network and sewage
treatment re:
Underground sewerage network for all city size classes and 100% collection and treatment of waste
water.
Sewage generated is assumed at 80% of the per capita water consumption, and 5% sewage
generation is assumed for infiltration from ground water (113 lpcd).
O&M cost treatment is up to secondary treatment.
There is no excess treatment capacity in the existing sewerage treatment plants.
For the estimation of replacement costs, the service life of the assets is assumed to be 30 years.
Fig. 3.3 gives the per capita investment (PCI) required for capital works for different components of the
Urban Water Sector value chain for different classes of cities.
Figure 3.3: Per Capita Investment Required for Different City Classes (In Rs.)
1,4871,482
1,404
1,357
1,282 1,282
1,250
1,300
1,350
1,400
1,450
1,500
Class IA Class IB Class IC Class II Class III Class IV +
2,030
2,914
4,520
3,600
4,6194,619
2,000
2,500
3,000
3,500
4,000
4,500
5,000
5,500
Class IA Class IB Class IC Class II Class III Class IV +
Distribution, extensions (24*7 Standards)Sourcing of water, treatment & transmission

21| P u b l i c P r i v a t e P a r t n e r s h i p s i n U r b a n W a t e r S u p p l y i n I n d i a
Source: HPEC on Indian Urban Infrastructure and Service, GoI(2011)
Water sources for class IA, IB and IC cities, especially in southern India are located far away from the
city, hence the per capita investment for sourcing of water, treatment and transmission purposes for
these cities tends to be higher than that of cities in other classes. The per capita investment for
distribution networks and sewerage systems in metropolitan cities is lower than that in small cities and
towns due to high population density.10
Class IA and Class IB cities (35 cities) will account for 43% of the total urban population by 2032 and
require 53% of this total investment for water supply and sewerage systems. The remaining investment
is for the rest of the 4,343 cities.11
The map below depicts the investment requirements in Class IA and Class IB cities in India. Maharashtra
requires 22% of the total investment for its class IA and IB cities, followed by West Bengal and Delhi
with 13% and 11%, respectively.
10
Assuming that certain cities would need to rehabilitate their existing systems, whereas the rest would have to build the complete infrastructure from a scratch. 11
The re-classification of the cities has been done on the basis of the population size in the following manner: Class IA : > 5 million; Class IB: 1 – 5 million; Class IC: 100000 – 1 million ; Class II: 50000 – 100000; Class III: 20000 – 50000 ; Class IV+: < 20000
1,831
2,679
3,855
3,200
6,755 6,755
0
1,000
2,000
3,000
4,000
5,000
6,000
7,000
8,000
Class IA Class IB Class IC Class II Class III Class IV+
3,3603,841
3,411
5,3165,649
6,648
0
1,000
2,000
3,000
4,000
5,000
6,000
7,000
Class IA Class IB Class IC Class II Class III Class IV +
Distribution (24*7 Replacements) Sewerage network & treatment

22| P u b l i c P r i v a t e P a r t n e r s h i p s i n U r b a n W a t e r S u p p l y i n I n d i a
Figure 3.4: Investment Requirement in Class IA and IB Cities
Source: HPEC Report, GoI, (2011)
3.2 SOURCES OF FINANCING
The total expenditure on urban infrastructure, covering all the sectors namely, water supply and
sewerage system, solid waste management, roads and transportation, storm water drains and street
lighting, as a percentage of GDP, is estimated to increase from 1.59% in 2011 to 2.16% in 2032. The
figure below gives the different sources of financing this expenditure as a percentage of GDP.
Investment in Urban Water Projects in Cities IA & IB for 2012-32 (RsCrores)
< 30000
30000 - 60000
60000 - 90000
> 90000
Class IA Cities
Class IB Cities

23| P u b l i c P r i v a t e P a r t n e r s h i p s i n U r b a n W a t e r S u p p l y i n I n d i a
Figure 3.5: Sources of Financing
Source: HPEC Report, GoI(2011)
A large amount of this expenditure needs to be financed through the urban local bodies’ own revenue
sources that include exclusive taxes (property taxes, entertainment and advertisement taxes), shared
taxes and revenue generated from its operations. Currently, this forms about 0.5% of the GDP, but
needs to increase to 1.47% of the GDP by 2032.
According to the HPEC Report, the on-going JnNURM scheme needs to be further extended for
another twenty years and funds from this scheme should rise from 0.1% of the GDP in 2011 to 0.25% of
GDP by 2032.
The rest of the expenditure should be financed through non–tax revenue (in the form of user charges)
and the deficit would require new financing options such as support from external agencies,
institutional financing and PPPs with private sector financing.
-0.4
0.1
0.6
1.1
1.6
2.1
Total Expenditure
Exclusive Taxes
Revenue -Shared Taxes
Non - Tax Revenue
Transfers from State Finance Commission
Grants in aid from State
Government
Transfers from Central Finance
Commission
Grants in aid from GoI
JnNURM / NIJnNURM
Deficit
2011-12 2021-22 2031-32

24| P u b l i c P r i v a t e P a r t n e r s h i p s i n U r b a n W a t e r S u p p l y i n I n d i a
4. STRATEGIC FRAMEWORK FOR SUCCESSFUL PPPS IN URBAN WATER
SECTOR
PPPs in social infrastructure sectors such as water supply, sewerage, solid waste management, health
and education have been practiced in India since the 1990s. Different methods/models were adopted
and the country has witnessed few successful models and a number of unsuccessful ones. Unlike PPPs
in the commercial infrastructure sectors, it has been very difficult to upscale PPPs in the social
infrastructure sectors. The lack of sufficient understanding regarding people’s affordability and
willingness to pay coupled by the general perception that it is the government’s responsibility to
provide public amenities like water supply and waste management free of cost has made the service
less amenable for private sector participation. Thus the replication of PPP models and processes that
worked in the commercial infrastructure sectors like Roads and power, in the delivery of urban water
supply led to their failure.
Further unlike the commercial sectors, the government did not initially provide viability gap funding to
private concessionaires and instead funding was provided through schemes such as the Augmented
Urban Water Supply Scheme (AUWSS), which were limited in nature. In this section, we present a
framework for successful PPP implementation and highlight areas that need special focus due to the
critical nature of the water supply and sewerage system. Exhibit 4.1 shows the role that needs to be
performed by each stake holder involved in a PPP, the sharing of risks and the flow of funds between
them. The government must make a strategic plan and identify various implementation modes (either
via traditional public procurement or private sector participation) for the reforms in urban water supply
and sewerage sector. As for private sector participation, a mature rationale for its suitability is
necessary. The role of consultants in assisting the government for setting optimal tariff structures,
avoiding undue monopoly profits to the private operator and thereby designing a sustainable financial
model that allows social inclusion and environmental safeguards should be considered. Each of these
factors is elaborated in this section by covering the issues and lessons from various practices in urban
water supply and sewerage sector.

25| P u b l i c P r i v a t e P a r t n e r s h i p s i n U r b a n W a t e r S u p p l y i n I n d i a
Exhibit 4.1: Strategic Framework for Successful PPP Implementation
Source: “Public Private Partnerships: Lessons from Experiences”, Athena Infonomics, April 2012
4.1 ROLE OF PUBLIC SECTOR
Rationale & Planning
Given the critical nature of the service – drinking water supply and sewerage systems – where the cost
of delays and project failure are extremely high, it is important to evaluate the suitability of the PPP
model before implementing the project. This should be done by identifying the objectives of the project
and by comparing it with other ways of providing the service e.g., public procurement. In other words,
the ‘value for money’ indicator for a PPP project must be measured and established.
One needs to examine the rationale for having a PPP along with an assessment of the execution
capability of the private sector and the monitoring capacity of the public agency. Experiences of PPP
projects in the water sector show that the reason for opting to provide water utilities under a PPP mode
was initially inadequate government funds, capacity and capability to execute such projects. Examples
include projects such as the Tirupur Water Supply, Krishna Bulk Raw Water Supply, Cauvery Water
Supply and Water Supply in Pune, although not all of these projects were actually implemented. The
government realised that to meet the requirements of the citizens, the water supply system needs to
be improved. However, the municipal corporations had neither the financial capacity (due to poor
management of the services accompanied by a lack of application of tariffs) nor the operational
efficiency (output in terms of their staffing levels and technical expertise) to provide these services.
Hence PPPs were selected to meet these financial and efficiency constraints.

26| P u b l i c P r i v a t e P a r t n e r s h i p s i n U r b a n W a t e r S u p p l y i n I n d i a
Commitment
Strong political commitment towards the project is essential to avoid any delay in the approval of the
project, release of central or state funds, land acquisition and providing clearances to the private sector.
Furthermore, the role of the government, which varies from one type of PPP model to another, should
be clearly identified and executed. The bid process should be transparent and appropriately structured
so as to ensure the selection of the most competent private player.
Procedural Frameworks
The government is responsible for providing procedural frameworks related to the PPPs in this sector.
These include providing toolkits, procedures for bidding and awarding contracts, modelling concession
agreements (MCA), methods for monitoring and evaluating the projects. These frameworks for the
urban water sector are still under formulation with support from multilateral agencies. They are an
important component of PPP projects since they act as guiding tools and build more confidence among
the stakeholders while executing the projects.
Regulatory Authority
Pricing of water remains a sensitive and contentious issue. However, usage of water over and above a
minimum quantity essential for human sustenance should be treated as a scarce economic good and
priced appropriately to ensure its conservation and proper management. Such an approach can be
pursued by establishing a water tariff regulating authority at the state level.
Nodal Agencies
Although there is a national level PPP nodal agency, not all states have their respective state PPP cells.
Five states have their PPP cells. These include, Andhra Pradesh, Haryana, Maharashtra, Karnataka and
Rajasthan. Some of the states have their own infrastructure board, such as Andhra Pradesh, Gujarat,
Haryana, Maharashtra, Karnataka and Rajasthan. Only 16 states, including Andhra Pradesh, Arunachal
Pradesh, Assam, Bihar, Chhattisgarh, Gujarat, Haryana, Maharashtra, Madhya Pradesh, Goa, Punjab,
Karnataka, Rajasthan, Tamil Nadu, Uttarakhand and Uttar Pradesh have their respective State PPP
Policy. Of these, Gujarat is the only state which has a sector wise empanelment of consultants. The
establishment of a state PPP cell is necessary specifically for sectors such as water, which is a state
subject. The state PPP cell should take the responsibility of identifying the priority areas in the sector,
conceptualise projects, undertake feasibility and technical studies and implement, regulate and
monitor the projects.

27| P u b l i c P r i v a t e P a r t n e r s h i p s i n U r b a n W a t e r S u p p l y i n I n d i a
4.2 ROLE OF PRIVATE SECTOR
Private Developers and Contractors
It is important to build a highly competitive environment that facilitates the selection of the right
private player with the best technical and financial expertise to execute projects without time or cost
overruns. The emphasis should be on the efficiency and quality of the service provided with a strong
social commitment that allows inclusivity. It must be ensured that the profit-making incentive does not
lead to a monopoly over the asset by the private player. The developer should be capable of bringing
new innovations and technology for effective service delivery which may not be brought in if the project
is undertaken through public procurement. It is also necessary that the rehabilitation and resettlement
of the local community affected due to the development of an infrastructure project be undertaken
along with the government.
Consultants
Technical consultants assist the government in carrying out feasibility studies and estimating the socio-
economic costs and benefits of projects and most importantly, in contract structuring. The consultants
are required to align the incentives of all stakeholders involved and factor in social inclusion and
environmental sustainability in the project plans. They must guide the government/private sector and
therefore improve the latter’s capability to successfully implement a PPP project.
Past experiences of PPP projects in the urban water sector indicate rigid contract structuring. However,
there are a few projects in which flexible components were incorporated in the contracts to restructure
certain parameters. For example, the Tirupur Water Supply Project was designed in a manner that
allowed for financial restructuring i.e., conversion of debt into equity. Incorporating such flexibility in
the contract structures and lenders’ agreements may help to reduce the chances of project termination,
thereby reducing re-bidding costs, allowing uninterrupted services to customers and enhancing the
long-term sustainability of the models.
4.3 COMMUNITY PARTICIPATION
Engagement of the community in the provision of essential services like water has been considered a
critical element to ensure the availability of these services to different sections of society, and to
efficiently cater to their needs and grievances. Different forms of community involvement have been
considered at various stages of the water and sewerage value chain, namely to provide financial
support, manage the utilities, or monitor operations. We describe three aspects of community
participation that can enhance the efficiency of a project.
Transparency
The public or private partner responsible for asset creation and provision of water supply and sewerage
facility must engage the local community in the decision making process. Public communication and

28| P u b l i c P r i v a t e P a r t n e r s h i p s i n U r b a n W a t e r S u p p l y i n I n d i a
consultation allows for an exchange of dialogue between the representatives of the community and the
utility provider. Such an interaction also allows the public to share their views on a project or a
programme that is to be implemented. As for the service providing agency, it allows them to share the
details of the project so as to avoid any problems during the implementation phase. In brief, it allows
transparent, mutual negotiation of the project outcomes, helps overcome information asymmetries
and creates awareness among the stake holders.
Accountability
Greater community participation can improve the accountability of the public and private sector
officials responsible for delivering water supply and sewerage services. For example, the Byrraju
Foundation implements its ‘Sujala’ water treatment plants in various parts of Andhra Pradesh. The
stake holder model of the project that showcases the active role played by the village community is
presented below. The most important aspect of the project is the formation of Gram Vikas Samity — a
small member team of the village community that is involved in monitoring the project. The
management of the project by the community facilitates immediate redressal of grievances or any
problems in service delivery.
Exhibit 4.2: Stakeholder Map of Byrraju Foundation Model of Drinking Water Supply
Source: Athena Research

29| P u b l i c P r i v a t e P a r t n e r s h i p s i n U r b a n W a t e r S u p p l y i n I n d i a
Participation in Project Execution
Community participation in project execution may range from the identification of the need for service
delivery to the actual operations and maintenance of the service delivery by the community. In the case
of basic services, such as health, education and water supply, participation of the community may
increase the efficiency of service delivery as the community’s needs and recurrent grievances are
recognised. Box 4.1 gives an example where the private developer consults the village community
(Village Panchayat) before setting up its water treatment centre (Water Health Centre) and also
encourages them to participate in the execution of the entire water supply system.12
12
Village Panchayats refer to a system of governance prevalent in rural India since ancient times. The 73rd
Constitutional Amendment Act, 1992 conferred constitutional status to Panchayats. It is the third tier of government below the state government.

30| P u b l i c P r i v a t e P a r t n e r s h i p s i n U r b a n W a t e r S u p p l y i n I n d i a
Box 4.1: Water Health Centers13
Water Health International, founded in 1996 in USA supplies safe (meeting WHO and ISO15550
standards) and affordable drinking water to the under-served community via a decentralized
innovative business model. It began its operations in India in 2005 through its subsidiary named Water
Health India Pvt. Ltd. Since then it has established 175 Water Health Centers (WHCs) across different
villages of Andhra Pradesh and is currently setting up its WHCs in states such as Gujarat, Karnataka,
Maharashtra, Tamil Nadu and parts of North-Eastern India.
The WHCs are developed on a Public-Private-Community Partnership (PPCP) basis: usually a
Memorandum of Understanding (MoU) is signed by the Village Panchayat (VP) and the company. The
selection of the villages is based on parameters such as location, existing infrastructure, availability of
natural resources, size of the population and village income levels. The VP is responsible for providing
the company with the land, power and water sources for setting up the plant. All the support is usually
provided free of cost by the VP while in some cases the concessionaire pays for the power charges. The
plant, with a capacity for treating 21,000 liters per day, is built in approximately 22-40 days, once the
company gets the VP’s approval. The quality of the water at each water health centre is tested every
month over twenty parameters in the laboratories of the organization. The organization works with
Non – Government Organisations (NGOs) that use various techniques of social marketing to capture
the market and convinces the villagers about the quality of water supplied to them.
Initially, user fees were levied based on income categories. However, due to difficulties in managing
price discrimination, this was changed to a system of standard fees for the entire population of a
village. However, the user fees vary across different villages and districts. The variation depends on the
technology and the degree of contamination of the water. This is a PPCP Project on a BOT basis,
usually with a concession period of 10 to 15 years. The private developer trains and hires members of
the village community to operate the WHCs and to sell the water to various houses that are situated in
remote areas.
4.4 RISK ALLOCATION
It is important to ensure that the risks associated with the PPP are properly defined and appropriately
allocated among the stakeholders. Measures to mitigate risk must also be provided. Risks are critical to
PPP projects as they indicate the probability of occurrence of events that may cause changes in the
socio-economic, political and natural environment faced by projects.14 Allocation of risks is important to
increase efficiency, reduce project related costs and achieve improved value for money. The risks
should be allocated to those stakeholders who are best suited to handle them. In case the party, to
whom the risk was allocated, fails to handle it, the other stake holders involved in the project may make
13Source: Athena Research
14Please see, ‘Risk – A critical focus of PPP Design,’ PPP Toolkit for Improving PPP Decision Making Processes, Public Private
Partnerships in India, Ministry of Finance, Government of India as retrieved from http://toolkit.pppinindia.com/

31| P u b l i c P r i v a t e P a r t n e r s h i p s i n U r b a n W a t e r S u p p l y i n I n d i a
attempts to mitigate those risks in a manner that the community is not affected due to interrupted
services.
4.5 FINANCIAL SUSTAINABILITY
Financing Capital Expenditure
Most successful PPP projects in the urban water sector have had more than 50% of theircapital
expenditure financed by the government or by multilateral agencies. Evidence from past experiences
suggests that the economic viability of the project would suffer if the private sector were to finance the
capital expenditure of the project. This is because building the infrastructure for supplying water is
capital-intensive and recovering this cost from user charges would make water supply services
unaffordable to the poor.
Examples of successful PPP models show that public financing boosts the confidence of the private
sector to enter into PPP projects in the urban water sector. Government funding through schemes
under the JnNURM along with reasonable tariff structures creates a win-win situation for the project
stakeholders. The Karnataka Urban Water Supply Improvement Project (KUWASIP) was funded jointly
by the World Bank and the Government. Its success led to a similar financing pattern being followed by
other projects, namely the water supply in Latur, Khandwa and Mysore. Details of the project are
provided in the case studies in the Appendix.
Financing Operations & Maintenance Expenditure
Given that the capital expenditure of the PPP projects in the urban water sector will be largely funded
by the government or by multilateral agencies, the viability of the project depends on its ability to
recover its operations and maintenance costs. Broadly, there are two ways in which the O&M costs can
be recovered.
A. Revenue through User Charges
The private operator/implementing government agency levies water tariffs on the users. The revenue
generated from the collection of tariffs will be used to recover the O&M costs. The revenue can be
shared with the private operator in either of the two forms discussed below:
First, in a BOT (Toll) project, the revenue risk can be borne by the private sector partner and the private
partner collects user charges during the concession period after which the ULB takes over the user
charges collection function. Such a mechanism is under operation in the Tirupur Water Supply Project
Secondly, in a BOT (Annuity) project, the private operator can be made responsible for collection of
user charges but only receives a certain predetermined percentage of the revenue collected based on
its collection efficiency. Khandwa Municipal Water Supply project is an example of such a revenue
model.

32| P u b l i c P r i v a t e P a r t n e r s h i p s i n U r b a n W a t e r S u p p l y i n I n d i a
B. Revenue through Performance Based Payments
The performance based method of compensating the private partner may or may not involve levy of
user charges. Here, the revenue to the private operator for executing water supply and/or the sewerage
system is based on its performance in meeting the set service standards. The payment is made by
utilizing grants available under government schemes or from multilateral agencies. Hence, the revenue
risk of the private player is linked to its performance. Such a mechanism ensures enhanced
performance by the private sector partner and discourages monopoly profits and provides quality
services to the customers. The Karnataka Urban Water and Sanitation Improvement Project is an
example of this type of a revenue model.
Box 4.2: Pricing of Water
Pricing of water is an extremely contentious issue in the Indian context. The opposition is primarily
ideological in nature and fails to appreciate the reality of water scarcity across the world and the
impending need to conserve and manage this scarce resource. Pricing of water and/or private sector
participation in its delivery are seen as tantamount to privatisation of water per se.
Yet, a pricing structure that allows everyone 24*7 access to an acceptable minimum quantity of water
for basic sustenance, and that charges users consuming above the set minimum level so as to recover
at least the O&M costs of providing the water supply services can be an important step towards
conserving water as well as providing quality service.
Water tariff systems such as flat tariffs or tariffs as a percentage of property taxes do not incentivise
users to regulate their water consumption. Tariff structures such as volumetric tariffs or differentiated
tariffs based on income levels of the consumers are more socially acceptable and environmentally
conscious. Volumetric or differentiated tariff structures take account of both, social inclusion and
affordability issues, and ensure that a minimum quantity of water is within the reach of all classes of
people, irrespective of the ability and willingness to pay.
The cost of administering different types of water tariff varies from category to category. For
example, a flat water tariff is easier to collect and govern than a volumetric tariff which requires an
efficient meter system.
33| P u b l i c P r i v a t e P a r t n e r s h i p s i n U r b a n W a t e r S u p p l y i n I n d i a
5. CONCLUSION
Much work needs to be done to revamp the crumbling urban infrastructure in the country and provide
universal access to basic services such as water and sanitation. PPPs in the urban water sector, if
undertaken in a well-planned manner, and for the right reasons, is one viable approach for solving some
of the chronic problems faced by the sector. This report highlights some of the necessary steps that
must be undertaken for a successful PPP.
PPPs, as has been emphasized in this report, are not appropriate for every situation and should not be
implemented indiscriminately. In many cases, it may be more appropriate to undertake public works
through EPC contracts. Selection of the appropriate model of private sector participation – either
through EPC and management contracts or through BOT Toll/Annuity models – is an important step in
the project identification phase, but one that often does not receive the necessary attention. A detailed
process of arriving at the appropriate model of private sector participation that includes exhaustive
assessment of existing physical infrastructure, current performance on service delivery benchmarks,
and the technical, operational and financial capability of the ULBs, needs to be developed.
The selection of the appropriate private sector participation model maximizes the potential
performance of the developed system. Realizing this potential, however, requires a strong focus on
execution from all the stakeholders. It is particularly important to undertake intensive capacity building
of urban local bodies and implement reforms that make them accountable and responsible for
achieving service level benchmarks in water supply and sewerage.
A programmatic approach that integrates planning for urban water supply and sewerage at the state
level, which is further broken into targets and objectives for cities that are stratified according to their
size, is the overarching approach of implementing change. Full achievement of the service level
benchmarks should occur in a phased manner, where intermediate targets are set, based on a number
of parameters, such as the state of existing physical infrastructure, the technical and operational
capacity of the ULBs and the private sector, availability of finance, etc.
The next phases of our research will develop an approach to identify the appropriate private sector
participation model and develop guidelines for phase-wise implementation for PPPs at the urban local
body level.

34| P u b l i c P r i v a t e P a r t n e r s h i p s i n U r b a n W a t e r S u p p l y i n I n d i a
APPENDIX I │CASE STUDIES
1. THE TIRUPUR WATER SUPPLY PROJECT
Background
Tirupur, a town in Tamil Nadu is at the centre of India’s cotton knitwear industries with the textile units
contributing to nearly 90% of the country’s exports. Water is an intensively used raw material in this
industry. It was in the early 1990s that the industrial units in Tirupur started facing water shortages. The
industrial units in Tirupur had no access to piped water due to the lack of infrastructural facilities.
Moreover, the other sources of water, such as ground water and surface water, were heavily polluted
due to discharge of toxic effluents without treatment into the River Noyyal by the dying and bleaching
units which operate in the area. This rendered the ground water unfit for use. Lack of access to water
was slowing down the growth of the industries and increasing the cost of production as the industries
had to rely largely on private water tankers who charged a high price for water supply.
In order to protect the industries from making losses, the Tirupur Exports Association (TEA), a body
which constituted primarily of knitwear exporters, approached the Government of Tamil Nadu (GoTN)
to make provision for the supply of industrial water to the textile industrial clusters. Heeding to the
request of TEA, the GoTN in 1993–94, mandated the Tamil Nadu Corporation of Infrastructure
Development (TACID) to design and develop the Tirupur Area Development Project (TADP) with the
objective of developing the water supply and sewerage system for extracting water to meet the
industrial demands. TACID approached IL&FS to assist in the implementation of the project. The
project cost estimated by IL&FS was Rs. 500 crore.15 However, the government did not have adequate
financial resources to implement such a large project. Hence, it was decided to implement the project
on a PPP basis, making this the first PPP project in India in the water sector.
In August 1994, the GoTN signed a MoU with the TEA and IL&FS to form a public limited company
called the New Tirupur Area Development Company Limited (NTADCL). However there was an initial
15
The total project cost of $ 100 million has been converted into Indian rupee terms with the following exchange rate – one USD = ` 50.

35| P u b l i c P r i v a t e P a r t n e r s h i p s i n U r b a n W a t e r S u p p l y i n I n d i a
lag of five years in the implementation of the project due to a change in the government. Political
instability and frequent change in the government is a potential threat to such large-scale projects. The
project was further delayed as NTADCL only achieved financial closure in 2000 with a debt-equity ratio
of 1.5:1. Meanwhile, the textile industrialists had to meet their industrial water requirements by buying
water from farmers of the villages in the district.
A concession agreement was signed between the GoTN, Tirupur Municipality (Contracting Authority)
and NTADCL (Concessionaire) with a project cost of Rs. 1,023 crore, to be developed on a BOOT basis
with a concession period of 30 years. The construction for the project finally started in 2002 and the
operations began in 2005. A brief timeline of the project is given on the next page:
Exhibit 1a: Timeline of the Tirupur Water Supply Project
Structure of the Project:
A. Stakeholder Model
The key stakeholders in the project were IL&FS (the private entity), NTADCL, Tamil Nadu Water
Infrastructure Company (TWIC) and TEA. The exhibit below depicts the stakeholder model which
identifies the role of each stakeholder and the transfer of resources from one entity to another.

36| P u b l i c P r i v a t e P a r t n e r s h i p s i n U r b a n W a t e r S u p p l y i n I n d i a
Exhibit 1b: Stakeholder Model/Organogram of Tirupur Water Supply Project
The role of IL&FS was primarily to provide transactions and financial advisory and undertake the
documentation for the same. It was also responsible for the management and execution of the project.
NTADCL, a Special Purpose Vehicle (SPV) established by TWIC, was made responsible for the
development and implementation of the project. Unlike the traditional SPVs which consisted only of
private organizations, this SPV was a joint shareholding between the public and the private sector. The
first task of the SPV was to make the project commercially viable and to achieve this objective,a tariff
structure16 was established which allowed for the collection of user charge by the concessionaire from
the beneficiaries.
Contractors for the project were selected through a pre-qualification process and submission of
technical and financial bids. Around 40 Indian and International contractors had participated. The
Construction and Operations and Management contracts were signed in 2002.
B. Financial Structure
NTADCL was responsible for raising finances for the project. However it had encountered various
barriers in the process. The primary issue facing the project was the reluctance on the part of the
financial institutions to provide credit for the project. Concerns were expressed as there was no
16
Please refer to the revenue model discussed later.

37| P u b l i c P r i v a t e P a r t n e r s h i p s i n U r b a n W a t e r S u p p l y i n I n d i a
precedent for PPP in the water sector and this was the first project of its kind in India. Also, there was
less clarity regarding the relevant risks shared by the different stakeholder.
The project achieved financial closure in 2000. The various sources of financing have been given in the
table below.
Exhibit 1c: Sources of Financing
Source: Dwivedi, G., “Public Private Partnerships & Lessons from Tiruppur Water Supply and Sewerage Project,”
ManthanAdhyayan Kendra, 2008.
C. Revenue Structure
The water supply plant had a total capacity of 185 Million Litres per Day (MLD), of which 125 MLD was
to be supplied to the textile industries, 25 MLD to Tirupur residents and 35 MLD to the nearby villages.
The prices for the same were fixed at Rs. 45, Rs. 5 and Rs. 3 per kiloliter respectively, which allowed for
a cross-subsidization mechanism. The industries were charged a price which was decided by the Price
Review Committee constituted under the project. The prices for domestic users and other users were
based on recommendations made by the Tamil Nadu Water & Drainage Board. The concession
agreement also had provisions for price escalations that covered annual inflation.
D. Alternative Revenue Loss Mitigation Measures
Certain innovative measures were mentioned in the concession agreement to mitigate risks. These
were as follows:
Water Shortage Period Fund (WSPF)
This fund covered an amount of Rs. 75 crore that was meant to mitigate the risk of the concessionaire
during water shortages arising from the reduced flow of water or degradation of water quality. This
would allow the concessionaire to continue generating revenues irrespective of the quantity and quality
of water drawn from the river.

38| P u b l i c P r i v a t e P a r t n e r s h i p s i n U r b a n W a t e r S u p p l y i n I n d i a
Debt Service Reserve Fund (DSRF)
A fund of Rs. 50 crore was created to ensure timely debt servicing during its operations.
Status of the Project since Inception
It was only in 2005 that NTADCL was able to provide continuous supply of water to all consumers, both
domestic and industrial. However the project faced a series of unexpected events which negatively
affected the profitability and commercial viability of the project. One of the main setbacks to the
project was the decline in the industrial demand for water. There were several reasons for this. Firstly,
the global recession lead to a fall in the demand for Indian textile exports. Secondly, new technologies
in the textile industry reduced the water intensity of production. Thirdly, Tirupur had adequate rainfall,
which allowed the industrialists to extract ground water at a cheaper cost. Moreover, the mitigation
efforts were insufficient to make up for the revenue loss with the DSRF getting completely exhausted in
the period.
The low industrial demand was accelerated due the court order in January 2011 which resulted in the
closing of several industrial units for causing pollution by discharging used water into the nearby rivers
without any treatment. The Pollution Control Board has since then taken strict measures and only
allows units that will comply with the policy of ‘zero liquid discharge’ into the rivers to commence
operations. Majority of the units, as a consequence, have outsourced their dying operations.
Lessons
Delays in project due to change in government
This project was proposed by the existing government in 1993. However an election and change in the
government in 1996 resulted in poor political will for implementing the project. This delayed the project
by a period of four years until financial closure was achieved in 2000. Thus sustenance of political will
for implementation of such long term projects is central to the successful implementation of PPPs.
Projections of demand for water were not changed
The initial water demand projections were made in 1994 by the textile industries without engaging any
consultant. By the time the NTADCL developed the project and started operations, the economic
environment of the industry had changed. There should have been inbuilt mechanism which would
allow for re-forecasting of demand to capture such changes.
Lack of support from the industrial units
The project was developed specifically to cater to the demands of industrial units. However, during its
operational phase, the town received adequate rainfall, which allowed the industrial units to extract
more ground water instead of buying water from the project. Also, increased pollution of the rivers by
the industry hindered the operation of the project and increased the revenue losses.

39| P u b l i c P r i v a t e P a r t n e r s h i p s i n U r b a n W a t e r S u p p l y i n I n d i a
Provision of special rights to the foreign investor
One of the foreign equity investors had a share of 27.05%, which was the largest amongst the
investments made, following TWIC. The investor was given special rights that made it necessary to
seek prior approval in order to restructure the financial model. The investor disagreed with a number of
amendments suggested.
Immediate measures taken
To reduce the revenue risk associated with the private developer and to ensure smooth flow of funds,
TWIC (financier) approached the Supreme Court with an immediate request to allow 10% of the textile
units to operate. TWIC had taken on the responsibility of ensuring that these units complied with the
Tamil Nadu Pollution Control Board directive of zero effluent discharge. This allowed NTADCL to
breakeven.
Measures currently under Consideration
Restructuring of the Revenue Model
The capacity of the water supply plant at present is 250 MLD, which can be upgraded to cover
additional users through a minor investment of Rs. Rs. 50 crore. NTADCL is considering exploiting this
additional capacity to supply a minimum of 100 MLD to the TMC. However, this will take another 3-4
years as the TMC needs to build the necessary infrastructure for storage facilities and distribution
systems, including a number of overhead tanks. Water will be supplied to the residents of the village at
the weighted average tariff (approximately Rs. Rs. 25-27 per kiloliter) as against Rs. Rs. 3 per kiloliter
proposed in the initial revenue model. An additional 85 MLD will be supplied to industrial units and
other commercial centers beyond Tirupur.
Corporate Debt Restructure Package:
Under this measure, the conversion of some portions of the debt into equity is being considered. The
banks would convert 15% of the debt to equity. The government is planning to give interim debt and
extra equity, which will be used by the NTADCL to repay a portion of the debt and for operations and
maintenance. IL&FS may also convert its subordinate debt into equity.
2. THE KARNATAKA URBAN WATER SUPPLY IMPROVEMENT PROJECT
Background
The Urban Drinking Water and Sanitation Policy, 2002 of the Government of Karnataka (GoK)
articulated the need for augmenting the bulk water supply, initiating reforms in distribution networks,
volumetric pricing and gradual private sector participation in the delivery of water supply in the state.
Until 2003, the Karnataka Urban Water Supply and Drainage Board (KUWSDB) was responsible for

40| P u b l i c P r i v a t e P a r t n e r s h i p s i n U r b a n W a t e r S u p p l y i n I n d i a
sourcing bulk water and supplying it to the distribution points in the cities. The distribution of water to
the urban households was operated and managed by the respective ULBs. Over the years, the ULBs
have performed poorly due to the lack of funding to maintain the distribution network and to ensure
continuous water supply.
In order to implement the policy and to test the possibility of 24*7 continuous water supply, the GoK
launched the Karnataka Urban Water Supply Improvement Project (KUWASIP) in 2005 with assistance
from the International Bank for Reconstruction and Development (IBRD), a component of the World
Bank. The two bodies collaborated to jointly finance the project and leverage the expertise of the World
Bank in project delivery and social intermediation to meet the project objectives.
Structure of KUWASIP
The project consists of two components:
i) Rehabilitation of the distribution network in the demonstration zones of the selected cities and
operations of the same: This was to be done on a PPP basis (performance based management contract)
ii) Priority Investments (PI) for enhancing bulk system capacities and increasing their efficiency by
reducing transmission losses: This was to be done on an EPC basis with the nodal agency being
KWSDB.
The total project cost was Rs. 237 crore, funded by the World Bank and the Government of Karnataka.
A detailed structure of the allocation of investments is given in Exhibit 2a below.
Exhibit 2a: Financial Structure of KUWASIP
Sources of Funds Amount ( Rs. Crore)
International Bank for Reconstruction and Development 182
Government of Karnataka 55
Total 237
Use of Funds
Technical Assistance 11.75
Physical Investments 1) Rehabilitation for Distribution Network in Demonstration Zones
- Phase II - Phase III
2) Priority Investments
42 22.6 154.5
Project Implementation Support 8.15
Total 237
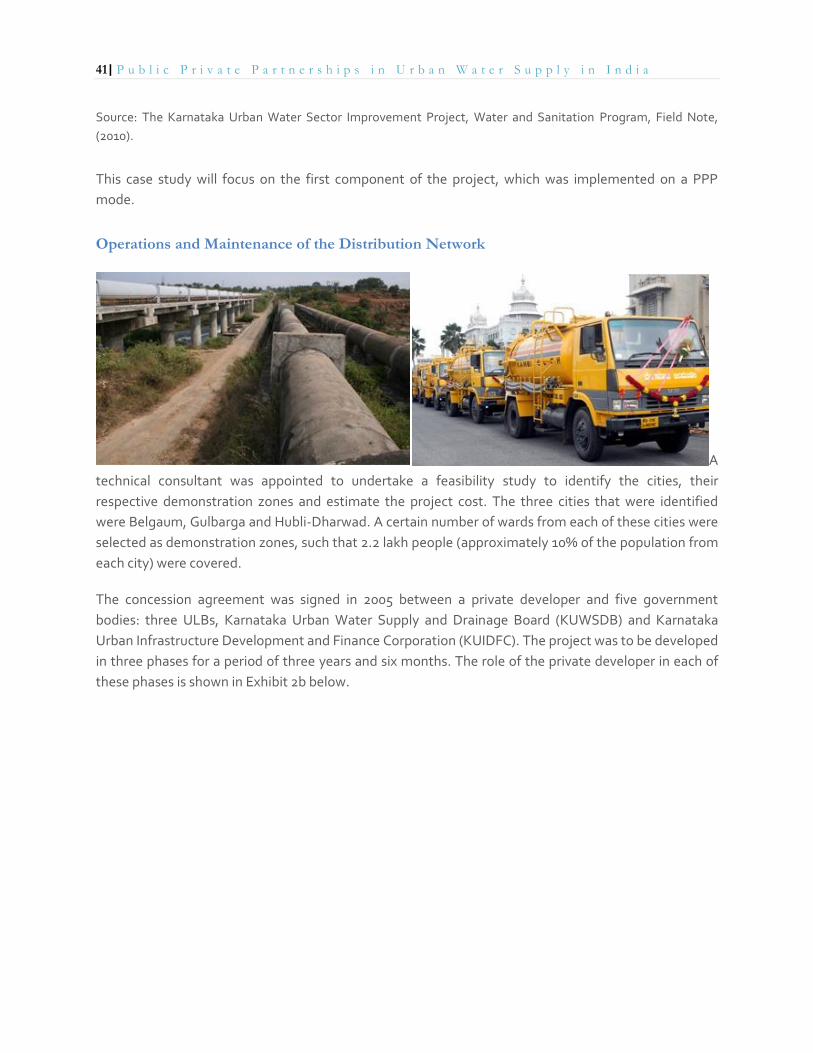
41| P u b l i c P r i v a t e P a r t n e r s h i p s i n U r b a n W a t e r S u p p l y i n I n d i a
Source: The Karnataka Urban Water Sector Improvement Project, Water and Sanitation Program, Field Note,
(2010).
This case study will focus on the first component of the project, which was implemented on a PPP
mode.
Operations and Maintenance of the Distribution Network
A
technical consultant was appointed to undertake a feasibility study to identify the cities, their
respective demonstration zones and estimate the project cost. The three cities that were identified
were Belgaum, Gulbarga and Hubli-Dharwad. A certain number of wards from each of these cities were
selected as demonstration zones, such that 2.2 lakh people (approximately 10% of the population from
each city) were covered.
The concession agreement was signed in 2005 between a private developer and five government
bodies: three ULBs, Karnataka Urban Water Supply and Drainage Board (KUWSDB) and Karnataka
Urban Infrastructure Development and Finance Corporation (KUIDFC). The project was to be developed
in three phases for a period of three years and six months. The role of the private developer in each of
these phases is shown in Exhibit 2b below.

42| P u b l i c P r i v a t e P a r t n e r s h i p s i n U r b a n W a t e r S u p p l y i n I n d i a
Exhibit 2b: Phases of the Management Contract
Source: Athena Research
In the first phase, an assessment of the existing network of pipelines was undertaken. Several technical
challenges were faced by the private developer in identifying the leakages as a detailed underground
network map was unavailable. Further, it was discovered that the pipes could not withstand high
pressure and were also placed at shallow depths which could result in damage to the pipes due to
vehicular traffic. Thus, a complete replacement of the distribution network was proposed. The amount
of investment proposed by the concessionaire was Rs. 26 crore, which was much lower than what was
estimated by the technical consultants (Rs. 42 crore) which was subsequently approved by the
government.

43| P u b l i c P r i v a t e P a r t n e r s h i p s i n U r b a n W a t e r S u p p l y i n I n d i a
In the second phase, the private developer appointed three sub-contractors who would be responsible
for each component of the O&M operations: pipeline renewal, installation of meters and consumer
connections, and issuance of bills and collection of tariffs. Even though this phase was to be completed
in 58 weeks, it got deferred by another 16 weeks due to a delay in the approval of the sub-contractors
by the nodal agencies.
A technical auditor was appointed by the government to assess the key performance indicators to be
met by the private developer. This task was undertaken during the last six weeks of phase 2. The
indicators proposed by the auditor included:
24*7 continuous water supply to 90% of the demonstration zone.
90% metering coverage and issuance of bills
Reduction in water losses to 30 liters/connection/day/meter pressure
90% of the customer services stations to be operational
The private developer completed this phase successfully and started with phase three (operations of
the distribution network) in April 2008.
Stakeholder Model
Throughout the project period, the ownership of the assets was with the ULBs. The responsibility of
operations and management was to be transferred to the ULB at the end of the concession period. The
private developer was not entrusted with the responsibility for tariff setting. KUIDFC was responsible
for monitoring the developer and coordinating between various stakeholders. A detailed stakeholder
model for the project is given below.

44| P u b l i c P r i v a t e P a r t n e r s h i p s i n U r b a n W a t e r S u p p l y i n I n d i a
Exhibit 2c: Stake holder model of KUWASIP
Source: Athena Research
A certain amount of remuneration was provided to the private developer to carry out the functions in
each of the phases. In order to incentivize the private developer to avoid cost overruns and time delays,
be efficient in use of capital and resources and meet the key performance indicators, the scope of the
project provided bonuses based on the specific requirements that were met. The details of the
remuneration and the bonuses are given in Exhibit 2d below.
Exhibit 2d: Remunerations and Bonuses Allocated to the Private Developer
Remuneration
Fixed remuneration – 60% of the total remuneration which is paid in quarterly installments
throughout the project period
Performance remuneration – 40% of the total remuneration which is paid in quarterly installments
during the operations and management phase, only if the key performance indicators are met
Retention money – 10% of the total remuneration which is paid on successful completion of the
project

45| P u b l i c P r i v a t e P a r t n e r s h i p s i n U r b a n W a t e r S u p p l y i n I n d i a
Bonuses
Capital efficiency during rehabilitation phase
For savings 25% of the total capital expenditure, bonus equals 3.75% of the total remuneration
For savings 25% of the total capital expenditure, bonus equals 10% of the total remuneration
Capital efficiency during O&M phase
For savings 25% of the total O&M expenditure, bonus equals 15% of the total remuneration
For savings 25% of the total O&M expenditure, bonus equals 40% of the total remuneration
Performance efficiency during O&M phase
For reduction in real losses between 15 & 20%, bonus equals 20% of the total remuneration
For reduction in real losses 20%, bonus equals 30% of the total remuneration
Percent increase in billed volume to the base volume of bulk water supplies is
25% , bonus equals 12% of the total remuneration
25%, bonus equals 30% of the total remuneration
Source: The Karnataka Urban Water Sector Improvement Project, Water and Sanitation Program, Field Note,
(2010).
The private developer utilized less than 25% of the funds allocated for the capital and operations
expenditure thereby earning a capital efficiency bonus of 3.75% and 15% of the total remuneration. In
addition, it also met all the performance targets that were set by the implementing agencies and the
technical consultant, thereby earning a performance efficiency bonus as well.
Key Lessons
Pre–project assessment should be carried out by the implementing agencies
The private developer faced difficulties while designing the detailed project report, as the quality of
information available about the distribution network was poor. All the three ULBs and KWSDB did not
have any records of the underground pipeline system and the number of connections. These studies
should be carried out by the implementing agencies before the project is awarded as it brings more
clarity in the scope of the project.
Co-operation by the Government
There should be sustained co-operation amongst the various levels of government and also with the
private developer. This can shorten several delays in the project. Some of the delays faced by the
developers in the project include getting approval from the implementing agencies for the selected
sub-contractors, non-availability of bulk water from the KWSDB to the distribution points during the

46| P u b l i c P r i v a t e P a r t n e r s h i p s i n U r b a n W a t e r S u p p l y i n I n d i a
demonstration phase and delay in release of payments to the private developer by the implementing
agencies.
Formation of Social Intermediation and Communications Strategy Cell (SICS)
The SICS was formed under the KUIDFC comprising the representatives from each of the government
bodies and NGOs. A budget of Rs. 2 crore was allocated for the activities to be undertaken by them.
These included customer surveys to assess the need for continuous water supply and the willingness to
pay volumetric tariffs, and raising awareness about water usage and hygiene factors.
Approach of a phased project
A major factor contributing to the success of the project was the approach adopted for its
implementation. It allowed for the flow of funds in installments, specifically focusing on the
performance of the developer. The approach called for phased implementation of the project in a
selected demonstration zone which helped to reduce the risk burden on the private developer. Phased
implementation also allowed for formulation of realistic expectations regarding the performance, cost
and delivery. Additionally, it helped to prove to all the stakeholders that continuous water supply with
the collection of volumetric tariffs was possible.
Implementation of pro-poor policy
The project took the needs and constraints of the urban poor into account. The urban poor were
identified as those residing in houses with less than 600 square feet of built-up area. These people were
given a waiver of initial deposit for getting a connection and were charged concessional rates for a life-
long supply of 8,000 liters per household per month. Also, some water was supplied free of charge
through public kiosks, cisterns and bore wells fitted into hand pumps for the most vulnerable sections
of the society.
Current Status
After completing the project in 2010, the operations and maintenance of the water distribution system
in the demonstration zones of the selected cities of Karnataka was re–tendered. The financial bid
parameter was decided based on the cost charged by the private developer for operating the water
distribution system. This cost was,once again, divided into a fixed component and a variable
component based on the performance of the developer. The project was awarded to the same private
developer who had earlier implemented the project. Currently, the government is structuring the
project for expanding the rehabilitation of the water network system in other cities.

47| P u b l i c P r i v a t e P a r t n e r s h i p s i n U r b a n W a t e r S u p p l y i n I n d i a
3. THE KHANDWA WATER SUPPLY PROJECT
Background
The Khandwa Municipal Corporation (KMC) had estimated the city’s population to be 2, 25,373 in 2004.
The water required to meet the demand of the population was estimated to be 29 million liters per day
(MLD) based on the standard assumption of providing each individual with 135 liters per day, as
formulated by CPHEEO. However, the KMC had the capacity to supply only 17.20 MLD from its three
main sources of water namely, Bhagwant Sagar Reservoir (Sukta Dam), Nagchun Dam and ground
water, with each of them contributing 10.5 MLD, 1.2 MLD and 5.4 MLD, respectively. Around 60% of
the water supplied to the towns was drawn from the Sukta Dam. Despite the KMC’s claim that 80% of
the town had access to water supply, it was discovered that large residential colonies comprising of 15
wards did not have piped water supply and were dependent largely on private water tankers to meet
their needs. Since 2004, various efforts have been undertaken by the KMC to meet the deficit of 11.8
MLD of water.
First, the KMC tried to increase the quantity of water drawn from the Sukta Dam. This required
replacing the open drain with a pipeline from the reservoir to the treatment plant and an additional
installation of a 28-inch pipeline from the treatment plant to the augmentation centre. Housing and
Urban Development Corporation (HUDCO) was approached for credit and were willing to provide a
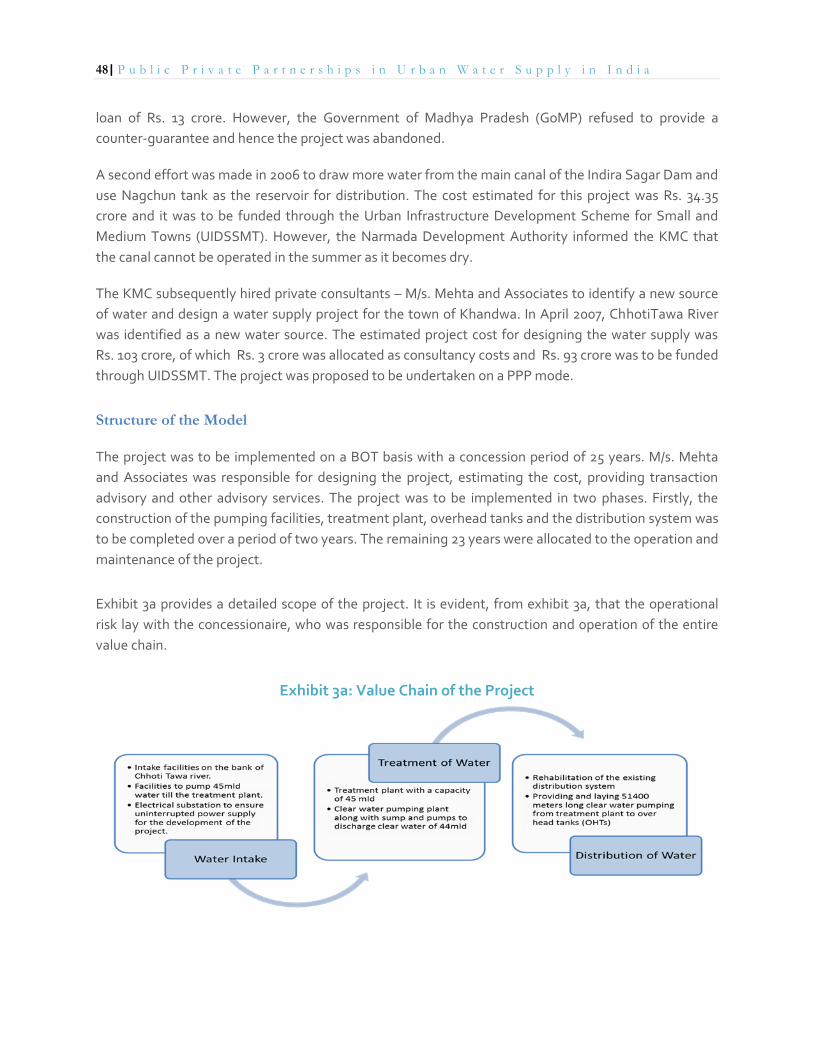
48| P u b l i c P r i v a t e P a r t n e r s h i p s i n U r b a n W a t e r S u p p l y i n I n d i a
loan of Rs. 13 crore. However, the Government of Madhya Pradesh (GoMP) refused to provide a
counter-guarantee and hence the project was abandoned.
A second effort was made in 2006 to draw more water from the main canal of the Indira Sagar Dam and
use Nagchun tank as the reservoir for distribution. The cost estimated for this project was Rs. 34.35
crore and it was to be funded through the Urban Infrastructure Development Scheme for Small and
Medium Towns (UIDSSMT). However, the Narmada Development Authority informed the KMC that
the canal cannot be operated in the summer as it becomes dry.
The KMC subsequently hired private consultants – M/s. Mehta and Associates to identify a new source
of water and design a water supply project for the town of Khandwa. In April 2007, ChhotiTawa River
was identified as a new water source. The estimated project cost for designing the water supply was
Rs. 103 crore, of which Rs. 3 crore was allocated as consultancy costs and Rs. 93 crore was to be funded
through UIDSSMT. The project was proposed to be undertaken on a PPP mode.
Structure of the Model
The project was to be implemented on a BOT basis with a concession period of 25 years. M/s. Mehta
and Associates was responsible for designing the project, estimating the cost, providing transaction
advisory and other advisory services. The project was to be implemented in two phases. Firstly, the
construction of the pumping facilities, treatment plant, overhead tanks and the distribution system was
to be completed over a period of two years. The remaining 23 years were allocated to the operation and
maintenance of the project.
Exhibit 3a provides a detailed scope of the project. It is evident, from exhibit 3a, that the operational
risk lay with the concessionaire, who was responsible for the construction and operation of the entire
value chain.
Exhibit 3a: Value Chain of the Project

49| P u b l i c P r i v a t e P a r t n e r s h i p s i n U r b a n W a t e r S u p p l y i n I n d i a
Source: Athena Research
Due to delays in preparing the Detailed Project Report, the project cost inflated to Rs. 115.32 crore. In
2009, a Concession Agreement was signed between KMC and Vishwa Infrastructures to implement the
project. The bid criterion for the selection of the concessionaire was the lowest capital cost estimated
and the lowest tariff charged from the water users.
Revenue Structure
The total project cost was Rs. 115.32 crore. The capital expenditure of Rs. 93.25 crore was to be financed
by a government subsidy through the UIDSSMT. This is a grant that ULBs receive from the State and
the Central Government for their willingness to implement Municipal Reforms under the UIDSSMT. The
subsidy was to be deposited in installments by the state nodal agency into the account of the private
concessionaire for executing the project. The rest of the project cost was to be financed by the
concessionaire itself. An upfront equity of Rs. 5.51 crore was made by the private developer. The
remaining amount (Rs. 16.55) was financed through debt. So the share of GoI and GoMP together in the
project was 81% and the share of the private concessionaire was 19%. The KMC did not have any funds
of its own to invest. The various sources of financing and its utilization have been given in the exhibit
below.
Exhibit 3b: Financial Structure of the PPP Model
Sources of Funds Amount ( Rs. Crores)
Urban Infrastructure Development Scheme for Small & Medium Towns (UIDSSMT)
93.25
Debt 16.5525
Private Equity 5.5175
Total 115.32
Use of Funds
Project Preparation and Consultancy Services 3.45
Capital Costs 111.87
Total 115.32
Source: Dwivedi, G., “Public Private Partnerships & Lessons from Tiruppur Water Supply and Sewerage Project,”
ManthanAdhyayan Kendra, 2008 and Athena Research.

50| P u b l i c P r i v a t e P a r t n e r s h i p s i n U r b a n W a t e r S u p p l y i n I n d i a
The cost of operations and management/maintenance was to be financed through the revenue
generated from the collection of tariffs. The concessionaire was responsible for establishing a
volumetric metering system and collecting water tariffs, which then had to be transferred to the KMC’s
escrow account. The private developer was paid by the KMC based on collection efficiency. The
stakeholder model of the project has been provided below.
Exhibit 3c: Stakeholder Model
Source: Athena Research
The estimated Internal Rate of Return (IRR) for the project was 12%. This was based on the bid price of
the treated water per kilolitre that would be charged by the company to cover its O&M costs over the
concession period, the construction costs incurred by it and the interest payments on debt. This
excludes the share of GoI and the GoMP made under the provision of the UIDSSMT.
The supply of water was to be undertaken in two phases. The first phase allowed supply of only 17 MLD
of water for the first four years of the O&M component of the project. This would be increased to 30
MLD from the fifth year, once all connections to the domestic households, commercial institutes and
industries are released. The concessionaire had estimated distribution losses of 15% (approximately 5
MLD of water). Therefore, in the second phase, the target for water supply was 34.74 MLD.
The O&M costs proposed by the private developer for the first phase was Rs. 7.62 crore per annum, i.e.
Rs. 63.75 lakh per month. The concession agreement included a provision for cost escalation at 10% per
annum. To meet these costs, the water tariff proposed by the concessionaire was Rs. 11.95 per kilolitre
of water supplied and there was a provision that allowed this to be increased by 10% every third year;

51| P u b l i c P r i v a t e P a r t n e r s h i p s i n U r b a n W a t e r S u p p l y i n I n d i a
i.e. after every two years.17. A similar revenue structure covering operations and maintenance costs and
generating profits is expected to be implemented in the second phase.
Lessons
Government grants attract private participation
The financial structure of the project plays an important role in attracting the developer. A grant given
by the State and Central Government via the UIDSSMT scheme covered around 80% of the total
project cost which reduced the financial risk borne by the private concessionaire.
Governance and regulatory issues
According to the private developer, the project will be successful as there is a strong commitment by all
the stakeholders and the government has been showing keen interest, ensuring a mobilization of
political will. Minor delays however were faced in acquiring land and releasing funds.
Willingness to pay water tariffs by the community
The revenue structure was designed while the project was still in its implementation phase. However,
this structure is yet to be finalized by the project implementers. The question that needs to be
addressed is the ability of the concessionaire to recover the costs. This is because nearly 40% of the
population in Khandwa lives in the slum areas and the average cost recovery of expenses by the KMC
during 2005 to 2008 was only 32.48%.18
Raising Awareness
Awareness projects were conducted by the concessionaire in association with local NGOs. The focus of
the campaign was to create awareness in schools and hospitals about the quality of water and the
availability of 24x7 water. The primary objective of such campaigns was to get public acceptance and
avoid conflict or any other related hurdles at a later stage.
Current Status
The project was commissioned to be completed in March 2012. This deadline was not met due to a
delay in setting up electro mechanical systems for the project and commissioning the distribution
network. After construction, the supply of water will be undertaken in a phased manner in select wards
17 Based on this, the concessionaire, during the first phase of the water supply, could barely break even with an estimated
revenue of ` 7.70 crore 18
For further details refer to ‘Dwivedi, Guarav and Rehmat, ‘Private Water Supply Augmentation Project for Khandwa Town in
MP under UIDSSMT: A Case Study of the Impacts of the Project,’ ManthanAdhyayan Kendra. (2011).

52| P u b l i c P r i v a t e P a r t n e r s h i p s i n U r b a n W a t e r S u p p l y i n I n d i a
as demonstration. This will be gradually expanded to the rest of the town and complete operation of
the water supply system will commence. The revenue structure of the project has not been finalized
yet, despite the submission of the water tariff by the concessionaire during the bidding process. There
are ongoing discussions between the developer and the government on making annual payments to
the concessionaire in proportion to the revenue collection by the KMC.

53| P u b l i c P r i v a t e P a r t n e r s h i p s i n U r b a n W a t e r S u p p l y i n I n d i a
REFERENCES
Browne and Mohan Management Consultancy (2010). PPP Models for Water Supply: an Evaluation. Browne
and Mohan, India.
Census of India (2011).Main Source of Drinking Water 2001-11.Ministry of Home Affairs, Government of
India, New Delhi.
Department of Economic Affair (2010). Risk – A critical focus of PPP Design. PPP Toolkit for Improving
PPP Decision Making Processes, Public Private Partnerships in India. Accessed from
http://toolkit.pppinindia.com/
Dwivedi, Guarav (2008). Public Private Partnerships and Lessons from Tirupur Water Supply and Sewerage
Project.ManthanAdhyayan Kendra, Badwani.
Dwivedi, Guarav (2011). Private Water Supply Augmentation Project for Khandwa Town in MP under
UIDSSMT: A Case Study of the Impacts of the Project. ManthanAdhyayan Kendra, Badwani.
Infrastructure Leasing and Financial Services (2005). Tirupur Water Supply Project- Innovation Report.The
Indian Innovation Awards 2005, IL&FS.
IL&FS Water Limited (2011). Presentation to Working Group on Urban and Industrial Water Supply and
Sanitation for the Twelfth Five Year Plan (2012-17). Accessed from
http://urbanindia.nic.in/programme/uwss/uiww/PPT_6th_Meeting/PPT_IL_FS_Water.pdf
Kingdom, Bill, Roland Liemberger and Phillippe Marin (2006). The Challenge of Reducing Non – Revenue
Water (NRW) in Developing Countries. The Water Supply and Sanitation Sector Board Discussion Paper
Series, 8.The World Bank Group, Washington DC.
Madhav, Roopa (2008). Tirupur Water Supply and Sanitation Project: An Impediment to Sustainable Water
Management. International Environmental Law Research Centre Working Paper, 1.Swiss National Science
Foundation, Geneva, Switzerland.
Mahalingam, Ashwin., Ganesh A Devkar, and Satyanarayana N Kalidindi (2011). A Comparative Assessment
of Public – Private Partnership (PPP) Coordination Agencies in India: What Works & What Doesn’t. Public
Works Management and Policy, 20(10),pp. 1-32. Sage Publication, India.
Ministry of Environment & Forest (2009).State of Environment Report – India.Government of India, New
Delhi.
Ministry of Urban Development (2005).JnNURM Brochure. Government of India, New Delhi.
Ministry of Urban Development (2006).Modified JnNURM Guidelines – UIG. Government of India, New
Delhi
Ministry of Urban Development (2010). Service Level Benchmarking Databook: Improving Service
Outcomes 2008 – 09. Ministry of Urban Development, Government of India, New Delhi.
54| P u b l i c P r i v a t e P a r t n e r s h i p s i n U r b a n W a t e r S u p p l y i n I n d i a
Ministry of Urban Development (2011). Jawaharlal Nehru National Urban Renewal Mission Monitoring
Format: Fund Allocation and Release (UIG) Summary statement Report.
Ministry of Urban Development (2011). Jawaharlal Nehru National Urban Renewal Mission Monitoring
Fund Allocation and Utilization (BSUP/ IHSDP): Summary statement Report.
Ministry of Urban Development (2011). Jawaharlal Nehru National Urban Renewal Mission Monitoring
Format: Fund Allocation and Utilization (UIG/ UIDSSMT) Summary statement Report.
Ministry of Urban Development (2011). Report on Indian Urban Infrastructure and Services. High Powered
Expert Committee Report, Government of India, New Delhi.
The World Bank (2008).How the Private Sector Can Help: A Look at Performance – Based Service
Contracting. The World Bank Group, Washington DC.
The World Bank (2010). The Karnataka Urban Water Sector Improvement Project, Water and Sanitation
Program, Field Note.

55| P u b l i c P r i v a t e P a r t n e r s h i p s i n U r b a n W a t e r S u p p l y i n I n d i a
Athena Infonomics India Pvt. Ltd. 6th Floor, B Block, Mena Kampala Arcade Sir Theagaraya Road, T. Nagar, Chennai – 600017 Ph: +91 44 42327112/13, 28152778 Fax: +91 44 28152778 www.athenainfonomics.in