Public Perceptions to Travel Demand Management …paspk.org/wp-content/uploads/proceedings/51,...
13
Research Article ———————————————— Received, March 2013; Accepted, January 2014 * Corresponding author: Muhammad A. Javid: Email: [email protected] Proceedings of the Pakistan Academy of Sciences 51 (1): 17–29 (2014) Pakistan Academy of Sciences Copyright © Pakistan Academy of Sciences ISSN: 0377 - 2969 (print), 2306 - 1448 (online) Public Perceptions to Travel Demand Management Measures in Lahore, Pakistan: Analysis and Implications Muhammad A. Javid 1* , Toshiyuki Okamura 2 , Fumihiko Nakamura 3 , Shinji Tanaka 3 , and Rui Wang 3 1 Department of Transportation Engineering and Management, University of Engineering and Technology, Lahore, Pakistan 2 Faculty of Regional Development Studies, Toyo University, 2-36-5, Hakusan, Bunkyo-ku, Tokyo, 112-0001, Japan 3 Department of Civil Engineering, Yokohama National University, 79-5 Tokiwadai, Hodogaya-ku, Yokohama, 240-8501, Japan Abstract: This study aims to analyze travel behavior pattern, and identify the nature of relationships among socio-economic demographics (SEDs) and travel demand management (TDM) measures. A questionnaire survey was conducted in Lahore, Pakistan and 631 samples were collected. Initially, cross analysis of vehicle ownership and modal share was conducted to classify the sample into four segments, i.e., car oriented, motorcycle oriented, public transport roiented, and non-motorized modes oriented. The results of cross analysis indicated that the use of cars increased with an increase in education level, and decreased with size of the households. People having private vehicles prefer to use those, instead of availing public transport. However, most of the private vehicle users have favorable evaluation of public transport improvement strategy. Perceptions for TDM measures vary among the four segments of mode users. Optimal ranking of TDM measures places advance traffic information and public transport improvement at the top, and parking charges and fuel tax at the bottom. Ordinal regression analysis was conducted by applying Logit model, and relationships were determined among various SED variables and TDM measures. Modeling results revealed that income, education, gender, and current travel mode are significant determinants of commuter’s attitudes towards the selected TDM measures. Among all factors, respondent’s education level was observed to be the most influencing factor. However, different SED factors affect the consideration of TDM measures differently. The results of this study can help the transport planners and policy makers in arriving at appropriate TDM measures for specific segment of the travel market. Keywords: Travel demand management, travel behavior, SEDs, public perception, traffic congestion, Lahore 1. INTRODUCTION 1.1 Background The rapid increase in car ownership and its usage has resulted congestion related problems in developing cities. Other factors that contribute in resulting traffic congestion are people’s disorder driving behaviour, limited supply of infrastructure, inefficient use of existing facilities and absence of traffic enforcements. The trend of using private vehicle tends to shape the cities as auto dependent. Travel demand of passengers has increased rapidly and leading to complexity of handling the situation effectively. The imbalance between demand and supply has resulted road congestion, thus condensing the urban mobility. It is unfair to build more road infrastructure just to facilitate car users and neglecting the mobility of poor people
Transcript of Public Perceptions to Travel Demand Management …paspk.org/wp-content/uploads/proceedings/51,...

Research Article
————————————————Received, March 2013; Accepted, January 2014
* Corresponding author: Muhammad A. Javid: Email: [email protected]
Proceedings of the Pakistan Academy of Sciences 51 (1): 17–29 (2014) Pakistan Academy of SciencesCopyright © Pakistan Academy of SciencesISSN: 0377 - 2969 (print), 2306 - 1448 (online)
Public Perceptions to Travel Demand Management Measures in Lahore, Pakistan: Analysis and Implications
Muhammad A. Javid1*, Toshiyuki Okamura2, Fumihiko Nakamura3, Shinji Tanaka3, and Rui Wang3
1Department of Transportation Engineering and Management, University of Engineering and Technology, Lahore, Pakistan2Faculty of Regional Development Studies, Toyo University,
2-36-5, Hakusan, Bunkyo-ku, Tokyo, 112-0001, Japan3Department of Civil Engineering, Yokohama National University,
79-5 Tokiwadai, Hodogaya-ku, Yokohama, 240-8501, Japan
Abstract: This study aims to analyze travel behavior pattern, and identify the nature of relationships among socio-economic demographics (SEDs) and travel demand management (TDM) measures. A questionnaire survey was conducted in Lahore, Pakistan and 631 samples were collected. Initially, cross analysis of vehicle ownership and modal share was conducted to classify the sample into four segments, i.e., car oriented, motorcycle oriented, public transport roiented, and non-motorized modes oriented. The results of cross analysis indicated that the use of cars increased with an increase in education level, and decreased with size of the households. People having private vehicles prefer to use those, instead of availing public transport. However, most of the private vehicle users have favorable evaluation of public transport improvement strategy. Perceptions for TDM measures vary among the four segments of mode users. Optimal ranking of TDM measures places advance traffic information and public transport improvement at the top, and parking charges and fuel tax at the bottom. Ordinal regression analysis was conducted by applying Logit model, and relationships were determined among various SED variables and TDM measures. Modeling results revealed that income, education, gender, and current travel mode are significant determinants of commuter’s attitudes towards the selected TDM measures. Among all factors, respondent’s education level was observed to be the most influencing factor. However, different SED factors affect the consideration of TDM measures differently. The results of this study can help the transport planners and policy makers in arriving at appropriate TDM measures for specific segment of the travel market.
Keywords: Travel demand management, travel behavior, SEDs, public perception, traffic congestion, Lahore
1. INTRODUCTION
1.1 Background
The rapid increase in car ownership and its usage has resulted congestion related problems in developing cities. Other factors that contribute in resulting traffic congestion are people’s disorder driving behaviour, limited supply of infrastructure, inefficient use of existing facilities and absence of
traffic enforcements. The trend of using private vehicle tends to shape the cities as auto dependent. Travel demand of passengers has increased rapidly and leading to complexity of handling the situation effectively. The imbalance between demand and supply has resulted road congestion, thus condensing the urban mobility. It is unfair to build more road infrastructure just to facilitate car users and neglecting the mobility of poor people

18 Muhammad A. Javid et al
such as non-motorized and public transport mode users. In developing countries, the main focus is on supply side measures to meet the increased demand of travel. However, lack of space and technical abilities, lacking in financial and institutional resources, and environment sustainability related problems have forced to look for demand side solutions with supply side solutions. In this context, Travel demand management (TDM) measures are considered as effective tools in influencing the travel behaviour and have impact on reduction in travel time and cost, and convenience of travel options [1]. It is vital to promote such policies that should reduce the advantage of car use and increase benefits of public transport usage [2]. TDM strategies are mainly classified into two categories such as push or disincentive measures aiming to reduce the advantages of car use (e.g. increase in fuel and road taxes), and pull or incentive measures where alternative travel choices are provided (e.g. improved public transport, van pooling, HOVs lanes) [3]. Another classification of policies includes hard measures such as road pricing, parking charges, new public transport service and soft measures such as workplace travel plans, personalized travel planning, public transport marketing and travel awareness campaigns [4].
Now-a-days, managing travel demand has widened the need of optimizing the performance of transportation system for commuting and non-commuting trips and for recurring and non-recurring congestion events [5]. TDM strategies that promote cheaper travel choices will be effective for a major portion of residents in developing countries [6]. TDM measures such as education and awareness campaigns, promotion of online or tele-working, support for ridesharing, public transport improvement and implementation of land use policies can reduce the vehicle trip. Introduction of parking restraints, and support for pedestrians and cyclists can also be effective in altering the travel pattern [7]. Imposing vehicle ownership taxes and other vehicle related taxes like road tax and parking charges may discourage both car ownership and usage [8]. The acceptability of a TDM measure is important to evaluate that whether a specific strategy will effectively change travel behaviour of commuters or not [9]. In different studies, push
measures like road pricing and parking charges perceived low acceptance from public compared to pull measures like public transport improvement [10-11). However, commuters normally perceive pull measures to be more suitable, even push measures often estimated to influence car use decrease largely [3, 12]. Moreover, the acceptability of a measure is important if its objective has to achieve [9, 13].
1.2 Scope and Objectives of Study
Lahore is the second largest city of Pakistan with population of almost 8.65 million and area about 1792 Km2 [14]. The population has nearly doubled in last 20 years which represents 3% growth rate per annum [14]. It is believed that Lahore city has immense potential of mass transit development considering the number of trips generated due to high density development in the inner zone. Population density varies from 450 persons per hectare in the inner zone to 100 persons per hectare in the outer zone [14]. The 80% of population is almost living within a radius of 7-8 km from the city centre [14]. The rapidly growing population and traffic demand has resulted chronic traffic congestion on road network despite significant development. Number of vehicles is increasing at an alarming rate i.e. 17 % per annum and major reasons of increase are the absence of an efficient public transport and government banking leasing policy for car ownership [14]. Other main factors in rapid increase of car ownership and usage are changing lifestyles, status symbol and low ownership and usage cost of automobile. Heavy traffic congestion on roads and the suffering of inhabitants from vehicle emissions demand alternative sustainable strategies to solve these problems. Vehicular traffic also threatens the pedestrian safety in busy urban areas [15]. The transportation policies are mostly developed just considering the benefits of automobile users, which impose greater external cost to most of the population. The fuel prices are increasing day by day and it is essential to focus on energy efficient transport. All these situations demand the consideration and implementation of demand side measures to solve congestion oriented problems, and ensure sustainability of the city.
It is believed that for successful implementation of demand management strategies, it is essential to

Travel Demand Management Measures in Lahore 19
evaluate acceptability of specific policy measures. People’s behaviour can be a key issue in the success of any policy measure. In this context, stated preference approach can apply to evaluate the anticipated acceptability of TDM strategies before implementation [11]. Many studies in developed countries explore the influence of socio-economic demographics, situational factors and freedom in travel on acceptability of various TDM measures [2-3, 16-18]. In developing countries, only few studies provide the evidence of impact of socio-economic factors on acceptance and effectiveness of TDM measures [11, 19-20]. However, it is very important to explore significant factors in the acceptability of policy measures in specific region. Therefore, this study aims to analyze the commuter’s travel behaviour pattern, and their attitudes towards selected TDM measures. Initially, sample has been segmented into four classes based on vehicle ownership and modal share of this study, and a comparison was made among four segments for socio-economic features, and perceptions to TDM measures. Ordinal Logit models have been developed to analyze influence of socio-economic characteristics on perceptions to each TDM measure. This paper has been organized in the following manner. Section 2 describes the questionnaire design and survey methods. Distribution of socio-economic characteristics of respondents is presented in section 3. Commuters’ opinions to TDM strategies and results of ordinal logit modelling are discussed in section 4. Last section describes the conclusions and policy implications of this study.
2. DATA COLLECTION METHODS
2.1 Questionnaire Design
The findings of this study are based on results of a questionnaire survey. Seeking the objectives a questionnaire was designed consisting of two parts. Personal and travel information were asked in part one of questionnaire i.e. gender, age, income, education, occupation, vehicle ownership, trip frequency with different modes and for different trip purposes, possesses driving license or not, drive car and motorcycle or not. Travel pattern with different modes and for different trip purposes were asked
using the following scale; never, a few times a year, a few times a month, 1-2 days a week, 3-4 days a week, and 5-7 days a week. In part 2 eight TDM strategies were selected seeking the feasibility of implementation in Lahore city, and presented in Table 3 with average response of respondents. The respondents were asked to give their opinion on each measure based on whether they support to a specific measure for reduction of traffic congestion or not. Carbon tax on gasoline only was included in case of fuel taxes considering the social impacts of tax on other fuels e.g. diesel, because increase in tax on diesel may result increase in prices of living goods. People’s willingness was also asked to pay road taxes for the improvements of traffic conditions, and support the increase in parking charges at office sites. The measures of willingness to do online or tele-work and participate in organization and institution based transport services were selected considering the current scenario and their future potential. Currently, some organizations and institutions are providing transport for their employees, and also provide home-based work for skilled workers. The inclusion of these measures would help in evaluating their future potential. The respondent’s willingness was asked for participation in traffic education and awareness programs, and use of public transport in case of better mode e.g. bus lanes or rapid rail mass transit. The respondent’s opinion was asked on provision of advance traffic information in order to alleviate traffic congestion. This questionnaire was designed to target current car users, and potential car users (current non car users). The rapid increase in car and motorcycle ownership as well as their usage in last ten years is the main reason of including opinions of potential car users. It was assumed that the attitudes of potential car users also needed to evaluate in advance towards TDM measures. In this study 4-point Likert scale was used to measure people’s response on stated questions of TDM measures. It was hypothesized that 4-point ordinal scale is appropriate considering a questionnaire survey in developing country and reliability of data in grasping the actual preferences. Therefore, 4-point scale was selected by seeking trade-off between simplicity of respondents in survey and data reliability.

20 Muhammad A. Javid et al
2.2 Survey and Sampling
This questionnaire survey was conducted in Lahore during September 2011 with the help of university graduate students. The students were trained and instructed for the objectives of survey. Main target groups were students, employees of different private and government organizations and people related to commercial and business sector. The other main objective of this survey was to target daily commuters, and get mix of different mode users. Thirteen locations were selected in Lahore metropolitan area seeking the objectives of survey
Fig. 1. Locations of the survey in Lahore, Pakistan (Source: Google map).
as presented in figure 1. The designed questionnaire initially was tested for concreteness and clarity through a pilot survey. Self-completion (by respondents) and interview approaches (interviews of respondents with the help of students) were used in survey deeming the literacy level of respondents. It was assured to conduct survey by interview from those respondents whose literacy level is low. The respondents were selected randomly at selected locations and total 1,000 questionnaires were used. The selected respondents were instructed about the contents of questionnaire and filling procedure to ensure the respondent understanding of

Travel Demand Management Measures in Lahore 21
questionnaire items, and the reliability of collected data. Only 668 filled questionnaires were obtained which represented 66.8% return rate. Almost 300 samples were not returned by respondents even after three weeks as most of the questionnaires were distributed at various locations, and some questionnaire forms were wasted during the survey. Later on 37 samples were discarded from collected 668 due to incomplete information and double answers on some questions. Therefore, results of only 631 samples were used in analysis and ordinal modelling.
3. RESULTS AND DISCUSSION
3.1 Distribution of Socio-Economic Characteristics
3.1.1 Overall Distribution
The share of female respondents is only 23.3 % percent of sample, which is quite less compared to total share of population. This is, because female do not drive motorcycle and bicycle, and do not work in commercial sectors (business, shops, etc.). The distribution of sample shows that 64.6% respondents have bachelor education or above, which is higher than the actual literacy rate in Lahore. It is due to presence of car and potential car users in large number in sample as they belong to medium to high household income category, and thus education level increases with the increase of household income. Sample represents a good mix of different mode users as well as occupations. The share of different modes in modal share follow as car (25.5%), motorcycle (35.5%), public transport [bus, wagon, Qingqi] (16.8%), auto-rickshaw/taxi (7.1%), office/school transport (5.9%), and walk/bicycle (9.2%). The share of students in sample is (23.6%), civil employees (20.8%), private employees (29%), entrepreneurs (15.7%), and others (11%). Collected samples nearly represent daily travelers in Lahore as 83.5% of respondents have trip frequency 5-7 days a week and 10.6% 3-4 days a week. Almost 33.3% respondents have car and 35.5% motorcycle driving license respectively. The respondents were also asked whether they drive car and motorcycle or not. Sample shows that 39.8% of respondents drive car and 52.5% motorcycle. It means that some people drive car and motorcycle even without
driving license. The respondents who drive vehicle asked for how they learned driving. Survey results show that 35.9% are self-trained, 52.7% learned driving from friends or family members and only 11.4% learned from a driving school. Almost 76.3 % respondents were aged between 21-40 years. Average monthly household and personal income of respondents lies in 21,000-30,000 PKR and 10,000-15,000 PKR respectively.
3.1.2 Cross Distribution of Vehicle Ownership and Modal Share
A cross-analysis was conducted between modal share and vehicle ownership of this study. Initially, sample was segmented for vehicle ownership into four classes i.e. no vehicle, only motorcycle, car and motorcycle, and only car. The results of cross analysis as shown in Table 1 depict that those respondents who have car and motorcycle prefer to use private vehicle instead of other modes. From this analysis, four segments were identified based on mode dependency and captivity of choice. These segments include car oriented including auto-rickshaw and taxi users (204), motorcycle oriented (224), public transport oriented including office or school transport users (145) and non-motorized group or green travelers (58).
3.1.3 Cross Analysis of Personal Information with Four Segments of Mode Users
The results of cross-analysis for socio-economic characteristics among identified four segments as presented in Table 2 show that male are dominant in motorcycle oriented group and female in car and public transport oriented group. This is, because female do not drive motorcycle and just travel as passenger, and in case of car, they can drive and travel as a passenger. It can be argued that the travel behavior of female is dependent on male in motorcycle oriented group. The use of car increases with the increase of age, and motorcycle is dominant mode for age group of 21-30 years. The use of public transport decreases with increase of age. These results reveal that income increases as people approaches to higher age, and this results increase in auto ownership and usage. The dominance of motorcycle in age group of 21-30 years indicates that graduate students, and

22 Muhammad A. Javid et al
fresh graduates and workers initially depend on motorcycle, and then with the increase of income approach towards car ownership and usage. The use of car is higher in small and motorcycle in large household. It is very realistic because household size decreases and car ownership increases with the increase of household income. The use of car again increases with the increase of education, whereas use of public transport decreases. This is, because education level in Lahore increases with the increase of household income which supports the findings of increase in car use with increase of education. Motorcycle group is dominant in middle income category. There is no significant variation among four groups for work or study trip. However, car and motorcycle oriented people travel more for shopping and recreational trips compared to public transport and non-motorized mode groups because later groups belong to low income category. This implies that these groups are very captive in mode choice and have low tendency for shopping and recreational trips. This may be due to expensive and inefficient public transport in the city.
3.2 Distribution of Respondents’ Socio-economic Characteristics
3.2.1 Average Rating of TDM Measures
A comparison was also conducted among four segments for average response to selected TDM measures. Advance traffic information measure has favorable evaluation from all groups. All groups have almost same intentions for participation in traffic education and awareness programs. Auto users have more favorable evaluation of tele-work strategy than non-auto users. It means these groups have more potential for such work because their education level is high and can easily get benefit of such opportunities. Public transport and car users have high positive evaluation of office or institution based transport service. It means that there is potential of providing office based transport service for employees and workers by targeting these specific people although the samples in non-motorized group are less. Car and motorcycle users have more willingness to use better mode of public transport such as bus lane or rail mass transit. Non-auto groups have less willingness because some of them may think that travel cost of these new modes
would be high and it is difficult for them to avail this better opportunity. However, the potential of auto users can be utilized with the provision of state of the art public transport in order to make significant promotion from auto to public transport. Motorcycle users have low willingness for increase of parking charges for reduction of traffic congestion whereas car and public transport users have high willingness for increase of parking charges. Public transport and NMM users have low willingness to pay road taxes and carbon tax on gasoline. This is obvious because these groups belong to low income category, and they consider inflation and social impacts in evaluation of fiscal measures. All strategies have been ranked based on overall average response and average response of four segments and an optimal ranking has been proposed as presented in Table 4. The ranking places pull measures at the top (highly favorable measures) and push measures at the bottom (less favorable measures).
3.2.2 Ordinal Regression Analysis
Ordinal logit models were developed to examine the influence of respondent’s socio-economic characteristics on their response to selected TDM measures. Appropriate observed variables of personal and trip information were coded as 1, 0 for modeling purpose. Education, personal income gender, and existing travel mode were used as independent variables. Personal income is used as independent variable instead of household income because vehicle ownership and education are highly correlated with the household income. Similarly, regression parameters were estimated for male instead of female because share of female workers and female headed household is quite less in Lahore and they travel less compared to male. It has been supposed that implementation of any strategy is likely to have more influence on travel attitudes of male than female as they travel more. Therefore, response of male respondents is more critical and need to evaluate primarily. It was also assumed that estimation of regression parameters is important for different mode users in order to make some important implications for each group regarding different measures although rating has been proposed from average response. Regression analysis will also help statistically in evaluating the attitudes of current car users and potential car

Travel Demand Management Measures in Lahore 23
Table 1. Distribution of modal share (frequent travel mode) across vehicle ownership.
Vehicle ownership
Car AR/ taxi MC Office/school transport
Public bus Public Wagon
Qingqi Walk/ Bicycle
No vehicle
Only MC
Car and MC
Only car
0.0
0.82
42.49
72.82
6.59
8.20
4.15
10.68
2.20
57.79
39.90
3.88
7.69
5.33
7.77
2.91
29.67
8.20
1.04
0.97
14.29
4.92
0.00
2.91
13.19
5.33
0.52
2.91
26.37
9.43
4.15
2.91
Note: AR: auto-rickshaw, MC: motorcycle, the above indexes are in %. Table 2. Cross distribution of socio-economic features with four segments.
Socio-demographics Car oriented (%)
Motorcycle oriented (%)
Public transport oriented (%)
Non-motorized oriented (%)
Gender Male Female Age ≤ 20 years 21-30 31-40 > 40 years Household members ≤ 5 > 5 Education Below bachelor Bachelor & above Personal Income Low income Middle income High income Household income Low income Middle income High income Work/study trip 5-7 days a week 3-4 days a week 1-2 days a week A few times a month Shopping trip Weekly A few times a month Recreational trip Weekly A few times a month
27.7 47.6
33.0 27.6 42.9 37.3
39.3 25.5
18.4 40.0
24.3 21.9 62.4
12.6 18.1 51.7
32.1 31.1 31.4 37.5
49.7 26.1
43.4 29.3
40.7 18.4
22.0 43.4 27.0 27.1
29.4 41.5
38.1 24.1
27.7 48.6 26.2
29.9 44.9 30.9
35.6 41.9 37.1 34.4
27.5 38.4
32.4 36.4
21.9 26.5
36.3 20.0 26.2 13.6
24.3 21.7
33.2 17.4
34.0 22.7 6.0
37.8 27.8 12.8
21.8 24.3 22.9 18.4
15.6 25.6
17.6 24.4
9.7 7.5
8.8 9.0 4.0
22.0
7.0 11.3
10.3 8.6
14.0 6.9 5.4
19.7 9.3 4.5
10.3 2.7 8.6 9.4
7.2 9.9
6.6 9.9

24 Muhammad A. Javid et al
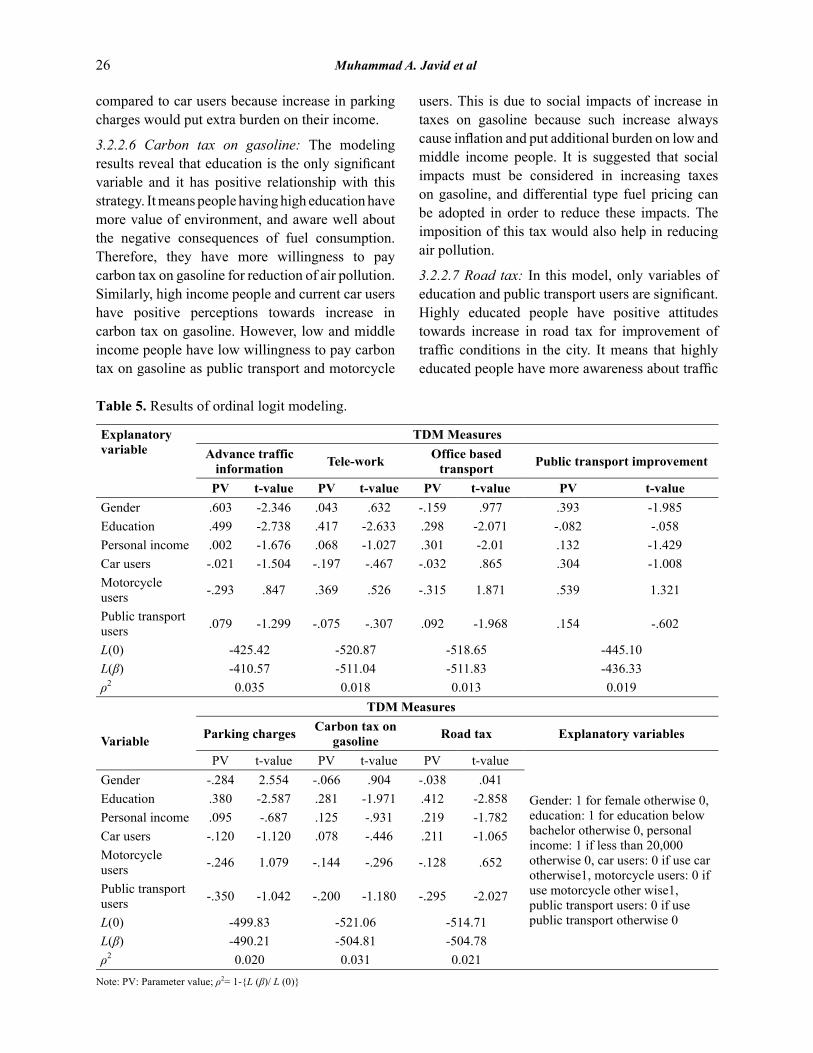
users (e.g. current motorcycle and public transport users) towards TDM measures. Moreover, multi-collinearity was checked among independent variable, values of variance inflation factor (VIF) found on lower side i.e. less than 3.0. In the field of statistics, it is believed that the multi-collinearity among independent variables does not exist if VIF values are less than 5 or even 10 [21-22]. The detail of explanatory variables and modeling results is given in Table 5. Parameters for traffic education and awareness measure were not presented here because model estimation did not find any significant model and parameter values. The estimated values of ρ2 are found to be on lower sides which show low reliability of models. However, some important implications can be made from significant explanatory variables for each policy measure.
3.2.2.1 Advance traffic information: Modeling results for this measure show that gender, education, and personal income have significant impact on commuter’s perceptions to advance traffic information. The male respondents have positive attitudes towards this measure because they travel more and provision of advance traffic information would help in making their trips efficient. Increase in education and personal income result positive attitudes towards this measure. It means people who have high education feel that this measure would be appropriate to alleviate traffic congestion. It would be easy for such class of people to get latest information using different sources such as mobile phone, internet, and variable message signs. However, affordability of sources to get information, and readability of text information are key issues associated with low income and low educated people.
3.2.2.2 Tele-work: The respondent’s education is the only significant explanatory variable in the model of tele-work strategy. The respondents with higher education have positive attitudes towards acceptance of this measure. This is, because highly educated people have more awareness about such works, and potential to do compare to low educated people. This potential can be utilized for reduction of private vehicle trips, because one main reason of using private vehicle is the part-time work or side business. If skilled and highly educated people can get such part time opportunity through online
working programs then it would help in reducing the use of private vehicle. Car and public transport users have negative attitudes towards this strategy whereas motorcycle users have positive propensity. It means middle income people with higher education should be the target group of this policy because motorcycle users mainly belong to middle income category such as fresh graduates and age group of 21-30 years. Moreover, trend of doing part-time work is more in middle income group, and provision of this policy would help them in reducing the travel of private vehicle.
3.2.2.3 Office based transports service: The respondent’s education, income and variable of public transport users are significant determinants of people’s attitudes towards office based transport policy. Education and income have positive association with respondent’s participation in transport service from organizations or institutions. Public transport users also have positive attitudes towards this service because they belong to low to middle income category and this service will be cheaper as compare to public transport. The male respondents, car and motorcycle dependent people have negative attitudes towards transport service which indicates high auto dependency. Inflexibility, lengthy route and fix schedule are the main reasons of not using this service.
3.2.2.4 Public transport improvement: The gender is the only significant variable in the model of public transport improvement. It shows that male have more potential of using improved public transport than female because in some families female are not allowed to travel on public transport especially in high income group. In some cases female can travel on public transport but only with male members. Higher education level decreases the potential of public transport usage because education level and car ownership increases with the increase of household income. Therefore, highly educated people do not prefer to travel on public transport because they may think that it does not reflect their status and respect in the society. However, current car and motorcycle users have positive attitudes towards bus lane or rapid rail mass transit system. It can be argued that some people may use improved public transport for daily commuting, as it is reliable from private transport. However, travelling with

Travel Demand Management Measures in Lahore 25
Table 3. Average rating of TDM measures from different groups.
TDM Measures Car MC PT NMM OA
Advance traffic information would be very helpful to relieve traffic congestion 3.43 3.40 3.31 3.38 3.36
I have intention to participate in traffic education and awareness programs 2.94 2.96 3.01 2.95 2.96
I have intentions to do online or tele-working if there will be an opportunity 2.84 2.79 2.65 2.71 2.75
I have intention to participate in office based transport service from organization/institutions 2.70 2.47 2.64 2.55 2.59
I would use public transport if there is better mode like rapid rail mass transit or bus lanes 3.23 3.30 3.13 2.90 3.20
I support to increase parking charges in order to reduce traffic congestion in the city 2.38 2.20 2.31 2.27 2.29
I support to put more carbon tax on gasoline in order to protect environment 2.68 2.57 2.40 2.45 2.52
I would pay more road taxes in order to improve traffic conditions in the city 2.83 2.74 2.56 2.57 2.71 Note: MC: motorcycle, PT: public transport, NMM: Non-motorized modes, OA: overall
Table 4. Ranking of TDM measures.
TDM Measures Overall Car Motorcycle Public transport
Non motorized
Optimal ranking
Advance traffic information 1st 1st 1st 1st 1st 1st
Public transport improvement 2nd 2nd 2nd 2nd 3rd 2nd Education & awareness programs 3rd 3rd 3rd 3rd 2nd 3rd
Tele-work 4th 4th 4th 4th 4th 4th
Road tax 5th 5th 5th 6th 5th 5th
Office based transport service 6th 6th 7th 5th 6th 6th
Carbon tax on gasoline 7th 7th 6th 7th 7th 7th Parking charges 8th 8th 8th 8th 8th 8th female family members may prefer to use private vehicle because of privacy and other situational factors e.g. shopping, emergency, travelling at night, and service quality factors of public transport e.g. no direct access to some destination, fixed and limited schedule, etc. Positive relation of current public transport users with this strategy implies that improved service would help in keeping existing users.
3.2.2.5 Parking charges: The gender and education are only significant explanatory variables for this measure. The male respondents have negative attitudes towards increase in parking charges,
whereas higher education results positive attitudes towards this policy. It means high income people have more potential for acceptance of this policy such as car users, and there is potential of increase in parking charges on car use as mostly car users belong to high income category. This would help in collecting revenues which can be used for the improvement of road infrastructure especially public transport system although it may not have significant influence on travel behavior of car users. Motorcycle and public transport users have negative attitudes towards acceptance of increase in parking charges. This is due to low income of these groups
26 Muhammad A. Javid et al
compared to car users because increase in parking charges would put extra burden on their income.
3.2.2.6 Carbon tax on gasoline: The modeling results reveal that education is the only significant variable and it has positive relationship with this strategy. It means people having high education have more value of environment, and aware well about the negative consequences of fuel consumption. Therefore, they have more willingness to pay carbon tax on gasoline for reduction of air pollution. Similarly, high income people and current car users have positive perceptions towards increase in carbon tax on gasoline. However, low and middle income people have low willingness to pay carbon tax on gasoline as public transport and motorcycle
users. This is due to social impacts of increase in taxes on gasoline because such increase always cause inflation and put additional burden on low and middle income people. It is suggested that social impacts must be considered in increasing taxes on gasoline, and differential type fuel pricing can be adopted in order to reduce these impacts. The imposition of this tax would also help in reducing air pollution.
3.2.2.7 Road tax: In this model, only variables of education and public transport users are significant. Highly educated people have positive attitudes towards increase in road tax for improvement of traffic conditions in the city. It means that highly educated people have more awareness about traffic
Table 5. Results of ordinal logit modeling.
Explanatory variable
TDM Measures Advance traffic
information Tele-work Office based transport Public transport improvement
PV t-value PV t-value PV t-value PV t-value Gender .603 -2.346 .043 .632 -.159 .977 .393 -1.985 Education .499 -2.738 .417 -2.633 .298 -2.071 -.082 -.058 Personal income .002 -1.676 .068 -1.027 .301 -2.01 .132 -1.429 Car users -.021 -1.504 -.197 -.467 -.032 .865 .304 -1.008 Motorcycle users -.293 .847 .369 .526 -.315 1.871 .539 1.321
Public transport users .079 -1.299 -.075 -.307 .092 -1.968 .154 -.602
L(0) -425.42 -520.87 -518.65 -445.10 L( ) -410.57 -511.04 -511.83 -436.33
2 0.035 0.018 0.013 0.019
Variable
TDM Measures
Parking charges Carbon tax on gasoline Road tax Explanatory variables
PV t-value PV t-value PV t-value
Gender: 1 for female otherwise 0, education: 1 for education below bachelor otherwise 0, personal income: 1 if less than 20,000 otherwise 0, car users: 0 if use car otherwise1, motorcycle users: 0 if use motorcycle other wise1, public transport users: 0 if use public transport otherwise 0
Gender -.284 2.554 -.066 .904 -.038 .041 Education .380 -2.587 .281 -1.971 .412 -2.858 Personal income .095 -.687 .125 -.931 .219 -1.782 Car users -.120 -1.120 .078 -.446 .211 -1.065 Motorcycle users -.246 1.079 -.144 -.296 -.128 .652
Public transport users -.350 -1.042 -.200 -1.180 -.295 -2.027
L(0) -499.83 -521.06 -514.71 L( ) -490.21 -504.81 -504.78
2 0.020 0.031 0.021
Note: PV: Parameter value; 2= 1-{L ( )/ L (0)}

Travel Demand Management Measures in Lahore 27
situation in Lahore as they travel more. Car users also have positive attitudes towards willingness to pay road tax where as motorcycle and public transport users have negative attitudes. This is, because car users mainly belong to high income category, and public transport and motorcycle users belong to low to middle income class respectively. It implies that car oriented class is willing to pay taxes in order to have better road infrastructure, and use congestion free roads. Therefore, this potential can be utilized for collection of revenue for the improvement of traffic conditions in city by targeting this specific group. Collected revenues can also be used for the improvement of public transport system in order to keep existing users and to attract auto users for proper modal shift.
4. CONCLUSIONS AND IMPLICATIONS
This paper focuses on evaluation of travel pattern, and relationship among respondent’s socio-economic characteristics and attitudes towards selected TDM measures. Initially, cross analysis among vehicle ownership and modal share identifies four segments i.e. car oriented, motorcycle oriented, public transport oriented and non-motorized mode oriented. A comparison was made among four segments for SEDs and perception to TDM measures. The cross analysis depict that public transport and non-motorized modes are modes of low income people, and motorcycle is dominant mode in middle income group. Public transport and non-motorized modes are modes of poor people, and these people have low tendency for shopping and recreational trips. This analysis further identifies two types of travel behavior i.e. auto-dependent behavior of people who have private vehicle, and captive behavior of people who do not have private vehicle. The perceptions to TDM strategies among four segments also vary. The acceptance level for fiscal measures is lower compared to other measures. However, acceptance level can be enhanced by highlighting the benefits to the public associated with implementation of each measure through social marketing and awareness programs.
The results of ordinal modeling reveal that education is the highly significant explanatory variable in determining the people’s attitude towards most of the policy measures. Higher education
tends to enhance people’s awareness about the traffic conditions, and consequences of their own behavior. In return, this results higher acceptance of different strategies. Gender, income and existing travel mode are also significant determinants of specific policy measures. These variables related differently (positively or negatively) with different TDM measures. Survey and modeling results reveal that there is potential for promotion of tele-work and office based transport policies in Lahore for specific segment of travel market. Improvements in public transport would help in making promotion from private vehicle to public transport as auto users have positive attitudes towards this strategy. In addition, imposition of fiscal measures such as fuel and road taxes on car use would help in restricting the potential car users on their existing mode, and collection of revenues from car users that can be used to improve the road infrastructure and public transportation. Optimal ranking was proposed based on average response from all groups of respondents. The provision of advance traffic information is ranked as first, public transport second, traffic education and awareness programs third, tele-work forth, willingness to pay road tax fifth, organization based transport service sixth, carbon tax on gasoline seventh and increase in parking charges eighth. This ranking implies that incentive or pull measures need to initiate first which should be followed by push or disincentives measures. In addition, theoretically it can be suggested that integration among pull and push measures is much important in implementation because any strategy alone cannot be effective in changing the travel behavior [2, 23–24] although combination of measures are not considered in this study. For example, public transport improvement should be integrated with parking control measures such as imposition of parking charges in commercial as well as in public transport service area. Imposition of car usage related taxes (fuel taxes, road taxes) could also help in reducing transport sector externalities. Similarly, education and awareness programs need to initiate in conjunction with strict implementation of traffic rules. This study recommends determining the desire service quality of each segment especially auto users, and suggests the improvement in public transport accordingly. The assurance of good quality public transport would help to keep existing users,

28 Muhammad A. Javid et al
and attract auto users.
Fig. 2 explains the process of consideration of TDM measures for implementation in Lahore city as well as similar cities of other developing countries. It is suggested that advance traffic information, education and awareness programs need to introduce in combination because traffic information system or media can also be used to educate the people about transportation problems and their effective solutions. These measures should be followed by trip reduction measures such as public transport improvement, tele-work opportunities and office based transport service. Finally, fiscal restrictions should be imposed on car use i.e. parking charges, fuel tax on gasoline and other car usage taxes in order to enhance the effectiveness of trip reduction measures. This study would provide a clear understanding of travel behavior pattern of people having different socio-economic characteristics to transport planners and policy makers for making appropriate set of TDM policies in order to change travel behavior, and reduce auto-dependency. However, proper attention is required in selection combinations of different measures. Future studies need to focus on evaluation of packages of TDM measure as combined measures are more effective in changing travel behavior. In addition, attitudinal and behavioral aspects of travellers also need to consider in evaluating the packages of measures.
5. ACKNOWLEDGEMENTSThe authors acknowledge the financial support of “Engineering Management Program of Graduate School of Engineering, Yokohama National University, Japan” and “Ministry of Environment, Japan” for field trip to
Lahore, Pakistan. The authors also acknowledge the co-operation of Department of Transportation Engineering and Management, University of Engineering and Technology, Lahore in conducting the questionnaire survey.
6. REFERENCES
1. Garling, T., D. Eek, Loukopoulos, S. Fujii, O.J. Stenman, R. Kitamura, R. Pendyala & B. Vilhelmson. A conceptual analysis of the impact of travel demand management on private car use. Transport Policy 9: 59-70 (2002).
2. Garling, T. & G. Schuitema. Travel demand management targeting reduced private car use: effectiveness, public acceptability, and political feasibility. Journal of Social Issues 63 (1): 139-153 (2007).
3. Steg, L. & C. Vlek. The role of problem awareness in willingness to change car use and evaluating relevant policy measures. In: Traffic and Transport Psychology: Theory and Application, 1st ed. G. Underwood (Ed.), Elsevier, p. 465-475 (1997).
4. Garling, T. & S. Fujii. Travel Behaviour Modification: Theories, Methods, and Programs. Resource Paper presented at IATBR Conference, Kyoto University, Japan (2006).
5. Meyer, M. Demand Management as an Element of Transportation Policy: Using carrots and sticks to influence travel behaviour. Transportation Research Record A 33(7-8): 575-599 (1999).
6. Litman, T. Efficient Vehicles versus efficient transportation: Comparing transportation energy conservation strategies. Transport Policy 12(2): 121-129 (2005).
7. Auckland Regional Council. Travel Demand Management Strategies (2000). http://www.arc.govt.nz [online].
8. Faiz, A., K. Sinha, M. Walsh & A. Varma. Automatic Air Pollution: Issues and Options for Developing Countries. Working Paper 492, Infrastructure and
Fig. 2. Schematic diagram of integration of TDM measures.

Travel Demand Management Measures in Lahore 29
Urban Development Department, The World Bank, Washington DC, USA (1990).
9. Schade, J. & B. Schlag. Acceptability of urban transport pricing strategies. Transportation Research Part F 6: 45-61 (2003).
10. Schlag, B. & J. Schade. Public Acceptability of Traffic Demand Management in Europe. Traffic Engineering and Control 41: 314-318 (2000).
11. Bhattacharjee, D., S.W. Haider & Y. Tanaboriboon. Commuter’s Attitudes towards Travel Demand Management in Bangkok. Transport Policy 4(3): 161-170 (1997).
12. Sharif, M.B., A.H. Khan & M. Yousaf. Transportation Demand Management Models For Transportation System of Pakistan. Pakistan Journal of Science 64(3): 223-231 (2012).
13. Thorpe, N., P. Hills & S. Jaensirisak. Public attitudes to TDM measures: a comparative study. Transport Policy 7: 243-257 (2000).
14. JICA (2012). Lahore Urban Transport Master Plan in the Islamic Republic of Pakistan; Final Report, Volume I & II, March 2012. Retrieved from JICA online library; http://libopac.jica.go.jp
15. Esmael, M.O., K. Sasaki & K. Nishii. Road Traffic Accident Trend in Developing Countries- The Policy Implications. Proceedings of 13th World Conference on Transport Research, Rio De Janeiro, Brazil, (July, 2014).
16. Steg, L. Factors influencing the acceptability and effectiveness of transport pricing. In: Acceptability of Transport Pricing Strategies, J. Schade J, B. Schlag (Eds.), p. 187–202 (2003).
17. Schade, J. & B. Schlag. Acceptability of urban transport pricing strategies. Transportation Research Part F, 6, 45-61 (2003).
18. Schlag, B. & J. Schade. Public acceptability of traffic demand management in Europe. Traffic Engineering and Control 41: 314-318 (2000).
19. Pkusumantoro, I., E. Martha, I. Syabri, & D. Kipuw. Level of Effectiveness of the Implementation of Transport demand Management Strategy in Indonesian Cities. Proceedings of the Eastern Asia Society for Transportation Studies 7: 38-49 (2009).
20. Pradono, S.Y. Rachmat & N.D. Pitaloka. Level of Acceptance of the TDM Implementation in Indonesian Cities, Journal of the Eastern Asia Society for Transportation Studies 8: 374-388 (2009).
21. Mason, R.L., R.F. Gunst & J.L. Hess. Statistical Design and Analysis of Experiments: Applications to Engineering and Science. Wiley, New York, USA (1989).
22. Hair, J.F.J., R.E. Anderson, R.L. Tatham & W.C. Black. Multivariate Data Analysis, 3rd ed. Macmillan, New York, USA (1995).
23. Eriksson, L., A.M. Nordlund & J. Garvill. Expected car use reduction in response to structural travel demand management measures. Transport Research Part F 13: 329-342 (2010).
24. Steg, L. & C. Vlek. The role of problem awareness in willingness to change car use and in evaluating relevant policy measures. In: Traffic and Transport Psychology: Theory and Application. Pergamon Press, Amsterdam, The Netherland, p. 465-475 (1997).


![Title 51 RCW - Washingtonleg.wa.gov › CodeReviser › RCWArchive › Documents › 2018 › Title 51...(2018 Ed.) [Title 51 RCW—page 1] Title 51 Title 51 51 INDUSTRIAL INSURANCE](https://static.fdocuments.in/doc/165x107/5f13739b25d6831c263b508b/title-51-rcw-a-codereviser-a-rcwarchive-a-documents-a-2018-a-title-51.jpg)