Public Funding Observatory - EUA
46
Public Funding Observatory Report 2020/2021 Part 2 Enora Bennetot Pruvot, Thomas Estermann and Hristiyana Stoyanova April 2021
Transcript of Public Funding Observatory - EUA

EMBARGOED VERSION 11 Dec. 2017
Public Funding ObservatoryReport 2020/2021Part 2
Enora Bennetot Pruvot, Thomas Estermann and Hristiyana Stoyanova
April 2021

EMBARGOED VERSION 11 Dec. 2017 2
Contents
Structure of the Public Funding Observatory 3
1. Evolution of public funding to universities: 2008-2019 5
1.1 Long-term funding trends 6
1.2 Recovery under threat? 16
1.3 Average annual funding change 17
1.4 Evolution of public funding to universities and student enrolment 18
1.5 Public funding to universities and GDP growth 22
1.6 Long-term developments in university staff 25
1.7 Staff numbers and public funding 26
2. Short-term trends in funding to universities 27
2.1 Topics for discussion and reform in 2020 28
2.2 Public investment in universities from 2019 to 2020 30
2.3 Evolution of public funding to universities from 2018 to 2019 31
2.4 Short-term funding trends 32
2.5 Impacted areas 33
2.6 Funding mix: public and private funding 34
3. European funding to universities: 2021-2027 36
3.1 Horizon Europe 37
3.2 Erasmus+ 38
3.3 Next Generation EU 39
Key messages 42
Higher education system codes 44
Resources 45

EMBARGOED VERSION 11 Dec. 2017 3
This year’s EUA Public Funding Observatoryconsists of the following components:
• the EUA Public Funding Observatory Report2020/2021 part 1, released in October 2020.It provides a detailed picture of theimmediate impact of the Covid-19 pandemicon university funding and offers insight intothe implications expected in the years tocome.
• the EUA Public Funding Observatory Report2020/2021 part 2 (present report), based ondata collected from the EUA member nationaluniversity associations during the secondsemester of 2020.
Structure of the Public Funding Observatory
The Observatory also includes:
• individual country sheets for 32 systemsacross Europe;
• the online tool containing the full dataset onpublic funding to universities in Europe;
• the methodological note offering moredetails about the data sample and theresearch method.

EMBARGOED VERSION 11 Dec. 2017 4
The present report analyses long-term fundingtrends captured over the period from 2008 to2019. It also offers an overview of the latestpublic funding developments in 2019 and 2020.Finally, it focuses on the new phase of EUfunding (2021-2027) and what is at stake foruniversities.
The data collected in 2020 allows toadapt/correct data provided for previous yearsbetween 2008 and 2020 and complete datasetsfor some of the participating countries. The datacovers the overall funding mix; direct publicfunding; student numbers; staff numbers;qualitative feedback on relevant ongoingdiscussions related to governance and fundingof universities.
Structure of the report
The 2020/2021 report features 32 highereducation systems. Data for various highereducation systems within the UK (England,Northern Ireland, Scotland and Wales) arereported separately. Cyprus, Greece and Latviawere not included in the analysis as the dataprovided covers a period inferior to nine years.
All systems may not be included in the differentsections, depending on the dataset provided.Explanatory notes are provided in grey andsignaled by the * symbol. The methodologicalnote provides further information on thematter.

EMBARGOED VERSION 11 Dec. 2017 5
This chapter outlines long-term developmentsin public funding to universities across Europefrom 2008 to 2019*. These trends arecontextualized against a set of key factors, suchas student enrolment, inflation and economicgrowth.
Before the pandemic hit the sector, there wasrelative stability compared to last year’sanalysis. Changes were mostly positive, withSlovenia, Hungary, Romania and Serbia movingup by one category or more.
Part 1 Evolution of public funding to universities
*How to read this map:The map shows the inflation-adjusted change in public funding touniversities in 2019 compared to 2008. Different colour codes refer todifferent levels of investment or cuts. Top investors appear in dark green.Countries with the biggest decrease in funding in 2019 compared to thebase year appear in black. Shorter timeframes for: EE; FI; LU; PL; UK-ni;UK-sc and UK-wa. Public subsidies to student loans included for UK-en;UK-ni and UK-wa.

EMBARGOED VERSION 11 Dec. 2017 6
The higher education systems under review followed variousfunding trajectories from 2008 to 2019. Several broad groups ofsystems with similar patterns such as “sustained growth”,“improving” and “declining” can be identified. This categorisation isrelative since there could be significant variations across differentcountries and at different points in time.
The graphs describe the evolution in three cases since 2008 andillustrate the identified trends in Sweden (“sustained growth”),Croatia (“improving”) and Italy (“declining”).
1.1 Long-term funding trends

EMBARGOED VERSION 11 Dec. 2017 7
The group of top performing higher education systems with sustainable long-term funding growth has seen somechanges this year:
• Austria and Belgium (Flanders) now join Germany and Norway among the largest investors (above 30%) over thelast decade.
• Luxembourg is an outlier and more than doubled its investment from 2009 to 2019 (overall increase of 127%).
1.1.1 Sustained growth patterns (1)

EMBARGOED VERSION 11 Dec. 2017 8
• Belgium (French-speaking community), Denmark and Sweden continue with increases between 20-30%.• Overall investment is growing in the Netherlands but remains below the bar of 20%. France features as relatively
stable, but with limited levels of investment.
1.1.1 Sustained growth patterns (2)

EMBARGOED VERSION 11 Dec. 2017 9
In the long run, several systems recovered from the previous cuts (usually applied between 2009 and 2013), although thedegree of recovery significantly varies across the sample.
• Iceland closed its funding gap in 2017 and has continued to invest in its universities since then. Poland, for which 2019data was unavailable, has also been increasing its funding since 2013.
• Croatia, Portugal and Slovenia turned around their trajectory between 2013 and 2015. Croatia and Slovenia closed thegap around 2017-2018 and have shown positive trends since.
• In 2019, Hungary moved into the positive (compared to 2008). It took six years to compensate five consecutive years ofbudget cuts (2009-2013).
1.1.2 Improving patterns (1)

EMBARGOED VERSION 11 Dec. 2017 10
Systems that have re-invested in universities but have not managed to exceed the 2008 investment level includethe Czech Republic, Ireland, Romania and Slovakia.
They are joined by Lithuania, which has been increasing investment for two years (but remains below the 2008benchmark by more than 20%). The relatively broken pattern of investment in Lithuania, however, calls forcaution when analysing this case.
Beyond the figures shown in the graph, the latest information shows that Romania and Slovakia closed theirfunding gap in 2020 (returning to 2008 levels).
1.1.2 Improving patterns (2)

EMBARGOED VERSION 11 Dec. 2017 11
Several higher education systems accumulated large funding gaps from 2008 to 2019.
Italy and Spain do not seem to deviate from a critical level of underfunding since 2012.
Positive signs detected in Italy in 2018 were not consolidated by a further increase in 2019.
Scotland, which is analysed for the period of 2010-2019, shows a continued and worrying disinvestment pattern since
2015.
1.1.3 Declining patterns

EMBARGOED VERSION 11 Dec. 2017 12
Turkey is somewhat of an outsider in theanalysis, because of the scale of the investmentover the period (peaking at nearly an 80%increase in real terms in 2016, compared to2008).
The country also shows an unusual pattern ofquasi-sustained investment for those eightyears, except for the period from 2017 to 2018.
1.1.4 Special cases: Turkey

EMBARGOED VERSION 11 Dec. 2017 13
The period considered for Finland starts in 2010,when the funding model was revisedsignificantly.
The almost continued declining pattern since2011 seems to have come to a halt in 2019.However, it remains to be seen whetherinvestment will be sustained enough to closethe funding gap generated in the earlier years.
1.1.5 Special cases: Finland

EMBARGOED VERSION 11 Dec. 2017 14
Regarding the UK, in England, the large decrease indirect public funding is compensated by a largergrowth of public funding allocated to highereducation institutions for student loans followingthe change in the funding model*.
1.1.6 Special cases: United Kingdom (1)
*How to read these graphs:“UK-England DIRECT” and “UK-Northern Ireland DIRECT” show direct public funding to English or Northern Irish higher education institutions.“UK-England TOTAL” and “UK-Northern Ireland TOTAL” show direct public funding combined with public subsidies for student loans received by English or Northern Irish highereducation institutions.
However, both records show a negative trajectoryin 2019 compared to 2018. The same modelapplies in Northern Ireland, where figures remainbelow the 2008 investment level.

EMBARGOED VERSION 11 Dec. 2017 15
While public subsidies allocated to Welsh highereducation institutions for student loans havebeen growing since 2010, following reforms tostudent funding, direct public funding has beendramatically going down*.
The last two years for which consolidated data isavailable (2018-2019) nevertheless show apositive trend, essentially due to higher publicsubsidies for student loans.
1.1.6 Special cases: United Kingdom (2)
*How to read this graph:This graph shows the funding decline in two systems in 2019 comparedto 2010.“UK-Wales DIRECT” refers to direct public funding to Welsh highereducation institutions.“UK-Wales TOTAL” shows direct public funding combined with publicsubsidies for student loans received by Welsh higher educationinstitutions. The total data is only available for the period 2010-2017.

EMBARGOED VERSION 11 Dec. 2017 16
This graph shows the yearly changes in the numberof systems cutting or increasing funding foruniversities in the period from 2008 to 2019(reference year: 2008*).
The 2019 data confirms the signs of the gradualimprovement of public funding for universities inEurope since 2015, detected in EUA’s previousreport.
In 2019, only seven systems applied funding cuts,which is fewer than in 2009. In 2019, Hungarybecame the most recent system to have closed itsfunding gap.
However, the slow but steady progress towardsrecovery is now heavily endangered by thepandemic-related economic crisis of 2020 (see the2020/2021 report released in October 2020).
*How to read this graph:The graph includes 23 systems with a complete funding dataset for2008-2019.
1.2 Recovery under threat?

EMBARGOED VERSION 11 Dec. 2017 17
1.3 Average annual funding change
The average annual funding change in real termssignificantly differed across 32 systems from 2008to 2019*. Luxembourg remains at the top of thesample. Austria and Flanders move up among thehighest average annual funding growth.In total, 12 systems had negative average annualvalues, and 20 systems had positive values. Inseven systems, the average annual funding changeremained flat (between -1% and +1%).The worst placed systems display figures that haveimproved slightly compared to last year’s report.(Serbia and Ireland, for instance, used to displayfigures close to -4%).
*How to read these graphs:These graphs show the annual funding change (positive or negative) in real termsaveraged over the period 2008-2019. Shorter timeframes are used for EE (2008-2017); CH (2008-2017); FI (2010-2019); LU (2009-2019); PL (2008-2018); UK-ni (2008-2018); UK-sc (2010-2019); UK-wa (2010-2019).

EMBARGOED VERSION 11 Dec. 2017 18
1.4 Evolution of public funding to universities and student enrolment
*Note:The country/system sheets spell out the exact scope of the data collected for funding and for student numbers.These may differ and therefore it is advised to read this report in conjunction with the individualcountry/system sheets for more granularity in the analysis.
The long-term public funding trends in varioushigher education systems need to be furthercontexualised in terms of changes in studentnumbers and economic growth.
Given the scope of the data collected, it is notpossible nor intended to establish a directrelationship between public funding andstudent numbers at the system level*. Yetconsidering these two factors together helps tobetter understand the pressure universities facein any given system.
EUA performed the analysis for 32 systems withcomplete funding and student number datasets(shorter timeframes are used in some cases).The sample is divided into two groups,capturing positive and negative trends for thesesystems.

EMBARGOED VERSION 11 Dec. 2017 19
Looking at changes in funding and student numbersfor systems where public funding in 2019 was higher than in 2008*, a major distinction can be made between:
• eight systems where funding growth is superior to student enrolment growth;
• 11 systems where the demographic pressure is not met by sufficient investment.
*How to read this graph:Shorter timeframes are used for LU (2009-2019); CH (2008-2017); PL (2008-2018).Student numbers for TR are capped at 100% to enhance the readability of thegraph. The actual figure is +230%, for students enrolled in public and privatehigher education institutions. Funding data for England (UK-en) covers total publicfunding.
1.4.1 Systems with increasing funding
Pressures nevertheless vary significantly, with fourextreme cases being Turkey (highest demographicpressure), Hungary, Poland and Slovenia (decliningstudent body). The overall picture remains highlysimilar to that of last year’s report. Austria increasedfunding significantly enough to overtake the growthof student numbers.
230%

EMBARGOED VERSION 11 Dec. 2017 20
The gravity of cuts in 13 systems varies withstudent enrolment numbers*:
• Four systems decreased funding to universitiesacross the period from 2008 to 2019, whilststudent numbers increased.
• In nine systems, both funding to universitiesand student numbers decreased in 2019compared to 2008, with variations regardingthe relative pace of funding cuts anddemographic decline.
• Extreme cases include Ireland, whereuniversities were confronted with strongstudent growth while experiencing gravefunding cuts.
• Over the same period, Lithuania, Romania andSlovakia lost close to or more than a third oftheir student populations.
*How to read this graph:Shorter timeframes are used for EE (2008-2017); FI (2010-2016); UK-ni (2008-2018); UK-sc (2010-2018); UK-wa (2010-2019). For Wales (UK-wa) the student numbers value is -0.2%. Funding data for Northern Ireland and Wales covers total public funding.
1.4.2 Systems with declining funding

EMBARGOED VERSION 11 Dec. 2017 21
1.4.3 Long-term financial and demographic pressures
Category Description Systems
Funding ↑ > Students
↑
Funding increase higher
than student number
growth
AT, IS, NO, SE
Funding ↑ < Students
↑
Funding increase lower
than student number
growth
BE-fr, BE-nl, DE, DK,
FR, HR, NL, PT, TR,
UK-en
Funding ↑ / Students
↓
Funding increase
despite student number
decline
HU, SI
Funding ↓ / Students
↑
Disinvestment despite
student number growthIE, RS
Funding ↓ < Students
↓
Funding decline lower
than student number
decline
CZ, LT, RO, SK
Funding ↓ > Students
↓
Funding decline higher
than student number
decline
ES, IT
Compared to the previous report, Austria and Portugal invert theirpositions, Austria having now reinvested in a way that exceedsstudent number growth. Notably, Austria has a three-year fundingcycle, therefore variations within one cycle are connected to theimpact of inflation and student growth.
The second group of systems remains stable; there, countries aresubject to higher pressure due to rising student numbers.
Italy and Spain, as well as several Central and Eastern Europeancountries, experience negative patterns both in terms of studentenrolment and public funding. For the first two, while the decline inthe student populations is relatively small (close to -5%), budget cutshave disproportionately affected universities. In Lithuania, Romaniaand Slovakia, the student populations decreased by between aboutone third and one half compared to the 2008/2009 cohorts.
Exceptions include Hungary and Slovenia (as well as Poland, forwhich data was unavailable in 2020), with positive investment trendsand reducing student cohorts. Slovenia has been reinvesting forthree years against a negative demographic background, whileHungary has just closed its funding gap.
Ireland and Serbia continue to face a difficult challenge, with fundingcuts over the monitored period, while facing growing studentpopulations*.
*How to read this graph:This table captures different trends in public funding and student enrolment for 24 systemswith complete datasets for the period from 2008 to 2019. The following systems are notincluded in the analysis because of the incomplete datasets: CH, EE, FI, LU, PL, UK-ni, UK-sc,UK-wa.

EMBARGOED VERSION 11 Dec. 2017 22
A country’s investment capacity is an important factor for theassessment of public funding changes over time. Comparingthe average annual real GDP growth rate and the averageannual funding growth over the period from 2008 to 2019*makes it possible to identify some general patterns:
• 12 most “committed” systems increased their investmentin public universities at a larger scale than their averageeconomic growth.
• Five countries have some unused potential, as theirinvestment levels remain lower than GDP growth over theperiod. Romania joins this group after significantreinvestments.
• Eight systems reduced funding for universities despite theoverall positive GDP growth. Although the picture is highlycomplex at the national level, this is a warning signal forthe countries that may miss an opportunity to strengthentheir knowledge economy.
• Italy is the only country characterised by funding cutsgreater than the average negative annual economicgrowth.
Category Description Systems
Funding ↑ > GDP
↑
Investment higher
than economic growth
AT, CH*, DE, DK, HR,
IS, LU*, NL, NO, PT,
SE, TR
Funding ↑ < GDP
↑
Investment lower than
economic growthFR, HU, PL*, RO, SI
Funding ↓ / GDP
↑
Disinvestment despite
economic growth
CZ, EE*, ES, FI*, IE,
LT, RS, SK
Funding ↓ > GDP
↓
Disinvestment greater
than economic declineIT
1.5 Public funding to universities and GDP growth
*How to read this graph:This graph compares the average annual funding growth rate to the averageannual real GDP growth rate for the period from 2008 to 2019. The followingsystems are not included in the analysis: BE-fr, BE-nl, UK-en, UK-ni, UK-sc, UK-wa. *Shorter timeframes are used for CH (2008-2017); EE (2008-2017); FI (2010-2019); LU (2009-2019); PL (2008-2018).

EMBARGOED VERSION 11 Dec. 2017 23
1.5.1 Public funding to universities and GDP growth: systems investing in universities
This section breaks down the previous table andexplores each category.
Several countries supported their universities at alarger scale than the GDP growth in the periodfrom 2008 to 2019*.
Romania records a positive average annual growthfor funding thanks to its reinvestment efforts overthe last years. The average annual GDP growth it isexperiencing suggests that further action ispossible, as in France, Hungary, Poland andSlovenia.
*How to read this graph:This graph compares the average annual public funding to the averageannual GDP growth (both in real terms) for 17 systems that had apositive average annual growth in public funding for universities from2008 to 2019. Shorter timeframes are used for CH (2008-2017); LU(2009-2019); PL (2008-2018). The following systems are not included inthe analysis: BE-fr, BE-nl, UK-en, UK-ni, UK-sc, UK-wa.

EMBARGOED VERSION 11 Dec. 2017 24
1.5.2 Public funding to universities and GDP growth: systems disinvestingin universities
Several countries including the Czech Republic,Ireland and Slovakia, reduced funding for universitiesdespite significant average GDP growth. Somecorrective measures have been taken in Ireland andSerbia, and to a lesser extent in Lithuania.
Italy is the only country that continues to register anegative average annual economic growth combinedwith the negative real funding average in the periodfrom 2008 to 2019*.
*How to read this graph:This graph compares the average annual public funding to the averageannual GDP growth (both in real terms) for nine systems that had anegative average annual growth in public funding for universities overthe period from 2008 to 2019. *Shorter timeframes are used for EE(2008-2017) and FI (2010-2019). Serbia presents an incomplete dataset.The following systems are not included in the analysis : BE-fr, BE-nl, UK-en, UK-ni, UK-sc, UK-wa.Note: GDP in Ireland is heavily distorted by the impact of theexceptionally high proportion of multinational companies in theeconomy. Direct comparison of GDP based metrics need to beconsidered in that context.

EMBARGOED VERSION 11 Dec. 2017 25
The financial and demographic pressures are
reflected in the evolution of staff (both academic
and non-academic) and student numbers. Given
the varying scope of the data collected, no direct
estimates of ratios between the two datasets can
be made*. Nevertheless, comparing the evolution
of student numbers and staff can help detect
certain trends across Europe.
The situation remained challenging for Irish and
Northern-Irish universities that experienced
growing student numbers but had to reduce staff.
Conversely, in Hungary, Slovenia and Wales, staff
numbers were growing while the student
population remained stable (Wales) or dropped
(Hungary, Slovenia).*How to read this figure:This graph presents different groups of systems according to thechanges in the number of students and staff (academic and non-academic staff together) from academic year 2008/2009 to 2018/2019.It includes 20 systems with the complete staff and student datasets forthe period from 2008/2009 to 2018/2019.
1.6 Long-term developments in university staff
Diminishing students and
growing/stable staff: HU, SI, UK-
wa
Growing students and
staff: BE-nl, DE, DK, FR, HR, NL, NO, SE, UK-en,
CH
Diminishing students and
staff: CZ, ES, IT, RO, SK
Growing students and diminishing
staff: IE, UK-ni
EMBARGOED VERSION 11 Dec. 2017 26
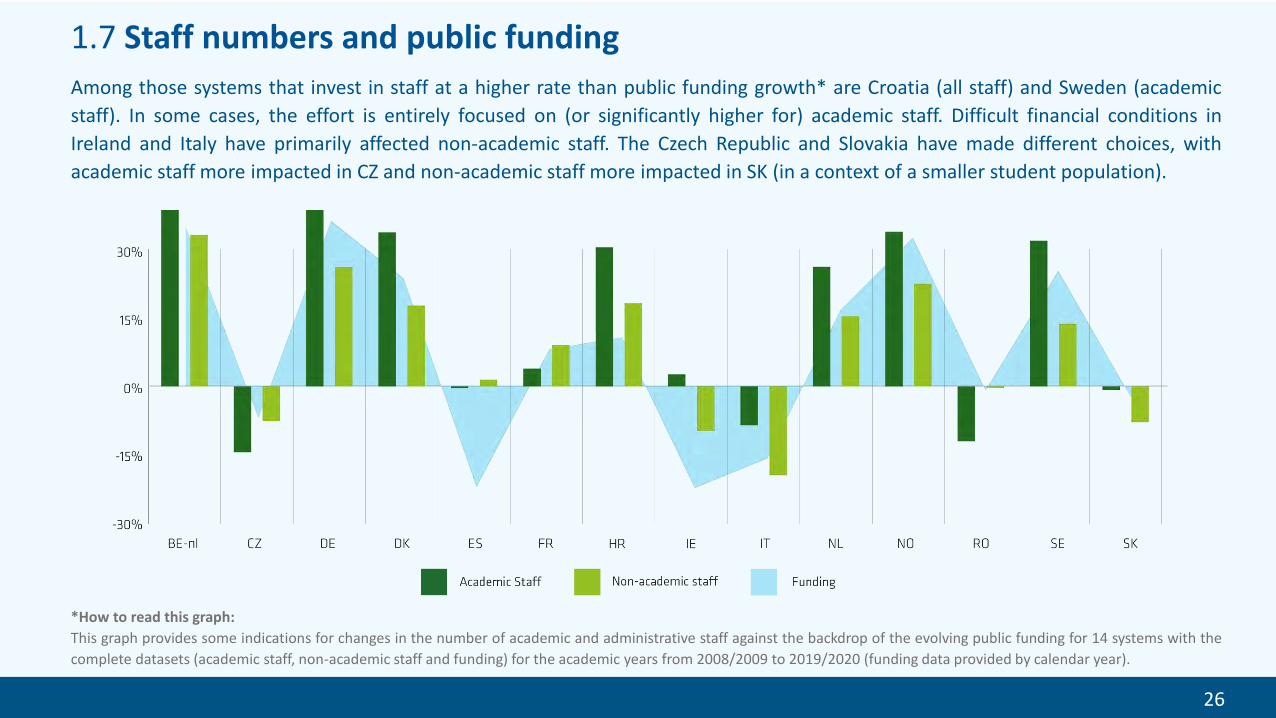
Among those systems that invest in staff at a higher rate than public funding growth* are Croatia (all staff) and Sweden (academic
staff). In some cases, the effort is entirely focused on (or significantly higher for) academic staff. Difficult financial conditions in
Ireland and Italy have primarily affected non-academic staff. The Czech Republic and Slovakia have made different choices, with
academic staff more impacted in CZ and non-academic staff more impacted in SK (in a context of a smaller student population).
1.7 Staff numbers and public funding
*How to read this graph:
This graph provides some indications for changes in the number of academic and administrative staff against the backdrop of the evolving public funding for 14 systems with the
complete datasets (academic staff, non-academic staff and funding) for the academic years from 2008/2009 to 2019/2020 (funding data provided by calendar year).

EMBARGOED VERSION 11 Dec. 2017 27
This chapter provides an overview of themost recent university funding trends inEurope. It explores the short-termtrajectories of total direct public funding touniversities, allocated over the last twoyears, and investigates their impact onvarious university activity areas.
Part 2 Short-term trends in funding to universities

EMBARGOED VERSION 11 Dec. 2017 28
2.1 Topics for discussion and reform in 2020 (1)
In total, 19 systems provided additional qualitativeinformation on the current topics of discussion orreform. Performance-based funding (PBF) andfunding allocation models remain among the mostcommon topics on the agenda. Funding modelsare being adapted or newly implemented (Finlandas of 2021), or discussed (Denmark, Romania,Slovenia). Slovakia is pondering the introduction ofvoluntary performance contracts and thegovernment plans to enhance the competitiveelement among higher education institutions. Inthe UK (except Scotland), the governmentannounced a major review of the ResearchExcellence Framework which determines recurrentresearch funding allocation.

EMBARGOED VERSION 11 Dec. 2017 29
Funding allocation model for research AT, BE-nl, DK, FI, IS, NL, SE, SI, UK-en, UK-ni, UK-sc, UK-wa
Performance-based funding AT, BE-nl, DK, FI, IE, IS, NO, RO, SK, UK-en, UK-sc
Funding allocation model for teaching AT, DK, FI, FR, IS, NL, RO, SK, UK-sc
Regulatory framework DK, IE, IS, NO, SE, SI, UK-sc, UK-wa
Infrastructures and investments CH, IE, IS, NO, SE, SK
Efficiency IS, NO, RO, UK-sc
Mergers FR, IE, RO, UK-en
Staffing policies IE, RO, SK
Tuition fee policies ES, IE
University governance IE
2.1 Topics for discussion and reform in 2020 (2)
Compared to last year, infrastructure andinvestment are appearing more often, in a contextmarked by the pandemic and the forced (partial ortotal) closure of campuses to students in variousparts of Europe, and the light shed on ITinvestment needs as universities moved the bulkof their activities online. Sweden expects aninfrastructure enquiry to be ready in the firstsemester of 2021, while Slovakia approved new
investments for the renovation of studentresidences at the beginning of 2020.
Merger activity was reported in a few countries,but there is also a discussion in England where thegovernment launched the Higher EducationRestructuring Regime to support institutions atrisk of insolvency, as a result of Covid-19, throughrestructuring options, including mergers.

EMBARGOED VERSION 11 Dec. 2017 30
The funding trend was marked by stability for budgetallocation decisions in 2020*. Ireland is joined by Slovakiaand Romania in the top investors in 2020. Significantinvestments in the latter two allowed them to fully closetheir funding gap compared to 2008, while Ireland madeprogress towards this goal.
The impact of the pandemic is not yet visible in the data.Over the course of the year, several countries providedextra financial resources to support crisis-struckuniversities. Part 1 of this report (October 2020) containsfurther information on the topic.
2.2 Public investment in universities from 2019 to 2020
TOP INCREASES 2020(real terms)
Slovakia (17,5%)
Ireland (16,9%)
Romania (15%)
DECREASES 2020(real terms)
Sweden (-2,9%)
Turkey (-2.5%)
Austria (-1,4%)
> 10% increase IE, RO, SK
5% to 10% increase
1 to 5% increase BE-fr, ES, FI, HR, IS, IT, LT, NL, NO
-1% to +1% change CZ
-1% to -5% decrease AT, SE, TR
-5% to -10% decrease
No dataBE-nl, CH, CY, DE, DK, EE, FR, GR, HU, LU, LV, PL, PT, RS, SI, UK (all)
*How to read these graphs:
The upper graph shows changes in real public funding in 2020 compared to
2019. The analysis was performed for 16 higher education systems that
provided funding data for 2020 and for which inflation data was available.
Two lower graphs refer to the top three countries in terms of the magnitude
of nominal and real funding changes from 2019 to 2020.

EMBARGOED VERSION 11 Dec. 2017 31
Considering that the 2020 funding data was only available for alimited number of systems under review, additional analysis wasperformed on the basis of the 2018-2019 funding data in realterms*.
Five systems had slightly negative trends in 2019 compared to2018, which were all comprised between 0 and -3%. In addition,in England, direct public funding plummeted (-12.6%) but thattrend was partially corrected by additional subsidies for studentloans (total funding: -3.7% compared to 2018).
After three consecutive years of small cuts, Finland and Spainreturned to a positive trajectory in 2019, which was furtherconfirmed in 2020.
Several systems increased investment by over 10% compared to2018 (Austria, Hungary, Ireland, Romania and Wales).
2.3 Evolution of public funding to universities from 2018 to 2019
*How to read this map:The map shows the inflation-adjusted change in public funding to universities in 2019 compared to2018. Different colour codes refer to different levels of investment or cuts. Public subsidies to studentloans included for UK-en; UK-ni and UK-wa.

EMBARGOED VERSION 11 Dec. 2017 32
The most dynamic investors in 2019 were Flanders,
Croatia, Hungary, Ireland and Norway, which had higher
positive progressions from 2018 to 2019 than from
2017 to 2018. For Ireland and Hungary, this is coherent
with a recovery pattern.
Finland, Germany and Spain moved from a downward
trajectory in 2018 compared to 2017, to a positive one
in 2019 compared to 2018. For Finland and Spain, this
was the first year of such growth for a long time.
The biggest group (nine systems) is made of those
countries that continued their progression, but at a
slower rate than when comparing 2018 to 2017. It
includes systems of Central and Eastern Europe
(Lithuania, Romania, Serbia, Slovenia), as well as
Luxembourg, the Netherlands, Iceland and Portugal.
Wales also joins this pattern.
2.4 Short-term funding trends from 2018 to 2019
France and Turkey partially mitigated their respective
negative trajectories. However, funding figures in
France are relatively stable and evolve within a -2/+2%
bracket; while in Turkey, a -7.2% change (between 2017
and 2018) was followed by an increase of +3.4%
(between 2018 and 2019).
Finally, five systems moved from a positive progression
to a negative one. Italy, Sweden, Slovakia and two UK
systems (England and Scotland). Slovakia took
corrective action in 2020 with significant investments.
EMBARGOED VERSION 11 Dec. 2017 33
Funding Research Teaching Staff Infrastructure
Positive impact
BE-nl, CZ, IE, IS, NL, RO, SI, SK, TR UK-en
CZ, FI, IE, IS, NL, RO, SI, SK, TR
CZ, RO, SI, SK, TR
IS, SK, TR
No impact DK, FI, SE, UK-sc
BE-nl, DK, ES, FR, SE, UK-sc
BE-nl, DK, ES, FI, FR, IE, IS, SE, UK-en
BE-nl, CZ, IE, SE, SI, UK-en, UK-sc
Negative impact
ES UK-en ES, RO
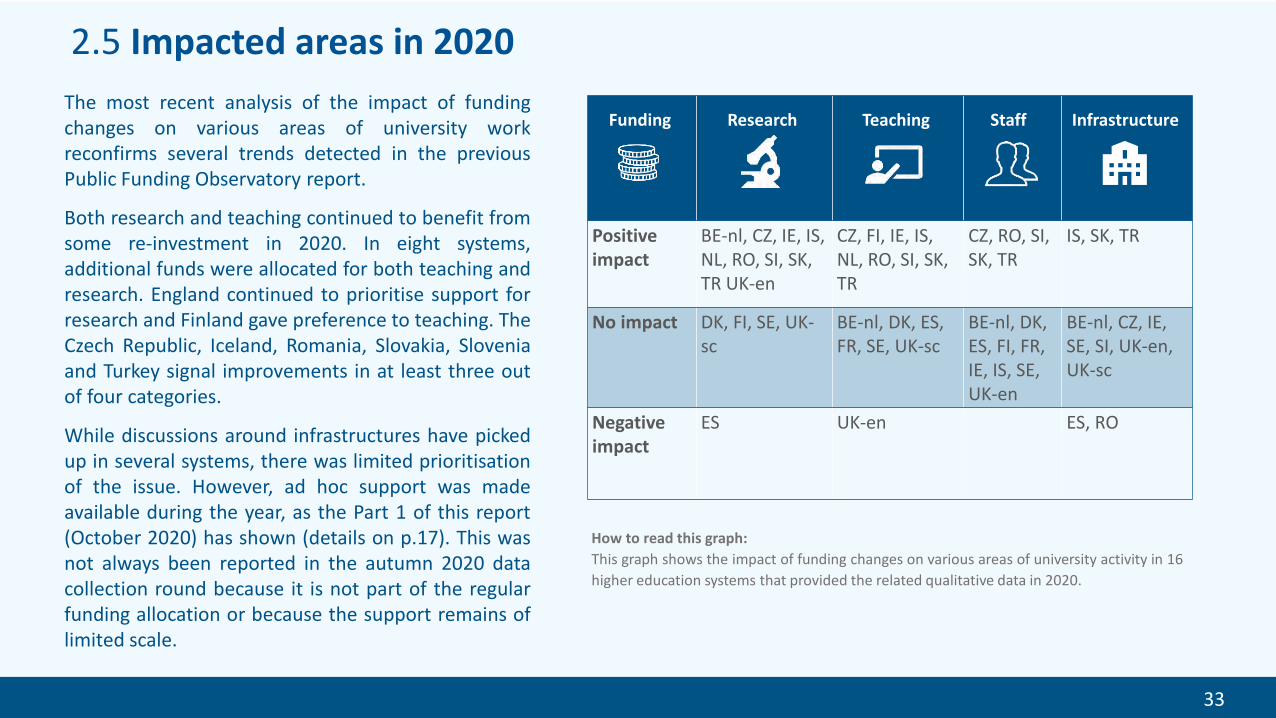
The most recent analysis of the impact of fundingchanges on various areas of university workreconfirms several trends detected in the previousPublic Funding Observatory report.
Both research and teaching continued to benefit fromsome re-investment in 2020. In eight systems,additional funds were allocated for both teaching andresearch. England continued to prioritise support forresearch and Finland gave preference to teaching. TheCzech Republic, Iceland, Romania, Slovakia, Sloveniaand Turkey signal improvements in at least three outof four categories.
While discussions around infrastructures have pickedup in several systems, there was limited prioritisationof the issue. However, ad hoc support was madeavailable during the year, as the Part 1 of this report(October 2020) has shown (details on p.17). This wasnot always been reported in the autumn 2020 datacollection round because it is not part of the regularfunding allocation or because the support remains oflimited scale.
2.5 Impacted areas in 2020
How to read this graph:
This graph shows the impact of funding changes on various areas of university activity in 16
higher education systems that provided the related qualitative data in 2020.

EMBARGOED VERSION 11 Dec. 2017 34
2.6 Funding mix: public and private funding (1)
In addition to core public funding data captured bythe Public Funding Observatory, 16 systemsprovided further information about public andprivate sources of funding for the present report.The graph provides a basic overview of thefunding mix in these systems, considering thatthey have different ways of recording the relateddata.
In continental Europe, Flanders, Spain and theNetherlands feature the lowest dependence onpublic funding, which nevertheless accounts inthese countries for about 70% of the overalluniversity funding mix.
Ireland and the UK nations showcased hererepresent a different funding model.

EMBARGOED VERSION 11 Dec. 2017 35
2.6 Funding mix: public and private funding (2)
To the extent that it is possible to zoom in ondifferent sub-categories, bearing in mind thediversity in the recording systems, one can explorethe different configurations for 14 systems. Therole of competitive public funding, for instance,appears clearly in countries such as Finland andSweden, as well as in Belgium, Germany andRomania. Tuition fees are an important part of thefunding mix in Spain and Romania (next to Irelandand the UK nations, with the exception ofScotland). Private sector contributions areparticularly visible in the Netherlands and Sweden.

EMBARGOED VERSION 11 Dec. 2017 36
Part 3 EU funding to universities (2021-2027)
The EU funding programmes are important touniversities both as a source of income and as aplatform for European and international academiccollaboration.
After long and uniquely complex negotiations, inthe last days of 2020 the EU reached anagreement on the new Multiannual FinancialFramework 2021-2027 (MFF). The impact of thepandemic and the associated economic crisis hasled the EU policy makers for the first time tosupplement the MFF with a recovery package,known as Next Generation EU (NGEU).
Synergies are in the spotlight in the new fundingprogrammes with enhanced possibilities of usingthe Seal of Excellence both for Horizon Europe andErasmus+; as well as synergies between HorizonEurope and European Structural and InvestmentFunds (ESIF).
Source: https://www.consilium.europa.eu/en/infographics/recovery-plan-mff-2021-2027/

EMBARGOED VERSION 11 Dec. 2017 37
3.1 Horizon EuropeBudget allocation for Horizon Europe remainedrelatively stable throughout the negotiationprocess.
The MFF, supplemented by NGEU, providesHorizon Europe with €84.9 billion (2018 prices).The figure is higher than the previous seven-yearbudget, but unlikely to address the issue of lowsuccess rates.
When taken all together, the reinforcements weredistributed in a way that essentially preserves theoriginally proposed structure of the programme.The biggest share (56%) goes to Pillar II (“Globalchallenges and European industrialcompetitiveness”) and towards Pillar I (26%)(“Excellent and open science”), notably to theEuropean Research Council.
Pillar III (“Innovative Europe”), gets 14% of thebudget allocation, while the transversal Pillar IV(“Strengthening the European Research Area”)receives 4%.
Source: EUA elaboration, 2018 prices

EMBARGOED VERSION 11 Dec. 2017 38
3.2 Erasmus+
The budget allocation to Erasmus+ within the MFFaccounts for €23.4 billion (2018 prices), afteradditional means were agreed on late in theprocess. There is no direct reinforcement underNGEU.
The programme will address the overarchingpolicy goals of inclusion, digitalisation andgreening, to realise the ambitions set for theEuropean Education Area, as well as to ensure thelink to the European Green Deal.
The agreement confirms that 83% of theErasmus+ budget will be allocated to educationand training (€19.4 billion). Within this heading,the biggest share will fund activities under thehigher education sector’s mobility andcollaboration actions (KA1 and decentralised partsof KA2).
Source: EUA elaboration, 2018 prices

EMBARGOED VERSION 11 Dec. 2017 39
3.3 Next Generation EU (NGEU)
Through NGEU, the European Commission (EC) willborrow up to €750 billion (in 2018 prices) oncapital markets on behalf of the EU. NGEU ischannelled through seven programmes in the formof loans (€360 billion) and grants (€390 billion) andthe intention is to frontload the investment in thefirst two years.
The aim of NGEU is not only to foster an economicrebound but also to ensure that the recovery pathincorporates green and digital objectives.
Horizon Europe is reinforced through NGEU with€5 billion, but there is a scope for universities tobenefit further from the largest part of theinstrument, the Recovery and Resilience Facility(€672.5 billion).
Source: https://www.consilium.europa.eu/en/infographics/ngeu-covid-19-recovery-package/

EMBARGOED VERSION 11 Dec. 2017 40
3.3.1 NGEU: Recovery and Resilience Facility (RRF)
The RRF will help the EU pave the way to asustainable economic recovery. Under thisinstrument, member states prepare nationalrecovery and resilience plans, based on ECguidelines, setting out their reform andinvestment agendas for the period from 2021 to2023. The plans will be reviewed and adapted asnecessary in 2022 to take account of the finalallocation of funds for 2023.
The estimated allocation per country has beenpublished by the European Commission. The topfour beneficiaries in the front-load period of theinstrument are Italy and Spain with around €44billion each, followed by France and Poland witharound €20 billion each; while countries such asEstonia or Ireland would receive less than €1billion (2018 prices). Source: https://www.consilium.europa.eu/en/infographics/ngeu-covid-19-recovery-package/

EMBARGOED VERSION 11 Dec. 2017 41
3.3.2 NGEU: National Recovery and Resilience Plans
In their national and recovery and resilience plans, memberstates should demonstrate that they dedicated at least 37% toclimate investments and reforms and 20% to the digitaltransition.
The Spanish plan, for instance, outlines 10 priority areas,including 17% of the investment for science and innovation,and 18% for education. The French plan envisages a broadinvestment roadmap with support to the budget upgrade ofthe national research agency and opening of an additional30,000 student places in the higher education sector. Severalother member states presented recovery plans includingeducation and research.
The national university associations and universities have aninterest in engaging at the national level to put forwardconcrete proposals of how the sector can contribute to therecovery effort. Universities have various roles to play infostering the green and digital transitions, from developingresearch and skills to adapting campus infrastructure. Directlyconnected to their missions are the objectives of reskilling andupskilling the working age population, and strengthening thelink between education and the labour market.
Source: https://ec.europa.eu/info/business-economy-euro/recovery-coronavirus/recovery-and-resilience-facility_en

EMBARGOED VERSION 11 Dec. 2017www.eua.eu
Key messages: long term

EMBARGOED VERSION 11 Dec. 2017www.eua.eu
Key messages: short term

EMBARGOED VERSION 11 Dec. 2017 44
Higher education system codes
Austria AT
Belgium – Flanders BE-nl
Belgium – French-speaking community BE-fr
Croatia HR
Czech Republic CZ
Denmark DK
Estonia EE
Finland FI
France FR
Germany DE
Greece GR
Hungary HU
Iceland IS
Ireland IE
Italy IT
Latvia LV
Lithuania LT
Luxembourg LU
Netherlands NL
Norway NO
Poland PL
Portugal PT
Romania RO
Serbia RS
Slovakia SK
Slovenia SI
Spain ES
Sweden SE
Switzerland CH
Turkey TR
UK-England UK-en
UK-Northern Ireland UK-ni
UK-Scotland UK-sc
UK-Wales UK-wa

EMBARGOED VERSION 11 Dec. 2017 45
Resources
• EUA Public Funding Observatory online tool• EUA Public Funding Observatory country sheets 2020/2021• EUA Public Funding Observatory methodological note
All available here:
http://efficiency.eua.eu/public-funding-observatory
For additional information, please contact:
EUA Governance, Funding and Public Policy Development [email protected]

EMBARGOED VERSION 11 Dec. 2017
The European University Association (EUA) is the representative organisation of
universities and national rectors’ conferences in 48 European countries. EUA plays a
crucial role in the Bologna Process and in influencing EU policies on higher education,
research and innovation. Thanks to its interaction with a range of other European and
international organisations, EUA ensures that the voice of European universities is heard
wherever decisions are being taken that will impact their activities. j
The Association provides unique expertise in higher education and research as well as a
forum for exchange of ideas and good practice among universities. The results of EUA’s
work are made available to members and stakeholders through conferences, seminars,
websites and publications.
www.EUA.eu | @euatweets
Subscribe to our newsletters: http://bit.ly/SubscribeEUANewsletters