Public Expenditure Trends and Fiscal...
22
Working Paper 2 for Afghanistan Public Expenditure Review 2010 Second Generation of Public Expenditure Reforms Public Expenditure Trends and Fiscal Sustainability Co-produced with the UK Department for International Development
Transcript of Public Expenditure Trends and Fiscal...
Working Paper 2 for
Afghanistan Public Expenditure Review 2010 Second Generation of Public Expenditure Reforms
Public Expenditure Trends and Fiscal Sustainability
Co-produced with the UK Department for International Development

1
2
Public Expenditure Trends and Fiscal Sustainability1 Key Findings
The role of public expenditure significantly increased in the past several years as core national budget expenditures rose from 9 percent of GDP in 2002/03 to 20 percent in 2009/10.
The domestic revenue-to-GDP ratio increased to 9.4 percent in 2009/10. Afghanistan’s ratio remains lower than other low income countries. Income tax revenues increased considerably, mainly due to the operationalization of Large Taxpayers Office (LTO), while those of customs duties stagnated. Transfers of administration fees from line ministries to the Treasury Single Account could potentially increase domestic revenues. The introduction of two percent BRT on imposts with the enactment of the amended income tax law and revenues from state fuel company contributed to the increase in 2009/10.
Key policy recommendations are, (i) smooth implementation of new tax measures; (ii) adequate resource allocation for the revenue and customs departments; (iii) operationalization of LTOs and Medium Taxpayers Offices (MTOs) in provinces; (iv) improvement of the domestic revenue policy formulation framework, and (v) introduction/operationalization of the Standard Integration of Government Tax Administration System (SIGTAS).
Afghanistan’s expenditure structure is dominated by the external budget (off-budget) that accounts for about three quarters of total expenditures. Security consumes about 60 percent of the national expenditures followed by infrastructure in the past several years. The security and education sectors account for more than 80 percent of government employees and are the largest sources of core operating expenditures. The low execution rate of core development expenditures has negatively affected development. On average, the undisbursed core development budget amounts to 9 percent of GDP. In terms of equity of core expenditures, imbalances measured by per capita income were observed in both operating and development expenditures across provinces. Improving the quantity/quality of data on external budget expenditures should be a priority.
Low core budget deficits (after grants) have contributed to macroeconomic stability. However, the increase in the core budget deficit in 2008/09 is of great concern, and MoF will need to manage cash flow more carefully.
Progress towards fiscal sustainability (i.e. domestic revenues fully covering operating expenditures) has fallen far behind earlier expectations, though it improved in 2009/10. The indicator deteriorated from 66 percent in 2007/08 to 60 percent in 2008/09 due to the combination of lower revenues and higher operating expenditures, then it improved to 72 percent in 2010. Furthermore, prospects for achieving fiscal sustainability have further deteriorated. The March 2008 Medium Term Fiscal Framework (MTFF) projected fiscal sustainability would be achieved in 2012/13, but the July 2009 MTFF projects a fiscal sustainability rate at 73 percent in 2012/13. Significant upward revision of security expenditures (mainly due to Afghan National Army (ANA) and Afghan National Police (ANP) salary increases) is the main cause for the deterioration. Key risks affecting future fiscal sustainability are, (i) domestic revenues; (ii) further increase in security sector expenditures, and (iii) implementation of Pay and Grading (P&G) reforms. Accelerated implementation of P&G would raise P&G costs by more than 60 percent in both 2009/10 and 2010/11. It is critical that the Ministry of Finance (MoF) and the Independent Administrative Reform and Civil Service Commission (IARCSC) intensify coordination and actively manage fiscal liabilities stemming from P&G.
1 This working paper was produced by Yoichiro Ishihara (World Bank, SASEP) for Afghanistan Public
Expenditure Review based on information available as of March 31, 2010.
3
A. Structural Change and Size of Public Expenditure
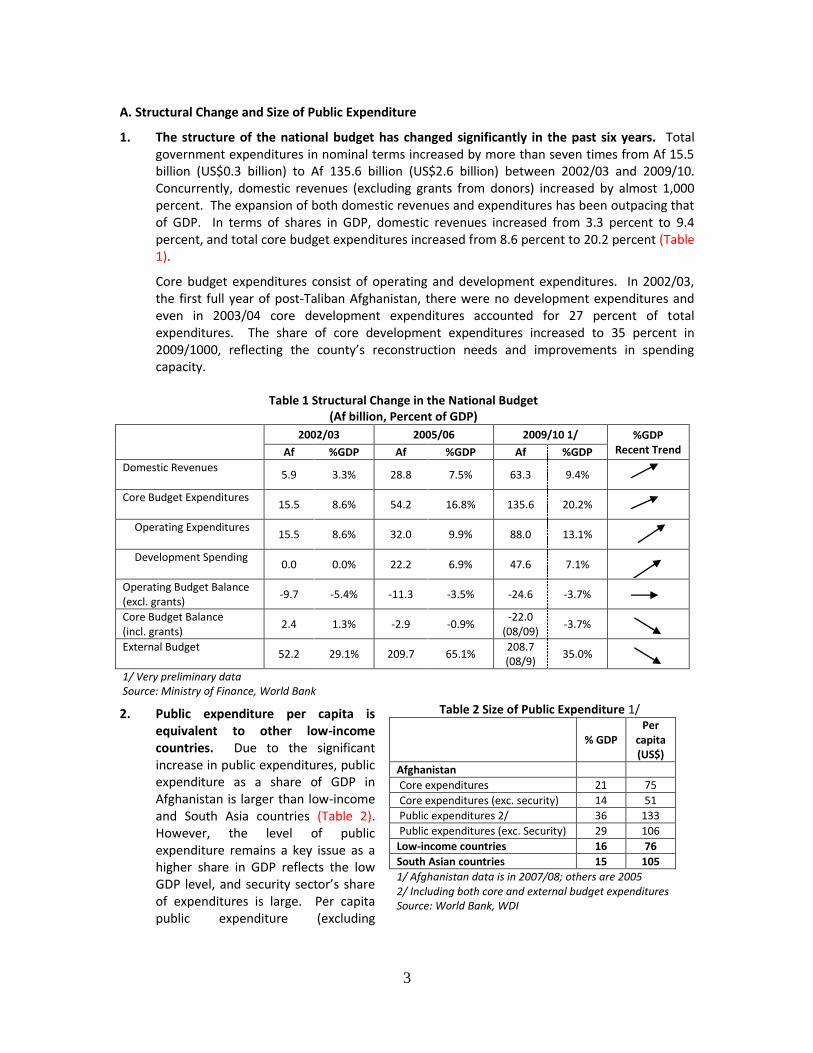
1. The structure of the national budget has changed significantly in the past six years. Total government expenditures in nominal terms increased by more than seven times from Af 15.5 billion (US$0.3 billion) to Af 135.6 billion (US$2.6 billion) between 2002/03 and 2009/10. Concurrently, domestic revenues (excluding grants from donors) increased by almost 1,000 percent. The expansion of both domestic revenues and expenditures has been outpacing that of GDP. In terms of shares in GDP, domestic revenues increased from 3.3 percent to 9.4 percent, and total core budget expenditures increased from 8.6 percent to 20.2 percent (Table 1).
Core budget expenditures consist of operating and development expenditures. In 2002/03, the first full year of post-Taliban Afghanistan, there were no development expenditures and even in 2003/04 core development expenditures accounted for 27 percent of total expenditures. The share of core development expenditures increased to 35 percent in 2009/1000, reflecting the county’s reconstruction needs and improvements in spending capacity.
2. Public expenditure per capita is equivalent to other low-income countries. Due to the significant increase in public expenditures, public expenditure as a share of GDP in Afghanistan is larger than low-income and South Asia countries (Table 2). However, the level of public expenditure remains a key issue as a higher share in GDP reflects the low GDP level, and security sector’s share of expenditures is large. Per capita public expenditure (excluding
Table 1 Structural Change in the National Budget (Af billion, Percent of GDP)
2002/03 2005/06 2009/10 1/ %GDP
Recent Trend Af %GDP Af %GDP Af %GDP
Domestic Revenues
5.9 3.3% 28.8 7.5% 63.3 9.4%
Core Budget Expenditures
15.5 8.6% 54.2 16.8% 135.6 20.2%
Operating Expenditures
15.5 8.6% 32.0 9.9% 88.0 13.1%
Development Spending
0.0 0.0% 22.2 6.9% 47.6 7.1%
Operating Budget Balance (excl. grants)
-9.7 -5.4% -11.3 -3.5% -24.6 -3.7%
Core Budget Balance (incl. grants)
2.4 1.3% -2.9 -0.9% -22.0
(08/09) -3.7%
External Budget
52.2 29.1% 209.7 65.1% 208.7 (08/9)
35.0%
1/ Very preliminary data Source: Ministry of Finance, World Bank
Table 2 Size of Public Expenditure 1/
% GDP Per
capita (US$)
Afghanistan
Core expenditures 21 75
Core expenditures (exc. security) 14 51
Public expenditures 2/ 36 133
Public expenditures (exc. Security) 29 106
Low-income countries 16 76
South Asian countries 15 105
1/ Afghanistan data is in 2007/08; others are 2005 2/ Including both core and external budget expenditures Source: World Bank, WDI
4
security) is equivalent to other South Asian countries, though higher than average low-income countries2.
Given the importance of public expenditure in achieving national objectives including the reconstruction of infrastructure and improvements in public service delivery, the level of public expenditure seems insufficient. Increasing fiscal space through domestic resource mobilization, absorbing available resources by increasing core development budget execution rates and improving the efficiency of public expenditure prioritization are equally essential.
B. Domestic Revenues
3. Afghanistan’s domestic revenue-to-GDP ratio remains among the lowest in the world3, despite significant improvements earlier in this decade, and it would be even lower if the drug economy were included in GDP. The average domestic revenue-to-GDP ratio of low-income
countries and South Asia was about 13 percent in 20064. Although the challenges Afghanistan face are different from those of other countries, domestic revenues equivalent to between 12 percent and 13 percent of GDP can be a medium-term target. Currently, domestic revenues have been sufficient to cover only 45 percent of total core expenditures. The operating budget deficits and core development expenditures are all covered by donors. Afghanistan’s immediate target is therefore to cover the core expenditures with domestic revenues (See Section E on fiscal sustainability).
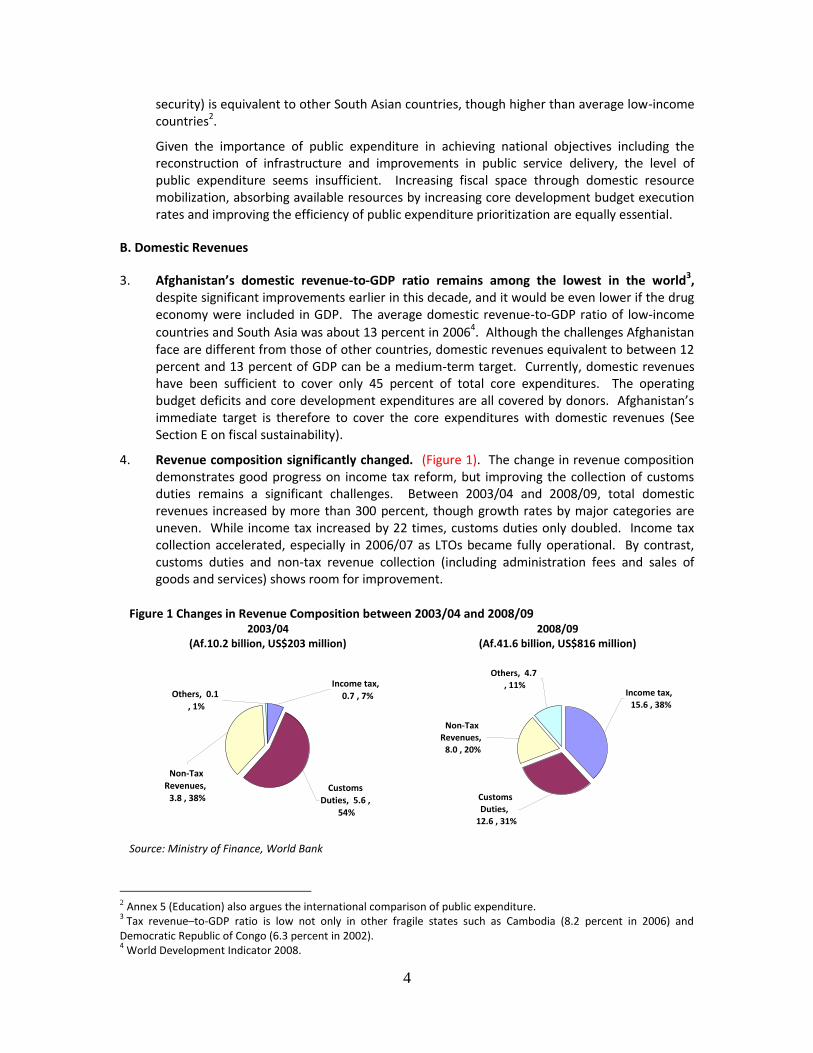
4. Revenue composition significantly changed. (Figure 1). The change in revenue composition demonstrates good progress on income tax reform, but improving the collection of customs duties remains a significant challenges. Between 2003/04 and 2008/09, total domestic revenues increased by more than 300 percent, though growth rates by major categories are uneven. While income tax increased by 22 times, customs duties only doubled. Income tax collection accelerated, especially in 2006/07 as LTOs became fully operational. By contrast, customs duties and non-tax revenue collection (including administration fees and sales of goods and services) shows room for improvement.
2 Annex 5 (Education) also argues the international comparison of public expenditure. 3 Tax revenue–to-GDP ratio is low not only in other fragile states such as Cambodia (8.2 percent in 2006) and
Democratic Republic of Congo (6.3 percent in 2002). 4 World Development Indicator 2008.
Figure 1 Changes in Revenue Composition between 2003/04 and 2008/09 2003/04
(Af.10.2 billion, US$203 million) 2008/09
(Af.41.6 billion, US$816 million)
Source: Ministry of Finance, World Bank
Non-Tax
Revenues,
3.8 , 38%Customs
Duties, 5.6 ,
54%
Income tax,
0.7 , 7%Others, 0.1
, 1%
Others, 4.7
, 11%
Non-Tax
Revenues,
8.0 , 20%
Customs
Duties,
12.6 , 31%
Income tax,
15.6 , 38%
5
5. The establishment of the LTO in February 2004 and its operationalization in December 2005 has contributed to the growth of domestic revenues. The LTO is intended to improve tax collection in Kabul by providing timely and transparent tax services to large businesses5 that were handled by Kabul Mustofiats (provincial office of MoF) in the past. LTOs collected one-third of total national income tax in 2007/08 and further increased in 2008/096. In light of its success, MoF established MTOs in 2008 and opened LTOs to Herat (covering 13 large taxpayers), Jalalabad (19 large taxpayers) and Mazar-e-Sharif (14 large taxpayers).
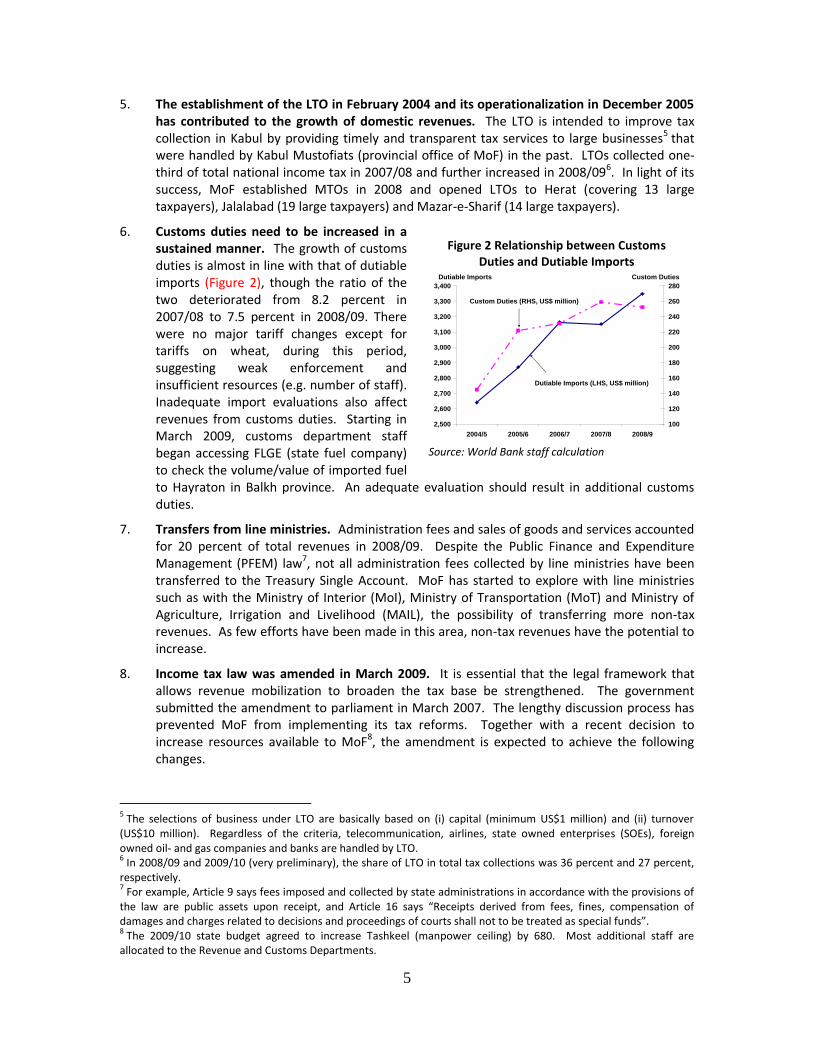
6. Customs duties need to be increased in a sustained manner. The growth of customs duties is almost in line with that of dutiable imports (Figure 2), though the ratio of the two deteriorated from 8.2 percent in 2007/08 to 7.5 percent in 2008/09. There were no major tariff changes except for tariffs on wheat, during this period, suggesting weak enforcement and insufficient resources (e.g. number of staff). Inadequate import evaluations also affect revenues from customs duties. Starting in March 2009, customs department staff began accessing FLGE (state fuel company) to check the volume/value of imported fuel to Hayraton in Balkh province. An adequate evaluation should result in additional customs duties.
7. Transfers from line ministries. Administration fees and sales of goods and services accounted for 20 percent of total revenues in 2008/09. Despite the Public Finance and Expenditure Management (PFEM) law7, not all administration fees collected by line ministries have been transferred to the Treasury Single Account. MoF has started to explore with line ministries such as with the Ministry of Interior (MoI), Ministry of Transportation (MoT) and Ministry of Agriculture, Irrigation and Livelihood (MAIL), the possibility of transferring more non-tax revenues. As few efforts have been made in this area, non-tax revenues have the potential to increase.
8. Income tax law was amended in March 2009. It is essential that the legal framework that allows revenue mobilization to broaden the tax base be strengthened. The government submitted the amendment to parliament in March 2007. The lengthy discussion process has prevented MoF from implementing its tax reforms. Together with a recent decision to increase resources available to MoF8, the amendment is expected to achieve the following changes.
5 The selections of business under LTO are basically based on (i) capital (minimum US$1 million) and (ii) turnover
(US$10 million). Regardless of the criteria, telecommunication, airlines, state owned enterprises (SOEs), foreign owned oil- and gas companies and banks are handled by LTO. 6 In 2008/09 and 2009/10 (very preliminary), the share of LTO in total tax collections was 36 percent and 27 percent,
respectively. 7 For example, Article 9 says fees imposed and collected by state administrations in accordance with the provisions of
the law are public assets upon receipt, and Article 16 says “Receipts derived from fees, fines, compensation of damages and charges related to decisions and proceedings of courts shall not to be treated as special funds”. 8 The 2009/10 state budget agreed to increase Tashkeel (manpower ceiling) by 680. Most additional staff are
allocated to the Revenue and Customs Departments.
Figure 2 Relationship between Customs Duties and Dutiable Imports
Source: World Bank staff calculation
2,500
2,600
2,700
2,800
2,900
3,000
3,100
3,200
3,300
3,400
2004/5 2005/6 2006/7 2007/8 2008/9
100
120
140
160
180
200
220
240
260
280
Custom Duties (RHS, US$ million)
Dutiable Imports (LHS, US$ million)
Custom DutiesDutiable Imports
6
Impose a two percent Business Receipt Tax (BRT) on imports.
Simplify income tax for small businesses and eliminate most fixed taxes for specific activities.
Move the BRT towards a broad-based goods and services tax (and future Value Added Tax).
Remove a number of nuisance taxes (notably Sukook taxes) and simplify the tax structure in this area.
Introduce a new income tax bracket at two percent (Af 5,000-12,500 per month) to instill a tax culture among Afghans. The rate is low but will generate revenues.
9. Corruption and Taxation9. Vulnerabilities to Corruption Assessments (VCAs) of the Revenue Department of MoF10 identified five key areas with the combination of high corruption risk and high potential revenue losses. These are:
Returns processing, review, and analysis by Mustofiats.
Internal audit of MoF.
Selection of taxpayers for audit investigation.
Corporate audit investigations.
Issuing Public/Private rulings, handling objections and appeals, and the litigation process.
For each one of these areas the VCAs made recommendations relating to, (i) process, (ii) vulnerabilities and potential scale of revenue loss, and (iii) mitigation measures. The Revenue Department of MoF has incorporated mitigation measures into its strategy. Box 2.1 shows an example of “returns processing, review and analysis by Mustofiats”.
9 VCA on the Custom Department is being conducted by the World Bank.
10 World Bank (2009) “Fighting Corruption in Afghanistan: Summaries of Vulnerabilities to Corruption Assessments”
provides more details including process
Box 1 Returns processing, review, and analysis by Mustofiats
Process: Except for large taxpayers, Mustofiats retain responsibility for the assessment and collection of a wide range of taxes and sukooks (administrative levies), including Business Receipts Tax of Limited Liability Companies and Corporations, and Tax on Income of Importers/Exporters. Financial management and record keeping practices vary between Mustofiats. There is a high degree of discretionary authority during the process of reviewing returns, where taxpayers are required to present different forms of business and financial information.
Vulnerabilities and Potential Scale of Revenue Loss: Returns processing, like all other tax assessment and collection process in the Mustofiats, is inherently prone to a high degree of corruption risk at petty and major administrative levels. Bribery occurs to both accelerate processing and to enable taxpayers to avoid their tax obligations. Survey evidence consistently confirms “speed money” is the norm at all levels of the Mustofiats, as is a “bribery tariff” to remove or reduce tax liabilities based on payment of 5-10 percent of the assessed liability.
Mitigation Measures: The reform of the seven priority provinces supported by 982 appointments under the Priority Reform and Restructuring (PRR) program is significant for corruption prevention. Interim mitigation measures, that also serve to send positive anti-corruption signals to the Mustofiats include, (i) increasing the level of internal audits; (ii) risk-based MoF audit of selected taxpayers; (iii) staff rotation policy and practices, and (iv) introduction of taxpayer report cards, secure post boxes and telephone hotlines supported by a complaints investigation procedure and disciplinary framework under Article 111 of the Income Tax Law.
Action Implemented: While the process of reforming Mustofiats has benefited from building capacity in accounting and legal knowledge, fundamental aspects of the reform process, like the establishment of Provincial Revenue Offices directly responsible to the Director General of Revenue, have been held up due to political factors. The capacity development of LTO/MTOs and roll-out of the Standard Integration of Government Tax Administration System (SIGTAS) in five priority provinces - Herat, Balkh, Nangarhar, Kunduz and Kandahar – represent key components of Phase II of the Revenue Reform Project, however the strengthening of Mustofiats’ capacity and integrity remains a challenge and imperative.
7
10. Policy formulation process based on analyses should be established. A steering committee was created to oversee tax reform and customs modernization. Policy decisions in these areas must be based on sound analysis because of the affect they will have on domestic revenues and other macroeconomic variables. The reduction of soft drink tariffs from 40 percent to 20 percent in 2007 is an example of a key policy decision made in the absence of concrete analysis11.
C. Expenditures
11. Data limitation. Analysis of expenditures in Afghanistan is severely constrained by the lack of timely, reliable and comprehensive data. A consistent classification of expenditure data covering both the core budget and external budget is currently not available. All of the external budget expenditures are loosely labeled as “development spending”. There are also major reporting problems that create serious data gaps. In particular, external budget data are not reported in a timely manner, creating serious problems for data comparability. While these deficiencies detract from drawing robust conclusions on public expenditure trends, it is still possible to draw some broad conclusions on expenditure composition and trends, key drivers of change and their implications for public resource management.
National Budget
12. Afghanistan’s expenditure structure is dominated by the external budget (donor-executed, off-budget), as opposed to the core budget (on-budget). Between 2002/03 and 2008/09, total national expenditures amounted to US$35.1 billion. The core budget reached US$8.8 billion (25 percent), while external budget accounted for US$26.3 billion (75 percent). Nevertheless, the share of the security sector in external budget expenditures during the period was 65 percent.
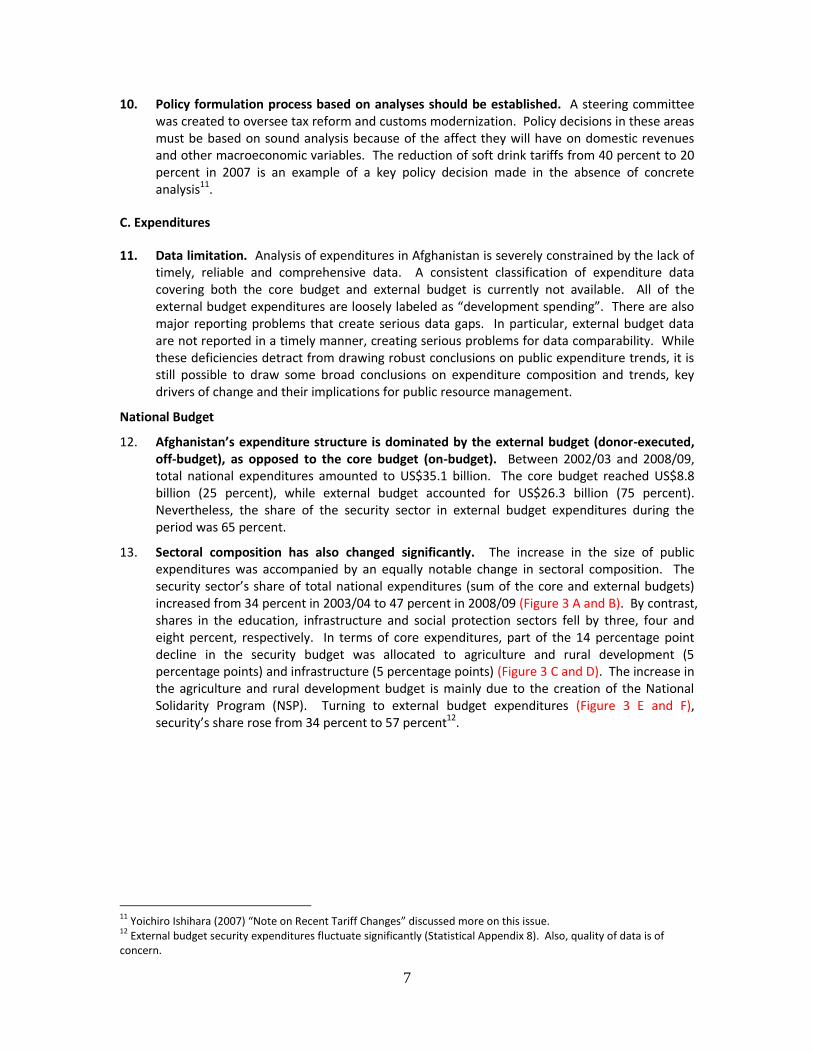
13. Sectoral composition has also changed significantly. The increase in the size of public expenditures was accompanied by an equally notable change in sectoral composition. The security sector’s share of total national expenditures (sum of the core and external budgets) increased from 34 percent in 2003/04 to 47 percent in 2008/09 (Figure 3 A and B). By contrast, shares in the education, infrastructure and social protection sectors fell by three, four and eight percent, respectively. In terms of core expenditures, part of the 14 percentage point decline in the security budget was allocated to agriculture and rural development (5 percentage points) and infrastructure (5 percentage points) (Figure 3 C and D). The increase in the agriculture and rural development budget is mainly due to the creation of the National Solidarity Program (NSP). Turning to external budget expenditures (Figure 3 E and F), security’s share rose from 34 percent to 57 percent12.
11
Yoichiro Ishihara (2007) “Note on Recent Tariff Changes” discussed more on this issue. 12
External budget security expenditures fluctuate significantly (Statistical Appendix 8). Also, quality of data is of concern.
8
Core Budget Expenditures
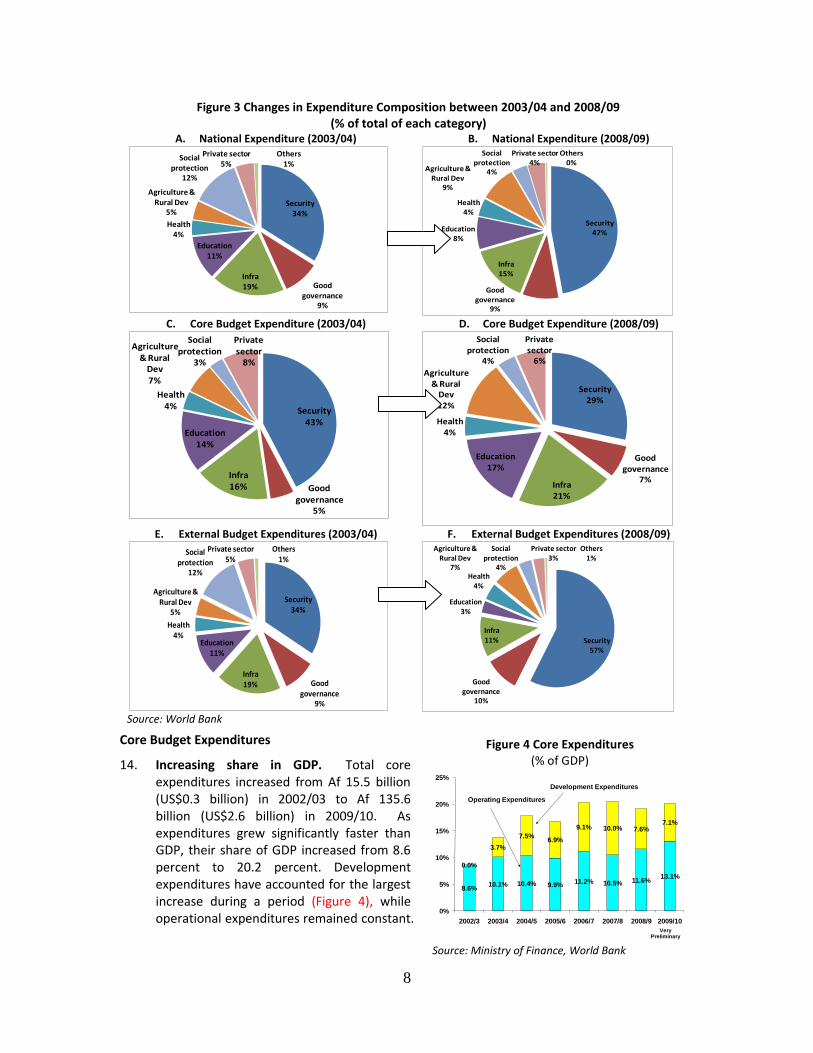
14. Increasing share in GDP. Total core expenditures increased from Af 15.5 billion (US$0.3 billion) in 2002/03 to Af 135.6 billion (US$2.6 billion) in 2009/10. As expenditures grew significantly faster than GDP, their share of GDP increased from 8.6 percent to 20.2 percent. Development expenditures have accounted for the largest increase during a period (Figure 4), while operational expenditures remained constant.
Figure 4 Core Expenditures (% of GDP)
Source: Ministry of Finance, World Bank
8.6%10.1% 10.4% 9.9%
11.2% 10.5% 11.6%13.1%
0.0%
3.7%
7.5%6.9%
9.1% 10.0% 7.6%7.1%
0%
5%
10%
15%
20%
25%
2002/3 2003/4 2004/5 2005/6 2006/7 2007/8 2008/9 2009/10
Operating Expenditures
Development Expenditures
Very Preliminary
Figure 3 Changes in Expenditure Composition between 2003/04 and 2008/09 (% of total of each category)
A. National Expenditure (2003/04) B. National Expenditure (2008/09)
C. Core Budget Expenditure (2003/04) D. Core Budget Expenditure (2008/09)
E. External Budget Expenditures (2003/04) F. External Budget Expenditures (2008/09)
Source: World Bank
Security34%
Good governance
9%
Infra19%
Education11%
Health4%
Agriculture & Rural Dev
5%
Social protection
12%
Private sector 5%
Others1%
Security47%
Good governance
9%
Infra15%
Education8%
Health4%
Agriculture & Rural Dev
9%
Social protection
4%
Private sector 4%
Others0%
Security43%
Good governance
5%
Infra16%
Education14%
Health4%
Agriculture & Rural
Dev7%
Social protection
3%
Private sector
8%
Security29%
Good governance
7%Infra21%
Education17%
Health4%
Agriculture & Rural
Dev12%
Social protection
4%
Private sector
6%
Security34%
Good governance
9%
Infra19%
Education11%
Health4%
Agriculture & Rural Dev
5%
Social protection
12%
Private sector 5%
Others1%
Security57%
Good governance
10%
Infra11%
Education3%
Health4%
Agriculture & Rural Dev
7%
Social protection
4%
Private sector 3%
Others1%
9
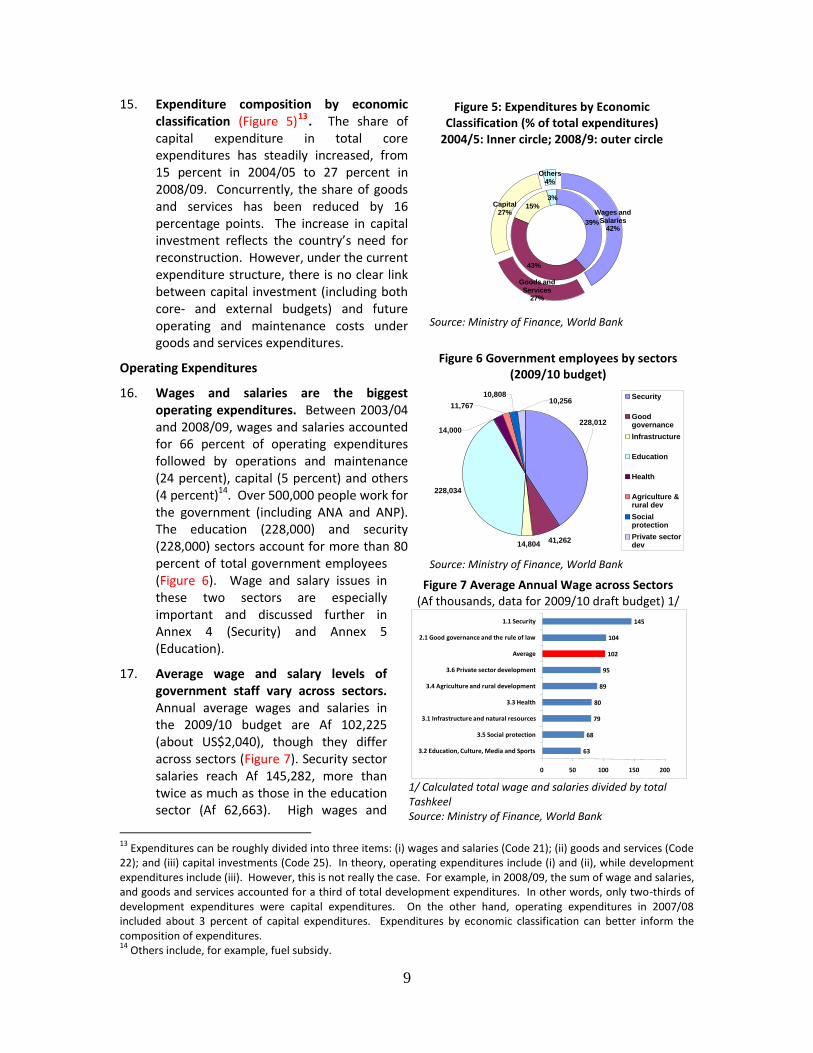
15. Expenditure composition by economic classification (Figure 5)13. The share of capital expenditure in total core expenditures has steadily increased, from 15 percent in 2004/05 to 27 percent in 2008/09. Concurrently, the share of goods and services has been reduced by 16 percentage points. The increase in capital investment reflects the country’s need for reconstruction. However, under the current expenditure structure, there is no clear link between capital investment (including both core- and external budgets) and future operating and maintenance costs under goods and services expenditures.
Operating Expenditures
16. Wages and salaries are the biggest operating expenditures. Between 2003/04 and 2008/09, wages and salaries accounted for 66 percent of operating expenditures followed by operations and maintenance (24 percent), capital (5 percent) and others (4 percent)14. Over 500,000 people work for the government (including ANA and ANP). The education (228,000) and security (228,000) sectors account for more than 80 percent of total government employees (Figure 6). Wage and salary issues in these two sectors are especially important and discussed further in Annex 4 (Security) and Annex 5 (Education).
17. Average wage and salary levels of government staff vary across sectors. Annual average wages and salaries in the 2009/10 budget are Af 102,225 (about US$2,040), though they differ across sectors (Figure 7). Security sector salaries reach Af 145,282, more than twice as much as those in the education sector (Af 62,663). High wages and
13
Expenditures can be roughly divided into three items: (i) wages and salaries (Code 21); (ii) goods and services (Code 22); and (iii) capital investments (Code 25). In theory, operating expenditures include (i) and (ii), while development expenditures include (iii). However, this is not really the case. For example, in 2008/09, the sum of wage and salaries, and goods and services accounted for a third of total development expenditures. In other words, only two-thirds of development expenditures were capital expenditures. On the other hand, operating expenditures in 2007/08 included about 3 percent of capital expenditures. Expenditures by economic classification can better inform the composition of expenditures. 14
Others include, for example, fuel subsidy.
Figure 5: Expenditures by Economic Classification (% of total expenditures)
2004/5: Inner circle; 2008/9: outer circle
Source: Ministry of Finance, World Bank
39%
43%
15%
3%
Wages and Salaries
42%
Goods and Services
27%
Capital27%
Others4%
Figure 6 Government employees by sectors (2009/10 budget)
Source: Ministry of Finance, World Bank
41,26214,804
228,034
10,808
11,767
14,000
10,256
228,012
Security
Goodgovernance
Infrastructure
Education
Health
Agriculture &rural dev
Socialprotection
Private sectordev
Figure 7 Average Annual Wage across Sectors (Af thousands, data for 2009/10 draft budget) 1/
1/ Calculated total wage and salaries divided by total Tashkeel Source: Ministry of Finance, World Bank
63
68
79
80
89
95
102
104
145
0 50 100 150 200
3.2 Education, Culture, Media and Sports
3.5 Social protection
3.1 Infrastructure and natural resources
3.3 Health
3.4 Agriculture and rural development
3.6 Private sector development
Average
2.1 Good governance and the rule of law
1.1 Security
10
salaries in the security sector are partly due to the US$20 per month salary increase for ANA and ANP introduced in the second half of 2008/09. Differences in average salaries in non-uniformed sectors are related to differences in the composition of the civil service and ministries, resulting in service delivery personnel like those in the Ministry of Education (MoE) receiving lower average salaries.
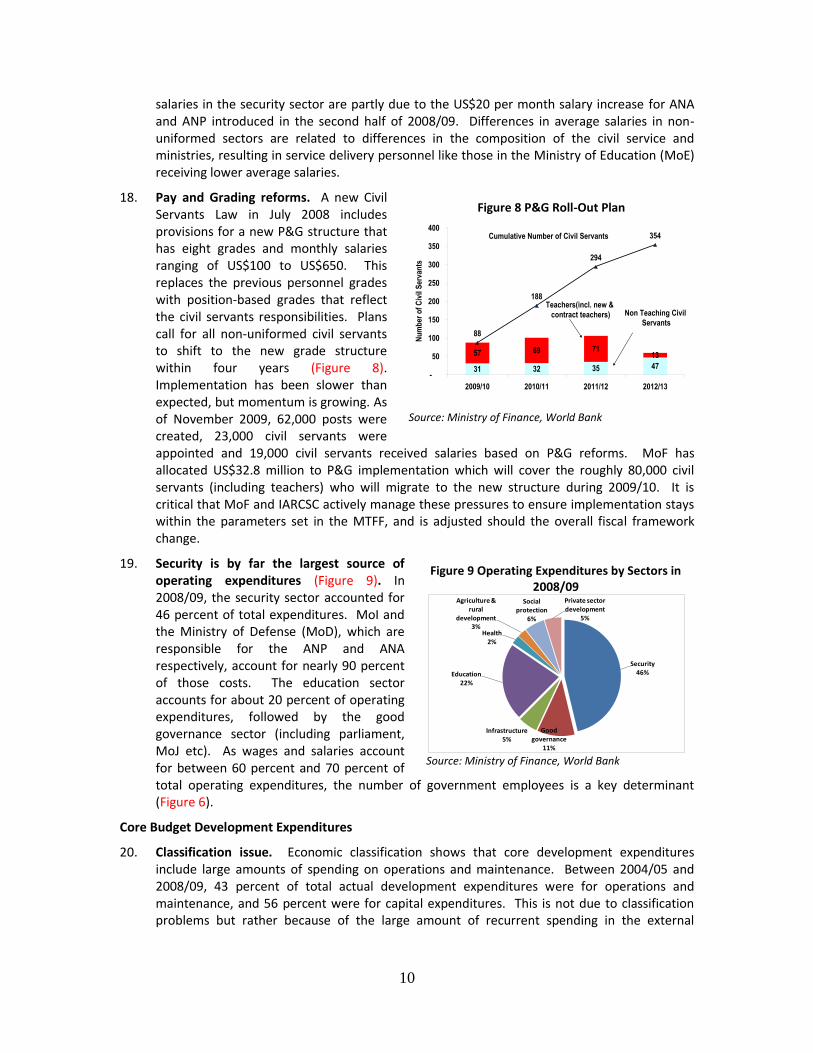
18. Pay and Grading reforms. A new Civil Servants Law in July 2008 includes provisions for a new P&G structure that has eight grades and monthly salaries ranging of US$100 to US$650. This replaces the previous personnel grades with position-based grades that reflect the civil servants responsibilities. Plans call for all non-uniformed civil servants to shift to the new grade structure within four years (Figure 8). Implementation has been slower than expected, but momentum is growing. As of November 2009, 62,000 posts were created, 23,000 civil servants were appointed and 19,000 civil servants received salaries based on P&G reforms. MoF has allocated US$32.8 million to P&G implementation which will cover the roughly 80,000 civil servants (including teachers) who will migrate to the new structure during 2009/10. It is critical that MoF and IARCSC actively manage these pressures to ensure implementation stays within the parameters set in the MTFF, and is adjusted should the overall fiscal framework change.
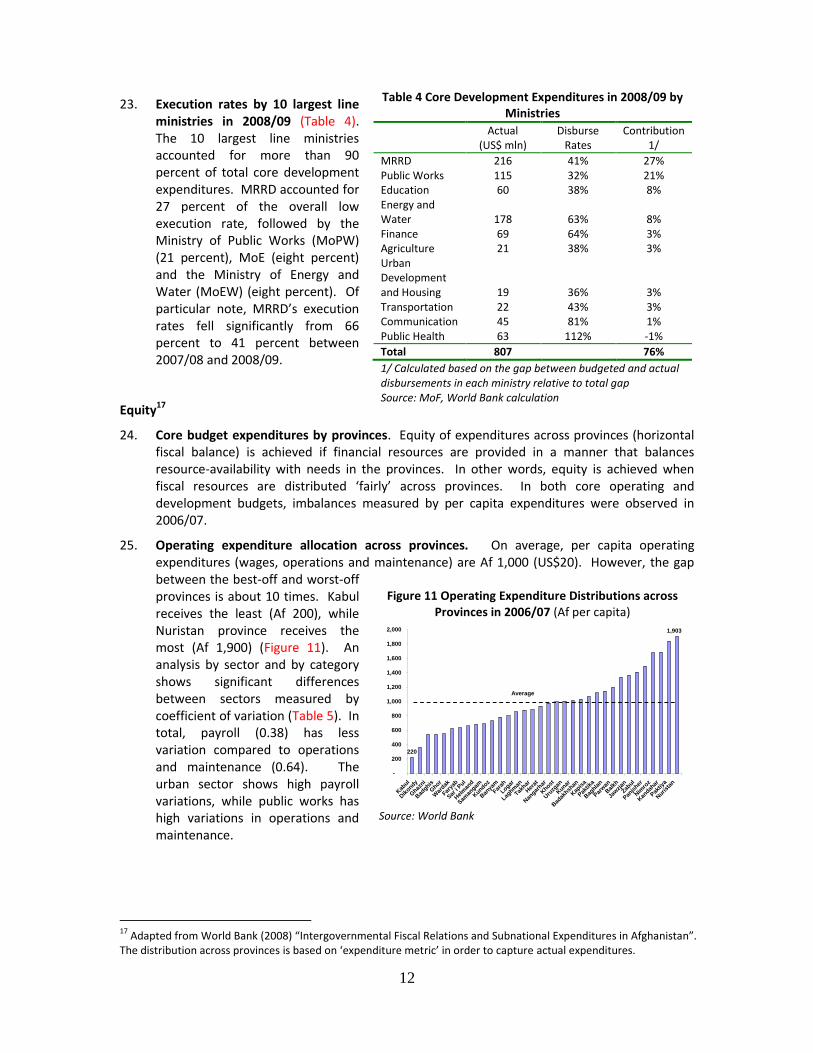
19. Security is by far the largest source of operating expenditures (Figure 9). In 2008/09, the security sector accounted for 46 percent of total expenditures. MoI and the Ministry of Defense (MoD), which are responsible for the ANP and ANA respectively, account for nearly 90 percent of those costs. The education sector accounts for about 20 percent of operating expenditures, followed by the good governance sector (including parliament, MoJ etc). As wages and salaries account for between 60 percent and 70 percent of total operating expenditures, the number of government employees is a key determinant (Figure 6).
Core Budget Development Expenditures
20. Classification issue. Economic classification shows that core development expenditures include large amounts of spending on operations and maintenance. Between 2004/05 and 2008/09, 43 percent of total actual development expenditures were for operations and maintenance, and 56 percent were for capital expenditures. This is not due to classification problems but rather because of the large amount of recurrent spending in the external
Figure 8 P&G Roll-Out Plan
Source: Ministry of Finance, World Bank
31 32 35 47
57 69 7113
294
354
88
188
-
50
100
150
200
250
300
350
400
2009/10 2010/11 2011/12 2012/13
Nu
mb
er o
f C
ivil
Ser
van
ts
Cumulative Number of Civil Servants
Teachers(incl. new &
contract teachers) Non Teaching Civil
Servants
Figure 9 Operating Expenditures by Sectors in 2008/09
Source: Ministry of Finance, World Bank
Security46%
Good governance
11%
Infrastructure 5%
Education22%
Health2%
Agriculture & rural
development3%
Social protection
6%
Private sector development
5%

11
assistance that supports core development expenditures, particularly in the health sector15. Currently, external assistance accounts for more than 90 percent of the core development budget, which is largely formulated on a project basis. As such, economic composition is heavily weighted by external assistance to the core development budget. Nevertheless, the share of capital expenditures in core development expenditures has increased from 26 percent in 2004/05 to 65 percent in 2008/09.
21. Low execution rates are key constraints to development. Persistent low execution rates of core development expenditures hinder the achievement of development objectives. These low rates generally reflect, (i) low absorption capacity of implementing agencies; (ii) weak budget formulation process by both MoF and implementing agencies, and (iii) poor project formulation capacity of donors. The execution rates, defined as the ratio between actual disbursements and the mid-year budget, improved from 41 percent in 2005/06 to 54 percent in 2006/07-2007/08. In 2008/09 and 2009/10, execution rates deteriorated to 43 percent and 40 percent, respectively (Figure 10). The fall in execution rates in 2008/09 can be attributed to confusion about program budgeting that had led to almost no disbursement in the first month, and the lack of resources for bridge financing by MoF. Although donors are partly responsible for low execution rates, questions must also be raised about the absorption capacity of line ministries that prevents donor assistance from shifting from the external budget to the core development budget.
22. Estimates of the impact of low core development budget execution 16 . In Afghanistan, almost 100 percent of the core development budget is externally financed so the gap between budgeted and actual core development expenditures can be considered a proxy for GDP loss. On average, between 2005/06 and 2008/09 an amount equivalent to nine percent of GDP (nominal) was not executed (Table 3).
15
For example, the MoPH’s Basic Package of Health Service (BPHS), which is a part of core development budget programs, includes sizable operations and maintenance components. 16
Overestimates of the core development budget are part of the reason for low execution rates. This estimate to some extent overstates the impacts. Also, this paragraph does not take multiplier effect into account.
Figure 10 Core Development Expenditures (absolute values ($ million) and disbursement
rates 1/)
1/ Related to Mid-Year Review Source: Ministry of Finance, World Bank
448
705
967 891 914
41%
54% 54%
43%40%
0%
10%
20%
30%
40%
50%
60%
-
200
400
600
800
1,000
1,200
1,400
1,600
2005/6 2006/7 2007/8 2008/9 2009/10
Absolute values (LHS)
US$ millionExecution rates (RHS)
Table 3 Impacts of Low Core Development Expenditures
Year Gap (US$ million)
% Nominal GDP
2005/06 596 9.3 2006/07 609 7.9 2007/08 833 8.7
2008/09 1,174 9.7
2009/10 1,368 10.6
Source: MoF, World Bank calculation
12
23. Execution rates by 10 largest line ministries in 2008/09 (Table 4). The 10 largest line ministries accounted for more than 90 percent of total core development expenditures. MRRD accounted for 27 percent of the overall low execution rate, followed by the Ministry of Public Works (MoPW) (21 percent), MoE (eight percent) and the Ministry of Energy and Water (MoEW) (eight percent). Of particular note, MRRD’s execution rates fell significantly from 66 percent to 41 percent between 2007/08 and 2008/09.
Equity17
24. Core budget expenditures by provinces. Equity of expenditures across provinces (horizontal fiscal balance) is achieved if financial resources are provided in a manner that balances resource-availability with needs in the provinces. In other words, equity is achieved when fiscal resources are distributed ‘fairly’ across provinces. In both core operating and development budgets, imbalances measured by per capita expenditures were observed in 2006/07.
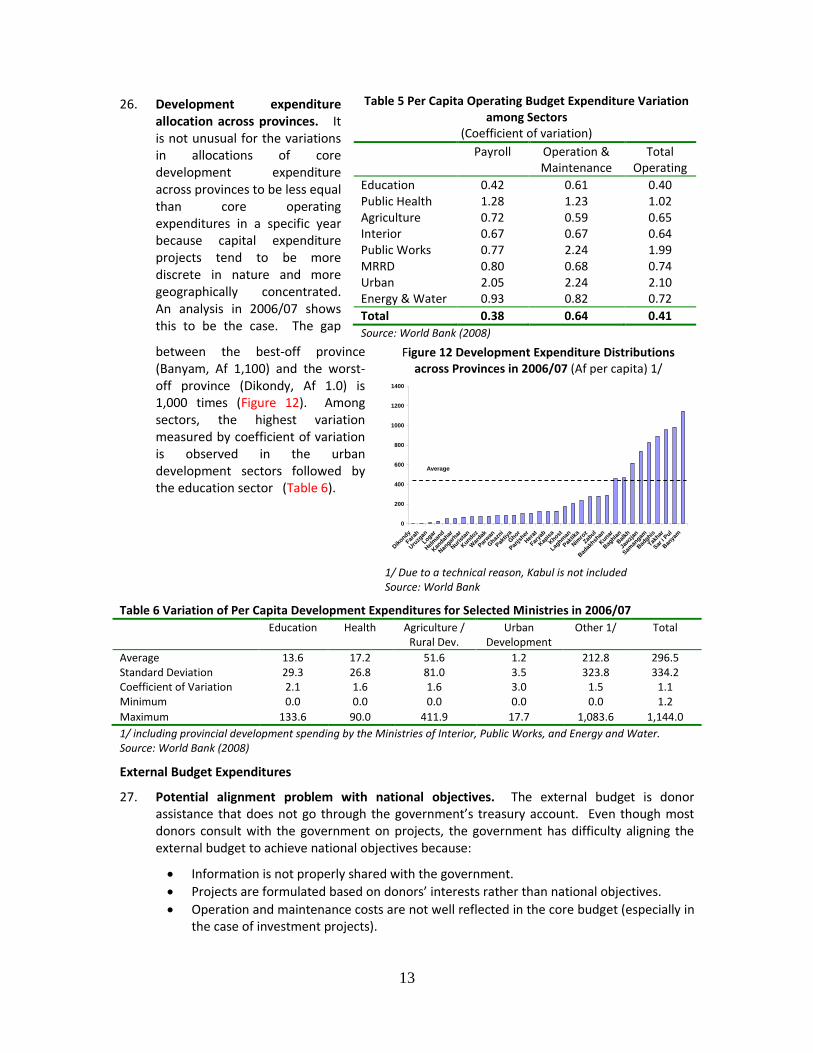
25. Operating expenditure allocation across provinces. On average, per capita operating expenditures (wages, operations and maintenance) are Af 1,000 (US$20). However, the gap between the best-off and worst-off provinces is about 10 times. Kabul receives the least (Af 200), while Nuristan province receives the most (Af 1,900) (Figure 11). An analysis by sector and by category shows significant differences between sectors measured by coefficient of variation (Table 5). In total, payroll (0.38) has less variation compared to operations and maintenance (0.64). The urban sector shows high payroll variations, while public works has high variations in operations and maintenance.
17
Adapted from World Bank (2008) “Intergovernmental Fiscal Relations and Subnational Expenditures in Afghanistan”. The distribution across provinces is based on ‘expenditure metric’ in order to capture actual expenditures.
Table 4 Core Development Expenditures in 2008/09 by Ministries
Actual (US$ mln)
Disburse Rates
Contribution 1/
MRRD 216 41% 27% Public Works 115 32% 21% Education 60 38% 8% Energy and Water 178 63% 8% Finance 69 64% 3% Agriculture 21 38% 3% Urban Development and Housing 19 36% 3% Transportation 22 43% 3% Communication 45 81% 1% Public Health 63 112% -1%
Total 807 76%
1/ Calculated based on the gap between budgeted and actual disbursements in each ministry relative to total gap Source: MoF, World Bank calculation
Figure 11 Operating Expenditure Distributions across Provinces in 2006/07 (Af per capita)
Source: World Bank
1,903
220
-
200
400
600
800
1,000
1,200
1,400
1,600
1,800
2,000
Kab
ul
Dik
ondy
Ghaz
ni
Bad
ghis
Ghor
War
dak
Farya
b
Sar
i Pul
Hel
man
d
Sam
angam
Kundoz
Ban
yam
Farah
Logar
Laghm
an
Takhar
Her
at
Nan
garhar
Khost
Uru
zgan
Kunar
Bad
akhsh
an
Kap
isa
Pak
tika
Bag
hlan
Par
wan
Bal
kh
Jawzjan
Zabul
Pan
jsher
Nim
roz
Kan
dahar
Pak
tiya
Nuri
stan
Average
13
26. Development expenditure allocation across provinces. It is not unusual for the variations in allocations of core development expenditure across provinces to be less equal than core operating expenditures in a specific year because capital expenditure projects tend to be more discrete in nature and more geographically concentrated. An analysis in 2006/07 shows this to be the case. The gap
between the best-off province (Banyam, Af 1,100) and the worst-off province (Dikondy, Af 1.0) is 1,000 times (Figure 12). Among sectors, the highest variation measured by coefficient of variation is observed in the urban development sectors followed by the education sector (Table 6).
Table 6 Variation of Per Capita Development Expenditures for Selected Ministries in 2006/07
Education Health Agriculture / Rural Dev.
Urban Development
Other 1/ Total
Average 13.6 17.2 51.6 1.2 212.8 296.5 Standard Deviation 29.3 26.8 81.0 3.5 323.8 334.2 Coefficient of Variation 2.1 1.6 1.6 3.0 1.5 1.1 Minimum 0.0 0.0 0.0 0.0 0.0 1.2
Maximum 133.6 90.0 411.9 17.7 1,083.6 1,144.0
1/ including provincial development spending by the Ministries of Interior, Public Works, and Energy and Water. Source: World Bank (2008)
External Budget Expenditures
27. Potential alignment problem with national objectives. The external budget is donor assistance that does not go through the government’s treasury account. Even though most donors consult with the government on projects, the government has difficulty aligning the external budget to achieve national objectives because:
Information is not properly shared with the government.
Projects are formulated based on donors’ interests rather than national objectives.
Operation and maintenance costs are not well reflected in the core budget (especially in the case of investment projects).
Table 5 Per Capita Operating Budget Expenditure Variation among Sectors
(Coefficient of variation)
Payroll Operation & Maintenance
Total Operating
Education 0.42 0.61 0.40 Public Health 1.28 1.23 1.02 Agriculture 0.72 0.59 0.65 Interior 0.67 0.67 0.64 Public Works 0.77 2.24 1.99 MRRD 0.80 0.68 0.74 Urban 2.05 2.24 2.10 Energy & Water 0.93 0.82 0.72
Total 0.38 0.64 0.41
Source: World Bank (2008)
Figure 12 Development Expenditure Distributions across Provinces in 2006/07 (Af per capita) 1/
1/ Due to a technical reason, Kabul is not included Source: World Bank
0
200
400
600
800
1000
1200
1400
Dik
ondy
Farah
Uru
zgan
Logar
Hel
man
d
Kan
dahar
Nan
garhar
Nuri
stan
Kundoz
War
dak
Par
wan
Ghaz
ni
Pak
tiya
Ghor
Pan
jsher
Her
at
Farya
b
Kap
isa
Khost
Laghm
an
Pak
tika
Nim
roz
Zabul
Bad
akhsh
an
Kunar
Bag
hlan
Bal
kh
Jawzjan
Sam
angam
Bad
ghis
Takhar
Sar
i Pul
Ban
yam
Average
14
28. Progress on data collection. Although information sharing needs to be further improved, 2008 saw significant progress in the collection of data related to the external budget. The Aid Management Unit (AMU) of MoF initiated the Donor Financial Review (DFR) in mid-2008 to improve the quality/quantity of donor assistance data with particular attention paid to the external budget. There are several areas for further improvement. Although by far the largest sector, by its nature information sharing on the security sector is extremely difficult. Key donors (USA, World Bank, EU and IMF) and ministries (MoF, MoD and MoI) have created an informal technical working group to improve security sector information sharing.
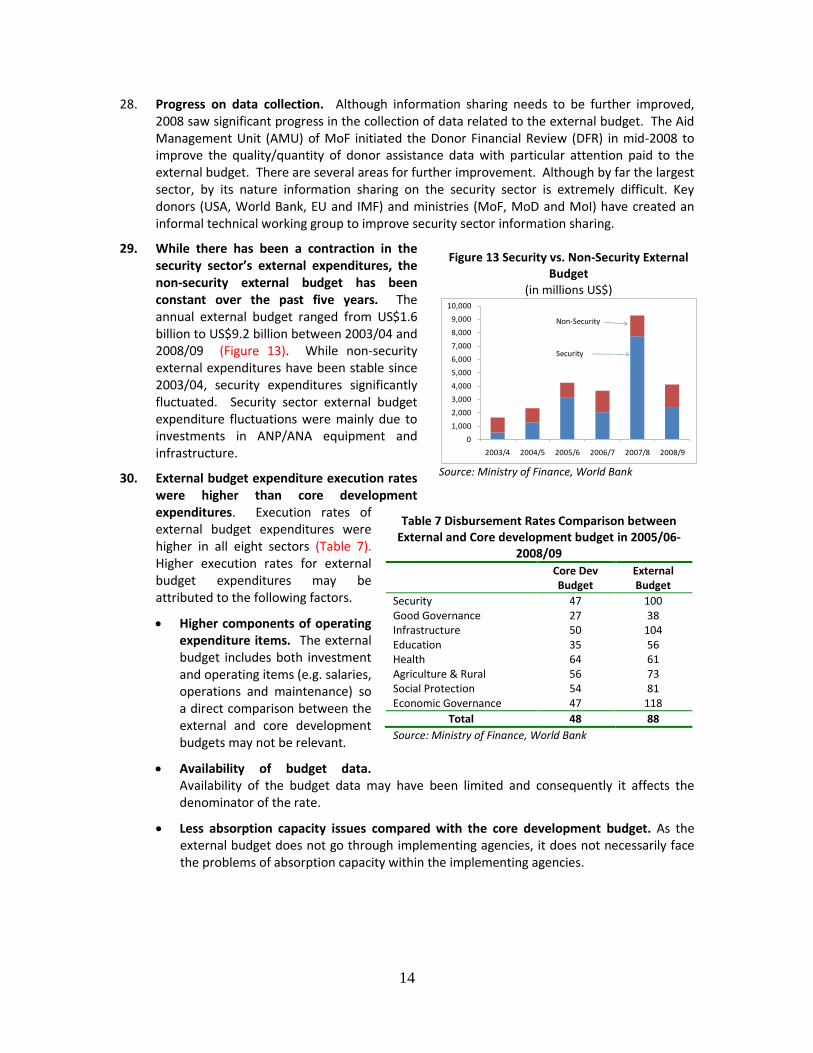
29. While there has been a contraction in the security sector’s external expenditures, the non-security external budget has been constant over the past five years. The annual external budget ranged from US$1.6 billion to US$9.2 billion between 2003/04 and 2008/09 (Figure 13). While non-security external expenditures have been stable since 2003/04, security expenditures significantly fluctuated. Security sector external budget expenditure fluctuations were mainly due to investments in ANP/ANA equipment and infrastructure.
30. External budget expenditure execution rates were higher than core development expenditures. Execution rates of external budget expenditures were higher in all eight sectors (Table 7). Higher execution rates for external budget expenditures may be attributed to the following factors.
Higher components of operating expenditure items. The external budget includes both investment and operating items (e.g. salaries, operations and maintenance) so a direct comparison between the external and core development budgets may not be relevant.
Availability of budget data. Availability of the budget data may have been limited and consequently it affects the denominator of the rate.
Less absorption capacity issues compared with the core development budget. As the external budget does not go through implementing agencies, it does not necessarily face the problems of absorption capacity within the implementing agencies.
Figure 13 Security vs. Non-Security External Budget
(in millions US$)
Source: Ministry of Finance, World Bank
0
1,000
2,000
3,000
4,000
5,000
6,000
7,000
8,000
9,000
10,000
2003/4 2004/5 2005/6 2006/7 2007/8 2008/9
Security
Non-Security
Table 7 Disbursement Rates Comparison between External and Core development budget in 2005/06-
2008/09
Core Dev Budget
External Budget
Security 47 100 Good Governance 27 38 Infrastructure 50 104 Education 35 56 Health 64 61 Agriculture & Rural 56 73 Social Protection 54 81 Economic Governance 47 118
Total 48 88
Source: Ministry of Finance, World Bank
15
D. Core Budget Balance and Financing
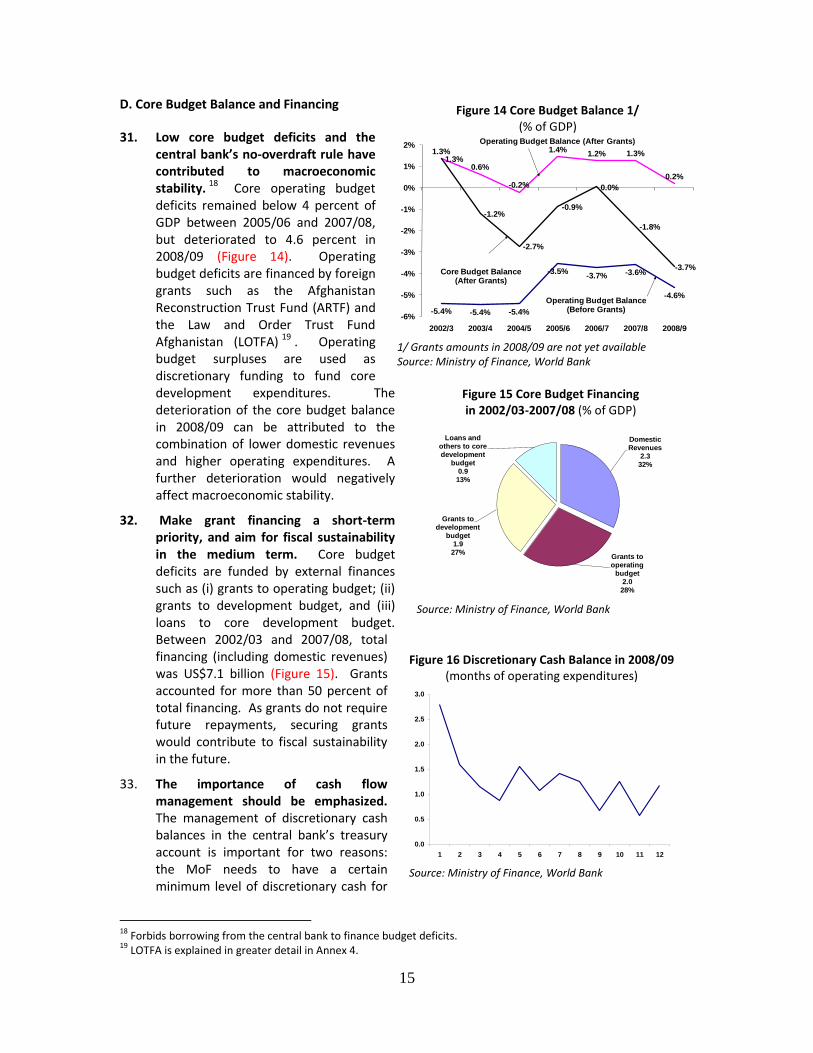
31. Low core budget deficits and the central bank’s no-overdraft rule have contributed to macroeconomic stability. 18 Core operating budget deficits remained below 4 percent of GDP between 2005/06 and 2007/08, but deteriorated to 4.6 percent in 2008/09 (Figure 14). Operating budget deficits are financed by foreign grants such as the Afghanistan Reconstruction Trust Fund (ARTF) and the Law and Order Trust Fund Afghanistan (LOTFA) 19 . Operating budget surpluses are used as discretionary funding to fund core development expenditures. The deterioration of the core budget balance in 2008/09 can be attributed to the combination of lower domestic revenues and higher operating expenditures. A further deterioration would negatively affect macroeconomic stability.
32. Make grant financing a short-term priority, and aim for fiscal sustainability in the medium term. Core budget deficits are funded by external finances such as (i) grants to operating budget; (ii) grants to development budget, and (iii) loans to core development budget. Between 2002/03 and 2007/08, total financing (including domestic revenues) was US$7.1 billion (Figure 15). Grants accounted for more than 50 percent of total financing. As grants do not require future repayments, securing grants would contribute to fiscal sustainability in the future.
33. The importance of cash flow management should be emphasized. The management of discretionary cash balances in the central bank’s treasury account is important for two reasons: the MoF needs to have a certain minimum level of discretionary cash for
18
Forbids borrowing from the central bank to finance budget deficits. 19
LOTFA is explained in greater detail in Annex 4.
Figure 14 Core Budget Balance 1/ (% of GDP)
1/ Grants amounts in 2008/09 are not yet available Source: Ministry of Finance, World Bank
-5.4% -5.4% -5.4%
-3.5%-3.7% -3.6%
-4.6%
1.3%
0.6%
-0.2%
1.4%1.2% 1.3%
0.2%
1.3%
-1.2%
-2.7%
-0.9%
0.0%
-1.8%
-3.7%
-6%
-5%
-4%
-3%
-2%
-1%
0%
1%
2%
2002/3 2003/4 2004/5 2005/6 2006/7 2007/8 2008/9
Operating Budget Balance (Before Grants)
Operating Budget Balance (After Grants)
Core Budget Balance (After Grants)
Figure 15 Core Budget Financing in 2002/03-2007/08 (% of GDP)
Source: Ministry of Finance, World Bank
Domestic Revenues
2.332%
Grants to operating
budget2.0
28%
Grants to development
budget1.9
27%
Loans and others to core development
budget0.9
13%
Figure 16 Discretionary Cash Balance in 2008/09 (months of operating expenditures)
Source: Ministry of Finance, World Bank
0.0
0.5
1.0
1.5
2.0
2.5
3.0
1 2 3 4 5 6 7 8 9 10 11 12
16
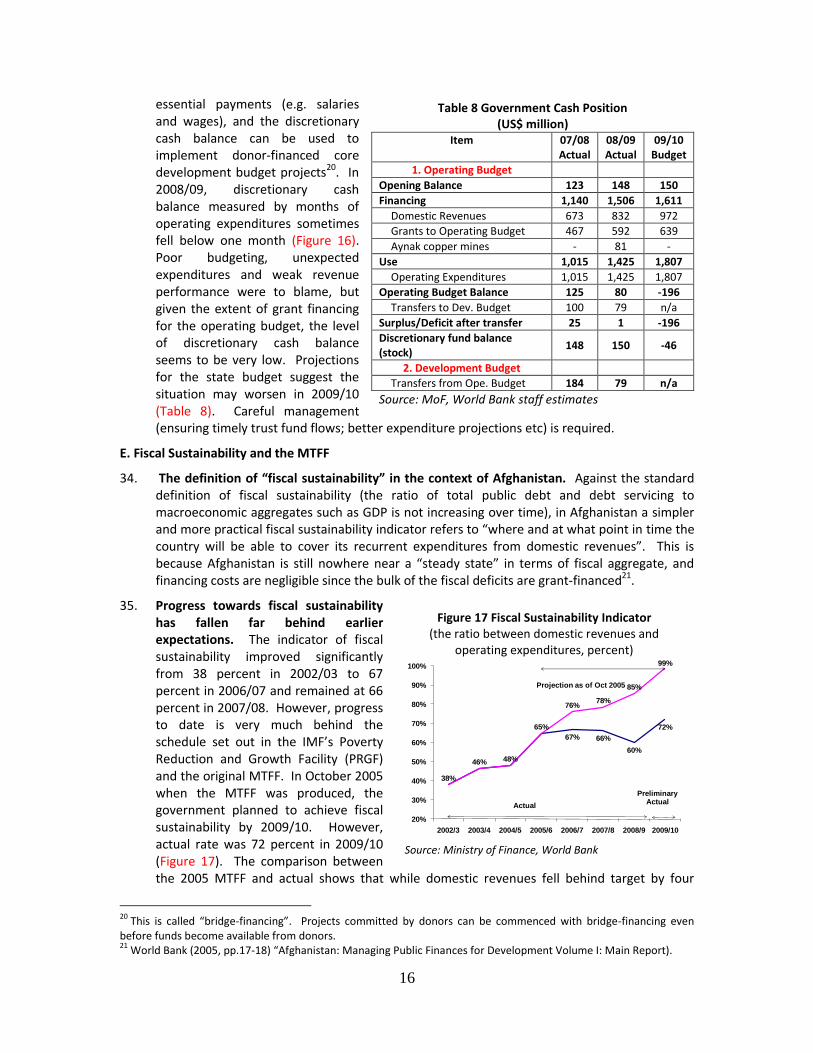
essential payments (e.g. salaries and wages), and the discretionary cash balance can be used to implement donor-financed core development budget projects20. In 2008/09, discretionary cash balance measured by months of operating expenditures sometimes fell below one month (Figure 16). Poor budgeting, unexpected expenditures and weak revenue performance were to blame, but given the extent of grant financing for the operating budget, the level of discretionary cash balance seems to be very low. Projections for the state budget suggest the situation may worsen in 2009/10 (Table 8). Careful management (ensuring timely trust fund flows; better expenditure projections etc) is required.
E. Fiscal Sustainability and the MTFF
34. The definition of “fiscal sustainability” in the context of Afghanistan. Against the standard definition of fiscal sustainability (the ratio of total public debt and debt servicing to macroeconomic aggregates such as GDP is not increasing over time), in Afghanistan a simpler and more practical fiscal sustainability indicator refers to “where and at what point in time the country will be able to cover its recurrent expenditures from domestic revenues”. This is because Afghanistan is still nowhere near a “steady state” in terms of fiscal aggregate, and financing costs are negligible since the bulk of the fiscal deficits are grant-financed21.
35. Progress towards fiscal sustainability has fallen far behind earlier expectations. The indicator of fiscal sustainability improved significantly from 38 percent in 2002/03 to 67 percent in 2006/07 and remained at 66 percent in 2007/08. However, progress to date is very much behind the schedule set out in the IMF’s Poverty Reduction and Growth Facility (PRGF) and the original MTFF. In October 2005 when the MTFF was produced, the government planned to achieve fiscal sustainability by 2009/10. However, actual rate was 72 percent in 2009/10 (Figure 17). The comparison between the 2005 MTFF and actual shows that while domestic revenues fell behind target by four
20
This is called “bridge-financing”. Projects committed by donors can be commenced with bridge-financing even before funds become available from donors. 21
World Bank (2005, pp.17-18) “Afghanistan: Managing Public Finances for Development Volume I: Main Report).
Table 8 Government Cash Position (US$ million)
Item 07/08 Actual
08/09 Actual
09/10 Budget
1. Operating Budget
Opening Balance 123 148 150
Financing 1,140 1,506 1,611
Domestic Revenues 673 832 972
Grants to Operating Budget 467 592 639
Aynak copper mines - 81 -
Use 1,015 1,425 1,807
Operating Expenditures 1,015 1,425 1,807
Operating Budget Balance 125 80 -196
Transfers to Dev. Budget 100 79 n/a
Surplus/Deficit after transfer 25 1 -196
Discretionary fund balance (stock)
148 150 -46
2. Development Budget
Transfers from Ope. Budget 184 79 n/a
Source: MoF, World Bank staff estimates
Figure 17 Fiscal Sustainability Indicator (the ratio between domestic revenues and
operating expenditures, percent)
Source: Ministry of Finance, World Bank
67% 66%
60%
72%
38%
46% 48%
65%
76%78%
85%
99%
20%
30%
40%
50%
60%
70%
80%
90%
100%
2002/3 2003/4 2004/5 2005/6 2006/7 2007/8 2008/9 2009/10
Projection as of Oct 2005
Actual
Preliminary Actual
17
percent in 2008/09, operating expenditures were 39 percent higher (Table 9). Domestic revenues almost reached the original target in absolute terms despite the stagnation of the revenue-to-GDP ratio over the past several years.
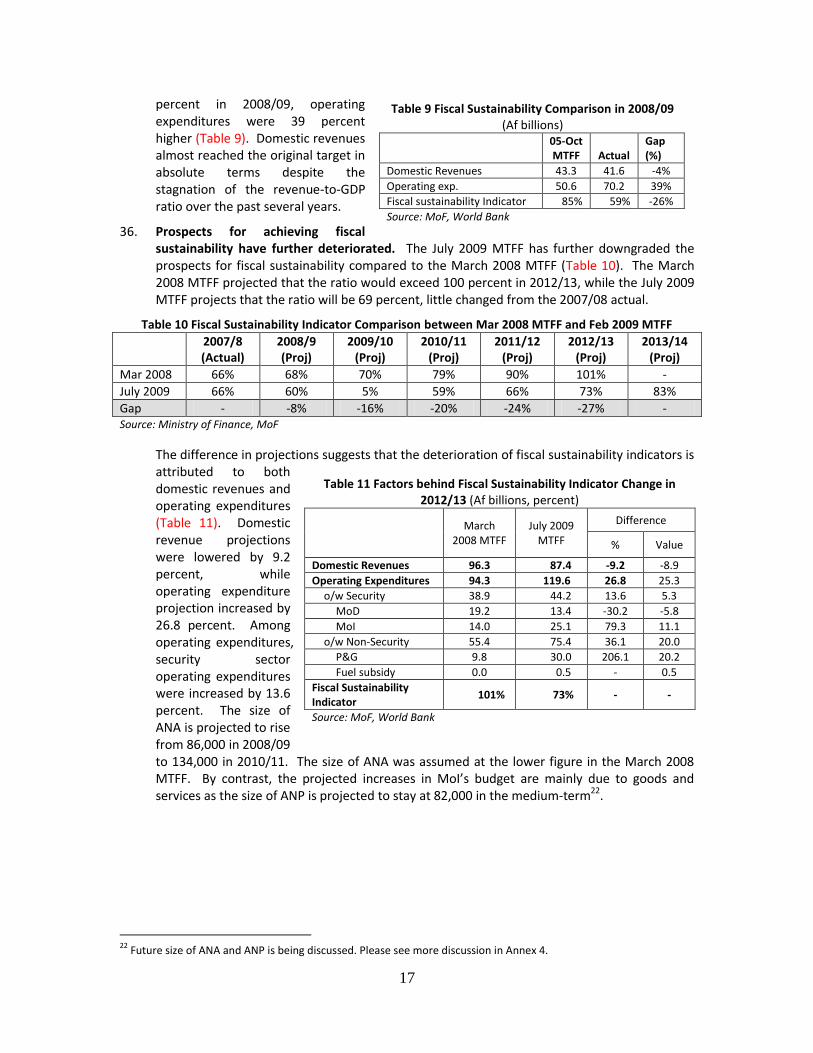
36. Prospects for achieving fiscal sustainability have further deteriorated. The July 2009 MTFF has further downgraded the prospects for fiscal sustainability compared to the March 2008 MTFF (Table 10). The March 2008 MTFF projected that the ratio would exceed 100 percent in 2012/13, while the July 2009 MTFF projects that the ratio will be 69 percent, little changed from the 2007/08 actual.
Table 10 Fiscal Sustainability Indicator Comparison between Mar 2008 MTFF and Feb 2009 MTFF
2007/8 (Actual)
2008/9 (Proj)
2009/10 (Proj)
2010/11 (Proj)
2011/12 (Proj)
2012/13 (Proj)
2013/14 (Proj)
Mar 2008 66% 68% 70% 79% 90% 101% -
July 2009 66% 60% 5% 59% 66% 73% 83%
Gap - -8% -16% -20% -24% -27% - Source: Ministry of Finance, MoF
The difference in projections suggests that the deterioration of fiscal sustainability indicators is attributed to both domestic revenues and operating expenditures (Table 11). Domestic revenue projections were lowered by 9.2 percent, while operating expenditure projection increased by 26.8 percent. Among operating expenditures, security sector operating expenditures were increased by 13.6 percent. The size of ANA is projected to rise from 86,000 in 2008/09 to 134,000 in 2010/11. The size of ANA was assumed at the lower figure in the March 2008 MTFF. By contrast, the projected increases in MoI’s budget are mainly due to goods and services as the size of ANP is projected to stay at 82,000 in the medium-term22.
22
Future size of ANA and ANP is being discussed. Please see more discussion in Annex 4.
Table 9 Fiscal Sustainability Comparison in 2008/09 (Af billions)
05-Oct MTFF Actual
Gap (%)
Domestic Revenues 43.3 41.6 -4%
Operating exp. 50.6 70.2 39%
Fiscal sustainability Indicator 85% 59% -26%
Source: MoF, World Bank
Table 11 Factors behind Fiscal Sustainability Indicator Change in 2012/13 (Af billions, percent)
March 2008 MTFF
July 2009 MTFF
Difference
% Value
Domestic Revenues 96.3 87.4 -9.2 -8.9
Operating Expenditures 94.3 119.6 26.8 25.3
o/w Security 38.9 44.2 13.6 5.3
MoD 19.2 13.4 -30.2 -5.8
MoI 14.0 25.1 79.3 11.1
o/w Non-Security 55.4 75.4 36.1 20.0
P&G 9.8 30.0 206.1 20.2
Fuel subsidy 0.0 0.5 - 0.5
Fiscal Sustainability Indicator
101% 73% - -
Source: MoF, World Bank
18
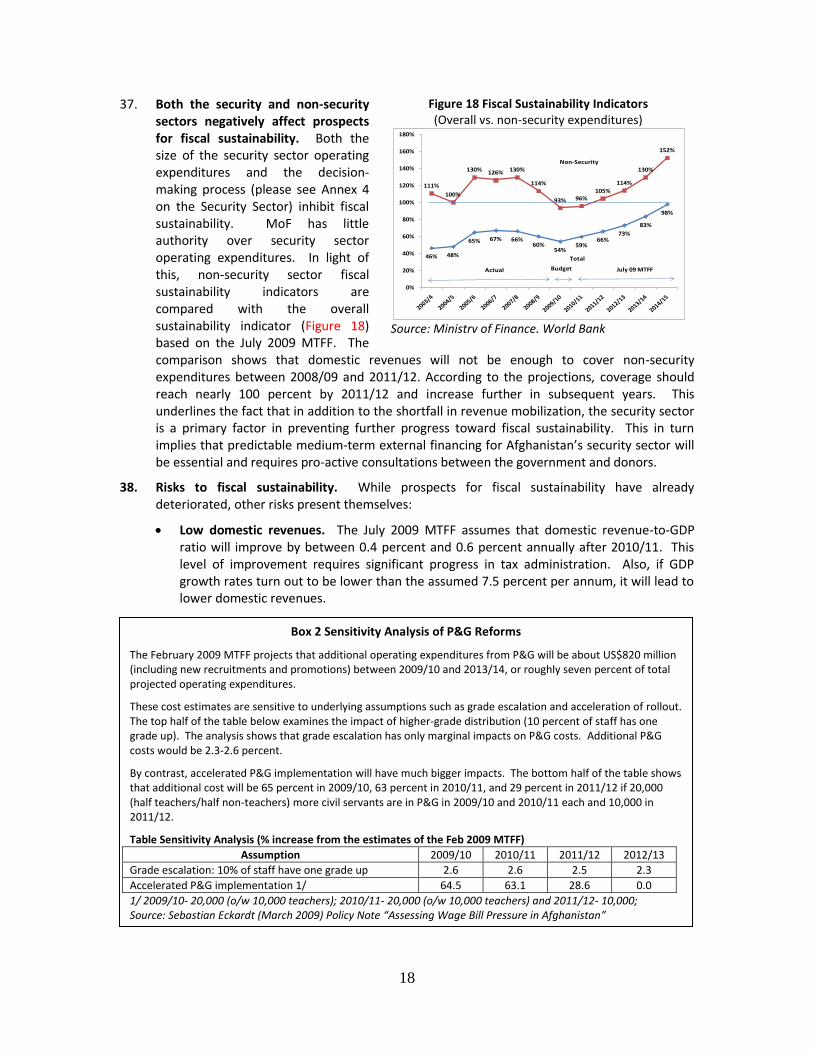
37. Both the security and non-security sectors negatively affect prospects for fiscal sustainability. Both the size of the security sector operating expenditures and the decision-making process (please see Annex 4 on the Security Sector) inhibit fiscal sustainability. MoF has little authority over security sector operating expenditures. In light of this, non-security sector fiscal sustainability indicators are compared with the overall sustainability indicator (Figure 18) based on the July 2009 MTFF. The comparison shows that domestic revenues will not be enough to cover non-security expenditures between 2008/09 and 2011/12. According to the projections, coverage should reach nearly 100 percent by 2011/12 and increase further in subsequent years. This underlines the fact that in addition to the shortfall in revenue mobilization, the security sector is a primary factor in preventing further progress toward fiscal sustainability. This in turn implies that predictable medium-term external financing for Afghanistan’s security sector will be essential and requires pro-active consultations between the government and donors.
38. Risks to fiscal sustainability. While prospects for fiscal sustainability have already deteriorated, other risks present themselves:
Low domestic revenues. The July 2009 MTFF assumes that domestic revenue-to-GDP ratio will improve by between 0.4 percent and 0.6 percent annually after 2010/11. This level of improvement requires significant progress in tax administration. Also, if GDP growth rates turn out to be lower than the assumed 7.5 percent per annum, it will lead to lower domestic revenues.
Figure 18 Fiscal Sustainability Indicators (Overall vs. non-security expenditures)
Source: Ministry of Finance, World Bank
46% 48%
65% 67% 66%60%
54%59%
66%73%
83%
98%
111%
100%
130% 126% 130%
114%
93% 96%105%
114%
130%
152%
0%
20%
40%
60%
80%
100%
120%
140%
160%
180%
Non-Security
Total
Actual Budget July 09 MTFF
Box 2 Sensitivity Analysis of P&G Reforms
The February 2009 MTFF projects that additional operating expenditures from P&G will be about US$820 million (including new recruitments and promotions) between 2009/10 and 2013/14, or roughly seven percent of total projected operating expenditures.
These cost estimates are sensitive to underlying assumptions such as grade escalation and acceleration of rollout. The top half of the table below examines the impact of higher-grade distribution (10 percent of staff has one grade up). The analysis shows that grade escalation has only marginal impacts on P&G costs. Additional P&G costs would be 2.3-2.6 percent.
By contrast, accelerated P&G implementation will have much bigger impacts. The bottom half of the table shows that additional cost will be 65 percent in 2009/10, 63 percent in 2010/11, and 29 percent in 2011/12 if 20,000 (half teachers/half non-teachers) more civil servants are in P&G in 2009/10 and 2010/11 each and 10,000 in 2011/12.
Table Sensitivity Analysis (% increase from the estimates of the Feb 2009 MTFF)
Assumption 2009/10 2010/11 2011/12 2012/13
Grade escalation: 10% of staff have one grade up 2.6 2.6 2.5 2.3
Accelerated P&G implementation 1/ 64.5 63.1 28.6 0.0
1/ 2009/10- 20,000 (o/w 10,000 teachers); 2010/11- 20,000 (o/w 10,000 teachers) and 2011/12- 10,000; Source: Sebastian Eckardt (March 2009) Policy Note “Assessing Wage Bill Pressure in Afghanistan”
19
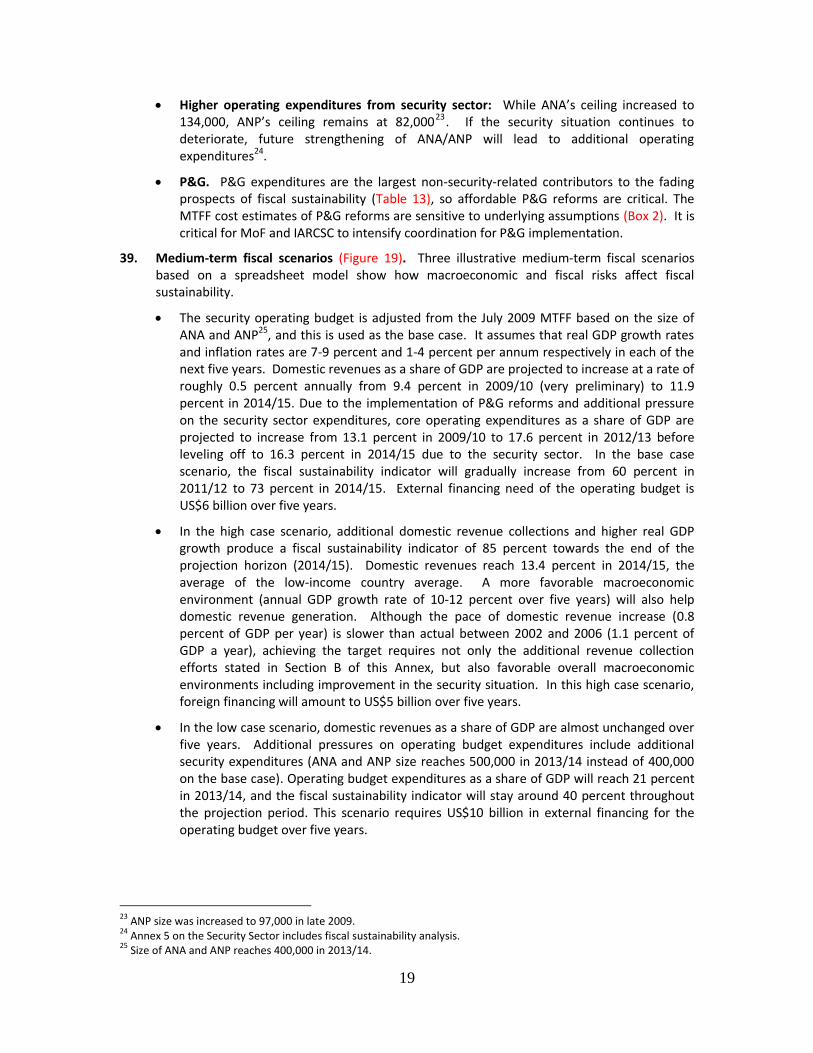
Higher operating expenditures from security sector: While ANA’s ceiling increased to 134,000, ANP’s ceiling remains at 82,00023. If the security situation continues to deteriorate, future strengthening of ANA/ANP will lead to additional operating expenditures24.
P&G. P&G expenditures are the largest non-security-related contributors to the fading prospects of fiscal sustainability (Table 13), so affordable P&G reforms are critical. The MTFF cost estimates of P&G reforms are sensitive to underlying assumptions (Box 2). It is critical for MoF and IARCSC to intensify coordination for P&G implementation.
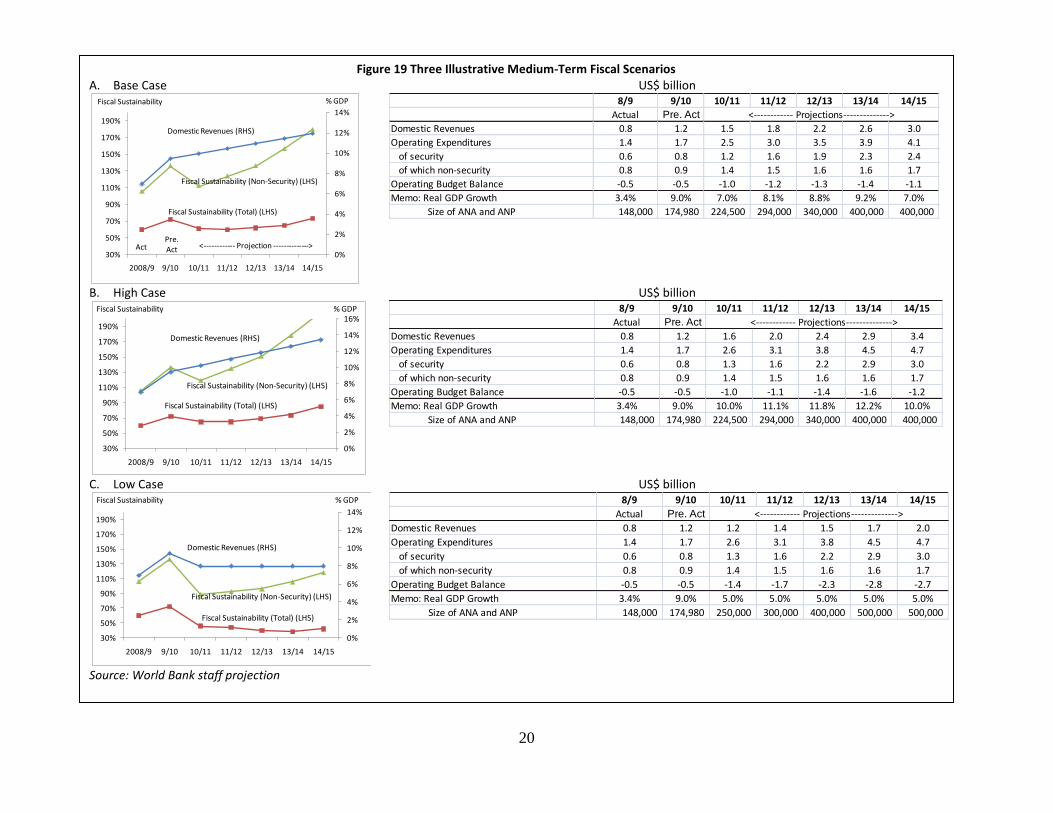
39. Medium-term fiscal scenarios (Figure 19). Three illustrative medium-term fiscal scenarios based on a spreadsheet model show how macroeconomic and fiscal risks affect fiscal sustainability.
The security operating budget is adjusted from the July 2009 MTFF based on the size of ANA and ANP25, and this is used as the base case. It assumes that real GDP growth rates and inflation rates are 7-9 percent and 1-4 percent per annum respectively in each of the next five years. Domestic revenues as a share of GDP are projected to increase at a rate of roughly 0.5 percent annually from 9.4 percent in 2009/10 (very preliminary) to 11.9 percent in 2014/15. Due to the implementation of P&G reforms and additional pressure on the security sector expenditures, core operating expenditures as a share of GDP are projected to increase from 13.1 percent in 2009/10 to 17.6 percent in 2012/13 before leveling off to 16.3 percent in 2014/15 due to the security sector. In the base case scenario, the fiscal sustainability indicator will gradually increase from 60 percent in 2011/12 to 73 percent in 2014/15. External financing need of the operating budget is US$6 billion over five years.
In the high case scenario, additional domestic revenue collections and higher real GDP growth produce a fiscal sustainability indicator of 85 percent towards the end of the projection horizon (2014/15). Domestic revenues reach 13.4 percent in 2014/15, the average of the low-income country average. A more favorable macroeconomic environment (annual GDP growth rate of 10-12 percent over five years) will also help domestic revenue generation. Although the pace of domestic revenue increase (0.8 percent of GDP per year) is slower than actual between 2002 and 2006 (1.1 percent of GDP a year), achieving the target requires not only the additional revenue collection efforts stated in Section B of this Annex, but also favorable overall macroeconomic environments including improvement in the security situation. In this high case scenario, foreign financing will amount to US$5 billion over five years.
In the low case scenario, domestic revenues as a share of GDP are almost unchanged over five years. Additional pressures on operating budget expenditures include additional security expenditures (ANA and ANP size reaches 500,000 in 2013/14 instead of 400,000 on the base case). Operating budget expenditures as a share of GDP will reach 21 percent in 2013/14, and the fiscal sustainability indicator will stay around 40 percent throughout the projection period. This scenario requires US$10 billion in external financing for the operating budget over five years.
23
ANP size was increased to 97,000 in late 2009. 24
Annex 5 on the Security Sector includes fiscal sustainability analysis. 25
Size of ANA and ANP reaches 400,000 in 2013/14.
20
Figure 19 Three Illustrative Medium-Term Fiscal Scenarios A. Base Case US$ billion
B. High Case US$ billion
C. Low Case US$ billion
Source: World Bank staff projection
0%
2%
4%
6%
8%
10%
12%
14%
30%
50%
70%
90%
110%
130%
150%
170%
190%
2008/9 9/10 10/11 11/12 12/13 13/14 14/15
Domestic Revenues (RHS)
% GDPFiscal Sustainability
Fiscal Sustainability (Total) (LHS)
Fiscal Sustainability (Non-Security) (LHS)
ActPre. Act <------------ Projection -------------->
8/9 9/10 10/11 11/12 12/13 13/14 14/15
Actual Pre. Act
Domestic Revenues 0.8 1.2 1.5 1.8 2.2 2.6 3.0
Operating Expenditures 1.4 1.7 2.5 3.0 3.5 3.9 4.1
of security 0.6 0.8 1.2 1.6 1.9 2.3 2.4
of which non-security 0.8 0.9 1.4 1.5 1.6 1.6 1.7
Operating Budget Balance -0.5 -0.5 -1.0 -1.2 -1.3 -1.4 -1.1
Memo: Real GDP Growth 3.4% 9.0% 7.0% 8.1% 8.8% 9.2% 7.0%
Size of ANA and ANP 148,000 174,980 224,500 294,000 340,000 400,000 400,000
<------------ Projections-------------->
0%
2%
4%
6%
8%
10%
12%
14%
16%
30%
50%
70%
90%
110%
130%
150%
170%
190%
2008/9 9/10 10/11 11/12 12/13 13/14 14/15
Fiscal Sustainability % GDP
Domestic Revenues (RHS)
Fiscal Sustainability (Non-Security) (LHS)
Fiscal Sustainability (Total) (LHS)
8/9 9/10 10/11 11/12 12/13 13/14 14/15
Actual Pre. Act
Domestic Revenues 0.8 1.2 1.6 2.0 2.4 2.9 3.4
Operating Expenditures 1.4 1.7 2.6 3.1 3.8 4.5 4.7
of security 0.6 0.8 1.3 1.6 2.2 2.9 3.0
of which non-security 0.8 0.9 1.4 1.5 1.6 1.6 1.7
Operating Budget Balance -0.5 -0.5 -1.0 -1.1 -1.4 -1.6 -1.2
Memo: Real GDP Growth 3.4% 9.0% 10.0% 11.1% 11.8% 12.2% 10.0%
Size of ANA and ANP 148,000 174,980 224,500 294,000 340,000 400,000 400,000
<------------ Projections-------------->
0%
2%
4%
6%
8%
10%
12%
14%
30%
50%
70%
90%
110%
130%
150%
170%
190%
2008/9 9/10 10/11 11/12 12/13 13/14 14/15
% GDPFiscal Sustainability
Domestic Revenues (RHS)
Fiscal Sustainability (Non-Security) (LHS)
Fiscal Sustainability (Total) (LHS)
8/9 9/10 10/11 11/12 12/13 13/14 14/15
Actual Pre. Act
Domestic Revenues 0.8 1.2 1.2 1.4 1.5 1.7 2.0
Operating Expenditures 1.4 1.7 2.6 3.1 3.8 4.5 4.7
of security 0.6 0.8 1.3 1.6 2.2 2.9 3.0
of which non-security 0.8 0.9 1.4 1.5 1.6 1.6 1.7
Operating Budget Balance -0.5 -0.5 -1.4 -1.7 -2.3 -2.8 -2.7
Memo: Real GDP Growth 3.4% 9.0% 5.0% 5.0% 5.0% 5.0% 5.0%
Size of ANA and ANP 148,000 174,980 250,000 300,000 400,000 500,000 500,000
<------------ Projections-------------->
21
F. Policy Recommendations
Domestic Revenues
Smooth implementation of the income tax law amendment. New tax policies such as the BRT tax on imports have raised domestic revenues. Implementation measures, including the preparation and publication of a revised income tax law manual should be accelerated.
Ensure adequate resourcing of the revenue and customs departments. In the 2009/10 budget, MoF was allocated an additional 700 Tashkeel, mainly for the revenue and customs department. Hiring capable staff and providing training is important.
Improve the domestic revenue formulation process. Domestic revenue policy (including tax, customs duties and line ministry revenues) affects not only revenue performance itself but also macroeconomic management. Responsibility for domestic revenue policy formulation remains opaque so a clear/transparent policy formulation process should be created.
Introduction and operationalization of SIGTAS. SIGTAS is expected to efficiently follow-up on non-compliant taxpayers and to better manage information (e.g. performance of revenues), leading to increased domestic revenues. SIGTAS should be operationalized at the earliest opportunity.
Further follow-up anti-corruption measures in the revenue department. The revenue department should continue to actively following-up on the successfully integrated key VCA policy measures.
Expenditures
Wages and salaries in the security and education sectors. These two sectors account for more than 80 percent of government employees and roughly 70 percent of total operating expenditures. The transparency and accountability of sectoral wages and salaries should be improved (discussed further in Annex Four on Security and Annex Five on Education).
The execution rates of core development expenditures should be increased. As low disbursement rates negatively affect growth and development, MoF should create concrete measures to improve the rates (discussed in Annex Three on Expenditure Framework). Particular attention should be paid to ministries like MRRD and MoPW that contributed heavily to the current low execution rate.
Equity. Operating and development expenditure inequities were observed across provinces. On-going pilot provincial budgeting (Annex Three) should be used to formulate policy and allocate resources to address these inequities.
Core budget balance and financing. Cash must be managed with greater care to address the deteriorating core budget balance and lower discretionary cash balance. Measures include the timely receipt of grants financing from donors by satisfying eligibilities criteria, and better expenditure forecasting.
Active management of the P&G process for fiscal sustainability. I addition to its impacts on public administration reform, the quality of P&G implementation will affect fiscal sustainability
indicators. MoF and IARCSC should actively manage the implementation of P&G reforms.