Public Equity, Private Equity & Real Estate …...1 Public Equity, Private Equity & Real Estate...
68
Public Equity, Private Equity & Real Estate Investments in Vietnam Andy Ho – VinaCapital Vietnam Opportunity Fund David Blackhall – VinaLand Limited Edmond de Rothschild Emerging Markets Funds Conference 2015 26 February 2015 London
Transcript of Public Equity, Private Equity & Real Estate …...1 Public Equity, Private Equity & Real Estate...
1
Public Equity, Private Equity & Real Estate Investments in Vietnam Andy Ho – VinaCapital Vietnam Opportunity Fund David Blackhall – VinaLand Limited
Edmond de Rothschild Emerging Markets Funds Conference 2015 26 February 2015 London
Contents
Macroeconomic developments
VinaCapital Vietnam Opportunity Fund
VinaLand Limited
Vietnam Infrastructure Limited
VCG Partners Vietnam Value Fund
2
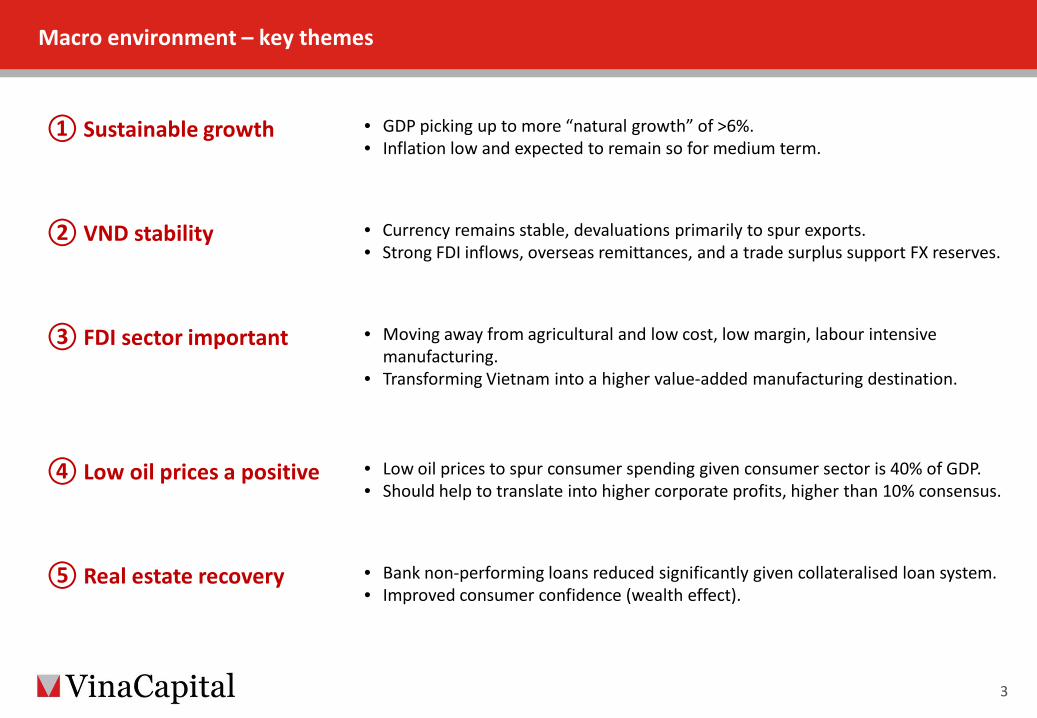
Macro environment – key themes
① Sustainable growth
• GDP picking up to more “natural growth” of >6%. • Inflation low and expected to remain so for medium term.
② VND stability • Currency remains stable, devaluations primarily to spur exports. • Strong FDI inflows, overseas remittances, and a trade surplus support FX reserves.
③ FDI sector important • Moving away from agricultural and low cost, low margin, labour intensive manufacturing.
• Transforming Vietnam into a higher value-added manufacturing destination.
④ Low oil prices a positive • Low oil prices to spur consumer spending given consumer sector is 40% of GDP. • Should help to translate into higher corporate profits, higher than 10% consensus.
⑤ Real estate recovery • Bank non-performing loans reduced significantly given collateralised loan system. • Improved consumer confidence (wealth effect).
3
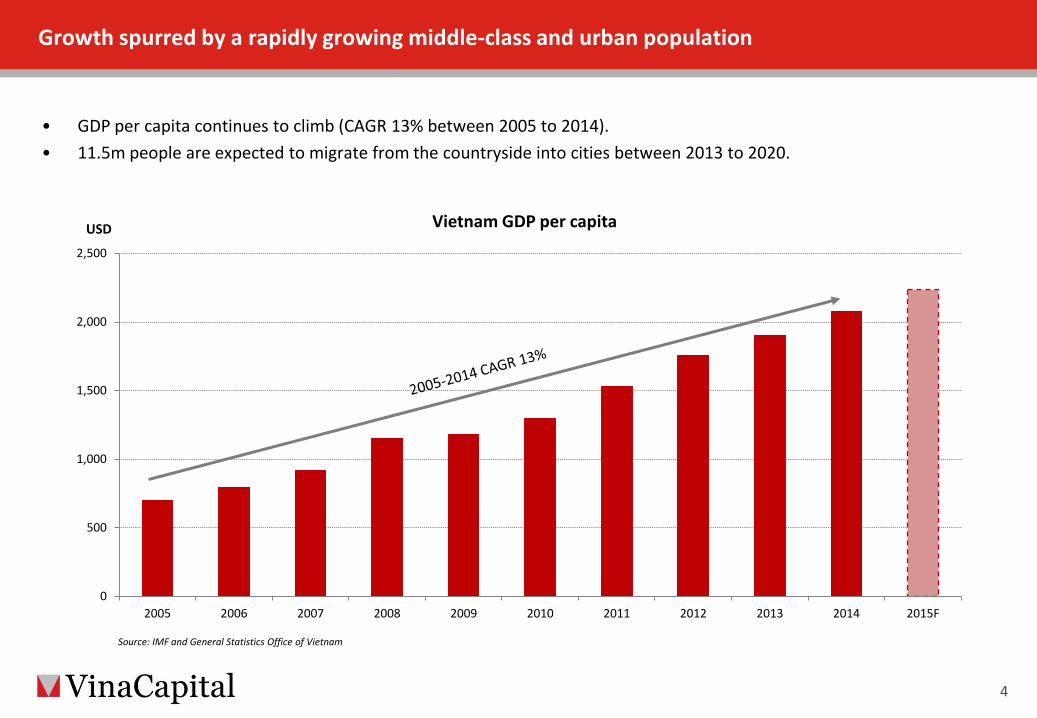
Growth spurred by a rapidly growing middle-class and urban population
• GDP per capita continues to climb (CAGR 13% between 2005 to 2014). • 11.5m people are expected to migrate from the countryside into cities between 2013 to 2020.
4
0
500
1,000
1,500
2,000
2,500
2005 2006 2007 2008 2009 2010 2011 2012 2013 2014 2015F
Vietnam GDP per capita USD
Source: IMF and General Statistics Office of Vietnam
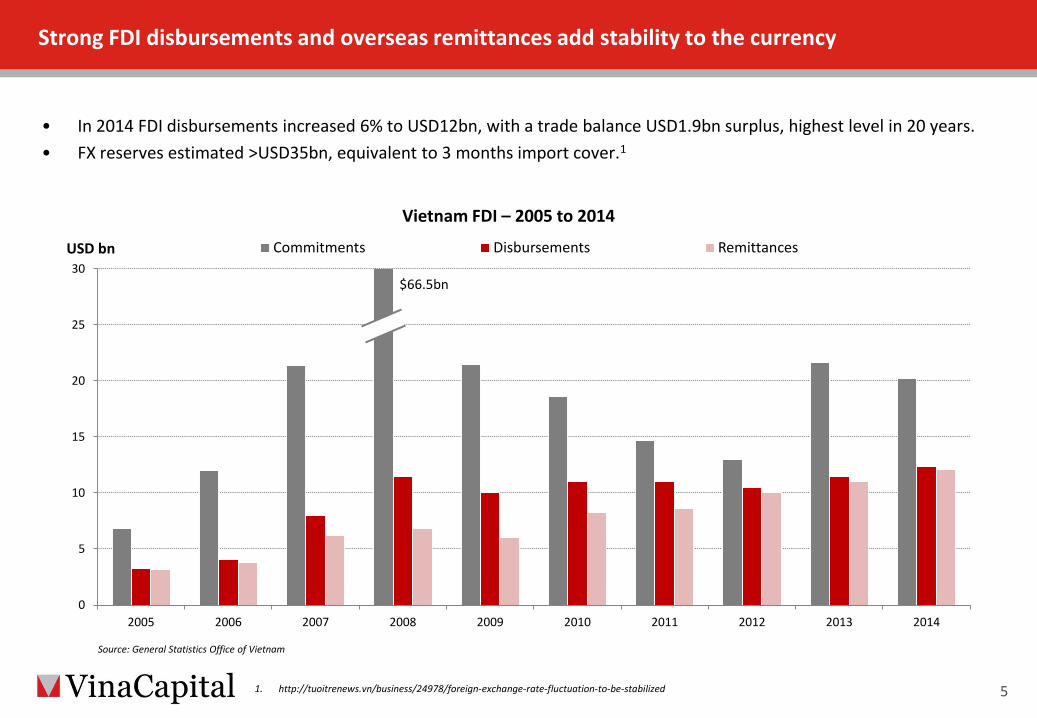
Strong FDI disbursements and overseas remittances add stability to the currency
• In 2014 FDI disbursements increased 6% to USD12bn, with a trade balance USD1.9bn surplus, highest level in 20 years. • FX reserves estimated >USD35bn, equivalent to 3 months import cover.1
5
Source: General Statistics Office of Vietnam
0
5
10
15
20
25
30
2005 2006 2007 2008 2009 2010 2011 2012 2013 2014
Vietnam FDI – 2005 to 2014
Commitments Disbursements Remittances USD bn
$66.5bn
1. http://tuoitrenews.vn/business/24978/foreign-exchange-rate-fluctuation-to-be-stabilized
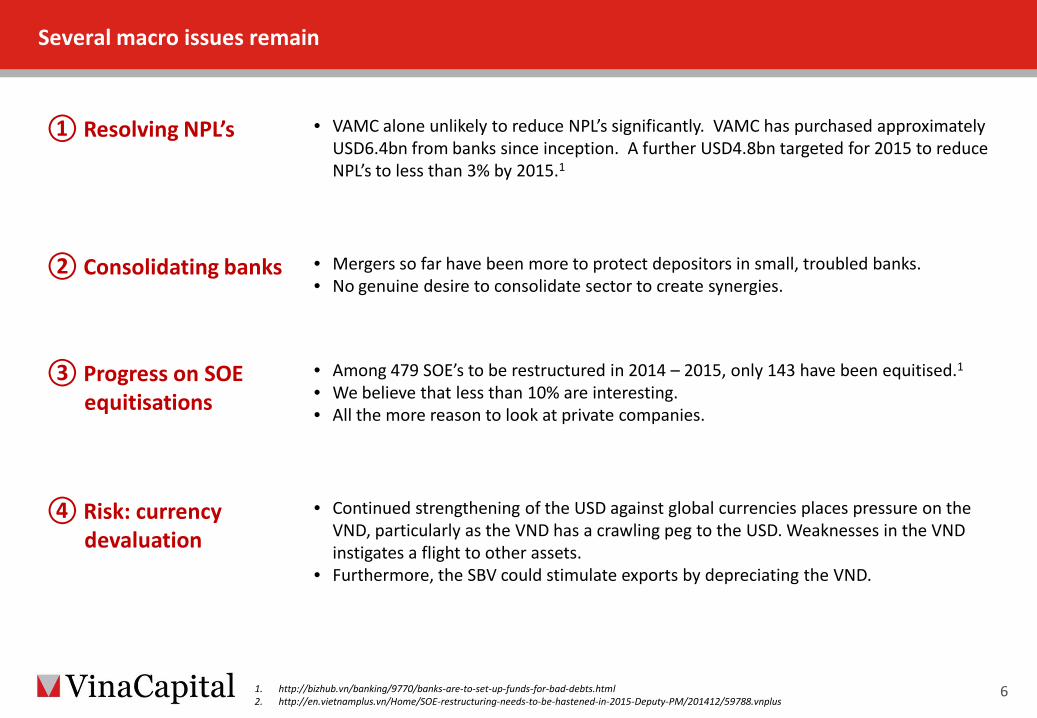
Several macro issues remain
6
① Resolving NPL’s
• VAMC alone unlikely to reduce NPL’s significantly. VAMC has purchased approximately USD6.4bn from banks since inception. A further USD4.8bn targeted for 2015 to reduce NPL’s to less than 3% by 2015.1
② Consolidating banks • Mergers so far have been more to protect depositors in small, troubled banks. • No genuine desire to consolidate sector to create synergies.
③ Progress on SOE equitisations
• Among 479 SOE’s to be restructured in 2014 – 2015, only 143 have been equitised.1
• We believe that less than 10% are interesting. • All the more reason to look at private companies.
④ Risk: currency devaluation
• Continued strengthening of the USD against global currencies places pressure on the VND, particularly as the VND has a crawling peg to the USD. Weaknesses in the VND instigates a flight to other assets.
• Furthermore, the SBV could stimulate exports by depreciating the VND.
1. http://bizhub.vn/banking/9770/banks-are-to-set-up-funds-for-bad-debts.html 2. http://en.vietnamplus.vn/Home/SOE-restructuring-needs-to-be-hastened-in-2015-Deputy-PM/201412/59788.vnplus
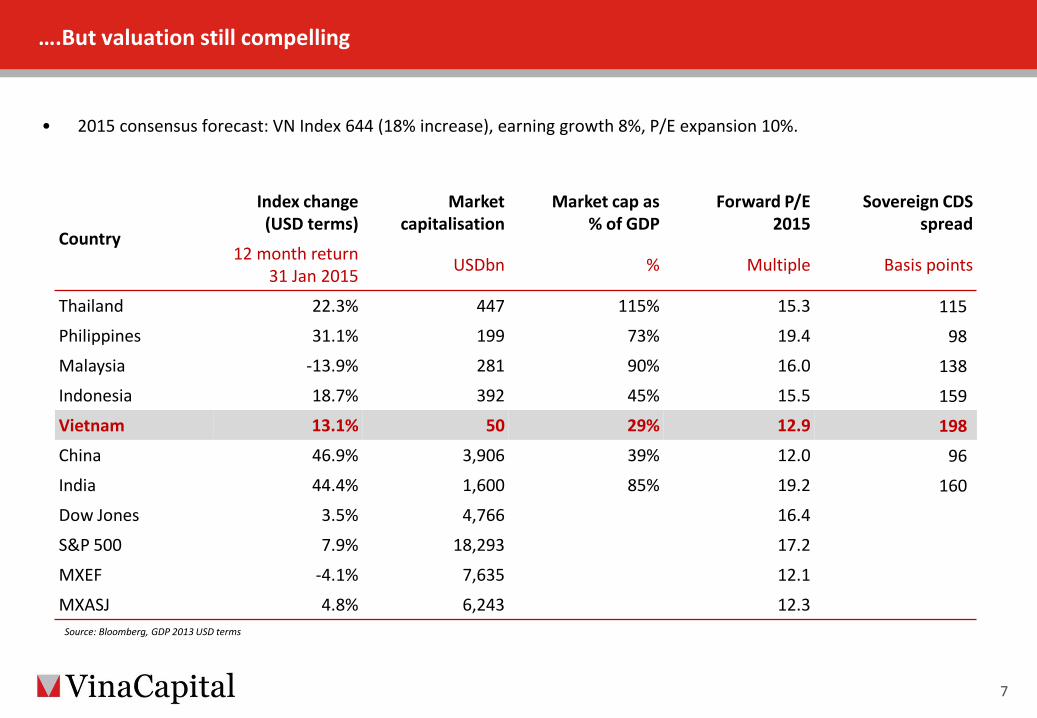
….But valuation still compelling
• 2015 consensus forecast: VN Index 644 (18% increase), earning growth 8%, P/E expansion 10%.
7
Country
Index change (USD terms)
Market capitalisation
Market cap as % of GDP
Forward P/E 2015
Sovereign CDS spread
12 month return 31 Jan 2015 USDbn % Multiple Basis points
Thailand 22.3% 447 115% 15.3 115 Philippines 31.1% 199 73% 19.4 98 Malaysia -13.9% 281 90% 16.0 138 Indonesia 18.7% 392 45% 15.5 159 Vietnam 13.1% 50 29% 12.9 198 China 46.9% 3,906 39% 12.0 96 India 44.4% 1,600 85% 19.2 160 Dow Jones 3.5% 4,766 16.4
S&P 500 7.9% 18,293 17.2
MXEF -4.1% 7,635 12.1
MXASJ 4.8% 6,243 12.3
Source: Bloomberg, GDP 2013 USD terms
Contents
Macroeconomic developments
VinaCapital Vietnam Opportunity Fund
VinaLand Limited
Vietnam Infrastructure Limited
VCG Partners Vietnam Value Fund
8

VOF: Size and structure offer a unique pure-play investment opportunity into Vietnam
9
① Multi-asset portfolio
• VOF scale allows greater participation in the Vietnamese investment universe: o Meaningful sized PIPE opportunities eg PVD. o Attractive SOE equitizations eg Vinatex. o Access to large, scalable family-owned businesses undergoing transition eg IDP o Pre-IPO deals.
• No liquidity or asset-class restrictions.
② Synergies across all asset classes
• Deeper understanding of sectors, particularly where the fund holds investments in a listed security as well as private equity business eg. Vinamilk (listed) and IDP (PE).
• Synergies also for investing in listed real estate given participation in direct real estate.
③ Advantage of large stakes in companies
• Exit at a premium to market prices (eg Vinamilk block at over 10% premium). • Seek minority protections and can take legal or controlling stakes.
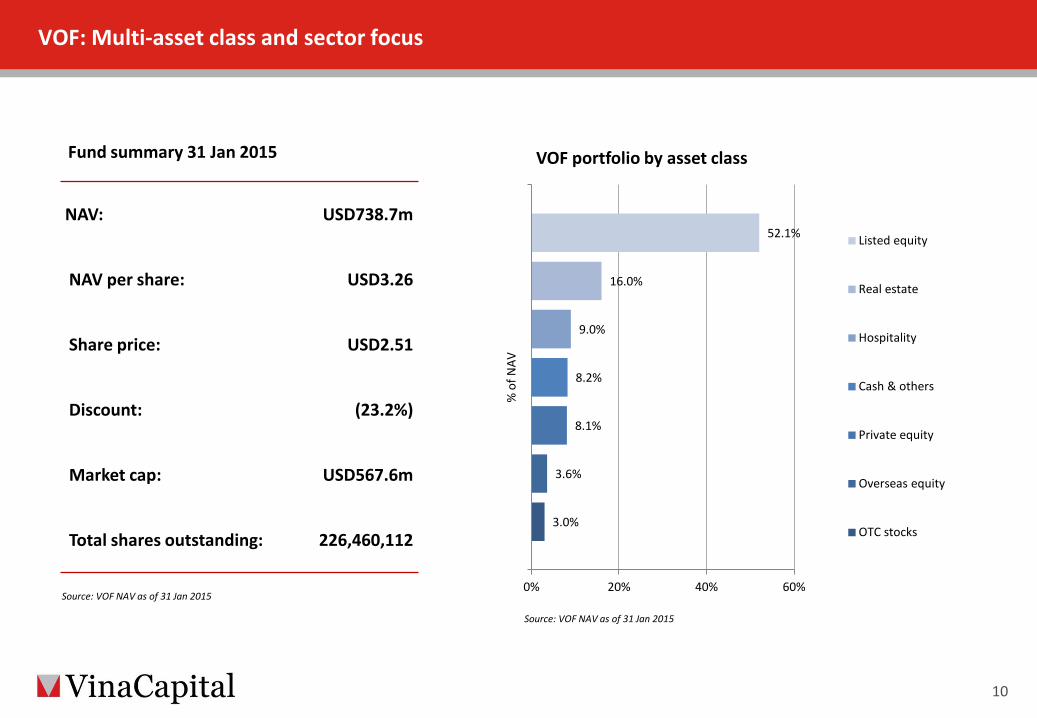
VOF: Multi-asset class and sector focus
10
Source: VOF NAV as of 31 Jan 2015
Source: VOF NAV as of 31 Jan 2015
Fund summary 31 Jan 2015
NAV: USD738.7m
NAV per share: USD3.26
Share price: USD2.51
Discount: (23.2%)
Market cap: USD567.6m
Total shares outstanding: 226,460,112 3.0%
3.6%
8.1%
8.2%
9.0%
16.0%
52.1%
0% 20% 40% 60%
% o
f NAV
VOF portfolio by asset class
Listed equity
Real estate
Hospitality
Cash & others
Private equity
Overseas equity
OTC stocks
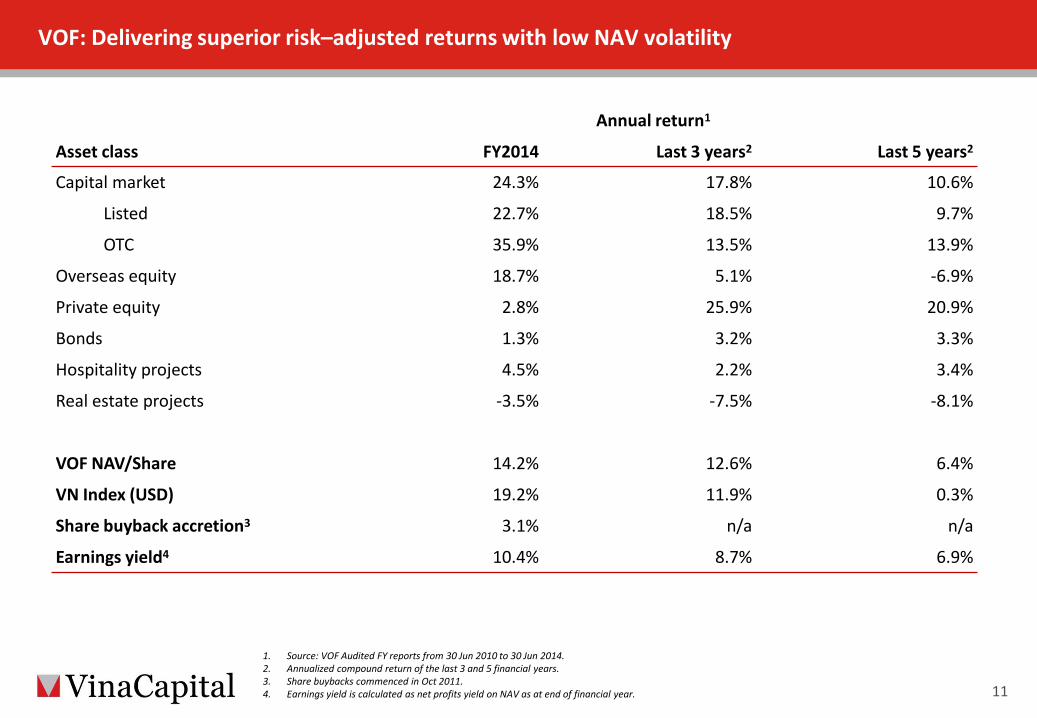
VOF: Delivering superior risk–adjusted returns with low NAV volatility
11
1. Source: VOF Audited FY reports from 30 Jun 2010 to 30 Jun 2014. 2. Annualized compound return of the last 3 and 5 financial years. 3. Share buybacks commenced in Oct 2011. 4. Earnings yield is calculated as net profits yield on NAV as at end of financial year.
Annual return1
Asset class FY2014 Last 3 years2 Last 5 years2
Capital market 24.3% 17.8% 10.6%
Listed 22.7% 18.5% 9.7%
OTC 35.9% 13.5% 13.9%
Overseas equity 18.7% 5.1% -6.9%
Private equity 2.8% 25.9% 20.9%
Bonds 1.3% 3.2% 3.3%
Hospitality projects 4.5% 2.2% 3.4%
Real estate projects -3.5% -7.5% -8.1%
VOF NAV/Share 14.2% 12.6% 6.4%
VN Index (USD) 19.2% 11.9% 0.3%
Share buyback accretion3 3.1% n/a n/a
Earnings yield4 10.4% 8.7% 6.9%

VOF: A strong legacy of private investments since inception
• Since inception, VOF has consistently delivered a private investment return in excess of 24% IRR1 and a multiple2 of >2x over an average holding period of 4-7 years3.
• Total equity invested: USD539m; total proceeds realised: USD654m
12
$155
$330 $268 $324
$116
$229
0
100
200
300
400
500
600
Equity invested Proceeds Equity invested Proceeds Equity invested
USD million
1. Investments with equity invested of $3million or more and ownership at acquisition of 5% or more as of 31 December 2014. 2. Returns are gross of tax and fees;. 3. Straight average across deals; not weighted by deal value 4. Partially Realised includes deals in which 20% to 95% of the holding has been realised. Unrealised deals are deals in which less than 20% of the holding has been
realised.
Fully Realised (18 deals)
Realised proceeds
Unrealised proceeds
Realised proceeds
Partially Realised4
(8 deals) Unrealised4
(6 deals)

VOF: Significant stakes in listed holdings
• VOF’s top five listed holdings add to USD229m, accounting for 31% of total NAV as of 31 January 2015.
13
P/E VOF holding
31 January 2015 Profit
Market FOL
2014 2015 NAV % of NAV 2014 2015 Change Cap Premium
USDm % x X USDm % USDm USDm %
VNM Vinamilk 4,860 15-20% 17.1 12.8 79 11% 284 379 33%
HPG Hoa Phat Group 1,076 5-10% 7.2 8.2 58 8% 150 131 -13%
EIB Eximbank (EIB) 799 0% 1.2 1.2 40 5% 2 36 1,654%
DHG Hau Giang Pharmaceuticals 379 5-10% 15.3 11.5 28 4% 25 33 33%
PVD PetroVietNam Drilling 814 0% 7.1 7.9 25 3% 114 103 -10%
Total 5 listed holdings 229 31% 5732 6462 13%2
Total listed portfolio 385
Total VOF NAV 739
1. EIB (banking stock), the price-to-book value multiple is used instead of price-to-earnings multiple. 2. Excluding EIB as it is an outlier. 2014-2015 profit change for VOF’s top holdings is 13%, outperforming market consensus earnings growth of 10%
for 2015.
VOF: Our strategy moving forward
① Focus on sectors that contribute to domestic economy
• Food & beverage: Anticipate strong earns growth as consumers benefit from low inflation, increased spending power/wealth creation. Example: IDP – a mini Vinamilk and is rapidly growing.
• Listed real estate: Low bank deposit rates will instead channel money into real estate. Increased our stake in existing real estate holdings via a rights issue (full foreign room). Have been offered a premium for a large block (10%+ above market price).
• Other sectors include education, healthcare, media, logistics, construction materials, agri/aquaculture, financials, and hospitality.
② Increase PE and OTC holdings
• Continue to pursue PE deals of meaningful size (USD10m to USD40m). Several market leaders are seeking investments in exchange for minority / non-controlling stakes.
• SOE equitisations provide plenty of opportunities to rebuild our OTC portfolio. Several successful investments include AGPPS and Vinamilk. Recently participated in the equitisation of Vinatex and South Basic Chemicals.
• Continue to restructure the portfolio away from direct real estate holdings. In doing
so, VOF should further narrow its discount.
14

VOF: Private equity investment into IDP
15
Investment • USD45m co-investment with VOF (80%) and Daiwa PI
Partners (20%) to acquire 70% ownership of International Diary Products JSC (IDP).
• Management expects 2014 revenues to exceed USD80m.
Key investment rationales • Dairy sector has a strong growth potential. Vietnam’s
average consumption per capita per annum is 15 liters or less than 50% of that of nearby countries. With a population of 90m+, there are numerous F&B players interested in Vietnam.
Major products • UHT milk, pasteurized fresh milk, spoon and drinking
yogurt, using the latest technology from Europe. • Further develop into functional, healthy dairy products
such as cheese and children’s drinks which have low market penetration.
• Currently, IDP is co-operating with over 2,000 farmers, collecting more than 75 tonnes of fresh milk per day.
Established brand name but limited product mix and growth.
VOF has implemented: • New CEO
appointment • New product
range and branding
• Doubling of sales YOY.
Mr Tran Bao Minh, CEO
New products: KUN for Kids, Love’n Farm yogurt and fresh milk
New packaging: 70g yogurt
2013 and earlier
2014 following VOF’s involvement
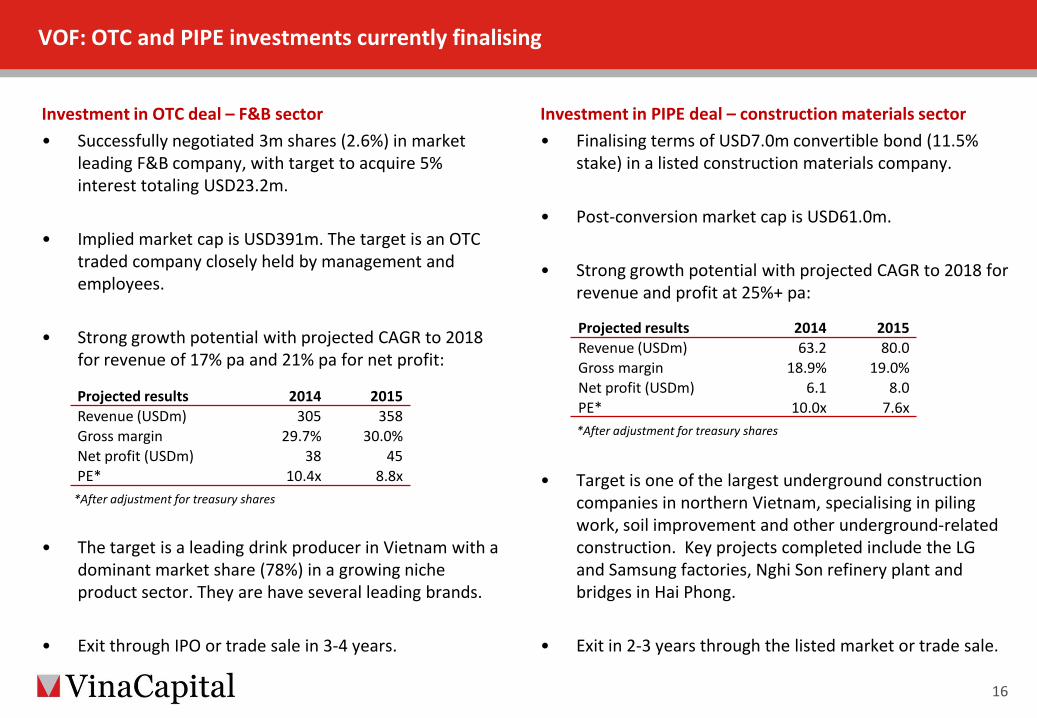
VOF: OTC and PIPE investments currently finalising
Investment in OTC deal – F&B sector • Successfully negotiated 3m shares (2.6%) in market
leading F&B company, with target to acquire 5% interest totaling USD23.2m.
• Implied market cap is USD391m. The target is an OTC traded company closely held by management and employees.
• Strong growth potential with projected CAGR to 2018 for revenue of 17% pa and 21% pa for net profit:
• The target is a leading drink producer in Vietnam with a dominant market share (78%) in a growing niche product sector. They are have several leading brands.
• Exit through IPO or trade sale in 3-4 years.
16
Investment in PIPE deal – construction materials sector • Finalising terms of USD7.0m convertible bond (11.5%
stake) in a listed construction materials company.
• Post-conversion market cap is USD61.0m.
• Strong growth potential with projected CAGR to 2018 for revenue and profit at 25%+ pa:
• Target is one of the largest underground construction companies in northern Vietnam, specialising in piling work, soil improvement and other underground-related construction. Key projects completed include the LG and Samsung factories, Nghi Son refinery plant and bridges in Hai Phong.
• Exit in 2-3 years through the listed market or trade sale.
Projected results 2014 2015 Revenue (USDm) 63.2 80.0 Gross margin 18.9% 19.0% Net profit (USDm) 6.1 8.0 PE* 10.0x 7.6x
Projected results 2014 2015 Revenue (USDm) 305 358 Gross margin 29.7% 30.0% Net profit (USDm) 38 45 PE* 10.4x 8.8x
*After adjustment for treasury shares
*After adjustment for treasury shares
VOF
shar
e pr
ice
(USD
)
0
2
4
6
8
10
12 0%
5%
10%
15%
20%
25%
30%
35%
40%
45%
Nov-11 Feb-12 May-12 Aug-12 Nov-12 Feb-13 May-13 Aug-13 Nov-13 Feb-14 May-14 Aug-14 Nov-14
VOF
shar
es p
urch
ased
(Mill
ions
)
Disc
ount
to N
AV (%
)
Buyback Vol Discount NAV
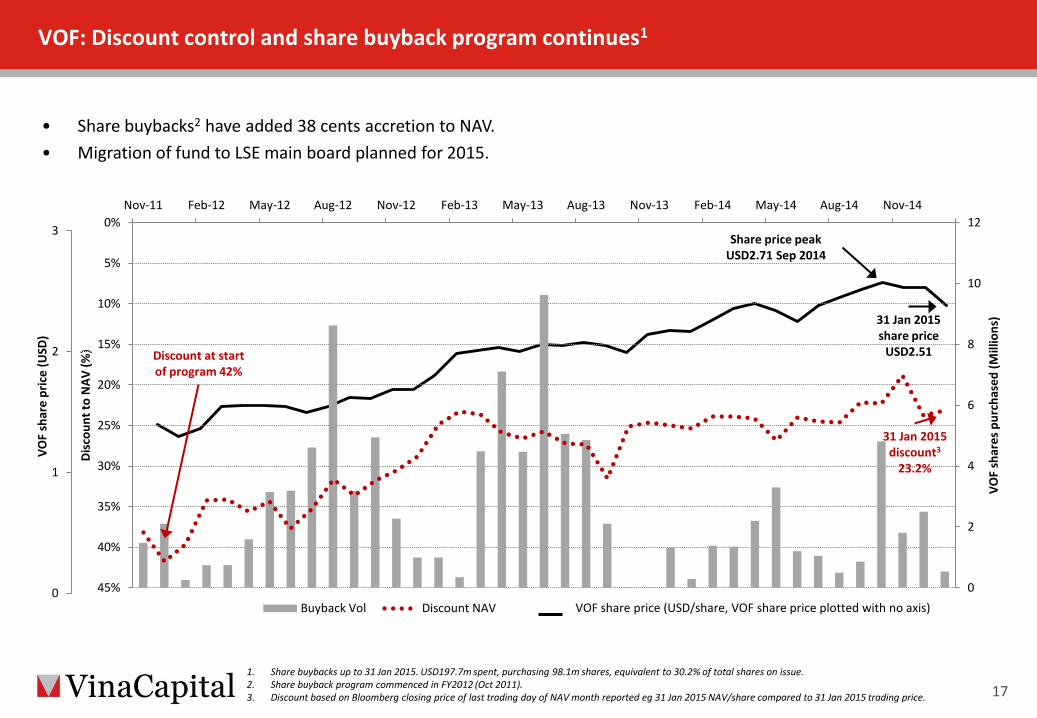
VOF: Discount control and share buyback program continues1
• Share buybacks2 have added 38 cents accretion to NAV. • Migration of fund to LSE main board planned for 2015.
17 1. Share buybacks up to 31 Jan 2015. USD197.7m spent, purchasing 98.1m shares, equivalent to 30.2% of total shares on issue. 2. Share buyback program commenced in FY2012 (Oct 2011). 3. Discount based on Bloomberg closing price of last trading day of NAV month reported eg 31 Jan 2015 NAV/share compared to 31 Jan 2015 trading price.
VOF share price (USD/share, VOF share price plotted with no axis) 0
1
2
3
31 Jan 2015 discount3
23.2%
31 Jan 2015 share price
USD2.51 Discount at start of program 42%
Share price peak USD2.71 Sep 2014

Contents
Macroeconomic developments
VinaCapital Vietnam Opportunity Fund
VinaLand Limited
Vietnam Infrastructure Limited
VCG Partners Vietnam Value Fund
18
Contents
19
1. Vietnam property market
2. Overview of VNL Fund
3. Review of the last 12 months
4. Strategy for 2015
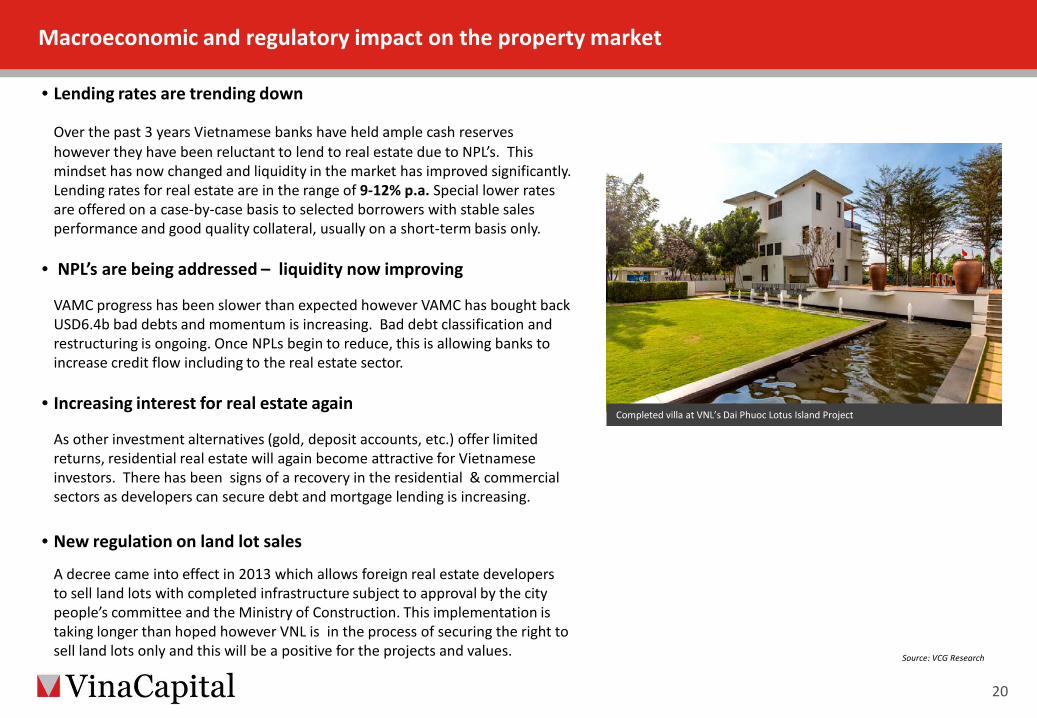
• Lending rates are trending down
Over the past 3 years Vietnamese banks have held ample cash reserves however they have been reluctant to lend to real estate due to NPL’s. This mindset has now changed and liquidity in the market has improved significantly. Lending rates for real estate are in the range of 9-12% p.a. Special lower rates are offered on a case-by-case basis to selected borrowers with stable sales performance and good quality collateral, usually on a short-term basis only.
• NPL’s are being addressed – liquidity now improving
VAMC progress has been slower than expected however VAMC has bought back USD6.4b bad debts and momentum is increasing. Bad debt classification and restructuring is ongoing. Once NPLs begin to reduce, this is allowing banks to increase credit flow including to the real estate sector.
• Increasing interest for real estate again
As other investment alternatives (gold, deposit accounts, etc.) offer limited returns, residential real estate will again become attractive for Vietnamese investors. There has been signs of a recovery in the residential & commercial sectors as developers can secure debt and mortgage lending is increasing.
• New regulation on land lot sales
A decree came into effect in 2013 which allows foreign real estate developers to sell land lots with completed infrastructure subject to approval by the city people’s committee and the Ministry of Construction. This implementation is taking longer than hoped however VNL is in the process of securing the right to sell land lots only and this will be a positive for the projects and values.
Completed villa at VNL’s Dai Phuoc Lotus Island Project
Macroeconomic and regulatory impact on the property market
20
Source: VCG Research

Relaxation of foreign ownership of residential property - progress towards opening up Vietnam’s residential market to the world • On 25 November 2014, the Vietnamese Government approved
the amended Housing Law permitting foreign ownership of properties, effective from 01 July 2015.
• This legislation is the most recent move by the Government to bolster the property market following a housing stimulus program and a low-cost housing loan package.
• There are now only 2 major restrictions imposed on foreigners: 50-year leasehold tenure; Cap on total number of units owned in a condominium
tower; 30% of total units / or 250 dwellings in a local precinct
• The relaxation of foreign property ownership restrictions will make it easier for foreigners to participate in the residential sector.
Brief summary of Vietnam’s new law on foreign property ownership
New law on foreign ownership in the residential sector
21
Source: VCG Research, CBRE Vietnam
Who can buy?
• All foreigners who are granted a visa to Vietnam are allowed to buy residential properties in the country.
• All foreign investment funds, banks, Vietnamese branches and representative offices of overseas companies are eligible to buy.
(previously only foreigners married to Vietnamese and foreigners deemed to make significant contributions to the country’s development).
Types • Condominiums; • Landed properties including villas and townhouses (previously only condominiums).
Volume • Maximum 30% of total units of a condominium tower; • Maximum 250 landed property units in a ward
(previously an eligible foreign can buy only 1 condominium unit).
Usage • Properties owned by foreigners can be sub-leased, traded, inherited, and collateralized
(previously only for owner occupying purpose)
Tenure • 50-year leasehold, renewal possibility upon expiration; • Foreign individuals married to Vietnamese – freehold (unchanged from previously).
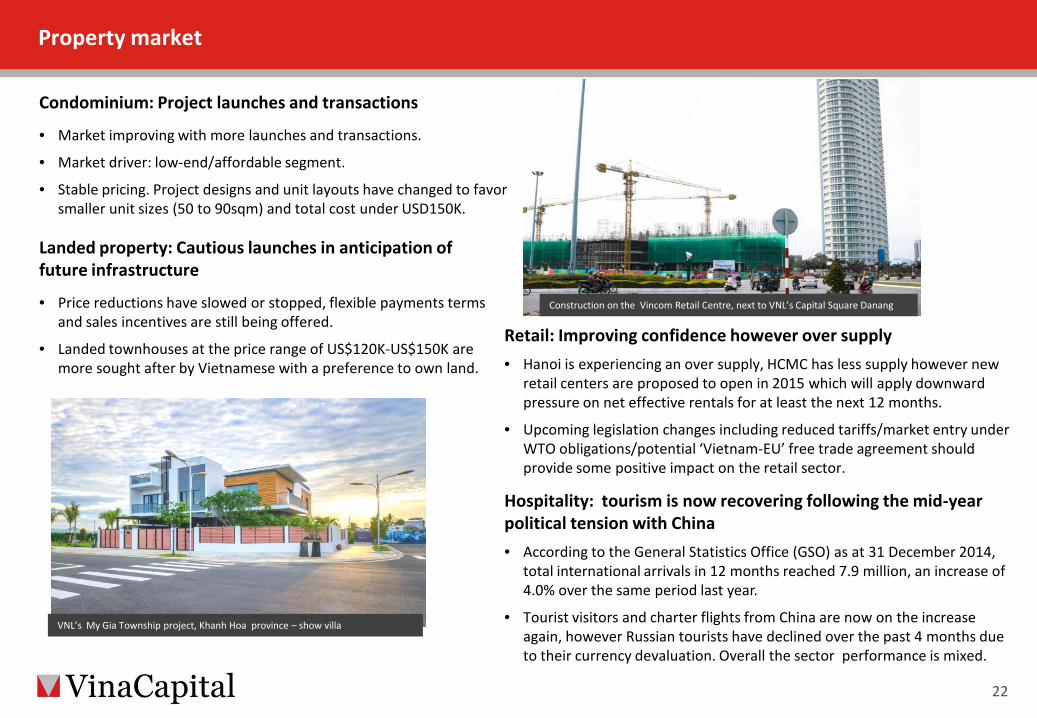
Condominium: Project launches and transactions
• Market improving with more launches and transactions.
• Market driver: low-end/affordable segment.
• Stable pricing. Project designs and unit layouts have changed to favor smaller unit sizes (50 to 90sqm) and total cost under USD150K.
Landed property: Cautious launches in anticipation of future infrastructure
• Price reductions have slowed or stopped, flexible payments terms and sales incentives are still being offered.
• Landed townhouses at the price range of US$120K-US$150K are more sought after by Vietnamese with a preference to own land.
Retail: Improving confidence however over supply • Hanoi is experiencing an over supply, HCMC has less supply however new
retail centers are proposed to open in 2015 which will apply downward pressure on net effective rentals for at least the next 12 months.
• Upcoming legislation changes including reduced tariffs/market entry under WTO obligations/potential ‘Vietnam-EU’ free trade agreement should provide some positive impact on the retail sector.
Hospitality: tourism is now recovering following the mid-year political tension with China • According to the General Statistics Office (GSO) as at 31 December 2014,
total international arrivals in 12 months reached 7.9 million, an increase of 4.0% over the same period last year.
• Tourist visitors and charter flights from China are now on the increase again, however Russian tourists have declined over the past 4 months due to their currency devaluation. Overall the sector performance is mixed.
Property market
22
VNL’s My Gia Township project, Khanh Hoa province – show villa
Construction on the Vincom Retail Centre, next to VNL’s Capital Square Danang

Vietnam is again on the radar screen for investors Domestic players dominate both buyers and sellers
• There are more investors looking at Vietnam now and this includes the real estate and infrastructure sectors.
• For real estate, the majority of these foreign investors are Asian based, including Japan, South Korea, Philippines, Singapore, Hong Kong and Malaysia.
• Vietnamese developers and investors are again able to access finance and are looking to invest into real estate.
• HK and Mainland Chinese investors are less active than South East Asian investors.
• Non-Asian investors (Europe and North America) are not as active.
• Thai investors now becoming active in retail and FMCG sectors, less so in direct real estate.
Sources: CBRE Q3 2014 Market Report, RCA Analytics
Property market update
23
BUYERS SELLERS
Thailand BJC group acquired Metro Vietnam for US$850 million in Aug 2014
The top buyers and sellers in Vietnam
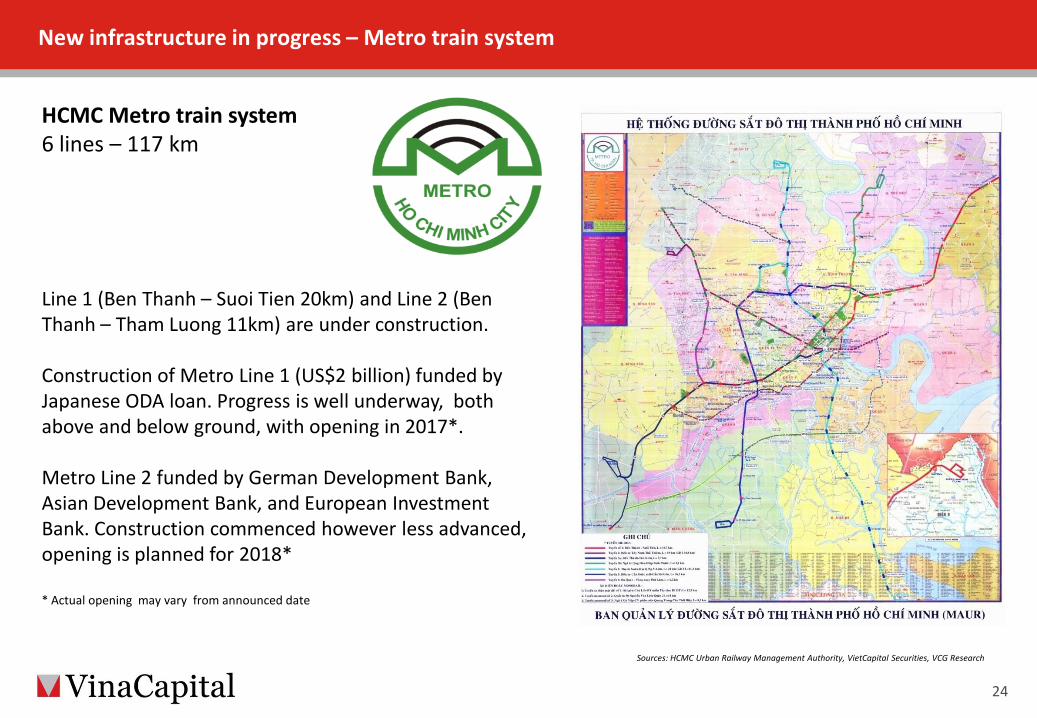
HCMC Metro train system 6 lines – 117 km Line 1 (Ben Thanh – Suoi Tien 20km) and Line 2 (Ben Thanh – Tham Luong 11km) are under construction. Construction of Metro Line 1 (US$2 billion) funded by Japanese ODA loan. Progress is well underway, both above and below ground, with opening in 2017*. Metro Line 2 funded by German Development Bank, Asian Development Bank, and European Investment Bank. Construction commenced however less advanced, opening is planned for 2018* * Actual opening may vary from announced date
Sources: HCMC Urban Railway Management Authority, VietCapital Securities, VCG Research
New infrastructure in progress – Metro train system
24
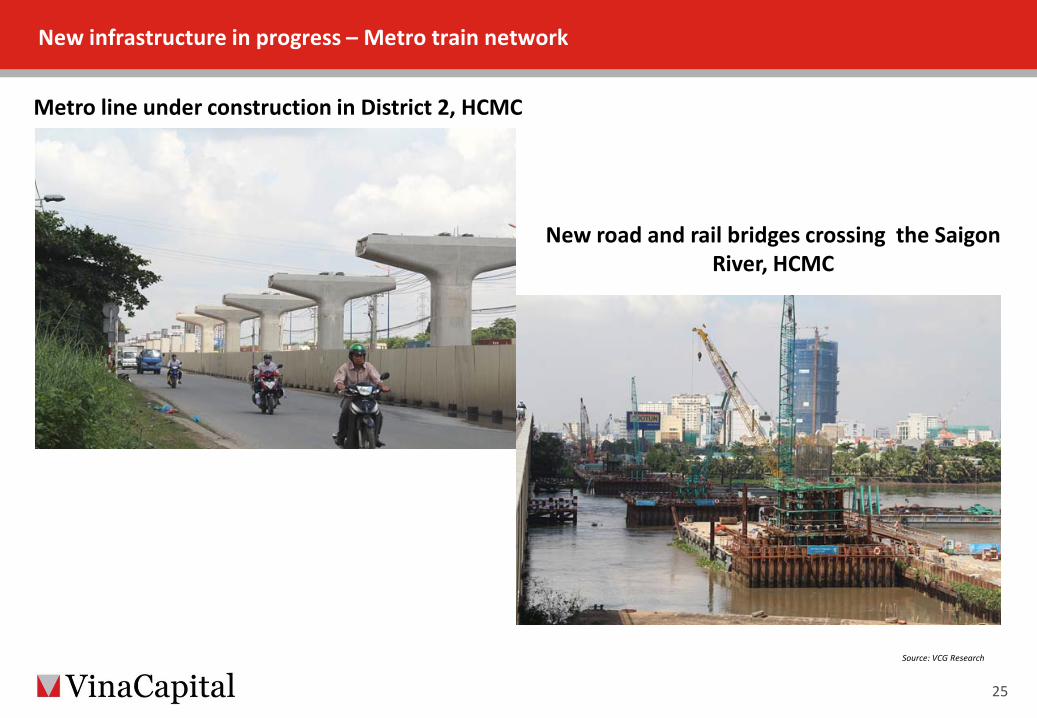
Source: VCG Research
Metro line under construction in District 2, HCMC
New road and rail bridges crossing the Saigon River, HCMC
New infrastructure in progress – Metro train network
25

New infrastructure in progress – Metro train station and city centre
26
HCMC Town Hall
Underground Metro station
Sheraton Hotel Changing HCMC’s CBD face
Source: VCG Research – photo taken in February 2015
Contents
27
1. Vietnam macroeconomic & property market update
2. Overview of VNL Fund
3. Review of the last 12 months
4. Strategy going forward
VinaLand Limited (VNL)
28
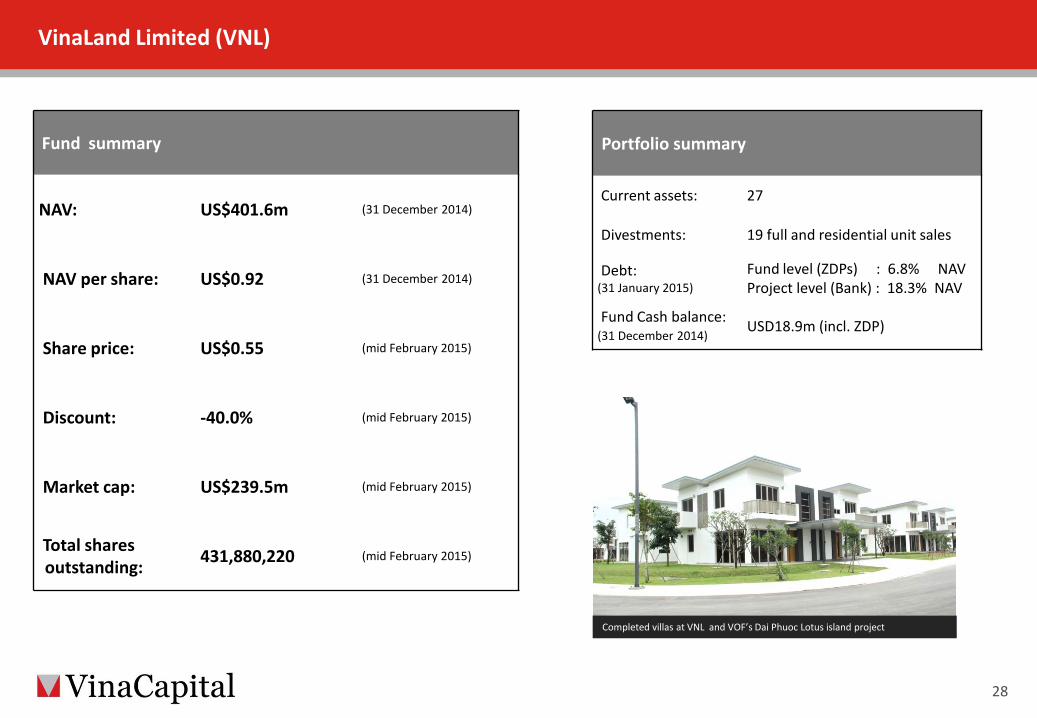
Fund summary
NAV: US$401.6m (31 December 2014)
NAV per share: US$0.92 (31 December 2014)
Share price: US$0.55 (mid February 2015)
Discount: -40.0% (mid February 2015)
Market cap: US$239.5m (mid February 2015)
Total shares outstanding: 431,880,220 (mid February 2015)
Completed villas at VNL and VOF’s Dai Phuoc Lotus island project
Portfolio summary
Current assets: 27
Divestments: 19 full and residential unit sales
Debt: (31 January 2015)
Fund level (ZDPs) : 6.8% NAV Project level (Bank) : 18.3% NAV
Fund Cash balance: (31 December 2014) USD18.9m (incl. ZDP)
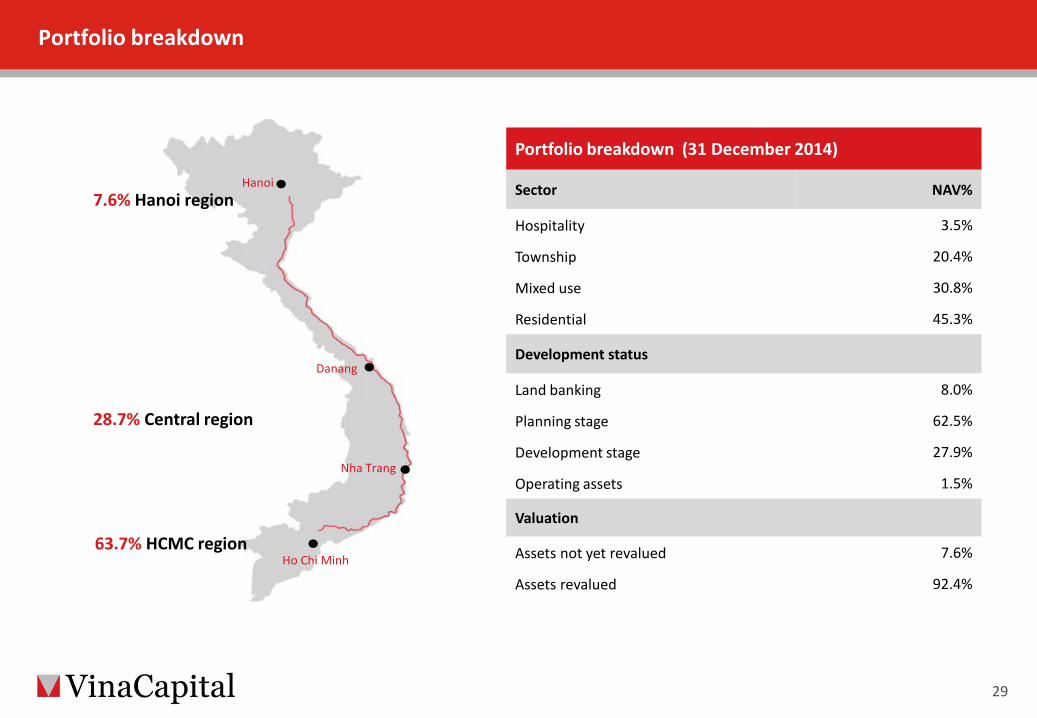
Portfolio breakdown
29
7.6% Hanoi region
28.7% Central region
Danang
Nha Trang
63.7% HCMC region Ho Chi Minh
Hanoi
Portfolio breakdown (31 December 2014)
Sector NAV%
Hospitality 3.5%
Township 20.4%
Mixed use 30.8%
Residential 45.3%
Development status
Land banking 8.0%
Planning stage 62.5%
Development stage 27.9%
Operating assets 1.5%
Valuation
Assets not yet revalued 7.6%
Assets revalued 92.4%
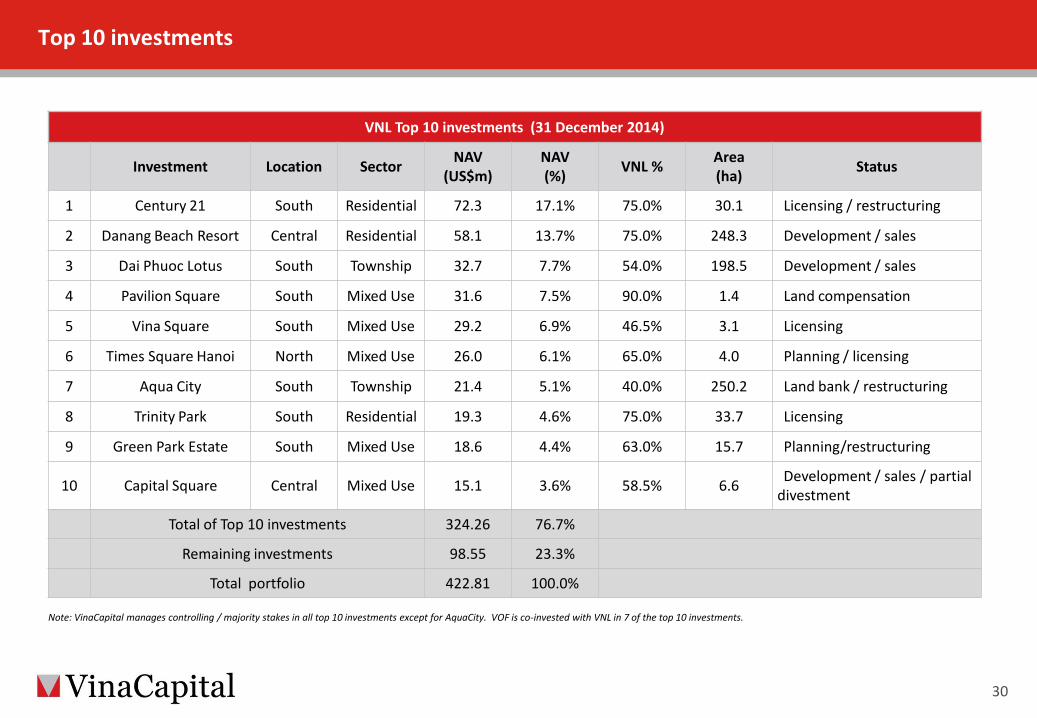
Top 10 investments
30
VNL Top 10 investments (31 December 2014)
Investment Location Sector NAV (US$m)
NAV (%) VNL % Area
(ha) Status
1 Century 21 South Residential 72.3 17.1% 75.0% 30.1 Licensing / restructuring
2 Danang Beach Resort Central Residential 58.1 13.7% 75.0% 248.3 Development / sales
3 Dai Phuoc Lotus South Township 32.7 7.7% 54.0% 198.5 Development / sales
4 Pavilion Square South Mixed Use 31.6 7.5% 90.0% 1.4 Land compensation
5 Vina Square South Mixed Use 29.2 6.9% 46.5% 3.1 Licensing
6 Times Square Hanoi North Mixed Use 26.0 6.1% 65.0% 4.0 Planning / licensing
7 Aqua City South Township 21.4 5.1% 40.0% 250.2 Land bank / restructuring
8 Trinity Park South Residential 19.3 4.6% 75.0% 33.7 Licensing
9 Green Park Estate South Mixed Use 18.6 4.4% 63.0% 15.7 Planning/restructuring
10 Capital Square Central Mixed Use 15.1 3.6% 58.5% 6.6 Development / sales / partial divestment
Total of Top 10 investments 324.26 76.7%
Remaining investments 98.55 23.3%
Total portfolio 422.81 100.0%
Note: VinaCapital manages controlling / majority stakes in all top 10 investments except for AquaCity. VOF is co-invested with VNL in 7 of the top 10 investments.
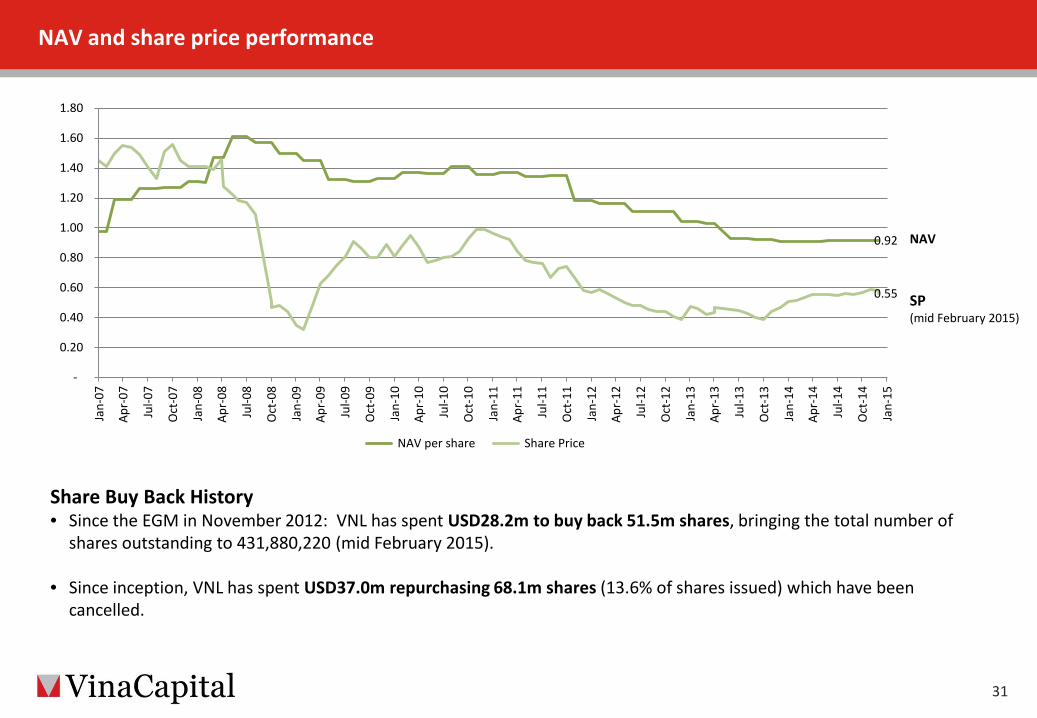
NAV and share price performance
31
SP (mid February 2015)
Share Buy Back History • Since the EGM in November 2012: VNL has spent USD28.2m to buy back 51.5m shares, bringing the total number of
shares outstanding to 431,880,220 (mid February 2015).
• Since inception, VNL has spent USD37.0m repurchasing 68.1m shares (13.6% of shares issued) which have been cancelled.
NAV
0.92
0.55
-
0.20
0.40
0.60
0.80
1.00
1.20
1.40
1.60
1.80 Ja
n-07
Apr-
07
Jul-0
7
Oct
-07
Jan-
08
Apr-
08
Jul-0
8
Oct
-08
Jan-
09
Apr-
09
Jul-0
9
Oct
-09
Jan-
10
Apr-
10
Jul-1
0
Oct
-10
Jan-
11
Apr-
11
Jul-1
1
Oct
-11
Jan-
12
Apr-
12
Jul-1
2
Oct
-12
Jan-
13
Apr-
13
Jul-1
3
Oct
-13
Jan-
14
Apr-
14
Jul-1
4
Oct
-14
Jan-
15
NAV per share Share Price

Contents
32
1. Vietnam macroeconomic & property market update
2. Overview of VNL Fund
3. Review of the last 12 months
4. Strategy going forward
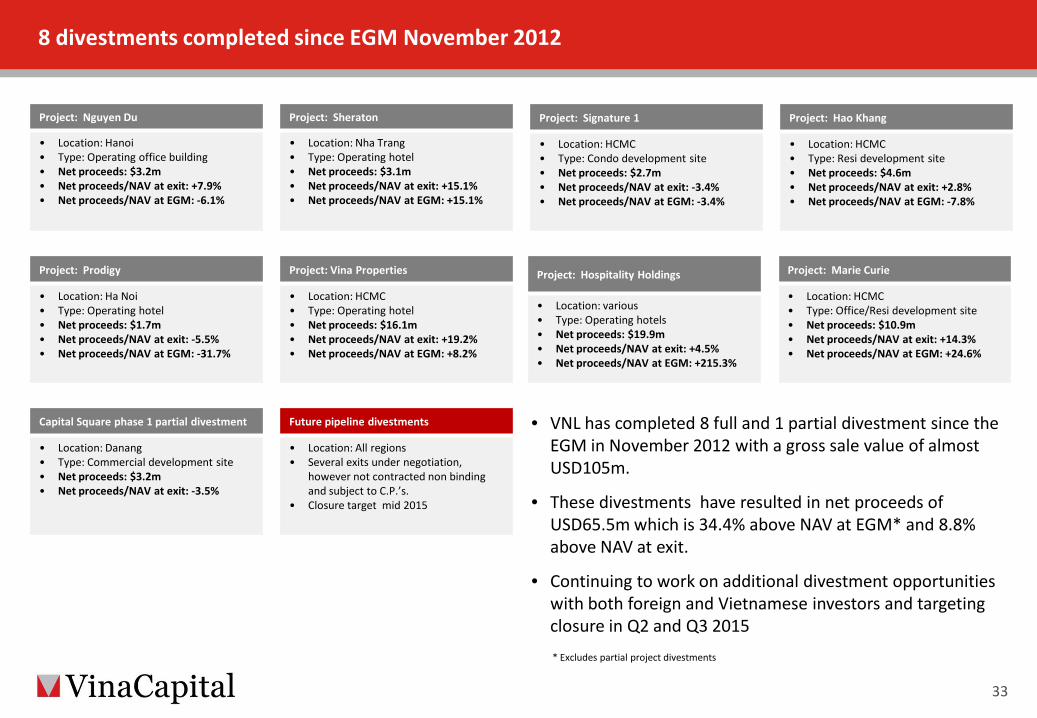
• VNL has completed 8 full and 1 partial divestment since the EGM in November 2012 with a gross sale value of almost USD105m.
• These divestments have resulted in net proceeds of USD65.5m which is 34.4% above NAV at EGM* and 8.8% above NAV at exit.
• Continuing to work on additional divestment opportunities with both foreign and Vietnamese investors and targeting closure in Q2 and Q3 2015
8 divestments completed since EGM November 2012
33
Project: Nguyen Du
• Location: Hanoi • Type: Operating office building • Net proceeds: $3.2m • Net proceeds/NAV at exit: +7.9% • Net proceeds/NAV at EGM: -6.1%
Project: Sheraton
• Location: Nha Trang • Type: Operating hotel • Net proceeds: $3.1m • Net proceeds/NAV at exit: +15.1% • Net proceeds/NAV at EGM: +15.1%
Project: Signature 1
• Location: HCMC • Type: Condo development site • Net proceeds: $2.7m • Net proceeds/NAV at exit: -3.4% • Net proceeds/NAV at EGM: -3.4%
Project: Hao Khang
• Location: HCMC • Type: Resi development site • Net proceeds: $4.6m • Net proceeds/NAV at exit: +2.8% • Net proceeds/NAV at EGM: -7.8%
Project: Prodigy
• Location: Ha Noi • Type: Operating hotel • Net proceeds: $1.7m • Net proceeds/NAV at exit: -5.5% • Net proceeds/NAV at EGM: -31.7%
Project: Vina Properties
• Location: HCMC • Type: Operating hotel • Net proceeds: $16.1m • Net proceeds/NAV at exit: +19.2% • Net proceeds/NAV at EGM: +8.2%
Project: Marie Curie
• Location: HCMC • Type: Office/Resi development site • Net proceeds: $10.9m • Net proceeds/NAV at exit: +14.3% • Net proceeds/NAV at EGM: +24.6%
Project: Hospitality Holdings
• Location: various • Type: Operating hotels • Net proceeds: $19.9m • Net proceeds/NAV at exit: +4.5% • Net proceeds/NAV at EGM: +215.3%
Capital Square phase 1 partial divestment
• Location: Danang • Type: Commercial development site • Net proceeds: $3.2m • Net proceeds/NAV at exit: -3.5%
Future pipeline divestments
• Location: All regions • Several exits under negotiation,
however not contracted non binding and subject to C.P.’s.
• Closure target mid 2015
* Excludes partial project divestments
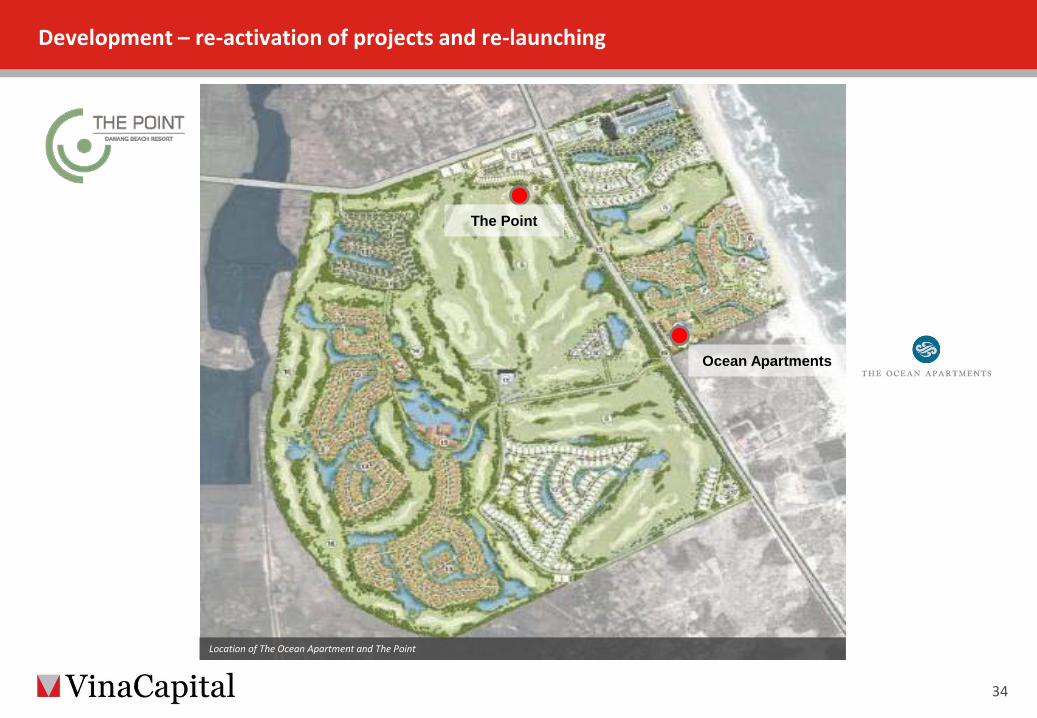
Development – re-activation of projects and re-launching
34
Ocean Apartments
The Point
Location of The Ocean Apartment and The Point
Development – re-activation of projects and re-launching
35
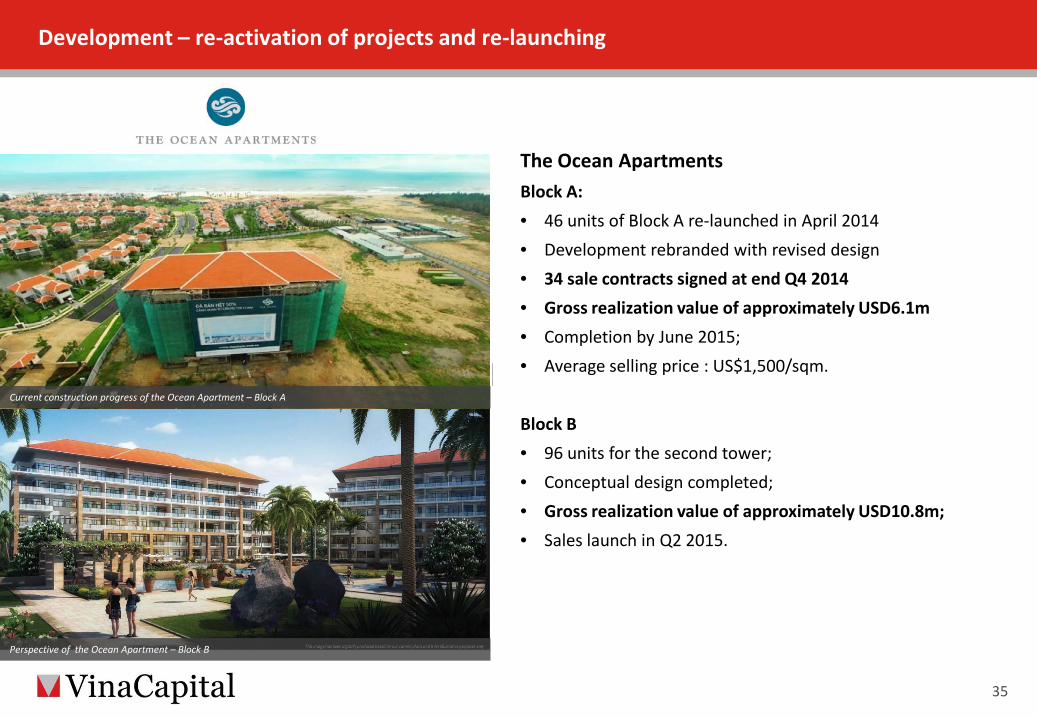
The Ocean Apartments Block A: • 46 units of Block A re-launched in April 2014 • Development rebranded with revised design • 34 sale contracts signed at end Q4 2014 • Gross realization value of approximately USD6.1m • Completion by June 2015; • Average selling price : US$1,500/sqm. Block B • 96 units for the second tower; • Conceptual design completed; • Gross realization value of approximately USD10.8m; • Sales launch in Q2 2015.
The current construction progress of the Ocean Apartment – Block A
Perspective of the Ocean Apartment – Block B
Current construction progress of the Ocean Apartment – Block A

Development – re-activation of projects and re-launching
36
The Point • 40 three bedroom pool villas fronting the Dunes Golf Course; • Phase 1 (20 villas) re-launched in late October 2014; • 7 sale contracts signed at end 2014 and 10 additional
reservations secured to date; • Gross realization value of approximately USD 10.9m; • Phase 2 (20 villas) to be launched in Q2 2015.
Perspective of The Point Current construction progress of The Point Perspective of The Point
General Arrangement of The Point
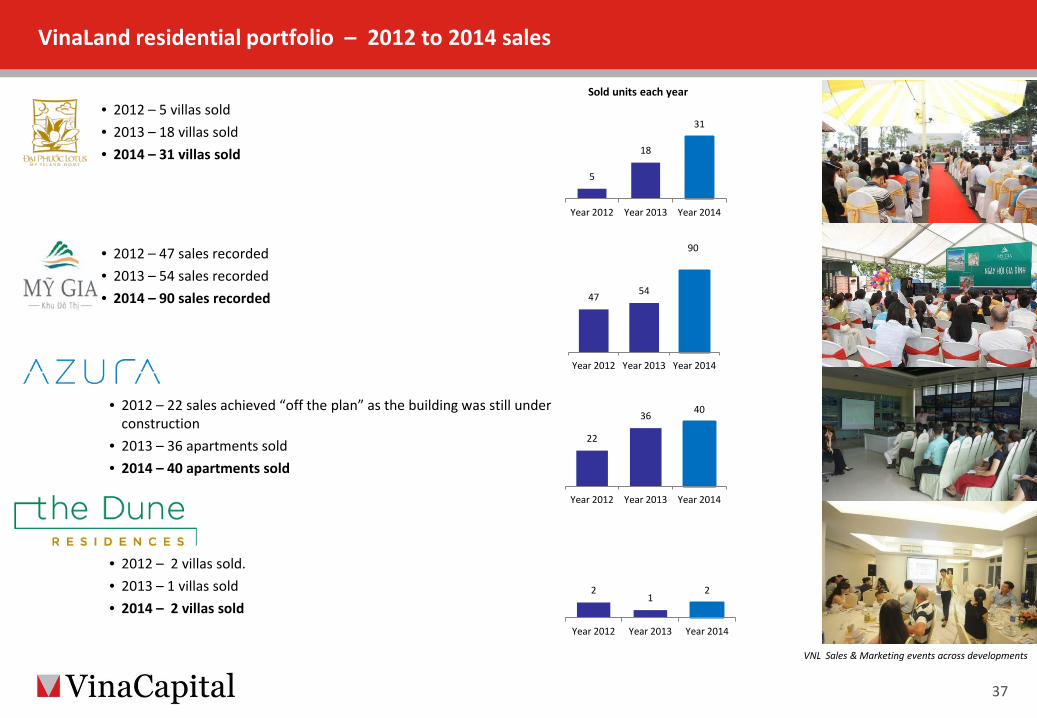
• 2012 – 5 villas sold • 2013 – 18 villas sold • 2014 – 31 villas sold
• 2012 – 47 sales recorded • 2013 – 54 sales recorded • 2014 – 90 sales recorded
• 2012 – 22 sales achieved “off the plan” as the building was still under construction
• 2013 – 36 apartments sold • 2014 – 40 apartments sold
VNL Sales & Marketing events across developments
• 2012 – 2 villas sold. • 2013 – 1 villas sold • 2014 – 2 villas sold
Sold units each year
VinaLand residential portfolio – 2012 to 2014 sales
37
5
18
31
Year 2012 Year 2013 Year 2014
47 54
90
Year 2012 Year 2013 Year 2014
22
36 40
Year 2012 Year 2013 Year 2014
2 1
2
Year 2012 Year 2013 Year 2014
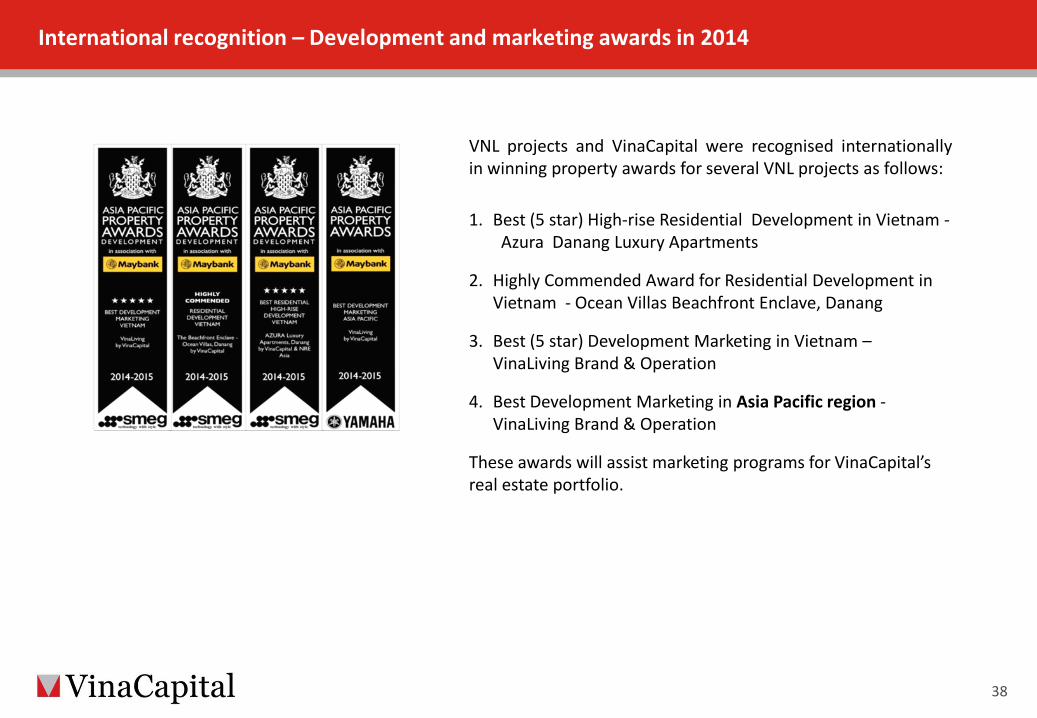
VNL projects and VinaCapital were recognised internationally in winning property awards for several VNL projects as follows: 1. Best (5 star) High-rise Residential Development in Vietnam -
Azura Danang Luxury Apartments
2. Highly Commended Award for Residential Development in Vietnam - Ocean Villas Beachfront Enclave, Danang
3. Best (5 star) Development Marketing in Vietnam – VinaLiving Brand & Operation
4. Best Development Marketing in Asia Pacific region - VinaLiving Brand & Operation
These awards will assist marketing programs for VinaCapital’s real estate portfolio.
International recognition – Development and marketing awards in 2014
38

Contents
39
1. Vietnam macroeconomic & property market update
2. Overview of VNL Fund
3. Review of the last 12 months
4. Strategy going forward
Strategy for 2015
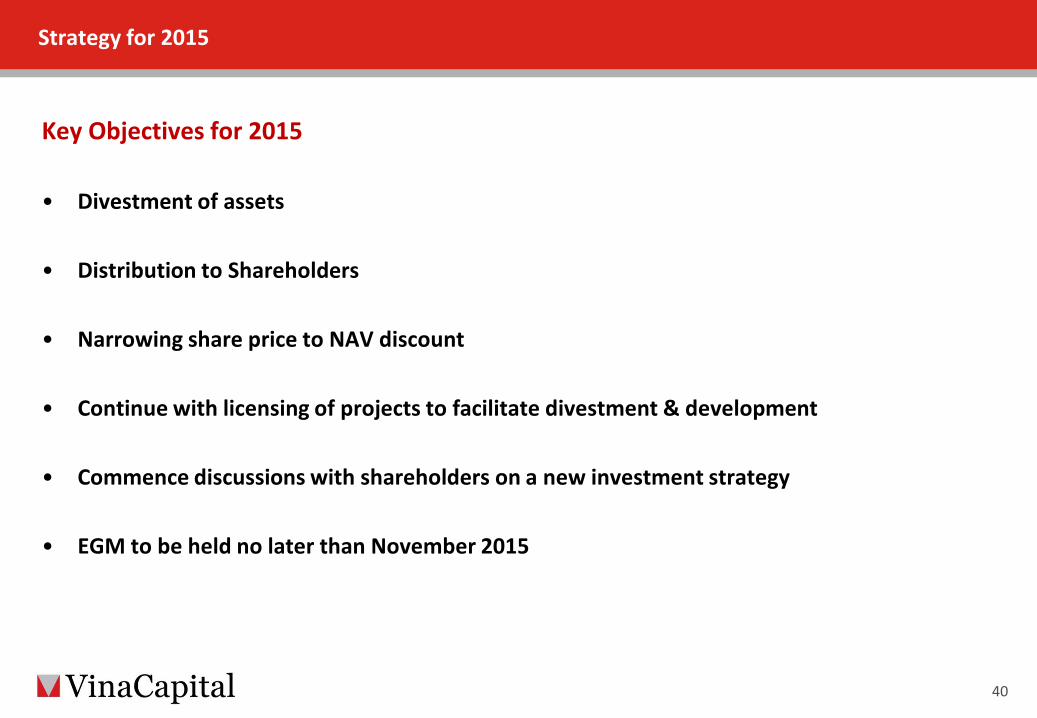
Key Objectives for 2015 • Divestment of assets
• Distribution to Shareholders
• Narrowing share price to NAV discount
• Continue with licensing of projects to facilitate divestment & development
• Commence discussions with shareholders on a new investment strategy
• EGM to be held no later than November 2015
40

The figures shown on this slide are illustrative estimates only. Due to various risks and uncertainties, actual events or results or the actual performance of the Fund or any investment discussed in this presentation may differ materially from those reflected or contemplated in such illustrative estimates. Any projections, market outlooks or illustrative estimates are forward-looking statements and are based upon certain assumptions. Other events which were not taken into account may occur and may significantly affect the performance of the Fund or any investment. Any outlooks and assumptions should not be construed to be indicative of the actual events which will occur.
Indicative realisation and distribution profile – Illustrative outcome up to end 2015
41
Assumptions used in the estimation:
1) Cash from an exit is received within 2 years from the exit date.
2) Starting cash balance used for distributions.
3) Exits modeled on project-by-project basis starting with current NAV which is derived from
independent third party valuations.
4) Estimated cash flow figures are based on remaining realisation period.
5) All estimated amounts are assumptions of the Manager at the time of compilation. These estimates are market sensitive
and therefore subject to change due to economic, property market and government policies.
6) Estimated cash flow figures exclude proceeds from ZDP.
7) Estimated realisation fee refers to the accrued unpaid performance fee and will be settled from net cash from exits .
8) At the point where 112m is distributed to Shareholders the 28m realisation fee will have been paid VinaCapital.
9) 41.2m receivables from exits during 2015 to be collected in H1 2016 includes 33.1m from C21; 4.7m from VinaSquare; 2.4m from
Romana & 1.0m from DN Marina.
The above chart is a forecast up until the end of 2015, however also includes estimated collection of further receivables in 2016 that will be derived from project divestments contracted in 2015 and not closing until 2016. This will enable additional distributions in 2016.
Estimated Distribution Profile (USDm) Total Nov 2012 - 2015 Nov 2012- Dec 2014
Actual
2015
Future
2016 H1
Receivables Opening cash balance 4.9 4.9 (3.3)* 22.4
Collection from Outstanding Receivables 8.3 7.5 0.8 -
Cash from exits/ Return from projects 221.7 68.2 153.5 41.2
Management fee (23.0) (16.5) (6.5) (3.3)
Operating expenses (Incl. ZDP Fees) (9.6) (7.9) (1.7) (0.8)
Future capital commitments (55.4) (33.3) (22.1) (9.8)
Estimated distribution to Shareholders (99.5) (26.2) (73.3) (24.0)
Estimated realisation fee (note 8) (24.9) - (24.9) (3.3)
Closing cash balance 22.4 (3.3)* 22.4 22.4
* Estimated cash flow figures exclude Proceeds from ZDP Issue (note 6), actual VNL Cash balance as at end of 2014 is approximately 5.2m after
utilizing ZDP cash support.
APPENDIX - Key projects
Appendix
42
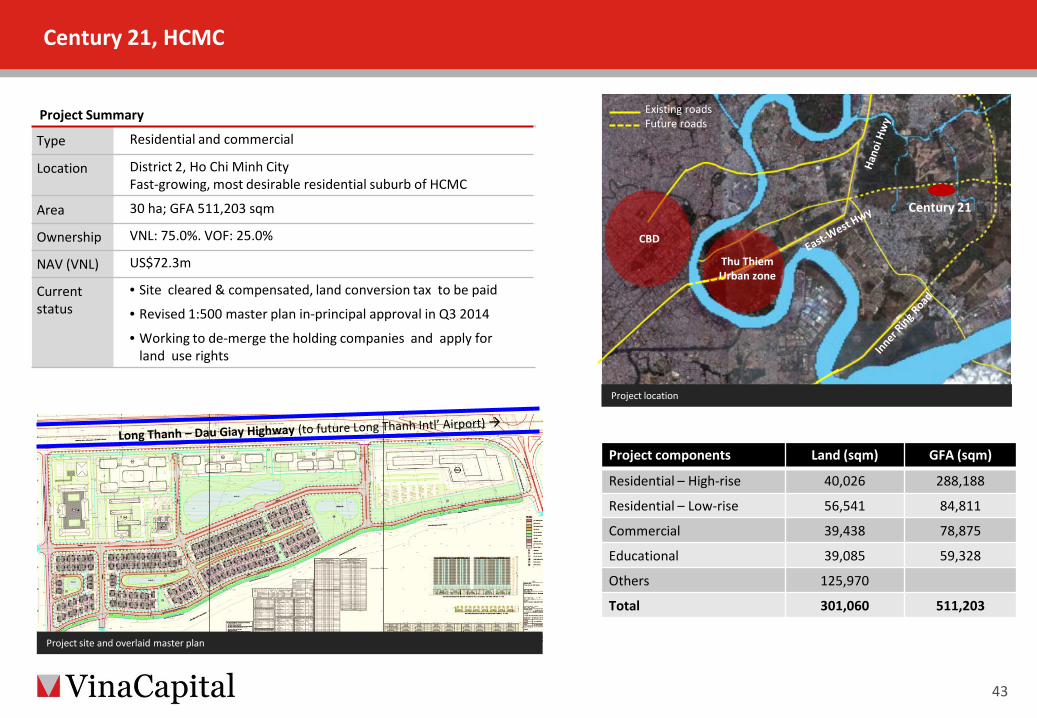
Project Summary
Type Residential and commercial
Location District 2, Ho Chi Minh City Fast-growing, most desirable residential suburb of HCMC
Area 30 ha; GFA 511,203 sqm
Ownership VNL: 75.0%. VOF: 25.0%
NAV (VNL) US$72.3m
Current status
• Site cleared & compensated, land conversion tax to be paid
• Revised 1:500 master plan in-principal approval in Q3 2014
• Working to de-merge the holding companies and apply for land use rights
CBD
Thu Thiem Urban zone
Existing roads Future roads
Century 21
Project location
Project components Land (sqm) GFA (sqm)
Residential – High-rise 40,026 288,188
Residential – Low-rise 56,541 84,811
Commercial 39,438 78,875
Educational 39,085 59,328
Others 125,970
Total 301,060 511,203
Project site and overlaid master plan
Century 21, HCMC
43
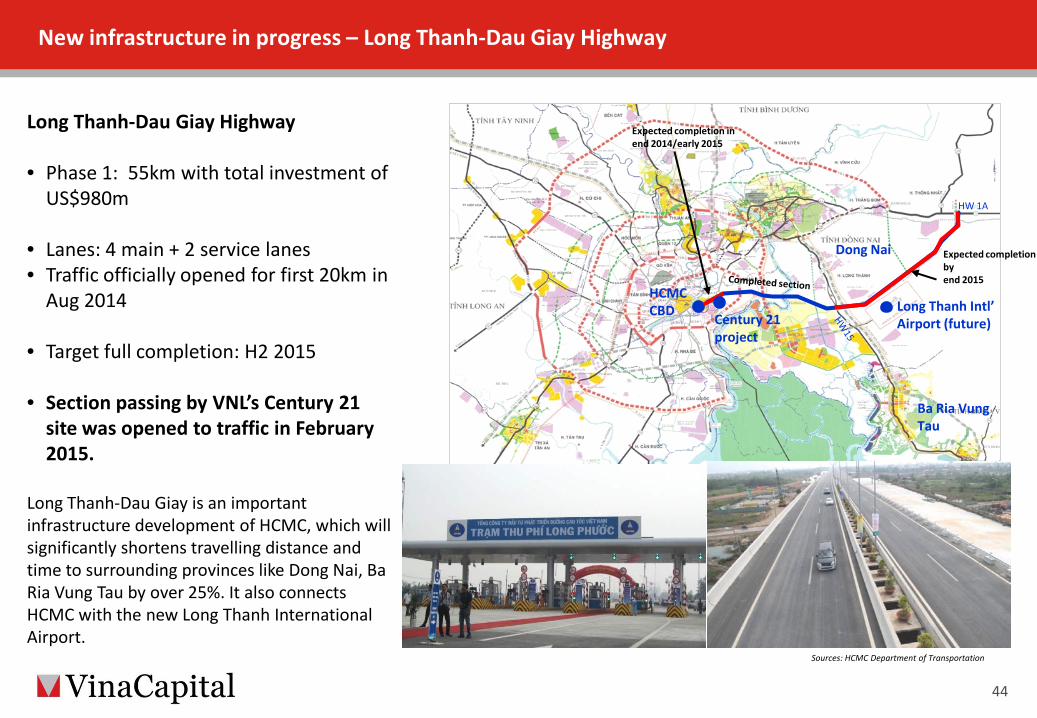
Long Thanh-Dau Giay Highway
• Phase 1: 55km with total investment of US$980m
• Lanes: 4 main + 2 service lanes • Traffic officially opened for first 20km in
Aug 2014
• Target full completion: H2 2015
• Section passing by VNL’s Century 21 site was opened to traffic in February 2015.
Long Thanh-Dau Giay is an important infrastructure development of HCMC, which will significantly shortens travelling distance and time to surrounding provinces like Dong Nai, Ba Ria Vung Tau by over 25%. It also connects HCMC with the new Long Thanh International Airport.
Sources: HCMC Department of Transportation
HCMC CBD Long Thanh Intl’
Airport (future)
Ba Ria Vung Tau
Dong Nai
HW 1A
Expected completion in end 2014/early 2015
Expected completion by end 2015
Century 21 project
New infrastructure in progress – Long Thanh-Dau Giay Highway
44
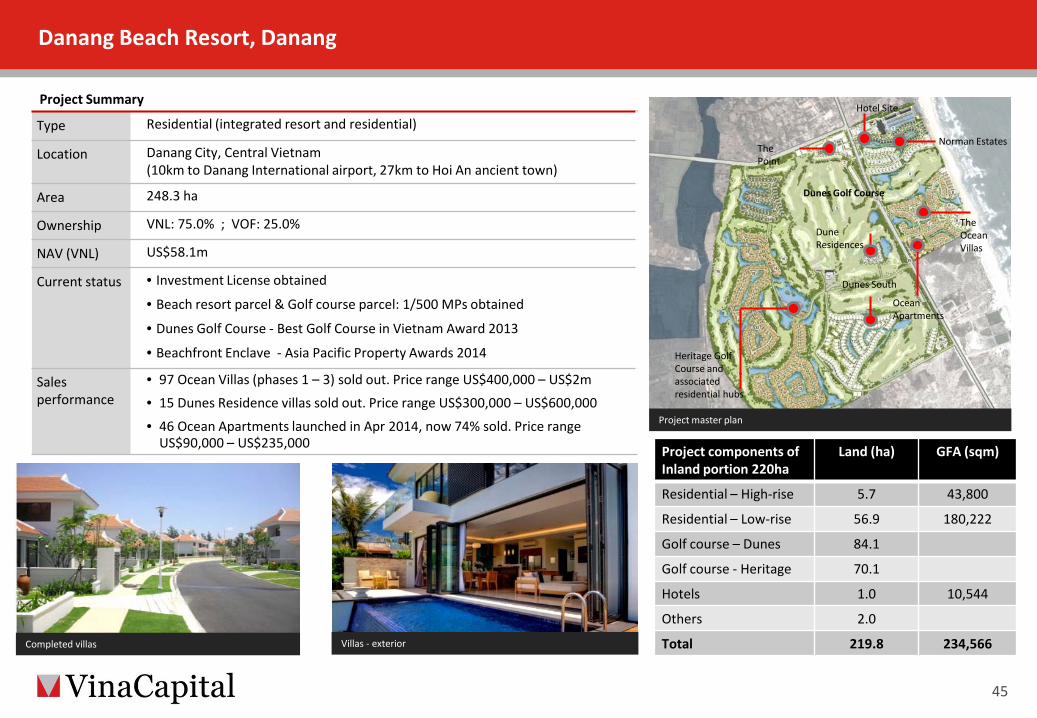
Project Summary
Type Residential (integrated resort and residential)
Location Danang City, Central Vietnam (10km to Danang International airport, 27km to Hoi An ancient town)
Area 248.3 ha
Ownership VNL: 75.0% ; VOF: 25.0%
NAV (VNL) US$58.1m
Current status • Investment License obtained
• Beach resort parcel & Golf course parcel: 1/500 MPs obtained
• Dunes Golf Course - Best Golf Course in Vietnam Award 2013
• Beachfront Enclave - Asia Pacific Property Awards 2014
Sales performance
• 97 Ocean Villas (phases 1 – 3) sold out. Price range US$400,000 – US$2m
• 15 Dunes Residence villas sold out. Price range US$300,000 – US$600,000
• 46 Ocean Apartments launched in Apr 2014, now 74% sold. Price range US$90,000 – US$235,000
Hotel Site
Norman Estates
The Ocean Villas
Ocean Apartments
Dune Residences
Dunes Golf Course
Heritage Golf Course and associated residential hubs
Dunes South
The Point
Project master plan
Completed villas Villas - exterior
Project components of Inland portion 220ha
Land (ha) GFA (sqm)
Residential – High-rise 5.7 43,800
Residential – Low-rise 56.9 180,222
Golf course – Dunes 84.1
Golf course - Heritage 70.1
Hotels 1.0 10,544
Others 2.0
Total 219.8 234,566
Danang Beach Resort, Danang
45
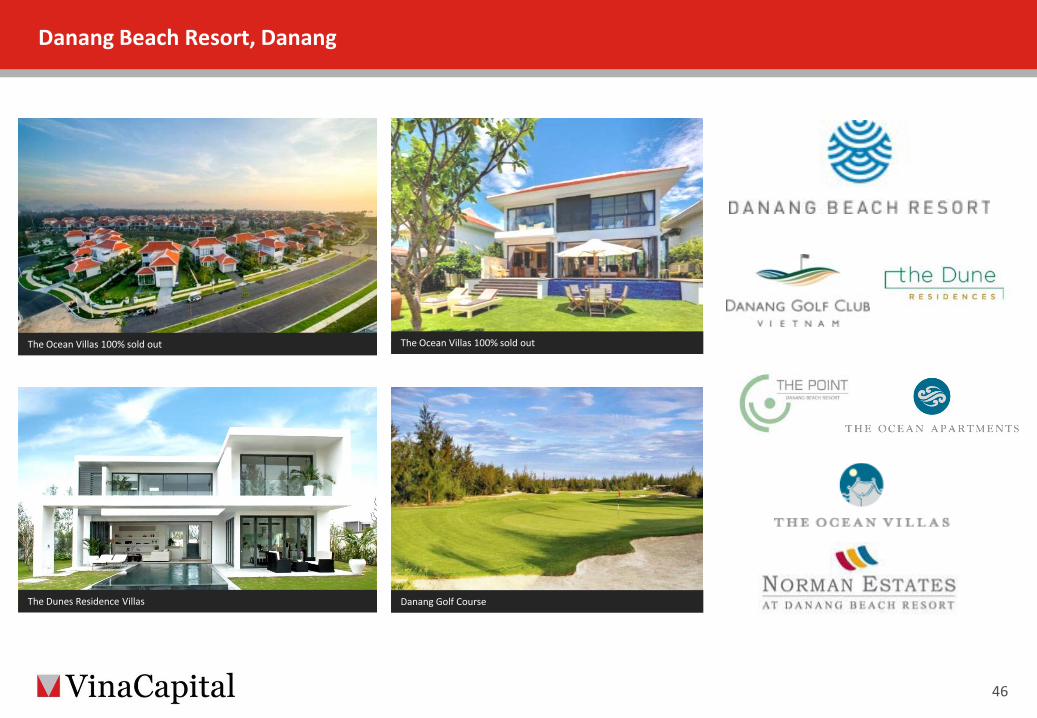
The Ocean Villas 100% sold out
The Dunes Residence Villas Danang Golf Course
The Ocean Villas 100% sold out
Danang Beach Resort, Danang
46
ZONE 6 JEONGSAN COUNTRY GOLF CLUB
Central
ZONE 7
ZONE 8
MARINA ZONE 5 ZONE 4
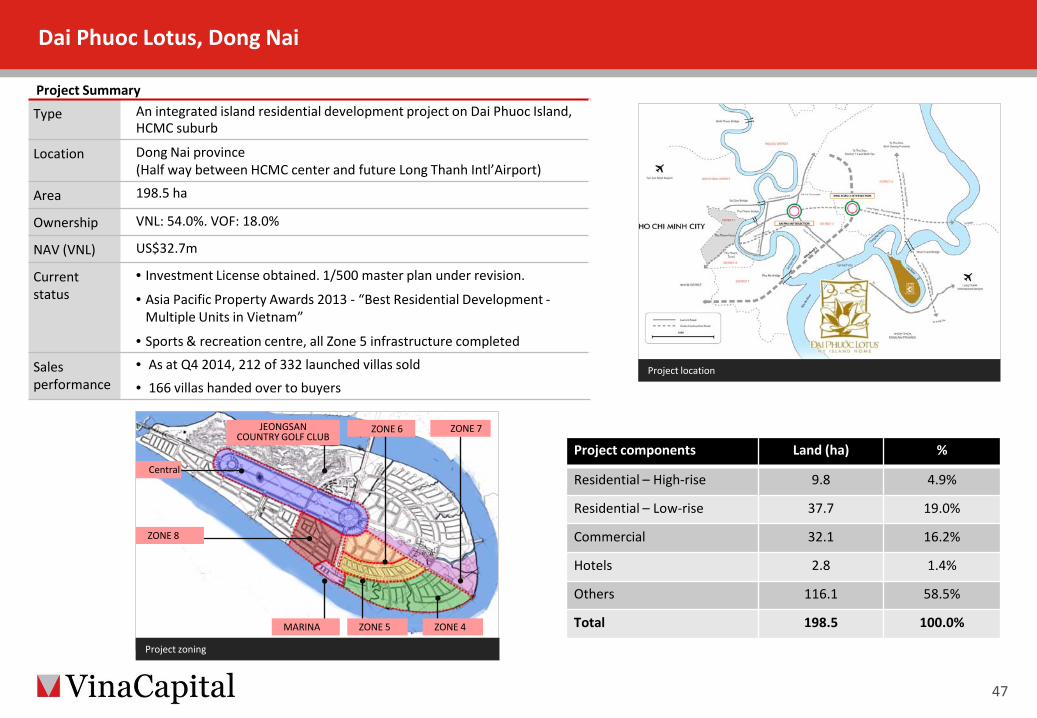
Project Summary
Type An integrated island residential development project on Dai Phuoc Island, HCMC suburb
Location Dong Nai province (Half way between HCMC center and future Long Thanh Intl’Airport)
Area 198.5 ha
Ownership VNL: 54.0%. VOF: 18.0%
NAV (VNL) US$32.7m
Current status
• Investment License obtained. 1/500 master plan under revision.
• Asia Pacific Property Awards 2013 - “Best Residential Development - Multiple Units in Vietnam”
• Sports & recreation centre, all Zone 5 infrastructure completed
Sales performance
• As at Q4 2014, 212 of 332 launched villas sold
• 166 villas handed over to buyers Project location
Project zoning
Project components Land (ha) %
Residential – High-rise 9.8 4.9%
Residential – Low-rise 37.7 19.0%
Commercial 32.1 16.2%
Hotels 2.8 1.4%
Others 116.1 58.5%
Total 198.5 100.0%
Dai Phuoc Lotus, Dong Nai
47
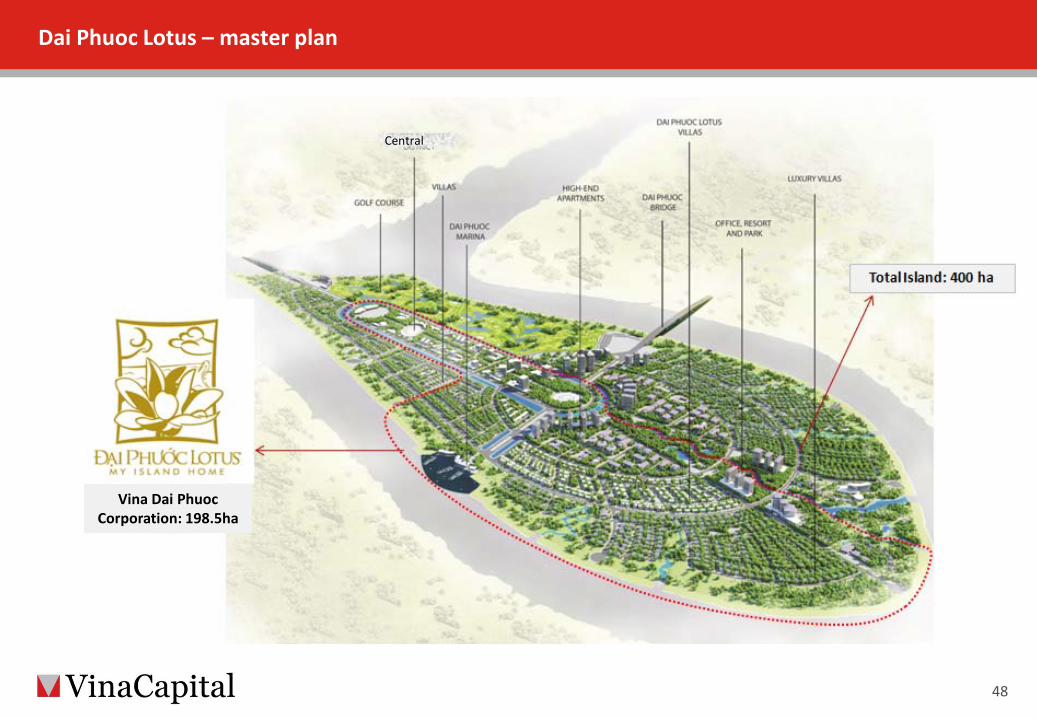
Dai Phuoc Lotus – master plan
48
Central
Vina Dai Phuoc Corporation: 198.5ha
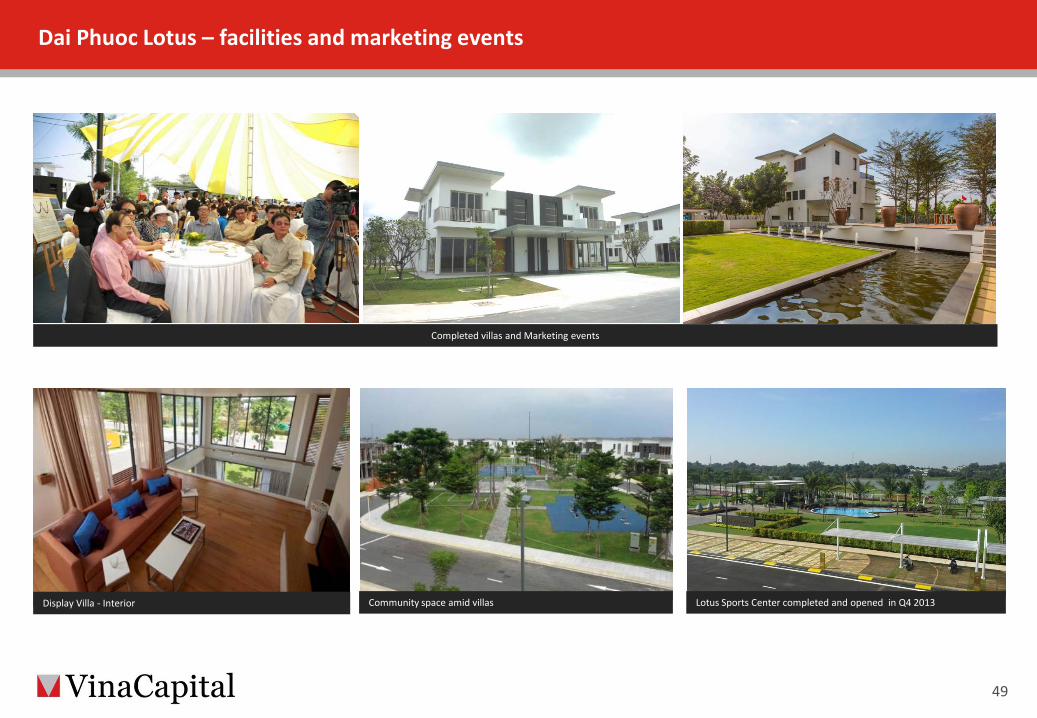
Lotus Sports Center completed and opened in Q4 2013 Display Villa - Interior
Completed villas and Marketing events
Community space amid villas
Dai Phuoc Lotus – facilities and marketing events
49
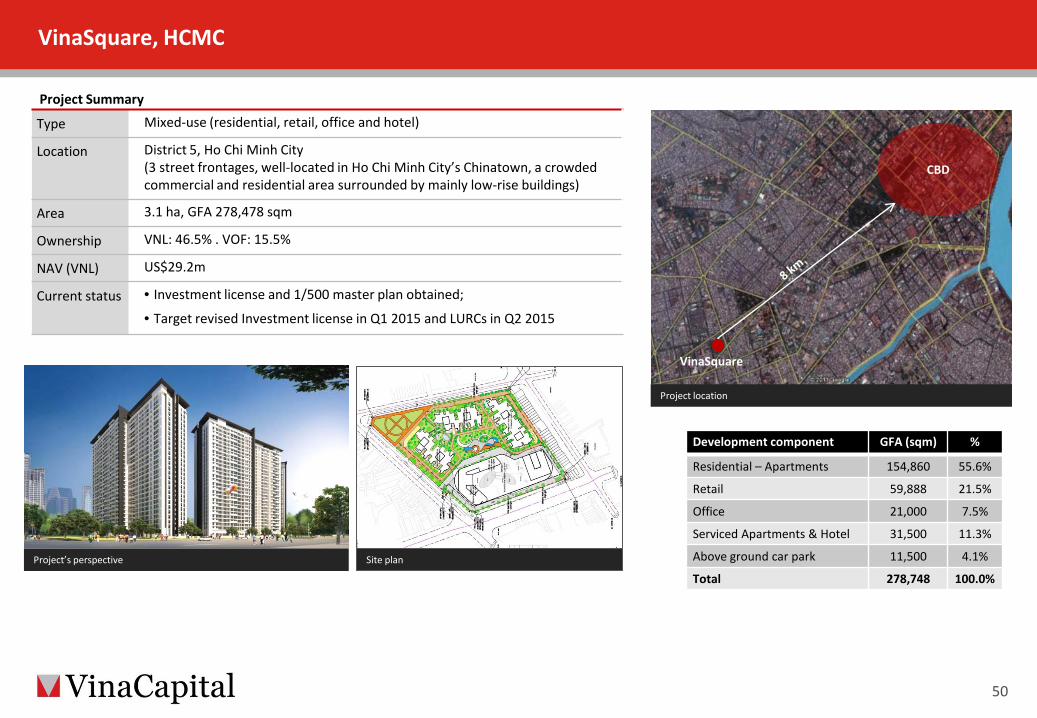
Chinatown VinaSquare
CBD
Development component GFA (sqm) %
Residential – Apartments 154,860 55.6%
Retail 59,888 21.5%
Office 21,000 7.5%
Serviced Apartments & Hotel 31,500 11.3%
Above ground car park 11,500 4.1%
Total 278,748 100.0%
Project Summary
Type Mixed-use (residential, retail, office and hotel)
Location District 5, Ho Chi Minh City (3 street frontages, well-located in Ho Chi Minh City’s Chinatown, a crowded commercial and residential area surrounded by mainly low-rise buildings)
Area 3.1 ha, GFA 278,478 sqm
Ownership VNL: 46.5% . VOF: 15.5%
NAV (VNL) US$29.2m
Current status • Investment license and 1/500 master plan obtained;
• Target revised Investment license in Q1 2015 and LURCs in Q2 2015
Project location
Project’s perspective
VinaSquare, HCMC
50
Site plan
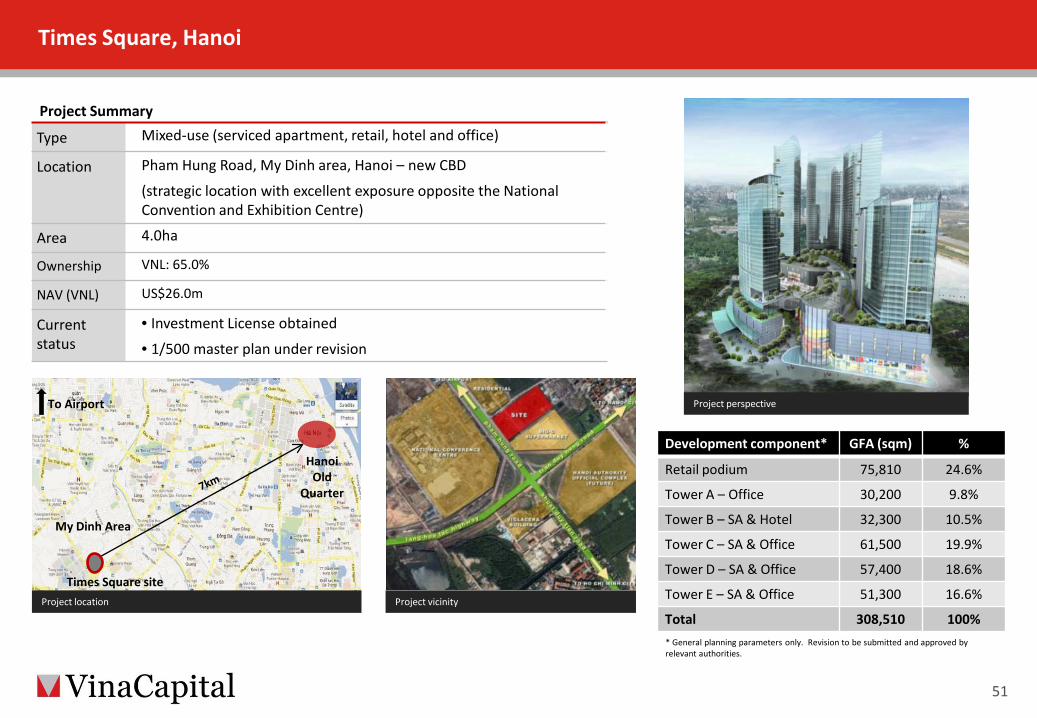
Hanoi Old
Quarter
Times Square site
To Airport
My Dinh Area
Project Summary
Type Mixed-use (serviced apartment, retail, hotel and office)
Location Pham Hung Road, My Dinh area, Hanoi – new CBD
(strategic location with excellent exposure opposite the National Convention and Exhibition Centre)
Area 4.0ha
Ownership VNL: 65.0%
NAV (VNL) US$26.0m
Current status
• Investment License obtained
• 1/500 master plan under revision
Project location Project vicinity
Project perspective
Development component* GFA (sqm) %
Retail podium 75,810 24.6%
Tower A – Office 30,200 9.8%
Tower B – SA & Hotel 32,300 10.5%
Tower C – SA & Office 61,500 19.9%
Tower D – SA & Office 57,400 18.6%
Tower E – SA & Office 51,300 16.6%
Total 308,510 100% * General planning parameters only. Revision to be submitted and approved by relevant authorities.
Times Square, Hanoi
51
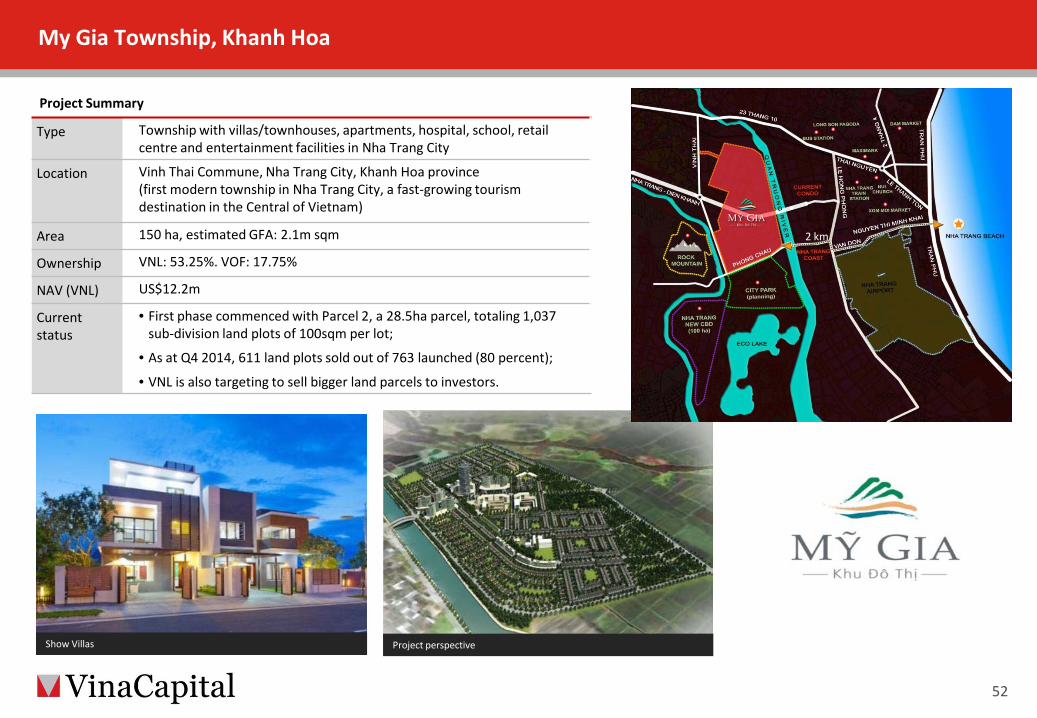
My Gia Township, Khanh Hoa
52
Project perspective Show Villas
Project Summary
Type Township with villas/townhouses, apartments, hospital, school, retail centre and entertainment facilities in Nha Trang City
Location Vinh Thai Commune, Nha Trang City, Khanh Hoa province (first modern township in Nha Trang City, a fast-growing tourism destination in the Central of Vietnam)
Area 150 ha, estimated GFA: 2.1m sqm
Ownership VNL: 53.25%. VOF: 17.75%
NAV (VNL) US$12.2m
Current status
• First phase commenced with Parcel 2, a 28.5ha parcel, totaling 1,037 sub-division land plots of 100sqm per lot;
• As at Q4 2014, 611 land plots sold out of 763 launched (80 percent);
• VNL is also targeting to sell bigger land parcels to investors.
2 km
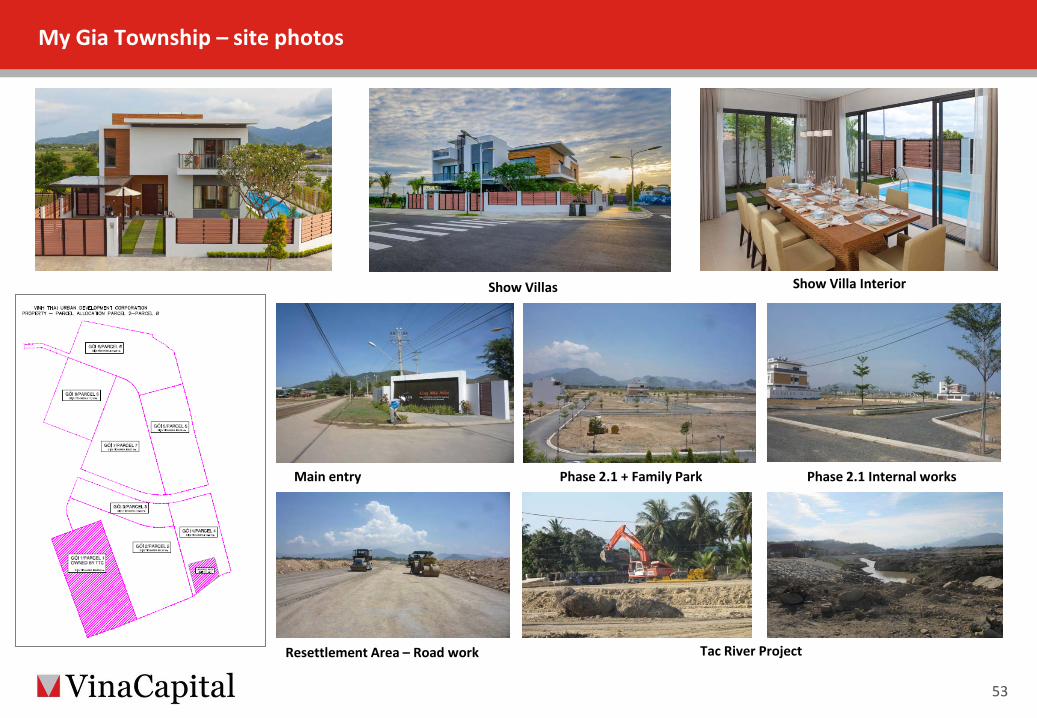
My Gia Township – site photos
53
Show Villas Show Villa Interior
Main entry
Tac River Project
Phase 2.1 + Family Park Phase 2.1 Internal works
Resettlement Area – Road work
Contents
Macroeconomic developments
VinaCapital Vietnam Opportunity Fund
VinaLand Limited
Vietnam Infrastructure Limited
VCG Partners Vietnam Value Fund
54
VNI - Performance Highlights
55
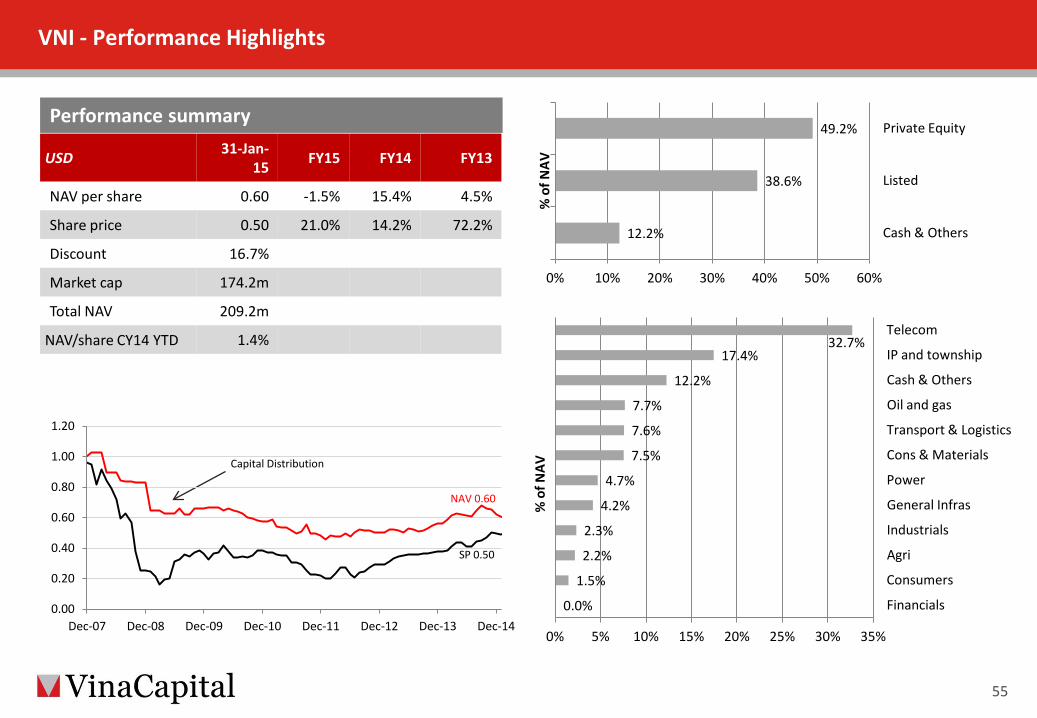
Performance summary
Capital Distribution
NAV 0.60
SP 0.50
USD 31-Jan-15 FY15 FY14 FY13
NAV per share 0.60 -1.5% 15.4% 4.5%
Share price 0.50 21.0% 14.2% 72.2%
Discount 16.7%
Market cap 174.2m
Total NAV 209.2m
NAV/share CY14 YTD 1.4%
0.00
0.20
0.40
0.60
0.80
1.00
1.20
Dec-07 Dec-08 Dec-09 Dec-10 Dec-11 Dec-12 Dec-13 Dec-14
12.2%
38.6%
49.2%
0% 10% 20% 30% 40% 50% 60%
Cash & Others
Listed
Private Equity
% o
f NAV
0.0%
1.5%
2.2%
2.3%
4.2%
4.7%
7.5%
7.6%
7.7%
12.2%
17.4% 32.7%
0% 5% 10% 15% 20% 25% 30% 35%
Financials
Consumers
Agri
Industrials
General Infras
Power
Cons & Materials
Transport & Logistics
Oil and gas
Cash & Others
IP and township
Telecom
% o
f NAV
Portfolio Review – Listed Equities
56
VNI Listed Portfolio Return
Valuation*
Valuation VNI Listed Portfolio VN Index
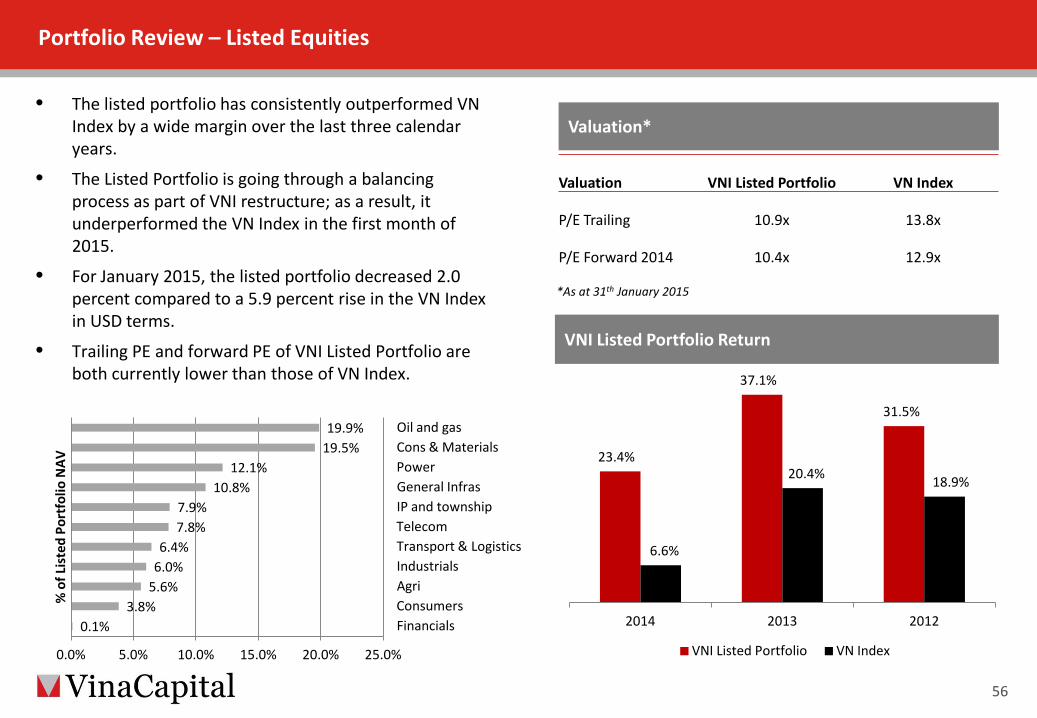
P/E Trailing 10.9x 13.8x
P/E Forward 2014 10.4x 12.9x
*As at 31th January 2015
• The listed portfolio has consistently outperformed VN Index by a wide margin over the last three calendar years.
• The Listed Portfolio is going through a balancing process as part of VNI restructure; as a result, it underperformed the VN Index in the first month of 2015.
• For January 2015, the listed portfolio decreased 2.0 percent compared to a 5.9 percent rise in the VN Index in USD terms.
• Trailing PE and forward PE of VNI Listed Portfolio are both currently lower than those of VN Index.
23.4%
37.1%
31.5%
6.6%
20.4% 18.9%
2014 2013 2012
VNI Listed Portfolio VN Index
0.1% 3.8%
5.6% 6.0% 6.4%
7.8% 7.9%
10.8% 12.1%
19.5% 19.9%
0.0% 5.0% 10.0% 15.0% 20.0% 25.0%
Financials Consumers Agri Industrials Transport & Logistics Telecom IP and township General Infras Power Cons & Materials Oil and gas
% o
f Lis
ted
Port
folio
NAV

57
VNI Restructuring Update
VNI Restructuring Update
• VNI restructuring proposals were passed on 15th December 2014.
• VNI is to split the listed and private equity assets into two separate pools represented by two share classes, the Listed Portfolio Share class which holds listed shares and bonds, and the Private Equity Portfolio Share class which represents the non-listed assets.
• The listed component will be transferred to a new Luxembourg-based UCITS compliant open-ended fund, called the VCG Partners Vietnam Fund (VVF), with a generalist Vietnam focus. The private equity component will be actively managed with a realisation and value-maximising strategy.
• VVF is in the process of being approved for the UCITS status by relevant authority. The fund is expected to launch in May 2015.
58
Private Equity Portfolio - Overview
Strategy – Private equity portfolio to be realised by mid 2017. – Realised cash (income and capital) will be distributed either in shares/units or in cash.
Management & Incentive Fees
– VCG will not charge a management fee on the Private Equity component. – VCG will receive a fee of 3% of the sale proceeds upon realisation of the assets. – VCG is entitled to receive an incentive fee of 10% of the aggregate of all the sale proceeds over the aggregate 75% of
book value as at 30 June 2014. – The fee structure is designed to incentivise VNI to maximise the sale proceeds and to minimise the time taken to
realise the PE assets at attractive valuations.
59
Private Equity Portfolio
60
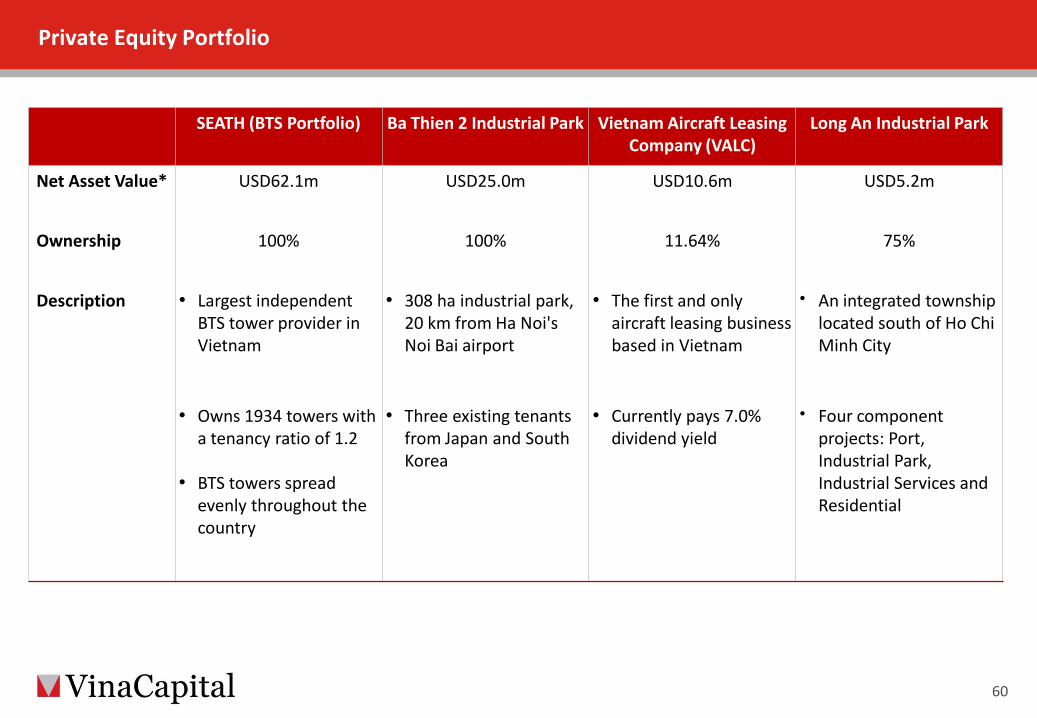
SEATH (BTS Portfolio) Ba Thien 2 Industrial Park Vietnam Aircraft Leasing Company (VALC)
Long An Industrial Park
Net Asset Value* USD62.1m USD25.0m USD10.6m USD5.2m
Ownership 100% 100% 11.64% 75%
Description • Largest independent BTS tower provider in Vietnam
• 308 ha industrial park, 20 km from Ha Noi's Noi Bai airport
• The first and only aircraft leasing business based in Vietnam
• An integrated township located south of Ho Chi Minh City
• Owns 1934 towers with a tenancy ratio of 1.2
• BTS towers spread evenly throughout the country
• Three existing tenants from Japan and South Korea
• Currently pays 7.0% dividend yield
• Four component projects: Port, Industrial Park, Industrial Services and Residential
Contents
Macroeconomic developments
VinaCapital Vietnam Opportunity Fund
VinaLand Limited
Vietnam Infrastructure Limited
VCG Partners Vietnam Value Fund
61
VVF - Overview
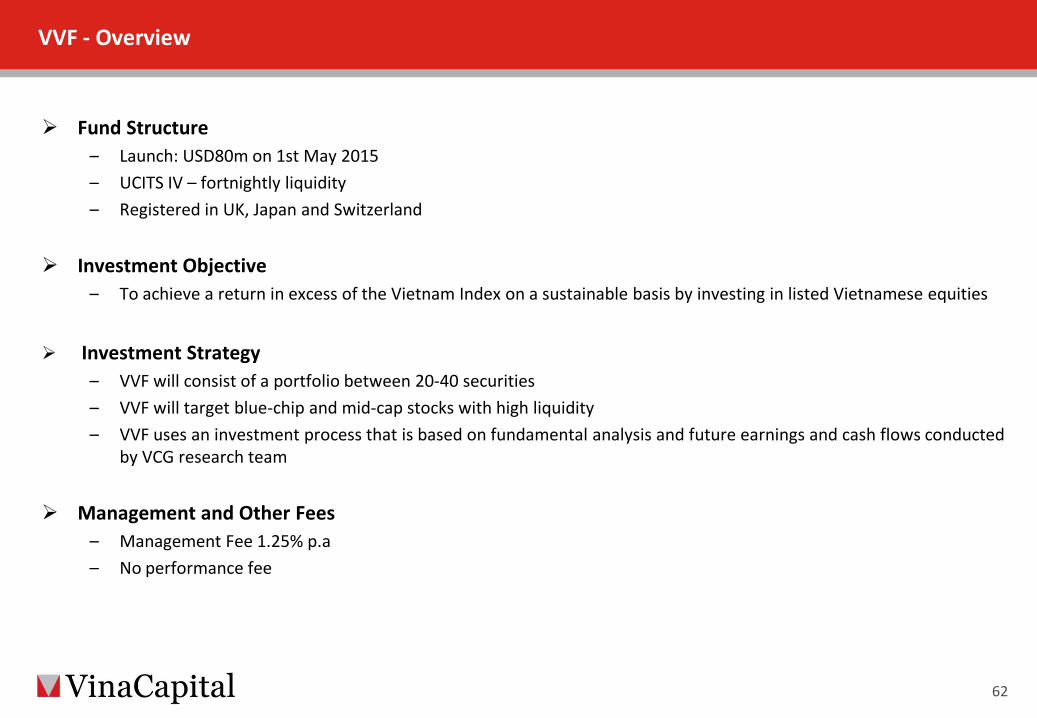
Fund Structure – Launch: USD80m on 1st May 2015 – UCITS IV – fortnightly liquidity – Registered in UK, Japan and Switzerland
Investment Objective – To achieve a return in excess of the Vietnam Index on a sustainable basis by investing in listed Vietnamese equities
Investment Strategy
– VVF will consist of a portfolio between 20-40 securities – VVF will target blue-chip and mid-cap stocks with high liquidity – VVF uses an investment process that is based on fundamental analysis and future earnings and cash flows conducted
by VCG research team
Management and Other Fees – Management Fee 1.25% p.a – No performance fee
62

Philosophy and process
We are long-term holders of companies that are best positioned to benefit from the ongoing structural changes and growth in Vietnam.
We believe we have a competitive advantage through the strength of our process and the depth of knowledge of our investment team in both the private and public equity markets.
Focus on a more diverse universe of stocks, including smaller cap companies not incorporated into other strategies of other funds.
63
Stock Screening Mechanism
64
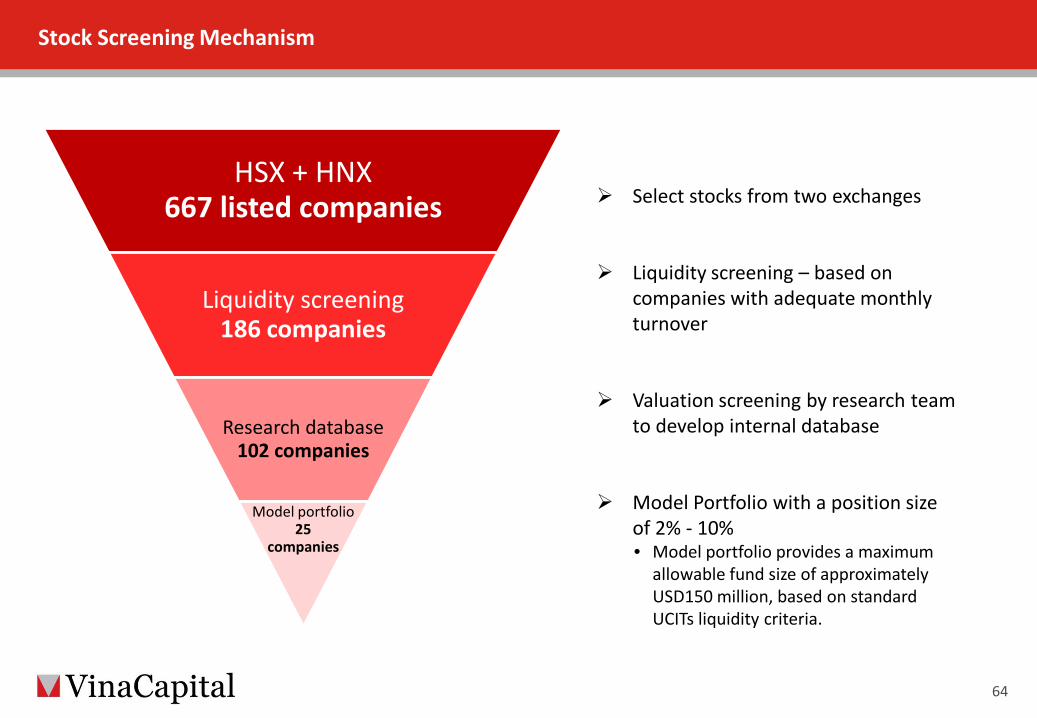
HSX + HNX 667 listed companies
Liquidity screening 186 companies
Research database 102 companies
Model portfolio 25
companies
Select stocks from two exchanges
Liquidity screening – based on companies with adequate monthly turnover
Valuation screening by research team to develop internal database
Model Portfolio with a position size of 2% - 10% • Model portfolio provides a maximum
allowable fund size of approximately USD150 million, based on standard UCITs liquidity criteria.
One of Vietnam’s most experienced research platforms
65
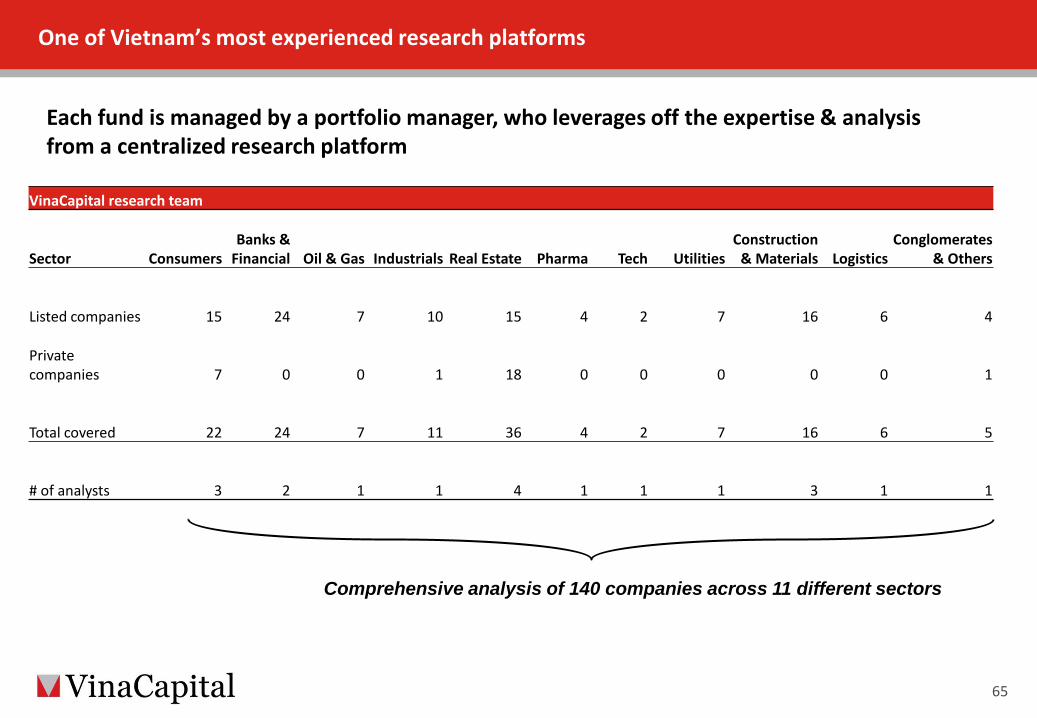
Each fund is managed by a portfolio manager, who leverages off the expertise & analysis from a centralized research platform
VinaCapital research team
Sector Consumers Banks &
Financial Oil & Gas Industrials Real Estate Pharma Tech Utilities Construction
& Materials Logistics Conglomerates
& Others
Listed companies 15 24 7 10 15 4 2 7 16 6 4
Private companies 7 0 0 1 18 0 0 0 0 0 1
Total covered 22 24 7 11 36 4 2 7 16 6 5
# of analysts 3 2 1 1 4 1 1 1 3 1 1
Comprehensive analysis of 140 companies across 11 different sectors
VNI listed portfolio performance
66
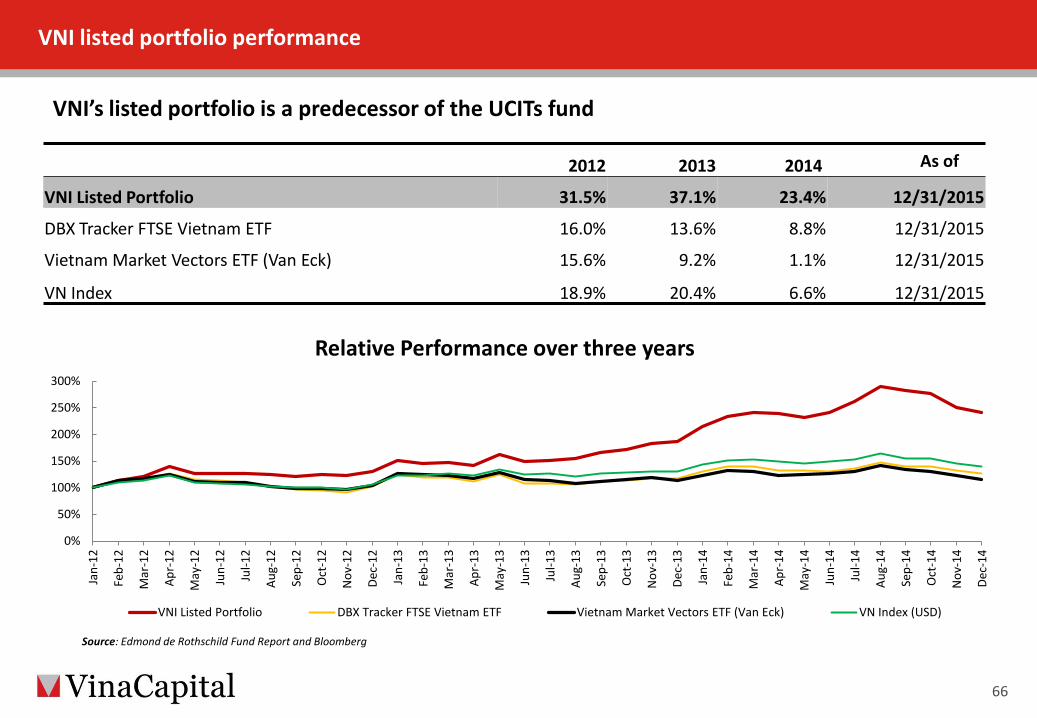
VNI’s listed portfolio is a predecessor of the UCITs fund
2012 2013 2014 As of
VNI Listed Portfolio 31.5% 37.1% 23.4% 12/31/2015
DBX Tracker FTSE Vietnam ETF 16.0% 13.6% 8.8% 12/31/2015
Vietnam Market Vectors ETF (Van Eck) 15.6% 9.2% 1.1% 12/31/2015
VN Index 18.9% 20.4% 6.6% 12/31/2015
Source: Edmond de Rothschild Fund Report and Bloomberg
0%
50%
100%
150%
200%
250%
300%
Jan-
12
Feb-
12
Mar
-12
Apr-
12
May
-12
Jun-
12
Jul-1
2
Aug-
12
Sep-
12
Oct
-12
Nov
-12
Dec-
12
Jan-
13
Feb-
13
Mar
-13
Apr-
13
May
-13
Jun-
13
Jul-1
3
Aug-
13
Sep-
13
Oct
-13
Nov
-13
Dec-
13
Jan-
14
Feb-
14
Mar
-14
Apr-
14
May
-14
Jun-
14
Jul-1
4
Aug-
14
Sep-
14
Oct
-14
Nov
-14
Dec-
14
Relative Performance over three years
VNI Listed Portfolio DBX Tracker FTSE Vietnam ETF Vietnam Market Vectors ETF (Van Eck) VN Index (USD)
The information contained herein has been prepared by VinaCapital Limited (the “Company") and is subject to updating, completion, revision, further verification and amendment without notice. The information contained herein has not been approved by any listing authority or any investment regulator. The information does not constitute or form part of any offer for sale or solicitation of any offer to buy or subscribe for any securities nor shall they or any part of them form the basis of or be relied on in connection with, or act as any inducement to enter into, any contract or commitment whatsoever. No undertaking, representation, warranty or other assurance, express or implied, is made or given by or on behalf of the Group or any of its directors, officers, partners, employees, agents or advisers or any other person as to the accuracy or completeness of the information or opinions contained herein and no responsibility or liability is accepted by any of them for any such information or opinions or for any errors, omissions, misstatements, negligence or otherwise for any other communication written or otherwise. The information herein may not be reproduced, re-distributed or passed to any other person or published in whole or in part for any purpose. By accepting receipt of this document, you agree to be bound by the limitations and restrictions set out above. Neither these pages nor any copy of them may be taken or transmitted into or distributed in any jurisdiction where the distribution of such material would be prohibited under the jurisdiction’s applicable securities laws. Any failure to comply with this restriction may constitute a violation of national securities laws.
Disclaimer
67
68
VinaCapital 17th floor, Sun Wah Tower 115 Nguyen Hue, District 1, Ho Chi Minh City, Vietnam P: +84 8 3821 9930 F: +84 8 3821 9931 Email: [email protected] Website: www.vinacapital.com
Ho Chi Minh City Hanoi Danang Nha Trang Singapore Yangon