PUBLIC DOCUMENT: TRADE SECRET …...Resume Schedule 1 Index of Schedules Schedule 2 Summary of 2016...
328
PUBLIC DOCUMENT: TRADE SECRET INFORMATION EXCISED – PUBLIC DATA – Direct Testimony and Schedules Anne E. Heuer Before the Minnesota Public Utilities Commission State of Minnesota In the Matter of the Application of Northern States Power Company for Authority to Increase Rates for Electric Service in Minnesota Docket No. E002/GR-15-826 Exhibit___(AEH-1) 2016 Test Year Overall Revenue Requirements Rate Base Income Statement Rate Rider Recovery 2016-2018 November 2, 2015
Transcript of PUBLIC DOCUMENT: TRADE SECRET …...Resume Schedule 1 Index of Schedules Schedule 2 Summary of 2016...

PUBLIC DOCUMENT: TRADE SECRET INFORMATION EXCISED – PUBLIC DATA –
Direct Testimony and Schedules Anne E. Heuer
Before the Minnesota Public Utilities Commission State of Minnesota
In the Matter of the Application of Northern States Power Company for Authority to Increase Rates for Electric Service in Minnesota
Docket No. E002/GR-15-826 Exhibit___(AEH-1)
2016 Test Year Overall Revenue Requirements
Rate Base Income Statement
Rate Rider Recovery 2016-2018
November 2, 2015
PUBLIC DOCUMENT: TRADE SECRET INFORMATION EXCISED – PUBLIC DATA –
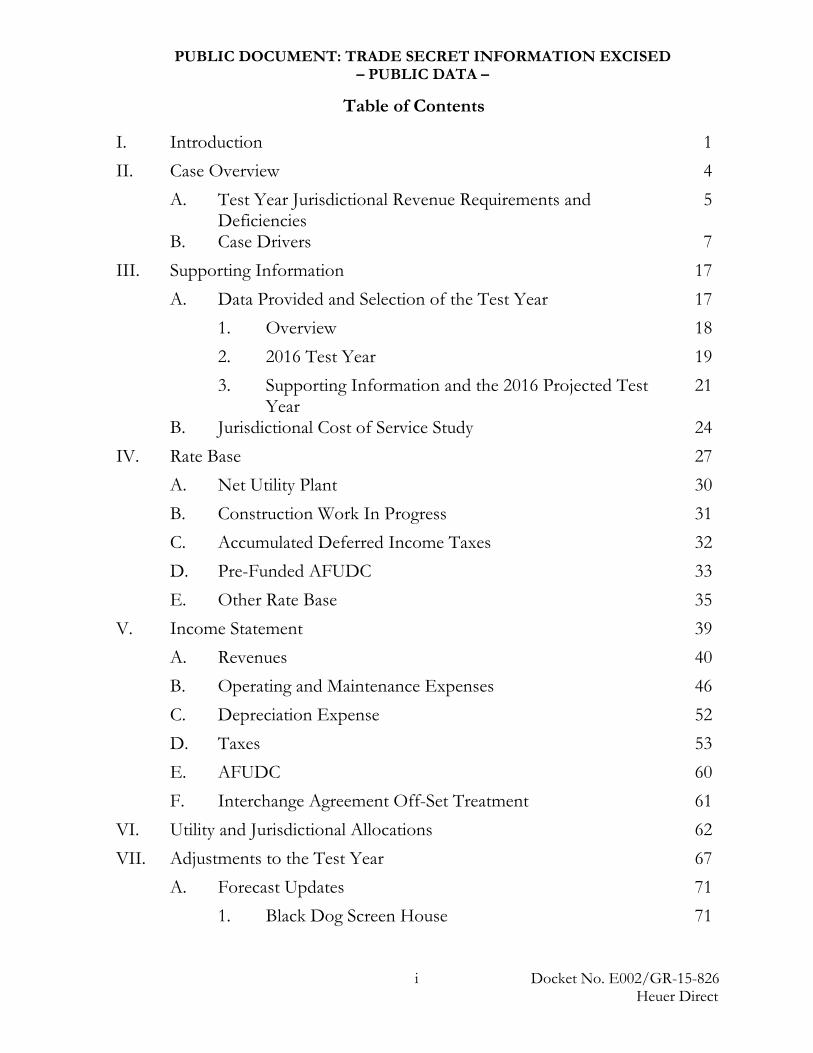
Table of Contents
I. Introduction 1 II. Case Overview 4 A. Test Year Jurisdictional Revenue Requirements and
Deficiencies 5
B. Case Drivers 7 III. Supporting Information 17 A. Data Provided and Selection of the Test Year 17 1. Overview 18 2. 2016 Test Year 19 3. Supporting Information and the 2016 Projected Test
Year 21
B. Jurisdictional Cost of Service Study 24 IV. Rate Base 27 A. Net Utility Plant 30 B. Construction Work In Progress 31 C. Accumulated Deferred Income Taxes 32 D. Pre-Funded AFUDC 33 E. Other Rate Base 35 V. Income Statement 39 A. Revenues 40 B. Operating and Maintenance Expenses 46 C. Depreciation Expense 52 D. Taxes 53 E. AFUDC 60 F. Interchange Agreement Off-Set Treatment 61 VI. Utility and Jurisdictional Allocations 62 VII. Adjustments to the Test Year 67 A. Forecast Updates 71 1. Black Dog Screen House 71
i Docket No. E002/GR-15-826 Heuer Direct

PUBLIC DOCUMENT: TRADE SECRET INFORMATION EXCISED – PUBLIC DATA –
B. Traditional Adjustments 71 2. Advertising 71 3. Customer Deposits 73 4. Dues – Chamber of Commerce 73 5. Dues – Professional Association 74 6. Economic Development Administration 74 7. Economic Development Donations 76 8. Foundation Administration 77 9. Foundation and Other Charitable Contributions 77 10. Incentive Compensation 78 11. Investor Relations 78 12. Monticello LCM/EPU Return 79 13. Nobles Amount over Certificate of Need 79 14. Non-Qualified Pension Expense 80 C. Rate Case Adjustments 81 15. Aviation 81 16. Bad Debt Expense 82 17. CIP Approved Program Costs 82 18. CIP Incentive 83 19. Employee Expenses 84 20. Like Kind Exchange Program 84 21. Nuclear Retention 85 22. Other Revenue Three-Year Average 85 23. Retiree Medical Discount Rate 86 24. Pension Expense Smoothing 87 25. Remaining Life Depreciation Study – NSPM 87 26. Remaining Life Depreciation Study – NSPW 88 27. Trading – Asset Based Margin 89 28. Trading – Non-Asset Based Administration 89 29. Trading – Non-Asset Based Margin 90
ii Docket No. E002/GR-15-826 Heuer Direct
PUBLIC DOCUMENT: TRADE SECRET INFORMATION EXCISED – PUBLIC DATA –
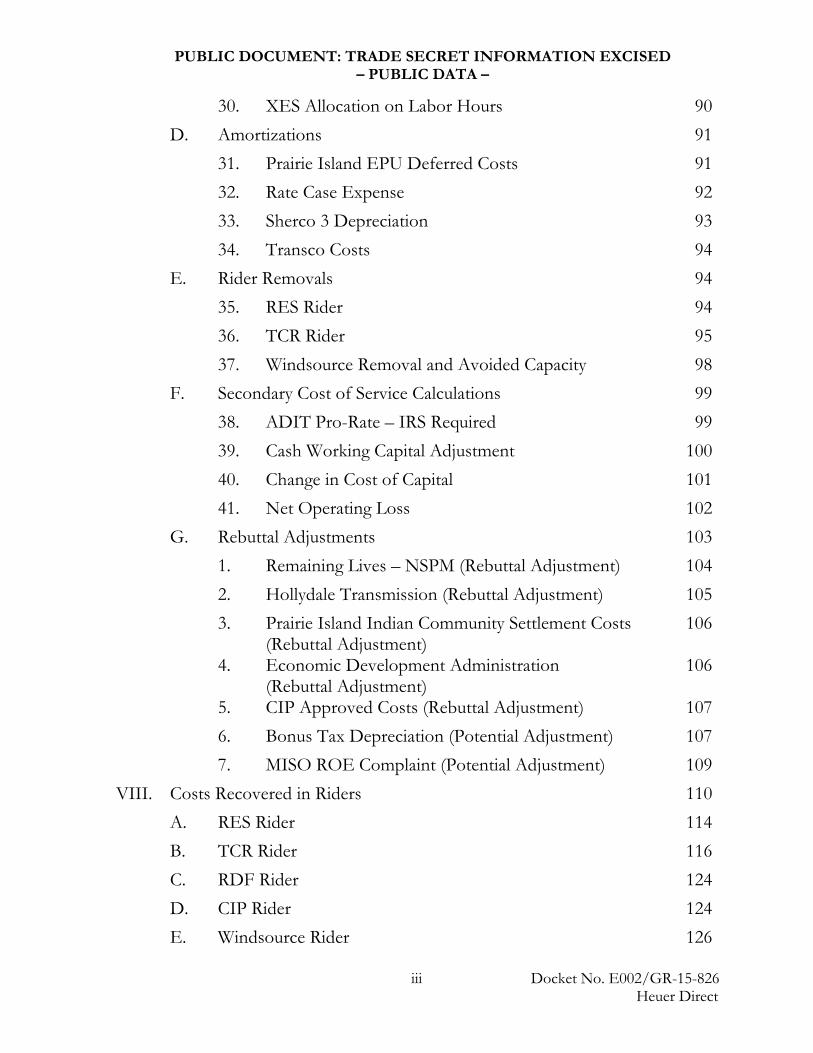
30. XES Allocation on Labor Hours 90 D. Amortizations 91
31. Prairie Island EPU Deferred Costs 91 32. Rate Case Expense 92 33. Sherco 3 Depreciation 93 34. Transco Costs 94
E. Rider Removals 94 35. RES Rider 94 36. TCR Rider 95 37. Windsource Removal and Avoided Capacity 98 F. Secondary Cost of Service Calculations 99 38. ADIT Pro-Rate – IRS Required 99 39. Cash Working Capital Adjustment 100 40. Change in Cost of Capital 101 41. Net Operating Loss 102 G. Rebuttal Adjustments 103 1. Remaining Lives – NSPM (Rebuttal Adjustment) 104 2. Hollydale Transmission (Rebuttal Adjustment) 105 3. Prairie Island Indian Community Settlement Costs
(Rebuttal Adjustment) 106
4. Economic Development Administration (Rebuttal Adjustment)
106
5. CIP Approved Costs (Rebuttal Adjustment) 107 6. Bonus Tax Depreciation (Potential Adjustment) 107 7. MISO ROE Complaint (Potential Adjustment) 109 VIII. Costs Recovered in Riders 110 A. RES Rider 114 B. TCR Rider 116 C. RDF Rider 124 D. CIP Rider 124 E. Windsource Rider 126
iii Docket No. E002/GR-15-826 Heuer Direct
PUBLIC DOCUMENT: TRADE SECRET INFORMATION EXCISED – PUBLIC DATA –
F. Fuel Clause Rider (FCR) 126 IX. Compliance with Prior Commission Orders 127 A. General Rate Case – Docket No. E002/GR-13-868 127 1. Amortization of Reserve Surplus for Transmission,
Distribution and General Assets 127
2. Monticello Prudence Revenue Costs 128 3. Alliant Billing 128 B. General Rate Case – Docket No. E002/GR-12-961 128 1. Mapping to FERC Form 1 128 2. Changes Between Actuals and 2016 Test Year 129 3. Financial Labeling 129 4. Wholesale Customer Study 131 C. Depreciation 132 D. Decommissioning 132 E. Other Compliance Requirements 132 1. Incentive Compensation Refunds 132 2. Non-Asset Based Trading Activities–Fully Allocated
Cost Study and Incremental Cost Study 133
3. Nuclear Fuel Outage Costs 134 4. Capacity Cost Report 134 5. Lobbyist Compensation 135 6. North Dakota Income Tax Credits 135 7. Recurring Compliance Reporting Requirements 138 X. Conclusion 140
Schedules
Resume Schedule 1 Index of Schedules Schedule 2 Summary of 2016 Revenue Requirements Schedule 3
Cost of Service Study Summary for 2016 Test Year Schedule 4
iv Docket No. E002/GR-15-826 Heuer Direct

PUBLIC DOCUMENT: TRADE SECRET INFORMATION EXCISED – PUBLIC DATA –
Labeling of Financial Sources Schedule 5
Detailed Case Drivers Schedule 6
Comparison of Detailed Rate Base Components Schedule 7
Comparison of Detailed Income Statement Components Schedule 8
CWIP and ADIT Summary Schedule 9
2016 Rate Base Adjustment Schedule Schedule 10
2016 Income Statement Adjustment Schedule Schedule 11
Wholesale Customers Study Schedule 12
Capacity Cost Study Schedule 13
Nuclear Outage Accounting Schedule 14
Advertising Schedule 15
Organizational Dues Schedule 16
Economic Development Cost-Benefit Analysis Schedule 17
Non-Asset Based Trading Cost Study Schedule 18
Production Tax Credits Schedule 19
Monticello LCM/EPU Return Schedule 20
PI EPU Recovery Schedule 21
Rate Case Expense Amortization Schedule 22
ADIT Pro-Rate Schedule 23
Net Operating Loss Schedule 24
Fuel Reconciliation Schedule 25
NSPM Remaining Life – Rebuttal Adjustment Schedule 26
TCR Rider Roll-In Timeline Schedule 27
Pre-Filed Discovery Appendix A
v Docket No. E002/GR-15-826 Heuer Direct
PUBLIC DOCUMENT: TRADE SECRET INFORMATION EXCISED – PUBLIC DATA –
I. INTRODUCTION 1
2
Q. PLEASE STATE YOUR NAME AND OCCUPATION. 3
A. My name is Anne E Heuer. I am the Director of Revenue Analysis for Xcel 4
Energy Services Inc. (XES or the Service Company). My qualifications and 5
experience are summarized in my resume provided with my testimony as 6
Exhibit___(AEH-1), Schedule 1. 7
8
Q. WHAT IS THE PURPOSE OF YOUR TESTIMONY IN THIS PROCEEDING? 9
A. I am testifying on behalf of Northern States Power Company, doing business 10
as Xcel Energy (Xcel Energy, NSPM, or the Company). I provide testimony 11
supporting the Company’s financial data and its requests for a general rate 12
increase and interim rate increase for the State of Minnesota retail electric 13
jurisdiction. My testimony also addresses the Minnesota jurisdiction’s electric 14
operations 2016 test year retail deficiency of $194.612 million, with an overall 15
revenue requirement of $3.229 billion determined by the cost of service for 16
the 2016 budget test year ending December 31, 2016. 17
18
My testimony also supports the 2016 and 2017 requested interim increases 19
discussed in the Petition for Interim Rates. Support for the 2017 interim rate 20
increase as a part of our multi-year rate plan is also discussed in the Direct 21
Testimony of Company witness Mr. Aakash Chandarana. 22
23
In addition, I explain our treatment of riders, and provide a description of 24
cost changes, including the data we provide and our selection of the test year. 25
I also identify certain compliance issues reflected in our Application. Further, 26
I present: 27
1 Docket No. E002/GR-15-826 Heuer Direct
PUBLIC DOCUMENT: TRADE SECRET INFORMATION EXCISED – PUBLIC DATA –
• our jurisdictional cost of service study and the revenue requirement 1
effects of our utility and jurisdictional allocations; 2
• our revenue requirement, including rate base and adjustments and 3
income statement and adjustments; and 4
• our 2016 revenue requirements. 5
6
I relied on information provided by other witnesses in this proceeding to 7
develop many of the test year revenue requirement adjustments discussed in 8
my Direct Testimony. 9
10
Q. HOW IS THE REST OF YOUR DIRECT TESTIMONY ORGANIZED? 11
A. I present my testimony in the following sections: 12
• Section II, Case Overview, summarizes our 2016 test year jurisdictional 13
revenue requirement and discusses the key drivers of cost increases in 14
2016. 15
• Section III, Supporting Information, provides information related to the 16
data provided in our application, the selection of the test year, and the 17
jurisdictional cost of service study. 18
• Section IV, Rate Base, identifies and explains the components of rate 19
base, and supports the reasonableness of the Company’s projected 20
2016 test year rate base. 21
• Section V, Income Statement, identifies and explains the major 22
components of the income statement and supports the reasonableness 23
of the Company’s proposed 2016 test year income statement. 24
• Section VI, Utility and Jurisdictional Allocations, explains why it is 25
necessary for the Company to allocate costs among its affiliates and 26
2 Docket No. E002/GR-15-826 Heuer Direct
PUBLIC DOCUMENT: TRADE SECRET INFORMATION EXCISED – PUBLIC DATA –
between jurisdictions, and describes the utility and jurisdictional 1
allocators that are used in determining the test year revenue 2
requirement. 3
• Section VII, Adjustments to the Test Year, presents all adjustments 4
affecting the test year revenue requirement, providing both rate base 5
and income statement impacts. 6
• Section VIII, Costs Recovered in Riders, presents our proposed treatment 7
of costs recovered in riders during the multi-year rate plan period, 8
providing details about which riders we propose to continue to use and 9
costs we propose to move into base rates. 10
• Section IX, Compliance with Prior Commission Orders, provides information 11
related to specific requirements from prior Commission Orders that 12
have not been addressed elsewhere in my testimony. 13
• Section X, Conclusion, summarizes our request. 14
15
An index of the Schedules to my Direct Testimony is provided as 16
Exhibit___(AEH-1), Schedule 2. 17
18
Q. ARE ALL OF THE DOLLAR VALUES PRESENTED IN YOUR TESTIMONY 19
JURISDICTIONALIZED TO STATE OF MINNESOTA ELECTRIC JURISDICTION? 20
A. While most of the dollar values presented in my testimony are 21
jurisdictionalized to State of Minnesota Electric Jurisdiction, there are several 22
instances where dollars are either Total Company, or net of Interchange 23
Agreement billings to Northern States Power Company-Wisconsin (NSPW). 24
Dollar values that are net of Interchange Agreement billings to NSPW are 25
labeled as (IA). 26
27
3 Docket No. E002/GR-15-826 Heuer Direct

PUBLIC DOCUMENT: TRADE SECRET INFORMATION EXCISED – PUBLIC DATA –
Q. DO YOU PROVIDE INFORMATION IN COMPLIANCE WITH PAST COMMISSION 1
ORDERS AND COMPANY COMMITMENTS? 2
A. Yes. Throughout my testimony I note where I am providing information 3
related to prior Commission Orders and Company commitments. In Section 4
IX, I provide additional information related to compliance with prior 5
Commission Orders that have not been addressed elsewhere in my testimony. 6
7
Q. DO YOU PROVIDE ANY ADDITIONAL INFORMATION RELATED TO THE 8
REVENUE REQUIREMENT? 9
A. Yes. Appendix A provides a list of relevant information requests from our 10
last two rate cases, Docket Nos. E002/GR-12-961 and E002/GR-13-868, 11
that I respond to in this case, with new time frames as appropriate to reflect 12
the November 2, 2015 filing date of this case. The list indicates where the 13
responsive information is included in my testimony or schedules, or if it is 14
included in Appendix A. 15
16
II. CASE OVERVIEW 17
18
Q. WHAT TOPICS DO YOU DISCUSS IN THIS SECTION OF YOUR TESTIMONY? 19
A. In this section, I will: 20
• present the jurisdictional revenue requirement and revenue deficiencies 21
for Minnesota for the 2016 test year; 22
• present a summary comparison of the costs in the 2016 test year to the 23
costs approved in our last rate case, which include costs in the 2014 24
test year and the 2015 Step increase; and 25
4 Docket No. E002/GR-15-826 Heuer Direct

PUBLIC DOCUMENT: TRADE SECRET INFORMATION EXCISED – PUBLIC DATA –
• provide an explanation of the primary sources of the changes in overall 1
costs, including plant related costs and O&M costs, and the rate 2
moderation tools approved as a part of our last rate case. 3
4
A. Test Year Jurisdictional Revenue Requirements and Deficiencies 5
Q. WHAT IS THE 2016 TEST YEAR JURISDICTIONAL OVERALL REVENUE 6
REQUIREMENT AND REVENUE DEFICIENCY? 7
A. The overall jurisdiction revenue requirement for the 2016 test year is $3.229 8
billion. The 2016 test year revenue deficiency is $194.612 million. The 2016 9
test year revenue deficiency amount represents a 6.41 percent overall increase 10
in retail revenues from base rates compared to projected 2016 retail revenues 11
at present rates. A summary of the 2016 revenue requirement is provided in 12
Exhibit___(AEH-1) Schedule 3, Summary of Revenue Requirements, Test 13
Year Ending December 31, 2016. The calculation of these amounts is 14
provided in Exhibit___(AEH-1) Schedule 4, Cost of Service Study for 15
Proposed 2016 Test Year. 16
17
Q. WHAT IS THE AMOUNT OF THE INTERIM RATE REVENUE DEFICIENCY IN 2016? 18
A. The Interim Rate Petition (Petition) supports an interim revenue deficiency 19
based on the 2016 test year of $163.670 million, which results in a proposed 20
interim rate increase of 5.50 percent beginning January 1, 2016. As discussed 21
in the Direct Testimony of Mr. Chandarana and in the Petition, the Company 22
is also proposing an interim rate adjustment for 2017 as part of its multi-year 23
rate plan filing. The 2017 interim rate revenue deficiency includes an 24
additional $44.902 million beginning on January 1, 2017, which equates to an 25
additional interim rate increase of 1.51 percent in 2017. 26
27
5 Docket No. E002/GR-15-826 Heuer Direct
PUBLIC DOCUMENT: TRADE SECRET INFORMATION EXCISED – PUBLIC DATA –
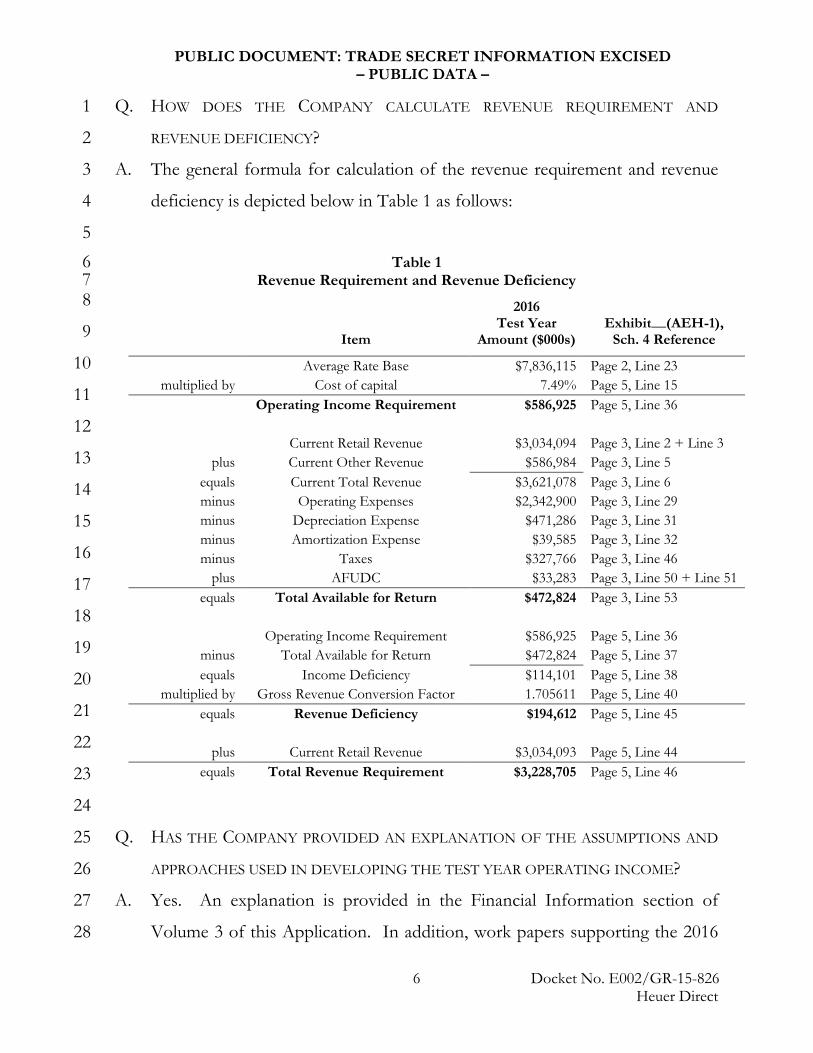
Q. HOW DOES THE COMPANY CALCULATE REVENUE REQUIREMENT AND 1
REVENUE DEFICIENCY? 2
A. The general formula for calculation of the revenue requirement and revenue 3
deficiency is depicted below in Table 1 as follows: 4
5 Table 1 6
Revenue Requirement and Revenue Deficiency 7 8
9
10
11
12
13
14
15
16
17
18
19
20
21
22
23
24
Q. HAS THE COMPANY PROVIDED AN EXPLANATION OF THE ASSUMPTIONS AND 25
APPROACHES USED IN DEVELOPING THE TEST YEAR OPERATING INCOME? 26
A. Yes. An explanation is provided in the Financial Information section of 27
Volume 3 of this Application. In addition, work papers supporting the 2016 28
Item
2016 Test Year
Amount ($000s) Exhibit__(AEH-1),
Sch. 4 Reference
Average Rate Base $7,836,115 Page 2, Line 23 multiplied by Cost of capital 7.49% Page 5, Line 15
Operating Income Requirement $586,925 Page 5, Line 36 Current Retail Revenue $3,034,094 Page 3, Line 2 + Line 3
plus Current Other Revenue $586,984 Page 3, Line 5 equals Current Total Revenue $3,621,078 Page 3, Line 6 minus Operating Expenses $2,342,900 Page 3, Line 29 minus Depreciation Expense $471,286 Page 3, Line 31 minus Amortization Expense $39,585 Page 3, Line 32 minus Taxes $327,766 Page 3, Line 46
plus AFUDC $33,283 Page 3, Line 50 + Line 51 equals Total Available for Return $472,824 Page 3, Line 53
Operating Income Requirement $586,925 Page 5, Line 36
minus Total Available for Return $472,824 Page 5, Line 37 equals Income Deficiency $114,101 Page 5, Line 38
multiplied by Gross Revenue Conversion Factor 1.705611 Page 5, Line 40 equals Revenue Deficiency $194,612 Page 5, Line 45
plus Current Retail Revenue $3,034,093 Page 5, Line 44
equals Total Revenue Requirement $3,228,705 Page 5, Line 46
6 Docket No. E002/GR-15-826 Heuer Direct
PUBLIC DOCUMENT: TRADE SECRET INFORMATION EXCISED – PUBLIC DATA –
test-year cost of service are provided in Volumes 4A and 4B of this 1
Application (Test Year Work Papers). 2
3
B. Case Drivers 4
Q. HAVE YOU PREPARED A COMPARISON OF THE COSTS IN THE 2016 TEST YEAR 5
TO THE 2014 TEST YEAR WITH THE 2015 STEP? 6
A. Yes. Consistent with prior rate cases, I provide an explanation of the key cost 7
drivers of the deficiency using a comparison of the 2016 test year with the 8
combination of the 2014 test year and 2015 Step from our last electric rate 9
case, Docket No. E002/GR-13-868. My analysis differs from the Direct 10
Testimony analyses of the Company’s business area witnesses, who primarily 11
compare cost changes in their 2016 budgets to prior years’ total actual costs 12
and forecasts (not revenue deficiencies). Therefore, my discussion of key cost 13
drivers reflects dollar values that are, in large part, different from their 14
discussions. 15
16
Q. HAVE YOU PREPARED A SCHEDULE IDENTIFYING THE CHANGES IN THE MAJOR 17
COST ELEMENTS SINCE THE LAST RATE CASE? 18
A. Yes. I provide Exhibit___(AEH-1), Schedule 6, which provides a Summary 19
of Major Cost Elements for 2016 Test Year (an overview of the major 20
revenue requirement elements), and a Summary of Major Cost Drivers 21
(identification of case drivers for the 2016 test year), including: 22
• Capital Recovery for additional rate base investment; a reduction for 23
Energy Supply investments, other rate base items, and NOL/federal 24
tax items; application of the theoretical reserve; and increases in 25
property taxes, collectively increasing the 2016 revenue deficiency by 26
approximately $159.6 million; 27
7 Docket No. E002/GR-15-826 Heuer Direct
PUBLIC DOCUMENT: TRADE SECRET INFORMATION EXCISED – PUBLIC DATA –
• Operating Expense, including a reduction in Nuclear O&M offset by 1
increases in Transmission, Distribution, and Administrative and 2
General; increases in property taxes; and decreases in amortizations 3
and payroll taxes, collectively increasing the revenue deficiency by 4
approximately $45.5 million; and 5
• Total margins, which collectively decrease the deficiency by 6
approximately $10.5 million. 7
8
Exhibit___(AEH-1), Schedule 6 also provides a Summary of Major Cost 9
Drivers bridge schedule to the cost of service, and an illustration of Major 10
Carryover Projects from our last rate case (Docket E002/GR-13-868). In 11
addition to the discussion in this Section, support for our proposed increase 12
in rates for the 2016 test year is provided in the Direct Testimonies of the 13
Company’s business area witnesses and the Direct Testimony of Company 14
witness Mr. Gregory J. Robinson. 15
16
Q. PLEASE DESCRIBE THE REVENUE REQUIREMENT IMPACT FOR THE PRINCIPAL 17
CHANGES IN CAPITAL PLANT RELATED COSTS. 18
A. Table 2 below compares the 2016 test year revenue requirements with the 19
comparable revenue requirements for the 2014 test year and the 2015 Step, by 20
category, for capital plant related costs as shown on Exhibit___(AEH), 21
Schedule 6 at Page 2. 22
23
8 Docket No. E002/GR-15-826 Heuer Direct

PUBLIC DOCUMENT: TRADE SECRET INFORMATION EXCISED – PUBLIC DATA –
Table 2 1 Capital Related Cost Changes 2
3
4
5
6
7
8
9
10
11
12
13
14
15
16
Q. PLEASE DESCRIBE THE PRINCIPAL CHANGES IN NUCLEAR CAPITAL COSTS. 17
A. The 2016 revenue requirements include a $57.5 million (IA) increase in 18
Nuclear. This increase reflects revenue requirement increases related to 19
having certain large 2015 Step projects in service for a full year in 2016, 20
including an $11.2 million (IA) increase for the Monticello Life Cycle 21
Management/Extended Power Uprate (LCM/EPU) project and a $5.5 22
million (IA) increase for the Prairie Island Unit 2 Generator and GSU 23
Transformer. These changes are illustrated in Exhibit___(AEH-1), Schedule 24
6 at Page 5. The Nuclear capital increase also reflects investments to comply 25
with NRC mandates, including its Fukushima program and fire safety 26
requirements, and to help support the ongoing reliability of the Prairie Island 27
plant. Company witness Mr. Timothy J. O’Connor provides additional 28
Cost Category Increase
(Decrease) $ in Millions
% Change in Average
Rate Base Nuclear (IA) $57.5 36.0%
Energy Supply (IA) ($3.4) -2.1%
Wind (IA) $12.7 8.0%
Transmission (IA) net of TCR $18.8 11.8%
Distribution $13.0 8.1%
General & Intangible $25.9 16.2%
Theoretical Reserve1 $26.1 16.3%
Other Rate Base ($2.6) -1.7%
NOL and Fed Tax Items ($6.2) -3.9%
Return on Equity $20.0 12.6%
Capital Structure & Debt ($2.1) -1.3%
Total $159.6 100.0%
9 Docket No. E002/GR-15-826 Heuer Direct
PUBLIC DOCUMENT: TRADE SECRET INFORMATION EXCISED – PUBLIC DATA –
information regarding nuclear plant capital improvements in his Direct 1
Testimony. 2
3
Q. WHAT ARE THE PRINCIPAL CHANGES IN ENERGY SUPPLY AND WIND CAPITAL 4
COSTS? 5
A. The 2016 test year includes a $12.7 million (IA) increase related primarily to 6
placing the Pleasant Valley and Border Winds projects in service at the end of 7
2015, as illustrated by Exhibit___(AEH-1), Schedule 6 at Page 5. In addition, 8
the Company will be placing the Courtenay Wind Farm in service in 2016, but 9
anticipates that costs associated with this project will remain in the Renewable 10
Energy Standard (RES) Rider, as described in the Direct Testimony of Mr. 11
Aakash H. Chandarana. As a result of devoting substantial resources to these 12
projects, Energy Supply capital investments are otherwise reduced by $3.4 13
million (IA) for the 2016 test year. Energy Supply and Wind projects are 14
discussed in the Direct Testimony of Mr. Steven H. Mills. 15
16
Q. PLEASE DESCRIBE THE PRINCIPAL CHANGES IN TRANSMISSION CAPITAL COSTS. 17
A. The 2016 test year includes an $18.8 million (IA) revenue requirement 18
increase associated with Transmission, net of the Transmission Cost Recovery 19
(TCR) Rider. For Transmission, most of the large capital projects, particularly 20
the CapX2020 projects, are recovered in Minnesota through the TCR Rider. 21
However, a portion of the deficiency is related to capital investments in 22
reliability projects. The 2016 deficiency related to Transmission also reflects 23
an $11.4 million increase in billings from NSPW through the Interchange 24
Agreement as compared to the last electric rate case, offset by $44.2 million in 25
transmission related revenue. This is due to significant transmission projects 26
in both NSPM and NSPW. 27
28 10 Docket No. E002/GR-15-826
Heuer Direct

PUBLIC DOCUMENT: TRADE SECRET INFORMATION EXCISED – PUBLIC DATA –
Q. PLEASE IDENTIFY THE PRINCIPAL CHANGES IN DISTRIBUTION CAPITAL COSTS. 1
A. Approximately $13.0 million of the 2016 revenue deficiency is due to 2
Distribution capital. Company witness Ms. Kelly A. Bloch describes the 3
distribution capital needs relating to asset health such as pole and cable 4
replacement, extending service to new residential and business customers, 5
capacity investment for greater reliability, and fleet, tools, and equipment. Ms. 6
Bloch also describes our LED street light replacement program, which will 7
commence in 2016. 8
9
Q. WHAT ARE THE PRINCIPAL CHANGES IN GENERAL & INTANGIBLE CAPITAL 10
COSTS? 11
A. Approximately $25.9 million of the 2016 revenue deficiency is due to General 12
& Intangible capital investments, which consist primarily of Information 13
Technology implemented by our Business Systems business area. Company 14
witness Mr. David C. Harkness describes the capital needs relating to cyber 15
security, aging technology, enhanced capabilities, and the implementation of 16
the Work and Asset Management portion of our Productivity Through 17
Technology initiative. 18
19
Q. WHAT OTHER CAPITAL COSTS CHANGED? 20
A. Revenue requirements associated with the Transmission, Distribution, and 21
General Plant categories (TDG) theoretical reserve increased by $26.1 million 22
(IA) due to the application of 50 percent and 30 percent of the reserve in 23
2014 and 2015, respectively, versus 20 percent in 2016. This application of 24
rate moderation was approved by the Commission in our prior rate case 25
(Docket E002/GR-13-868). We also experienced a partially offsetting 26
11 Docket No. E002/GR-15-826 Heuer Direct

PUBLIC DOCUMENT: TRADE SECRET INFORMATION EXCISED – PUBLIC DATA –
reduction in the revenue deficiency due to the net operating loss, federal tax 1
items, and other rate base items. 2
3
Q. PLEASE DESCRIBE THE PRINCIPAL CHANGES IN COST OF CAPITAL. 4
A. We anticipate a $20 million increase related to return on equity (ROE), and a 5
$2.1 million decrease due primarily to a decline in the cost of long term debt. 6
Company witness Mr. Brian J. Van Abel describes the capital structure and 7
costs of debt in his Direct Testimony. Company witness Mr. James M. Coyne 8
of Concentric Energy Advisors, Inc. discusses the ROE. I provide additional 9
detail on how these relate to the cost of service in Section V, Income 10
Statement and Section VII, Adjustments to the Test Year. 11
12
Q. ARE AMORTIZATIONS, DEPRECIATION, AND AFUDC REFLECTED IN THESE 13
CAPITAL DRIVERS? 14
A. Yes. A comparison of the Amortization costs between the 2016 test year and 15
2014 approved level is included in Table 3 below. Capital-related amortization 16
expense generally relates to rider revenue offsets or specific treatment of costs 17
for regulatory purposes as prescribed by the Commission. The Amortization 18
line identified on Exhibit___(AEH-1), Schedule 6 Pages 1 and 2 includes the 19
approved amortization level for rate case expense and Monticello prudence 20
review expense from the 2014 test year and requested rate case amortization 21
expense for the 2016 test year. Table 3 subtotals the capital-related 22
amortizations and case-related amortizations that total the amortization line 23
on the Income Statement. 24
12 Docket No. E002/GR-15-826 Heuer Direct

PUBLIC DOCUMENT: TRADE SECRET INFORMATION EXCISED – PUBLIC DATA –
Table 3 1 Comparison of Amortization Costs 2
3
4
5
6
7
8
9
10
11
12
13
14
15
16
Amortization adjustments are described in detail in Section VII, Adjustments 17
to the Test Year. Compared to the 2014 test year and 2015 Step in the last 18
electric case, this test year has $123.9 million greater depreciation expense (a 19
35.7 percent increase) and $3.9 million greater AFUDC offset (a 13.4 percent 20
increase). These contribute to the revenue requirement calculations related to 21
capital. 22
23
Q. PLEASE DESCRIBE THE PRINCIPAL CHANGES IN TAXES. 24
A. We anticipate a $30.2 million (IA) increase in property taxes, offset somewhat 25
by a $1.9 million decrease in payroll taxes. Company witness Ms. Leanna M. 26
Chapman explains that property taxes continue to trend upward due to the 27
Company’s investments in our system. 28
2014 Test Year
2016 Test Year Difference Comments
Capital-Related Amortizations
RDF Rider (Base Data) $22.7M $35.1M $12.4M RDF Rider revenue offset
SEP Rider (Base Data) $1.5M $ 0.0M ($1.5M) Nuclear Expense in 2016
PI EPU Recovery $2.9M $2.9M $0.0M Adj. 31 Section VII
Sherco 3 Depreciation $0.5M $0.5M $0.0M Adj. 33 Section VII
Black Dog Removal Costs (Base Data) $1.6M $0.0M ($1.6M) Depr. Expense in 2016
Nobles No Return $0.2M $0.0M ($0.2M) Other Revenue in 2016
Subtotal Capital-Related Amortizations $29.4M $38.5M $9.1M
Case-Related Amortizations
Rate Case Expense $1.4M $1.1M (0.3M) Adj. 32 Section VII
Monti Prudence Expense $0.5M $0.0M ($0.5M) Amort .ended pre-2016
Subtotal Case-Related Amortizations $1.9M $1.1M ($0.8M)
Total Income Statement Amortizations $31.3M $39.6M $8.3M
13 Docket No. E002/GR-15-826 Heuer Direct
PUBLIC DOCUMENT: TRADE SECRET INFORMATION EXCISED – PUBLIC DATA –
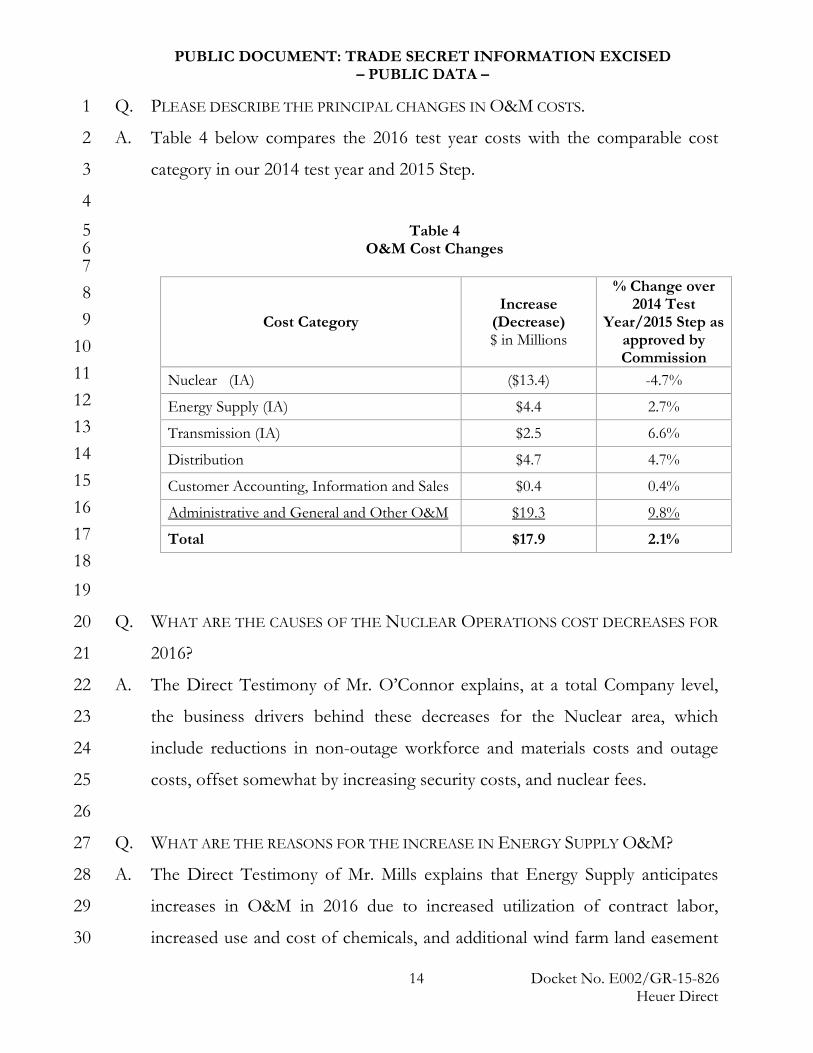
Q. PLEASE DESCRIBE THE PRINCIPAL CHANGES IN O&M COSTS. 1
A. Table 4 below compares the 2016 test year costs with the comparable cost 2
category in our 2014 test year and 2015 Step. 3
4 Table 4 5
O&M Cost Changes 6 7 8 9 10 11 12 13 14 15 16 17 18
19
Q. WHAT ARE THE CAUSES OF THE NUCLEAR OPERATIONS COST DECREASES FOR 20
2016? 21
A. The Direct Testimony of Mr. O’Connor explains, at a total Company level, 22
the business drivers behind these decreases for the Nuclear area, which 23
include reductions in non-outage workforce and materials costs and outage 24
costs, offset somewhat by increasing security costs, and nuclear fees. 25
26
Q. WHAT ARE THE REASONS FOR THE INCREASE IN ENERGY SUPPLY O&M? 27
A. The Direct Testimony of Mr. Mills explains that Energy Supply anticipates 28
increases in O&M in 2016 due to increased utilization of contract labor, 29
increased use and cost of chemicals, and additional wind farm land easement 30
Cost Category Increase
(Decrease) $ in Millions
% Change over 2014 Test
Year/2015 Step as approved by Commission
Nuclear (IA) ($13.4) -4.7%
Energy Supply (IA) $4.4 2.7%
Transmission (IA) $2.5 6.6%
Distribution $4.7 4.7%
Customer Accounting, Information and Sales $0.4 0.4%
Administrative and General and Other O&M $19.3 9.8%
Total $17.9 2.1%
14 Docket No. E002/GR-15-826 Heuer Direct

PUBLIC DOCUMENT: TRADE SECRET INFORMATION EXCISED – PUBLIC DATA –
costs related to the addition of the Pleasant Valley and Border Winds farms in 1
2015. These increases are offset somewhat by decreases in internal labor and 2
materials. 3
4
Q. WHAT ARE THE REASONS FOR THE INCREASE IN TRANSMISSION COSTS? 5
A. Although 2016 Transmission O&M is decreasing from an NSPM business 6
unit expenditure standpoint, the 2016 revenue deficiency associated with 7
Transmission O&M is increasing due to increased billings through the 8
interchange. Mr. Benson describes Transmission O&M in more detail. 9
10
Q. WHAT ARE THE REASONS FOR THE INCREASE IN DISTRIBUTION COSTS? 11
A. The increases in Distribution costs are primarily due to vegetation 12
management and damage prevention (electric locate) costs. Company witness 13
Ms. Bloch describes Distribution operations in more detail. 14
15
Q. PLEASE DESCRIBE OTHER O&M COST DRIVERS. 16
A. Administrative and general expense related to Information Technology (IT) is 17
driven by the same factors described above with respect to IT capital drivers, 18
and as described by Mr. Harkness in his Direct Testimony. Specifically, 19
increased O&M expenses necessary to operate and maintain the new 20
Company’s new General Ledger system (implemented in 2015) and new Work 21
and Asset Management costs (first implemented in 2016) are driving these 22
cost increases. Incentive compensation costs and medical insurance are also 23
expected to increase by $2.5 million and $6.3 million respectively compared to 24
the authorized amounts. Company witness Ms. Ruth A. Lowenthal discusses 25
the reasons for changes in the Company’s compensation and benefit costs in 26
her Direct Testimony. 27
28 15 Docket No. E002/GR-15-826
Heuer Direct
PUBLIC DOCUMENT: TRADE SECRET INFORMATION EXCISED – PUBLIC DATA –
Q. PLEASE DESCRIBE HOW CHANGES IN MARGIN RELATE TO THE RATE INCREASE. 1
A. Retail revenues are expected to increase somewhat in 2016, thereby offsetting 2
items increasing the 2016 revenue deficiency. The largest portion of retail 3
revenues consists of Company retail sales. As discussed by Company witness 4
Ms. Jannell E. Marks, for 2016 the Company’s total sales are projected to 5
increase 0.7 percent from 2015 actual sales for January through May and 6
projections from June through December. Ms. Marks explains that the 7
projected growth is a result of moderate increases in Commercial and 8
Industrial sales combined with declining Residential sales. Consequently, the 9
Company’s retail revenues are also expected to increase. In addition, 10
purchased demand expense is decreasing due to contract terminations and 11
new contracts that have been for lower purchase demand quantities. 12
Together, these items offset the increased revenue deficiency by 13
approximately $32.2 million. 14
15
Q. ARE THERE ANY OTHER MARGIN ITEMS WITH A SIGNIFICANT IMPACT ON THE 16
2016 REVENUE DEFICIENCY? 17
A. Yes. In our last rate case, the Commission approved the Company’s proposal 18
to utilize the amount of 2013 and 2014 Department of Energy (DOE) 19
settlement payments (resulting from the DOE’s contractual obligation to take 20
spent nuclear fuel) in excess of the Company’s 2014 and 2015 nuclear 21
decommissioning accrual requirements to moderate rate increases in 2015. 22
Such payments are not available in 2016, resulting in a $25.7 million 23
difference in the 2016 revenue deficiency. 24
25
Q. ARE THE FUNCTIONAL CLASS CATEGORIES OF OPERATING EXPENSE 26
COMPARABLE BETWEEN THE 2016 TEST YEAR AND 2014 TEST YEAR? 27
16 Docket No. E002/GR-15-826 Heuer Direct

PUBLIC DOCUMENT: TRADE SECRET INFORMATION EXCISED – PUBLIC DATA –
A. Yes. Budget amounts for both periods conform to the FERC Uniform 1
System of Accounts. To better show cost drivers, especially as they relate to 2
operating margins, some reclassifications are made in the cost driver analysis 3
from the Jurisdictional Cost of Service Study. Therefore, to provide 4
additional clarity, Exhibit___(AEH-1), Schedule 6 at Pages 3 and 4 shows 5
where each cost driver impacts the Jurisdictional Cost of Service. Also, 6
Exhibit___(AEH-1), Schedule 6, Page 5 provides a quantification of the 7
carryover impact in the 2016 test year that in-service for any a part of the year 8
in the Company’s last case. 9
10
Q. DID YOU INCLUDE COMPARISONS OF THE CHANGE IN THE FUEL AND 11
PURCHASED ENERGY EXPENSE AS PART OF THE O&M EXPENSE ANALYSIS? 12
A. No. Although the cost of fuel and purchased energy are considered to be an 13
operating expense, recovery occurs through the Company’s separate fuel 14
clause adjustment (FCA) mechanism and true-up process. I provide a 15
reconciliation of fuel costs in the Cost of Service to the Base Cost of Fuel 16
filing in Exhibit___(AEH-1), Schedule 25, Fuel Reconciliation. 17
18
III. SUPPORTING INFORMATION 19
20
Q. WHAT TOPICS DO YOU DISCUSS IN THIS SECTION OF YOUR TESTIMONY? 21
A. In this section, I provide information related to data provided in our 22
application and the selection of the test year, and the jurisdictional cost of 23
service study. 24
25
A. Data Provided and Selection of the Test Year 26
Q. WHAT TOPICS DO YOU DISCUSS IN THIS SECTION OF YOUR TESTIMONY? 27
17 Docket No. E002/GR-15-826 Heuer Direct

PUBLIC DOCUMENT: TRADE SECRET INFORMATION EXCISED – PUBLIC DATA –
A. In this section, I will: 1
• identify the supporting financial information and related fiscal periods 2
that we are providing in connection with the 2016 test year; and 3
• demonstrate that the supporting financial information and related fiscal 4
periods that we are presenting provide appropriate information and 5
facilitate review of our 2016 test year. 6
7
1) Overview 8
Q. PLEASE DEFINE THE FISCAL PERIODS FOR WHICH FINANCIAL DATA IS 9
PROVIDED IN THIS PROCEEDING. 10
A. Following the Commission’s rules, financial data is provided for the most 11
recent fiscal year (calendar year 2014), the projected fiscal year 2015, and the 12
2016 test year. In addition, as discussed further by Mr. Chandarana and Mr. 13
Burdick, we are proposing a multi-year rate plan that requests additional rate 14
changes for years 2017 and 2018. 15
16
Q. WHAT FINANCIAL DATA IS USED IN THESE FISCAL PERIODS? 17
A. Financial data is provided for 2014 (the most recent fiscal year), 2015 (the 18
projected fiscal year), and 2016 (the test year). 19
20
The most recent fiscal year (calendar year 2014) reflects the Company’s actual 21
financial results. For the projected fiscal year 2015, actual financial results 22
through April 2015 are provided as rate base data; and actual financial results 23
through June 2015, are provided as operating expenses and revenues. 24
Forecast projections are provided for the remainder of 2015. 25
26
18 Docket No. E002/GR-15-826 Heuer Direct

PUBLIC DOCUMENT: TRADE SECRET INFORMATION EXCISED – PUBLIC DATA –
The 2016 test year is adjusted: (a) for traditional regulatory adjustments (e.g., 1
charitable donations, etc.); (b) to update the budgets to reflect any subsequent 2
changes to our costs that have become better known so as to provide the 3
most accurate information about our 2016 costs and revenues as is available; 4
and (c) to correct any errors in the budget. 5
6
I also provide schedules showing: the actual unadjusted average rate base 7
consisting of the same rate base components; unadjusted operating income; 8
overall rate of return; the calculation of required income; and the income 9
deficiency and revenue requirements for the most recent fiscal year (2014), the 10
projected fiscal year (2015), and the 2016 test year. Separate rate base and 11
income statement bridge schedules for the 2014 test year that identify test 12
period adjustments are provided with my testimony. 13
14
2) 2016 Test Year 15
Q. WHAT WAS THE BASE SOURCE FOR THE PROPOSED 2016 TEST YEAR COSTS? 16
A. Calendar year 2016 was selected as the test year for this filing using Xcel 17
Energy’s budget data for the first year of the budget cycle. The 2016 test year 18
is based on the most recent available budget information. Use of a fully 19
projected calendar test year (2016) is consistent with longstanding practice 20
and precedent in the Company’s rate cases before the Commission. 21
22
For the 2016 test year, the Company’s 2016 budget is provided, as described 23
in Mr. Robinson’s Direct Testimony and Volumes 5 and 6 of the Application. 24
25
Q. DOES THE COMPANY ANTICIPATE UPDATING SOME OF ITS INFORMATION IN 26
ITS REBUTTAL TESTIMONY? 27
19 Docket No. E002/GR-15-826 Heuer Direct
PUBLIC DOCUMENT: TRADE SECRET INFORMATION EXCISED – PUBLIC DATA –
A. Yes. Consistent with prior cases, we will update certain costs to incorporate 1
updated information. More specifically, as in our last rate case, we will review 2
the following and update in this case as appropriate. 3
• Cost of capital to reflect the most currently available data. 4
• Sales and customer count forecasts using available actual sales and 5
customer counts and updated IHS Global Insight economic data 6
through December 2015. 7
• Assumptions used for calculating Qualified Pension expense based on 8
information as of December 31, 2015. 9
• O&M active health care may be updated to reflect actual 2015 active 10
medical and pharmacy claims. 11
• Capital projects more than $1 million currently planned to be in service 12
in December 2016 to determine whether those projects will be 13
completed within the 2016 test year, as well as any new or expanded 14
projects anticipated to be completed within the test year. 15
• Property tax forecasts based upon property tax data that will become 16
available during 2016. 17
18
Q. IN ADDITION TO THE UPDATES LISTED ABOVE THAT WILL REFLECT THE MOST 19
CURRENT AVAILABLE DATA IN THE TEST YEAR, DO YOU ANTICIPATE ANY 20
OTHER ADJUSTMENTS IN REBUTTAL TESTIMONY? 21
A. Yes. After we finalized our cost of service for this case, we identified five 22
additional necessary adjustments. However, we either identified these 23
adjustments or received the information too late to allow us to incorporate 24
these changes into the revenue requirement in this initial filing. We plan to 25
incorporate these adjustments when we file Rebuttal Testimony. In total, they 26
result in a net $7.430 million decrease to the 2016 test year deficiency. 27
20 Docket No. E002/GR-15-826 Heuer Direct
PUBLIC DOCUMENT: TRADE SECRET INFORMATION EXCISED – PUBLIC DATA –
Following is a summary of the adjustments. I provide details related to these 1
adjustments in Section VII.G. 2
1) Reflection of the Commission’s October 22, 2015 decision in the 2015 3
Remaining Lives proceeding, Docket No. E,G002/D-15-46 (decrease 4
of $8.046 million (IA) to the test year deficiency). 5
2) Removal of the 2016 test year impact of a 2017 capital addition 6
(Hollydale) that was included in the 2017 capital budget forecast in 7
error (decrease of $0.031 million (IA) to the test year deficiency). 8
3) Allocation of Prairie Island Indian Community Settlement Agreement 9
Costs (increase of $0.663 million to the test year deficiency). 10
4) Removal of Economic Development Administration costs as discussed 11
in Section VII, Adjustment 6 (decrease of $.016 million to the test year 12
deficiency). 13
5) Reflection of the October 12, 2015 Decision of the Minnesota 14
Department of Commerce on CIP expenditures in Docket No. 15
E,G002/CIP-12-447 (equal revenues and expenditures offset, no net 16
impact to test year deficiency). 17
18
We also identified two potential adjustments that may be necessary to include 19
in Rebuttal Testimony if we have additional information at that time. These 20
adjustments are related to Bonus Tax Depreciation and the MISO ROE 21
Complaints. 22
23
3) Supporting Information and the 2016 Projected Test Year 24
Q. WHY DOES THE COMPANY USE 2014 AS ITS MOST RECENT FISCAL YEAR 25
INSTEAD OF 2015? 26
A. Minn. R. 7825.3100, subp. 10 provides the following definition: 27
21 Docket No. E002/GR-15-826 Heuer Direct
PUBLIC DOCUMENT: TRADE SECRET INFORMATION EXCISED – PUBLIC DATA –
“Most recent fiscal year” is the utility’s prior fiscal year unless notice of a 1 change in rates is filed with the commission within the last three 2 months of the current fiscal year and at least nine months of historical 3 data is available for presentation of current fiscal year financial information, in 4 which case the most recent fiscal year is deemed to be the current 5 fiscal year. (Emphasis added) 6
7
The Company is filing this rate case within the last three months of 2015. 8
However, nine months of actual 2015 data is “not available for presentation.” 9
As a result, one of the two requirements for using 2015 as the “most recent 10
fiscal year” cannot be met. Since that requirement cannot be met, the plain 11
language of the Rule directs that 2014 be used as the most recent fiscal year, 12
which supports the Company’s long standing approach. 13
14
Nothing in the Rule requires the Company to delay its filing until additional 15
2015 data becomes available or to accelerate the availability of the actual data 16
to include nine months of actual data with the filing. Rather, Minn. R. 17
7825.3100, subp. 10 requires the Company to treat 2014 as the prior fiscal 18
year and Minn. R. 7825.3100, subp. 12 requires that we treat 2015 as the 19
projected fiscal year. 20
21
Q. DOES THE COMPANY’S PRACTICE RESULT IN LESS INFORMATION BEING 22
INCLUDED IN THE FILING? 23
A. No. The Company filed information for 2014 (the most recent fiscal year), 24
2015 (the projected year), the unadjusted 2016 year, and the adjusted 2016 test 25
year. Definitions and financial schedules related to 2014 actual and 2015 26
projections are included in the following locations. 27
• Volume 3, Required Information, Section II. 28
- Tab 2, Jurisdictional Financial Summary Schedules, Schedule A-1 29
22 Docket No. E002/GR-15-826 Heuer Direct

PUBLIC DOCUMENT: TRADE SECRET INFORMATION EXCISED – PUBLIC DATA –
- Tab 3, Rate Base Schedules, Section A, Schedule A-1 1
- Tab 3, Rate Base Schedules, Section B, Schedule B-2 2
- Tab 3, Rate Base Schedules, Section E, Schedule E, Page 2 3
- Tab 4, Operating Income Schedules, Section A, Schedule A-1 4
- Tab 4, Operating Income Schedules, Section B, Schedule B-1 5
- Tab 4, Operating Income Schedules, Section C, Schedules C-1 and C-3 6
- Tab 4, Operating Income Schedules, Section F, Schedule F, Page 2 7
- Tab 5, Rate of Return Cost of Capital Schedules, Sections A-D 8
• Exhibit___(AEH-1), Schedule 7, Page 2, Comparison of Detailed Rate 9
Base Components. 10
• Exhibit___(AEH-1), Schedule 8, Page 3, Comparison of Detailed 11
Income Statement Components. 12
13
Q. HAS THE COMPANY’S PRACTICE RELATED TO IDENTIFICATION OF THE MOST 14
RECENT FISCAL YEAR BEEN APPROVED IN PRIOR RATE CASES? 15
A. Yes. In our rate case in Docket E002/GR-12-961, the Administrative Law 16
Judge (ALJ) found that the Company’s practice was consistent with its filings 17
in past rate cases, and was in compliance with Commission rules. Therefore, 18
the ALJ supported,1 and the Commission adopted, the Company’s use of a 19
fully projected test year. 20
21
Q. HAVE UPDATES BEEN MADE TO THE BUDGET DATA PRESENTED IN THE 22
JURISDICTIONAL COST OF SERVICE STUDY? 23
A. Yes. Updates to both rate base and income statement data were identified 24
during our review of the 2016 capital and O&M budgets and Direct 25
23 Docket No. E002/GR-15-826 Heuer Direct

PUBLIC DOCUMENT: TRADE SECRET INFORMATION EXCISED – PUBLIC DATA –
Testimony preparation. These updates were deemed necessary to present a 1
representative level of rate base and operating income for our proposed 2016 2
test year. The budget updates are identified and presented in Section VII, 3
Adjustments to the Test Year. 4
5
B. Jurisdictional Cost of Service Study 6
Q. WHAT TOPICS DO YOU DISCUSS IN THIS SECTION OF YOUR TESTIMONY? 7
A. In this section, I will: 8
• explain the jurisdictional cost of service studies that we prepared for 9
the 2016 test year; and 10
• identify and discuss information requests from our last rate case that 11
we have updated and provided in this case. 12
13
Q. PLEASE DESCRIBE THE COMPONENTS OF THE JURISDICTIONAL COST OF 14
SERVICE STUDY FOR THE 2016 TEST YEAR. 15
A. The complete jurisdictional cost of service for the 2016 test year is in 16
Volume 4 (Test Year Work Papers) of this filing and includes all the 17
adjustments discussed in my Direct Testimony. A summary of the 18
jurisdictional cost of service study for 2016 is provided in 19
Exhibit___(AEH-1), Schedule 4, Cost of Service Study Summary for 2016 20
Test Year. 21
22
The jurisdictional cost of service study includes the following financial data 23
input sections, for both total Company and the Minnesota Jurisdiction: 24
(i) capital structure; (ii) cost of capital; (iii) income tax rates; (iv) rate base; (v) 25
1 ALJ Report Findings 866-873 in Docket E002/GR-12-961 (July 3, 2013).
24 Docket No. E002/GR-15-826 Heuer Direct

PUBLIC DOCUMENT: TRADE SECRET INFORMATION EXCISED – PUBLIC DATA –
income statement; (vi) income tax calculations; and (vii) cash working capital 1
computation. 2
3
Q. PLEASE DESCRIBE THE JURISDICTIONAL COST OF SERVICE SUMMARY 4
SCHEDULES. 5
A. The jurisdictional cost of service summary for the 2016 test year is included at 6
Exhibit___(AEH-1), Schedule 4, Cost of Service Study Summary for 2016 7
Test Year, (Pages 1-6): 8
• The cover Page identifies the Minnesota Retail jurisdiction requested 9
ROE, and shows the earned ROE under current rates, the revenue 10
deficiency, and the percent of increase that would result if rates were 11
increased to earn the requested ROE. 12
• The “Rate Base Summary” for total Company electric operations and 13
the Minnesota jurisdiction is shown on Page 2. The Rate Base 14
Summary references a calculation of cash working capital, which is 15
detailed on Page 6. 16
• An “Income Statement Summary” for total Company electric 17
operations and the Minnesota jurisdiction is shown on Page 3. The 18
income statement shows the determination of total operating income at 19
present authorized retail rates. The Income Statement Summary 20
references calculations for federal and state income taxes, which are 21
detailed on Page 4. 22
• The “Revenue Requirement and Return Summary” for total Company 23
electric operations and the Minnesota jurisdiction is shown on Page 5. 24
It shows: (i) the earned overall rate of return on rate base; (ii) the 25
earned ROE; (iii) the revenue deficiency that needs to be recovered to 26
enable the Minnesota jurisdiction electric operations to earn the 27
25 Docket No. E002/GR-15-826 Heuer Direct
PUBLIC DOCUMENT: TRADE SECRET INFORMATION EXCISED – PUBLIC DATA –
requested ROE; and (iv) the total revenue requirements and the 1
percent of increase that would result by increasing retail billing rates by 2
the amount of the revenue deficiency. 3
4
Q. ARE THE REVENUE CONVERSION FACTOR CALCULATION AND THE 5
MINNESOTA COMPOSITE INCOME TAX RATES INCLUDED IN THIS FILING? 6
A. Yes. The revenue conversion factor calculation is included in Volume 3, Tab 7
B of the Other Supplemental Information; and composite income tax rates 8
are included in Volume 3, Tab C, Schedule C-5, of the Operating Income 9
Schedules. 10
11
Q. PLEASE EXPLAIN HOW THE INTEREST DEDUCTION FOR DETERMINING 12
TAXABLE INCOME IS CALCULATED. 13
A. The amount of interest deducted for income tax purposes is the weighted cost 14
of debt capital multiplied by the average rate base. This is sometimes called 15
“interest synchronization.” The Test Year Work Papers for the interest 16
synchronization calculation are provided in Volume 4. 17
18
Q. WHICH SCHEDULES IN YOUR EXHIBIT ARE RELATED TO RATE BASE? 19
A. I have provided three schedules related to rate base: Exhibit___(AEH-1) 20
Schedule 7, Comparison of Detailed Rate Base Components, 21
Exhibit___(AEH-1) Schedule 10, 2016 Rate Base Adjustment Schedule, and 22
Exhibit___(AEH-1) Schedule 9, Rate Base, CWIP and ADIT Summary. I 23
discuss these schedules in Section IV, Rate Base and Section VII, 24
Adjustments to the Test Year. Additional comparative rate base schedules are 25
provided in Required Information Volume 3. 26
27
26 Docket No. E002/GR-15-826 Heuer Direct

PUBLIC DOCUMENT: TRADE SECRET INFORMATION EXCISED – PUBLIC DATA –
Q. WHICH SCHEDULES IN YOUR EXHIBIT ARE RELATED TO THE INCOME 1
STATEMENT? 2
A. I have provided two schedules related to the income statement: 3
Exhibit___(AEH-1), Schedule 8, Comparison of Detailed Income Statement 4
Components, and Schedule 11, 2016 Income Statement Adjustment Schedule. 5
I discuss these schedules in Section V, Income Statement and Section VII, 6
Adjustments to the Test Year. Additional comparative income statement 7
schedules are provided in Required Information Volume 3. 8
9
IV. RATE BASE 10
11
Q. WHAT TOPICS DO YOU ADDRESS IN THIS SECTION OF YOUR TESTIMONY? 12
A. In this section of my testimony, I support the reasonableness of the 13
Company’s projected 2016 test year rate base and identify and explain how 14
the components of the rate base were determined. 15
16
Q. IS THE COMPANY’S PROJECTED 2016 TEST YEAR RATE BASE REASONABLE FOR 17
PURPOSES OF DETERMINING FINAL RATES IN THIS PROCEEDING? 18
A. Yes. The projected 2016 test-year rate base for the Company’s Minnesota 19
jurisdiction electric operations was developed on sound ratemaking principles 20
in a manner similar to prior Company electric rate cases. 21
22
Q. PLEASE EXPLAIN WHAT RATE BASE REPRESENTS. 23
A. Rate base primarily reflects the capital expenditures made by a utility to secure 24
plant, equipment, materials, supplies and other assets necessary for the 25
provision of utility service, reduced by amounts recovered from depreciation 26
and non-investor sources of capital. 27
28 27 Docket No. E002/GR-15-826
Heuer Direct
PUBLIC DOCUMENT: TRADE SECRET INFORMATION EXCISED – PUBLIC DATA –
Q. PLEASE IDENTIFY THE MAJOR COMPONENTS OF THE PROJECTED 2016 TEST-1
YEAR RATE BASE. 2
A. The 2016 test-year rate base is generally comprised of the following major 3
items, which I later describe in detail: 4
• Net Utility Plant; 5
• Construction Work in Progress; 6
• Accumulated Deferred Income Taxes; 7
• Pre-Funded Allowance for Funds Used During Construction; and 8
• Other Rate Base. 9
10
Q. HOW DOES THE COMPANY CALCULATE RATE BASE? 11
A. The Company’s rate base can be expressed using the breakdown on Page 27 12
of the “Electric Utility Cost Allocation Manual” of the National Association 13
of Regulatory Utility Commissioners (NARUC) as follows: 14
15
Original Average Cost of Electric Plant in Service (Plant) 16
Less: Average Accumulated Depreciation Reserve (Reserve) 17
Less: Average Accumulated Provision for Deferred Taxes 18
(net of accts 281-283 and 190) (ADIT) 19
Plus: Average Construction Work in Progress (CWIP) 20
Plus: Average Working Capital (Work Cap) 21
Equals: Rate Base 22
23
In this case, the calculation is as follows, using the average of the beginning 24
of year (BOY) and end of year (EOY) balances: 25
26
28 Docket No. E002/GR-15-826 Heuer Direct

PUBLIC DOCUMENT: TRADE SECRET INFORMATION EXCISED – PUBLIC DATA –
Plant $16,425,447 (per AEH-1, Sched 4, Page 2, Line 2) 1
Reserve (7,267,758) (per AEH-1, Sched 4, Page 2, Line 3) 2
ADIT (1,979,773) (per AEH-1, Sched 4, Page 2, Line 11) 3
CWIP 444,412 (per AEH-1, Sched 4, Page 2, Line 5) 4
Other Rate Base 213,787 (per AEH-1, Sched 4, Page 2, Lines 13-20) 5
Rate Base $7,836,115 (thousands of dollars) 6
7
Q. PLEASE DESCRIBE THE SCHEDULES IN YOUR EXHIBIT THAT ARE RELATED TO 8
THE TEST YEAR AVERAGE INVESTMENT IN RATE BASE. 9
A. Exhibit___(AEH-1), Schedule 7, Comparison of Detailed Rate Base 10
Components, provides a detailed statement of the rate base components. 11
Page 1 of 2 provides a comparison of the rate base components for the 2016 12
test year, to the 2014 test year used in our most recent rate case. Page 2 of 2 13
shows a comparison of detailed rate base components for the 2014 fiscal year, 14
2015 forecast year, and the 2016 test year. 15
16
Exhibit___(AEH-1), Schedule 10, 2016 Rate Base Adjustment Schedule, is a 17
bridge schedule that shows the 2016 unadjusted rate base, each proposed rate 18
base adjustment, and the resulting proposed 2016 test year rate base. 19
20
Exhibit___(AEH-1), Schedule 9, Comparison of Detailed Rate Base 21
Components, Page 1 of 3, shows a detailed average rate base by component 22
for the 2016 test year for the Minnesota jurisdiction and total Company, 23
before and after making proposed test period adjustments. Schedule 9, Page 24
2 of 3, shows the 2016 test year average Construction Work in Progress. 25
Schedule 9, Page 3 of 3 shows the accumulated deferred income taxes by 26
29 Docket No. E002/GR-15-826 Heuer Direct
PUBLIC DOCUMENT: TRADE SECRET INFORMATION EXCISED – PUBLIC DATA –
function for the Minnesota jurisdiction and total Company for the 2016 test 1
year, before and after making proposed test period adjustments. 2
3
A. Net Utility Plant 4
Q. WHAT DOES NET UTILITY PLANT REPRESENT? 5
A. Net utility plant represents the Company’s investment in plant and equipment 6
that is used and useful in providing retail electric service to its customers, net 7
of accumulated depreciation and amortization. 8
9
Q. PLEASE EXPLAIN THE METHOD USED TO CALCULATE NET UTILITY PLANT 10
INVESTMENT IN THIS CASE. 11
A. The net utility plant is included in rate base at depreciated original cost 12
reflecting the simple average of projected net plant balances at the beginning 13
and end of the 2016 test year. Such treatment is consistent with the method 14
employed in the most recent Minnesota electric rate case. 15
16
Q. WHAT HISTORICAL BASE DID XCEL ENERGY USE AS A STARTING POINT TO 17
DEVELOP THE PROJECTED NET PLANT BALANCES FOR THE BEGINNING OF THE 18
2016 TEST YEAR? 19
A. The historical base used for the beginning of the 2016 test year was the 20
Company’s actual net investment (Plant in Service less Accumulated 21
Depreciation) on the Company’s books and records as of April 30, 2015. 22
23
Q. ON WHAT BASIS WERE NET PLANT BALANCES PROJECTED FOR THE END OF THE 24
2016 TEST YEAR? 25
A. The 2016 test year ending net plant balances were determined by applying the 26
data contained in the 2016 capital budget to the above-described beginning 27
30 Docket No. E002/GR-15-826 Heuer Direct
PUBLIC DOCUMENT: TRADE SECRET INFORMATION EXCISED – PUBLIC DATA –
test year balances, adjusted for retirements, depreciation, salvage and removal 1
costs projected to occur during the 2016 test year. 2
3
Q. WHAT WAS THE AVERAGE NET UTILITY PLANT INCLUDED IN THE 2016 TEST 4
YEAR RATE BASE? 5
A. The average net utility plant included in the 2016 test year rate base is $9.158 6
billion, as shown on Exhibit___(AEH-1), Schedule 7, Comparison of 7
Detailed Rate Base Components, Page 2. This is comprised of an average 8
plant balance of $16.425 billion as detailed on Schedule 7, Page 2, minus an 9
average depreciation reserve of $7.268 billion, also shown by component on 10
Schedule 7, Page 2. 11
12
B. Construction Work In Progress 13
Q. WHAT IS CWIP? 14
A. In Minnesota, CWIP is included as part of the revenue requirement 15
calculation for base rates. CWIP is the accumulation of construction costs 16
that directly relate to putting a fixed asset into use. 17
18
Q. HAS CWIP BEEN INCLUDED IN THE 2016 TEST YEAR RATE BASE? 19
A. Yes. CWIP is included in rate base with a corresponding offset of AFUDC 20
added to operating income. The rate base amount reflects a simple average 21
of projected CWIP beginning and ending 2016 test year balances. This is 22
consistent with the method employed in Minnesota and approved by the 23
Commission in the Company’s last rate case and matches the use of an 24
average rate base. The inclusion of CWIP in rate base and the calculation of 25
the AFUDC offset are discussed in the Direct Testimony of Company 26
witness Ms. Lisa H. Perkett. 27
28 31 Docket No. E002/GR-15-826
Heuer Direct

PUBLIC DOCUMENT: TRADE SECRET INFORMATION EXCISED – PUBLIC DATA –
Q. HOW WERE THE 2016 TEST YEAR BEGINNING AND ENDING CWIP BALANCES 1
DETERMINED? 2
A. The beginning balance for CWIP was the April 30, 2015 historical balance. 3
The beginning CWIP balance was adjusted to reflect projected construction 4
expenditures, AFUDC, and transfers to Plant in Service during the remainder 5
of 2015 and in 2016 to obtain the beginning and ending 2016 test year CWIP 6
balance. These projections were developed from Xcel Energy’s 2016 capital 7
budget. 8
9
C. Accumulated Deferred Income Taxes 10
Q. PLEASE DESCRIBE ACCUMULATED DEFERRED INCOME TAXES (ADIT). 11
A. Inter-period differences exist between the book and taxable income treatment 12
of certain accounting transactions. These differences typically originate in 13
one period and reverse in one or more subsequent periods. For utilities, the 14
largest such timing difference typically is the extent to which accelerated 15
income tax depreciation generally exceeds book depreciation during the early 16
years of an asset’s service life. ADIT represents the cumulative net deferred 17
tax amounts that have been allowed and recovered in rates in previous 18
periods. 19
20
Q. WHY IS ADIT DEDUCTED IN ARRIVING AT TOTAL RATE BASE? 21
A. To the extent income taxes recovered in rates are deferred for later payment, 22
they represent a prepayment by customers, a non-investor source of funds. 23
The average projected ADIT balance is deducted in arriving at total rate base 24
to recognize such funds are available for corporate use between the time they 25
are collected in rates and ultimately remitted to the respective taxing 26
authorities. 27
28 32 Docket No. E002/GR-15-826
Heuer Direct
PUBLIC DOCUMENT: TRADE SECRET INFORMATION EXCISED – PUBLIC DATA –
Q. WHAT AMOUNT OF ADIT WAS DEDUCTED TO ARRIVE AT THE 2016 PROJECTED 1
TEST YEAR RATE BASE? 2
A. As shown on Exhibit___(AEH-1), Schedule 7, Comparison of Detailed Rate 3
Base Components, Page 2, $1.980 billion was deducted. This amount reflects 4
a simple average of the beginning and projected ending 2016 test year ADIT 5
balances, and incorporates IRS tax regulations. Specifically, Sec. 1.167(l) of 6
the tax code defines a pro-rated schedule for the extent average accumulated 7
deferred income taxes can be used to reduce rate base to comply with the tax 8
normalization requirements of the Code when forecast information is used to 9
set rates. Details related to ADIT are provided in Exhibit___(AEH-1), 10
Schedule 9, on Page 3 of 3. 11
12
D. Pre-Funded AFUDC 13
Q. WHAT IS PRE-FUNDED AFUDC? 14
A. In Minnesota, AFUDC is included as part of the revenue requirement 15
calculation for base rates. Specifically, during construction, AFUDC is 16
calculated and included in the CWIP balance and is also included in operating 17
income as an offset to the revenue requirement. AFUDC is added to the cost 18
of related capital projects and is reflected in rate base when the related capital 19
project is placed into service. Once a project is placed in service, the 20
recording of AFUDC ceases and the total capital cost of the project including 21
accumulated AFUDC is recovered through depreciation. 22
23
However, certain rate riders in Minnesota (e.g., the TCR Rider and the RES 24
Rider) include a current return on CWIP as part of the revenue requirement 25
calculation for the rider. The capital projects associated with those riders do 26
not include the accumulated (pre-funded) AFUDC as part of rate base. Pre-27
33 Docket No. E002/GR-15-826 Heuer Direct
PUBLIC DOCUMENT: TRADE SECRET INFORMATION EXCISED – PUBLIC DATA –
funded AFUDC is the Minnesota jurisdictional amount of AFUDC related to 1
those rate riders. 2
3
Q. HOW IS PRE-FUNDED AFUDC TREATED? 4
A. Pre-funded AFUDC is calculated and credited against the total jurisdictional 5
AFUDC to prevent double-counting. This treatment, in effect, reduces the 6
income offset provided by AFUDC and reduces the accumulated AFUDC 7
that is added to rate base when a project is placed into service. The Company 8
tracks Pre-funded AFUDC and the non-rider AFUDC separately so that the 9
Minnesota jurisdictional customers are assured of receiving the entire benefit 10
in lower fixed asset costs during the in-service period for the assets included 11
in rate riders. In this way, we ensure that costs are recovered in the 12
appropriate jurisdictions, pursuant to their specific ratemaking procedures. 13
14
Q. HOW DOES THE COMPANY ACCOUNT FOR PRE-FUNDED AFUDC? 15
A. Pre-funded AFUDC is recorded in FERC Account No. 253, Other Deferred 16
Credits, during the construction process as AFUDC is incurred, separated by 17
rate jurisdiction within this FERC account. Pre-funded AFUDC is related to 18
projects recovering a current return on CWIP from customers in Minnesota 19
and wholesale transmission customers who pay our FERC regulated MISO 20
Attachment O and Schedule 26 rates. Once the associated asset is placed into 21
service, the Pre-Funded AFUDC balance is amortized over the same time 22
period as the associated asset. 23
24
Q. HOW HAVE YOU TREATED PRE-FUNDED AFUDC IN THE 2016 TEST YEAR? 25
A. All Minnesota jurisdictional Pre-funded AFUDC has been directly assigned to 26
the Minnesota jurisdiction, according to the functional class of the associated 27
34 Docket No. E002/GR-15-826 Heuer Direct

PUBLIC DOCUMENT: TRADE SECRET INFORMATION EXCISED – PUBLIC DATA –
asset for CWIP, Depreciation Reserve, Plant in Service and ADIT in rate base, 1
and to depreciation and deferred taxes, and AFUDC on the income 2
statement. Accumulated Pre-funded AFUDC is a reduction to rate base, with 3
the amortization of the Pre-funded AFUDC balance being a reduction to 4
depreciation expense. The deferred taxes associated with Pre-funded 5
AFUDC create a deferred tax asset during construction that flows back as the 6
book amortization is recognized. These Pre-funded AFUDC items are at a 7
jurisdictional level; thus the offset is made once the rate base and the income 8
statement are jurisdictionalized. The Pre-funded AFUDC recorded and 9
budgeted associated with our MISO transmission tariff have been allocated to 10
Minnesota, North Dakota and South Dakota jurisdictions based on 12 11
coincident peak demand. This allocation method is consistent with treatment 12
of the underlying transmission assets and their associated expenses and 13
revenues. 14
15
E. Other Rate Base 16
Q. PLEASE SUMMARIZE THE ITEMS YOU HAVE INCLUDED IN OTHER RATE BASE. 17
A. Other Rate Base is comprised primarily of Working Capital. It also includes 18
certain unamortized balances that are the result of specific ratemaking 19
amortizations, as discussed below in my testimony. 20
21
Q. PLEASE EXPLAIN WHAT WORKING CAPITAL REPRESENTS. 22
A. Working Capital is the average investment in excess of net utility plant 23
provided by investors that is required to provide day-to-day utility service. It 24
includes items such as materials and supplies, fuel inventory, prepayments, and 25
various non-plant assets and liabilities. The net cash requirement (referred to 26
as Cash Working Capital) is shown separately. 27
28 35 Docket No. E002/GR-15-826
Heuer Direct

PUBLIC DOCUMENT: TRADE SECRET INFORMATION EXCISED – PUBLIC DATA –
Q. HOW WERE 2016 TEST YEAR MATERIALS AND SUPPLIES AND FUEL INVENTORY 1
REQUIREMENTS CALCULATED? 2
A. The Materials and Supplies and Fuel Inventory amounts shown on 3
Exhibit___(AEH-1), Schedule 7, Page 2, Comparison of Detailed Rate Base 4
Components, are based on the 13-month average balances ending June 30, 5
2015, the most recent data available. The Materials and Supplies average 6
balance included in the test-year rate base equals $136 million. The 2016 test-7
year average rate base amount for Fuel Inventory is $73 million. 8
9
Q. HOW WERE 2016 TEST YEAR NON-PLANT ASSETS AND LIABILITIES 10
DETERMINED? 11
A. These balances as shown on Exhibit___(AEH-1), Schedule 7, Comparison of 12
Detailed Rate Base Components, Page 2, represent the 2016 calendar year 13
estimate of these balances. Any book/tax timing differences associated with 14
these items have been reflected in the determination of current and deferred 15
income tax provision and ADIT balances previously discussed. This group is 16
primarily comprised of liabilities that reduce test year rate base by $4 million. 17
18
Q. HOW WERE 2016 TEST YEAR PREPAYMENTS AND OTHER WORKING CAPITAL 19
ITEMS DETERMINED? 20
A. Prepayments and Other Working Capital, such as customer advances and 21
deposits, are based on the actual 13-month average balances during the period 22
ended June 30, 2015, as a proxy for the 2016 test year. Our nuclear outage 23
amortization is also included in Other Working Capital. The average rate base 24
for nuclear outage amortization is based on the average of the beginning of 25
year and end of year averages. The unamortized balances included in this 26
section are based on the amortization schedules as described in Section IV. 27
36 Docket No. E002/GR-15-826 Heuer Direct
PUBLIC DOCUMENT: TRADE SECRET INFORMATION EXCISED – PUBLIC DATA –
The net impact of these various items increase test-year rate base by $116 1
million as shown on Exhibit___(AEH-1), Schedule 7, Comparison of 2
Detailed Rate Base Components, Page 2. 3
4
Q. HOW WERE 2016 TEST-YEAR CASH WORKING CAPITAL REQUIREMENTS 5
DETERMINED? 6
A. Cash Working Capital requirements have been determined by applying the 7
results of a comprehensive lead/lag study to the projected 2016 test year 8
revenues and expenses. 9
10
Q. WERE THE COMPONENTS OF THE 2016 TEST-YEAR CASH WORKING CAPITAL 11
CALCULATED CONSISTENT WITH METHODS USED IN THE LAST RATE CASE? 12
A. Yes. The 2016 test-year cash working capital has been calculated consistent 13
with methods accepted in our most recent Minnesota electric rate case. 14
15
Q. PLEASE BRIEFLY EXPLAIN HOW A LEAD/LAG STUDY MEASURES CASH WORKING 16
CAPITAL. 17
A. A lead/lag study is a detailed analysis of the time periods involved in the 18
utility’s receipt and disbursement of funds. The study measures the difference 19
in days between the date services to a customer are rendered and the revenues 20
for that service are received, and the date the costs of rendering the services 21
are incurred until the related disbursements are actually made. 22
23
Q. HAS XCEL ENERGY’S LEAD/LAG STUDY BEEN UPDATED SINCE THE LAST 24
ELECTRIC RATE CASE? 25
A. Yes. The Company has updated the lead/lag study for the calculation of the 26
lead and lag days for all categories through year end 2014, using the 27
37 Docket No. E002/GR-15-826 Heuer Direct
PUBLIC DOCUMENT: TRADE SECRET INFORMATION EXCISED – PUBLIC DATA –
methodology for calculating the lead/lag days consistent with the Company’s 1
prior electric and gas regulatory filings. The results of the updated lead/lag 2
study for electric operations were incorporated into the Minnesota 3
jurisdiction cash working capital calculations as shown on Exhibit___(AEH-4
1), Schedule 4, Cost of Service Study Summary for 2016 Test Year, Page 6. 5
6
Q. WHAT IS THE 2016 TEST-YEAR CASH WORKING CAPITAL AMOUNT? 7
A. The amount included as reduction in average rate base is $108 million as 8
shown on Exhibit___(AEH-1), Schedule 4, Page 2. 9
10
Q. HAS THERE BEEN A CHANGE IN THE TEST-YEAR CASH WORKING CAPITAL 11
AMOUNT SINCE THE LAST RATE CASE? 12
A. Yes. The $108 million reduction in test year Cash Working Capital 13
requirement is an approximately $32 million greater reduction than the 14
amount of the reduction in the test year in the last rate case ($76 million). 15
16
Q. WHAT IS THE SOURCE OF THE DECREASE IN CASH WORKING CAPITAL? 17
A. The decrease in Cash Working Capital results in a corresponding decrease in 18
average rate base. This change is primarily due to the net changes in the 19
average expense lead and revenue lag days between the two periods. Average 20
revenue lag days increased to 41.58 in 2016 from 40.34 in 2014, meaning the 21
Company’s revenues are being collected on average 1.24 days slower in 2016 22
than in 2014. Conversely, the Company’s average expense lead days increased 23
to 56.34 in 2016 from 50.45 in 2014, meaning that the Company’s cash outlay 24
for paying expenses has been extended by an average of 5.89 days. The 25
longer time frame in disbursing cash greatly exceeded the slower collection of 26
38 Docket No. E002/GR-15-826 Heuer Direct
PUBLIC DOCUMENT: TRADE SECRET INFORMATION EXCISED – PUBLIC DATA –
revenues and has reduced the level of cash working capital balance to be 1
included in rate base. 2
3
Q. WHAT IS THE SIGNIFICANCE OF NEGATIVE CASH WORKING CAPITAL? 4
A. A negative cash working capital indicates that overall revenue collections 5
occur sooner than the date when the associated costs of service are paid, and 6
that, on average, most cash working capital requirements are being provided 7
by customers and vendors. The negative cash working capital reduces rate 8
base to compensate customers for funds provided to meet cash working 9
capital requirements. 10
11
V. INCOME STATEMENT 12
13
Q. WHAT TOPICS WILL YOU DISCUSS IN THIS SECTION OF YOUR TESTIMONY? 14
A. In this section, I will support the reasonableness of the Company’s proposed 15
2016 test year income statement. 16
17
Q. IS THE COMPANY’S PROPOSED 2016 TEST YEAR INCOME STATEMENT 18
REASONABLE FOR DETERMINING FINAL RATES IN THIS PROCEEDING? 19
A. Yes. The proposed 2016 test-year income statement for the Company’s 20
Minnesota jurisdiction electric operations was developed on sound 21
ratemaking principles in a manner similar to prior Company electric rate cases. 22
23 Q. PLEASE IDENTIFY THE MAJOR COMPONENTS OF THE PROJECTED INCOME 24
STATEMENT. 25
A. The following are the major components of the projected income statement: 26
• Revenues; 27
39 Docket No. E002/GR-15-826 Heuer Direct

PUBLIC DOCUMENT: TRADE SECRET INFORMATION EXCISED – PUBLIC DATA –
• Operating and Maintenance Expenses; 1
• Depreciation Expense; 2
• Taxes; 3
• AFUDC; and 4
• Net Income 5
6
Q. PLEASE DESCRIBE THE SCHEDULES IN YOUR EXHIBIT THAT ARE RELATED TO 7
THE INCOME STATEMENT. 8
A. Exhibit___(AEH-1), Schedule 11, 2016 Income Statement Adjustment 9
Schedule, is a bridge schedule that shows the 2016 unadjusted income 10
statement, each proposed income statement adjustment, and the resulting 11
proposed 2016 test year income statement. Schedule 11 also includes the 12
revenue deficiency amount for each items included in this schedule 13
14
Exhibit___(AEH-1), Schedule 8, Comparison of Detailed Income Statement 15
Components, provides a detailed statement of the income statement 16
components. Page 1 provides a comparison of income statement components 17
for present rates at December 31, 2016 and for final rates at December 31, 18
2016. Page 2 provides a comparison of income statement components for 19
the Company’s last rate case filing to the 2016 test year assuming final rates. 20
Page 3 provides a comparison of the income statement components for 2014, 21
2015, and the 2016 test year. 22
23
A. Revenues 24
Q. WAS THE IMPACT OF WEATHER ON PROJECTED SALES FOR THE 2016 TEST 25
YEAR CONSIDERED? 26
40 Docket No. E002/GR-15-826 Heuer Direct

PUBLIC DOCUMENT: TRADE SECRET INFORMATION EXCISED – PUBLIC DATA –
A. Yes. The test year sales volumes are supported by the Direct Testimony of 1
Ms. Marks. 2
3
Q. DO RETAIL OPERATING REVENUES REFLECT THE PROJECTED LEVEL OF 4
UNBILLED SALES VOLUMES IN THE 2016 TEST YEAR? 5
A. Yes. As Ms. Marks explains, the projected level of unbilled sales is 6
incorporated into the retail sales forecast on a calendar month basis. This 7
eliminates the need to reconcile billing month sales to calendar month sales by 8
recording unbilled revenues. 9
10
Q. HAVE YOU CONSIDERED OTHER OPERATING REVENUES AS AN OFFSET TO THE 11
RETAIL REVENUE REQUIREMENT? 12
A. Yes. The 2016 test year includes items such as revenues from sales to other 13
utilities, certain revenues from wholesale trading activities, wholesale 14
transmission revenues, and specific tariff charges, including service activation 15
fees, reconnection fees and others. In areas where the Company did not 16
budget for the collection of these tariffed charges, a representative level was 17
determined and included as part of the revenues in the cost of service study. 18
Other operating revenues also include billings to NSPW under the 19
Interchange Agreement. Consistent with adjustments made in our last rate 20
case, a three year average (2013, 2014 and 2015 Bridge) for certain other 21
revenues was included in the determination of the 2016 test year level of 22
Other Revenues. I discuss that revenue adjustment and other adjustments to 23
revenues in more detail in Section VII, Adjustments to the Test Year. 24
25
Q. ARE ANY NON-REGULATED REVENUES OR OTHER AMOUNTS EXCLUDED FROM 26
THE 2016 COST OF SERVICE? 27
41 Docket No. E002/GR-15-826 Heuer Direct
PUBLIC DOCUMENT: TRADE SECRET INFORMATION EXCISED – PUBLIC DATA –
A. Yes. Because the following items are not considered in the determination of 1
base rates, we have excluded them from the 2016 Cost of Service: 2
• Windsource revenues and operating expenses (see Section VII, 3
Adjustments to the Test Year, Adjustment 37); 4
• Asset and non-asset based margins (see Section VII, Adjustments to 5
the Test Year, Adjustments 27 and 29); and 6
• CIP Incentive (see Section VII, Adjustments to the Test Year, 7
Adjustment 18). 8
9
Q. HAVE REVENUES AND EXPENSES ASSOCIATED WITH NSPM’S NON-10
REGULATED BUSINESS ACTIVITIES BEEN EXCLUDED FROM THE 2016 COST OF 11
SERVICE? 12
A. Yes, we have excluded the revenues and expenses associated with 13
Commission approved non-regulated business activities (customer-owned 14
street lighting maintenance and Sherco steam sales to Liberty Paper) from the 15
2016 cost of service. Because these activities are recorded in below the line 16
accounts, they were not included in the 2016 test year. A discussion of why 17
these two activities are classified as non-regulated activities and how these 18
activities are treated for rate-making purposes is included in Appendix A to 19
my Direct Testimony. 20
21
Q. HOW ARE REVENUES AND EXPENSES RELATED TO THE MISO SCHEDULES 22
TREATED IN RATES? 23
A. Both revenues and expenses related to the MISO schedules are included in 24
the determination of retail rates through either base rates, the FCA or the 25
TCR Rider. Base rate recovery, for example, includes both the revenues 26
received from MISO and the expense billings from MISO for Schedules 1 27
42 Docket No. E002/GR-15-826 Heuer Direct
PUBLIC DOCUMENT: TRADE SECRET INFORMATION EXCISED – PUBLIC DATA –
(Scheduling, System Control and Dispatch Service) and 2 (Reactive Supply 1
and Voltage). The FCA, for example, includes Schedule 3 (Regulating 2
Reserve). The TCR Rider includes recovery of Schedule 26 (Network 3
Upgrade from Transmission Expansion Plan) and 26-A (Multi-Value Project 4
Usage Rate) revenues and expenses. The TCR Rider also includes, for capital 5
projects not regionally shared, an Open Access Transmission Tariff (OATT) 6
Revenue Credit to estimate the revenue that will be collected for the project 7
from wholesale transmission customers. The treatment of revenues and 8
expenses related to the MISO schedules is consistent with their treatment in 9
prior rate cases. A description of each MISO schedule, its associated recovery 10
mechanism, the 2016 test year revenues and expenses and the location of 11
supporting information is included in Appendix A. 12
13
Q. WHAT ARE WHOLESALE MARGINS? 14
A. There are two categories of transactions that generate wholesale margins 15
(revenues less costs): asset based transactions; and non-asset based 16
transactions. Asset based transactions are comprised of short-term sales of 17
excess energy or capacity from Company-owned generation assets or power 18
purchase agreements (PPAs) executed to serve our native load customers. 19
The Company executes these asset based transactions through bilateral 20
agreements with specific wholesale customers and through sales directly into 21
the MISO energy market. Sales into the MISO market account for the bulk 22
of these transactions. 23
24
Non-asset based transactions are wholesale trading transactions undertaken to 25
obtain margins from purchases and sales of energy or capacity unrelated to 26
meeting the energy needs of our native load customers. The only transactions 27
43 Docket No. E002/GR-15-826 Heuer Direct
PUBLIC DOCUMENT: TRADE SECRET INFORMATION EXCISED – PUBLIC DATA –
that qualify as non-asset based transactions are third-party supplied electricity 1
or financial transactions that are not purchased to meet the needs of our retail 2
customers and that are then resold to other utilities or market participants. 3
4
Q HOW HAVE ASSET BASED MARGINS BEEN TREATED IN PRIOR RATE CASES? 5
A. Because asset based margins are created by selling energy or capacity from 6
generating facilities or PPAs paid for by ratepayers, all asset based margins 7
have been credited to ratepayers. Asset based energy sales margins have been 8
shared with rate payers through the FCA, and asset based capacity sales 9
margins are included in the retail rate case cost of service and require no 10
adjustment. In each of our last three rate cases, the Commission approved 11
passing the energy sales margins through to ratepayers using the FCA. 12
13
Q. IS THE COMPANY RECOMMENDING ANY CHANGE TO THE TREATMENT OF 14
ASSET BASED MARGINS? 15
A. No. The Company recommends the same treatment of crediting asset based 16
energy sales margins to ratepayers through the FCA going forward, which is 17
reflected in an adjustment discussed in Section VII, Adjustments to the Test 18
Year. 19
20
Q. HOW HAVE NON-ASSET BASED MARGINS BEEN ADDRESSED IN PRIOR CASES? 21
A. In our last two rate cases: (i) 100 percent of the non-asset based trading 22
margins were retained by the Company; and (ii) 100 percent of the fully 23
allocated O&M costs and IT system-related costs associated with non-asset 24
based trading margins were excluded from the test year and, thus, resulted in a 25
decrease in test year operating expenses. 26
27
44 Docket No. E002/GR-15-826 Heuer Direct
PUBLIC DOCUMENT: TRADE SECRET INFORMATION EXCISED – PUBLIC DATA –
Q. HAS THE COMPANY CONDUCTED INCREMENTAL AND FULLY ALLOCATED COST 1
STUDIES OF NON-ASSET BASED TRADING? 2
A. Yes. At one time, the Company advocated a contribution from non-asset 3
based margins based on incremental cost. As a consequence, the Commission 4
ordered the Company to prepare an incremental cost study to support the 5
Company’s position as well as a fully allocated cost study. 6
Exhibit___(AEH-1), Schedule 18, Non-Asset Based Trading Cost Study, is a 7
report of these two studies, explaining the methodologies used and the 8
results. In addition, Volume 4 Test Year Workpapers, Section VIII 9
Adjustments, Tab A28 includes all calculations and their effect on the 2016 10
test year. 11
12
Q. IS THE COMPANY RECOMMENDING ANY CHANGE TO THE TREATMENT OF 13
NON-ASSET BASED MARGINS? 14
A. No. Consistent with past Commission decisions, we are making an 15
adjustment to exclude costs equal to the fully allocated cost of non-asset 16
based trading, as further explained in Section VII, Adjustments to the Test 17
Year. Since the Company is required to exclude the fully allocated non-asset 18
based trading costs from test year expense, we request that the requirement to 19
prepare an incremental cost study be eliminated for future rate cases. 20
21
Q. UNDER THE COMPANY’S PROPOSALS FOR ASSET BASED MARGINS AND NON-22
ASSET BASE MARGINS, IS IT NECESSARY TO MAKE ANY TEST YEAR 23
ADJUSTMENTS? 24
A. Yes, we make three adjustments. First, with respect to asset-based energy 25
sales margins, the 2016 budget base data includes all fuel costs and trading 26
revenues. However, all asset-based energy sales margins are passed through 27
45 Docket No. E002/GR-15-826 Heuer Direct

PUBLIC DOCUMENT: TRADE SECRET INFORMATION EXCISED – PUBLIC DATA –
to the ratepayers in the FCA. The fuel clause revenue included in retail 1
revenue does not include asset-based margins. Therefore, the Asset Margin 2
Sharing adjustment also excludes asset-based energy sales revenues and 3
expenses from the 2016 test year. 4
5
Second, the 2016 budget base data does not reserve the non-asset based 6
trading margin for the shareholders. Therefore, the Non-Asset Margin 7
Retention adjustment removes these revenues and expenses from the test 8
year. 9
10
Lastly, the Non-Asset Trading O&M Credit adjustment credits the operating 11
expenses in the income statement for the fully allocated O&M and IT-related 12
costs of non-asset based trading activity. These 2016 test year adjustments are 13
also included in Section VII, Adjustments to the Test Year. 14
15
Q. IS THE COMPANY MAKING ANY OTHER 2016 TEST YEAR ADJUSTMENTS TO 16
OTHER REVENUES? 17
A. Yes. I have included an adjustment to use the three-year average for Other 18
Revenues to account for variability and to be consistent with how those 19
revenues were handled in our last rate case. This adjustment includes other 20
unbudgeted revenue that the Company receives in an actual year that cannot 21
be anticipated for budget purposes. This adjustment is addressed specifically 22
in Section VII, Adjustments to the Test Year. 23
24
B. Operating and Maintenance Expenses 25
Q. WHAT ARE THE PRINCIPLE O&M EXPENSE CATEGORIES? 26
A. The principle expense categories are: 27
46 Docket No. E002/GR-15-826 Heuer Direct

PUBLIC DOCUMENT: TRADE SECRET INFORMATION EXCISED – PUBLIC DATA –
• Fuel & Purchased Energy 1
• Power Production 2
• Transmission 3
• Distribution 4
• Customer Accounting 5
• Customer Service & Information 6
• Sales, Economic Development and Other 7
• Administrative and General 8
9
Q. HOW DOES THE COMPANY CALCULATE OPERATING EXPENSES? 10
A. The Company’s operating expenses can be expressed using the breakdown on 11
Pages 30-31 of the “Electric Utility Cost Allocation Manual” of the National 12
Association of Regulatory Utility Commissioners (NARUC) as follows: 13
14
Operation and Maintenance Expense (including fuel) (Operating Exp) 15
+ Depreciation Expense (Depreciation) 16
+ Miscellaneous Amortization Expense (Amortization) 17
+ Taxes other than Income Taxes (Other Taxes) 18
+ Income Taxes (Income Tax) 19
= Total Expenses 20
21
Other Operating Revenues (Other Rev) is an offset to expenses. In this case, 22
the calculation is as follows: 23
24
47 Docket No. E002/GR-15-826 Heuer Direct
PUBLIC DOCUMENT: TRADE SECRET INFORMATION EXCISED – PUBLIC DATA –
Operating Exp $2,342,900 (per AEH-1, Sch 4, Page 3, Line 29) 1
Depreciation $471,286 (per AEH-1, Sch 4, Page 3, Line 31) 2
Amortization $39,585 (per AEH-1, Sch 4, Page 3, Line 32) 3
Other Taxes $401,292 (per AEH-1, Sch 4, Page 3, Line 43) 4
Income Tax ($73,527) (per AEH-1, Sch 4, Page 3, Line 44) 5
Total Expenses $ 3,181,537 (per AEH-1, Sch 4, Page 3, Line 47) 6
7
Q. HOW ARE FUEL AND PURCHASED ENERGY COSTS TREATED? 8
A. These fuel and purchased energy costs are collected through the FCA. Those 9
costs are fully offset by revenues from the FCA. Therefore, these costs have 10
no impact on the 2016 test year revenue deficiency. 11
12
Q. WHAT ARE POWER PRODUCTION COSTS AND HOW ARE THEY DETERMINED? 13
A. Power production costs are primarily the costs of operating our generating 14
facilities. These costs are forecast through development of a production 15
budget prepared to serve the combined energy and demand requirements of 16
the NSP System (used for both NSPM and NSPW). Our Risk Management 17
Department conducts a production simulation (called PLEXOS) model run 18
based on the forecasted system sales to derive the costs. 19
20
Q. HOW DOES XCEL ENERGY DEVELOP ITS TEST YEAR TRANSMISSION EXPENSE? 21
A. Transmission expenses are the O&M costs associated with operating and 22
maintaining our system transmission facilities. These costs are forecast 23
through development of a transmission budget prepared to serve the NSP 24
System (e.g., for both NSPM and NSPW). These costs and their development 25
are detailed in Mr. Benson’s Direct Testimony. 26
27
48 Docket No. E002/GR-15-826 Heuer Direct
PUBLIC DOCUMENT: TRADE SECRET INFORMATION EXCISED – PUBLIC DATA –
Q. PLEASE DESCRIBE THE INTEGRATED NSP SYSTEM AND THE INTERCHANGE 1
AGREEMENT BETWEEN THE COMPANY AND NSPW. 2
A. The Company and NSPW operate a single integrated electric generation and 3
transmission system and a single electrical “local balancing authority area.” 4
This integrated NSP System jointly serves the electric customers and loads of 5
the Company and NSPW. However, the specific generators and transmission 6
facilities making up the NSP System are owned by the two separate legal 7
entities (the Company and NSPW), with the ownership boundary at the 8
Minnesota/Wisconsin border. The Interchange Agreement is a FERC 9
approved contractual mechanism that provides a means to share the costs of 10
the integrated NSP System between the Company and NSPW. 11
12
Q. PLEASE DESCRIBE THE COSTS AND REVENUES ALLOCATED BETWEEN THE 13
COMPANY AND NSPW UNDER THE INTERCHANGE AGREEMENT. 14
A. Under the Interchange Agreement, the Company and NSPW share annual 15
system generation (production) and transmission costs. Under the 16
Interchange Agreement formulas, approximately 15 percent of the costs of 17
the Company system are allocated to NSPW, and approximately 85 percent of 18
the NSPW system costs are allocated to the Company, because approximately 19
85 percent of the load on the integrated system is the Company load and 15 20
percent is NSPW load. The exact allocation percentages are determined by 21
the allocation factors updated and filed at FERC annually. 22
23
The Interchange Agreement also provides for an allocation of revenues 24
received by the Company and NSPW, such as revenues from transmission 25
services or off-system wholesale sales. Interchange Agreement costs and 26
revenues are budgeted by the Company and NSPW annually. Thus, the 27
49 Docket No. E002/GR-15-826 Heuer Direct

PUBLIC DOCUMENT: TRADE SECRET INFORMATION EXCISED – PUBLIC DATA –
Company’s budget shows Interchange Revenues, which are revenues that 1
reflect the charges to NSPW for its share of production and transmission 2
assets and associated expenses. Likewise, Interchange Expense reflects the 3
Company’s forecasted payments to NSPW for its proportionate share of the 4
costs of generation and transmission assets and associated expenses incurred 5
by NSPW to serve the NSP System needs. 6
7
The 2016 test year Interchange Revenue and Interchange Expenses have been 8
calculated using 2016 Company and NSPW budget information. This is 9
consistent with the treatment of Interchange Revenues and Interchange 10
Expenses in our last two rate cases. 11
12
Q. HOW DOES XCEL ENERGY DEVELOP ITS TEST YEAR DISTRIBUTION EXPENSE? 13
A. Distribution expenses are the O&M costs associated with operating and 14
maintaining our Minnesota distribution facilities. These costs are developed 15
through a distribution budget prepared for both the NSPM electric and gas 16
utilities. These costs and their development are detailed in the Direct 17
Testimony of Ms. Bloch. The allocation of these costs to the electric utility 18
and then to the Minnesota jurisdiction is addressed in Section VI of my 19
Direct Testimony. 20
21
Q. HOW DOES XCEL ENERGY DEVELOP ITS TEST YEAR CUSTOMER SERVICE 22
EXPENSE? 23
A Customer Service O&M costs are associated with operating our billing and 24
collection and customer call centers. These costs are developed through the 25
Customer Care budget prepared for both the NSPM electric and gas utilities. 26
These costs and their development are detailed in the Direct Testimony of 27
50 Docket No. E002/GR-15-826 Heuer Direct

PUBLIC DOCUMENT: TRADE SECRET INFORMATION EXCISED – PUBLIC DATA –
Company witness Mr. Michael C. Gersack. The allocation of these costs to 1
the electric utility and then to the Minnesota jurisdiction is addressed in 2
Section VI of my Direct Testimony. As Mr. Gersack explains, our bad debt 3
expense is affected by the level of commodity sales (retail sales). Therefore, 4
changes in the sale forecast affect the bad debt expense. As a result of 5
updating the sales forecast after the 2016 budget was developed, a change in 6
the bad debt expense is needed. I discuss that adjustment in Section VII of 7
my Direct Testimony. 8
9
Q. WHAT COSTS ARE INCLUDED IN ADMINISTRATIVE AND GENERAL (A&G) 10
EXPENSE? 11
A. A&G expense includes compensation, office supplies and expenses and 12
consulting services for officers, executives, and other Company employees 13
properly chargeable to utility operations and not chargeable directly to a 14
particular operating function. Also included in A&G expense are property 15
insurance, insurance and other costs related to injury or damage claims made 16
by employees or others, employee pensions and benefits, regulatory expenses, 17
general advertising expense, utility rental expense not properly chargeable 18
directly to a particular operating function and maintenance costs assignable to 19
the customer accounts, sales and A&G functions. 20
21
Q. ARE ANY COSTS RELATED TO CIVIC OR POLITICAL ACTIVITIES (LOBBYING), 22
IDENTIFIED IN THE COST OF SERVICE, OR ADJUSTMENTS? 23
A. No. Beginning in 1999, the Company made a conscious decision to move all 24
lobbying costs to below the line accounting, FERC account 426.4, 25
Expenditures For Certain Civic, Political and Related Activities. The 26
Company prepares the unadjusted expenses for the test year using queries that 27
51 Docket No. E002/GR-15-826 Heuer Direct

PUBLIC DOCUMENT: TRADE SECRET INFORMATION EXCISED – PUBLIC DATA –
restrict the data to only above-the-line accounts (FERC Accounts 500 1
through 935). Thus, no adjustment to the cost of service for lobbying costs is 2
required, as these below the line amounts are not used in our development of 3
the test year cost of service. We have also excluded the portion of 4
organizational dues associated with lobbying activities. Company witness Mr. 5
Gary J. O’Hara addresses our efforts to identify and remove lobbying 6
expenses in his Direct Testimony.2 7
8
Q. ARE THERE ANY OTHER ISSUES OF NOTE WITH RESPECT TO THE INCOME 9
STATEMENT? 10
A. Yes. As discussed by Company witness Mr. O’Connor, Nuclear costs 11
increased by $1.050 million due to an increase in payments to the Prairie 12
Island Indian Community consistent with the August 20, 2015, Amendment 13
to the May 22, 2003 Settlement Agreement between Xcel Energy and the 14
Prairie Island Indian Community, pursuant to Minn. Stat. 216B.1645, subd. 4. 15
The Company filed for Commission approval of the Amended Settlement 16
Agreement on October 15, 2015, in Docket No. E002/M-15-922. Because 17
the Commission has not yet approved the Amended Settlement Agreement, 18
the Company excluded the cost increase from Interim Rates. 19
20
C. Depreciation Expense 21
Q. WHAT IS THE BASIS OF THE DEPRECIATION RATES AND EXPENSE USED IN THE 22
2016 TEST YEAR? 23
2 Charitable contributions, economic development contributions, and Chamber of Commerce dues are other below-the-line expenses that are moved above the line through adjustments described in Section VII.
52 Docket No. E002/GR-15-826 Heuer Direct
PUBLIC DOCUMENT: TRADE SECRET INFORMATION EXCISED – PUBLIC DATA –
A. Depreciation expense for the 2016 test year reflects the Company’s pending 1
2012 Average Remaining Life filing (Docket No. E, G002/D-15-46) and the 2
results of the 2012 Transmission, Distribution and General Depreciation 3
Five-Year Study (Docket No. E,G002/D-12-858). In the 2015 Remaining 4
Lives filing, we proposed modifications to the remaining lives for the Blue 5
Lake Units 1-4, Red Wing, and Wilmarth production plants. In addition to 6
remaining life changes, we are also recommending updates to net salvage rates 7
for electric production facilities based on a new 5-year dismantling study and 8
the discontinuation of the use of probabilities in our dismantling analysis. 9
10
For the transmission, distribution, and general five-year study, we reflect the 11
Commission decision to amortize the reserve surplus over three years with 50 12
percent of the remaining balance applied to 2014, 30 percent applied to 2015 13
and 20 percent applied to 2016 as Ordered in Docket No. E002/GR-13-868. 14
Ms. Perkett discusses the Company’s depreciation expense in her Direct 15
Testimony. The necessary adjustments to the 2016 test year budget to reflect 16
these changes are provided in Section IX of my Direct Testimony 17
18
D. Taxes 19
Q. WHAT TAX EXPENSES ARE INCLUDED IN THE 2016 TEST YEAR INCOME 20
STATEMENT? 21
A. We have line items for Property, Deferred Income Tax and ITC, Federal and 22
State Income Tax, and Payroll. The State and Federal income taxes are 23
calculated in Exhibit___(AEH-1), Schedule 4, Cost of Service Study Summary 24
for 2016 Test Year, Page 4 of 6. 25
26
Q. HOW ARE PROPERTY TAXES DETERMINED FOR THE JURISDICTION? 27
53 Docket No. E002/GR-15-826 Heuer Direct

PUBLIC DOCUMENT: TRADE SECRET INFORMATION EXCISED – PUBLIC DATA –
A. Property taxes are determined on a NSPM Total Company basis. The 1
functions are then allocated to the Company’s regulatory jurisdictions using 2
the demand allocator for electric production and transmission, the gas design 3
day allocator for gas production, and transmission and distribution is direct 4
assigned by state for both electric and gas. Please see Volume 4, Tab P-6, 5
Property Tax for more details. 6
7
Q. WHAT IS THE LEVEL OF PRODUCTION TAX CREDITS INCLUDED IN THE STATE 8
AND FEDERAL INCOME TAX CALCULATION IN THE 2016 TEST YEAR? 9
A. As shown on Exhibit___(AEH-1), Schedule 19, Production Tax Credits and 10
Schedule 24, Net Operating Loss, the 2016 test year assumes PTCs for the 11
Company owned wind farms of $43.078 million, which results in a $73.474 12
million reduction in 2016 test year revenue requirements included in our base 13
data ($61.457 million net of Interchange Agreement billings to NSPW). We 14
expect production to begin at the new Courtenay wind project late in 2016. 15
Due to the forecast in-service of this project, the Company is recommending 16
that this project be recovered through the RES Rider. I provide a discussion 17
later in this Section of my Direct Testimony about how PTCs interact with 18
the deferred tax asset calculations in the 2016 test year. 19
20
Q. WHAT IS THE COMPANY’S PROPOSAL WITH RESPECT TO THE TREATMENT OF 21
PTCS BETWEEN TEST YEARS? 22
A. In addition to the Courtenay PTCs included in the RES Rider, the Company 23
continues to recommend that the RES Rider act as a true-up mechanism for 24
the PTCs related to projects already in-service and included in base rates as a 25
part of the 2016 test year cost of service. We propose that the difference in 26
the dollar value of actual PTCs generated and the amounts included in the test 27
54 Docket No. E002/GR-15-826 Heuer Direct
PUBLIC DOCUMENT: TRADE SECRET INFORMATION EXCISED – PUBLIC DATA –
year be recorded to the RES Tracker account and either returned to, or 1
recovered from, customers through the RES Rider. This approach meets our 2
understanding of the current regulatory treatment for PTCs. 3
4
Q. PLEASE SUMMARIZE THE RATEMAKING TREATMENT OF NET OPERATING 5
LOSSES (NOLS). 6
A. The Company continues to follow the resolution of “Tax Normalization and 7
Allowance for Net Operating Losses” from the last two rate cases, which was 8
reflected in Exhibit 105 in Docket No. E002/GR-10-971. Specifically, the 9
Company will continue to give back to retail customers annually the revenue 10
requirement benefit associated with the utilization of tax deductions and 11
credits carried forward from prior periods. 12
13
The estimated $78.1 million in revenue requirement benefits from 2015 to 14
2019 shown in the May 31, 2015 Rate Compliance Report for Regulatory 15
Treatment of Net Operating Loss (Docket E002/GR-10-971) are the sum of 16
estimated annual revenue requirement reductions over the period from the 17
start of carry forward utilization (2010) until the utilization balance is 18
projected to be fully consumed (2019). 19
20
The timing of utilization and the carry forward balances associated with 21
unused deductions and credits will continue to change over time as the 22
Company’s revenue and deduction levels change. The annual reporting 23
process which incorporates actual revenues, deductions and cost of capital 24
will continue to be the vehicle to track the utilization and balances and 25
annually refund any utilization that has not been applied in base rates. 26
27
55 Docket No. E002/GR-15-826 Heuer Direct

PUBLIC DOCUMENT: TRADE SECRET INFORMATION EXCISED – PUBLIC DATA –
Had this rate treatment not been approved by the Commission, the 2016 test 1
year revenue requirement would be the same. However, customers would not 2
receive refunds for the revenue requirement value of the utilization of these 3
carried forward deductions and credits if such utilization took place outside of 4
a rate case test year. 5
6
Q. PLEASE EXPLAIN HOW THE COMPANY DETERMINES WHETHER DEFERRED TAX 7
ASSETS ARE CREATED OR CONSUMED. 8
A. The calculation of income taxes determines whether deferred tax assets are 9
created or consumed. After the calculated income tax expense is reduced to 10
zero, the remaining income tax credits and deductions are “carried forward” 11
and can be used to reduce taxes in future years. The federal income tax code 12
and tax regulations dealing with NOLs state that unused deductions carried 13
forward to a future tax year must be utilized before credits. The opposite is 14
true during a time of setup. To the extent the calculated income tax expense 15
is negative, first tax credits and then depreciation deductions are reversed, 16
carried forward, and are available for utilization in a future period. This 17
reversal creates a reduction to deferred tax expense, resulting in the creation 18
of a deferred tax asset. 19
20
In future periods, to the extent the calculated income tax expense is positive, 21
the federal income tax code and tax regulations prioritize that first 22
depreciation deductions that were carried forward and then credits that were 23
carried forward are utilized to reduce the income tax expense down to zero. 24
This utilization creates an increase in deferred tax expense, reducing the 25
balance of the deferred tax asset. Once all depreciation deductions and 26
56 Docket No. E002/GR-15-826 Heuer Direct

PUBLIC DOCUMENT: TRADE SECRET INFORMATION EXCISED – PUBLIC DATA –
credits previously carried forward are utilized, the Company will have 1
returned to a positive tax position. This is normal NOL accounting. 2
3
For the purpose of determining the NOL, these income tax calculations are 4
done on an all-inclusive jurisdictional cost of service basis in which rider 5
revenues and rider related investments are included with non-rider revenues 6
and investments. This approach determines the extent to which the NSPM 7
Electric Utility Minnesota retail jurisdiction is in a tax loss position or in a 8
position to utilize deductions and credits carried forward from previous 9
periods as is the case with the 2016 test year. This approach insures that any 10
reduction in revenue requirements resulting from the utilization of deductions 11
or credits carried forward from prior periods is returned to customers as soon 12
as it is available in the form of a rate refund or reduction to base rates. 13
14
These balances related to unused credits and deductions are reported in the 15
Company’s May 1 Jurisdictional Annual Report, including the May 1, 2015 16
Jurisdictional Annual Report. Separate detailed reporting and the revenue 17
requirement value associated with any utilization is reported every May 31st 18
including May 31, 2015. By having these annual determinations made on an 19
all-in basis, the jurisdictional cost of service study (JCOSS) includes actual 20
data for both rider recovery and base rate recovery properties. Any change in 21
rider recovery by the Commission will be incorporated in this process. 22
23
Q. DO THE DEFERRED TAX ASSETS AFFECT THE 2016 REVENUE REQUIREMENT? 24
A. Yes. The Company’s 2016 test year COSS includes a revenue requirement 25
reduction of $7.383 million associated with the 2016 utilization of 26
depreciation deductions previously carried forward, a revenue requirement 27
57 Docket No. E002/GR-15-826 Heuer Direct
PUBLIC DOCUMENT: TRADE SECRET INFORMATION EXCISED – PUBLIC DATA –
reduction of $1.435 million associated the balance of 2015 utilization carried 1
forward into 2016, along with the need to continue to carry forward a portion 2
of the credits based on the Company’s 2016 test year COSS. An accounting 3
for the balances brought forward from the 2014 Annual Reporting and the 4
2015 bridge year, as well as the documented calculations supporting this 5
revenue requirement reduction, can be found in Exhibit___(AEH-1), 6
Schedule 24, Net Operating Loss. 7
8
The solving for a zero income tax expense for the 2016 test year on an all-9
inclusive basis is not the result of deductions that could not be used in the 10
2016 test year, but instead is the result of using deductions in the 2016 test 11
year that were carried forward to the 2016 test year from prior periods. These 12
deductions ($295.7 million), carried forward from prior periods to the 2016 13
test year, cause end of year rate base to decrease as a result of the increase 14
($120.7 million) in the net accumulated deferred tax liability. Also, as 15
mentioned above, our 2016 test year includes $31.8 million of PTCs that need 16
to continue to be carried forward to a future period due to Federal income tax 17
requirements to utilize deductions before credits. This results in a net 18
deferred tax asset reduction of $89.4 million in the 2016 test year. Also, 19
because 2016 is the last year of utilizing net operating losses, the Company is 20
able to take advantage of $3.4 million of Manufacture Production Tax 21
Deductions that are utilized prior to Production Tax Credits. Please see 22
Section VII, Adjustment to the Test Year, Adjustment 41) for quantification 23
of the revenue requirement impact of these calculations. 24
25
Q. HOW WILL THE RATES SET IN THIS CASE AFFECT THE UTILIZATION OF 26
DEFERRED TAX ASSETS IN FUTURE TEST YEARS? 27
58 Docket No. E002/GR-15-826 Heuer Direct

PUBLIC DOCUMENT: TRADE SECRET INFORMATION EXCISED – PUBLIC DATA –
A. The utilization of deferred tax assets is based on taxable income for the 1
NSPM retail electric jurisdiction. Taxable income is determined by total 2
revenues less total deductions. Once base rates are set in this case for the 3
2016 test year and any additional years considered by the Commission in the 4
Company’s multi-year rate proposal, they will remain in place until changed in 5
another electric rate case will impact total revenue levels. The level of 6
depreciation deductions carried forward from prior years that ultimately will 7
be utilized in the future is dependent on a number of variables that cannot be 8
quantified with certainty at this time. Total deductions will be dependent on 9
the levels of O&M and depreciation deductions available on plant 10
investments. Federal and state tax laws also continue to be reviewed and 11
could be changed. 12
13
Q. PLEASE EXPLAIN THE EFFECT OF TAX TREATMENT OF PTCS. 14
A. PTCs create a direct reduction (credit) to income tax expense causing a 15
corresponding increase to operating income. Every dollar change in 16
operating income needs a revenue conversion factor to be applied to 17
determine the pre-tax revenue level necessary to achieve the operating income 18
change. The revenue conversion factor calculation is included in Volume 3, 19
Tab B of the Other Supplemental Information; and composite income tax 20
rates are included in Volume 3, Tab C, Schedule C-5, of the Operating 21
Income Schedules. 22
23
Q. WHERE IS THE REDUCTION IN REVENUE REQUIREMENTS FOR PTCS 24
REFLECTED IN THE 2016 TEST YEAR FINANCIAL STATEMENTS? 25
A. The State of Minnesota jurisdictional revenue requirement impact of $43.078 26
million of PTCs after applying the 1.70561 revenue conversion factor is 27
59 Docket No. E002/GR-15-826 Heuer Direct
PUBLIC DOCUMENT: TRADE SECRET INFORMATION EXCISED – PUBLIC DATA –
$73.474 million or $61.457 million net of Interchange Agreement billings to 1
NSPW. Support for these calculations is shown on Exhibit___(AEH-1), 2
Schedule 19 Production Tax Credits. 3
4
Because the Company is continuing to utilize tax deductions carried forward 5
from prior periods as a result of net operating losses, the Cost of Service 6
reclassifies a portion of the PTCs from current credits to deferred credits as a 7
portion of these credits must continue to be deferred until all prior deductions 8
are utilized. Exhibit___(AEH-1) Schedule 24 Net Operating Loss, line 4, 9
shows the reversal of the $31.843 million of current PTCs for the 2016 test 10
year. The deferral of these PTCs, netted against the deferral of excess 11
deductions and state credits, results in a lowering of current taxes by $91.902 12
million (line 13). This is offset by an increase in deferred taxes of $89.409 13
million (line 12). These amounts do not offset exactly since the current and 14
deferred tax rates (41.37 percent and 40.81 percent respectively) are not 15
identical. However, the fact that they generally offset demonstrates that the 16
$43.078 million tax credit continues to be reflected in the financial statements, 17
but as a deferred rather than a current credit. 18
19
E. AFUDC 20
Q. WHAT IS AFUDC AND WHAT IS ITS FUNCTION IN THE INCOME STATEMENT? 21
A. AFUDC is the cost of financing during the period a capital investment is 22
included in CWIP. Once an asset is placed in service, the total cost to 23
construct including accumulated AFUDC is recovered through depreciation 24
expense. Ms. Perkett’s Direct Testimony discusses the role AFUDC plays in 25
allowing utilities to recover their cost of financing. In the income statement 26
AFUDC is used to offset expenses, thus increasing total operating income, 27
60 Docket No. E002/GR-15-826 Heuer Direct
PUBLIC DOCUMENT: TRADE SECRET INFORMATION EXCISED – PUBLIC DATA –
and reducing the revenue requirement. This provides a direct offset to the 1
return requirement associated with the inclusion of CWIP in rate base. Please 2
see Section IV. Rate Base, for a detailed discussion of the relationship 3
between CWIP and AFUDC and a discussion of Pre-Funded AFUDC. 4
5
F. Interchange Agreement Off-Set Treatment 6
Q. PLEASE DESCRIBE THE INTERCHANGE AGREEMENT OFF-SET TREATMENT 7
BEING EMPLOYED IN THE 2016 TEST YEAR COSS. 8
A. As discussed earlier, in general, the Interchange Agreement is designed to 9
share system related production and transmission cost between the two 10
operating companies Northern States Power Company – Minnesota (NSPM) 11
and Northern States Power Company – Wisconsin (NSPW). The intent of 12
this sharing is to represent these two company systems as a single joint 13
operation. To equalize the costs across this joint system, each operating 14
company bills the other operating company for their share of the joint costs 15
in general using energy requirements as the basis for variable cost sharing and 16
peak demand as the basis for sharing capital related and other fixed costs. 17
18
Q. WHAT SPECIFIC COMPONENTS ARE IMPACTED BY THIS SHARING IN THE 2016 19
TEST YEAR COSS? 20
A. The NSPM billings to NSPW for the sharing of NSPM costs appear as other 21
revenues in the 2016 test year cost of service. The NSPW billings to NSPM 22
for the sharing of NSPW costs appear as either production or transmission 23
expenses in the 2016 test year cost of service. Also, any adjustments being 24
proposed in the case that pertain to production or transmission are developed 25
using the same mechanics. 26
27
61 Docket No. E002/GR-15-826 Heuer Direct

PUBLIC DOCUMENT: TRADE SECRET INFORMATION EXCISED – PUBLIC DATA –
VI. UTILITY AND JURISDICTIONAL ALLOCATIONS 1
2
Q. WHAT TOPICS DO YOU DISCUSS IN THIS SECTION OF YOUR TESTIMONY? 3
A. In this section I will: 4
• explain why it is necessary for the Company to allocate costs among its 5
affiliates and between the jurisdictions in which it does business; 6
• describe the utility and jurisdictional allocations that are used in 7
determining the revenue requirement; 8
• explain the circumstances of the elimination of the separate Wholesale 9
Jurisdiction, the circumstances that led to the loss of full service 10
wholesale customers, and the effect of those events, including the 11
results of the Wholesale Customer Study that I identified earlier in my 12
testimony. 13
14
Q. WHY IS IT NECESSARY TO ASSIGN OR ALLOCATE COSTS BETWEEN NSPM AND 15
ITS AFFILIATES? 16
A. Whenever, services or facilities are shared between NSPM and an affiliate, it is 17
necessary that the appropriate costs related to those services or facilities be 18
assigned or allocated to the appropriate entity. Company witness Mr. Adam 19
R. Dietenberger, in his Direct Testimony, explains the process used to assign 20
or allocate O&M and Non-O&M costs (which include such items as book 21
depreciation expense, deferred income taxes and property taxes) for services 22
and facilities shared between NSPM and an affiliate. The cost assignment and 23
allocation principles are unchanged from those used by the Company in the 24
most recent Minnesota electric rate case. All of the common investments and 25
their related costs, be it software or other common equipment or facilities, are 26
evaluated by asset use to determine whether they should be direct assigned, or 27
62 Docket No. E002/GR-15-826 Heuer Direct
PUBLIC DOCUMENT: TRADE SECRET INFORMATION EXCISED – PUBLIC DATA –
allocated using an indirect allocator or general allocator. Additional 1
information regarding this process and the reason for selecting a particular 2
allocator is also included in the Cost Assignment and Allocation Manual 3
(CAAM) submitted with this application as Exhibit___(ARD-1), Schedule 3. 4
5
Q. IS IT NECESSARY TO ASSIGN OR ALLOCATE COSTS BETWEEN NSPM’S ELECTRIC 6
AND GAS UTILITIES? 7
A. Yes. NSPM operates both an electric utility and a gas utility. Therefore, it is 8
necessary that the appropriate costs related to those services or facilities be 9
assigned or allocated to the appropriate utility. 10
11
Q. IS IT NECESSARY TO ASSIGN OR ALLOCATE COSTS BETWEEN JURISDICTIONS? 12
A. Yes. The Company operates in three jurisdictions: Minnesota, North Dakota 13
and South Dakota. Thus, it is necessary to allocate or assign costs 14
appropriately between jurisdictions. Previously, costs were allocated or 15
assigned to four jurisdictions: Minnesota, North Dakota, South Dakota and 16
Wholesale. Beginning in 2014, however, the Company has no full 17
requirements wholesale customers. Therefore, since 2014, costs are allocated 18
between the Company’s three retail jurisdictions. 19
20
Q. HOW ARE COSTS ASSIGNED AND ALLOCATED? 21
A. The expense budgets relied upon to develop test-year income statement items 22
were generally prepared on a functional basis (i.e. Production, Transmission, 23
Distribution, Customer Accounts, Customer Information, Sales, 24
Administrative and General). These functional amounts are directly assigned 25
to the Minnesota jurisdiction electric utility operations where appropriate or 26
allocated based on cost causation. 27
28 63 Docket No. E002/GR-15-826
Heuer Direct
PUBLIC DOCUMENT: TRADE SECRET INFORMATION EXCISED – PUBLIC DATA –
Detailed records are maintained on a functional basis (i.e. Production, 1
Transmission, Distribution, etc.). The capital budgets, from which the 2
projected plant balances in rate base were developed, are also prepared on a 3
functional basis. These functional amounts are assigned to the appropriate 4
jurisdiction directly, or allocated based on the use of such assets in providing 5
electric service in a particular jurisdiction and the underlying elements of cost 6
causation. 7
8
Generally, all production plant is allocated to jurisdiction using the 9
jurisdictional demand allocator, with the exception of wind projects, which 10
are allocated using the jurisdictional energy allocator. In addition, production 11
costs are shared with Northern States Power Company-Wisconsin (NSPW) 12
under the terms of the Interchange Agreement. The Interchange Agreement 13
tariff approved by the Federal Energy Regulatory Commission (FERC) 14
specifically requires fixed production assets to be allocated between NSPM 15
and NSPW based on demand. 16
17
Fixed production O&M expense is allocated using the jurisdictional demand 18
allocator. In addition, fixed production O&M expense is shared with NSPW 19
under the terms of the Interchange Agreement. The Interchange Agreement 20
requires these costs to be allocated between NSPM and NSPW based on 21
demand. 22
23
All variable production O&M expense is allocated to jurisdiction using the 24
jurisdictional energy allocator. In addition, variable production O&M expense 25
is shared with NSPW under the terms of the Interchange Agreement. The 26
Interchange Agreement requires these costs to be allocated between NSPM 27
64 Docket No. E002/GR-15-826 Heuer Direct
PUBLIC DOCUMENT: TRADE SECRET INFORMATION EXCISED – PUBLIC DATA –
and NSPW based on energy. 1
2
Mr. Dietenberger further explains assignment and allocation of costs in his 3
Direct Testimony. 4
5
Q. HOW ARE THESE ALLOCATION FACTORS DEVELOPED? 6
A. A summary and description of the allocation factors used to allocate expenses 7
and capital items to the Minnesota jurisdictional electric operations income 8
statement and rate base is contained in Volume 3, Required Information, II 9
Required Financial Information, 3E Rate Base Jurisdictional Allocation 10
Factors and 4F Operating Income Jurisdictional Allocation Factors. Plant 11
investments are accounted for in the manner prescribed by the FERC 12
Uniform System of Accounts. Mr. Dietenberger also further explains the 13
development of allocation factors in his Direct Testimony. 14
15
Q. HOW ARE FUEL AND PURCHASED POWER COSTS ALLOCATED? 16
A. Fuel and purchased energy costs are allocated to each jurisdiction using the 17
jurisdictional energy allocator. Purchased demand costs are allocated to each 18
jurisdiction using the jurisdictional demand allocator. In addition, fuel and 19
purchased power costs are shared with NSPW under the terms of the 20
Interchange Agreement. The Interchange Agreement requires fuel and 21
purchased energy costs to be allocated between NSPM and NSPW based on 22
energy. Purchased demand costs are allocated between NSPM and NSPW 23
using demand. 24
25
Q. HOW ARE COMPENSATION- AND BENEFIT-RELATED RATE CASE ADJUSTMENTS 26
ALLOCATED? 27
65 Docket No. E002/GR-15-826 Heuer Direct
PUBLIC DOCUMENT: TRADE SECRET INFORMATION EXCISED – PUBLIC DATA –
A. Compensation and benefit related rate case adjustments are allocated to 1
jurisdictions using a weighted allocator based on all expenses in FERC 926 2
Employee Pensions and Benefits. Expenses in FERC 926 were allocated 3
following the Cost Assignment and Allocation Manual (CAAM) submitted 4
with this application as Exhibit___(ARD-1), Schedule 3. An additional 5
allocator was then created by determining each jurisdiction’s portion of the 6
Total NSPM expenses. The data used to calculate this allocator can be found 7
in Volume 4 Test Year Workpapers, Section VII Budget Allocators, Tab B-4. 8
9
Q. DOES THE WHOLESALE CUSTOMER STUDY EXPLAIN WHY THE COMPANY NO 10
LONGER ALLOCATES COSTS TO A WHOLESALE JURISDICTION? 11
A. Yes. Exhibit___(AEH-1) Schedule 12, Wholesale Customer Study, explains 12
that all of our partial requirements and energy only wholesale customers are 13
provided services pursuant to bilateral agreements and explains the treatment 14
of costs and revenues related to services provided to those customers. 15
16
Q. WHAT SERVICES DOES THE COMPANY ANTICIPATE PROVIDING TO PARTIAL 17
REQUIREMENTS WHOLESALE CUSTOMERS DURING 2016? 18
A. During 2016, the Company expects to provide services to wholesale customers 19
in the following categories: asset based energy sales, asset based capacity sales, 20
non-asset based energy and capacity sales, and other wholesale transactions 21
(including interfacing and scheduling services, energy services agreements, and 22
pass through charges). 23
24
Services to wholesale customers include interfacing between the customer and 25
MISO, including providing balancing services. Revenues from these customers 26
for services and asset based capacity are included in Other Revenues (e.g., for 27
66 Docket No. E002/GR-15-826 Heuer Direct
PUBLIC DOCUMENT: TRADE SECRET INFORMATION EXCISED – PUBLIC DATA –
balancing services). Sales of asset based energy are treated as asset based 1
margins and passed through the fuel clause. We also provide some non-asset 2
based services to these customers (energy and capacity sales using financial 3
instruments). The margins from non-asset based transactions as well as the 4
fully allocated embedded costs related those activities are treated as below the 5
line activities not included in the retail revenue requirement. 6
7
Attachment A to the Wholesale Customer Study provides a list of the types of 8
services provided, and the ratemaking treatment for each type of service. 9
Attachment B to the Wholesale Customer Study provides a wholesale customer 10
summary including all current agreements by customer and the expected 11
revenues for the years 2016 to 2018. 12
13
Q. DOES THE WHOLESALE CUSTOMER STUDY DEMONSTRATE THAT THE 14
REVENUES ARE INCLUDED IN THE RETAIL RATE CASE? 15
A. Yes. After reviewing the services provided to our wholesale customers and 16
the transactions associated with those services, the Company concludes that 17
the ratemaking treatment of these transactions is consistent with past 18
regulatory practice and the requirements of the Commission. Based on the 19
treatment of these transactions, the Company believes that costs and revenues 20
associated with wholesale customers are reflected properly in the test year. 21
22
VII. ADJUSTMENTS TO THE TEST YEAR 23
24
Q. WHAT TOPICS DO YOU ADDRESS IN THIS SECTION OF YOUR TESTIMONY? 25
A. In this section of my testimony, I explain adjustments that affect our 26
proposed 2016 revenue requirement. These adjustments were identified 27
67 Docket No. E002/GR-15-826 Heuer Direct
PUBLIC DOCUMENT: TRADE SECRET INFORMATION EXCISED – PUBLIC DATA –
during our review of the 2016 capital budget and preparation for this case. 1
An individual adjustment may be related to a previous Commission order, 2
reflect Commission policy or traditional ratemaking treatment, or may be 3
proposed to address a situation particular to this rate case. In this section, I 4
provide details related to each adjustment and explain why each is necessary 5
in order to present a representative level of rate base or costs in the 2016 test 6
year. I also identify where another Company witness provides information to 7
explain and support the adjustment. 8
9
First, I present one capital forecast update, traditional adjustments consistent 10
with treatment in prior cases, and rate case adjustments related to this 11
particular case. Next, I explain the various amortizations affecting the test 12
year, the removal of certain costs and revenues being recovered through 13
riders, and a group of adjustments that are the result of secondary dynamic 14
calculations in the cost of service model. Finally, I discuss five adjustments 15
we identified after we had finalized the year revenue requirement for this 16
initial filing. We propose to include these adjustments in our 2016 revenue 17
requirement in our Rebuttal Testimony. 18
19
Q. PLEASE LIST THE TEST YEAR ADJUSTMENTS. 20
A. The following adjustments were made to rate base and the income statement 21
where applicable. Rate base adjustments are shown on Exhibit___(AEH-1), 22
Schedule 10. Income statement (revenue requirement) adjustments are 23
shown on Exhibit___(AEH-1), Schedule 11. As a general note, all revenue 24
requirements shown on Schedule 11, Income Statement Adjustments, are net 25
of Interchange Agreement billings, where applicable, and capital related 26
68 Docket No. E002/GR-15-826 Heuer Direct

PUBLIC DOCUMENT: TRADE SECRET INFORMATION EXCISED – PUBLIC DATA –
revenue requirements are shown calculated at the last authorized rate of 1
return. 2
3
Forecast Updates 4
1) Black Dog Screen House 5
Traditional Adjustments 6
2) Advertising 7
3) Customer Deposits 8
4) Dues – Chamber of Commerce 9
5) Dues – Professional Association 10
6) Economic Development – Administration 11
7) Economic Development – Donations 12
8) Foundation Administration 13
9) Foundation and Other Charitable Contributions 14
10) Incentive Compensation 15
11) Investor Relations 16
12) Monticello LCM/EPU Return 17
13) Nobles Amount Over CON 18
14) Non-Qualified Pension Expense 19
Rate Case Adjustments 20
15) Aviation 21
16) Bad Debt Expense 22
17) CIP Approved Program Costs 23
18) CIP Incentive 24
19) Employee Expenses 25
20) Like Kind Exchange Program 26
21) Nuclear Retention 27
69 Docket No. E002/GR-15-826 Heuer Direct

PUBLIC DOCUMENT: TRADE SECRET INFORMATION EXCISED – PUBLIC DATA –
22) Other Revenue 3-Year Average 1
23) Retiree Medical Discount Rate 2
24) Pension Expense Smoothing 3
25) Remaining Life Depreciation Study – NSPM 4
26) Remaining Life Depreciation Study – NSPW 5
27) Trading – Asset Based Margin 6
28) Trading – Non-Asset Based Administration 7
29) Trading – Non-Asset Based Margin 8
30) XES Allocation on Labor Hours 9
Amortizations 10
31) PI EPU Deferred Costs 11
32) Rate Case Expense 12
33) Sherco 3 Depreciation 13
34) Transco Costs 14
Rider Removals 15
35) RES Rider 16
36) TCR Rider 17
37) Windsource 18
Secondary Cost of Service Calculations 19
38) ADIT Pro-Rate – IRS Required 20
39) Cash Working Capital 21
40) Change in Cost of Capital 22
41) Net Operating Loss 23
24
70 Docket No. E002/GR-15-826 Heuer Direct

PUBLIC DOCUMENT: TRADE SECRET INFORMATION EXCISED – PUBLIC DATA –
A. Forecast Updates 1
1) Black Dog Screen House 2
Q. PLEASE DESCRIBE THE BLACK DOG SCREEN HOUSE ADJUSTMENT. 3
A. Subsequent to the completion of the 2016 capital budget, the in-service date 4
for the Black Dog screen house project was moved from August 2018 to 5
March 2016. The adjustment shows the impact of this capital forecast update. 6
The Black Dog screen house project is discussed in the Direct Testimony of 7
Company witness Mr. Steven H. Mills. 8
9
This adjustment decreases test year rate base by $0.272 million, as shown on 10
Schedule 10, Rate Base Adjustments, Page 1, Column 4. The adjustment 11
increases test year revenue requirements by $0.563 million, as shown on 12
Schedule 11, Income Statement Adjustments, Page 1, Column 4. Support 13
for this adjustment can be found in Volume 4 Test Year Workpapers, Section 14
VIII Adjustments, Tab A-1. 15
16
B. Traditional Adjustments 17
2) Advertising 18
Q. PLEASE DESCRIBE THE ADVERTISING EXPENSE ADJUSTMENT. 19
A. Recovery of advertising costs is allowed primarily for advertising related to 20
providing information on safety, customer information and general, non-21
program specific conservation messages. An adjustment is necessary to 22
reduce administrative and general expenses for brand and image advertising 23
costs, which are not allowed for recovery from Minnesota ratepayers. 24
25
This adjustment is consistent with the Commission’s June 14, 1982 Statement 26
of Policy on Advertising, and Docket No. E002/GR-08-1065, where the 27
71 Docket No. E002/GR-15-826 Heuer Direct
PUBLIC DOCUMENT: TRADE SECRET INFORMATION EXCISED – PUBLIC DATA –
Commission directed the Company include a discussion of the steps the 1
Company has taken to exclude from advertising expense costs related to 2
branding and other promotional activities. 3
4
In response to this requirement, all advertisements included in our request for 5
cost recovery have been individually reviewed for content and 6
appropriateness for cost recovery. Representative advertisements for which 7
we are seeking recovery are included in Volume 3, Required Information, and 8
the costs we have included as recoverable advertisements are summarized in 9
Exhibit___(AEH-1), Schedule 15, Advertising. 10
11
The $2.690 million of advertising costs that have been excluded are 12
summarized on Schedule 15, Advertising, Page 1 of 1. The Company has 13
excluded the entire Brand and Image advertising budget, which makes up 14
most of the exclusion. This includes costs associated with television, print, 15
radio and outdoor advertisement, and is used by the Brand Advertising 16
Department. Messages that relate to CIP program expenses are not included 17
in this adjustment, as they are recorded with other CIP program costs in 18
FERC Account 908 (Customer Information) as a part of our CIP approved 19
program expenses. We have separately excluded an additional $0.219 million 20
of Windsource advertising through the Windsource O&M adjustment. 21
22
Excluding non-recoverable advertising decreases test year revenue 23
requirements by $2.690 million, as shown on Schedule 11, Income Statement 24
Adjustments, Page 1, Column 5. Support for this adjustment can be found in 25
Volume 4 Test Year Workpapers, Section VIII Adjustments, Tab A-2. 26
27
72 Docket No. E002/GR-15-826 Heuer Direct
PUBLIC DOCUMENT: TRADE SECRET INFORMATION EXCISED – PUBLIC DATA –
3) Customer Deposits 1
Q. PLEASE DESCRIBE THE ADJUSTMENT RELATED TO CUSTOMER DEPOSITS. 2
A. Customer deposits are treated as customer-supplied capital; thus it is 3
appropriate to include interest expense on customer deposits to pay a return 4
on that investment. The Commission’s findings in Docket Nos. G002/GR-5
86-160 and G002/M-86-165 required that the average balance of customer 6
deposits be deducted from rate base and at the same time allowed test year 7
operating expenses to be increased to permit the recovery of interest paid on 8
these deposits. An adjustment is required to include the interest expense on 9
customer deposits in the test year. 10
11
Including interest on customer deposits increases test year revenue 12
requirements by $0.001 million as shown on Schedule 11, Income Statement 13
Adjustments, Page 1, Column 6. Support for this adjustment can be found in 14
Volume 4 Test Year Workpapers, Section VIII Adjustments, Tab A-3. 15
16
4) Dues – Chamber of Commerce 17
Q. DOES THE COMPANY’S REQUEST INCLUDE RECOVERY OF ASSOCIATION DUES 18
PAID TO CHAMBERS OF COMMERCE? 19
A. Yes. The Company has included membership dues paid to various Chambers 20
of Commerce in Minnesota in the 2016 test year. Chambers of Commerce 21
provide an essential link between the Company and the communities it serves, 22
allowing for improved utility service. Because membership in these 23
organizations provides benefits to all utility customers, recovery of 24
membership dues paid to Chambers of Commerce is consistent with the 25
Commission’s June 14, 1982 Statement of Policy on Organizational Dues. 26
Chamber of Commerce dues are initially recorded below the line; thus, an 27
73 Docket No. E002/GR-15-826 Heuer Direct

PUBLIC DOCUMENT: TRADE SECRET INFORMATION EXCISED – PUBLIC DATA –
adjustment is necessary to include Chamber of Commerce dues in test year 1
costs. 2
3
Including Chamber of Commerce dues increases test year revenue 4
requirements by $0.220 million, as shown on Schedule 11, Income Statement 5
Adjustments, Page 1, Column 7. Support for this adjustment can be found in 6
Volume 4 Test Year Workpapers, Section VIII Adjustments, Tab A-4. 7
8
5) Dues – Professional Association 9
Q. PLEASE DESCRIBE THE PROFESSIONAL ASSOCIATION AND UTILITY 10
ASSOCIATION DUES ADJUSTMENT. 11
A. An adjustment is required to remove costs associated with organizational dues 12
that are not allowed for recovery from customers. Consistent with the 13
Commission’s June 14, 1982 Statement of Policy on Organizational Dues, the 14
Company is required to reduce administrative and general expenses for either 15
social organizations or organizations not associated with the State of 16
Minnesota. Exhibit___(AEH-1), Schedule 16, Organizational Dues, provides 17
the information required by the Commission’s Policy. 18
19
Removing professional and utility association dues decreases test year revenue 20
requirements by $0.019 million, as shown on Schedule 11, Income Statement 21
Adjustments, Page 1, Column 8. Support for this adjustment can be found in 22
Volume 4 Test Year Workpapers, Section VIII Adjustments, Tab A-5. 23
24
6) Economic Development – Administration 25
Q. AS BACKGROUND, PLEASE DESCRIBE THE COMPANY’S ACTIVITIES AND COSTS 26
RELATED TO ECONOMIC DEVELOPMENT. 27
74 Docket No. E002/GR-15-826 Heuer Direct

PUBLIC DOCUMENT: TRADE SECRET INFORMATION EXCISED – PUBLIC DATA –
A. The Company makes contributions to a number of regional and local 1
economic development organizations positioned to combine resources for the 2
purpose of maintaining and improving the long-term economic health of 3
communities in our service territory or retaining employment opportunities 4
and expanding the state and local tax base. NSPM can, through a donation, 5
provide communities or organizations involved in community and economic 6
development with either an operating grant or a one-time investment in a 7
special project that supports the community and economic development 8
efforts of our communities. In addition to these donations, the Company 9
incurs administrative costs associated with these donations. 10
11
Q. HAS THE COMPANY INCLUDED ECONOMIC DEVELOPMENT COSTS IN THE TEST 12
YEAR? 13
A. Yes. Consistent with prior ratemaking treatment, the Company is allowed to 14
recover from customers 50 percent of costs associated with economic 15
development administration and donations that benefit Minnesota. Below I 16
discuss two adjustments detailing inclusion of these costs in the test year. 17
18
Q. HAS THE COMPANY PERFORMED A COST BENEFIT ANALYSIS TO DETERMINE 19
THAT THE BENEFITS OF THE ECONOMIC DEVELOPMENT PROGRAMS EXCEED 20
THEIR COST TO RETAIL CUSTOMERS? 21
A. Yes. We completed a cost-benefit analysis supporting the inclusion of 22
economic development costs in the 2016 test year. Exhibit___(AEH-1), 23
Schedule 17, Economic Development Cost-Benefit Analysis, Attachments A 24
and B provide the potential revenue and cost impacts of the addition of one 25
commercial/industrial customer to NSPM’s electric system due to economic 26
development programs. The results indicate that the investments made by the 27
75 Docket No. E002/GR-15-826 Heuer Direct

PUBLIC DOCUMENT: TRADE SECRET INFORMATION EXCISED – PUBLIC DATA –
Company to support economic development in our community have the 1
potential to provide value to ratepayers as soon as the first year. 2
3
Q. PLEASE EXPLAIN THE ADJUSTMENT RELATED TO ECONOMIC DEVELOPMENT 4
ADMINISTRATION COSTS. 5
A. Consistent with prior ratemaking treatment, the Company intended to exclude 6
from recovery 50 percent of economic development administration costs. 7
However, instead of removing this amount, we inadvertently added it to test 8
year costs. This increase of $0.008 million to test year revenue requirements 9
is shown as shown on Schedule 11, Income Statement Adjustments, Page 1, 10
Column 9. A corrected adjustment of $0.016 million (reversing the incorrect 11
increase and removing the amount from test year costs) will be made in 12
Rebuttal Testimony, as discussed in Section G, Rebuttal Adjustments below. 13
Support for this adjustment can be found in Volume 4 Test Year Workpapers, 14
Section VIII Adjustments, Tab A-6. 15
16
7) Economic Development – Donations 17
Q. PLEASE EXPLAIN THE ADJUSTMENT RELATED TO ECONOMIC DEVELOPMENT 18
DONATIONS. 19
A. The Company is allowed to recover 50 percent of economic development 20
donations benefiting Minnesota. Because economic development donations 21
are initially recorded below the line, an adjustment is necessary to include 22
these costs in the test year. 23
24
Including 50 percent of economic development donations increases test year 25
revenue requirements by $0.054 million, as shown on Schedule 11, Income 26
Statement Adjustments, Page 1, Column 10. Support for this adjustment can 27
76 Docket No. E002/GR-15-826 Heuer Direct

PUBLIC DOCUMENT: TRADE SECRET INFORMATION EXCISED – PUBLIC DATA –
be found in Volume 4 Test Year Workpapers, Section VIII Adjustments, Tab 1
A-7. 2
3
8) Foundation Administration 4
Q. PLEASE DESCRIBE THE FOUNDATION ADMINISTRATION ADJUSTMENT. 5
A. Consistent with the Commission’s decision in Docket No. E002/GR-08-6
1065, we are excluding 100 percent of administrative costs related to the Xcel 7
Energy Foundation administration from the 2016 test year. 8
9
This adjustment decreases test year revenue requirements by $0.281 million, 10
as shown on Schedule 11, Income Statement Adjustments, Page 1, Column 11
11. Support for this adjustment can be found in Volume 4 Test Year 12
Workpapers, Section VIII Adjustments, Tab A-8. 13
14
9) Foundation and Other Charitable Contributions 15
Q. PLEASE DESCRIBE THE CHARITABLE CONTRIBUTION ADJUSTMENT. 16
A. Consistent with Commission decisions in our prior rate cases, the Company 17
included in the 2016 test year 50 percent of corporate charitable contributions 18
benefiting the State of Minnesota. An analysis was performed on 19
contribution details to ensure that only amounts contributed to charities and 20
institutions that could be associated with the Company’s electric service 21
territory in the Minnesota jurisdiction were included in the cost of service. 22
Because charitable donations are initially recorded below the line, an 23
adjustment is necessary to include these costs in the test year. 24
25
Including 50 percent of charitable contributions increases test year revenue 26
requirements by $1.625 million, as shown on Schedule 11, Income Statement 27
77 Docket No. E002/GR-15-826 Heuer Direct
PUBLIC DOCUMENT: TRADE SECRET INFORMATION EXCISED – PUBLIC DATA –
Adjustments, Page 1, Column 12. Support for this adjustment can be found 1
in Volume 4 Test Year Workpapers, Section VIII Adjustments, Tab A-9. 2
3
10) Incentive Compensation 4
Q. PLEASE DESCRIBE THE INCENTIVE COMPENSATION ADJUSTMENT. 5
A. Consistent with prior rate case treatment, we have adjusted 2016 test year 6
costs to exclude the budgeted costs for: 1) the long-term portion of the 7
incentive compensation; 2) any non-corporate incentive plan costs; and 3) all 8
Annual Incentive Plan amounts above 15 percent of each individual’s base 9
pay. Company witness Ms. Ruth Lowenthal discusses incentive compensation 10
in her Direct Testimony. 11
12
This adjustment decreases test year revenue requirements by $12.645 million, 13
as shown on Schedule 11, Income Statement Adjustments, Page 1, Column 14
13. Support for this adjustment can be found in Volume 4 Test Year 15
Workpapers, Section VIII Adjustments, Tab A-10. 16
17
11) Investor Relations 18
Q. PLEASE DESCRIBE THE INVESTOR RELATIONS ADJUSTMENT. 19
A. Consistent with the outcome in Docket No. E002/GR-12-961, the Company 20
has removed 50 percent of all Investor Relation/Shareholder costs from the 21
2016 test year. Company witness Mr. Brian Van Abel explains the customer 22
benefits of the Investor Relations operations and the basis for the Company’s 23
proposal in his Direct Testimony. 24
25
Removing 50 percent of Investor Relations costs decreases the test year 26
revenue requirements by $0.475 million, as shown on Schedule 11, Income 27
78 Docket No. E002/GR-15-826 Heuer Direct
PUBLIC DOCUMENT: TRADE SECRET INFORMATION EXCISED – PUBLIC DATA –
Statement Adjustments, Page 1, Column 14. Support for this adjustment can 1
be found in Volume 4 Test Year Workpapers, Section VIII Adjustments, Tab 2
A-11. 3
4
12) Monticello LCM/EPU Return 5
Q. PLEASE DESCRIBE THE MONTICELLO LCM/EPU RETURN ADJUSTMENT. 6
A. The Commission’s Order in Docket No. E002/GR-13-868 required the 7
Company to adjust the return on rate base for this the Monticello LCM/EPU 8
project. Specifically, any portion in excess of $415 million as determined on a 9
total project basis must be adjusted to earn a zero return. In compliance with 10
this Order, the Company has computed the revenue requirement adjustment 11
to treat this portion of the project as having a zero return, and we have 12
reduced the requested deficiency accordingly by including an offset to the 13
deficiency in Other Revenues. 14
15
This adjustment decreases test year revenue requirements by $19.708 million 16
($16.582 million (IA)), as shown in Exhibit___(AEH-1), Schedule 20 17
Monticello LCM/EPU Project Return. This is also shown on Schedule 11, 18
Income Statement Adjustments, Page 1, Column 15. The Interchange offset 19
for this adjustment is included in base Interchange Agreement revenues as the 20
Interchange Agreement has been modified to incorporate the same return 21
adjustment as ordered by the MPUC. Because this adjustment includes a 22
return in the calculation, if return component weighted costs are adjusted 23
during this case, this adjustment will require a recalculation. 24
25
13) Nobles Amount over Certificate of Need 26
Q. PLEASE DESCRIBE THE NOBLES DISALLOWED ASSETS ADJUSTMENT. 27
79 Docket No. E002/GR-15-826 Heuer Direct
PUBLIC DOCUMENT: TRADE SECRET INFORMATION EXCISED – PUBLIC DATA –
A. The Commission’s Order in Docket No. E002/GR-12-961 required the 1
Company to amortize costs related to the Nobles Wind plant above the 2
amount estimated in the Company’s CON filing over the remaining life of the 3
plant. Specifically, the Commission ordered that the amortization includes a 4
return of, but not a return on, the $5.6 million (IA) jurisdictional cost. To 5
accomplish this, the Company continues to include all cost components in 6
base data, such as net investment in rate base and depreciation expense in the 7
income statement. To value the zero return on rate base, a rate base return 8
revenue requirement calculation is performed and included as other revenue 9
to reduce the deficiency for this return requirement. This is the same process 10
used to quantify earning a zero return on a portion of the Monticello 11
LCM/EPU project. 12
13
This adjustment decreases test year revenue requirements by $0.288 million, 14
as shown on Schedule 11, Income Statement Adjustments, Page 1, Column 15
16. Support for this adjustment can be found in Volume 4 Test Year 16
Workpapers, Section VIII Adjustments, Tab A-13. 17
18
14) Non-Qualified Pension Expense 19
Q. PLEASE DESCRIBE THE NON-QUALIFIED PENSION EXPENSE ADJUSTMENT. 20
A. This adjustment excludes from the 2016 test year all non-qualified pension 21
expenses related to the Company’s Supplemental Executive Retirement Plan 22
(SERP) and Restoration Plan. Non-qualified pension expenses are discussed 23
in the Direct Testimony of Ms. Lowenthal and Company witness Mr. Richard 24
R. Schrubbe. Our treatment of SERP costs in this case is consistent with 25
treatment of these costs in our last rate case, Docket No. E002/GR-13-868. 26
80 Docket No. E002/GR-15-826 Heuer Direct

PUBLIC DOCUMENT: TRADE SECRET INFORMATION EXCISED – PUBLIC DATA –
As discussed further by Ms. Lowenthal, we are making the adjustment for 1
Restoration Plan costs to reduce the number of disputed issues in this case. 2
3
Excluding non-qualified pension costs decreases test year revenue 4
requirements by of $1.410 million, as shown on Schedule 11, Income 5
Statement Adjustments, Page 2, Column 17. Support for this adjustment can 6
be found in Volume 4 Test Year Workpapers, Section VIII Adjustments, Tab 7
A-14. 8
9
C. Rate Case Adjustments 10
15) Aviation 11
Q. PLEASE DESCRIBE THE AVIATION ADJUSTMENT. 12
A. The Aviation adjustment removes 100 percent of the aviation-related costs to 13
the Minnesota electric jurisdiction. The NSPM electric utility was allocated 14
approximately $2.2 million in costs related to the operation of two Xcel 15
Energy corporate aircraft for use by Company personnel for 2016, with 16
approximately $1.9 million allocated to the Minnesota electric jurisdiction. 17
These costs are incurred in lieu of commercial aviation transportation and 18
help to facilitate the efficient use of executive time, as discussed by Company 19
witness Mr. Gary J. O’Hara. As further discussed by Mr. O’Hara, we are 20
making this adjustment to reduce the number of disputed issues in this case. 21
22
Removing 100 percent of aviation costs reduces test year revenue 23
requirements by $1.925 million, as shown on Schedule 11, Income Statement 24
Adjustments, Page 2, Column 18. Support for this adjustment can be found 25
in Volume 4 Test Year Workpapers, Section VIII Adjustments, Tab A-15. 26
27
81 Docket No. E002/GR-15-826 Heuer Direct
PUBLIC DOCUMENT: TRADE SECRET INFORMATION EXCISED – PUBLIC DATA –
16) Bad Debt Expense 1
Q. PLEASE DESCRIBE THE BAD DEBT EXPENSE ADJUSTMENT. 2
A. The original calculation for 2016 bad debt expense was generated during the 3
budget process and is a function of projected revenues multiplied by the bad 4
debt ratio for NSPM. Consistent with our usual test year preparation 5
processes, in developing the 2016 test year for this proceeding, an analysis was 6
performed to update the bad debt expense based upon the revised revenues 7
based upon the 2015 fall sales forecast. An adjustment is needed to 8
incorporate into the revenue requirement the updated bad debt amount, 9
which best reflects test year costs. This update resulted in an overall 10
reduction to the budgeted 2016 bad debt expense of approximately $0.824 11
million on a Total Company electric basis, and $0.729 million for the NSPM 12
Minnesota electric jurisdiction. 13
14
This adjustment decreases test year revenue requirements by $0.729 million, 15
as shown on Schedule 11, Income Statement Adjustments, Page 2, Column 16
19. Support for this adjustment can be found in Volume 4 Test Year 17
Workpapers, Section VIII Adjustments, Tab A-16. 18
19
17) CIP Approved Program Costs 20
Q. PLEASE DESCRIBE THE CIP APPROVED PROGRAM LEVELS ADJUSTMENT. 21
A. The 2016 test year CIP expenses and corresponding revenues have been set at 22
the 2016 level of $89.039 million as proposed in Docket E,G002/CIP-12-447. 23
24
Because we make corresponding adjustments to both revenue and expense, 25
this adjustment has no impact on the test year deficiency, as shown on 26
Schedule 11, Income Statement Adjustments, Page 2, Column 20. Support 27
82 Docket No. E002/GR-15-826 Heuer Direct
PUBLIC DOCUMENT: TRADE SECRET INFORMATION EXCISED – PUBLIC DATA –
for this adjustment can be found in Volume 4 Test Year Workpapers, Section 1
VIII Adjustments, Tab A-17. 2
3
I note that the decision of Deputy Commissioner of the Minnesota 4
Department of Commerce in Docket No. E,G002/CIP-12-447, authorizing a 5
higher level of CIP expenditures, was issued October 12, 2015. This timing 6
did not allow the Company to incorporate the approved levels in this initial 7
rate case filing. As I discuss in Section G below, the Company will propose 8
an adjustment in Rebuttal Testimony to increase the CIP expenditures and 9
offsetting revenues to reflect the final authorized level in the test year. 10
11
18) CIP Incentive 12
Q. PLEASE DESCRIBE THE CIP INCENTIVE ADJUSTMENT. 13
A. The CIP performance incentive is designed to compensate the Company for 14
lost sales due to Company conservation efforts. The annual projected CIP 15
performance incentive margin is included in the Other Revenue budget. The 16
CIP performance margin is intended as an incentive to the Company and 17
represents budgeted level in anticipation of achieving the 2016 CIP goals. An 18
adjustment is necessary to remove the estimated 2016 performance margin 19
from the 2016 test year. Failure to include this adjustment would flow the 20
annual CIP performance incentive to customers by overstating the 2016 test 21
year operating revenues and therefore understating the revenue deficiency for 22
the test year. 23
24
This adjustment increases test year revenue requirements by $23.670 million, 25
as shown on Schedule 11, Income Statement Adjustments, Page 2, Column 26
83 Docket No. E002/GR-15-826 Heuer Direct
PUBLIC DOCUMENT: TRADE SECRET INFORMATION EXCISED – PUBLIC DATA –
21. Support for this adjustment can be found in Volume 4 Test Year 1
Workpapers, Section VIII Adjustments, Tab A-18. 2
3
19) Employee Expenses 4
Q. PLEASE DESCRIBE THE EMPLOYEE EXPENSES ADJUSTMENT. 5
A. The employee expense adjustment accounts for employee expenses that 6
appear inconsistent with the guidelines in our employee expense policy, or 7
identified as generally not being needed for the provision of utility service. 8
Our adjustment in this case is consistent with employee expense adjustments 9
we have made in prior rate cases. Mr. O’Hara provides the background and 10
basis for the Employee Expense adjustment in his Direct Testimony. 11
12
The employee expense adjustment decreases test year revenue requirements 13
by $1.613 million, as shown on Schedule 11, Income Statement Adjustments, 14
Page 2, Column 22. Support for this adjustment is in Volume 4 Test Year 15
Workpapers, Section VIII Adjustments, Tab A-19. 16
17
20) Like Kind Exchange Program 18
Q. PLEASE DESCRIBE THE LIKE KIND EXCHANGE PROGRAM ADJUSTMENT. 19
A. There is an additional reserve adjustment due to the net salvage recognition 20
associated with the Like Kind Exchange Program, which replaces projects 21
with new projects similar in scope, timing, and cost to the original projects. 22
Ms. Perkett provides the background and basis for the Like Kind Exchange 23
Program adjustment in her Direct Testimony. 24
25
This adjustment decreases test year rate base by $2.961 million, as shown on 26
Schedule 10, Rate Base Adjustments, Page 1, Column 5. The adjustment 27
84 Docket No. E002/GR-15-826 Heuer Direct

PUBLIC DOCUMENT: TRADE SECRET INFORMATION EXCISED – PUBLIC DATA –
decreases test year revenue requirements by $0.324 million, as shown on 1
Schedule 11, Income Statement Adjustments, Page 2, Column 23. 2
3
21) Nuclear Retention 4
Q. PLEASE DESCRIBE THE NUCLEAR RETENTION REMOVAL ADJUSTMENT. 5
A. The nuclear retention removal adjustment eliminates from the 2016 test year 6
all costs associated with the Nuclear Retention program. As Company 7
witness Mr. O’Connor discusses further in his testimony, we are making this 8
adjustment to reduce the number of disputed issues in this case. 9
10
Removing nuclear retention program costs decreases test year revenue 11
requirements by $0.793 million, as shown on Schedule 11, Income Statement 12
Adjustments, Page 2, Column 24. Support for this adjustment can be found 13
in Volume 4 Test Year Workpapers, Section VIII Adjustments, Tab A-21. 14
15
22) Other Revenue Three-Year Average 16
Q. PLEASE DESCRIBE THE OTHER REVENUE THREE-YEAR AVERAGE 17
ADJUSTMENT. 18
A. Consistent with the Commission’s order in Docket No. E002/GR-12-961, we 19
are making an adjustment in this case to reflect a three-year average (2013 and 20
2014 Actual, and 2015 Bridge year) of certain Other Revenues to ensure a 21
representative level is included in the 2016 test year. In developing our 22
average, we did not include categories of revenue that are not included in the 23
test year (for example, Windsource and Service Quality). The three-year 24
average adjustment resulted from a comparison of the three-year average to 25
the 2016 test year amounts. 26
27
85 Docket No. E002/GR-15-826 Heuer Direct
PUBLIC DOCUMENT: TRADE SECRET INFORMATION EXCISED – PUBLIC DATA –
This adjustment decreases test year revenue requirements by $1.123 million, 1
as shown on Schedule 11, Income Statement Adjustments, Page 2, Column 2
25. Support for this adjustment can be found in Volume 4 Test Year 3
Workpapers, Section VIII Adjustments, Tab A-22. 4
5
Q. WHY IS IT APPROPRIATE TO USE A THREE-YEAR AVERAGE FOR OTHER 6
REVENUES BUT NOT FOR OTHER REVENUE OR EXPENSE ITEMS? 7
A. Historically, Other Revenues have shown substantial variability and do not 8
reflect trends. Unlike the category of Other Revenues, a more accurate 9
reflection of the various other items of revenue and expense can be obtained 10
by analysis of trends and other specific factors that are reflected in our 11
budgeting process. 12
13
23) Retiree Medical Discount Rate 14
Q. PLEASE DESCRIBE THE RETIREE MEDICAL DISCOUNT RATE ADJUSTMENT. 15
A. The Commission’s Order in Docket No. E002/GR-13-868 states the 16
discount rate used to calculate retiree medical benefit costs for ratemaking 17
purposes shall be set to equal the five-year average of the FAS 106-based 18
discount rates. An adjustment is necessary to reflect the use of the five-year 19
average discount rate to calculate retiree medical benefits and reflect the 20
appropriate expense level in the test year. Mr. Schrubbe discusses retiree 21
medical benefits and the discount rate in his Direct Testimony. 22
23
This adjustment decreases test year revenue requirements by $0.376 million, 24
as shown on Schedule 11, Income Statement Adjustments, Page 2, Column 25
26. Support for this adjustment can be found in Volume 4 Test Year 26
Workpapers, Section VIII Adjustments, Tab A-23. 27
28 86 Docket No. E002/GR-15-826
Heuer Direct
PUBLIC DOCUMENT: TRADE SECRET INFORMATION EXCISED – PUBLIC DATA –
24) Pension Expense Smoothing 1
Q. PLEASE DESCRIBE THE PENSION PLAN SMOOTHING ADJUSTMENT. 2
A. In Docket No. E002/GR-12-961, the Commission adopted the Company’s 3
alternative proposal to cap Xcel Energy Services (XES) pension expense at 4
the 2011 level, defer any excess amounts, and amortize the deferred amounts 5
over future years. This alternative treatment had been offered as a method to 6
smooth recovery of the expense and mitigate rate impacts. An adjustment is 7
necessary to reflect the 2011 XES pension expense level in 2016, and reflect 8
the resulting change in the amount amortized in the 2016 test year. Mr. 9
Schrubbe discusses pension expense in detail in his Direct Testimony. 10
11
This adjustment increases 2016 test year revenue requirements by $0.018 12
million, as shown on Schedule 11, Income Statement Adjustments, Page 2, 13
Column 27. Support for this adjustment can be found in Volume 4 Test Year 14
Workpapers, Section VIII Adjustments, Tab A-24. 15
16
25) Remaining Life Depreciation Study – NSPM 17
Q. PLEASE DESCRIBE THE 2015 REMAINING LIFE DEPRECIATION STUDY 18
ADJUSTMENT FOR NSPM. 19
A. This adjustment updates the test year to include the impact of Docket No. 20
E,G002/D-15-46). In the 2015 Remaining Lives filing, we proposed 21
modifications to the remaining lives for the Blue Lake Units 1-4, Red Wing, 22
and Wilmarth production plants. In addition to remaining life changes we are 23
also recommending updates to net salvage rates for electric production 24
facilities based on a new 5-year dismantling study and the discontinuation of 25
the use of probabilities in our dismantling analysis. Support for these changes 26
included provided by Ms. Perkett in her Direct Testimony. 27
28 87 Docket No. E002/GR-15-826
Heuer Direct
PUBLIC DOCUMENT: TRADE SECRET INFORMATION EXCISED – PUBLIC DATA –
This adjustment decreases test year rate base by $0.373 million, as shown on 1
Schedule 10, Rate Base Adjustments, Page 1, Column 6. The adjustment 2
increases test year revenue requirements by $1.037 million (IA), as shown on 3
Schedule 11, Income Statement Adjustments, Page 2, Column 28. Support 4
for this adjustment can be found in Volume 4 Test Year Workpapers, Section 5
VIII Adjustments, Tab A-25. 6
7
I note that on October 22, 2015, the Commission made a decision at the 8
hearing in our Remaining Lives proceeding. This timing did not allow the 9
Company to incorporate in this initial rate case filing the Commission’s 10
decision on the remaining lives of three production plants. As I discuss in 11
Section G below, the Company will propose an adjustment in Rebuttal 12
Testimony to reflect the Commission’s decision in this docket. 13
14
26) Remaining Life Depreciation Study – NSPW 15
Q. PLEASE DESCRIBE THE 2015 REMAINING LIFE DEPRECIATION STUDY 16
ADJUSTMENT FOR NSPW. 17
A. This adjustment updates the test year to include the impact of remaining life 18
changes to production facilities located in Wisconsin and shared between 19
NSPM and NSPW through the Interchange Agreement. These changes 20
reflect the Public Service Commission of Wisconsin (PSCW) October 22, 21
2015 Order in Docket No. 4220-DU-109. The primary change is a life 22
extension of the Bayfront plant from a remaining life of 5 years to 19 years. 23
In this docket the PSCW also approved minor extensions to the Saxton and 24
French Island hydro facilities. This results in reduced billings from 25
Wisconsin, resulting in a reduction to the Minnesota retail jurisdiction revenue 26
requirements. 27
28 88 Docket No. E002/GR-15-826
Heuer Direct
PUBLIC DOCUMENT: TRADE SECRET INFORMATION EXCISED – PUBLIC DATA –
This adjustment reduces test year revenue requirements by $4.215 million, as 1
shown on Schedule 11, Income Statement Adjustments, Page 2, Column 29. 2
Support for this adjustment can be found in Volume 4 Test Year Workpapers, 3
Section VIII Adjustments, Tab A-26. 4
5
27) Trading – Asset Based Margin 6
Q. PLEASE DESCRIBE THE ASSET BASED MARGIN ADJUSTMENT. 7
A. Consistent with our process to develop test year base rates, the adjustment to 8
Asset Based Margins excludes the budgeted asset based energy sales margins 9
from the test year. As I previously explained, asset based energy sales margins 10
are passed through to customers through the FCA. Accordingly, this 11
adjustment ensures no double counting occurs between base rates and the 12
FCA. 13
14
This adjustment increases test year revenue requirements by $17.221 (IA), as 15
shown on Schedule 11, Income Statement Adjustments, Page 2, Column 30. 16
This increase is offset by the amount of actual asset based margins credited to 17
the fuel cost revenue requirement on a going forward basis in the FCA. 18
Support for this adjustment can be found in Volume 4 Test Year Workpapers, 19
Section VIII Adjustments, Tab A-27. 20
21
28) Trading – Non-Asset Based Administration 22
Q. PLEASE DESCRIBE THE NON-ASSET TRADING ADJUSTMENT RELATED TO 23
ADMINISTRATION. 24
A. This adjustment excludes the fully allocated non-asset based trading O&M 25
and associated IT costs from the test year deficiency based on a cost study. 26
The cost study measures the fully allocated non-asset based trading costs 27
89 Docket No. E002/GR-15-826 Heuer Direct

PUBLIC DOCUMENT: TRADE SECRET INFORMATION EXCISED – PUBLIC DATA –
included in the 2016 capital and O&M budget and is provided as 1
Exhibit___(AEH-1), Schedule 18, Non-Asset Based Trading Cost Study. 2
3
This adjustment decreases test year revenue requirements by $0.985 million, 4
as shown on Schedule 11, Income Statement Adjustments, Page 2, Column 5
31. Support for this adjustment can be found in Volume 4 Test Year 6
Workpapers, Section VIII Adjustments, Tab A-28. 7
8
29) Trading – Non-Asset Based Margin 9
Q. PLEASE DESCRIBE THE NON-ASSET BASED MARGIN ADJUSTMENT. 10
A. Consistent with our process to develop test year base rates, the adjustment to 11
Non-Asset Based Margins excludes the non-asset based trading margins from 12
the test year so that the Company retains all margins resulting from non-asset 13
based trading activity. As discussed above, the Company excludes from the 14
test year the fully allocated costs of performing activities associated with 15
achieving these trades. 16
17
This adjustment increases test year revenue requirements by $3.099 million, as 18
shown on Schedule 11, Income Statement Adjustments, Page 2, Column 32. 19
Support for this adjustment is in Volume 4 Test Year Workpapers, Section 20
VIII Adjustments, Tab A-29. 21
22
30) XES Allocation on Labor Hours 23
Q. PLEASE DESCRIBE THE ADJUSTMENT TO ALLOCATE XES COSTS BASED ON 24
LABOR HOURS RATHER THAN EMPLOYEE COUNT. 25
A. Xcel Energy’s budgeting method of allocating XES costs to operating 26
companies involves many factors, some of which are based on a three-part 27
90 Docket No. E002/GR-15-826 Heuer Direct
PUBLIC DOCUMENT: TRADE SECRET INFORMATION EXCISED – PUBLIC DATA –
general allocator that uses number of employees as one of the three factors. 1
The Commission’s Order in Docket No. E,G002/AI-10-690 required the 2
Company to use a general allocator that replaces number of employees with 3
allocated labor hours with overtime. An adjustment is necessary to recalculate 4
the allocations using the general allocator to one using labor hours with 5
overtime rather than number of employees. Mr. Dietenberger discusses this 6
change and provides additional detail in his Direct Testimony. 7
8
This adjustment decreases test year revenue requirements by $1.475 million, 9
as shown on Schedule 11, Income Statement Adjustments, Page 3, Column 10
33. Support for this adjustment can be found in Volume 4 Test Year 11
Workpapers, Section VIII Adjustments, Tab A-30. 12
13
D. Amortizations 14
31) Prairie Island EPU Deferred Costs 15
Q. PLEASE EXPLAIN THE ADJUSTMENT NEEDED TO RECOVER THE PRAIRIE 16
ISLAND EPU DEFERRED COSTS. 17
A. The Commission’s Order in Docket No. E002/GR-13-868 approved the 18
recovery of the abandoned Prairie Island EPU project costs over the 19
remaining life of the plant through an amortization expense. The Order also 20
approved this unrecovered investment in rate base. A third provision limited 21
the return on rate base related to this project to the weighted cost of debt. 22
23
Q. PLEASE DESCRIBED THE ADJUSTMENTS INCLUDED IN THE 2016 COSS TO 24
COMPLY WITH THIS ORDER. 25
A. First, the various rate base and income statement components related to the 26
amortization of this deferred cost are input as an adjustment to the cost of 27
91 Docket No. E002/GR-15-826 Heuer Direct

PUBLIC DOCUMENT: TRADE SECRET INFORMATION EXCISED – PUBLIC DATA –
service. This results in the calculation of the overall revenue requirement 1
associated with this project. Embedded in these calculations is a computation 2
of return on rate base at the overall weighted cost of capital (debt and equity). 3
To adjust for the ordered weighted cost of debt return requirement, the 4
Company computes the revenue requirements associated with the weighted 5
cost of equity and includes the result of this calculation as Other Revenues to 6
reduce the deficiency by this amount. The Minnesota jurisdictional revenue 7
requirement for the deferral and amortization equals $6.234 million (IA). The 8
revenue requirement offset to reduce this requirement to limit the return on 9
rate base to the weight cost of debt equals $2.694 million (IA). Support for 10
these adjustments can be found in Exhibit (AEH-1), Schedule 21, PI EPU 11
Recovery. 12
13
This adjustment increases test year rate base by $30.407 million, as shown on 14
Schedule 10, Rate Base Adjustments, Page 1, Column 7. The adjustment 15
increases test year revenue requirements by $3.540 million (IA), as shown on 16
Schedule 11, Income Statement Adjustments, Page 3, Column 34. Support 17
for this adjustment can be found in Volume 4 Test Year Workpapers, Section 18
VIII Adjustments, Tab A-31. Because this adjustment includes a return in the 19
calculation, this adjustment will require a recalculation if return component 20
weighted costs are adjusted during this case. 21
22
32) Rate Case Expense 23
Q. PLEASE DESCRIBE THE RATE CASE EXPENSE AMORTIZATION. 24
A. The Company is requesting authorization to recover a total of $1.113 million 25
in rate case costs in the 2016 test year. This is the first year of a three-year 26
amortization based upon total anticipated rate case costs of $3.340 million. 27
92 Docket No. E002/GR-15-826 Heuer Direct
PUBLIC DOCUMENT: TRADE SECRET INFORMATION EXCISED – PUBLIC DATA –
We are requesting recovery of these costs over the three-year period 2016 1
through 2018, consistent with our Multi-Year Rate Plan. The Company 2
proposes to return any over-recovery of rate case expenses if the collection 3
continues beyond the three-year amortization period by crediting the revenue 4
requirement in our next rate case. Support for these adjustments can be 5
found in Exhibit (AEH-1), Schedule 22, Rate Case Expense Amortization. 6
7
This adjustment increases test year revenue requirements by $1.113 million, as 8
shown on Schedule 11, Income Statement Adjustments, Page 3, Column 35. 9
Support for this adjustment can be found in Volume 4 Test Year Workpapers, 10
Section VIII Adjustments, Tab A-32. 11
12
33) Sherco 3 Depreciation 13
Q. PLEASE DESCRIBE THE SHERCO 3 DEPRECIATION DEFERRAL AMORTIZATION. 14
A. The Commission’s Order in Docket No. E002/GR-12-961 requires that the 15
depreciation expense incurred for Sherco 3 during the extended repair outage 16
following the 2011 catastrophic event must be deferred and amortized over 17
the remaining life of the plant. 18
19
The adjustment to reflect the amortization of Sherco 3 depreciation costs 20
increases test year rate base by $5.509 million as shown on Schedule 10, Page 21
1, Column 8, and increases revenue requirements by $1.110 million, as shown 22
on Schedule 11, Income Statement Adjustments, Page 3, Column 36. Support 23
for this adjustment can be found in Volume 4 Test Year Workpapers, Section 24
VIII Adjustments, Tab A-33. 25
26
93 Docket No. E002/GR-15-826 Heuer Direct

PUBLIC DOCUMENT: TRADE SECRET INFORMATION EXCISED – PUBLIC DATA –
34) Transco Costs 1
Q. PLEASE DESCRIBE THE TRANSCO AMORTIZATION. 2
A. On August 3, 2015, in Docket No. E002/AI-14-759, the Commission 3
approved the Company’s request for an Affiliated Interest Agreement with a 4
newly formed Transco. In the Company’s original petition, we proposed to 5
track and defer the costs that had been included in the 2014 rate case test year 6
(Docket No. E002/GR-13-868) but supported activities associated with Xcel 7
Energy Inc.’s Transco initiative. The costs deferred would then be included 8
as a credit in the cost of service in the Company’s next electric rate case. The 9
Transco amortization reflects that credit of $138,450 amortized over a three 10
year period, as provided in the Company’s Compliance Filing in Docket No. 11
E002/AI-14-759. 12
13
The adjustment to reflect the amortization of Transco costs decreases test 14
year revenue requirements by $0.046 million, as shown on Schedule 11, 15
Income Statement Adjustments, Page 3, Column 37. Support for this 16
adjustment can be found in Volume 4 Test Year Workpapers, Section VIII 17
Adjustments, Tab A-34. 18
19
E. Rider Removals 20
35) RES Rider 21
Q. PLEASE DESCRIBE THE RES RIDER REMOVAL ADJUSTMENT. 22
A. As I describe in detail in Section VIII, Costs Recovered in Riders, we propose 23
continued use of the RES Rider during the multi-year rate plan period. 24
Specifically, we propose to include the costs and Production Tax Credits 25
(PTCs) related to the Courtenay wind project in the RES Rider. For PTCs 26
related to energy production at other Company-owned wind farms, currently 27
94 Docket No. E002/GR-15-826 Heuer Direct
PUBLIC DOCUMENT: TRADE SECRET INFORMATION EXCISED – PUBLIC DATA –
included in base rates, we propose to continue the true-up to actual PTCs in 1
the RES Rider. Finally, should the Company sell any Renewable Energy 2
Credits (RECs), the proceeds from those sales would be shared with 3
customers through the RES Rider. These proposals are consistent with our 4
2016 RES Rider filing in Docket No. E002/M-15-809. 5
6
The RES Rider removal adjustment removes all costs and revenues from the 7
test year jurisdictional cost of service for projects that will continue cost 8
recovery in the rider after the implementation of final rates in this case. The 9
RES Rider test year adjustment ensures no double recovery of these costs. 10
11
Q. WHAT COSTS ARE INCLUDED IN THE RES RIDER REMOVAL ADJUSTMENT FOR 12
THE 2016 TEST YEAR? 13
A. The only costs included in our proposed adjustment to the test year are the 14
costs and revenues for the Courtenay wind project. Costs or revenues 15
associated with the PTC true-up and RECs sales occur only on an actual basis 16
and, as such, require no test year adjustment. 17
18
This adjustment decreases test year rate base by $134.116 million, as shown 19
on Schedule 10, Rate Base Adjustments, Page 1, Column 9. The adjustment 20
increases test year revenue requirements by $0.122 million (IA), as shown on 21
Schedule 11, Income Statement Adjustments, Page 3, Column 38. Support 22
for this adjustment can be found in Volume 4 Test Year Workpapers, Section 23
VIII Adjustments, Tab A-35. 24
25
36) TCR Rider 26
Q. PLEASE DESCRIBE THE TCR RIDER REMOVAL ADJUSTMENT. 27
28 95 Docket No. E002/GR-15-826
Heuer Direct

PUBLIC DOCUMENT: TRADE SECRET INFORMATION EXCISED – PUBLIC DATA –
A. As I describe in detail in Section VIII, Costs Recovered in Riders, and as 1
described in our recent 2016 TCR Rider true-up report,3 we propose 2
continued use of the TCR Rider during the multi-year rate plan period. 3
Specifically, we propose to continue use of the TCR Rider for three projects 4
and MISO Regional Expansion Criteria and Benefits (RECB) Schedule 26 and 5
26A revenues net of expenses. The TCR Rider removal adjustment removes 6
all costs and revenues from the test year jurisdictional cost of service for the 7
CapX2020 La Crosse, Big Stone-Brookings, and La Crosse-Madison projects 8
and MISO RECB Schedule 26 and 26A net revenues. In our 2016 TCR Rider 9
filing, we proposed to include these project costs and revenues in the TCR 10
Rider, and to continue cost recovery for these projects in the rider after the 11
implementation of final rates in this case. The TCR Rider test year 12
adjustment ensures no double recovery of these costs. 13
14
We also propose to move two projects currently in the rider to base rates at 15
the conclusion of this rate case. As I describe in detail in Section VIII, Costs 16
Recovered in Riders, the 2016 test year reflects our proposal to move the 17
CapX2020 Brookings and CapX2020 Fargo projects from the TCR Rider to 18
base rates upon implementation of final rates in this case, as these projects 19
will be in service by the end of this year. Thus no adjustment to test year 20
costs is necessary for these two projects. However, as costs for these projects 21
will remain in the TCR Rider during the period interim rates are in effect, an 22
interim rate adjustment necessary to ensure no double recovery of these costs 23
3 Petition and Compliance Filing, Docket No. E002/M-15-891 (Oct. 1, 2015) (2016 TCR Rider Filing). We plan to supplement this filing in early November to confirm our request for TCR Rider recovery during the Interim Rate period.
96 Docket No. E002/GR-15-826 Heuer Direct
PUBLIC DOCUMENT: TRADE SECRET INFORMATION EXCISED – PUBLIC DATA –
during the interim rate period. I describe this interim rate adjustment in detail 1
in Section VIII. 2
3
Q. IS THE TCR RIDER REMOVAL BASED ON THE SAME DATA AS WAS USED IN THE 4
2016 TCR RIDER FILING? 5
A. No, the vintage of data differs between the rate case test year and our TCR 6
Rider filing. As explained in Section III, Supporting Information, the 2016 7
test year plant related budget data uses actual information through April 2015. 8
Therefore, in order to remove the amounts included in the test year, the TCR 9
Rider adjustment is developed using the same four months of 2015 actual 10
data. However, because the TCR Rider filing is more limited in scope, we 11
were able to incorporate more current data when preparing that filing. 12
Although the vintage of data differs between the test year and the TCR Rider 13
filing, we used the same project and the same vintage of data for both the test 14
year and test year adjustment calculations, ensuring all costs initially included 15
in the test year data that are being recovered in the Rider are removed. 16
17
Q. PLEASE QUANTIFY THE COSTS INCLUDED IN THE TCR RATE RIDER REMOVAL 18
ADJUSTMENT FOR THE 2016 TEST YEAR. 19
A. This adjustment includes project costs, MISO RECB Schedule 26 and 26A 20
net revenue, and TCR Rider present revenue associated with these items that 21
are proposed to be included in the TCR Rider after the implementation of 22
final rates. 23
24
Q. PLEASE EXPLAIN WHY THE TCR RIDER ADJUSTMENT, WHICH REMOVES BOTH 25
PRESENT REVENUES AND PROJECT REVENUE REQUIREMENTS, DOES NOT 26
RESULT IN A ZERO IMPACT TO THE TEST YEAR DEFICIENCY. 27
97 Docket No. E002/GR-15-826 Heuer Direct
PUBLIC DOCUMENT: TRADE SECRET INFORMATION EXCISED – PUBLIC DATA –
A. The TCR Rider present revenue is calculated based on the most recently 1
authorized overall rate of return. The TCR Project revenue requirement 2
included in the rate case is calculated based on the test year overall rate of 3
return, which is being proposed with this rate case. Thus, the present revenue 4
and the revenue requirement are not exactly the same. 5
6
Q. PLEASE QUANTIFY THE TCR RIDER REMOVAL ADJUSTMENT FOR THE TEST 7
YEAR. 8
A. This adjustment decreases test year rate base by $241.455 million, as shown 9
on Schedule 10, Rate Base Adjustments, Page 1, Column 7. The adjustment 10
decreases test year revenue requirements by $0.233 million (IA), as shown on 11
Schedule 11, Income Statement Adjustments, Page 3, Column 39. Support 12
for this adjustment can be found in Volume 4 Test Year Workpapers, Section 13
VIII Adjustments, Tab A-36. 14
15
37) Windsource Removal and Avoided Capacity 16
Q. PLEASE DESCRIBE THE WINDSOURCE REMOVAL AND AVOIDED CAPACITY 17
ADJUSTMENT. 18
A. The Windsource program is a stand-alone retail service program with discrete 19
revenues, purchase power contracts and operating expenses. We have 20
excluded all Windsource revenues and associated expenses from our 2016 test 21
year revenue requirements determination, which reduces test year revenue 22
requirements by $0.368 million. 23
24
Including wind energy generation as part of a utility’s resource mix means that 25
the utility avoided building or purchasing from other sources. The kWh cost 26
of wind energy purchased by a utility includes a capacity factor or value which 27
98 Docket No. E002/GR-15-826 Heuer Direct
PUBLIC DOCUMENT: TRADE SECRET INFORMATION EXCISED – PUBLIC DATA –
would otherwise have been included in the utility’s base rates and paid by all 1
ratepayers because all ratepayers benefit from the capacity. This capacity 2
credit is subtracted from the Windsource rate because it is a cost that should 3
be shared by all customers, rather than only Windsource customers. An 4
adjustment to increase test year revenue requirements by $0.579 million is 5
necessary to include this amount in the test year. The Direct Testimony of 6
Company witness Mr. Michael A. Peppin further supports the development 7
of the Windsource avoided capacity credit. 8
9
The net of these two adjustments increases test year revenue requirements by 10
$0.210 million, as shown on Schedule 11, Income Statement Adjustments, 11
Page 3, Column 40. Support for this adjustment can be found in Volume 4 12
Test Year Workpapers, Section VIII Adjustments, Tab A-37. 13
14
F. Secondary Cost of Service Calculations 15
38) ADIT Pro-Rate – IRS Required 16
Q. PLEASE DESCRIBE THE ADIT PRO-RATE ADJUSTMENT THAT IS REQUIRED BY 17
THE IRS AND INCLUDED IN THESE SECONDARY CALCULATIONS? 18
A. In general, the IRS tax regulations in Sec. 1.167(l) define a pro-rated schedule 19
for the extent average accumulated deferred income taxes can be used to 20
reduce rate base to comply with the tax normalization requirements of the 21
Code when forecast information is used to set rates. Given that the multi-22
year rate plan filed by the Company utilizes forecast test year data, this 23
condition applies. This has been supported by a number of Private Letter 24
Rulings (PLRs) issued by the IRS. 25
26
99 Docket No. E002/GR-15-826 Heuer Direct

PUBLIC DOCUMENT: TRADE SECRET INFORMATION EXCISED – PUBLIC DATA –
This secondary calculation limits the ADIT deduction from rate base by 1
applying the IRS defined pro-rate method to only the forecast entries to this 2
balance. Support for this calculation is included in Exhibit (AEH-1), 3
Schedule 23, ADIT Pro-Rate. The IRS requirements and mechanics of this 4
adjustment are described in more detail in the direct testimony of Ms. Perkett. 5
6
This adjustment increases test year rate base by $57.910 million, as shown on 7
Schedule 10, Rate Base Adjustments, Page 1, Column 11. The adjustment 8
increases test year revenue requirements by $6.335 million, as shown on 9
Schedule 11, Income Statement Adjustments, Page 3, Column 41. Support 10
for this adjustment can be found in Volume 4 Test Year Workpapers, Section 11
VIII Adjustments, Tab A-38. 12
13
39) Cash Working Capital Adjustment 14
Q. PLEASE DESCRIBE THE CASH WORKING CAPITAL ADJUSTMENT BEING MADE 15
AS A SECONDARY CALCULATION. 16
A. As discussed earlier in Section E, Other Rate Base, the Company has 17
incorporated a secondary calculation to apply the various revenue lead days 18
and expense lag days to the various income statement components to result 19
in the appropriate cash working capital rate base adjustment. The 20
incremental cash working capital adjustment to rate base associated with the 21
various incremental adjustments to the unadjusted base data equals $13.041 22
million, as shown on Schedule 10, Page 1, Column 12. This increase in cash 23
working capital increases test year revenue requirements $1.427 million, as 24
shown on Schedule 11, Income Statement Adjustments, Page 3, Column 42. 25
Support for this adjustment can be found in Volume 4 Test Year 26
Workpapers, Section VIII Adjustments, Tab A-39. 27
28 100 Docket No. E002/GR-15-826
Heuer Direct
PUBLIC DOCUMENT: TRADE SECRET INFORMATION EXCISED – PUBLIC DATA –
40) Change in Cost of Capital 1
Q. PLEASE DESCRIBE THE IMPACT OF THE CHANGE IN THE COST OF CAPITAL 2
ADJUSTMENT. 3
A. The change in the cost of capital adjustment is the effect of the change in the 4
overall cost of capital between the cost of capital (also referred to as the 5
overall rate of return, or ROR) being requested in this case of 7.49 percent 6
and the effective cost of capital authorized in Docket No. E002/GR-13-868 7
of 7.34 percent, an increase in the overall cost of capital of 0.15 percent. 8
9
On Schedule 11, Income Statement Adjustments, the revenue deficiencies for 10
the base data and all other adjustments is calculated at the 7.34 percent overall 11
cost of capital. This adjustment calculates the required operating income 12
resulting from the change in the overall cost of capital applied to the 13
requested rate base. The requested rate base on Schedule 10, Page 1, Column 14
15, line 42 of $7,836.115 million times 0.15 percent (7.49 percent - 7.34 15
percent) equals $11.754 million. The required operating income times the 16
revenue conversion factor (1.705611) results in the change in the cost of 17
capital revenue deficiency of $20.048 million. 18
19
We calculated the revenue deficiencies in this manner so that changes, if any, 20
in the overall cost of capital that occurs during the duration of the rate case 21
do not affect the revenue requirements for each adjustment. The adjustment 22
reflects both the change in the in ROE from 9.72 percent to 10.00 percent 23
and the changes in short term and long term debt. 24
25
101 Docket No. E002/GR-15-826 Heuer Direct
PUBLIC DOCUMENT: TRADE SECRET INFORMATION EXCISED – PUBLIC DATA –
This adjustment increases test year revenue requirements by $20.048 million, 1
as shown on Schedule 11, Income Statement Adjustments, Page 3, 2
Column 43. 3
4
41) Net Operating Loss 5
Q. PLEASE DESCRIBE THE COMPANY’S NET OPERATING LOSS POSITION. 6
A. The NSPM income tax determination has been in a net operating loss 7
position since 2010. This means that more deductions exist in the current 8
period than is needed to bring current taxable income to zero. As a result, 9
excess deductions and unused credits were deferred and tracked for use in 10
future periods. The Company worked with the Department on this issue, 11
which resulted in a process for reporting these deferred balances and 12
returning to customers the revenue requirement reduction associated with the 13
utilization of these deferred balances in the form of a refund or as a reduction 14
to base rates. 15
16
Net Operating Losses and the associated ratemaking treatment are discussed 17
in detail earlier in my testimony in Section V. D. Taxes. 18
19
Q. IS THE COMPANY PROPOSING AN ADJUSTMENT TO BASE RATES RELATED TO 20
NET OPERATING LOSSES IN THIS CASE? 21
A. Yes. As a result of the ongoing reporting and tracking, the Company has 22
completed its compliance reporting of balances beginning with the 2010 tax 23
year. Based on the results of the 2016 test year cost of service study, the 24
Company is able to utilize the remainder of the deductions previously 25
deferred. In order to return the value of this utilization to customers as soon 26
102 Docket No. E002/GR-15-826 Heuer Direct

PUBLIC DOCUMENT: TRADE SECRET INFORMATION EXCISED – PUBLIC DATA –
as possible, the Company has included an adjustment in the test year to 1
reduce the overall revenue requirement by the value of this utilization. 2
3
The result of including this adjustment in the test year is reflected on 4
Schedule 10, Rate Base Adjustments, Page 1, Column 2, for the base data, 5
decreasing test year rate base by approximately $54.005 million, and on 6
Schedule 10, Page 1, Column 14, for the adjustments, decreasing test year rate 7
base by approximately $3.818 million. The adjustment is also reflected on 8
Schedule 11, Income Statement Adjustments, Page 1, Column 2, for the base 9
data, decreasing test year revenue requirements by $9.498 million, and on 10
Schedule 11, Page 3, Column 44, for the adjustments, decreasing test year 11
revenue requirements by $1.365 million. It should be noted that these 12
references also include the impact of Section 199 Manufacture Production 13
Tax Deductions. Support for this adjustment can be found in Volume 4 Test 14
Year Workpapers, Section VIII Adjustments, Tab A-41 and 15
Exhibit___(AEH-1), Schedule 24, Net Operating Loss. 16
17
G. Rebuttal Adjustments 18
Q. WHAT INFORMATION DO YOU PROVIDE IN THIS SECTION? 19
A. In this section, I provide details related to five adjustments to the test year 20
cost of service that we plan to incorporate into the 2016 test year revenue 21
requirement when we file Rebuttal Testimony. These adjustments reflect 22
necessary changes we identified after we finalized our cost of service that we 23
were not able to incorporate due to timing constraints. In total, they result in 24
a net $7.430 million decrease to the 2016 test year revenue requirement. These 25
adjustments are for the following items: 26
1) Remaining Lives – NSPM 27
103 Docket No. E002/GR-15-826 Heuer Direct
PUBLIC DOCUMENT: TRADE SECRET INFORMATION EXCISED – PUBLIC DATA –
2) Hollydale Transmission Costs 1
3) Prairie Island Indian Community Settlement Agreement 2
4) Economic Development Administration 3
5) CIP Approved Program Costs 4
5
Q. DID YOU ADJUST INTERIM RATES FOR THESE REBUTTAL ADJUSTMENTS? 6
A. Yes. We adjusted Interim Rates for the material Remaining Lives adjustment 7
described below. This adjustment reduces our Interim Rate request by $8.046 8
million. 9
10
Q. ARE THERE OTHER POTENTIAL REBUTTAL ADJUSTMENTS? 11
A. Yes. Below I also discuss two potential rebuttal adjustments that may be 12
necessary to include in Rebuttal Testimony if we have additional information 13
at that time. These adjustments are related to: 14
6) Bonus Tax Depreciation 15
7) MISO ROE Complaints 16
17
Q. DID YOU ADJUST INTERIM RATES FOR THESE POTENTIAL REBUTTAL 18
ADJUSTMENTS? 19
A. No. We do not have certainty with respect to timing or amounts for these 20
items. Therefore, we do not have enough information at this time to make an 21
Interim Rate adjustment. 22
23
1) Remaining Lives – NSPM (Rebuttal Adjustment) 24
Q. PLEASE DESCRIBE THE COMPANY’S PROPOSED REBUTTAL ADJUSTMENT 25
RELATED TO THE NSPM REMAINING LIVES PROCEEDING. 26
104 Docket No. E002/GR-15-826 Heuer Direct

PUBLIC DOCUMENT: TRADE SECRET INFORMATION EXCISED – PUBLIC DATA –
A. On October 22, 2015, the Commission issued decisions in our Remaining 1
Lives proceeding (Docket No. E.G002/D-15-46) with respect to the 2
remaining lives of three production plants: Angus Anson, Granite City, and 3
Sherco Unit 1. This timing did not allow the Company to incorporate these 4
outcomes in this initial rate case. The Company proposes to make an 5
adjustment in Rebuttal Testimony to reflect the Commission’s decision. 6
7
This adjustment will decrease test year revenue requirements by $8.046 8
million (IA), as shown on Exhibit___(AEH-1), Schedule 26. Support for this 9
adjustment can be found in Volume 4 Test Year Workpapers, Section X 10
Rebuttal Adjustments, Tab R-1. Ms. Perkett further discusses the impact of 11
the Commission’s recent decision on the test year. 12
13
2) Hollydale Transmission (Rebuttal Adjustment) 14
Q. PLEASE DESCRIBE THE COMPANY’S PROPOSED REBUTTAL ADJUSTMENT 15
RELATED TO THE HOLLYDALE TRANSMISSION PROJECT. 16
A. As discussed in the Direct Testimony of Company witness Mr. Benson, 17
during the process of reviewing data in preparation for filing this case, it was 18
discovered that a $2.7 million capital addition for the Hollydale project was 19
included in the 2017 capital budget in error. Thus the 2016 test year includes 20
this project in CWIP with an AFUDC offset on the Income Statement. We 21
propose to make an adjustment in Rebuttal Testimony to remove the impact 22
of this project from the test year. 23
24
This adjustment will decrease test year revenue requirements by $0.031 25
million (IA). Support for this adjustment can be found in Volume 4 Test 26
Year Workpapers, Section X Rebuttal Adjustments, Tab R-2. 27
28 105 Docket No. E002/GR-15-826
Heuer Direct
PUBLIC DOCUMENT: TRADE SECRET INFORMATION EXCISED – PUBLIC DATA –
3) Prairie Island Indian Community Settlement Costs (Rebuttal Adjustment) 1
Q. PLEASE DESCRIBE THE COMPANY’S PROPOSED REBUTTAL ADJUSTMENT 2
RELATED TO THE PRAIRIE ISLAND INDIAN COMMUNITY SETTLEMENT 3
AGREEMENT COSTS. 4
A. The Company included in the 2016 test year the costs ($2.5 million) 5
associated with the 2003 Settlement Agreement as amended April 20, 2015, 6
between the Company and the Prairie Island Indian Community. While these 7
costs should have been direct assigned to the Minnesota electric jurisdiction, 8
they were instead allocated to all NSPM jurisdictions. We propose to make 9
an adjustment in Rebuttal Testimony to reflect the correct direct assignment 10
of these costs. 11
12
This adjustment will increase test year revenue requirements by $0.663 13
million. Support for this adjustment can be found in Volume 4 Test Year 14
Workpapers, Section X Rebuttal Adjustments, Tab R-3. 15
16
4) Economic Development Administration (Rebuttal Adjustment) 17
Q. PLEASE DESCRIBE THE COMPANY’S PROPOSED REBUTTAL ADJUSTMENT 18
RELATED TO ECONOMIC DEVELOPMENT ADMINISTRATION COSTS. 19
A. As described in Section VII, Adjustments to the Test Year, Adjustment 6, the 20
Company intended to exclude from recovery 50 percent of economic 21
development administration costs. However, instead of removing this 22
amount, we inadvertently added it to test year costs. We propose to make an 23
adjustment in Rebuttal Testimony to reverse the incorrect increase and 24
remove the correct amount from test year costs. 25
26
106 Docket No. E002/GR-15-826 Heuer Direct

PUBLIC DOCUMENT: TRADE SECRET INFORMATION EXCISED – PUBLIC DATA –
This adjustment will decrease test year revenue requirements by $0.016 1
million. Support for this adjustment can be found in Volume 4 Test Year 2
Workpapers, Section X Rebuttal Adjustments, Tab R-4. 3
4
5) CIP Approved Costs (Rebuttal Adjustment) 5
Q. PLEASE DESCRIBE THE COMPANY’S PROPOSED REBUTTAL ADJUSTMENT 6
RELATED TO ECONOMIC DEVELOPMENT ADMINISTRATION COSTS 7
A. Test year CIP expenses are set at $89.038 million, the level that the Company 8
proposed in Docket No. E002/CIP-12-447. On October 12, 2015, the 9
Deputy Commissioner of the Minnesota Department of Commerce approved 10
a CIP level of $92.897 million for 2016. This timing did not allow the 11
Company to incorporate the approved levels in this initial rate case filing. We 12
propose to include an adjustment in Rebuttal Testimony to increase the CIP 13
expenditures and offsetting revenues to reflect the final authorized level in the 14
test year. This adjustment will have no impact on the test year deficiency. 15
16
Support for the corresponding CIP expenditure and CIP revenue adjustments 17
to reflect the approved $92.897 million level can be found in Volume 4 Test 18
Year Workpapers, Section X Rebuttal Adjustments, Tab R-5. 19
20
6) Bonus Tax Depreciation (Potential Adjustment) 21
Q. PLEASE DESCRIBE THE POTENTIAL REBUTTAL ADJUSTMENT RELATED TO 22
BONUS TAX DEPRECIATION. 23
A. As discussed in the Direct Testimony of Ms. Perkett, as of July 21, 2015 a bill 24
containing a two-year extension to the current legislation, “The Tax Increase 25
Prevention Act of 2014” (2014 Tax Act) was passed through the Senate 26
Committee on Finance. The bill would extend bonus depreciation on 27
107 Docket No. E002/GR-15-826 Heuer Direct

PUBLIC DOCUMENT: TRADE SECRET INFORMATION EXCISED – PUBLIC DATA –
qualified property purchased and placed in service before January 1, 2017 1
(before January 1, 2018 for certain long-lived assets). The full Senate must 2
give approval of the bill and differences with the House of Representative’s 3
tax extender bill must be reconciled in order to move forward with the two-4
year extension. In the event that this legislation is passed, the Company 5
would update its filing 6
7
Q. WHAT IS THE ESTIMATED IMPACT ON THE FILED CASE IF SUCH A CHANGE IS 8
PASSED? 9
A. Based on the Company’s knowledge of the legislation as it exists today, the 10
Company has attempted to make an approximation of its impact. To do so, 11
the Capital Asset Accounting department has provided my area with 12
estimated changes to all of the various plant related information items input 13
into the cost of service by functional class detail. The Revenue Requirements 14
area has then processed this information in the COSS model to quantify the 15
impact. By processing this in the COSS model, changes in Net Operating 16
Losses, Section 199 Manufacture Production Tax Deductions, Rider removals 17
and ADIT Pro-Rate are all considered. It is important to consider all of these 18
related changes because the additional bonus tax depreciation will reduce rider 19
revenue requirements which in turn needs to be considered in the NOL solve 20
process which is performed on an all-inclusive basis (base rate data and riders) 21
as the Company does not do a NOL solve on individual riders. The 22
estimated impact of this change on the Company’s revenue requirements is 23
depicted below in Table 5 as follows: 24
25
108 Docket No. E002/GR-15-826 Heuer Direct

PUBLIC DOCUMENT: TRADE SECRET INFORMATION EXCISED – PUBLIC DATA –
Table 5 1 2
3
4
5
6
7
Q. WHY DOES THIS CHANGE CAUSE AN INCREASE IN REVENUE REQUIREMENTS? 8
A. As filed, our three-year rate plan anticipates using all of the previously 9
accumulated Net Operating Loss deductions in 2016, allowing the Company 10
to claim additional Section 199 Manufacture Production Tax Deductions and 11
start utilizing PTCs. Both of these reduce revenue requirements. With the 12
additional bonus tax depreciation, the Company is again in a net operating 13
loss tax position. As a result, the Company has no production taxable income 14
eliminating the Section 199 deductions and also causing a deferral in the 15
utilization of accumulated unused PTCs. Both of these items return again in 16
2018, causing a revenue requirement reduction. 17
18
Support for this adjustment can be found in Volume 4 Test Year Workpapers, 19
Section X Rebuttal Adjustments, Tab R-6. 20
21
7) MISO ROE Complaint (Potential Adjustment) 22
Q. PLEASE DESCRIBE THE POTENTIAL REBUTTAL ADJUSTMENT RELATED TO THE 23
MISO ROE COMPLAINT. 24
A. In his Direct Testimony, Company witness Mr. Benson describes the MISO 25
ROE complaints and the potential test year impact on transmission revenues 26
and expenses of any final decision from FERC related to the November 2013 27
and February 2015 MISO ROE Complaints. As discussed by Mr. Benson, 28
Impact of Bonus Tax Depreciation Extension
Estimate based on best available information
Dollars in Millions
2016 2017 2018
Annual Revenue Requirement Change $5.9 $16.1 ($23.9)
109 Docket No. E002/GR-15-826 Heuer Direct

PUBLIC DOCUMENT: TRADE SECRET INFORMATION EXCISED – PUBLIC DATA –
since the timing of a decision by the FERC in unknown and since it could 1
occur after this case is concluded, the Company requests the ability to true-up 2
the test year transmission revenue net of any change in transmission expense 3
due to the FERC decision in the TCR Rider. We request the true-up be 4
retroactive to January 1, 2016, the beginning this test year. 5
6
Q. PLEASE DESCRIBE THE POTENTIAL TRUE-UP IN THE TCR RIDER. 7
A. Transmission revenues are an offset to the Company’s test year revenue 8
requirement, including the revenue requirement for transmission expense. It 9
is likely that FERC’s final decision on the ROE complaints will require the 10
Company to refund to transmission customers amounts billed through the 11
MISO transmission tariff retroactive to November 2013. This refund would 12
decrease the Company’s net transmission revenues. As noted above, should 13
the FERC issue its decision after this rate case is concluded, the Company 14
requests the ability to true-up the impact of their decision retroactive to 15
January 1, 2016, in the TCR Rider. Our request for TCR Rider recovery would 16
include a full accounting of the transmission customer refunds net of any 17
refunds the Company receives, to ensure the true-up only covers the period 18
beginning January 1, 2016. 19
20
VIII. COSTS RECOVERED IN RIDERS 21
22
Q. WHAT TOPICS DO YOU DISCUSS IN THIS SECTION OF YOUR TESTIMONY? 23
A. In this section, I present our proposed treatment of costs recovered in riders 24
during the multi-year rate plan period, including riders that we propose to 25
continue to use and costs we propose to move to base rates. I provide 26
detailed information supporting the adjustments to the 2016 test year that I 27
110 Docket No. E002/GR-15-826 Heuer Direct
PUBLIC DOCUMENT: TRADE SECRET INFORMATION EXCISED – PUBLIC DATA –
presented in Section VII of my testimony, as well as the adjustments Mr. 1
Burdick incorporates into the revenue requirements for the 2017 and 2018 2
plan years. 3
4
Q. WHAT RIDER MECHANISMS ARE CURRENTLY USED BY THE COMPANY? 5
A. The Company currently uses six cost recovery riders: 6
• Renewable Energy Standards (RES) Rider; 7
• Transmission Cost Recovery (TCR) Rider; 8
• Renewable Development Fund (RDF) Rider; 9
• Conservation Improvement Program (CIP) Rider; 10
• Windsource Rider; and 11
• Fuel Clause Rider (FCR). 12
13
Q. WHAT IS THE COMPANY PROPOSING WITH RESPECT TO THE TREATMENT OF 14
COSTS RECOVERED THOUGH RATE RIDERS? 15
A. As discussed and supported in detail in the Direct Testimony of Mr. 16
Chandarana, we propose to: 17
• Continue use of the RES Rider for recovery of costs for the Courtenay 18
Wind Farm and the associated PTCs, the PTC true-up for other 19
Company owned wind projects, and sharing with customers potential 20
proceeds related to any Renewable Energy Credits the Company may 21
sell in the future. 22
• Continue use of the TCR Rider, with costs for three projects and 23
MISO RECB Schedule 26 and 26A net revenues to continue to be 24
included in the rider, and costs for two completed projects to be 25
moved to base rates upon implementation of final rates in this case. 26
111 Docket No. E002/GR-15-826 Heuer Direct
PUBLIC DOCUMENT: TRADE SECRET INFORMATION EXCISED – PUBLIC DATA –
• Continue use of the RDF Rider, CIP Rider, Windsource Rider, and the 1
FCR in their current forms. 2
3
These proposals are consistent with the rider filings we made during 2015 in 4
our separate rider dockets. In the following subsections of my testimony, I 5
will address our proposed rate case treatment for each of these riders in detail, 6
and discuss how the Company ensures there is no double recovery of these 7
costs. 8
9
Q. WHAT IS THE COMPANY’S TOTAL PROPOSED COST RECOVERY IN 2016, 2017, 10
AND 2018 INCLUDING THE COMPANY’S PROPOSED RIDER TREATMENT? 11
A. Our proposed total recovery from customers in 2016, 2017, and 2018, 12
including our proposed increase in base rates and estimated rider revenue, is 13
approximately $3.304 billion in 2016, $3.382 billion in 2017 and $3.464 billion 14
in 2018, as shown in Table 6 below. 15
16
112 Docket No. E002/GR-15-826 Heuer Direct
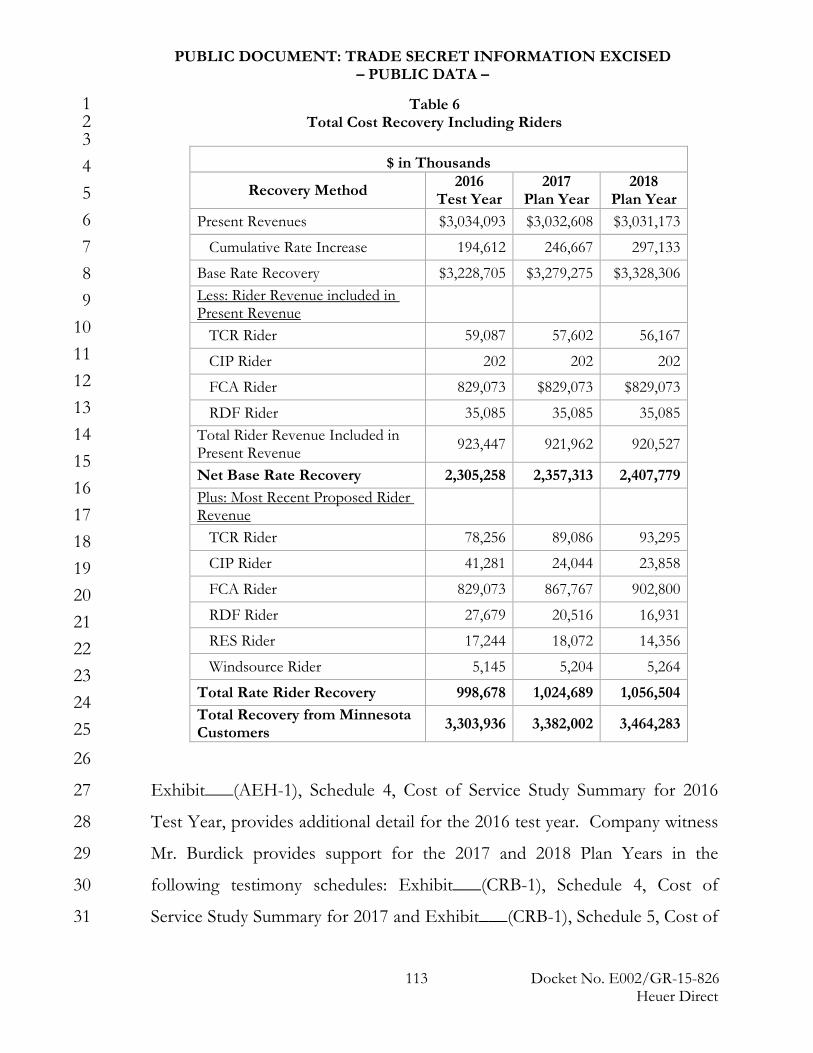
PUBLIC DOCUMENT: TRADE SECRET INFORMATION EXCISED – PUBLIC DATA –
Table 6 1 Total Cost Recovery Including Riders 2
3 4 5 6 7 8 9 10 11 12 13 14 15 16 17 18 19 20 21 22 23 24
25 26
Exhibit___(AEH-1), Schedule 4, Cost of Service Study Summary for 2016 27
Test Year, provides additional detail for the 2016 test year. Company witness 28
Mr. Burdick provides support for the 2017 and 2018 Plan Years in the 29
following testimony schedules: Exhibit___(CRB-1), Schedule 4, Cost of 30
Service Study Summary for 2017 and Exhibit___(CRB-1), Schedule 5, Cost of 31
$ in Thousands
Recovery Method 2016 Test Year
2017 Plan Year
2018 Plan Year
Present Revenues $3,034,093 $3,032,608 $3,031,173
Cumulative Rate Increase 194,612 246,667 297,133
Base Rate Recovery $3,228,705 $3,279,275 $3,328,306 Less: Rider Revenue included in Present Revenue
TCR Rider 59,087 57,602 56,167
CIP Rider 202 202 202
FCA Rider 829,073 $829,073 $829,073
RDF Rider 35,085 35,085 35,085 Total Rider Revenue Included in Present Revenue 923,447 921,962 920,527
Net Base Rate Recovery 2,305,258 2,357,313 2,407,779 Plus: Most Recent Proposed Rider Revenue
TCR Rider 78,256 89,086 93,295
CIP Rider 41,281 24,044 23,858
FCA Rider 829,073 867,767 902,800
RDF Rider 27,679 20,516 16,931
RES Rider 17,244 18,072 14,356
Windsource Rider 5,145 5,204 5,264
Total Rate Rider Recovery 998,678 1,024,689 1,056,504 Total Recovery from Minnesota Customers 3,303,936 3,382,002 3,464,283
113 Docket No. E002/GR-15-826 Heuer Direct
PUBLIC DOCUMENT: TRADE SECRET INFORMATION EXCISED – PUBLIC DATA –
Service Study Summary for 2018. Rate rider recovery estimates are 1
preliminary, are subject to change, and are also subject to the Commission’s 2
decision in individual rate rider dockets. We provide this information so that 3
the Commission, parties, and our customers can understand the combined 4
impact of our requests. 5
6
A. RES Rider 7
Q. WHAT IS THE RES RIDER? 8
A. The RES Rider is authorized by Minn. Stat. § 216B.1645, subd. 2a for the 9
recovery of a utility’s investments, expenses, or costs associated with facilities 10
constructed, owned, or operated by a utility to satisfy the Minnesota 11
Renewable Energy Standard. 12
13
Q. WHAT IS THE COMPANY’S PROPOSAL WITH RESPECT TO THE RES RIDER 14
DURING THE MULTI-YEAR RATE PLAN? 15
A. As noted above, we propose to include in the RES Rider: 16
• costs of the Courtenay wind project; 17
• the true-up of actual PTCs related to energy production at Company-18
owned wind farms compared to the amount included in base rates; and 19
• customers’ share of potential proceeds related to any Renewable 20
Energy Credits the Company may sell in the future. 21
22
These costs are fully supported in our 2016 RES Rider petition as revised 23
September 29, 2015 in Docket No. E002/M-15-805. Our 2016 RES Rider 24
filing requested recovery of $15.9 million in 2016 and $18.1 million in 2017 25
related to the Courtenay Wind project. 26
27
114 Docket No. E002/GR-15-826 Heuer Direct
PUBLIC DOCUMENT: TRADE SECRET INFORMATION EXCISED – PUBLIC DATA –
Q. PLEASE BRIEFLY DESCRIBE THE COMPANY’S REQUEST FOR RECOVERY OF THE 1
COURTENAY WIND PROJECT IN THE RES RIDER. 2
A. As described by Mr. Chandarana, the Company proposes to recover the 3
Courtenay Wind project through the RES Rider. We propose to recover the 4
capital related revenue requirements and property taxes as well as incremental 5
operating and maintenance expenses. We also propose to include all of the 6
PTCs associated with this project in the RES Rider. Therefore, we have not 7
included any PTCs for the Courtenay wind project in the 2016 baseline PTCs 8
as a part of our 2016 test year. 9
10
Q. HOW IS THE RES RIDER TREATED WITH RESPECT TO PTCS IN THE 2016 TEST 11
YEAR? 12
A. The Company requests PTC treatment consistent with the previously 13
approved process. Specifically, we request that: 14
1) A new baseline PTC be set in this rate case. We have included $43.1 15
million of PTCs as the base amount in the test year, resulting in a $61.5 16
million (IA) reduction to the 2016 test year revenue requirement. See 17
Exhibit___(AEH-1), Schedule 19, Production Tax Credit Baseline. 18
These PTCs are generated from the Grand Meadows, Nobles, Pleasant 19
Valley, and Border Winds facilities which are included in the 2016 test 20
year. 21
2) The difference between actual and baseline PTCs be recorded in the 22
RES Tracker account. 23
3) The difference be either refunded to, or recovered from, customers as 24
established in future RES Rider filings. 25
26
115 Docket No. E002/GR-15-826 Heuer Direct

PUBLIC DOCUMENT: TRADE SECRET INFORMATION EXCISED – PUBLIC DATA –
Because we propose that the true up of PTCs included in base rates to actual 1
PTCs earned will occur through the RES Rider, we do not anticipate a need 2
to address this issue in the base rate revenue requirement in the final 3
compliance filing. 4
5
Q. WHAT ADJUSTMENT HAVE YOU MADE TO ENSURE NO DOUBLE RECOVERY OF 6
COSTS RECOVERED IN THE RES RIDER AFTER THE IMPLEMENTATION OF 7
FINAL RATES IN THIS CASE? 8
A. I provide information related to the 2016 test year adjustment that ensures no 9
double recovery of these costs in Section VII.E. Rider Removals, RES Rider 10
Adjustment 35. Mr. Burdick discusses adjustments to the 2017 and 2018 Plan 11
Years in his Direct Testimony. 12
13
B. TCR Rider 14
Q. WHAT IS THE TCR RIDER? 15
A. The TCR Rider is authorized by Minn. Stat. § 216B.16, subd. 7b to allow the 16
recovery of capital costs related to transmission investments and for MISO 17
charges incurred for projects for which MISO assigns regional costs under 18
Schedule 26 and Schedule 26A of its Tariff. Recently, the TCR statute was 19
modified to include costs associated with Grid Modernization. 20
21
Q. WHAT COSTS ARE CURRENTLY INCLUDED IN THE TCR RIDER? 22
A. The Commission’s Order in Docket No. E002/M-14-852 approved our 2015 23
TCR Rider request to recover the following projects in the TCR Rider: 24
• CapX2020 Brookings; 25
• CapX2020 Fargo; 26
• CapX2020 La Crosse; and 27
116 Docket No. E002/GR-15-826 Heuer Direct
PUBLIC DOCUMENT: TRADE SECRET INFORMATION EXCISED – PUBLIC DATA –
• MISO RECB Schedule 26 and 26A net revenue. 1
2
Q. MR. CHANDARANA, MS. BLOCH, AND MR. HARKNESS DISCUSS THE USE OF A 3
NEW GRID MODERNIZATION RIDER ENABLED BY AN AMENDMENT TO THE 4
TCR RIDER STATUTE. ARE THERE ANY GRID MODERNIZATION COSTS 5
INCLUDED IN THE TCR RIDER AT THIS TIME OR IN THE COMPANY’S 2016 TCR 6
RIDER PETITION? 7
A. No. Although we have identified the ADMS and Belle Plaine Battery projects 8
as candidates for a Grid Modernization Rider, we have not included any Grid 9
Modernization projects in the TCR Rider at this time. Ms. Bloch and Mr. 10
Harkness provide further information about these projects in their Direct 11
Testimonies. 12
13
Q. MR. HARKNESS DISCUSSES $4.4 MILLION IN CAPITAL ADDITION COSTS FOR 14
2018 RELATED TO ADMS. WILL THOSE COSTS ALSO BE RECOVERED 15
THROUGH THE GRID MODERNIZATION RIDER? 16
A. No. Although Mr. Harkness discusses a small portion of ADMS in his 17
testimony as part of this case, the costs discussed in his testimony are 18
incremental to the grid modernization dollars we plan to request in the TCR 19
rider. We will ensure we provide a detailed discussion of the cost recovery 20
mechanics in our TCR filing next fall. 21
22
Q. WHAT IS THE COMPANY’S PROPOSAL WITH RESPECT TO THE TCR RIDER 23
DURING THE MULTI-YEAR RATE PLAN? 24
A. As described earlier, we propose to: 25
117 Docket No. E002/GR-15-826 Heuer Direct
PUBLIC DOCUMENT: TRADE SECRET INFORMATION EXCISED – PUBLIC DATA –
• Move the CapX2020 Brookings and CapX2020 Fargo projects from 1
TCR Rider recovery to base rate recovery coincident with 2
implementation of final rates in this rate case. 3
• Continue recovery of the CapX2020 La Crosse project in the TCR 4
Rider; 5
• Begin recovery of the Big Stone – Brookings and La Crosse – Madison 6
projects in the TCR Rider; and 7
• Continue recovery of MISO RECB Schedule 26 and 26A net revenue 8
in the TCR Rider. 9
10
These costs are fully supported in our 2016 TCR Rider petition in Docket No. 11
E002/M-15-891 and as discussed in the Direct Testimony of Company 12
witness Mr. Ian R. Benson. 13
14
Q. PLEASE DESCRIBE THE PROJECTS THAT WILL REMAIN IN THE TCR RIDER 15
AFTER THE IMPLEMENTATION OF FINAL RATES. 16
A. The Company is requesting continued recovery of the CapX2020 La Crosse, 17
Big Stone-Brookings, and La Crosse-Madison projects through the TCR 18
Rider. We propose to recover these projects through the TCR Rider because 19
these are large qualifying projects that are not yet fully in service. We are also 20
requesting to continue recovery of the MISO RECB Schedule 26 and 26A net 21
revenues through the TCR Rider. The revenue requirements for these three 22
projects and RECB net revenue as included in our 2016 TCR Rider petition 23
are summarized in Table 7 below. Please note that this summary does not 24
include the 2015 carry over balance or the revenue collected through the TCR 25
Rider. 26
27
118 Docket No. E002/GR-15-826 Heuer Direct

PUBLIC DOCUMENT: TRADE SECRET INFORMATION EXCISED – PUBLIC DATA –
Table 7 1 Revenue Requirements for Projects Remaining 2
in the TCR Rider Throughout the Three-Year Plan 3 4 5 6 7 8 9 10 11 12
13 14
Q. WHAT ADJUSTMENT HAVE YOU MADE TO ENSURE NO DOUBLE RECOVERY OF 15
PROJECTS CONTINUING RECOVERY IN THE TCR RIDER AFTER THE 16
IMPLEMENTATION OF FINAL RATES IN THIS CASE? 17
A. I provide information related to the 2016 test year adjustment that ensures no 18
double recovery of these costs in Section VII.E. Rider Removals, TCR Rider 19
Adjustment 36. Mr. Burdick discusses adjustments to the 2017 and 2018 Plan 20
Years in his Direct Testimony. 21
22
Q. YOU NOTED YOU ARE PROPOSING TO MOVE THE CAPX2020 BROOKINGS AND 23
FARGO PROJECTS TO BASE RATES AT THE CONCLUSION OF THIS RATE CASE. 24
PLEASE DESCRIBE HOW THESE PROJECTS WILL BE ROLLED IN TO BASE RATES. 25
A. We propose to move the CapX2020 Brookings and CapX2020 Fargo projects 26
from the TCR Rider to base rates at the conclusion of this case because it 27
reduces the Interim Rate increase and helps eliminate any potential for double 28
recovery of costs. Coincident with the implementation of final rates in this 29
rate case, the project costs will be removed from the TCR Rider for the 30
Description 2016 2017 2018
CapX2020 La Crosse
Local $5,827,371 $7,063,438 $6,835,387
MISO $6,971,744 $6,790,614 $6,620,419
MISO-WI $13,522,327 $13,189,718 $12,818,666
Big Stone-Brookings $1,921,637 $5,196,753 $7,990,087
La Crosse-Madison $2,717,735 $8,101,228 $13,236,926
MISO RECB Schedule 26 and 26A ($19,875,653) ($9,146,286) ($10,526,346)
Total Project Costs in TCR Rider $11,085,161 $31,195,465 $36,975,139
119 Docket No. E002/GR-15-826 Heuer Direct

PUBLIC DOCUMENT: TRADE SECRET INFORMATION EXCISED – PUBLIC DATA –
remaining months of the year and final rates will be designed to recover the 1
costs of these two projects. This approach is consistent with the method used 2
in Docket No. E002/GR-10-971, where we moved the Metropolitan 3
Emission Reduction Project (MERP) costs recovered through the 4
Environmental Improvement Rider (EIR) and the Nobles Wind, Grand 5
Meadow Wind and Wind2Battery projects recovered through the RES Rider 6
into base rates when final rates were implemented in that case. 7
8
More specifically, the TCR rate rider will be updated to exclude the 9
CapX2020 Brookings and CapX2020 Fargo project costs from the TCR Rider 10
for the remaining months of the year following implementation. The TCR 11
present revenues will be excluded from the 2017 test year and final rates will 12
be designed to recover the final revenue requirement approved by the 13
Commission, including the final revenue requirement for these two projects. 14
The interim rate refund will not be affected for these projects as any 15
over/under recovery during the Interim Rate period related to these projects 16
will remain in the TCR rider. 17
18
Q. WILL THERE BE A NEED TO UPDATE THE CASE FOR THE PROJECTS MOVING 19
FROM THE TCR RIDER TO BASE RATES? 20
A. Yes. The TCR Rider is trued up for actual costs and revised forecasts. 21
Therefore, the test year costs should be updated to reflect the 2016 actual 22
costs as well as updated 2017 and 2018 forecast costs as reflected in the TCR 23
Rider. As a result, the Company is proposing an update to test year costs 24
after actual 2016 costs are known. This update to the 2016 test year and the 25
2017 and 2018 plan years will occur at the same time as our proposed 2016 26
Capital true-up discussed by Company witness Mr. Burdick. This update will 27
120 Docket No. E002/GR-15-826 Heuer Direct
PUBLIC DOCUMENT: TRADE SECRET INFORMATION EXCISED – PUBLIC DATA –
ensure that the costs recovered in base rates are as close as possible to costs 1
that would have been recovered through the TCR Rider. 2
3
Q. WHAT DOES THE COMPANY PROPOSE TO INCLUDE IN ITS FINAL RATE 4
COMPLIANCE TO SUPPORT MOVEMENT OF THESE PROJECTS FROM THE TCR 5
RIDER TO BASE RATES? 6
A. We propose to submit a TCR Rider compliance report with Final Rate 7
compliance. This report will clearly identify the revenue requirements 8
removed from the TCR Rider, the revenue recovered from customers for the 9
projects moving to base rates during the Interim Rate period, and the 10
development of the revised TCR Rider adjustment factor. The Company 11
anticipates this process will be similar to the process used to move recovery of 12
CIP costs from the CIP Rider to base rates. 13
14
Q. HOW ARE THE TWO PROJECTS THAT WILL MOVE TO BASE RATES TREATED 15
DURING THE INTERIM RATE PERIOD? 16
A. During the interim rate period, the Company proposes that the CapX2020 17
Brookings and Fargo projects continue recovery through the TCR Rider, 18
along with the other costs that we are proposing to continue to recover 19
through the TCR Rider after implementation of final rates. Table 8 below 20
summarizes the costs and revenues included in the TCR Rider during the 21
interim rate period. Please note that this summary does not include the 2015 22
carry over balance or the revenue collected through the TCR Rider. 23
24
121 Docket No. E002/GR-15-826 Heuer Direct

PUBLIC DOCUMENT: TRADE SECRET INFORMATION EXCISED – PUBLIC DATA –
Table 8 1 TCR Rider Recovery 2
During Interim Rate Period 3 4 5 6 7 8 9 10 11 12 13 14 15 16 17 18 19
20 21
Q. IF YOU ARE PROPOSING TO INCLUDE THE CAPX2020 BROOKINGS AND FARGO 22
PROJECTS IN THE TCR RIDER DURING THE INTERIM RATE PERIOD, HOW WILL 23
YOU ENSURE NO DOUBLE RECOVERY OF THESE PROJECT COSTS OCCURS 24
DURING THIS TIME? 25
A. Because we are proposing to continue recovery of these projects through the 26
TCR Rider during the interim period, and move these projects into base rates 27
at the end of this case, the 2016 test year also includes the project costs in the 28
test year cost of service as well as the project revenues (from the TCR Rider) 29
in present revenue. Thus, an interim rate adjustment is necessary to ensure no 30
double recovery of these costs during the interim rate period. Accordingly, 31
Description 2016 2017
CAPX2020 Brookings $40,475,384 $39,461,230
CAPX2020 Fargo $18,611,685 $18,140,394
CAPX2020 La Crosse
Local $5,827,371 $7,063,438
MISO $6,971,744 $6,790,614
MISO - WI $13,522,327 $13,189,718
Big Stone-Brookings $1,921,637 $5,196,753
La Crosse-Madison $2,717,735 $8,101,228
MISO RECB Schedule 26 and 26A ($19,875,653) ($9,146,286)
ADIT Pro-Rate $150,830 $134,628
Project Revenue Requirement $70,323,061 $88,931717 TCR Tracker Balance Carryover from Prior Year $8,087,398 $154,062
TCR Revenue Requirement $78,410,459 $89,085,779
Projected Revenue Collections ($78,256,397) ($89,085,779) TCR Tracker Balance Carryover to Next Year $154,062 $0
122 Docket No. E002/GR-15-826 Heuer Direct
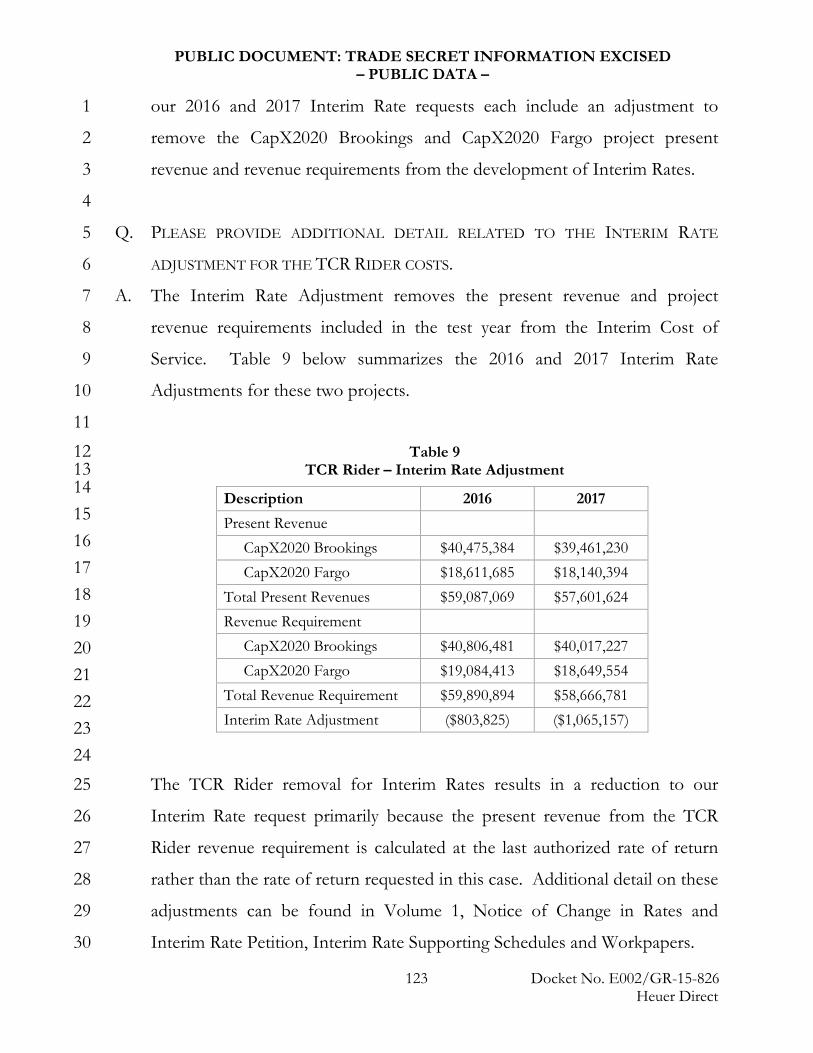
PUBLIC DOCUMENT: TRADE SECRET INFORMATION EXCISED – PUBLIC DATA –
our 2016 and 2017 Interim Rate requests each include an adjustment to 1
remove the CapX2020 Brookings and CapX2020 Fargo project present 2
revenue and revenue requirements from the development of Interim Rates. 3
4
Q. PLEASE PROVIDE ADDITIONAL DETAIL RELATED TO THE INTERIM RATE 5
ADJUSTMENT FOR THE TCR RIDER COSTS. 6
A. The Interim Rate Adjustment removes the present revenue and project 7
revenue requirements included in the test year from the Interim Cost of 8
Service. Table 9 below summarizes the 2016 and 2017 Interim Rate 9
Adjustments for these two projects. 10
11 Table 9 12
TCR Rider – Interim Rate Adjustment 13 14 15 16 17 18 19 20 21 22 23
24 The TCR Rider removal for Interim Rates results in a reduction to our 25
Interim Rate request primarily because the present revenue from the TCR 26
Rider revenue requirement is calculated at the last authorized rate of return 27
rather than the rate of return requested in this case. Additional detail on these 28
adjustments can be found in Volume 1, Notice of Change in Rates and 29
Interim Rate Petition, Interim Rate Supporting Schedules and Workpapers. 30
Description 2016 2017 Present Revenue CapX2020 Brookings $40,475,384 $39,461,230 CapX2020 Fargo $18,611,685 $18,140,394 Total Present Revenues $59,087,069 $57,601,624 Revenue Requirement CapX2020 Brookings $40,806,481 $40,017,227 CapX2020 Fargo $19,084,413 $18,649,554 Total Revenue Requirement $59,890,894 $58,666,781 Interim Rate Adjustment ($803,825) ($1,065,157)
123 Docket No. E002/GR-15-826 Heuer Direct

PUBLIC DOCUMENT: TRADE SECRET INFORMATION EXCISED – PUBLIC DATA –
Q. DO YOU PROVIDE ANY OTHER INFORMATION RELATED TO TREATMENT OF 1
TCR RIDER COSTS AND PROJECTS DURING THE MULTI-YEAR RATE PLAN 2
PERIOD? 3
A. Yes. Exhibit___(AEH-1), Schedule 27 provides a timeline illustrating how 4
projects will be rolled in to base rates or will remain in the TCR Rider during 5
the course of the multi-year rate plan. This timeline was developed based on 6
the Company’s proposed compliance activities identified in the Direct 7
Testimony of Mr. Burdick. 8
9
C. RDF Rider 10
Q. WHAT COSTS ARE RECOVERED THROUGH THE RDF RIDER? 11
A. Commission-approved RDF costs pursuant to Minn. Stat. §§ 116C.779 and 12
216B.1645, subd. 2 are recovered from retail customers through the RDF 13
Rider. 14
15
Q. HOW IS THE RDF RIDER TREATED IN THE 2016 TEST YEAR? 16
A. Both revenue and amortization expense for the RDF Rider are included in the 17
2016 test year. The amount of each is equal and, therefore, does not 18
contribute to the 2016 test year deficiency. Any true up of the revenues and 19
costs during the 2016 test year will occur in the RDF Rider and, therefore, 20
there will be no need to address a change in revenue requirement in the final 21
compliance filing. 22
23
D. CIP Rider 24
Q. WHAT COSTS ARE RECOVERED THROUGH THE CIP RIDER? 25
A. The CIP Rider is designed to recover conservation and demand side 26
management program costs that are incremental to the level collected in base 27
124 Docket No. E002/GR-15-826 Heuer Direct
PUBLIC DOCUMENT: TRADE SECRET INFORMATION EXCISED – PUBLIC DATA –
rates. Base electric rates are designed to include conservation and demand 1
side management cost at an authorized level approved by the Deputy 2
Commissioner of the Minnesota Department of Commerce, Division of 3
Energy Resources for a given test year. The CIP rider collects any incremental 4
conservation and demand side management above the authorized level in 5
final base rates. 6
7
Q. HOW IS THE CIP RIDER TREATED IN THE 2016 TEST YEAR? 8
A. The CIP Rider amount in the case is at the level needed to assure that both 9
the CIP revenue (Base and Rider) is equal to the expense in the 2016 test year. 10
With the total amount of CIP expense and CIP revenue equal, the overall CIP 11
program does not contribute to the test year deficiency. The total CIP 12
expense level included in the test year is $89.038 million. Total CIP revenues 13
included in the test year is $89.038 million ($87.836 million in base revenues 14
and $0.202 million in CIP Rider revenue). In the cost of service included in 15
the original filing for this proceeding, the level of CIP expense was set at the 16
requested level that had been proposed by the Company in Docket No. 17
E002/CIP-12-447 of $89.038 million. On October 12, 2015 the Deputy 18
Commissioner of the Minnesota Department of Commerce, Division of 19
Energy Resources in Xcel Energy’s CIP filing approved a CIP level of $92.897 20
million for plan year 2016. The timing of this decision on the higher approved 21
level precluded the Company from reflecting this increase in the test year. The 22
Company will include in Rebuttal Testimony an adjustment to increase both 23
the CIP expense and CIP recovery to the approved $92.897 million level for 24
final rate determination. The final level of CIP expense approved in the rate 25
case will move to base rate recovery at the conclusion of the rate case. Further 26
information is provided in Section VII, Adjustments to the Test Year. 27
28 125 Docket No. E002/GR-15-826
Heuer Direct
PUBLIC DOCUMENT: TRADE SECRET INFORMATION EXCISED – PUBLIC DATA –
E. Windsource Rider 1
Q. WHAT COSTS ARE RECOVERED THROUGH THE WINDSOURCE RIDER? 2
A. Costs related to the Windsource program, a stand-alone retail service program 3
with discrete revenues, purchase power contracts and operating expenses, are 4
recovered through the Windsource Rider. 5
6
Q. HOW IS THE WINDSOURCE RIDER TREATED IN THE 2016 TEST YEAR? 7
A. All revenue and expense related to the Windsource program is excluded from 8
the 2016 test year. Any true up of the revenues and costs incurred during the 9
2016 test year will occur in the Windsource Rider and, therefore, there will be 10
no need to address a change in revenue requirement in the final compliance 11
filing. Further information is provided in Section VII, Adjustments to the 12
Test Year. 13
14
F. Fuel Clause Rider (FCR) 15
Q. WHAT COSTS ARE RECOVERED THROUGH THE FCR? 16
A. Fuel and purchased energy are recovered from customers through the FCR. 17
18
Q. HOW IS THE FCR TREATED IN THE 2016 TEST YEAR? 19
A. Both revenue and fuel expenses recovered through the FCR are included in 20
the 2016 test year. The total amount of each is equal and the Minnesota 21
jurisdictional amount differs only by the difference in allocators (fuel expense 22
is allocated to the Minnesota jurisdiction based on the energy allocator while 23
fuel revenue is recovered from customers based on sales). As a result, fuel 24
recovery contributes only minimally to the test year deficiency. Any true up 25
of the revenues and costs during the 2016 test year will occur in the FCR and, 26
therefore, there will be no need to address a change in revenue requirement in 27
126 Docket No. E002/GR-15-826 Heuer Direct

PUBLIC DOCUMENT: TRADE SECRET INFORMATION EXCISED – PUBLIC DATA –
the final compliance filing. I provide a reconciliation of fuel costs in the Cost 1
of Service to the Base Cost of Fuel filing in Exhibit___(AEH-1), Schedule 25, 2
Fuel Reconciliation. 3
4
IX. COMPLIANCE WITH PRIOR COMMISSION ORDERS 5
6
Q. WHAT TOPIC DO YOU DISCUSS IN THIS SECTION OF YOUR TESTIMONY? 7
A. The Completeness Checklist included in the Direct Testimony of Mr. 8
Chandarana, Exhibit___(AHC-1), Schedule 2, documents how our rate case 9
filing includes information required by Rule or prior Commission orders, and 10
provides specific references to the testimony of Company witnesses that 11
addresses each requirement. In this section of my testimony, I identify and 12
provide information related to specific requirements from prior Commission 13
Orders that have not been addressed elsewhere in my testimony. 14
15
A. General Rate Case – Docket No. E002/GR-13-868 16
1) Amortization of Reserve Surplus for Transmission, Distribution and 17
General Assets 18
In compliance with the Commission’s Order in our most recent rate case, we 19
amortized 50 percent of the theoretical depreciation reserve surplus for 20
transmission, distribution, and general assets in 2014, 30 percent in 2015, and 21
the 2016 test year includes the final 20 percent amortization. This adjustment 22
is supported by Ms. Perkett in her Direct Testimony and is further discussed 23
in Section V, Rate Base. 24
25
127 Docket No. E002/GR-15-826 Heuer Direct

PUBLIC DOCUMENT: TRADE SECRET INFORMATION EXCISED – PUBLIC DATA –
2) Monticello Prudence Review Costs 1
Order Point 5 requires that the Company amortize the Monticello prudency 2
review costs over a two-year amortization period. If the Company had not 3
filed its next rate case within this two year period, we would be required to 4
return any over-recovery to customers when filing our next rate case. 5
Because this filing is being made within the two-year period, the Company 6
will complete collection of those costs in 2015, and no refund of any excess 7
amounts is required. 8
9
3) Alliant Billing 10
In 2014, the Company received an NSPM total Company refund of $790,966, 11
$692,320 for the State of Minnesota electric jurisdiction, from Alliant Energy 12
for a previous overbilling of transmission expense. This refund was recorded 13
as Other Revenues. We have included this refund in our calculation of the 3 14
Year Average adjustment to other revenues discussed in Adjustment 22. 15
16
B. General Rate Case – Docket No. E002/GR-12-961 17
1) Mapping to FERC Form 1 18
Order Point 47 from Docket E002/GR-12-961 stated: 19
Expanding upon the information filed under Minnesota Rules 20 7825.4000(B) and 7825.4100(B), direct the Company to include in 21 its initial filing of its next rate case balance sheet and income 22 statement reconciliations between its FERC Form 1 and its general 23 ledger accounts for each of the three most recent calendar years 24 relative to the rate case test year. The schedules provided should be 25 produced in like manner as requested and illustrated in the 26 Department’s Information Request 128-Revised, marked in the 27 record as Exhibit 163, DOC Attachment ACB-15. 28 29
128 Docket No. E002/GR-15-826 Heuer Direct
PUBLIC DOCUMENT: TRADE SECRET INFORMATION EXCISED – PUBLIC DATA –
These requirements have been met. The mapping to FERC Form 1 is located 1
in Volume 3, Required Information, Section IV, Other Required Information, 2
Tab 5, GAAP/FERC/COSS Comparison. There we provide accounting of 3
the NSPM Total Company for 2012 to 2014. For each year, we provide the 4
GAAP financial statements reconciled to the FERC Form 1. We then provide 5
the FERC Form 1 reconciled to the Minnesota Jurisdictional Annual Report 6
total company amounts. 7
8
2) Changes Between Actuals and 2016 Test Year 9
Order Point 47 also requests explanations for deviations ten percent or 10
greater (+/- 10 percent) “between actuals and [the Company’s] test-year 11
request.” Explanations of operating expense variations of +/-5 percent and 12
+/-$500,000 are provided for 2014 actuals compared to the 2016 budget by 13
FERC account in Volume 6, Budget Documentation, Variance Analysis. 14
Explanations of variations of +/-10 percent on rate base items are provided 15
with the schedules in Volume 3, Required Information, Section IV, Other 16
Required Information, Tab 5, GAAP/FERC/COSS Comparison 17
18
3) Financial Labeling 19
In my Rebuttal Testimony in Docket E002/GR-12-961, we agreed to make 20
efforts to label all costs and revenues to the relevant financial source: Xcel 21
Energy Services, Inc.; NSP System; NSP-Minnesota or NSPM (total 22
Company – electric and gas utilities); NSPM Electric; and State of Minnesota 23
Electric Jurisdiction. We have made a good faith effort to satisfy that 24
commitment. 25
26
129 Docket No. E002/GR-15-826 Heuer Direct

PUBLIC DOCUMENT: TRADE SECRET INFORMATION EXCISED – PUBLIC DATA –
For reference, following is a list of the labels used and the definitions of each. 1
• Xcel Energy or XEI: The entire enterprise – XES, NSPM, NSPW, SPS, 2
PSCo, and affiliate companies. 3
• XES: Xcel Energy Services: Xcel Energy’s service company that 4
provides services across all Xcel Energy affiliate companies. 5
• NSPM (Total Company): Northern States Power Company, Minnesota 6
providing service to electric and gas customers in Minnesota, North 7
Dakota, and South Dakota. 8
• NSPW (Total Company): Northern States Power Company, Wisconsin 9
providing service to electric and gas customers in Wisconsin and 10
Michigan. 11
• NSP System: The combined NSPM and NSPW electric production and 12
transmission system. 13
• NSPM Electric: Northern States Power Company, including the 14
portion allocated or direct assigned to the electric utility. 15
• State of Minnesota: Items physically located in the State of Minnesota 16
such as distribution facilities or property taxes assessed by the State. 17
• State of Minnesota Electric Jurisdiction: Amounts direct assigned or 18
allocated to the electric utility and to the State of Minnesota. 19
Interchange Agreement billings to and from NSPW are reflected in 20
revenues and expenses, respectively. 21
• State of Minnesota Electric Jurisdiction net of Interchange Agreement 22
billings to NSPW or State of Minnesota Electric Jurisdiction, net of 23
Interchange: The net amount allocated to the cost of service for electric 24
customers in the State of Minnesota. The portion of the item billed to 25
130 Docket No. E002/GR-15-826 Heuer Direct

PUBLIC DOCUMENT: TRADE SECRET INFORMATION EXCISED – PUBLIC DATA –
NSPW through the Interchange Agreement has been netted against the 1
item to show the net impact to Minnesota electric customers. 2
3
Other Company witnesses provide amounts in their Direct Testimonies from 4
several applicable financial sources. To the extent practicable, they have also 5
provided the State of Minnesota jurisdictional amount. The jurisdictional 6
amounts were developed under my guidance and are consistent with 7
development of allocators as explained in the Cost Assignment and Allocation 8
Manual, (Exhibit___(ARD-1), Schedule 3), and the Cost of Service Study. In 9
order to provide further context, an index to these financial sources is 10
included as Exhibit___(AEH-1), Schedule 5, Labeling of Financial Sources. 11
12
4) Wholesale Customer Study 13
With respect to the costs and revenues related to services provided to wholesale 14
customers, the Company and Department agreed as follows: 15
16 The Company will provide as a compliance filing in future rate cases 17 a wholesale customer study which shows all wholesale customers 18 being served by the Company (including, but not limited to, full 19 requirements, partial requirements, and market based wholesale 20 customers), types of service being provided to each wholesale 21 customer, costs and revenues associated with each wholesale 22 customer, and a clear showing either that wholesale costs are 23 allocated out of the retail rate case or that the revenues are included 24 in the retail rate case, for all services provided to wholesale 25 customers.4 26
27 Exhibit___(AEH-1), Schedule 12, Wholesale Customer Study, provides the 28
required information. The study does not address wholesale transmission 29
4 May 22, 2013 Issues List Page 19 in Docket No E002/GR-12-961.
131 Docket No. E002/GR-15-826 Heuer Direct
PUBLIC DOCUMENT: TRADE SECRET INFORMATION EXCISED – PUBLIC DATA –
revenues. Wholesale transmission revenues and associated costs are discussed 1
in detail in the Direct Testimony of Company witness Mr. Ian Benson. 2
3
C. Depreciation 4
Depreciation expense reflects the service lives, net salvage rates, and 5
depreciation rates approved by the Commission in Docket No. E,G002/D-6
12-858 (2012 five-year study for Transmission, Distribution and General 7
Assets) and proposed by the Company in its 2015 Annual Review of 8
Remaining Lives filed May 18, 2015, in Docket No. E,G002/D-15-46. This 9
filing is discussed by Ms. Perkett in her Direct Testimony. I make the 10
necessary adjustment to reflect the Company’s proposed remaining lives for 11
electric production facilities, and propose a Rebuttal Adjustment to reflect the 12
Commission’s October 22, 2015 decision in this docket, in Section VII, 13
Adjustments to the Test Year. 14
15
D. Decommissioning 16
A complete discussion of the Company’s compliance history and the status of 17
pending dockets with respect to nuclear decommissioning and the use of 18
DOE payments is contained in Section VII. Triennial Nuclear 19
Decommissioning Costs, of Ms. Perkett’s Direct Testimony. 20
21
E. Other Compliance Requirements 22
1) Incentive Compensation Refunds 23
In Docket No. E002/GR-10-971, the Commission required Xcel Energy to 24
continue to refund all incentive compensation payments earned according to 25
the Xcel Energy incentive compensation plan and recoverable in rates under 26
the Order, but not paid. For plan year 2014 (paid in March 2015), incentive 27
132 Docket No. E002/GR-15-826 Heuer Direct

PUBLIC DOCUMENT: TRADE SECRET INFORMATION EXCISED – PUBLIC DATA –
plan payouts were at a level that did not require the Company to refund any 1
amounts to customers, as reported in our annual incentive compensation 2
compliance filing in Dockets E002/GR-92-1185 and G002/GR-92-1186 on 3
May 31, 2015. Our last rate case, which was based on a 2014 test year, 4
included the forecasted incentive compensation costs accrued in 2014 and 5
payable in March 2015, after excluding certain costs (e.g., executive long term 6
incentive). It is too early to determine whether any refund will be needed 7
with respect to the 2015 plan year. 8
9
The 2016 test year includes the forecasted incentive compensation costs 10
accrued in 2016 and payable in March 2017, after excluding certain costs (e.g., 11
executive long term incentive), which I identified in Section VII. B. 10, 12
Adjustments to Test Year. As in the past, if the Company does not pay a 13
level of incentive compensation at least equal to the amount of expense 14
recovered in rates, the Company agrees to track and refund the difference to 15
customers. 16
17
2) Non-Asset Based Trading Activities–Fully Allocated Cost Study and 18
Incremental Cost Study 19
In Docket E002/GR-10-971, the Company was directed to file in its next rate 20
case both an incremental and fully allocated cost study of its non-asset based 21
trading activities. I discuss those studies and a related adjustment above in 22
Section VII Adjustments to Test Year. For future rate cases, we request that 23
only a fully allocated cost study be submitted because the incremental cost 24
study is not used to determine the level of costs to charge this activity. 25
26
133 Docket No. E002/GR-15-826 Heuer Direct

PUBLIC DOCUMENT: TRADE SECRET INFORMATION EXCISED – PUBLIC DATA –
3) Nuclear Fuel Outage Costs 1
In Docket No. E002/GR-08-1065, the Company was directed to include an 2
analysis of nuclear plant outage costs as shown in Exhibit 86 to the hearing 3
record. Attached as Exhibit___(AEH-1) Schedule 14, Nuclear Outage 4
Accounting, is the required information. Volume 4A Test Year Workpapers 5
also includes schedules in support of the 2017 and 2018 Plan Year nuclear 6
fuel outage costs. These schedules provide a determination of the Minnesota 7
retail jurisdiction revenue requirements associated with the Nuclear Outage 8
Deferral and Amortization method, as well as a comparison to the Direct 9
Expense method for the 2016 test year and the 2017 and 2018 Plan Years. 10
11
4) Capacity Cost Report 12
In Docket No. E002/GR-08-1065, the Commission ordered the Company to 13
describe NSP System short-term and long-term capacity costs by contract. 14
The required information is attached as Exhibit___(AEH-1) Schedule 13, 15
Capacity Cost Study, which is Trade Secret. The methodology for forecasting 16
capacity costs for the 2016 test year is similar to that described by Mr. David 17
G. Horneck in his direct testimony from Docket No. E002/GR-10-971. 18
Contracts with which NSPM has long-term obligations to purchase capacity 19
remain the same as described in that docket, except the Cyprus contract was 20
terminated in 2011, the Pine Bend contract no longer has a purchased 21
capacity obligation, the contract with Minnkota Power Cooperative was 22
terminated in 2015 and a new contract with Manitoba Hydro began in 2015 as 23
approved by the Commission in Docket No. E-002/M-10-633. The 24
Company anticipates that it can meet the expected Midcontinent Independent 25
System Operator (MISO) capacity planning reserve requirements for the 2016 26
planning year from its current generation and long term purchased capacity 27
134 Docket No. E002/GR-15-826 Heuer Direct

PUBLIC DOCUMENT: TRADE SECRET INFORMATION EXCISED – PUBLIC DATA –
contracts. Therefore, the Company does not expect to purchase short term 1
capacity contracts for the 2016 test year. 2
3
Forecast capacity cost calculations for 2017 and 2018 are consistent with 4
calculations done to forecast costs for the 2016 test year. However, contracts 5
with Rapidan and HERC will terminate in 2017 and the extended contract 6
with Calpine Mankato, Mankato II, is assumed to begin in 2018. As in the 7
2016 test year, the Company anticipates that it can meet the expected MISO 8
capacity planning reserve requirements in 2017 and 2018 from its current 9
generation and long term purchased capacity contracts and does not expect to 10
purchase short term capacity contracts. 11
12
5) Lobbyist Compensation 13
In Docket No. E002/GR-10-971, we agreed to include a report of the total 14
compensation for employees engaged in lobbying with an explanation of the 15
costs included and excluded in the rate request. This information is provided 16
in the Direct Testimony of Company witness Mr. Gary J. O’Hara. 17
18
6) North Dakota Income Tax Credits 19
In Docket No. E-002/M-15-401, the Company was instructed to discuss non-20
Minnesota state tax credits as follows; 21
22 The Company shall include in the initial filing in its next rate case 23 both testimony and schedules disclosing, in detail and by project, 24 all North Dakota Investment Tax Credits and all other non-25 Minnesota state tax credits earned or held by the Company as a 26 result of its investments and activity. 27
28
135 Docket No. E002/GR-15-826 Heuer Direct
PUBLIC DOCUMENT: TRADE SECRET INFORMATION EXCISED – PUBLIC DATA –
The main reason for this treatment is that income taxes (state and Federal) for 1
jurisdictional cost of service are calculated on a stand-alone basis by applying 2
the state-specific and Federal defined deductions and credits to the calculation 3
of current taxes. For example, with respect to deductions, for the 4
computation of state taxable income, one State may adopt the Federal Bonus 5
provision and another state may not. For the calculation of Minnesota state 6
taxes, the Minnesota definition of state deductions is used. With respect to 7
credits, the same applies. Minnesota defined Research and Experimentation 8
(R&E) Credits are used to derive Minnesota current taxes for the Minnesota 9
retail COSS. The R&E Credit is primarily derived from Company and 10
contract engineering labor during the design and test phases of capital 11
projects. The largest projects that contribute to the Minnesota R&E Credit 12
are nuclear. The other two key areas are fossil projects (such as pollution 13
control equipment) and transmission (such as substation design). 14
15
In North Dakota, state tax regulations provide for a state tax credit to 16
encourage wind development located in the state. As a result, in the North 17
Dakota retail COSS this credit is applied in determining North Dakota state 18
taxes. By consistently applying this stand-alone logic, Minnesota ratepayers 19
are not asked to sponsor North Dakota current state income taxes and North 20
Dakota ratepayers are not asked to sponsor Minnesota current state income 21
taxes. For these reasons, the Company has not applied any North Dakota 22
specific state tax credit to the calculation of Minnesota state and Federal 23
current income taxes in the jurisdictional COSS. 24
25
The North Dakota state credit for North Dakota-located wind generation is 26
the only non-Minnesota state credit utilized by NSPM. Due to the size of the 27
136 Docket No. E002/GR-15-826 Heuer Direct
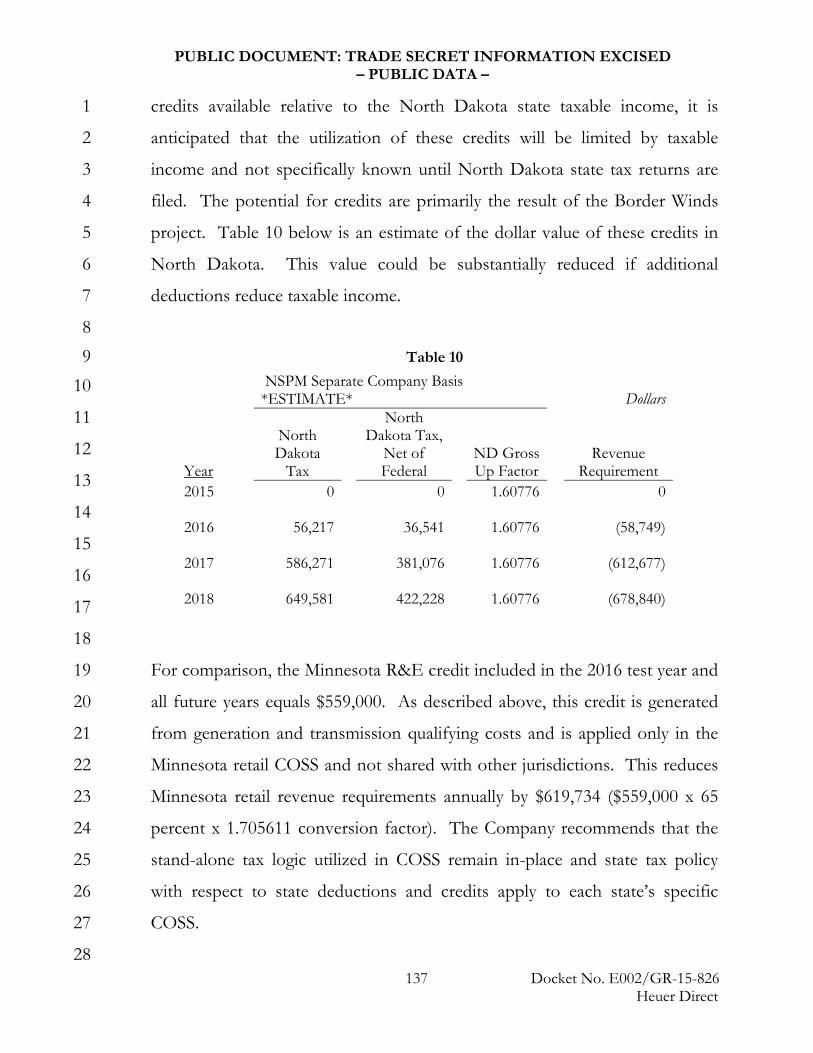
PUBLIC DOCUMENT: TRADE SECRET INFORMATION EXCISED – PUBLIC DATA –
credits available relative to the North Dakota state taxable income, it is 1
anticipated that the utilization of these credits will be limited by taxable 2
income and not specifically known until North Dakota state tax returns are 3
filed. The potential for credits are primarily the result of the Border Winds 4
project. Table 10 below is an estimate of the dollar value of these credits in 5
North Dakota. This value could be substantially reduced if additional 6
deductions reduce taxable income. 7
8 Table 10 9
10
11
12
13
14
15
16
17
18
For comparison, the Minnesota R&E credit included in the 2016 test year and 19
all future years equals $559,000. As described above, this credit is generated 20
from generation and transmission qualifying costs and is applied only in the 21
Minnesota retail COSS and not shared with other jurisdictions. This reduces 22
Minnesota retail revenue requirements annually by $619,734 ($559,000 x 65 23
percent x 1.705611 conversion factor). The Company recommends that the 24
stand-alone tax logic utilized in COSS remain in-place and state tax policy 25
with respect to state deductions and credits apply to each state’s specific 26
COSS. 27
28
NSPM Separate Company Basis *ESTIMATE*
Dollars
Year
North Dakota
Tax
North Dakota Tax,
Net of Federal
ND Gross Up Factor
Revenue Requirement
2015
0
0
1.60776
0
2016
56,217
36,541
1.60776
(58,749)
2017
586,271
381,076
1.60776
(612,677)
2018
649,581
422,228
1.60776
(678,840)
137 Docket No. E002/GR-15-826 Heuer Direct

PUBLIC DOCUMENT: TRADE SECRET INFORMATION EXCISED – PUBLIC DATA –
7) Recurring Compliance Reporting Requirements 1
The following compliance requirements are of a recurring nature reported 2
upon in each rate case: 3
4
a) Edison Electric Institute Spare Transformer Sharing Agreement 5
The Commission’s Order in Docket No. E002/PA-06-1662 required the 6
Company to report any sales or purchases of transformers made under the 7
EEI Spare Transformer Sharing Agreement in its next rate case. Over the life 8
of the program there have been no triggering events to initiate a transformer 9
sale or purchase under the program. Therefore, Xcel Energy has not sold or 10
purchased any transformers under this agreement. 11
12
b) Minnesota Emissions Allowance 13
In Docket E002/M-94-13, the Commission ordered deferred accounting for 14
revenues from the sale of certain emission allowances. The accumulated 15
unamortized deferred balance of emission sales is less than $3,400 (IA). Due 16
to the small level in this account, the Company is recommending to continue 17
to defer the emission allowance sales proceeds to a future rate filing. Thus, 18
there is no adjustment included in this filing. 19
20
c) Advantage Service (a/k/a HomeSmart) 21
In Docket No. E002/GR-91-1, the Company was directed to require NSP 22
Advantage Service (now branded as Xcel Energy HomeSmart) to: 1) pay a 23
return on the use of the Company’s billing services asset; 2) compensate the 24
Company for its personnel’s referral time; and 3) to compensate the Company 25
for use of its mailing lists. The Company has complied with these 26
requirements. 27
28 138 Docket No. E002/GR-15-826
Heuer Direct

PUBLIC DOCUMENT: TRADE SECRET INFORMATION EXCISED – PUBLIC DATA –
d) Liberty Paper 1
In Docket No E002/M-93-1253, the Commission ordered the Company to 2
segregate the cost of constructing a steam pipeline from Sherco to Liberty 3
Paper, Inc. from utility rate base, and to record operating and maintenance 4
expenses to non-utility operations. The Company has complied with these 5
requirements. 6
7
e) Tax Benefit Transfer Leases 8
In Docket No. G002/GR-97-1606, the Company was directed to treat Tax 9
Benefit Transfer (TBT) leases consistent with prior Commission approved 10
methodology. There are no TBTs included in the test year. 11
12
f) Sale of Renewable Energy Credits 13
In Docket No. E002/GR-08-1065, the Company was directed to flow 14
revenues from the sale of Renewable Energy Credits (RECs) through the RES 15
Rider. A petition to pass certain RECs to customers using the FCA was 16
approved by the Commission in Docket E002/M-12-1132. The Commission 17
ordered the proceeds from the sale of RECs be returned to customers 18
through the RES Rider unless the Commission makes a specific determination 19
to allow a sharing of the proceeds. The Company has complied with this 20
requirement. 21
22
g) Competitive Bidding 23
In Docket No. E002/M-95-174 the Company was permitted to offer 24
Company owned generation to compete against other provider offerings. The 25
Company is required to track capacity-related non-performance penalties on 26
139 Docket No. E002/GR-15-826 Heuer Direct
PUBLIC DOCUMENT: TRADE SECRET INFORMATION EXCISED – PUBLIC DATA –
NSP Generation projects for return to ratepayers. We have incurred no such 1
penalties. 2
3
X. CONCLUSION 4
5
Q. PLEASE SUMMARIZE YOUR RECOMMENDATIONS TO THE COMMISSION. 6
A. I recommend that the Commission determine an overall 2016 retail revenue 7
requirement of $3.229 billion and 2016 revenue deficiency of $194.612 million 8
for the Company’s Minnesota jurisdictional electric operation, determined by 9
the cost of service for the 2016 test year. I also recommend the Commission 10
grant a 2016 interim rate increase of $163.670 million and an additional 2017 11
interim rate increase of $44.902 million, for the Company’s Minnesota 12
jurisdictional operation. 13
14
Q. DOES THIS CONCLUDE YOUR DIRECT TESTIMONY? 15
A. Yes, it does. 16
140 Docket No. E002/GR-15-826 Heuer Direct

Northern States Power Company Docket No. E002/GR-15-826 State of Minnesota Electric Jurisdiction Exhibit___(AEH-1), Schedule 1 Page 1 of 2 Resume of Anne E. Heuer Xcel Energy Services, Inc. Director 414 Nicollet Mall Revenue Analysis Minneapolis, Minnesota 55401
Current Responsibilities
Since January 2007, I have managed the Revenue Requirements-North team. In this position, I am responsible for the general administration of the Northern States Power Company-Minnesota (NSPM) Revenue Requirements area and for the preparation and presentation of cost of service studies, revenue requirement determinations and jurisdictional annual reports for the electric and gas rates filed on behalf of NSPM with the Minnesota Public Utilities Commission, the North Dakota Public Service Commission, the South Dakota Public Utilities Commission and the Federal Energy Regulatory Commission. Previous Employment (1975 to 2006)
Rate Consultant – Xcel Energy Services Inc. Manager, Regulatory Development – NSP Principal Rate Analyst – NSP Senior Electric Financial Analyst – Electric Finance – NSP Senior Budget Analyst – Financial Accounting – NSP Senior Systems Cost Analyst – Information Services – NSP Education
Augsburg College, Minneapolis, Minnesota Bachelor of Arts – Business Administration – Finance December 1985 Current Testimony
FERC – Proposed Regulatory Accounting and Revised Interchange Agreement Tariffs, Docket No. ER15-698-000, 2015 Minnesota – Overall Revenue Requirements, Rate Base, Income Statement, Docket No. E002/GR-13-868, 2013 North Dakota – Overall Revenue Requirements, Rate Base, Income Statement, Case No. PU 12-813, 2012 Minnesota – Overall Revenue Requirements, Rate Base, Income Statement, Docket No. E002/GR-12-961, 2012 Minnesota – Overall Revenue Requirements, Rate Base, Income Statement, Docket No. E002/GR-10-971, 2010 Minnesota – Overall Revenue Requirements, Rate Base, Income Statement, Docket No. G002/GR-09-1153, 2009 South Dakota - Overall Revenue Requirements, Rate Base, Income Statement,
Northern States Power Company Docket No. E002/GR-15-826 State of Minnesota Electric Jurisdiction Exhibit___(AEH-1), Schedule 1 Page 2 of 2 Current Testimony – Cont.
Docket No. EL09-009, 2009 Minnesota – Overall Revenue Requirements, Rate Base, Income Statement, Docket No. E002/GR-08-1065, 2008 North Dakota - Overall Revenue Requirements, Rate Base, Income Statement, Case No. PU 07-776, 2007

Northern States Power Company Docket. No. E002/GR-15-826 State of Minnesota Electric Jurisdiction Exhibit___(AEH-1), Schedule 2 Page 1 of 1
Index of Schedules Schedule 1 Resume Schedule 2 Index of Schedules SUMMARY OF SCHEDULES Schedule 3 Summary of 2016 Revenue Requirements Schedule 4 Cost of Service Study Summary for 2016 Test Year Schedule 5 Labeling of Financial Sources Schedule 6 Detailed Case Drivers Schedule 7 Comparison of Detailed Rate Base Components Schedule 8 Comparison of Detailed Income Statement Components Schedule 9 CWIP and ADIT Summary Schedule 10 2016 Rate Base Adjustment Schedule Schedule 11 2016 Income Statement Adjustment Schedule COMPLIANCE ITEMS Schedule 12 Wholesale Customers Study Schedule 13 Capacity Cost Study Schedule 14 Nuclear Outage Accounting TEST YEAR SUPPPORT Schedule 15 Advertising Schedule 16 Organizational Dues Schedule 17 Economic Development Cost-Benefit Analysis Schedule 18 Non-Asset Based Trading Cost Study Schedule 19 Production Tax Credit Baseline Schedule 20 Monticello LCM/EPU Return Schedule 21 PI EPU Recovery Schedule 22 Rate Case Expense Amortization Schedule 23 ADIT Pro-Rate Schedule 24 Net Operating Loss Schedule 25 Fuel Reconciliation REBUTTAL ADJUSTMENT Schedule 26 NSPM Remaining Life TCR ROLL-IN Schedule 27 TCR Rider Roll-In Timeline PRE-FILED INFORMATION Appendix A Pre-Filed Discovery
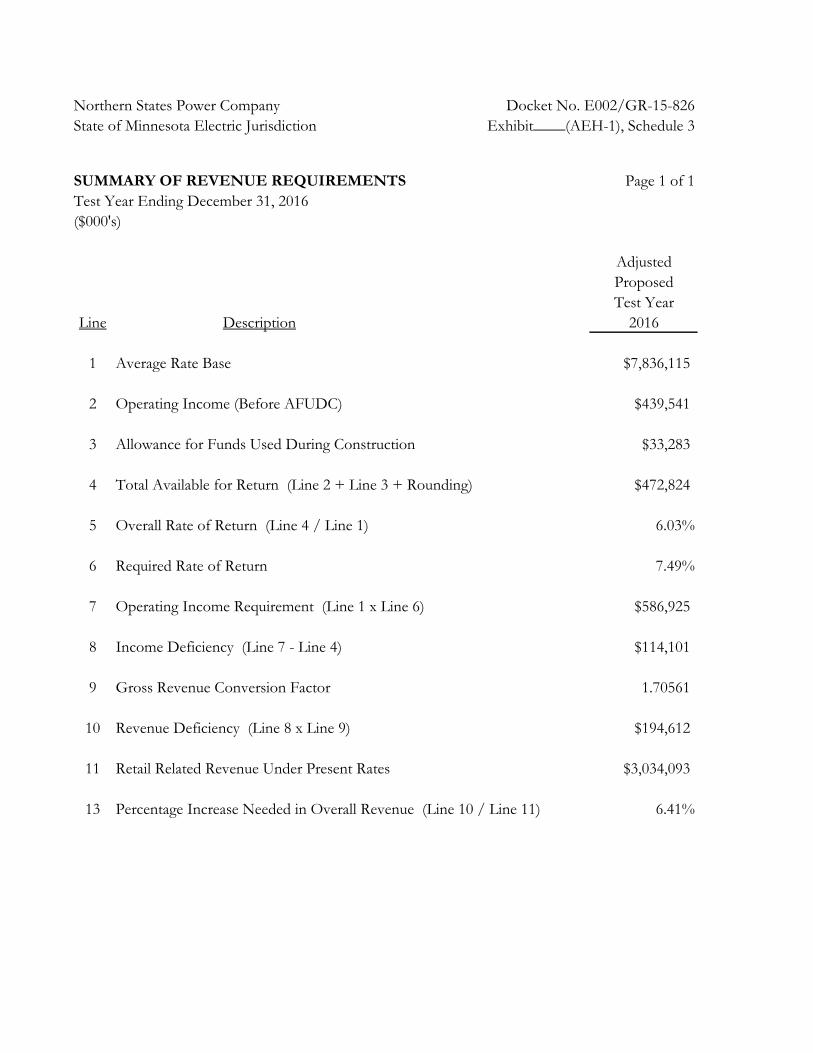
Northern States Power CompanyState of Minnesota Electric Jurisdiction
SUMMARY OF REVENUE REQUIREMENTS Page 1 of 1Test Year Ending December 31, 2016($000's)
AdjustedProposedTest Year
Line Description 2016
1 Average Rate Base $7,836,115
2 Operating Income (Before AFUDC) $439,541
3 Allowance for Funds Used During Construction $33,283
4 Total Available for Return (Line 2 + Line 3 + Rounding) $472,824
5 Overall Rate of Return (Line 4 / Line 1) 6.03%
6 Required Rate of Return 7.49%
7 Operating Income Requirement (Line 1 x Line 6) $586,925
8 Income Deficiency (Line 7 - Line 4) $114,101
9 Gross Revenue Conversion Factor 1.70561
10 Revenue Deficiency (Line 8 x Line 9) $194,612
11 Retail Related Revenue Under Present Rates $3,034,093
13 Percentage Increase Needed in Overall Revenue (Line 10 / Line 11) 6.41%
Docket No. E002/GR-15-826Exhibit____(AEH-1), Schedule 3

Northern States Power CompanyState of MN Electric Jurisdiction2016 Test Year
Docket No. E002/GR-15-826Exhibit___(AEH-1), Schedule 4
Page 1 of 6
ROE = 7.23%Deficiency = $194,612% Increase = 6.41%
Required ROE = 10.00%
Northern States Power Company (MN)Electric Utility - Minnesota Retail Jurisdiction
Cost of Service StudyProposed 2016 Test Year
Summary Reports
November 2015
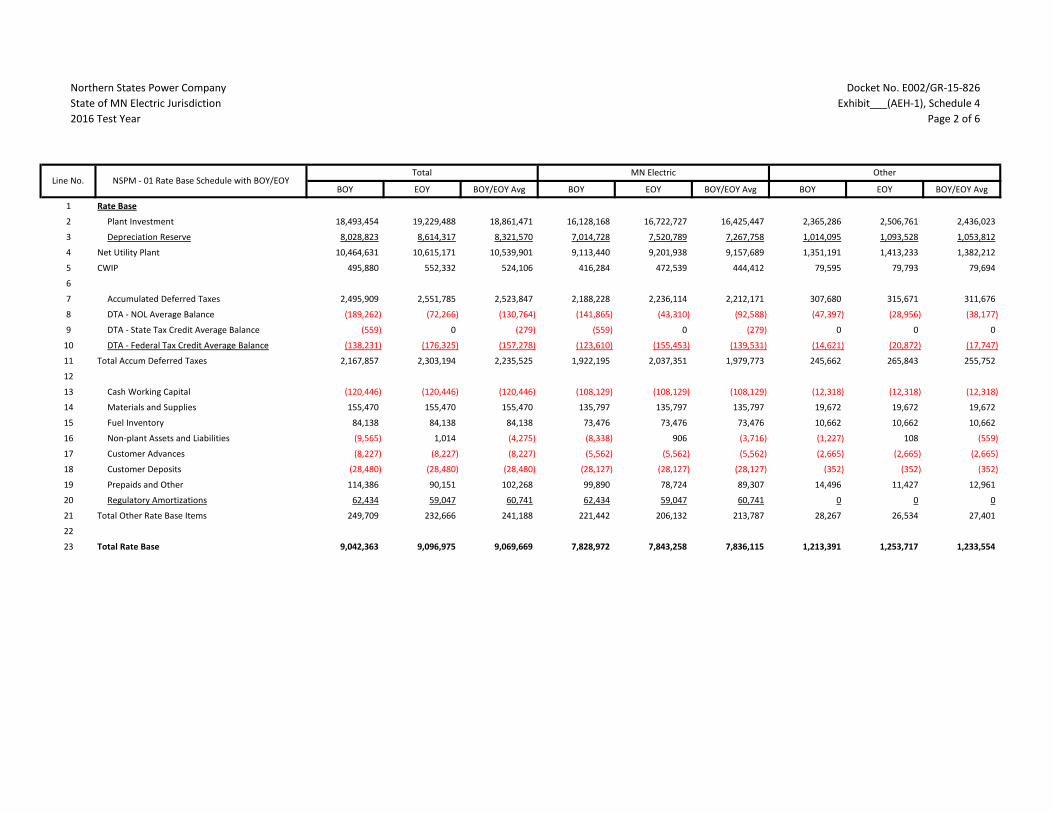
Northern States Power CompanyState of MN Electric Jurisdiction2016 Test Year
Docket No. E002/GR-15-826Exhibit___(AEH-1), Schedule 4
Page 2 of 6
BOY EOY BOY/EOY Avg BOY EOY BOY/EOY Avg BOY EOY BOY/EOY Avg
1 Rate Base
2 Plant Investment 18,493,454 19,229,488 18,861,471 16,128,168 16,722,727 16,425,447 2,365,286 2,506,761 2,436,023
3 Depreciation Reserve 8,028,823 8,614,317 8,321,570 7,014,728 7,520,789 7,267,758 1,014,095 1,093,528 1,053,812
4 Net Utility Plant 10,464,631 10,615,171 10,539,901 9,113,440 9,201,938 9,157,689 1,351,191 1,413,233 1,382,212
5 CWIP 495,880 552,332 524,106 416,284 472,539 444,412 79,595 79,793 79,694
6
7 Accumulated Deferred Taxes 2,495,909 2,551,785 2,523,847 2,188,228 2,236,114 2,212,171 307,680 315,671 311,676
8 DTA - NOL Average Balance (189,262) (72,266) (130,764) (141,865) (43,310) (92,588) (47,397) (28,956) (38,177)
9 DTA - State Tax Credit Average Balance (559) 0 (279) (559) 0 (279) 0 0 0
10 DTA - Federal Tax Credit Average Balance (138,231) (176,325) (157,278) (123,610) (155,453) (139,531) (14,621) (20,872) (17,747)
11 Total Accum Deferred Taxes 2,167,857 2,303,194 2,235,525 1,922,195 2,037,351 1,979,773 245,662 265,843 255,752
12
13 Cash Working Capital (120,446) (120,446) (120,446) (108,129) (108,129) (108,129) (12,318) (12,318) (12,318)
14 Materials and Supplies 155,470 155,470 155,470 135,797 135,797 135,797 19,672 19,672 19,672
15 Fuel Inventory 84,138 84,138 84,138 73,476 73,476 73,476 10,662 10,662 10,662
16 Non-plant Assets and Liabilities (9,565) 1,014 (4,275) (8,338) 906 (3,716) (1,227) 108 (559)
17 Customer Advances (8,227) (8,227) (8,227) (5,562) (5,562) (5,562) (2,665) (2,665) (2,665)
18 Customer Deposits (28,480) (28,480) (28,480) (28,127) (28,127) (28,127) (352) (352) (352)
19 Prepaids and Other 114,386 90,151 102,268 99,890 78,724 89,307 14,496 11,427 12,961
20 Regulatory Amortizations 62,434 59,047 60,741 62,434 59,047 60,741 0 0 0
21 Total Other Rate Base Items 249,709 232,666 241,188 221,442 206,132 213,787 28,267 26,534 27,401
22
23 Total Rate Base 9,042,363 9,096,975 9,069,669 7,828,972 7,843,258 7,836,115 1,213,391 1,253,717 1,233,554
Total MN Electric OtherNSPM - 01 Rate Base Schedule with BOY/EOYLine No.

Northern States Power CompanyState of MN Electric Jurisdiction2016 Test Year
Docket No. E002/GR-15-826Exhibit___(AEH-1), Schedule 4
Page 3 of 6
Total MN Electric Other
1 Operating Revenues
2 Retail 3,487,931 3,033,285 454,647
3 Interdepartmental 809 809
4 Transportation
5 Other Operating Rev - Non-Retail 670,500 586,984 83,515
6 Total Operating Revenues 4,159,240 3,621,078 538,162
7
8 Expenses
9 Operating Expenses:
10 Fuel 1,138,449 995,513 142,936
11 Variable IA Production Fuel 5,726 5,001 726
12 Purchased Energy - Windsource 583 583 0
13 Fuel & Purchased Energy Total 1,144,758 1,001,096 143,661
14 Production - Fixed 447,315 390,602 56,713
15 Production - Fixed IA Investment 53,592 46,811 6,782
16 Production - Fixed IA O&M (4,826) (4,215) (611)
17 Production - Variable 122,113 106,639 15,475
18 Production - Purchased Demand 154,140 134,635 19,505
19 Production - Other 0 0 0
20 Production Total 772,335 674,472 97,863
21 Regional Markets 8,070 7,049 1,021
22 Transmission IA 111,588 97,468 14,120
23 Transmission 123,353 107,718 15,634
24 Distribution 124,690 108,023 16,666
25 Customer Accounting 57,948 49,315 8,633
26 Customer Service & Information 92,454 91,110 1,344
27 Sales, Econ Dvlp & Other 119 69 51
28 Administrative & General 237,995 206,579 31,416
29 Total Operating Expenses 2,673,311 2,342,900 330,410
30
31 Depreciation 545,308 471,286 74,022
32 Amortization 39,447 39,585 (138)
33
34 Taxes:
35 Property Taxes 210,192 186,751 23,441
36 ITC Amortization (1,486) (1,340) (145)
37 Deferred Taxes 115,529 98,922 16,607
38 Deferred Taxes - NOL 143,535 120,693 22,842
39 Less Deferred State Tax Credits 559 559 0
40 Less Deferred Federal Tax Credits (38,094) (31,843) (6,251)
41 Deferred Income Tax & ITC 220,043 186,991 33,052
42 Payroll & Other Taxes 31,616 27,550 4,066
43 Total Taxes Other Than Income 461,852 401,292 60,559
44 Total State & Federal Income Taxes (79,244) (73,527) (5,717)
45
46 Total Taxes 382,608 327,766 54,842
47 Total Expenses 3,640,673 3,181,537 459,136
48 Total Operating Income 518,566 439,541 79,026
49
50 AFDC Debt 12,939 10,959 1,980
51 AFDC Equity 26,359 22,324 4,034
52
53 Net Income 557,864 472,824 85,040
Dec - 2016Line No.
NSPM - 02 Income Statement Schedule
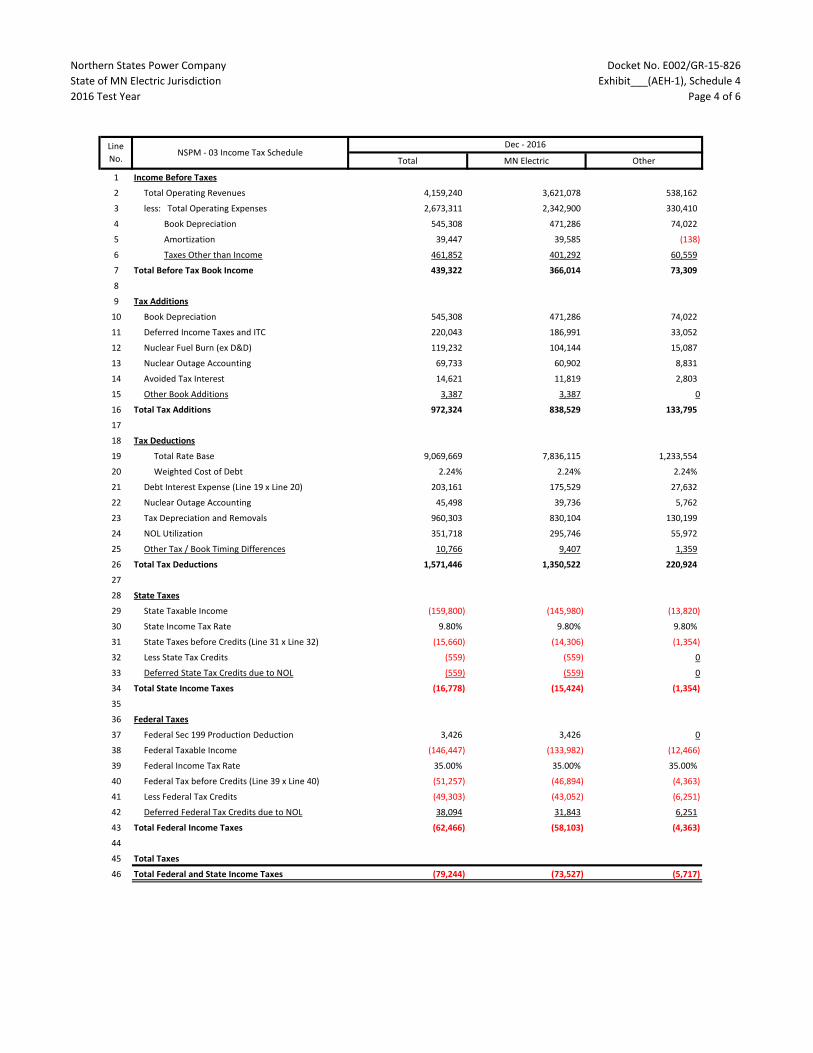
Northern States Power CompanyState of MN Electric Jurisdiction2016 Test Year
Docket No. E002/GR-15-826Exhibit___(AEH-1), Schedule 4
Page 4 of 6
Total MN Electric Other
1 Income Before Taxes
2 Total Operating Revenues 4,159,240 3,621,078 538,162
3 less: Total Operating Expenses 2,673,311 2,342,900 330,410
4 Book Depreciation 545,308 471,286 74,022
5 Amortization 39,447 39,585 (138)
6 Taxes Other than Income 461,852 401,292 60,559
7 Total Before Tax Book Income 439,322 366,014 73,309
8
9 Tax Additions
10 Book Depreciation 545,308 471,286 74,022
11 Deferred Income Taxes and ITC 220,043 186,991 33,052
12 Nuclear Fuel Burn (ex D&D) 119,232 104,144 15,087
13 Nuclear Outage Accounting 69,733 60,902 8,831
14 Avoided Tax Interest 14,621 11,819 2,803
15 Other Book Additions 3,387 3,387 0
16 Total Tax Additions 972,324 838,529 133,795
17
18 Tax Deductions
19 Total Rate Base 9,069,669 7,836,115 1,233,554
20 Weighted Cost of Debt 2.24% 2.24% 2.24%
21 Debt Interest Expense (Line 19 x Line 20) 203,161 175,529 27,632
22 Nuclear Outage Accounting 45,498 39,736 5,762
23 Tax Depreciation and Removals 960,303 830,104 130,199
24 NOL Utilization 351,718 295,746 55,972
25 Other Tax / Book Timing Differences 10,766 9,407 1,359
26 Total Tax Deductions 1,571,446 1,350,522 220,924
27
28 State Taxes
29 State Taxable Income (159,800) (145,980) (13,820)
30 State Income Tax Rate 9.80% 9.80% 9.80%
31 State Taxes before Credits (Line 31 x Line 32) (15,660) (14,306) (1,354)
32 Less State Tax Credits (559) (559) 0
33 Deferred State Tax Credits due to NOL (559) (559) 0
34 Total State Income Taxes (16,778) (15,424) (1,354)
35
36 Federal Taxes
37 Federal Sec 199 Production Deduction 3,426 3,426 0
38 Federal Taxable Income (146,447) (133,982) (12,466)
39 Federal Income Tax Rate 35.00% 35.00% 35.00%
40 Federal Tax before Credits (Line 39 x Line 40) (51,257) (46,894) (4,363)
41 Less Federal Tax Credits (49,303) (43,052) (6,251)
42 Deferred Federal Tax Credits due to NOL 38,094 31,843 6,251
43 Total Federal Income Taxes (62,466) (58,103) (4,363)
44
45 Total Taxes
46 Total Federal and State Income Taxes (79,244) (73,527) (5,717)
Dec - 2016Line No.
NSPM - 03 Income Tax Schedule

Northern States Power CompanyState of MN Electric Jurisdiction2016 Test Year
Docket No. E002/GR-15-826Exhibit___(AEH-1), Schedule 4
Page 5 of 6
Total MN Electric Other
1 Weighted Cost of Capital
2 Cost of Short Term Debt 1.84% 1.84% 1.84%
3 Cost of Long Term Debt 4.81% 4.81% 4.81%
4 Cost of Preferred Stock
5 Cost of Common Equity 10.00% 10.00% 10.00%
6 Ratio of Short Term Debt 1.26% 1.26% 1.26%
7 Ratio of Long Term Debt 46.24% 46.24% 46.24%
8 Ratio of Preferred Stock
9 Ratio of Common Equity 52.50% 52.50% 52.50%
10 Weighted Cost of STD 0.02% 0.02% 0.02%
11 Weighted Cost of LTD 2.22% 2.22% 2.22%
12 Weighted Cost of Debt 2.24% 2.24% 2.24%
13 Weighted Cost of Preferred Stock 0.0% 0.0% 0.0%
14 Weighted Cost of Equity 5.25% 5.25% 5.25%
15 Required Rate Of Return 7.49% 7.49% 7.49%
16
17 Composite Income Tax Rate
18 State Tax Rate 9.80% 9.80% 9.80%
19 Federal Statuatory Tax Rate 35.00% 35.00% 35.00%
20 Federal Effective Tax Rate 31.57% 31.57% 31.57%
21 Composite Tax Rate 41.37% 41.37% 41.37%
22
23 Rate of Return (ROR)
24 Total Operating Income 557,864 472,824 85,040
25 Total Rate Base 9,069,669 7,836,115 1,233,554
26 ROR (Operating Income / Rate Base) 6.15% 6.03% 6.89%
27
28 Return on Equity (ROE)
29 Total Operating Income 557,864 472,824 85,040
30 Debt Interest (Rate Base * Weighted Cost of Debt) (203,161) (175,529) (27,632)
31 Earnings Available for Common 354,704 297,295 57,409
32 Equity Rate Base (Rate Base * Equity Ratio) 4,761,576 4,113,960 647,616
33 ROE (earnings for Common/Equity Rate Base) 7.45% 7.23% 8.86%
34
35 Revenue Deficiency
36 Required Operating Income (Rate Base * Required Return) 680,068 586,925 93,143
37 Total Operating Income 557,864 472,824 85,040
38 Operating Income Deficiency 122,204 114,101 8,103
39
40 Revenue Conversion Factor ( 1/(1-Composite Tax Rate) ) 1.705611 1.705611 1.705611
41 Revenue Deficiency (Income Deficiency * Conversion Factor) 208,432 194,612 13,820
42
43 Total Revenue Requirements
44 Total Retail Revenues 3,488,740 3,034,093 454,647
45 Revenue Deficiency 208,432 194,612 13,820
46 Total Revenue Requirements 3,697,172 3,228,705 468,467
47
Dec - 2016Line No.
NSPM - 04 Revenue Deficiency Schedule

Northern States Power CompanyState of MN Electric Jurisdiction2016 Test Year
Docket No. E002/GR-15-826Exhibit___(AEH-1), Schedule 4
Page 6 of 6
Lead/Lag
Days Dollars Dollar x Days Dollars Dollar x Days Dollars Dollar x Days
1 Fuel Expenses
2 Coal and Rail Transport 19.07 319,061 6,084,501 278,629 5,313,461 40,432 771,040
3 Gas for Generation 37.68 240,705 9,069,749 210,202 7,920,412 30,503 1,149,337
4 Oil 19.87 784 15,571 684 13,598 99 1,973
5 Nuclear and EOL (0) 119,232 (0) 104,122 (0) 15,109 (0)
6 Nuclear Disposal (0) (0) (0) (0) (0) (0) (0)
7 Subtotal Fuel Expenses 679,782 15,169,822 593,638 13,247,471 86,143 1,922,350
8
9 Purchased Power
10 Purchases 35.62 562,853 20,048,811 491,614 17,511,277 71,239 2,537,534
11 Interchange 38.21 106,763 4,079,398 93,253 3,563,195 13,510 516,203
12 SubTotal Purchased Power 669,615 24,128,209 584,867 21,074,472 84,749 3,053,737
13
14 Labor and Related
15 Regular Payroll 11.56 396,695 4,585,796 344,910 3,987,159 51,785 598,637
16 Incentive 253.17 25,346 6,416,838 22,151 5,608,034 3,195 808,805
17 Pension and Benefits 35.67 89,242 3,183,270 77,707 2,771,794 11,536 411,476
18 SubTotal Labor and Related 511,283 14,185,905 444,768 12,366,987 66,516 1,818,918
19
20 All Other Operating Expenses 43.76 812,630 35,560,705 719,628 31,490,909 93,003 4,069,796
21 Property taxes 355.31 210,192 74,683,492 186,751 66,354,590 23,441 8,328,902
22 Employer's Payroll Taxes 33.72 31,616 1,066,099 27,550 928,998 4,066 137,100
23 Gross Earnings Tax 55.46 53,210 2,951,047 53,210 2,951,047 (0) (0)
24 Federal Income Tax 36.75 (62,466) (2,295,626) (58,103) (2,135,288) (4,363) (160,338)
25 State Income Tax 29.50 (16,778) (494,953) (15,424) (454,999) (1,354) (39,953)
26 State Sales Tax Customer Billings 35.20 136,608 4,808,617 136,608 4,808,617 0 0
27 Total Expenses 3,025,694 169,763,316 2,673,494 150,632,804 352,200 19,130,512
28 Net Annual Expense 465,105 412,693 52,412
29
30 Revenues
31 Retail Revenue 41.42 3,487,931 144,470,120 3,033,285 125,638,646 454,647 18,831,474
32 Late Payment - 7,031 (0) 6,058 (0) (0) (0)
33 Interdepartmental - 809 (0) 809 (0) (0) (0)
34 Misc Services 41.42 3,200 132,546 2,493 103,261 707 29,285
35 CIP Incentive - 228 (0) (0) (0) 228 (0)
36 Rentals (40.86) 5,120 (209,201) 4,472 (182,742) 648 (26,459)
37 Interchange 38.21 517,879 19,788,171 452,309 17,282,744 65,570 2,505,427
38 Sales for Resale 38.27 (0) (0) (0) (0) (0) (0)
39 Retail Rev Lag Days 38.27 2,431 93,036 2,223 85,082 208 7,954
40 MISO 14.00 (140,682) (1,969,541) (123,042) (1,722,592) (17,639) (246,950)
41 Wholesale Lag Days 38.27 248,775 9,520,612 217,294 8,315,838 31,481 1,204,773
42 Total Revenues 4,132,722 171,825,743 3,595,901 149,520,239 536,821 22,305,504
43
44 Net Annual Amount 470,755 409,644 61,111
45 Expense/Revenue Factor 0.732131 10.284675 0.743484 3.717419 0.656084 6.567256
46 Allocated Revenue Amount 344,658 304,564 40,094
47 Net Cash Working Capital (120,447) (108,129) (12,318)
Total MN Electric OtherLine No.
NSPM - 05 Summary Cash Working Capital
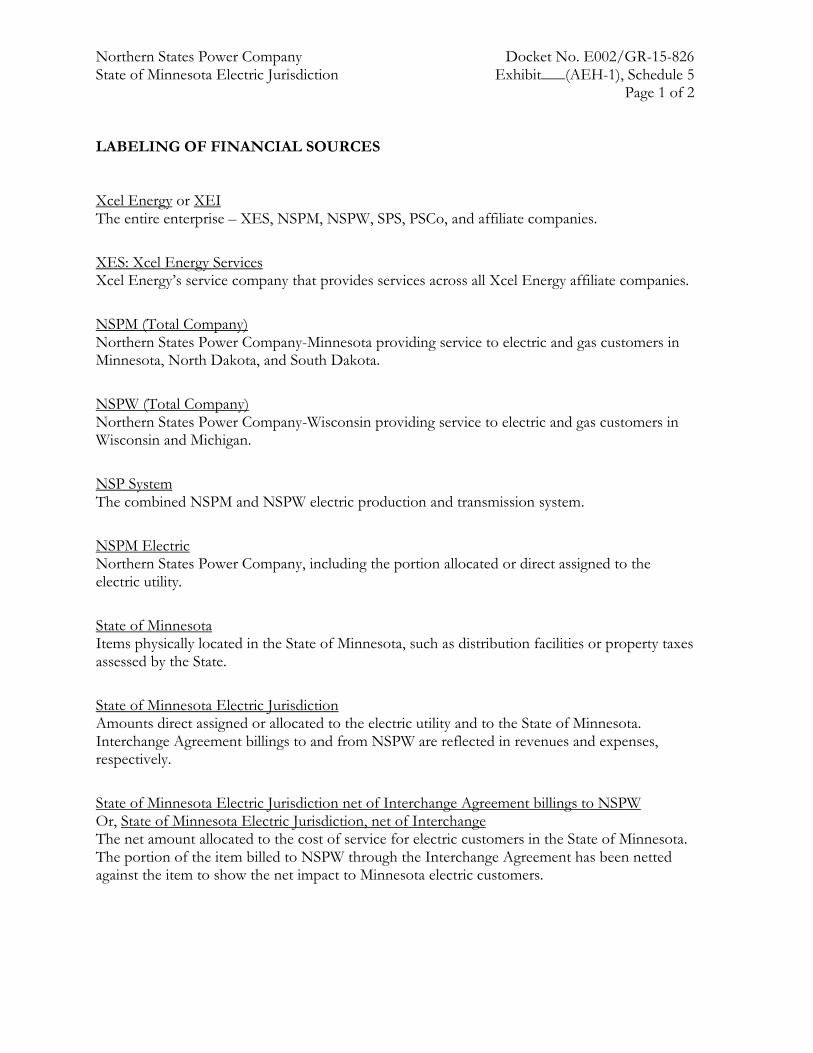
Northern States Power Company Docket No. E002/GR-15-826 State of Minnesota Electric Jurisdiction Exhibit___(AEH-1), Schedule 5
Page 1 of 2 LABELING OF FINANCIAL SOURCES Xcel Energy or XEI The entire enterprise – XES, NSPM, NSPW, SPS, PSCo, and affiliate companies.
XES: Xcel Energy Services Xcel Energy’s service company that provides services across all Xcel Energy affiliate companies.
NSPM (Total Company) Northern States Power Company-Minnesota providing service to electric and gas customers in Minnesota, North Dakota, and South Dakota.
NSPW (Total Company) Northern States Power Company-Wisconsin providing service to electric and gas customers in Wisconsin and Michigan.
NSP System The combined NSPM and NSPW electric production and transmission system.
NSPM Electric Northern States Power Company, including the portion allocated or direct assigned to the electric utility.
State of Minnesota Items physically located in the State of Minnesota, such as distribution facilities or property taxes assessed by the State.
State of Minnesota Electric Jurisdiction Amounts direct assigned or allocated to the electric utility and to the State of Minnesota. Interchange Agreement billings to and from NSPW are reflected in revenues and expenses, respectively.
State of Minnesota Electric Jurisdiction net of Interchange Agreement billings to NSPW Or, State of Minnesota Electric Jurisdiction, net of Interchange The net amount allocated to the cost of service for electric customers in the State of Minnesota. The portion of the item billed to NSPW through the Interchange Agreement has been netted against the item to show the net impact to Minnesota electric customers.
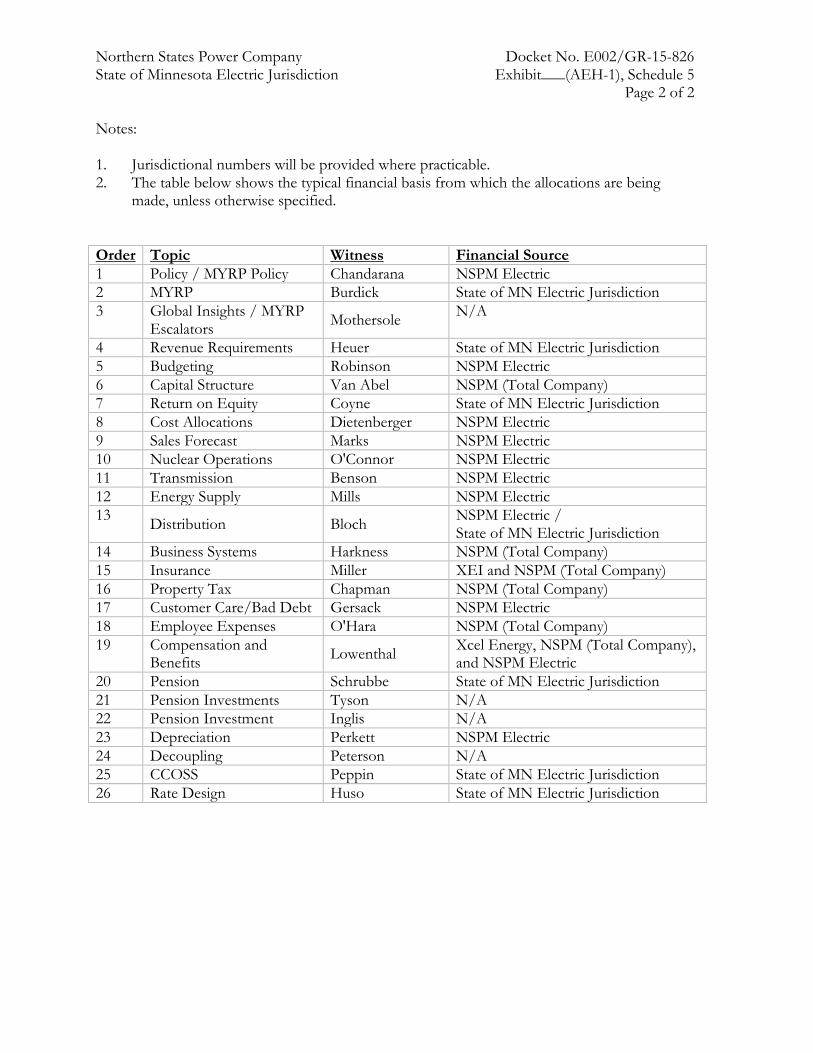
Northern States Power Company Docket No. E002/GR-15-826 State of Minnesota Electric Jurisdiction Exhibit___(AEH-1), Schedule 5
Page 2 of 2 Notes: 1. Jurisdictional numbers will be provided where practicable. 2. The table below shows the typical financial basis from which the allocations are being
made, unless otherwise specified.
Order Topic Witness Financial Source 1 Policy / MYRP Policy Chandarana NSPM Electric 2 MYRP Burdick State of MN Electric Jurisdiction 3 Global Insights / MYRP
Escalators Mothersole N/A
4 Revenue Requirements Heuer State of MN Electric Jurisdiction 5 Budgeting Robinson NSPM Electric 6 Capital Structure Van Abel NSPM (Total Company) 7 Return on Equity Coyne State of MN Electric Jurisdiction 8 Cost Allocations Dietenberger NSPM Electric 9 Sales Forecast Marks NSPM Electric 10 Nuclear Operations O'Connor NSPM Electric 11 Transmission Benson NSPM Electric 12 Energy Supply Mills NSPM Electric 13 Distribution Bloch NSPM Electric /
State of MN Electric Jurisdiction 14 Business Systems Harkness NSPM (Total Company) 15 Insurance Miller XEI and NSPM (Total Company) 16 Property Tax Chapman NSPM (Total Company) 17 Customer Care/Bad Debt Gersack NSPM Electric 18 Employee Expenses O'Hara NSPM (Total Company) 19 Compensation and
Benefits Lowenthal Xcel Energy, NSPM (Total Company), and NSPM Electric
20 Pension Schrubbe State of MN Electric Jurisdiction 21 Pension Investments Tyson N/A 22 Pension Investment Inglis N/A 23 Depreciation Perkett NSPM Electric 24 Decoupling Peterson N/A 25 CCOSS Peppin State of MN Electric Jurisdiction 26 Rate Design Huso State of MN Electric Jurisdiction

Northern States Power Company Docket No. E002/GR-15-826State of Minnesota Electric Jurisdication Exhibit___(AEH-1), Schedule 6
Page 1 of 5SUMMARY OF MAJOR COST ELEMENTSTest Year Ending December 31, 2016Amounts in millions
2016Revenue
Line of the Revenue Deficiency Deficiency reference
1 Capital Recovery: for additional rate base investment (includes return $159.6 row 22 of page 2requirement, change in capital structure, cost of capital, depreciationand Allowance for Funds Used During Construction)
Operating Expenses:2 Power Production ($9.0) row 25 & 26 of page 23 Transmission $2.5 row 27 of page 24 Distribution $4.7 row 28 of page 25 Customer Accounts, Info Services, Sales & Economic Development $0.4 row 29 of page 26 Administrative and General Expense $19.3 row 30 of page 27 Total Operating Expenses $17.9
Taxes Other than Income Taxes:8 Real Estate and Personal Property $30.2 row 34 of page 29 Payroll Taxes and Other ($1.9) row 35 of page 2
10 Total Taxes Other Than Income Taxes $28.3
11 Amortizations ($0.7) row 39 of page 2
12 Subtotal $205.1
13 Less, Net Sales and Growth in Margin ($10.5) row 47 of page 2
14 Net Revenue Deficiency $194.6

Northern States Power Company Docket No. E002/GR-15-826State of Minnesota Electric Jurisdication Exhibit___(AEH-1), Schedule 6
Page 2 of 5SUMMARY OF MAJOR COST DRIVERSTest Year Ending December 31, 2016Amounts in millions
13-868 Outcome2014 TY + 2016 TY over2015 Step 2016 TY last case reference
Capital-RelatedNuclear 200.1 257.6 57.5 column 1 of page 3Energy Supply 207.7 204.2 (3.4) column 2 of page 3Wind 31.6 44.3 12.7 column 3 of page 3Transmission net of TCR 169.7 188.5 18.8 column 4 of page 3Distribution 235.6 248.6 13.0 column 5 of page 3General & Intangible 88.3 114.2 25.9 column 6 of page 3Theoretical Reserve (58.5) (32.4) 26.1 column 7 of page 3Other Rate Base 10.6 7.9 (2.6) column 8 of page 3NOL & Fed Tax Items 22.3 16.1 (6.2) column 9 of page 3ROE - 20.0 20.0 column 10 of page 3Cap Structure & Debt - (2.1) (2.1) column 11 of page 3TOTAL Capital-Related 907.4 1,067.0 159.6
O&MNuclear 287.3 274.0 (13.4) column 12 of page 3Energy Supply 161.1 165.4 4.4 column 13 of page 3Transmission 37.9 40.3 2.5 column 14 of page 3Distribution (MN only) 103.0 107.7 4.7 column 15 of page 3Customer Acctg, Info, Sales 49.9 50.3 0.4 column 16 of page 3A&G and Other O&M 197.3 216.6 19.3 column 17 of page 3TOTAL O&M 836.4 854.4 17.9
TaxesProperty Taxes 146.0 176.2 30.2 column 18 of page 4Payroll Taxes 29.4 27.6 (1.9) column 19 of page 4TOTAL Taxes 175.4 203.7 28.3
AmortizationsAmortizations 1.8 1.1 (0.7) column 20 of page 4TOTAL Amortizations 1.8 1.1 (0.7)
MarginsRetail Revenue & COGS (2,001.0) (2,015.4) (14.4) column 21 of page 4Purchased Demand 131.2 113.4 (17.8) column 22 of page 4DOE Payment (25.7) - 25.7 column 23 of page 4Non-Retail Revenue (25.5) (29.6) (4.0) column 24 of page 4TOTAL Margins (1,921.0) (1,931.6) (10.5)
TOTAL Deficiency - 194.612 194.612
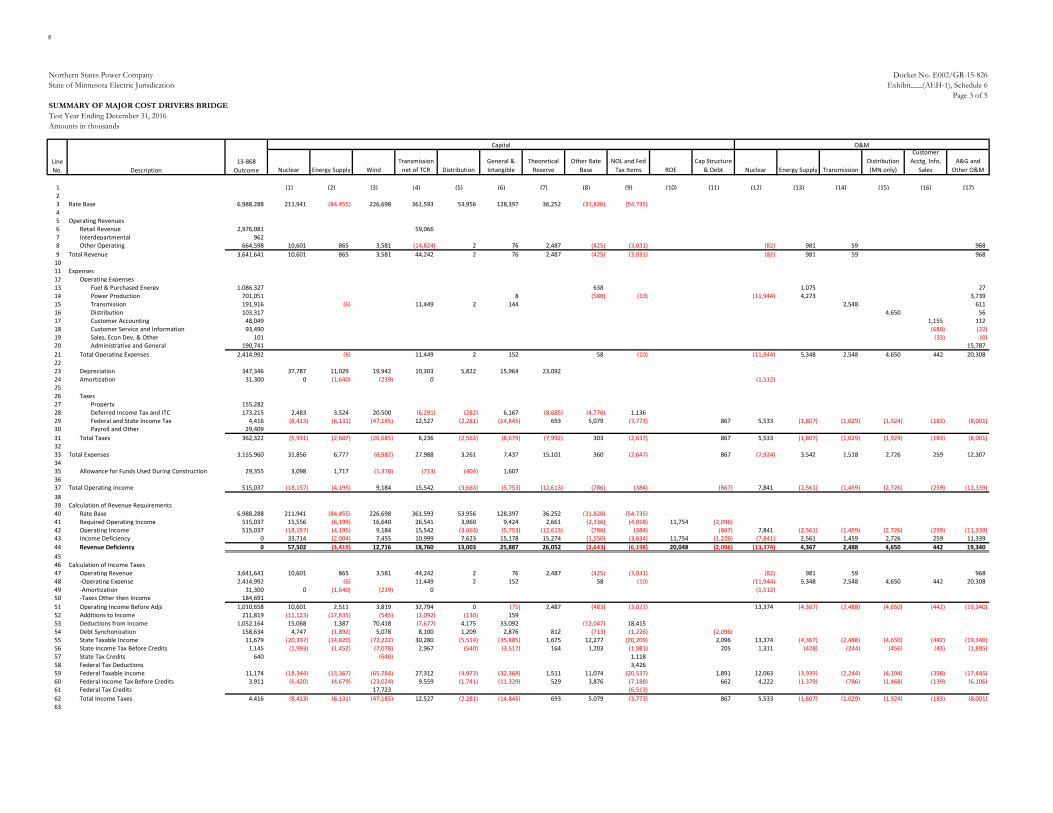
Northern States Power Company Docket No. E002/GR-15-826State of Minnesota Electric Jurisdication Exhibit___(AEH-1), Schedule 6
Page 3 of 5SUMMARY OF MAJOR COST DRIVERS BRIDGETest Year Ending December 31, 2016Amounts in thousands
Nuclear Energy Supply WindTransmission
net of TCR DistributionGeneral & Intangible
Theoretical Reserve
Other Rate Base
NOL and Fed Tax Items ROE
Cap Structure & Debt Nuclear Energy Supply Transmission
Distribution (MN only)
Customer Acctg, Info,
SalesA&G and
Other O&M
1 (1) (2) (3) (4) (5) (6) (7) (8) (9) (10) (11) (12) (13) (14) (15) (16) (17)23 Rate Base 6,988,288 211,941 (84,455) 226,698 361,593 53,956 128,397 36,252 (31,820) (54,735) 45 Operating Revenues6 Retail Revenue 2,976,081 59,066 7 Interdepartmental 962 8 Other Operating 664,598 10,601 865 3,581 (14,824) 2 76 2,487 (425) (3,031) (82) 981 59 9689 Total Revenue 3,641,641 10,601 865 3,581 44,242 2 76 2,487 (425) (3,031) (82) 981 59 968
10 11 Expenses 12 Operating Expenses 13 Fuel & Purchased Energy 1,086,327 638 1,075 2714 Power Production 701,051 8 (580) (10) (11,944) 4,273 3,73915 Transmission 191,916 (6) 11,449 2 144 2,548 61116 Distribution 103,317 4,650 5617 Customer Accounting 48,049 1,155 11218 Customer Service and Information 93,490 (680) (22)19 Sales, Econ Dev, & Other 101 (33) (0)20 Administrative and General 190,741 15,78721 Total Operating Expenses 2,414,992 (6) 11,449 2 152 58 (10) (11,944) 5,348 2,548 4,650 442 20,3082223 Depreciation 347,346 37,787 11,029 19,942 10,303 5,822 15,964 23,092 24 Amortization 31,300 0 (1,640) (239) 0 (1,512) 2526 Taxes27 Property 155,282 28 Deferred Income Tax and ITC 173,215 2,483 3,524 20,500 (6,291) (282) 6,167 (8,685) (4,776) 1,136 29 Federal and State Income Tax 4,416 (8,413) (6,131) (47,185) 12,527 (2,281) (14,845) 693 5,079 (3,773) 867 5,533 (1,807) (1,029) (1,924) (183) (8,001)30 Payroll and Other 29,409 31 Total Taxes 362,322 (5,931) (2,607) (26,685) 6,236 (2,563) (8,679) (7,992) 303 (2,637) 867 5,533 (1,807) (1,029) (1,924) (183) (8,001)32 33 Total Expenses 3,155,960 31,856 6,777 (6,982) 27,988 3,261 7,437 15,101 360 (2,647) 867 (7,924) 3,542 1,518 2,726 259 12,3073435 Allowance for Funds Used During Construction 29,355 3,098 1,717 (1,378) (713) (404) 1,607 3637 Total Operating Income 515,037 (18,157) (4,195) 9,184 15,542 (3,663) (5,753) (12,613) (786) (384) (867) 7,841 (2,561) (1,459) (2,726) (259) (11,339)38 39 Calculation of Revenue Requirements 40 Rate Base 6,988,288 211,941 (84,455) 226,698 361,593 53,956 128,397 36,252 (31,820) (54,735) 41 Required Operating Income 515,037 15,556 (6,199) 16,640 26,541 3,960 9,424 2,661 (2,336) (4,018) 11,754 (2,096) 42 Operating Income 515,037 (18,157) (4,195) 9,184 15,542 (3,663) (5,753) (12,613) (786) (384) (867) 7,841 (2,561) (1,459) (2,726) (259) (11,339)43 Income Deficiency 0 33,714 (2,004) 7,455 10,999 7,623 15,178 15,274 (1,550) (3,634) 11,754 (1,229) (7,841) 2,561 1,459 2,726 259 11,33944 Revenue Deficiency 0 57,502 (3,419) 12,716 18,760 13,003 25,887 26,052 (2,643) (6,198) 20,048 (2,096) (13,374) 4,367 2,488 4,650 442 19,34045 46 Calculation of Income Taxes 47 Operating Revenue 3,641,641 10,601 865 3,581 44,242 2 76 2,487 (425) (3,031) (82) 981 59 96848 -Operating Expense 2,414,992 (6) 11,449 2 152 58 (10) (11,944) 5,348 2,548 4,650 442 20,30849 -Amortization 31,300 0 (1,640) (239) 0 (1,512) 50 -Taxes Other then Income 184,691 51 Operating Income Before Adjs 1,010,658 10,601 2,511 3,819 32,794 0 (75) 2,487 (483) (3,021) 13,374 (4,367) (2,488) (4,650) (442) (19,340)52 Additions to Income 211,819 (11,123) (17,835) (545) (2,092) (130) 159 53 Deductions from Income 1,052,164 15,068 1,387 70,418 (7,677) 4,175 33,092 (12,047) 18,415 54 Debt Synchonization 158,634 4,747 (1,892) 5,078 8,100 1,209 2,876 812 (713) (1,226) (2,096) 55 State Taxable Income 11,679 (20,337) (14,820) (72,222) 30,280 (5,514) (35,885) 1,675 12,277 (20,209) 2,096 13,374 (4,367) (2,488) (4,650) (442) (19,340)56 State Income Tax Before Credits 1,145 (1,993) (1,452) (7,078) 2,967 (540) (3,517) 164 1,203 (1,981) 205 1,311 (428) (244) (456) (43) (1,895)57 State Tax Credits 640 (640) 1,118 58 Federal Tax Deductions 3,426 59 Federal Taxable Income 11,174 (18,344) (13,367) (65,784) 27,312 (4,973) (32,368) 1,511 11,074 (20,537) 1,891 12,063 (3,939) (2,244) (4,194) (398) (17,445)60 Federal Income Tax Before Credits 3,911 (6,420) (4,679) (23,024) 9,559 (1,741) (11,329) 529 3,876 (7,188) 662 4,222 (1,379) (786) (1,468) (139) (6,106)61 Federal Tax Credits 17,723 (6,513) 62 Total Income Taxes 4,416 (8,413) (6,131) (47,185) 12,527 (2,281) (14,845) 693 5,079 (3,773) 867 5,533 (1,807) (1,029) (1,924) (183) (8,001)63
Line No. Description
13-868 Outcome
Capital O&M

Northern States Power CompanyState of Minnesota Electric Jurisdication
SUMMARY OF MAJOR COST DRIVERS BRIDGETest Year Ending December 31, 2016Amounts in thousands
123 Rate Base45 Operating Revenues6 Retail Revenue7 Interdepartmental8 Other Operating9 Total Revenue
1011 Expenses12 Operating Expenses13 Fuel & Purchased Energy14 Power Production15 Transmission16 Distribution17 Customer Accounting18 Customer Service and Information19 Sales, Econ Dev, & Other20 Administrative and General21 Total Operating Expenses2223 Depreciation24 Amortization2526 Taxes27 Property28 Deferred Income Tax and ITC29 Federal and State Income Tax30 Payroll and Other31 Total Taxes3233 Total Expenses3435 Allowance for Funds Used During Construction3637 Total Operating Income3839 Calculation of Revenue Requirements40 Rate Base41 Required Operating Income42 Operating Income43 Income Deficiency44 Revenue Deficiency4546 Calculation of Income Taxes47 Operating Revenue48 -Operating Expense49 -Amortization50 -Taxes Other then Income51 Operating Income Before Adjs52 Additions to Income53 Deductions from Income54 Debt Synchonization55 State Taxable Income56 State Income Tax Before Credits57 State Tax Credits58 Federal Tax Deductions59 Federal Taxable Income60 Federal Income Tax Before Credits61 Federal Tax Credits62 Total Income Taxes63
Line No. Description
Docket No. E002/GR-15-826 Exhibit___(AEH-1), Schedule 6
Page 4 of 5
Property Taxes Payroll Taxes Amortizations
Retail Revenue/
COGSPurchased Demand DOE Payment
Non-Retail (Misc)
Revenue
(18) (19) (20) (21) (22) (23) (24)
7,836,115
(1,862) 3,033,285 (154) 809
4,151 (63,153) 1,821 (25,735) 4,041 586,9844,151 (65,169) 1,821 (25,735) 4,041 3,621,078
(86,970) 1,001,096
246 693 (15,954) 681,5212,627 (4,105) 205,186
108,023 49,315 (1,677) 91,110 69 52 206,579
2,873 (92,007) (15,954) 2,342,900
471,286 (719) 12,395 39,585
31,469 186,751 186,991
(12,490) 769 297 5,975 7,354 (10,646) 1,672 (73,527) (1,859) 27,550
18,979 (1,090) 297 5,975 7,354 (10,646) 1,672 327,766
21,853 (1,090) (422) (73,637) (8,601) (10,646) 1,672 3,181,537
33,283
(17,701) 1,090 422 8,468 10,422 (15,088) 2,370 472,824 7,836,115 586,925
(17,701) 1,090 422 8,468 10,422 (15,088) 2,370 472,82417,701 (1,090) (422) (8,468) (10,422) 15,088 (2,370) 114,10130,191 (1,859) (719) (14,443) (17,776) 25,735 (4,041) 194,612
4,151 (65,169) 1,821 (25,735) 4,041 3,621,0782,873 (92,007) (15,954) 2,342,900
(719) 12,395 39,58531,469 (1,859) 214,302
(30,191) 1,859 719 14,443 17,776 (25,735) 4,041 1,024,290 180,252 1,174,993 175,529
(30,191) 1,859 719 14,443 17,776 (25,735) 4,041 (145,980)(2,959) 182 70 1,415 1,742 (2,522) 396 (14,306)
1,118 3,426
(27,233) 1,676 649 13,028 16,034 (23,213) 3,645 (133,982)(9,531) 587 227 4,560 5,612 (8,124) 1,276 (46,894)
11,209(12,490) 769 297 5,975 7,354 (10,646) 1,672 (73,527)
2016 Test Year
Taxes Margin
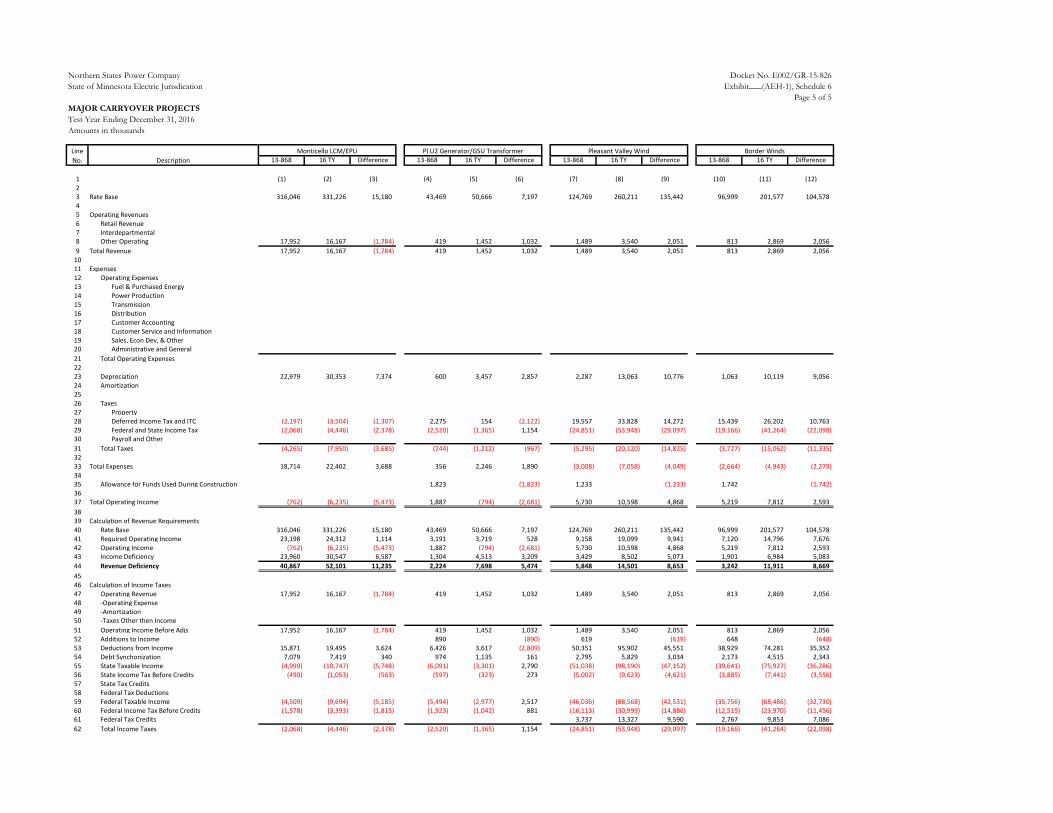
Northern States Power Company Docket No. E002/GR-15-826State of Minnesota Electric Jurisdication Exhibit___(AEH-1), Schedule 6
Page 5 of 5MAJOR CARRYOVER PROJECTSTest Year Ending December 31, 2016Amounts in thousands
13-868 16 TY Difference 13-868 16 TY Difference 13-868 16 TY Difference 13-868 16 TY Difference
1 (1) (2) (3) (4) (5) (6) (7) (8) (9) (10) (11) (12)23 Rate Base 316,046 331,226 15,180 43,469 50,666 7,197 124,769 260,211 135,442 96,999 201,577 104,57845 Operating Revenues6 Retail Revenue 7 Interdepartmental 8 Other Operating 17,952 16,167 (1,784) 419 1,452 1,032 1,489 3,540 2,051 813 2,869 2,0569 Total Revenue 17,952 16,167 (1,784) 419 1,452 1,032 1,489 3,540 2,051 813 2,869 2,056
1011 Expenses12 Operating Expenses13 Fuel & Purchased Energy 14 Power Production 15 Transmission 16 Distribution 17 Customer Accounting 18 Customer Service and Information 19 Sales, Econ Dev, & Other 20 Administrative and General 21 Total Operating Expenses 2223 Depreciation 22,979 30,353 7,374 600 3,457 2,857 2,287 13,063 10,776 1,063 10,119 9,05624 Amortization 2526 Taxes27 Property 28 Deferred Income Tax and ITC (2,197) (3,504) (1,307) 2,275 154 (2,122) 19,557 33,828 14,272 15,439 26,202 10,76329 Federal and State Income Tax (2,068) (4,446) (2,378) (2,520) (1,365) 1,154 (24,851) (53,948) (29,097) (19,166) (41,264) (22,098)30 Payroll and Other31 Total Taxes (4,265) (7,950) (3,685) (244) (1,212) (967) (5,295) (20,120) (14,825) (3,727) (15,062) (11,335)3233 Total Expenses 18,714 22,402 3,688 356 2,246 1,890 (3,008) (7,058) (4,049) (2,664) (4,943) (2,279)3435 Allowance for Funds Used During Construction 1,823 (1,823) 1,233 (1,233) 1,742 (1,742)3637 Total Operating Income (762) (6,235) (5,473) 1,887 (794) (2,681) 5,730 10,598 4,868 5,219 7,812 2,5933839 Calculation of Revenue Requirements 40 Rate Base 316,046 331,226 15,180 43,469 50,666 7,197 124,769 260,211 135,442 96,999 201,577 104,57841 Required Operating Income 23,198 24,312 1,114 3,191 3,719 528 9,158 19,099 9,941 7,120 14,796 7,67642 Operating Income (762) (6,235) (5,473) 1,887 (794) (2,681) 5,730 10,598 4,868 5,219 7,812 2,59343 Income Deficiency 23,960 30,547 6,587 1,304 4,513 3,209 3,429 8,502 5,073 1,901 6,984 5,08344 Revenue Deficiency 40,867 52,101 11,235 2,224 7,698 5,474 5,848 14,501 8,653 3,242 11,911 8,6694546 Calculation of Income Taxes47 Operating Revenue 17,952 16,167 (1,784) 419 1,452 1,032 1,489 3,540 2,051 813 2,869 2,05648 -Operating Expense 49 -Amortization 50 -Taxes Other then Income 51 Operating Income Before Adjs 17,952 16,167 (1,784) 419 1,452 1,032 1,489 3,540 2,051 813 2,869 2,05652 Additions to Income 890 (890) 619 (619) 648 (648)53 Deductions from Income 15,871 19,495 3,624 6,426 3,617 (2,809) 50,351 95,902 45,551 38,929 74,281 35,35254 Debt Synchonization 7,079 7,419 340 974 1,135 161 2,795 5,829 3,034 2,173 4,515 2,34355 State Taxable Income (4,999) (10,747) (5,748) (6,091) (3,301) 2,790 (51,038) (98,190) (47,152) (39,641) (75,927) (36,286)56 State Income Tax Before Credits (490) (1,053) (563) (597) (323) 273 (5,002) (9,623) (4,621) (3,885) (7,441) (3,556)57 State Tax Credits 58 Federal Tax Deductions 59 Federal Taxable Income (4,509) (9,694) (5,185) (5,494) (2,977) 2,517 (46,036) (88,568) (42,531) (35,756) (68,486) (32,730)60 Federal Income Tax Before Credits (1,578) (3,393) (1,815) (1,923) (1,042) 881 (16,113) (30,999) (14,886) (12,515) (23,970) (11,456)61 Federal Tax Credits 3,737 13,327 9,590 2,767 9,853 7,08662 Total Income Taxes (2,068) (4,446) (2,378) (2,520) (1,365) 1,154 (24,851) (53,948) (29,097) (19,166) (41,264) (22,098)
Monticello LCM/EPU Pleasant Valley Wind Border WindsPI U2 Generator/GSU TransformerLine No. Description
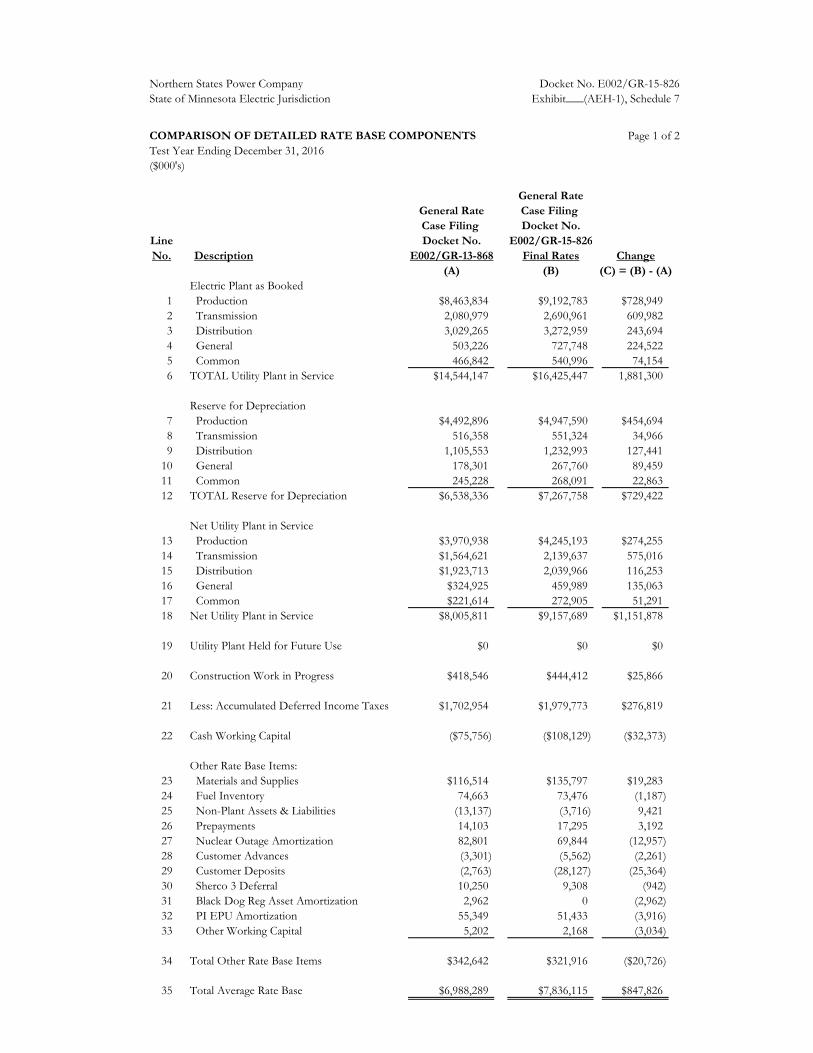
Northern States Power Company Docket No. E002/GR-15-826State of Minnesota Electric Jurisdiction Exhibit___(AEH-1), Schedule 7
COMPARISON OF DETAILED RATE BASE COMPONENTS Page 1 of 2Test Year Ending December 31, 2016($000's)
General RateGeneral Rate Case Filing Case Filing Docket No.
Line Docket No. E002/GR-15-826No. Description E002/GR-13-868 Final Rates Change
(A) (B) (C) = (B) - (A)Electric Plant as Booked
1 Production $8,463,834 $9,192,783 $728,9492 Transmission 2,080,979 2,690,961 609,9823 Distribution 3,029,265 3,272,959 243,6944 General 503,226 727,748 224,5225 Common 466,842 540,996 74,1546 TOTAL Utility Plant in Service $14,544,147 $16,425,447 1,881,300
Reserve for Depreciation7 Production $4,492,896 $4,947,590 $454,6948 Transmission 516,358 551,324 34,9669 Distribution 1,105,553 1,232,993 127,441
10 General 178,301 267,760 89,45911 Common 245,228 268,091 22,86312 TOTAL Reserve for Depreciation $6,538,336 $7,267,758 $729,422
Net Utility Plant in Service13 Production $3,970,938 $4,245,193 $274,25514 Transmission $1,564,621 2,139,637 575,01615 Distribution $1,923,713 2,039,966 116,25316 General $324,925 459,989 135,06317 Common $221,614 272,905 51,29118 Net Utility Plant in Service $8,005,811 $9,157,689 $1,151,878
19 Utility Plant Held for Future Use $0 $0 $0
20 Construction Work in Progress $418,546 $444,412 $25,866
21 Less: Accumulated Deferred Income Taxes $1,702,954 $1,979,773 $276,819
22 Cash Working Capital ($75,756) ($108,129) ($32,373)
Other Rate Base Items: 23 Materials and Supplies $116,514 $135,797 $19,28324 Fuel Inventory 74,663 73,476 (1,187)25 Non-Plant Assets & Liabilities (13,137) (3,716) 9,42126 Prepayments 14,103 17,295 3,19227 Nuclear Outage Amortization 82,801 69,844 (12,957)28 Customer Advances (3,301) (5,562) (2,261)29 Customer Deposits (2,763) (28,127) (25,364)30 Sherco 3 Deferral 10,250 9,308 (942)31 Black Dog Reg Asset Amortization 2,962 0 (2,962)32 PI EPU Amortization 55,349 51,433 (3,916)33 Other Working Capital 5,202 2,168 (3,034)
34 Total Other Rate Base Items $342,642 $321,916 ($20,726)
35 Total Average Rate Base $6,988,289 $7,836,115 $847,826
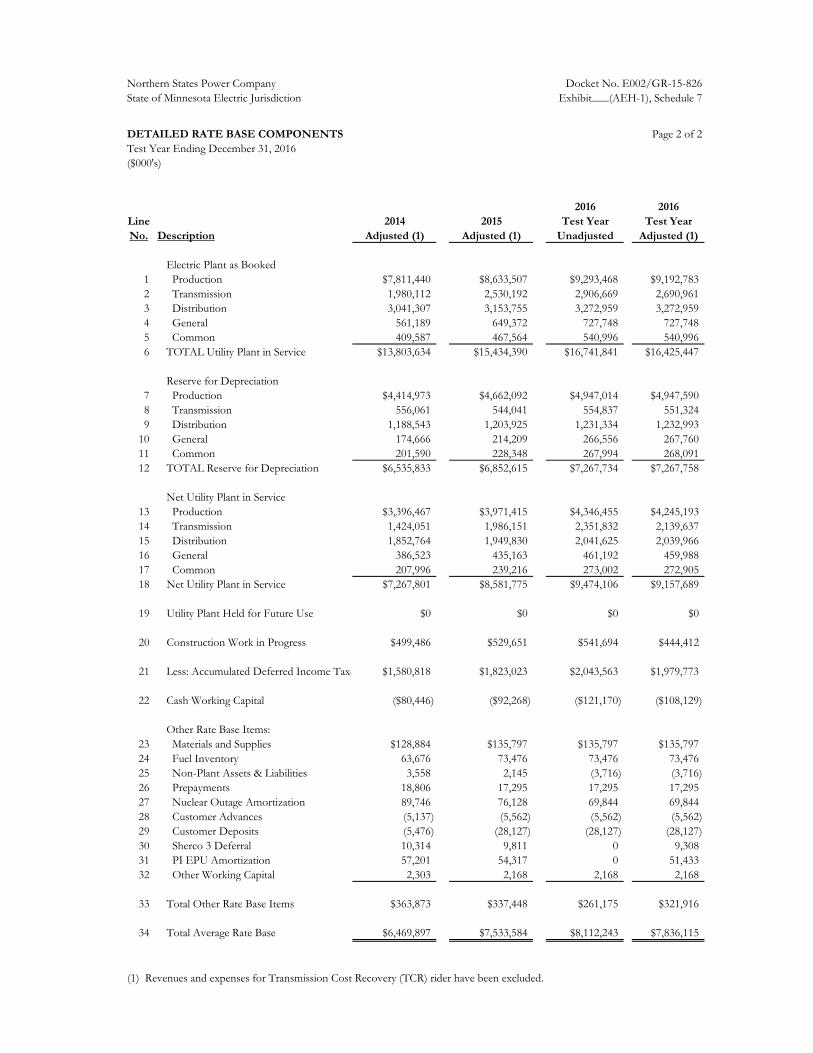
Northern States Power Company Docket No. E002/GR-15-826State of Minnesota Electric Jurisdiction Exhibit___(AEH-1), Schedule 7
DETAILED RATE BASE COMPONENTS Page 2 of 2Test Year Ending December 31, 2016($000's)
2016 2016Line 2014 2015 Test Year Test YearNo. Description Adjusted (1) Adjusted (1) Unadjusted Adjusted (1)
Electric Plant as Booked1 Production $7,811,440 $8,633,507 $9,293,468 $9,192,7832 Transmission 1,980,112 2,530,192 2,906,669 2,690,9613 Distribution 3,041,307 3,153,755 3,272,959 3,272,9594 General 561,189 649,372 727,748 727,7485 Common 409,587 467,564 540,996 540,9966 TOTAL Utility Plant in Service $13,803,634 $15,434,390 $16,741,841 $16,425,447
Reserve for Depreciation7 Production $4,414,973 $4,662,092 $4,947,014 $4,947,5908 Transmission 556,061 544,041 554,837 551,3249 Distribution 1,188,543 1,203,925 1,231,334 1,232,993
10 General 174,666 214,209 266,556 267,76011 Common 201,590 228,348 267,994 268,09112 TOTAL Reserve for Depreciation $6,535,833 $6,852,615 $7,267,734 $7,267,758
Net Utility Plant in Service13 Production $3,396,467 $3,971,415 $4,346,455 $4,245,19314 Transmission 1,424,051 1,986,151 2,351,832 2,139,63715 Distribution 1,852,764 1,949,830 2,041,625 2,039,96616 General 386,523 435,163 461,192 459,98817 Common 207,996 239,216 273,002 272,90518 Net Utility Plant in Service $7,267,801 $8,581,775 $9,474,106 $9,157,689
19 Utility Plant Held for Future Use $0 $0 $0 $0
20 Construction Work in Progress $499,486 $529,651 $541,694 $444,412
21 Less: Accumulated Deferred Income Taxe $1,580,818 $1,823,023 $2,043,563 $1,979,773
22 Cash Working Capital ($80,446) ($92,268) ($121,170) ($108,129)
Other Rate Base Items: 23 Materials and Supplies $128,884 $135,797 $135,797 $135,79724 Fuel Inventory 63,676 73,476 73,476 73,47625 Non-Plant Assets & Liabilities 3,558 2,145 (3,716) (3,716)26 Prepayments 18,806 17,295 17,295 17,29527 Nuclear Outage Amortization 89,746 76,128 69,844 69,84428 Customer Advances (5,137) (5,562) (5,562) (5,562)29 Customer Deposits (5,476) (28,127) (28,127) (28,127)30 Sherco 3 Deferral 10,314 9,811 0 9,30831 PI EPU Amortization 57,201 54,317 0 51,43332 Other Working Capital 2,303 2,168 2,168 2,168
33 Total Other Rate Base Items $363,873 $337,448 $261,175 $321,916
34 Total Average Rate Base $6,469,897 $7,533,584 $8,112,243 $7,836,115
(1) Revenues and expenses for Transmission Cost Recovery (TCR) rider have been excluded.

Northern States Power Company Docket No. E002/GR-15-826Exhibit___(AEH-1), Schedule 8
Page 1 of 3OPERATING REVENUES, OPERATING EXPENSE,TOTAL AVAILABLE FOR RETURN WITH PRESENT AND FINAL RATESTest Year Ending December 31, 2016($000's)
Test Year Test YearEnding Ending
Line 12/31/16 Final 12/31/16No. Description Present Rates Increase Final Rates
(A) (B) (C) = (B) + (A)Operating Revenues
1 Retail $3,033,285 $194,612 $3,227,8972 CIP Revenue Adjustment 0 03 Interdepartmental 809 8094 Other Operating 586,984 586,9845 Gross Earnings Tax 0 06 Total Operating Revenues $3,621,078 $194,612 $3,815,690
ExpensesOperating Expenses:
7 Fuel & Purchased Energy $1,001,096 $1,001,0968 Power Production 681,521 681,5219 Transmission 205,186 205,186
10 Distribution 108,023 108,02311 Customer Accounting 49,315 49,31512 Customer Service & Information 91,110 91,11013 Sales, Econ Dvlp & Other 69 6914 Administrative & General 206,579 206,57915 Total Operating Expenses $2,342,900 $0 $2,342,900
16 Depreciation $471,286 $471,28617 Amortizations 39,585 39,585
Taxes:18 Property $186,751 $186,75119 Gross Earnings 0 020 Deferred Income Tax & ITC 186,991 186,99121 Federal & State Income Tax (73,527) 80,511 6,98422 Payroll & Other 27,550 27,55023 Total Taxes $327,766 $80,511 $408,277
24 Total Expenses $3,181,537 $80,511 $3,262,048
25 AFUDC $33,283 $33,283
26 Total Operating Income $472,824 $114,101 $586,925
Note: Revenues reflect calendar month sales.
State of Minnesota Electric Jurisdiction

Northern States Power Company Docket No. E002/GR-15-826Exhibit___(AEH-1), Schedule 8
Page 2 of 3STATEMENT OF OPERATING INCOME2014 Allowed Test Year versus 2016 Test Year($000's)
General Rate General RateCase Filing Case Filing
Line E002/GR-13-868 E002/GR-15-826No. Description Final Rates Final Rates Change
(A) (B) (C) = (B) - (A)Operating Revenues
1 Retail 2,976,081 3,227,897 $251,8162 CIP Revenue Adjustment 0 0 03 Interdepartmental 962 809 (154)4 Other Operating 664,598 586,984 (77,614)5 Gross Earnings Tax 0 0 06 Total Operating Revenues $3,641,641 $3,815,690 $174,049
ExpensesOperating Expenses:
7 Fuel & Purchased Energy $1,086,327 $1,001,096 ($85,230)8 Power Production 701,051 681,521 (19,530)9 Transmission 191,916 205,186 13,270
10 Distribution 103,317 108,023 4,70611 Customer Accounting 48,049 49,315 1,26612 Customer Service & Information 93,490 91,110 (2,380)13 Sales, Econ Dvlp & Other 101 69 (33)14 Administrative & General 190,741 206,579 15,83815 Total Operating Expenses $2,414,992 $2,342,900 ($72,092)
16 Depreciation $347,346 $471,286 $123,94017 Amortizations 31,300 39,585 8,286
Taxes:18 Property $155,282 $186,751 $31,46919 Gross Earnings 0 0 020 Deferred Income Tax & ITC 173,215 186,991 13,77521 Federal & State Income Tax 4,416 6,984 2,56822 Payroll & Other 29,409 27,550 (1,859)23 Total Taxes $362,322 $408,277 $45,955
24 Total Expenses $3,155,960 $3,262,048 $106,088
25 AFUDC $29,355 $33,283 $3,928
26 Total Operating Income $515,037 $586,925 $71,888
Note: Revenues reflect calendar month sales.
State of Minnesota Electric Jurisdiction

Northern States Power Company Docket No. E002/GR-15-826Exhibit___(AEH-1), Schedule 8
Page 3 of 3OPERATING INCOME SCHEDULESJURISDICTIONAL STATEMENT OF OPERATING INCOME($000's)
Adjusted (1) Adjusted (1) Adjusted (1)Most Recent Projected Unadjusted Proposed
Line Fiscal Year Fiscal Year Test Year Test YearNo. Description 2014 2015 2016 2016
(B) (B) (C) (D)Operating Revenues
1 Retail $2,923,494 $2,971,036 $3,113,282 $3,033,2852 CIP Revenue Adjustment 0 0 $0 $03 Interdepartmental & Transportation 937 763 $798 $8094 Other Operating 591,100 589,842 $766,339 $586,9845 Gross Earnings Tax 0 0 $0 $06 Total Operating Revenues $3,515,532 $3,561,641 $3,880,419 $3,621,078
ExpensesOperating Expenses:
7 Fuel & Purchased Energy $1,139,367 $998,819 $1,078,508 $1,001,0968 Power Production 704,206 698,539 $689,903 $681,5219 Transmission 172,943 193,173 $311,312 $205,186
10 Distribution 102,974 99,054 $108,023 $108,02311 Customer Accounting 49,664 48,860 $50,044 $49,31512 Customer Service & Information 122,270 91,643 $87,584 $91,11013 Sales, Econ Dvlp & Other 39 108 $6 $6914 Administrative & General 206,850 205,938 $225,485 $206,57915 Total Operating Expenses $2,498,313 $2,336,135 $2,550,866 $2,342,900
16 Depreciation $269,372 $384,847 $473,932 $471,28617 Amortizations $26,506 $22,748 $46,148 $39,585
Taxes:18 Property $149,092 $165,558 $189,976 $186,75119 Gross Earnings 0 0 $0 $020 Deferred Income Tax & ITC 103,224 143,140 $203,731 $186,99121 Federal & State Income Tax 39,550 14,935 ($76,438) ($73,527)22 Payroll & Other 28,065 29,626 $27,599 $27,55023 Total Taxes $319,931 $353,259 $344,868 $327,766
24 Total Expenses $3,114,121 $3,096,989 $3,415,813 $3,181,537
25 AFUDC 31,170 32,189 33,560 33,283
26 Total Operating Income $432,581 $496,841 $498,165 $472,824
Note: Revenues reflect calendar month sales.
(1) Revenues and expenses for Transmission Cost Recovery (TCR) rider have been excluded.
State of Minnesota Electric Jurisdiction
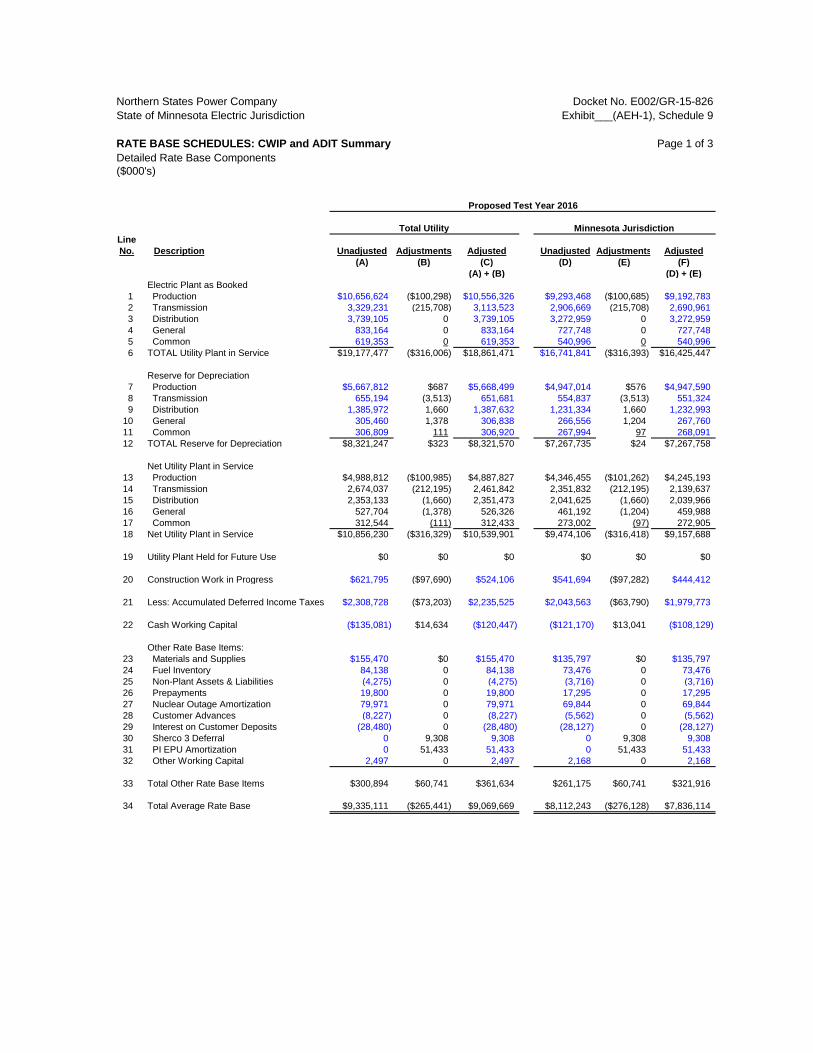
Northern States Power Company Docket No. E002/GR-15-826State of Minnesota Electric Jurisdiction Exhibit___(AEH-1), Schedule 9
RATE BASE SCHEDULES: CWIP and ADIT Summary Page 1 of 3Detailed Rate Base Components($000's)
Proposed Test Year 2016
Total Utility Minnesota JurisdictionLineNo. Description Unadjusted Adjustments Adjusted Unadjusted Adjustments Adjusted
(A) (B) (C) (D) (E) (F)(A) + (B) (D) + (E)
Electric Plant as Booked1 Production $10,656,624 ($100,298) $10,556,326 $9,293,468 ($100,685) $9,192,7832 Transmission 3,329,231 (215,708) 3,113,523 2,906,669 (215,708) 2,690,9613 Distribution 3,739,105 0 3,739,105 3,272,959 0 3,272,9594 General 833,164 0 833,164 727,748 0 727,7485 Common 619,353 0 619,353 540,996 0 540,9966 TOTAL Utility Plant in Service $19,177,477 ($316,006) $18,861,471 $16,741,841 ($316,393) $16,425,447
Reserve for Depreciation7 Production $5,667,812 $687 $5,668,499 $4,947,014 $576 $4,947,5908 Transmission 655,194 (3,513) 651,681 554,837 (3,513) 551,3249 Distribution 1,385,972 1,660 1,387,632 1,231,334 1,660 1,232,993
10 General 305,460 1,378 306,838 266,556 1,204 267,76011 Common 306,809 111 306,920 267,994 97 268,09112 TOTAL Reserve for Depreciation $8,321,247 $323 $8,321,570 $7,267,735 $24 $7,267,758
Net Utility Plant in Service13 Production $4,988,812 ($100,985) $4,887,827 $4,346,455 ($101,262) $4,245,19314 Transmission 2,674,037 (212,195) 2,461,842 2,351,832 (212,195) 2,139,63715 Distribution 2,353,133 (1,660) 2,351,473 2,041,625 (1,660) 2,039,96616 General 527,704 (1,378) 526,326 461,192 (1,204) 459,98817 Common 312,544 (111) 312,433 273,002 (97) 272,90518 Net Utility Plant in Service $10,856,230 ($316,329) $10,539,901 $9,474,106 ($316,418) $9,157,688
19 Utility Plant Held for Future Use $0 $0 $0 $0 $0 $0
20 Construction Work in Progress $621,795 ($97,690) $524,106 $541,694 ($97,282) $444,412
21 Less: Accumulated Deferred Income Taxes $2,308,728 ($73,203) $2,235,525 $2,043,563 ($63,790) $1,979,773
22 Cash Working Capital ($135,081) $14,634 ($120,447) ($121,170) $13,041 ($108,129)
Other Rate Base Items: 23 Materials and Supplies $155,470 $0 $155,470 $135,797 $0 $135,79724 Fuel Inventory 84,138 0 84,138 73,476 0 73,47625 Non-Plant Assets & Liabilities (4,275) 0 (4,275) (3,716) 0 (3,716)26 Prepayments 19,800 0 19,800 17,295 0 17,29527 Nuclear Outage Amortization 79,971 0 79,971 69,844 0 69,84428 Customer Advances (8,227) 0 (8,227) (5,562) 0 (5,562)29 Interest on Customer Deposits (28,480) 0 (28,480) (28,127) 0 (28,127)30 Sherco 3 Deferral 0 9,308 9,308 0 9,308 9,30831 PI EPU Amortization 0 51,433 51,433 0 51,433 51,43332 Other Working Capital 2,497 0 2,497 2,168 0 2,168
33 Total Other Rate Base Items $300,894 $60,741 $361,634 $261,175 $60,741 $321,916
34 Total Average Rate Base $9,335,111 ($265,441) $9,069,669 $8,112,243 ($276,128) $7,836,114
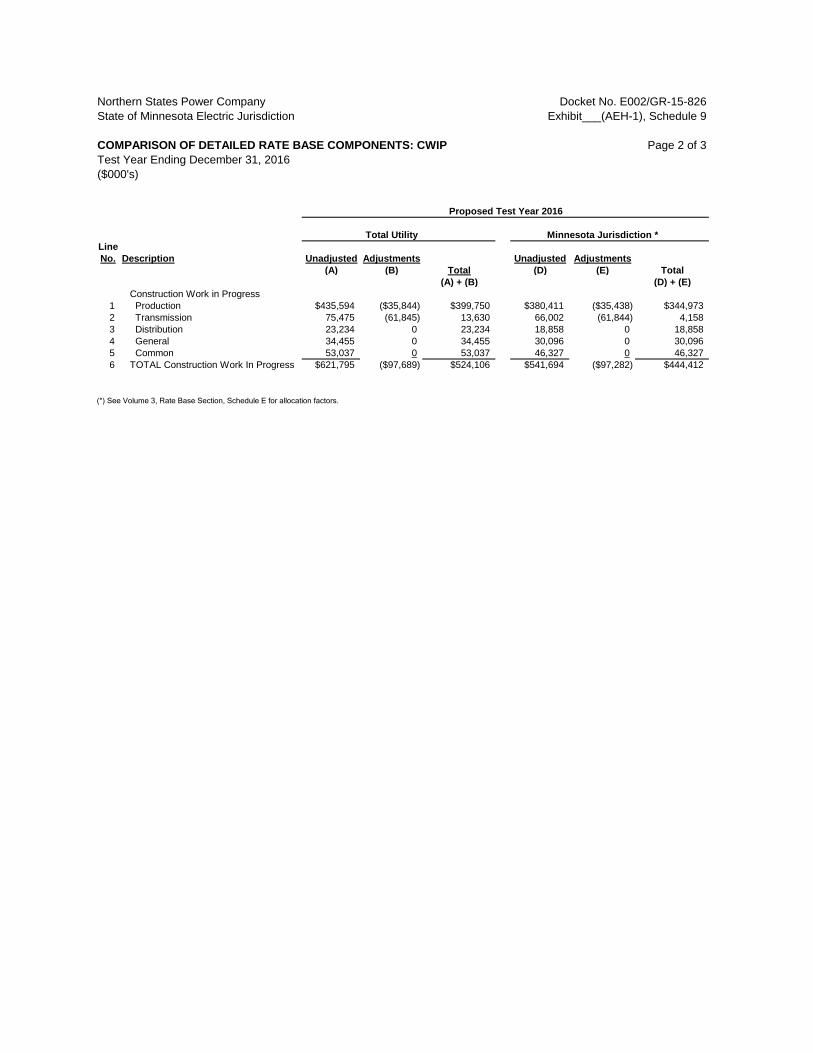
Northern States Power Company Docket No. E002/GR-15-826State of Minnesota Electric Jurisdiction Exhibit___(AEH-1), Schedule 9
COMPARISON OF DETAILED RATE BASE COMPONENTS: CWIP Page 2 of 3Test Year Ending December 31, 2016($000's)
Proposed Test Year 2016
Total Utility Minnesota Jurisdiction *LineNo. Description Unadjusted Adjustments Unadjusted Adjustments
(A) (B) Total (D) (E) Total(A) + (B) (D) + (E)
Construction Work in Progress1 Production $435,594 ($35,844) $399,750 $380,411 ($35,438) $344,9732 Transmission 75,475 (61,845) 13,630 66,002 (61,844) 4,1583 Distribution 23,234 0 23,234 18,858 0 18,8584 General 34,455 0 34,455 30,096 0 30,0965 Common 53,037 0 53,037 46,327 0 46,3276 TOTAL Construction Work In Progress $621,795 ($97,689) $524,106 $541,694 ($97,282) $444,412
(*) See Volume 3, Rate Base Section, Schedule E for allocation factors.

Northern States Power Company Docket No. E002/GR-15-826State of Minnesota Electric Jurisdiction Exhibit___(AEH-1), Schedule 9
COMPARISON OF DETAILED RATE BASE COMPONENTS: ADIT Page 3 of 3Test Year Ending December 31, 2016($000's)
Proposed Test Year 2016
Total Utility Minnesota Jurisdiction *LineNo. Description Unadjusted Adjustments Unadjusted Adjustments
(A) (B) Total (D) (E) Total(A) + (B) (D) + (E)
Accumulated Deferred Income Taxes1 Production $1,152,331 $4,578 $1,156,909 $1,000,339 $6,959 $1,007,2982 Transmission 645,502 (37,382) 608,120 570,742 (36,334) 534,4083 Distribution 649,355 (6,187) 643,168 574,673 (5,335) 569,3384 General 80,498 138 80,636 70,422 113 70,5355 Common 40,649 (709) 39,940 35,507 (619) 34,8886 Net Operating Loss (NOL) (254,681) (33,641) (288,321) (203,825) (28,573) (232,398)7 Non-Plant Related (4,926) 0 (4,926) (4,295) 0 (4,295)8 TOTAL Accum Deferred Income Taxes $2,308,728 ($73,203) $2,235,525 $2,043,563 ($63,790) $1,979,773
(*) See Volume 3, Rate Base Section, Schedule E for allocation factors.

Northern States Power Company Docket No. E002/GR-15-826State of Minnesota Electric Jurisdiction Exhibit___(AEH-1), Schedule 10RATE BASE SCHEDULES Page 1 of 1RATE BASE ADJUSTMENT SCHEDULES2016 Unadjusted Test Year versus Final Adjusted Test Year($000's)
Unadjusted w/o NOL & 199
Unadjusted NOL & 199
Total Unadjusted
Black Dog Screenhouse
Like Kind Exchange Program
Remaining Life Study: NSPM PI EPU Recovery
Sherco 3 Depr Deferral Rider: RES Rider: TCR
ADIT Prorate for IRS
Cash Working Capital
Change in Cost of Capital
Net Operating Loss & 199
Work Paper Reference WP A-41 WP A-1 WP A-20 WP A-25 WP A-31 WP A-33 WP A-35 WP A-36 WP A-38 WP A-39 WP A-40 WP A-41
(1) (2) (3) (4) (5) (6) (7) (8) (9) (10) (11) (12) (13) (14) (15)
1 Plant as booked
2 Production 9,293,468 9,293,468 2,676 (103,361) 9,192,783
3 Transmission 2,906,669 2,906,669 (5,371) (210,336) 2,690,961
4 Distribution 3,272,959 3,272,959 3,272,959
5 General 727,748 727,748 727,748
6 Common 540,996 540,996 540,996
7 Total Utility Plant in Service 16,741,841 16,741,841 2,676 (108,733) (210,336) 16,425,447
8
9 Reserve for Depreciation
10 Production 4,947,014 4,947,014 136 630 (190) 4,947,590
11 Transmission 554,837 554,837 (31) (3,482) 551,324
12 Distribution 1,231,334 1,231,334 1,660 1,232,993
13 General 266,556 266,556 1,204 267,760
14 Common 267,994 267,994 97 268,091
15 Total Reserve for Depreciation 7,267,735 7,267,735 136 2,961 630 (221) (3,482) 7,267,758
16
17 Net Utility Plant
18 Production 4,346,455 4,346,455 2,540 (630) (103,171) 4,245,193
19 Transmission 2,351,832 2,351,832 (5,341) (206,854) 2,139,637
20 Distribution 2,041,625 2,041,625 (1,660) 2,039,966
21 General 461,192 461,192 (1,204) 459,988
22 Common 273,002 273,002 (97) 272,905
23 Net Utility Plant in Service 9,474,106 9,474,106 2,540 (2,961) (630) (108,512) (206,854) 9,157,689
24
25 Utility Plant Held for Future Use
26
27 Construction Work in Progress 541,694 541,694 (2,814) (33,002) (61,466) 444,412
28
29 Less: Accumulated Deferred Income Taxes 1,989,557 54,005 2,043,563 (2) (257) 21,026 3,799 (7,398) (26,865) (57,910) 3,818 1,979,773
30
31 Other Rate Base Items
32 Cash Working Capital (121,170) (121,170) 13,041 (108,129)
33 Materials and Supplies 135,797 135,797 135,797
34 Fuel Inventory 73,476 73,476 73,476
35 Non Plant Assets and Liabilities (3,716) (3,716) (3,716)
36 Customer Advances (5,562) (5,562) (5,562)
37 Customer Deposits (28,127) (28,127) (28,127)
38 Prepayments 89,307 89,307 89,307
39 Regulatory Amortizations 51,433 9,308 60,741
40 Total Other Rate Base 140,005 140,005 51,433 9,308 13,041 213,787
41
42 Total Average Rate Base 8,166,248 (54,005) 8,112,243 (272) (2,961) (373) 30,407 5,509 (134,116) (241,455) 57,910 13,041 (3,818) 7,836,115
2016 Test YearLine No. Description
Rider Removals Secondary CalculationsData Update AmortizationBase Adjustment
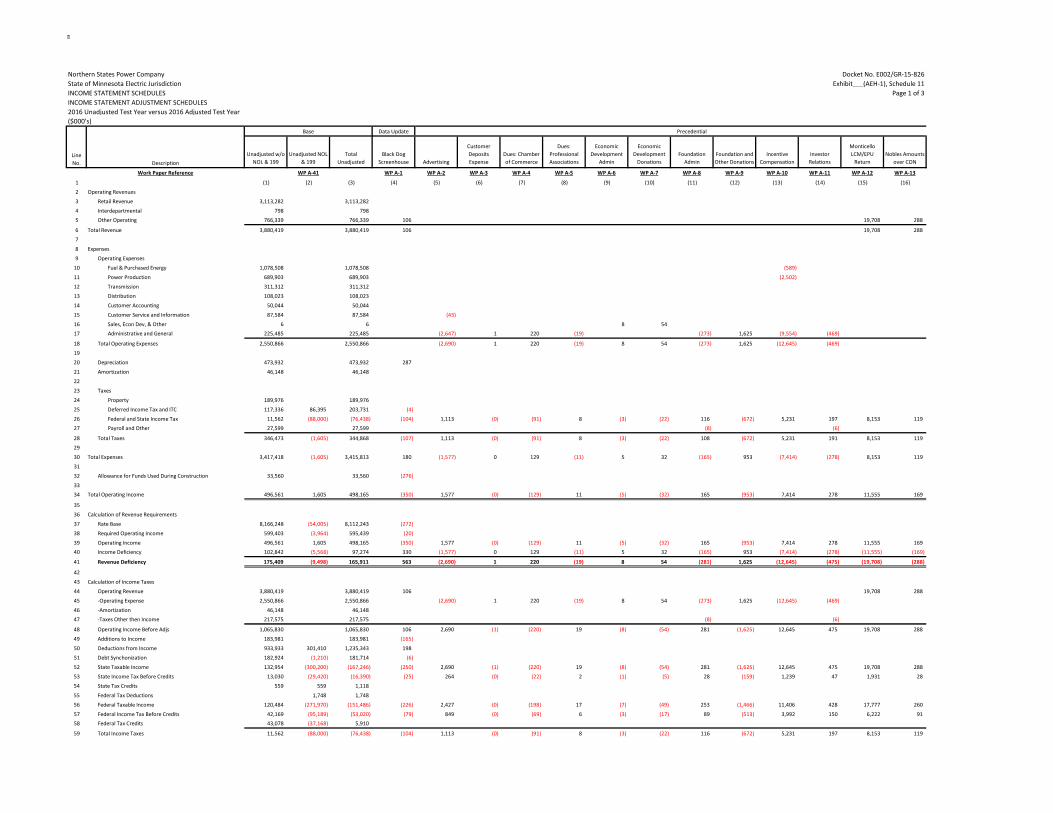
Northern States Power Company Docket No. E002/GR-15-826State of Minnesota Electric Jurisdiction Exhibit___(AEH-1), Schedule 11INCOME STATEMENT SCHEDULES Page 1 of 3INCOME STATEMENT ADJUSTMENT SCHEDULES2016 Unadjusted Test Year versus 2016 Adjusted Test Year($000's)
Unadjusted w/o NOL & 199
Unadjusted NOL & 199
Total Unadjusted
Black Dog Screenhouse Advertising
Customer Deposits Expense
Dues: Chamber of Commerce
Dues: Professional Associations
Economic Development
Admin
Economic Development
DonationsFoundation
AdminFoundation and Other Donations
Incentive Compensation
Investor Relations
Monticello LCM/EPU
ReturnNobles Amounts
over CON
Work Paper Reference WP A-41 WP A-1 WP A-2 WP A-3 WP A-4 WP A-5 WP A-6 WP A-7 WP A-8 WP A-9 WP A-10 WP A-11 WP A-12 WP A-13
1 (1) (2) (3) (4) (5) (6) (7) (8) (9) (10) (11) (12) (13) (14) (15) (16)
2 Operating Revenues
3 Retail Revenue 3,113,282 3,113,282
4 Interdepartmental 798 798 5 Other Operating 766,339 766,339 106 19,708 288
6 Total Revenue 3,880,419 3,880,419 106 19,708 288
7
8 Expenses
9 Operating Expenses
10 Fuel & Purchased Energy 1,078,508 1,078,508 (589)
11 Power Production 689,903 689,903 (2,502)
12 Transmission 311,312 311,312
13 Distribution 108,023 108,023
14 Customer Accounting 50,044 50,044
15 Customer Service and Information 87,584 87,584 (43)
16 Sales, Econ Dev, & Other 6 6 8 54 17 Administrative and General 225,485 225,485 (2,647) 1 220 (19) (273) 1,625 (9,554) (469)
18 Total Operating Expenses 2,550,866 2,550,866 (2,690) 1 220 (19) 8 54 (273) 1,625 (12,645) (469)
19
20 Depreciation 473,932 473,932 287
21 Amortization 46,148 46,148
22
23 Taxes
24 Property 189,976 189,976
25 Deferred Income Tax and ITC 117,336 86,395 203,731 (4)
26 Federal and State Income Tax 11,562 (88,000) (76,438) (104) 1,113 (0) (91) 8 (3) (22) 116 (672) 5,231 197 8,153 11927 Payroll and Other 27,599 27,599 (8) (6)
28 Total Taxes 346,473 (1,605) 344,868 (107) 1,113 (0) (91) 8 (3) (22) 108 (672) 5,231 191 8,153 119
29
30 Total Expenses 3,417,418 (1,605) 3,415,813 180 (1,577) 0 129 (11) 5 32 (165) 953 (7,414) (278) 8,153 119
31
32 Allowance for Funds Used During Construction 33,560 33,560 (276)
3334 Total Operating Income 496,561 1,605 498,165 (350) 1,577 (0) (129) 11 (5) (32) 165 (953) 7,414 278 11,555 169
35
36 Calculation of Revenue Requirements
37 Rate Base 8,166,248 (54,005) 8,112,243 (272)
38 Required Operating Income 599,403 (3,964) 595,439 (20)
39 Operating Income 496,561 1,605 498,165 (350) 1,577 (0) (129) 11 (5) (32) 165 (953) 7,414 278 11,555 16940 Income Deficiency 102,842 (5,568) 97,274 330 (1,577) 0 129 (11) 5 32 (165) 953 (7,414) (278) (11,555) (169)
41 Revenue Deficiency 175,409 (9,498) 165,911 563 (2,690) 1 220 (19) 8 54 (281) 1,625 (12,645) (475) (19,708) (288)
42
43 Calculation of Income Taxes
44 Operating Revenue 3,880,419 3,880,419 106 19,708 288
45 -Operating Expense 2,550,866 2,550,866 (2,690) 1 220 (19) 8 54 (273) 1,625 (12,645) (469)
46 -Amortization 46,148 46,148 47 -Taxes Other then Income 217,575 217,575 (8) (6)
48 Operating Income Before Adjs 1,065,830 1,065,830 106 2,690 (1) (220) 19 (8) (54) 281 (1,625) 12,645 475 19,708 288
49 Additions to Income 183,981 183,981 (165)
50 Deductions from Income 933,933 301,410 1,235,343 198
51 Debt Synchonization 182,924 (1,210) 181,714 (6)
52 State Taxable Income 132,954 (300,200) (167,246) (250) 2,690 (1) (220) 19 (8) (54) 281 (1,625) 12,645 475 19,708 288
53 State Income Tax Before Credits 13,030 (29,420) (16,390) (25) 264 (0) (22) 2 (1) (5) 28 (159) 1,239 47 1,931 28
54 State Tax Credits 559 559 1,118
55 Federal Tax Deductions 1,748 1,748
56 Federal Taxable Income 120,484 (271,970) (151,486) (226) 2,427 (0) (198) 17 (7) (49) 253 (1,466) 11,406 428 17,777 260
57 Federal Income Tax Before Credits 42,169 (95,189) (53,020) (79) 849 (0) (69) 6 (3) (17) 89 (513) 3,992 150 6,222 9158 Federal Tax Credits 43,078 (37,168) 5,910
59 Total Income Taxes 11,562 (88,000) (76,438) (104) 1,113 (0) (91) 8 (3) (22) 116 (672) 5,231 197 8,153 119
Base
Line No. Description
Data Update Precedential
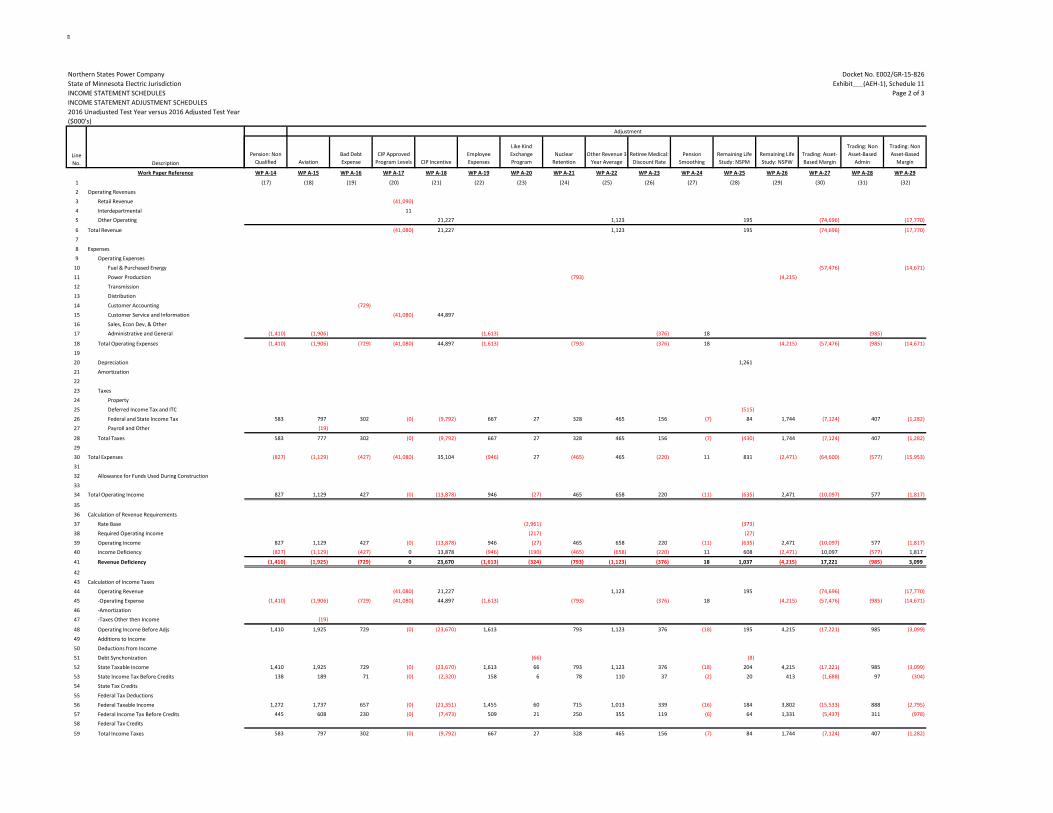
Northern States Power CompanyState of Minnesota Electric JurisdictionINCOME STATEMENT SCHEDULESINCOME STATEMENT ADJUSTMENT SCHEDULES2016 Unadjusted Test Year versus 2016 Adjusted Test Year($000's)
Work Paper Reference
1
2 Operating Revenues
3 Retail Revenue
4 Interdepartmental5 Other Operating
6 Total Revenue
7
8 Expenses
9 Operating Expenses
10 Fuel & Purchased Energy
11 Power Production
12 Transmission
13 Distribution
14 Customer Accounting
15 Customer Service and Information
16 Sales, Econ Dev, & Other17 Administrative and General
18 Total Operating Expenses
19
20 Depreciation
21 Amortization
22
23 Taxes
24 Property
25 Deferred Income Tax and ITC
26 Federal and State Income Tax27 Payroll and Other
28 Total Taxes
29
30 Total Expenses
31
32 Allowance for Funds Used During Construction
3334 Total Operating Income
35
36 Calculation of Revenue Requirements
37 Rate Base
38 Required Operating Income
39 Operating Income40 Income Deficiency
41 Revenue Deficiency
42
43 Calculation of Income Taxes
44 Operating Revenue
45 -Operating Expense
46 -Amortization47 -Taxes Other then Income
48 Operating Income Before Adjs
49 Additions to Income
50 Deductions from Income
51 Debt Synchonization
52 State Taxable Income
53 State Income Tax Before Credits
54 State Tax Credits
55 Federal Tax Deductions
56 Federal Taxable Income
57 Federal Income Tax Before Credits58 Federal Tax Credits
59 Total Income Taxes
Line No. Description
Docket No. E002/GR-15-826 Exhibit___(AEH-1), Schedule 11
Page 2 of 3
Pension: Non Qualified Aviation
Bad Debt Expense
CIP Approved Program Levels CIP Incentive
Employee Expenses
Like Kind Exchange Program
Nuclear Retention
Other Revenue 3 Year Average
Retiree Medical: Discount Rate
Pension Smoothing
Remaining Life Study: NSPM
Remaining Life Study: NSPW
Trading: Asset-Based Margin
Trading: Non Asset-Based
Admin
Trading: Non Asset-Based
Margin
WP A-14 WP A-15 WP A-16 WP A-17 WP A-18 WP A-19 WP A-20 WP A-21 WP A-22 WP A-23 WP A-24 WP A-25 WP A-26 WP A-27 WP A-28 WP A-29
(17) (18) (19) (20) (21) (22) (23) (24) (25) (26) (27) (28) (29) (30) (31) (32)
(41,090)
11 21,227 1,123 195 (74,696) (17,770)
(41,080) 21,227 1,123 195 (74,696) (17,770)
(57,476) (14,671)
(793) (4,215)
(729)
(41,080) 44,897
(1,410) (1,906) (1,613) (376) 18 (985)
(1,410) (1,906) (729) (41,080) 44,897 (1,613) (793) (376) 18 (4,215) (57,476) (985) (14,671)
1,261
(515)
583 797 302 (0) (9,792) 667 27 328 465 156 (7) 84 1,744 (7,124) 407 (1,282) (19)
583 777 302 (0) (9,792) 667 27 328 465 156 (7) (430) 1,744 (7,124) 407 (1,282)
(827) (1,129) (427) (41,080) 35,104 (946) 27 (465) 465 (220) 11 831 (2,471) (64,600) (577) (15,953)
827 1,129 427 (0) (13,878) 946 (27) 465 658 220 (11) (635) 2,471 (10,097) 577 (1,817)
(2,961) (373)
(217) (27)
827 1,129 427 (0) (13,878) 946 (27) 465 658 220 (11) (635) 2,471 (10,097) 577 (1,817)(827) (1,129) (427) 0 13,878 (946) (190) (465) (658) (220) 11 608 (2,471) 10,097 (577) 1,817
(1,410) (1,925) (729) 0 23,670 (1,613) (324) (793) (1,123) (376) 18 1,037 (4,215) 17,221 (985) 3,099
(41,080) 21,227 1,123 195 (74,696) (17,770)
(1,410) (1,906) (729) (41,080) 44,897 (1,613) (793) (376) 18 (4,215) (57,476) (985) (14,671)
(19)
1,410 1,925 729 (0) (23,670) 1,613 793 1,123 376 (18) 195 4,215 (17,221) 985 (3,099)
(66) (8)
1,410 1,925 729 (0) (23,670) 1,613 66 793 1,123 376 (18) 204 4,215 (17,221) 985 (3,099)
138 189 71 (0) (2,320) 158 6 78 110 37 (2) 20 413 (1,688) 97 (304)
1,272 1,737 657 (0) (21,351) 1,455 60 715 1,013 339 (16) 184 3,802 (15,533) 888 (2,795)
445 608 230 (0) (7,473) 509 21 250 355 119 (6) 64 1,331 (5,437) 311 (978)
583 797 302 (0) (9,792) 667 27 328 465 156 (7) 84 1,744 (7,124) 407 (1,282)
Adjustment
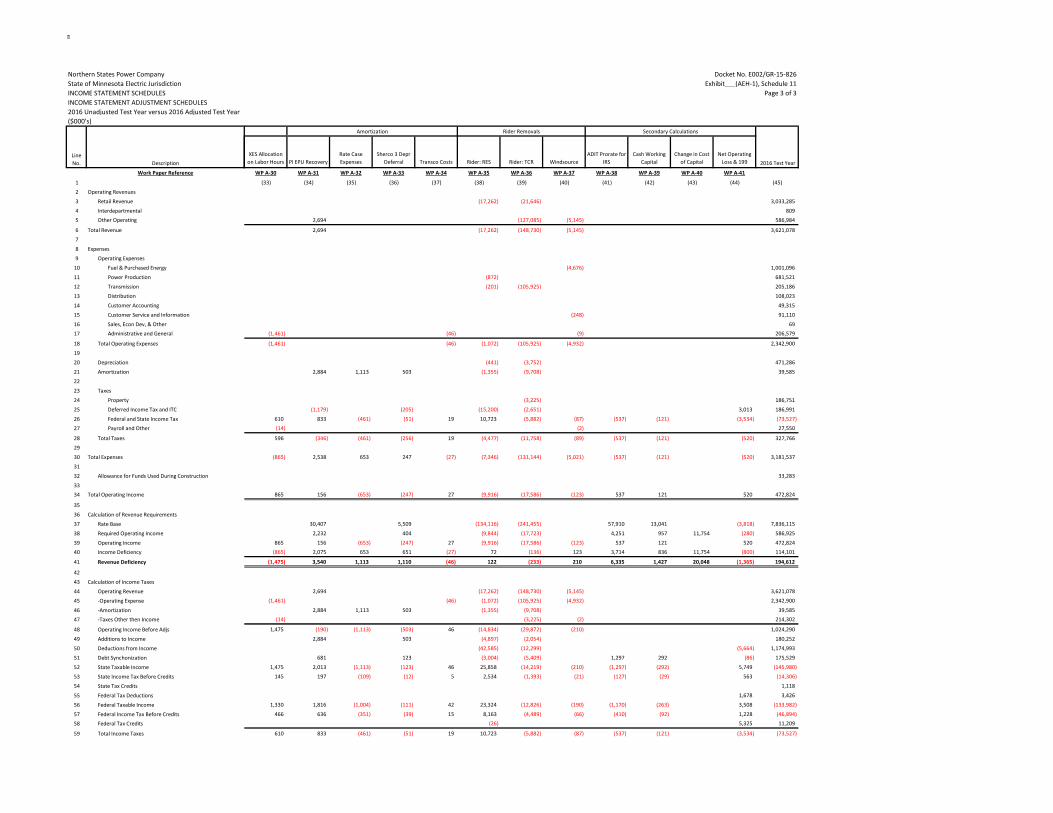
Northern States Power CompanyState of Minnesota Electric JurisdictionINCOME STATEMENT SCHEDULESINCOME STATEMENT ADJUSTMENT SCHEDULES2016 Unadjusted Test Year versus 2016 Adjusted Test Year($000's)
Work Paper Reference
1
2 Operating Revenues
3 Retail Revenue
4 Interdepartmental5 Other Operating
6 Total Revenue
7
8 Expenses
9 Operating Expenses
10 Fuel & Purchased Energy
11 Power Production
12 Transmission
13 Distribution
14 Customer Accounting
15 Customer Service and Information
16 Sales, Econ Dev, & Other17 Administrative and General
18 Total Operating Expenses
19
20 Depreciation
21 Amortization
22
23 Taxes
24 Property
25 Deferred Income Tax and ITC
26 Federal and State Income Tax27 Payroll and Other
28 Total Taxes
29
30 Total Expenses
31
32 Allowance for Funds Used During Construction
3334 Total Operating Income
35
36 Calculation of Revenue Requirements
37 Rate Base
38 Required Operating Income
39 Operating Income40 Income Deficiency
41 Revenue Deficiency
42
43 Calculation of Income Taxes
44 Operating Revenue
45 -Operating Expense
46 -Amortization47 -Taxes Other then Income
48 Operating Income Before Adjs
49 Additions to Income
50 Deductions from Income
51 Debt Synchonization
52 State Taxable Income
53 State Income Tax Before Credits
54 State Tax Credits
55 Federal Tax Deductions
56 Federal Taxable Income
57 Federal Income Tax Before Credits58 Federal Tax Credits
59 Total Income Taxes
Line No. Description
Docket No. E002/GR-15-826 Exhibit___(AEH-1), Schedule 11
Page 3 of 3
XES Allocation on Labor Hours PI EPU Recovery
Rate Case Expenses
Sherco 3 Depr Deferral Transco Costs Rider: RES Rider: TCR Windsource
ADIT Prorate for IRS
Cash Working Capital
Change in Cost of Capital
Net Operating Loss & 199
WP A-30 WP A-31 WP A-32 WP A-33 WP A-34 WP A-35 WP A-36 WP A-37 WP A-38 WP A-39 WP A-40 WP A-41
(33) (34) (35) (36) (37) (38) (39) (40) (41) (42) (43) (44) (45)
(17,262) (21,646) 3,033,285
809 2,694 (127,085) (5,145) 586,984
2,694 (17,262) (148,730) (5,145) 3,621,078
(4,676) 1,001,096
(872) 681,521
(201) (105,925) 205,186
108,023
49,315
(248) 91,110
69(1,461) (46) (9) 206,579
(1,461) (46) (1,072) (105,925) (4,932) 2,342,900
(441) (3,752) 471,286
2,884 1,113 503 (1,355) (9,708) 39,585
(3,225) 186,751
(1,179) (205) (15,200) (2,651) 3,013 186,991
610 833 (461) (51) 19 10,723 (5,882) (87) (537) (121) (3,534) (73,527)(14) (2) 27,550
596 (346) (461) (256) 19 (4,477) (11,758) (89) (537) (121) (520) 327,766
(865) 2,538 653 247 (27) (7,346) (131,144) (5,021) (537) (121) (520) 3,181,537
33,283
865 156 (653) (247) 27 (9,916) (17,586) (123) 537 121 520 472,824
30,407 5,509 (134,116) (241,455) 57,910 13,041 (3,818) 7,836,115
2,232 404 (9,844) (17,723) 4,251 957 11,754 (280) 586,925
865 156 (653) (247) 27 (9,916) (17,586) (123) 537 121 520 472,824(865) 2,075 653 651 (27) 72 (136) 123 3,714 836 11,754 (800) 114,101
(1,475) 3,540 1,113 1,110 (46) 122 (233) 210 6,335 1,427 20,048 (1,365) 194,612
2,694 (17,262) (148,730) (5,145) 3,621,078
(1,461) (46) (1,072) (105,925) (4,932) 2,342,900
2,884 1,113 503 (1,355) (9,708) 39,585(14) (3,225) (2) 214,302
1,475 (190) (1,113) (503) 46 (14,834) (29,872) (210) 1,024,290
2,884 503 (4,897) (2,054) 180,252
(42,585) (12,299) (5,664) 1,174,993
681 123 (3,004) (5,409) 1,297 292 (86) 175,529
1,475 2,013 (1,113) (123) 46 25,858 (14,219) (210) (1,297) (292) 5,749 (145,980)
145 197 (109) (12) 5 2,534 (1,393) (21) (127) (29) 563 (14,306)
1,118
1,678 3,426
1,330 1,816 (1,004) (111) 42 23,324 (12,826) (190) (1,170) (263) 3,508 (133,982)
466 636 (351) (39) 15 8,163 (4,489) (66) (410) (92) 1,228 (46,894) (26) 5,325 11,209
610 833 (461) (51) 19 10,723 (5,882) (87) (537) (121) (3,534) (73,527)
2016 Test Year
Rider Removals Secondary CalculationsAmortization

PUBLIC DOCUMENT – TRADE SECRET INFORMATION EXCISED – PUBLIC DATA –
Northern States Power Company Docket No. E002/GR-15-826
Exhibit___(AEH-1), Schedule 12 Page 1 of 6
Wholesale Customer Study Purpose With respect to the costs and revenues related to serving wholesale customers, the Company and the Department of Commerce agreed in the prior rate case (Docket No. E002/GR-12-961) as follows:
The Company will provide as a compliance filing in future rate cases a wholesale customer study which shows all wholesale customers being served by the Company (including, but not limited to, full requirements, partial requirements, and market based wholesale customers), types of service being provided to each wholesale customer, costs and revenues associated with each wholesale customer, and a clear showing either that wholesale costs are allocated out of the retail rate case or that the revenues are included in the retail rate case, for all services provided to wholesale customers.1
This study provides the required information. Information in this study will include the types of services being provided to wholesale customers and the treatment of revenues and margins associated with wholesale customer transactions. The study does not address wholesale transmission revenues, which revenues and associated costs are discussed in detail in the Direct Testimony of Company witness Mr. Ian R. Benson. All wholesale customers are provided services pursuant to bilateral agreements. These bilateral agreements define the scope of services for each wholesale customer, such as interfacing between the customer and the Midcontinent Independent System Operator, Inc. (MISO), including providing balancing services. Revenues from these customers are included in Other Revenues (e.g., for balancing services), and asset based margins for energy sales are passed through the fuel clause and removed from the cost of service. We also provide some non-asset based services to these customers (energy and capacity sales using financial instruments). Non-asset based margins (revenues less costs), as well as the fully-allocated costs of those activities, are removed from the cost of service.
1 May 22, 2013 Issues List, Docket No. E002/GR-12-961.
PUBLIC DOCUMENT – TRADE SECRET INFORMATION EXCISED – PUBLIC DATA –
Northern States Power Company Docket No. E002/GR-15-826
Exhibit___(AEH-1), Schedule 12 Page 2 of 6
Historic Wholesale Cost Assignment Method Through the mid-1990s, the Company provided bundled cost-based “requirements” wholesale services to numerous municipal utilities connected to the NSP transmission system. Total municipal loads were in the hundreds of megawatts. Some wholesale municipal customers were full requirements customers and purchased all of their capacity and energy from the Company. Other municipal customers received “preference power” allocations from the Western Area Power Administration for a portion of their power supply needs and purchased partial requirements service from the Company for the remainder. However, during the 1970s through the 1990s, new municipal power agencies (such as Southern Minnesota Municipal Power Agency, Central Minnesota Municipal Power Agency, Minnesota Municipal Power Agency, etc.) were created to serve the power supply needs of these and other municipal customers, and most of the cost-based requirements wholesale sales agreements expired. Previously, when municipal power loads were significant, costs were allocated to a wholesale municipal jurisdiction similar to the process used to allocate costs to the Company’s retail jurisdictions (Minnesota, North Dakota and South Dakota). Fixed production costs were allocated based on coincident peak demand, and variable production costs were allocated based on the energy allocator. This process also included the direct assignment of some costs to the Wholesale jurisdiction for services being directly provided to those customers (such as distribution transformation services). In addition, the Company direct-assigned costs where possible or allocated customer accounting, customer information, and sales costs to the jurisdiction based on the number of customers. Similarly, administrative and general (A&G) costs were allocated or direct assigned as appropriate based on functional organization. Specifically, if A&G costs were incurred by the Energy Supply, Commercial Operations or Transmission organizations, they were allocated to retail and wholesale jurisdictions based on the jurisdictional demand allocator. Changes in Wholesale Market and Test Year Wholesale Customers As of 2012, the Company directly served only three traditional cost-based requirements wholesale customers: the City of Ada, City of Kasota, and Heartland Consumers Power District (HCPD) for the City of Lake Crystal. These customers comprised less than

PUBLIC DOCUMENT – TRADE SECRET INFORMATION EXCISED – PUBLIC DATA –
Northern States Power Company Docket No. E002/GR-15-826
Exhibit___(AEH-1), Schedule 12 Page 3 of 6
one-tenth of one percent of total Company demand and energy requirements. The rates and services for sales to these customers were regulated by the Federal Energy Regulatory Commission (FERC) under tariffs or contracts on file with FERC. The contract rates were indexed to the Minnesota Commercial and Industrial (C&I) General Service Retail or Time of Day rates. However, excess capacity and energy on a short to mid-term basis has increased competition and put downward pressure on pricing. Given the market dynamics, the Company’s wholesale customers determined it was in their best interest to purchase energy on the open market rather than continuing service under cost based contracts. Where in the past, these customers mitigated energy cost volatility risk by entering into full requirements agreements with the Company, they now prefer to take on that risk themselves, given the current market environment. Therefore, the Company no longer has any cost-based requirements wholesale customers in the 2016 test year or the 2017 and 2018 plan years. Services Provided to Wholesale Customers in 2016 The Company provides services to wholesale customers through the execution of transactions that fall into three main categories: Asset Based Transactions, Non-Asset Based Transactions, and Other Wholesale Transactions. Asset based transactions involve the sale of excess energy and capacity available from Company owned generation assets. Both costs and revenues associated with asset-based energy and capacity transactions are included in the unadjusted retail rate case cost of service, and all margins resulting from asset-based energy sales are excluded from the 2016 test year as they are returned to the ratepayers through the Fuel Clause Adjustment pursuant the Company’s 2005 electric rate case (Docket No. E002/GR-05-1428). Non-asset based transactions are those in which energy and/or capacity is purchased from a third party and resold for profit. Non-asset based transactions are undertaken as energy market opportunities to make revenue and are unrelated to meeting the needs of our retail customers. These transactions are included in the unadjusted retail rate case cost of service. However, the fully allocated costs of non-asset based trading activity are removed from the cost of service study, and all margins (revenues less costs) associated with these activities are also removed and retained by the Company.
PUBLIC DOCUMENT – TRADE SECRET INFORMATION EXCISED – PUBLIC DATA –
Northern States Power Company Docket No. E002/GR-15-826
Exhibit___(AEH-1), Schedule 12 Page 4 of 6
The Other Wholesale Transaction category includes transactions related to MISO interfacing services, an energy services agreement with [TRADE SECRET BEGINS TRADE SECRET ENDS], and the pass-through of MISO charges to the appropriate parties. The costs of these services are included in the cost of service, and all revenues are recorded as Other Revenue and are credited to retail customers through the cost of service. Attachment A to this schedule provides a list of the types of services provided, and the ratemaking treatment for each type of service. Attachment B to this schedule provides a wholesale customer summary including all current agreements by customer and the expected revenues for the years 2016-2018. Test Year Wholesale Transactions During 2016, the Company expects to engage in wholesale transactions in the following categories: asset based energy sales, asset based capacity sales, non-asset based sales and other wholesale transactions including MISO interface and scheduling services, energy services agreements, and pass through charges. These transactions and their impact on the test year are discussed below. Asset Based Energy Sales Transactions Asset based energy sales margins are generated through the sale of available excess energy either directly into the Midcontinent Independent System Operator (MISO) market or to specific wholesale customers through bilateral agreements. Pricing of excess energy sales to MISO are based on prevailing locational marginal prices (LMP) that clear in the Day Ahead or Real Time markets. Pricing of transactions s made directly by the Company to specific wholesale customers is based on the current marginal cost of generation at the time of the transaction, and the Company does not make a margin on these sales. Instead, the Company charges a scheduling fee for providing this service. Therefore, the margin on these sales is equal to the scheduling fee paid by the customer. Net margins earned on all asset based energy sales, including the scheduling fees, are returned to rate payers through the Fuel Clause Adjustment. Table 1 below shows the asset based energy sales margins for 2014 and 2016. In addition, Volume 4 Test Year Workpapers, Section VIII Adjustments, Tab A27 includes all calculations related to asset based transactions and their impact on the test year. The revenues associated with these trades flow through to Other Electric
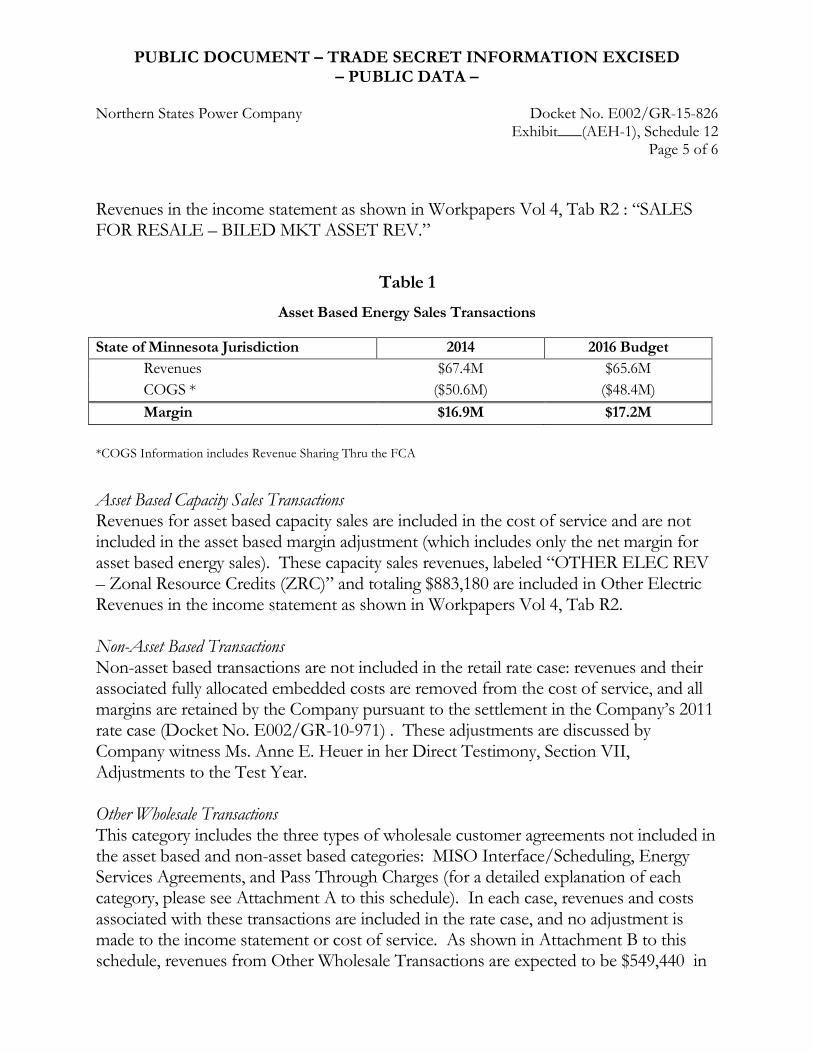
PUBLIC DOCUMENT – TRADE SECRET INFORMATION EXCISED – PUBLIC DATA –
Northern States Power Company Docket No. E002/GR-15-826
Exhibit___(AEH-1), Schedule 12 Page 5 of 6
Revenues in the income statement as shown in Workpapers Vol 4, Tab R2 : “SALES FOR RESALE – BILED MKT ASSET REV.”
Table 1 Asset Based Energy Sales Transactions
State of Minnesota Jurisdiction 2014 2016 Budget Revenues $67.4M $65.6M COGS * ($50.6M) ($48.4M) Margin $16.9M $17.2M
*COGS Information includes Revenue Sharing Thru the FCA
Asset Based Capacity Sales Transactions Revenues for asset based capacity sales are included in the cost of service and are not included in the asset based margin adjustment (which includes only the net margin for asset based energy sales). These capacity sales revenues, labeled “OTHER ELEC REV – Zonal Resource Credits (ZRC)” and totaling $883,180 are included in Other Electric Revenues in the income statement as shown in Workpapers Vol 4, Tab R2. Non-Asset Based Transactions Non-asset based transactions are not included in the retail rate case: revenues and their associated fully allocated embedded costs are removed from the cost of service, and all margins are retained by the Company pursuant to the settlement in the Company’s 2011 rate case (Docket No. E002/GR-10-971) . These adjustments are discussed by Company witness Ms. Anne E. Heuer in her Direct Testimony, Section VII, Adjustments to the Test Year. Other Wholesale Transactions This category includes the three types of wholesale customer agreements not included in the asset based and non-asset based categories: MISO Interface/Scheduling, Energy Services Agreements, and Pass Through Charges (for a detailed explanation of each category, please see Attachment A to this schedule). In each case, revenues and costs associated with these transactions are included in the rate case, and no adjustment is made to the income statement or cost of service. As shown in Attachment B to this schedule, revenues from Other Wholesale Transactions are expected to be $549,440 in
PUBLIC DOCUMENT – TRADE SECRET INFORMATION EXCISED – PUBLIC DATA –
Northern States Power Company Docket No. E002/GR-15-826
Exhibit___(AEH-1), Schedule 12 Page 6 of 6
2016. These revenues flow into Other Operating Revenue as shown in Workpapers Vol 4, Tab R2, labeled “OTHER ELEC REV – Transmission Sales.” Conclusions After reviewing the services anticipated to be provided to wholesale customers in 2016 and the transactions associated with those services, the Company concludes that the ratemaking treatment of these transactions is consistent with existing regulatory practices:
• Wholesale transaction costs and revenues are held above the line except with respect to non-asset based transactions
o Non-asset based margins are adjusted out of the test year and retained by the Company
o Non-asset based trading costs are adjusted out of the test year, reducing the revenue requirement
• Asset based energy sales margins are shared with rate payers through the Fuel Clause Adjustment
• Other Wholesale Transactions are included in the test year and offset revenue requirements
The Company does not recommend any changes to the treatment of wholesale customers or the revenues and costs associated with providing these services. In addition, the Company concludes that there are no adverse impacts on ratepayers as a result of providing these services or the ratemaking treatment of the associated transactions.

PUBLIC DOCUMENT – TRADE SECRET INFORMATION EXCISED – PUBLIC DATA –
Northern States Power Company Docket No. E002/GR-15-826
Exhibit___(AEH-1), Schedule 12 Attachment A - Page 1 of 1
Deal Category Deal Type Scope of Services Ratemaking Treatment
Energy Asset Based Energy Sale These Asset Based Energy deals are for the sale of energy generated by NSP's own assets. The quantity is scheduled by mutual agreement. NSP earns either a fixed monthly fee or per MWh scheduling fee over and above the cost of energy. The quantity is determined based upon forecasted volumes which may vary from actual usage.
Asset Based - Fuel Clause Adjustment 100% of the margins are returned to ratepayers through the Fuel Clause Adjustment
Non-Asset Based Energy Sale
A Non-Asset Based Energy deal is for the sale of a specified quantity of MWh at a given price throughout the contract term. The energy sold to the counterparty is not generated by NSP's own assets. Instead NSP either (1) purchases a like product to back all or a part of the position and/or (2) purchases the requisite energy off the MISO market day ahead or in real time depending upon risk tolerance. Business Rules require that any purchase or sale of energy be offered to the NSP system first. If the system passes on the purchase or sale it can then be assigned to the prop book.
Non-Asset Based - Margin Adjustment Margins are retained by the Company. Therefore, both the margins and the associated O&M costs are excluded from the test year
Capacity Asset Based Capacity Sale An Asset Based Capacity deal is for the sale of MISO Zonal Resource Credits ("ZRCs", which are fungible instruments that represent one MW of Unforced Capacity from a Planning Resource over a MISO planning year). For these deals, the capacity sold is provided by NSP's projected surplus assets.
Asset Based - No Adjustment Revenues are included as an offset to the revenue requirement. Associated fixed costs are included in the Cost of Service Study.
Non-Asset Based Capacity Sale
A Non-Asset Based Capacity deal is for the sale of MISO ZRCs that are backed by the purchase of a like product. Business Rules require that any purchase or sale of capacity be offered to the NSP system first. If the system passes on the purchase or sale it can then be assigned to the prop book
Non-Asset Based - Margin Adjustment Margins are retained by the Company. Therefore, both the margins and the costs are excluded from the test year
Other MISO Interface/Scheduling
In a MISO Interface deal NSP provides services necessary for the counterparty to operate in the MISO market. Such services include Day Ahead load bids, FinScheds, Capacity reporting for MISO Module E, and others as specified in the individual contracts. Pricing is determined on a per MWh basis and may vary depending upon actual usage.
Other Wholesale Transactions - No Adjustment Revenues are included as an offset to the revenue requirement. Associated O&M costs are included in the Cost of Service Study.
Energy Services Agreement
The Company currently has only one Energy Services Agreement in place. This deal governs the fee paid to NSP for the preservation of transmission reservations, which improves [TRADE SECRET BEGINS TRADE SECRET ENDS] ability to import and export power. The annual service fee payments are payable to NSP in advance of the service year.
Other Wholesale Transactions - No Adjustment Revenues are included as an offset to the revenue requirement. Associated O&M costs are included in the Cost of Service Study.
MISO Pass Through These pass through arrangements specify that all MISO charges including transmission service, congestion AND loss, and ancillary services are a pass through. NSP earns no margin on such deals.
N/A There are no revenues or expenses requiring ratemaking treatment as these transactions are merely a pass through of MISO charges.
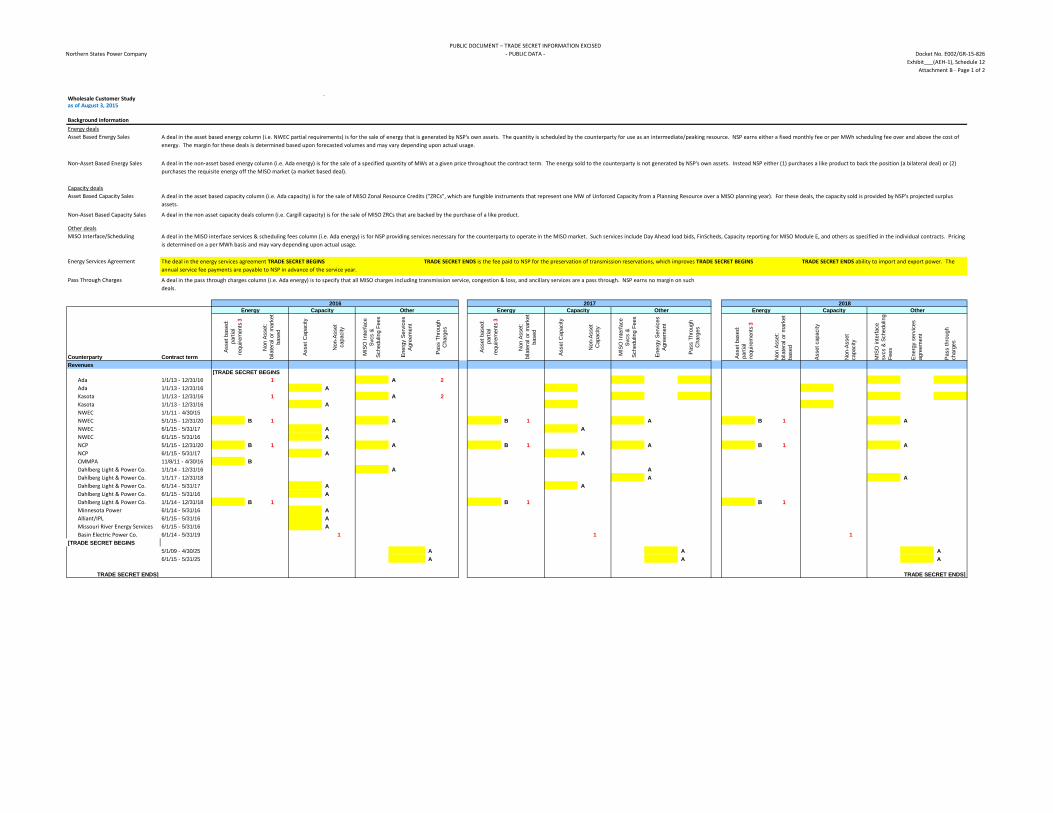
Northern States Power CompanyPUBLIC DOCUMENT – TRADE SECRET INFORMATION EXCISED
- PUBLIC DATA - Docket No. E002/GR-15-826Exhibit___(AEH-1), Schedule 12
Attachment B - Page 1 of 2
Wholesale Customer Study `as of August 3, 2015
Background informationEnergy deals
Capacity deals
Non-Asset Based Capacity Sales A deal in the non asset capacity deals column (i.e. Cargill capacity) is for the sale of MISO ZRCs that are backed by the purchase of a like product.
Other deals
Pass Through Charges
Counterparty Contract term
Non
Ass
et:
bila
tera
l or m
arke
t ba
sed
Asse
t Cap
acity
Non
-Ass
et
capa
city
MIS
O In
terfa
ce
Svcs
&
Sche
dulin
g Fe
es
Ener
gy S
ervi
ces
Agre
emen
t
Pass
Thr
ough
C
harg
es
Non
Ass
et:
bila
tera
l or m
arke
t ba
sed
Asse
t Cap
acity
Non
-Ass
et
Cap
acity
MIS
O In
terfa
ce
Svcs
&
Sche
dulin
g Fe
es
Ener
gy S
ervi
ces
Agre
emen
t
Pass
Thr
ough
C
harg
es
Non
Ass
et:
bila
tera
l or m
arke
t ba
sed
Asse
t cap
acity
Non
-Ass
et
capa
city
MIS
O in
terfa
ce
svcs
& S
ched
ulin
g Fe
es
Ener
gy s
ervi
ces
agre
emen
t
Pass
thro
ugh
char
ges
Revenues[TRADE SECRET BEGINS
Ada 1/1/13 - 12/31/16 1 A 2Ada 1/1/13 - 12/31/16 AKasota 1/1/13 - 12/31/16 1 A 2Kasota 1/1/13 - 12/31/16 ANWEC 1/1/11 - 4/30/15NWEC 5/1/15 - 12/31/20 B 1 A B 1 A B 1 ANWEC 6/1/15 - 5/31/17 A ANWEC 6/1/15 - 5/31/16 ANCP 5/1/15 - 12/31/20 B 1 A B 1 A B 1 ANCP 6/1/15 - 5/31/17 A ACMMPA 11/8/11 - 4/30/16 BDahlberg Light & Power Co. 1/1/14 - 12/31/16 A ADahlberg Light & Power Co. 1/1/17 - 12/31/18 A ADahlberg Light & Power Co. 6/1/14 - 5/31/17 A ADahlberg Light & Power Co. 6/1/15 - 5/31/16 ADahlberg Light & Power Co. 1/1/14 - 12/31/18 B 1 B 1 B 1Minnesota Power 6/1/14 - 5/31/16 AAlliant/IPL 6/1/15 - 5/31/16 AMissouri River Energy Services 6/1/15 - 5/31/16 ABasin Electric Power Co. 6/1/14 - 5/31/19 1 1 1
[TRADE SECRET BEGINS5/1/09 - 4/30/25 A A A6/1/15 - 5/31/25 A A A
TRADE SECRET ENDS] TRADE SECRET ENDS]
2016 2017 2018
Asset Based Energy Sales A deal in the asset based energy column (i.e. NWEC partial requirements) is for the sale of energy that is generated by NSP's own assets. The quantity is scheduled by the counterparty for use as an intermediate/peaking resource. NSP earns either a fixed monthly fee or per MWh scheduling fee over and above the cost of energy. The margin for these deals is determined based upon forecasted volumes and may vary depending upon actual usage.
Non-Asset Based Energy Sales A deal in the non-asset based energy column (i.e. Ada energy) is for the sale of a specified quantity of MWs at a given price throughout the contract term. The energy sold to the counterparty is not generated by NSP's own assets. Instead NSP either (1) purchases a like product to back the position (a bilateral deal) or (2) purchases the requisite energy off the MISO market (a market based deal).
Asset Based Capacity Sales A deal in the asset based capacity column (i.e. Ada capacity) is for the sale of MISO Zonal Resource Credits ("ZRCs", which are fungible instruments that represent one MW of Unforced Capacity from a Planning Resource over a MISO planning year). For these deals, the capacity sold is provided by NSP's projected surplus assets.
MISO Interface/Scheduling A deal in the MISO interface services & scheduling fees column (i.e. Ada energy) is for NSP providing services necessary for the counterparty to operate in the MISO market. Such services include Day Ahead load bids, FinScheds, Capacity reporting for MISO Module E, and others as specified in the individual contracts. Pricing is determined on a per MWh basis and may vary depending upon actual usage.
Energy Services Agreement The deal in the energy services agreement TRADE SECRET BEGINS TRADE SECRET ENDS is the fee paid to NSP for the preservation of transmission reservations, which improves TRADE SECRET BEGINS TRADE SECRET ENDS ability to import and export power. The annual service fee payments are payable to NSP in advance of the service year.
A deal in the pass through charges column (i.e. Ada energy) is to specify that all MISO charges including transmission service, congestion & loss, and ancillary services are a pass through. NSP earns no margin on such deals.
Other
Asse
t bas
ed:
parti
al
requ
irem
ents
3
Asse
t bas
ed:
parti
al
requ
irem
ents
3
Asse
t bas
ed:
parti
al
requ
irem
ents
3
Other Energy CapacityEnergy Capacity Other Energy Capacity
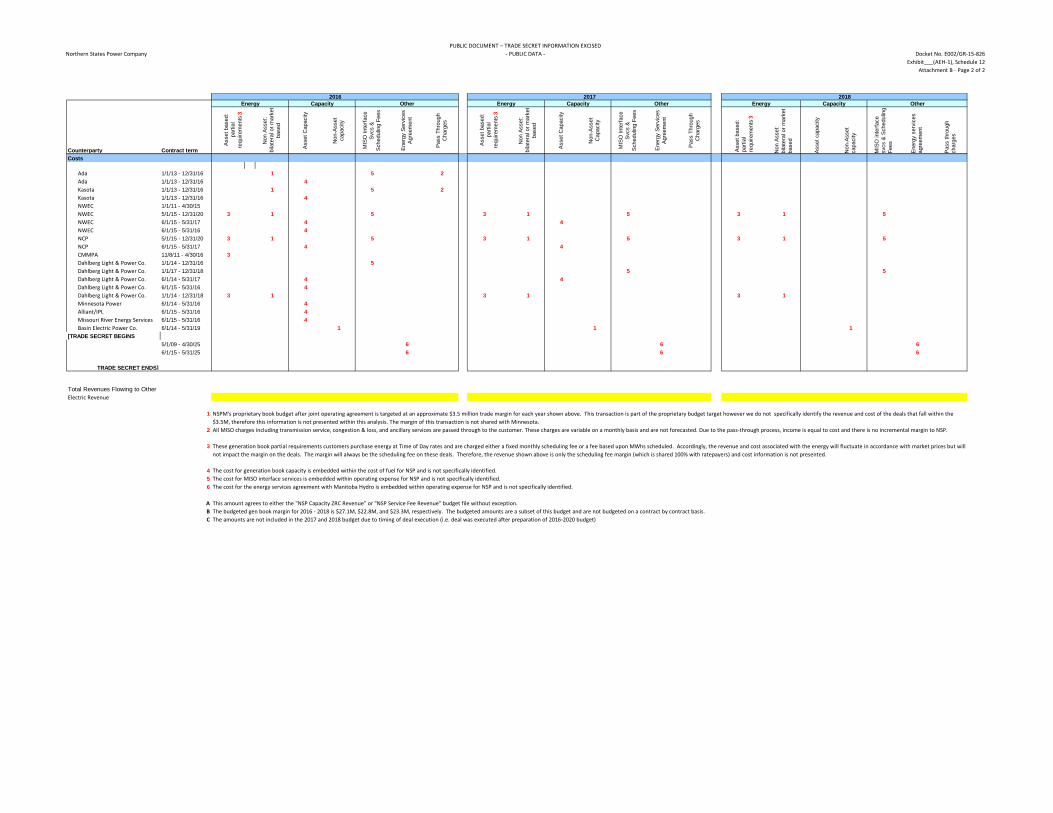
Northern States Power CompanyPUBLIC DOCUMENT – TRADE SECRET INFORMATION EXCISED
- PUBLIC DATA - Docket No. E002/GR-15-826Exhibit___(AEH-1), Schedule 12
Attachment B - Page 2 of 2
Counterparty Contract term
Non
Ass
et:
bila
tera
l or m
arke
t ba
sed
Asse
t Cap
acity
Non
-Ass
et
capa
city
MIS
O In
terfa
ce
Svcs
&
Sche
dulin
g Fe
es
Ener
gy S
ervi
ces
Agre
emen
t
Pass
Thr
ough
C
harg
es
Non
Ass
et:
bila
tera
l or m
arke
t ba
sed
Asse
t Cap
acity
Non
-Ass
et
Cap
acity
MIS
O In
terfa
ce
Svcs
&
Sche
dulin
g Fe
es
Ener
gy S
ervi
ces
Agre
emen
t
Pass
Thr
ough
C
harg
es
Non
Ass
et:
bila
tera
l or m
arke
t ba
sed
Asse
t cap
acity
Non
-Ass
et
capa
city
MIS
O in
terfa
ce
svcs
& S
ched
ulin
g Fe
es
Ener
gy s
ervi
ces
agre
emen
t
Pass
thro
ugh
char
ges
2016 2017 2018Other
Asse
t bas
ed:
parti
al
requ
irem
ents
3
Asse
t bas
ed:
parti
al
requ
irem
ents
3
Asse
t bas
ed:
parti
al
requ
irem
ents
3
Other Energy CapacityEnergy Capacity Other Energy Capacity
Costs
Ada 1/1/13 - 12/31/16 1 5 2 Ada 1/1/13 - 12/31/16 4 Kasota 1/1/13 - 12/31/16 1 5 2 Kasota 1/1/13 - 12/31/16 4 NWEC 1/1/11 - 4/30/15 NWEC 5/1/15 - 12/31/20 3 1 5 3 1 5 3 1 5 NWEC 6/1/15 - 5/31/17 4 4 NWEC 6/1/15 - 5/31/16 4NCP 5/1/15 - 12/31/20 3 1 5 3 1 5 3 1 5 NCP 6/1/15 - 5/31/17 4 4 CMMPA 11/8/11 - 4/30/16 3 Dahlberg Light & Power Co. 1/1/14 - 12/31/16 5 Dahlberg Light & Power Co. 1/1/17 - 12/31/18 5 5 Dahlberg Light & Power Co. 6/1/14 - 5/31/17 4 4 Dahlberg Light & Power Co. 6/1/15 - 5/31/16 4Dahlberg Light & Power Co. 1/1/14 - 12/31/18 3 1 3 1 3 1 Minnesota Power 6/1/14 - 5/31/16 4 Alliant/IPL 6/1/15 - 5/31/16 4 Missouri River Energy Services 6/1/15 - 5/31/16 4 Basin Electric Power Co. 6/1/14 - 5/31/19 1 1 1
[TRADE SECRET BEGINS5/1/09 - 4/30/25 6 6 6 6/1/15 - 5/31/25 6 6 6
TRADE SECRET ENDS]
Electric Revenue
1
2
3
4 The cost for generation book capacity is embedded within the cost of fuel for NSP and is not specifically identified. 5 The cost for MISO interface services is embedded within operating expense for NSP and is not specifically identified.6 The cost for the energy services agreement with Manitoba Hydro is embedded within operating expense for NSP and is not specifically identified.
A This amount agrees to either the "NSP Capacity ZRC Revenue" or "NSP Service Fee Revenue" budget file without exception.B The budgeted gen book margin for 2016 - 2018 is $27.1M, $22.8M, and $23.3M, respectively. The budgeted amounts are a subset of this budget and are not budgeted on a contract by contract basis.C The amounts are not included in the 2017 and 2018 budget due to timing of deal execution (i.e. deal was executed after preparation of 2016-2020 budget)
Total Revenues Flowing to Other
These generation book partial requirements customers purchase energy at Time of Day rates and are charged either a fixed monthly scheduling fee or a fee based upon MWhs scheduled. Accordingly, the revenue and cost associated with the energy will fluctuate in accordance with market prices but will not impact the margin on the deals. The margin will always be the scheduling fee on these deals. Therefore, the revenue shown above is only the scheduling fee margin (which is shared 100% with ratepayers) and cost information is not presented.
NSPM's proprietary book budget after joint operating agreement is targeted at an approximate $3.5 million trade margin for each year shown above. This transaction is part of the proprietary budget target however we do not specifically identify the revenue and cost of the deals that fall within the $3.5M, therefore this information is not presented within this analysis. The margin of this transaction is not shared with Minnesota.All MISO charges including transmission service, congestion & loss, and ancillary services are passed through to the customer. These charges are variable on a monthly basis and are not forecasted. Due to the pass-through process, income is equal to cost and there is no incremental margin to NSP.
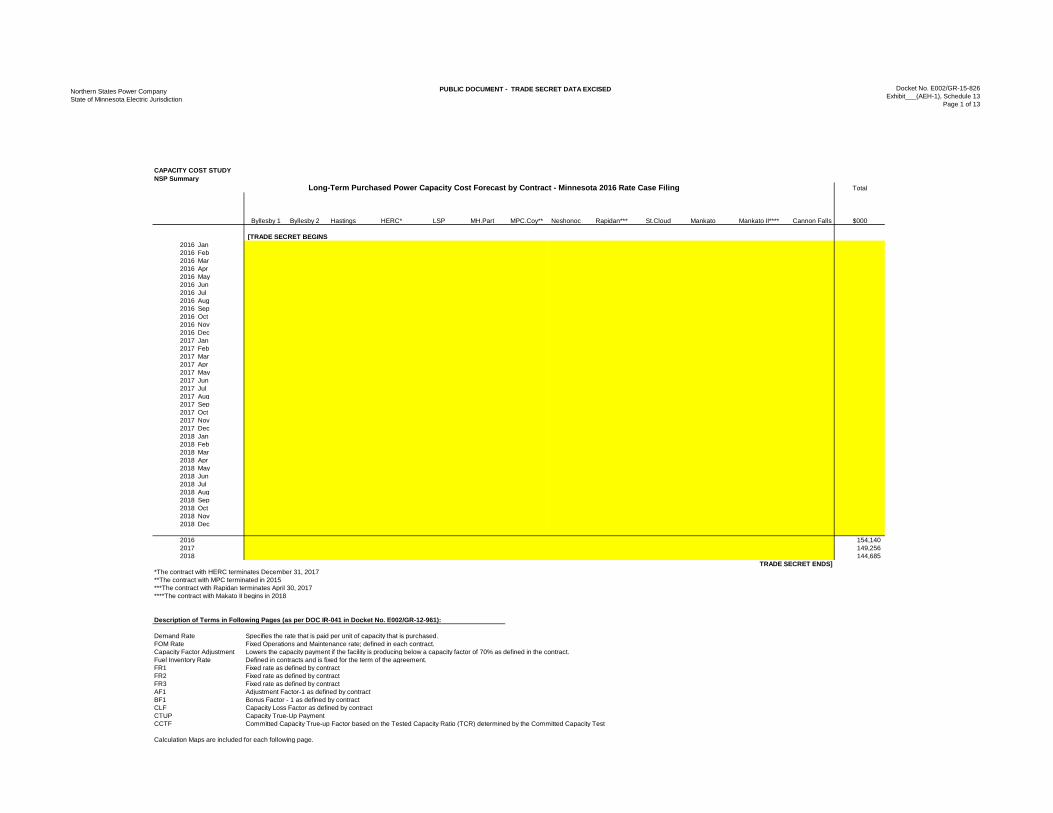
Northern States Power CompanyState of Minnesota Electric Jurisdiction
PUBLIC DOCUMENT - TRADE SECRET DATA EXCISED Docket No. E002/GR-15-826Exhibit___(AEH-1), Schedule 13
Page 1 of 13
Total
Byllesby 1 Byllesby 2 Hastings HERC* LSP MH.Part MPC.Coy** Neshonoc Rapidan*** St.Cloud Mankato Mankato II**** Cannon Falls $000
[TRADE SECRET BEGINS2016 Jan2016 Feb2016 Mar2016 Apr2016 May2016 Jun2016 Jul2016 Aug2016 Sep2016 Oct2016 Nov2016 Dec2017 Jan2017 Feb2017 Mar2017 Apr2017 May2017 Jun2017 Jul2017 Aug2017 Sep2017 Oct2017 Nov2017 Dec2018 Jan2018 Feb2018 Mar2018 Apr2018 May2018 Jun2018 Jul2018 Aug2018 Sep2018 Oct2018 Nov2018 Dec
2016 154,140 2017 149,256 2018 144,685
*The contract with HERC terminates December 31, 2017**The contract with MPC terminated in 2015***The contract with Rapidan terminates April 30, 2017****The contract with Makato II begins in 2018
Description of Terms in Following Pages (as per DOC IR-041 in Docket No. E002/GR-12-961):
Demand RateFOM RateCapacity Factor AdjustmentFuel Inventory RateFR1FR2FR3AF1BF1CLFCTUPCCTF
Calculation Maps are included for each following page.
CAPACITY COST STUDYNSP Summary
Long-Term Purchased Power Capacity Cost Forecast by Contract - Minnesota 2016 Rate Case Filing
Fixed rate as defined by contractFixed rate as defined by contractFixed rate as defined by contract
Defined in contracts and is fixed for the term of the agreement.
Specifies the rate that is paid per unit of capacity that is purchased.Fixed Operations and Maintenance rate; defined in each contract.Lowers the capacity payment if the facility is producing below a capacity factor of 70% as defined in the contract.
TRADE SECRET ENDS]
Committed Capacity True-up Factor based on the Tested Capacity Ratio (TCR) determined by the Committed Capacity TestCapacity True-Up Payment
Adjustment Factor-1 as defined by contractBonus Factor - 1 as defined by contractCapacity Loss Factor as defined by contract

Northern States Power CompanyState of Minnesota Electric Jurisdiction
PUBLIC DOCUMENT - TRADE SECRET DATA EXCISED Docket No. E002/GR-15-826Exhibit___(AEH-1), Schedule 13
Page 2 of 13
A B C D = A+B+C E F D*E*F/1000
[TRADE SECRET BEGINS
2016 Jan2016 Feb2016 Mar2016 Apr2016 May2016 Jun2016 Jul2016 Aug2016 Sep2016 Oct2016 Nov2016 Dec2017 Jan2017 Feb2017 Mar2017 Apr2017 May2017 Jun2017 Jul2017 Aug2017 Sep2017 Oct2017 Nov2017 Dec2018 Jan2018 Feb2018 Mar2018 Apr2018 May2018 Jun2018 Jul2018 Aug2018 Sep2018 Oct2018 Nov2018 Dec
TRADE SECRET ENDS]
CAPACITY COST STUDYNSP Summary
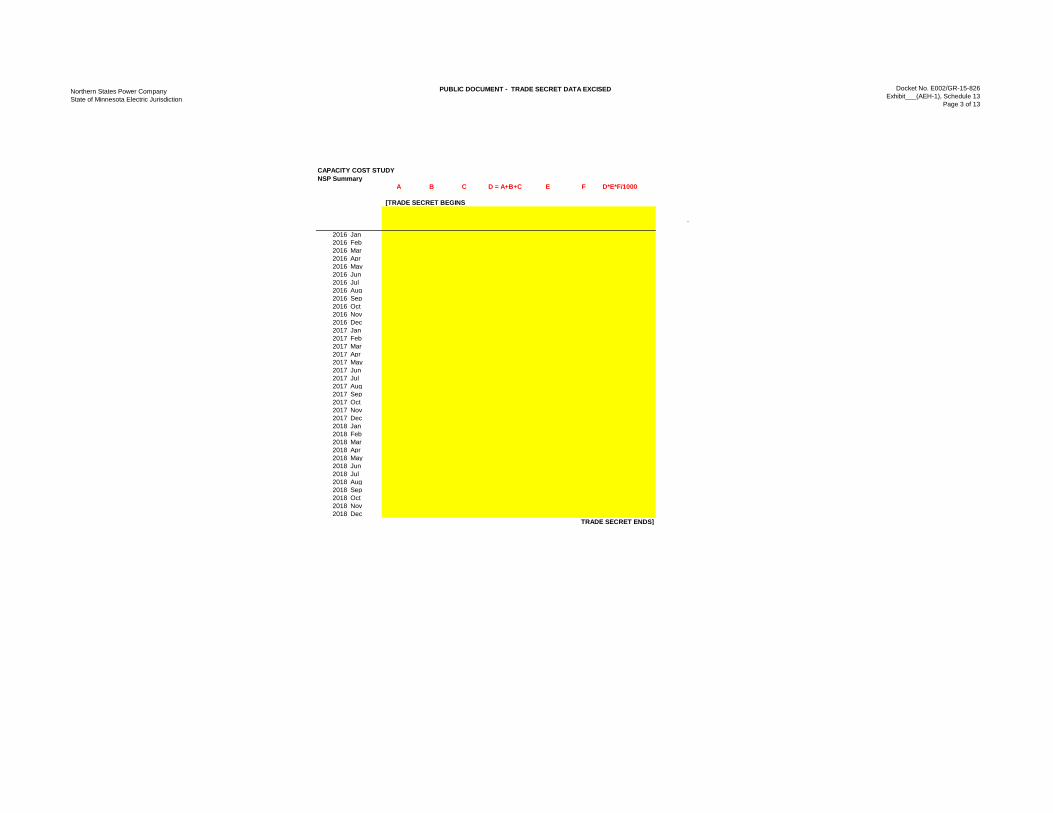
Northern States Power CompanyState of Minnesota Electric Jurisdiction
PUBLIC DOCUMENT - TRADE SECRET DATA EXCISED Docket No. E002/GR-15-826Exhibit___(AEH-1), Schedule 13
Page 3 of 13
A B C D = A+B+C E F D*E*F/1000
[TRADE SECRET BEGINS
2016 Jan2016 Feb2016 Mar2016 Apr2016 May2016 Jun2016 Jul2016 Aug2016 Sep2016 Oct2016 Nov2016 Dec2017 Jan2017 Feb2017 Mar2017 Apr2017 May2017 Jun2017 Jul2017 Aug2017 Sep2017 Oct2017 Nov2017 Dec2018 Jan2018 Feb2018 Mar2018 Apr2018 May2018 Jun2018 Jul2018 Aug2018 Sep2018 Oct2018 Nov2018 Dec
TRADE SECRET ENDS]
CAPACITY COST STUDYNSP Summary

Northern States Power CompanyState of Minnesota Electric Jurisdiction
PUBLIC DOCUMENT - TRADE SECRET DATA EXCISED Docket No. E002/GR-15-826Exhibit___(AEH-1), Schedule 13
Page 4 of 13
A B C = A+B D F C*D*F/1000
[TRADE SECRET BEGINS
2016 Jan2016 Feb2016 Mar2016 Apr2016 May2016 Jun2016 Jul2016 Aug2016 Sep2016 Oct2016 Nov2016 Dec2017 Jan2017 Feb2017 Mar2017 Apr2017 May2017 Jun2017 Jul2017 Aug2017 Sep2017 Oct2017 Nov2017 Dec2018 Jan2018 Feb2018 Mar2018 Apr2018 May2018 Jun2018 Jul2018 Aug2018 Sep2018 Oct2018 Nov2018 Dec
TRADE SECRET ENDS]
CAPACITY COST STUDYNSP Summary
Northern States Power CompanyState of Minnesota Electric Jurisdiction
PUBLIC DOCUMENT - TRADE SECRET DATA EXCISED Docket No. E002/GR-15-826Exhibit___(AEH-1), Schedule 13
Page 5 of 13
A B C D E = (A+B+C)*(1+D) F RCF E*F/1000*(RCF/70%)
[TRADE SECRET BEGINS
2016 Jan2016 Feb2016 Mar2016 Apr2016 May2016 Jun2016 Jul2016 Aug2016 Sep2016 Oct2016 Nov2016 Dec2017 Jan2017 Feb2017 Mar2017 Apr2017 May2017 Jun2017 Jul2017 Aug2017 Sep2017 Oct2017 Nov2017 Dec
Contract ends Contract endsTRADE SECRET ENDS]
CAPACITY COST STUDYNSP Summary

Northern States Power CompanyState of Minnesota Electric Jurisdiction
PUBLIC DOCUMENT - TRADE SECRET DATA EXCISED Docket No. E002/GR-15-826Exhibit___(AEH-1), Schedule 13
Page 6 of 13
A B C D = B*C E F G H I J K L = (A*(D+E+F)*G*H*I*K+J)/12/1000 M L-M
[TRADE SECRET BEGINS
2016 Jan2016 Feb2016 Mar2016 Apr2016 May2016 Jun2016 Jul2016 Aug2016 Sep2016 Oct2016 Nov2016 Dec2017 Jan2017 Feb2017 Mar2017 Apr2017 May2017 Jun2017 Jul2017 Aug2017 Sep2017 Oct2017 Nov2017 Dec2018 Jan2018 Feb2018 Mar2018 Apr2018 May2018 Jun2018 Jul2018 Aug2018 Sep2018 Oct2018 Nov2018 Dec
TRADE SECRET ENDS]
CAPACITY COST STUDYNSP Summary

Northern States Power CompanyState of Minnesota Electric Jurisdiction
PUBLIC DOCUMENT - TRADE SECRET DATA EXCISED Docket No. E002/GR-15-826Exhibit___(AEH-1), Schedule 13
Page 7 of 13
Purchaser: Northern States Power CompanySeller: The Manitoba Hydro -Electric Board (PPA dated May 27, 2010)
[TRADE SECRET BEGINS
TRADE SECRET ENDS]
CAPACITY COST STUDYNSP Summary
Northern States Power CompanyState of Minnesota Electric Jurisdiction
PUBLIC DOCUMENT - TRADE SECRET DATA EXCISED Docket No. E002/GR-15-826Exhibit___(AEH-1), Schedule 13
Page 8 of 13
A B C D A*B*C*D/1000
[TRADE SECRET BEGINS
2016 Jan2016 Feb2016 Mar2016 Apr2016 May2016 Jun2016 Jul2016 Aug2016 Sep2016 Oct2016 Nov2016 Dec2017 Jan2017 Feb2017 Mar2017 Apr2017 May2017 Jun2017 Jul2017 Aug2017 Sep2017 Oct2017 Nov2017 Dec2018 Jan2018 Feb2018 Mar2018 Apr2018 May2018 Jun2018 Jul2018 Aug2018 Sep2018 Oct2018 Nov2018 Dec
TRADE SECRET ENDS]
CAPACITY COST STUDYNSP Summary

Northern States Power CompanyState of Minnesota Electric Jurisdiction
PUBLIC DOCUMENT - TRADE SECRET DATA EXCISED Docket No. E002/GR-15-826Exhibit___(AEH-1), Schedule 13
Page 9 of 13
A B C D = A+B+C E F = D*E/1000 G H I = G*H/1000 F+I
[TRADE SECRET BEGINS
2016 Jan2016 Feb2016 Mar2016 Apr2016 May2016 Jun2016 Jul2016 Aug2016 Sep2016 Oct2016 Nov2016 Dec2017 Jan2017 Feb2017 Mar2017 Apr
Contract ends Contract endsTRADE SECRET ENDS]
CAPACITY COST STUDYNSP Summary
Northern States Power CompanyState of Minnesota Electric Jurisdiction
PUBLIC DOCUMENT - TRADE SECRET DATA EXCISED Docket No. E002/GR-15-826Exhibit___(AEH-1), Schedule 13
Page 10 of 13
A B C D = A+B+C E F D*E*F/1000-4.16667
[TRADE SECRET BEGINS
2016 Jan2016 Feb2016 Mar2016 Apr2016 May2016 Jun2016 Jul2016 Aug2016 Sep2016 Oct2016 Nov2016 Dec2017 Jan2017 Feb2017 Mar2017 Apr2017 May2017 Jun2017 Jul2017 Aug2017 Sep2017 Oct2017 Nov2017 Dec2018 Jan2018 Feb2018 Mar2018 Apr2018 May2018 Jun2018 Jul2018 Aug2018 Sep2018 Oct2018 Nov2018 Dec
TRADE SECRET ENDS]
CAPACITY COST STUDYNSP Summary
Northern States Power CompanyState of Minnesota Electric Jurisdiction
PUBLIC DOCUMENT - TRADE SECRET DATA EXCISED Docket No. E002/GR-15-826Exhibit___(AEH-1), Schedule 13
Page 11 of 13
Purchaser: Northern States Power Seller: Mankato Energy Center, LLC (Purchased Power Agreement dated March 11, 2004)
[TRADE SECRET BEGINS
TRADE SECRET ENDS]
[TRADE SECRET BEGINSContracted Capacity (Net Capability) - KW: A
TRADE SECRET ENDS]
1 2 3 4 5 6 7 8 9 10 11 12 13 14 152006 2007 2008 2009 2010 2011 2012 2013 2014 2015 2016 2017 2018 2019 2020
[TRADE SECRET BEGINSBC
Contract Capacity Payment Factors:[TRADE SECRET BEGINS
DE
TRADE SECRET ENDS]
2016 Fixed Charges: Jan Feb Mar Apr May Jun Jul Aug Sep Oct Nov Dec Annual Total
[TRADE SECRET BEGINS=A*B*D=A*C*E
2017 Fixed Charges: Jan Feb Mar Apr May Jun Jul Aug Sep Oct Nov Dec Annual Total
[TRADE SECRET BEGINS=A*B*D=A*C*E
2018 Fixed Charges: Jan Feb Mar Apr May Jun Jul Aug Sep Oct Nov Dec Annual Total
[TRADE SECRET BEGINS=A*B*D=A*C*E
TRADE SECRET ENDS]
TRADE SECRET ENDS]
CAPACITY COST STUDYNSP Summary
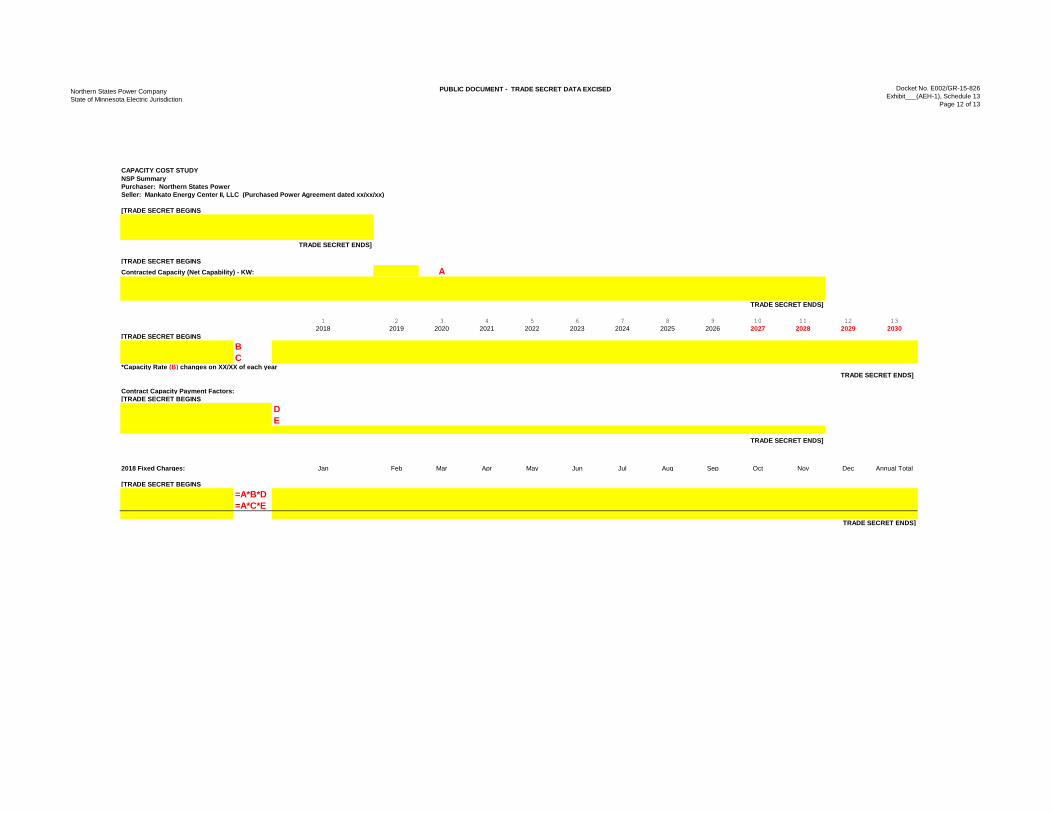
Northern States Power CompanyState of Minnesota Electric Jurisdiction
PUBLIC DOCUMENT - TRADE SECRET DATA EXCISED Docket No. E002/GR-15-826Exhibit___(AEH-1), Schedule 13
Page 12 of 13
Purchaser: Northern States Power Seller: Mankato Energy Center II, LLC (Purchased Power Agreement dated xx/xx/xx)
[TRADE SECRET BEGINS
TRADE SECRET ENDS]
[TRADE SECRET BEGINSContracted Capacity (Net Capability) - KW: A
TRADE SECRET ENDS]
1 2 3 4 5 6 7 8 9 10 11 12 132018 2019 2020 2021 2022 2023 2024 2025 2026 2027 2028 2029 2030
[TRADE SECRET BEGINSBC
*Capacity Rate (B) changes on XX/XX of each year
Contract Capacity Payment Factors:[TRADE SECRET BEGINS
DE
TRADE SECRET ENDS]
2018 Fixed Charges: Jan Feb Mar Apr May Jun Jul Aug Sep Oct Nov Dec Annual Total
[TRADE SECRET BEGINS=A*B*D=A*C*E
TRADE SECRET ENDS]
TRADE SECRET ENDS]
CAPACITY COST STUDYNSP Summary
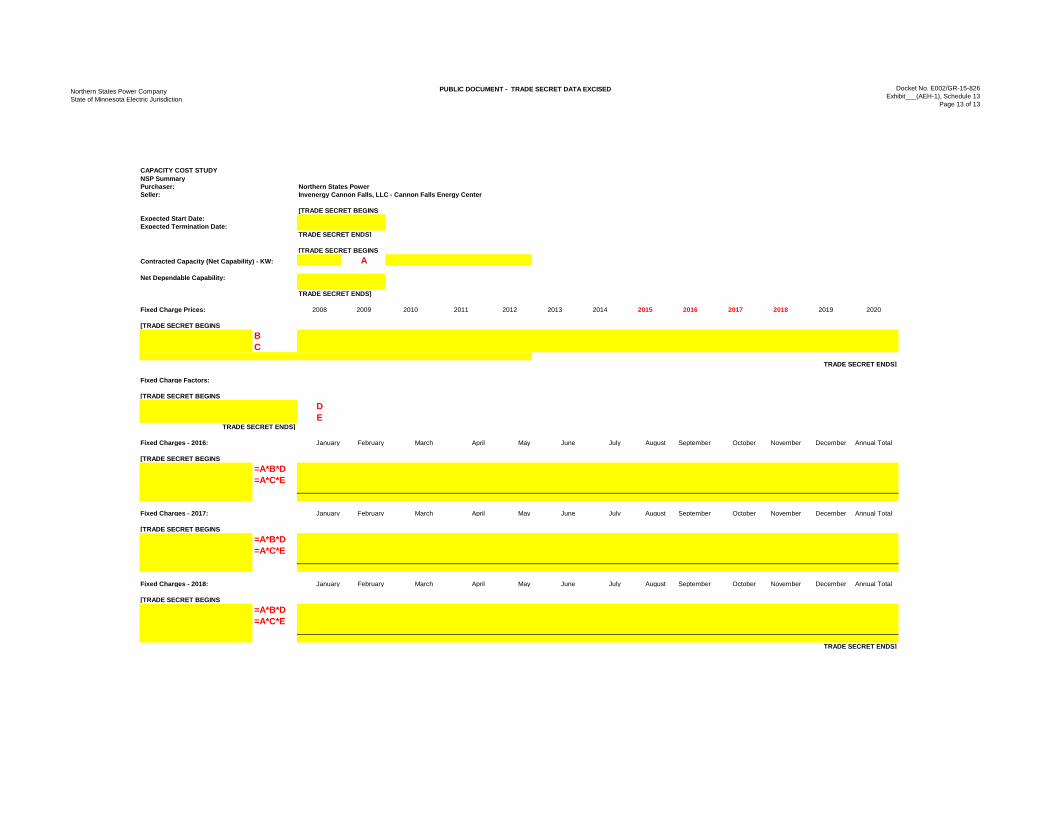
Northern States Power CompanyState of Minnesota Electric Jurisdiction
PUBLIC DOCUMENT - TRADE SECRET DATA EXCISED Docket No. E002/GR-15-826Exhibit___(AEH-1), Schedule 13
Page 13 of 13
Purchaser: Northern States Power Seller: Invenergy Cannon Falls, LLC - Cannon Falls Energy Center
[TRADE SECRET BEGINSExpected Start Date:Expected Termination Date:
TRADE SECRET ENDS]
[TRADE SECRET BEGINSContracted Capacity (Net Capability) - KW: A
Net Dependable Capability:
TRADE SECRET ENDS]
Fixed Charge Prices: 2008 2009 2010 2011 2012 2013 2014 2015 2016 2017 2018 2019 2020
[TRADE SECRET BEGINSBC
TRADE SECRET ENDS]
Fixed Charge Factors:
[TRADE SECRET BEGINSDE
TRADE SECRET ENDS]
Fixed Charges - 2016: January February March April May June July August September October November December Annual Total
[TRADE SECRET BEGINS=A*B*D=A*C*E
Fixed Charges - 2017: January February March April May June July August September October November December Annual Total
[TRADE SECRET BEGINS=A*B*D=A*C*E
Fixed Charges - 2018: January February March April May June July August September October November December Annual Total
[TRADE SECRET BEGINS=A*B*D=A*C*E
TRADE SECRET ENDS]
CAPACITY COST STUDYNSP Summary
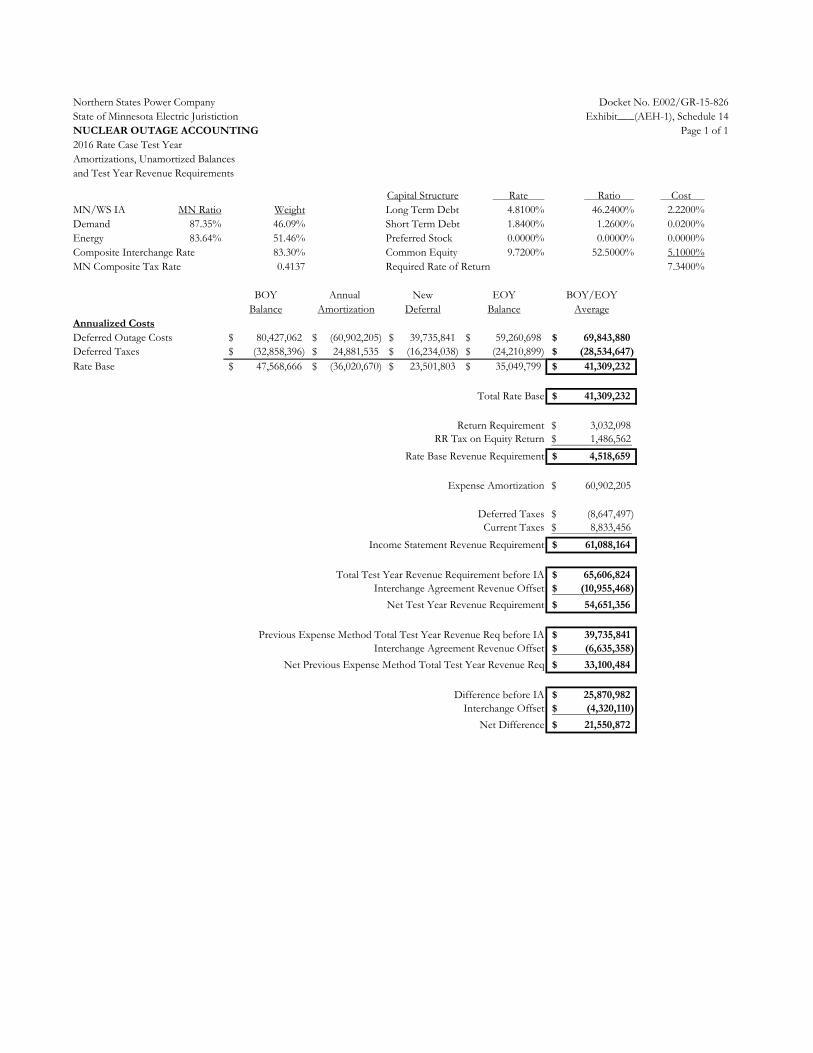
Northern States Power Company Docket No. E002/GR-15-826State of Minnesota Electric Juristiction Exhibit___(AEH-1), Schedule 14
Page 1 of 12016 Rate Case Test YearAmortizations, Unamortized Balancesand Test Year Revenue Requirements
Capital Structure Rate Ratio Cost MN/WS IA MN Ratio Weight Long Term Debt 4.8100% 46.2400% 2.2200%Demand 87.35% 46.09% Short Term Debt 1.8400% 1.2600% 0.0200%Energy 83.64% 51.46% Preferred Stock 0.0000% 0.0000% 0.0000%Composite Interchange Rate 83.30% Common Equity 9.7200% 52.5000% 5.1000%MN Composite Tax Rate 0.4137 Required Rate of Return 7.3400%
BOY Annual New EOY BOY/EOYBalance Amortization Deferral Balance Average
Annualized CostsDeferred Outage Costs 80,427,062$ (60,902,205)$ 39,735,841$ 59,260,698$ 69,843,880$ Deferred Taxes (32,858,396)$ 24,881,535$ (16,234,038)$ (24,210,899)$ (28,534,647)$ Rate Base 47,568,666$ (36,020,670)$ 23,501,803$ 35,049,799$ 41,309,232$
Total Rate Base 41,309,232$
Return Requirement 3,032,098$ RR Tax on Equity Return 1,486,562$
Rate Base Revenue Requirement 4,518,659$
Expense Amortization 60,902,205$
Deferred Taxes (8,647,497)$ Current Taxes 8,833,456$
Income Statement Revenue Requirement 61,088,164$
Total Test Year Revenue Requirement before IA 65,606,824$ Interchange Agreement Revenue Offset (10,955,468)$
Net Test Year Revenue Requirement 54,651,356$
Previous Expense Method Total Test Year Revenue Req before IA 39,735,841$ Interchange Agreement Revenue Offset (6,635,358)$
Net Previous Expense Method Total Test Year Revenue Req 33,100,484$
Difference before IA 25,870,982$ Interchange Offset (4,320,110)$
Net Difference 21,550,872$
NUCLEAR OUTAGE ACCOUNTING
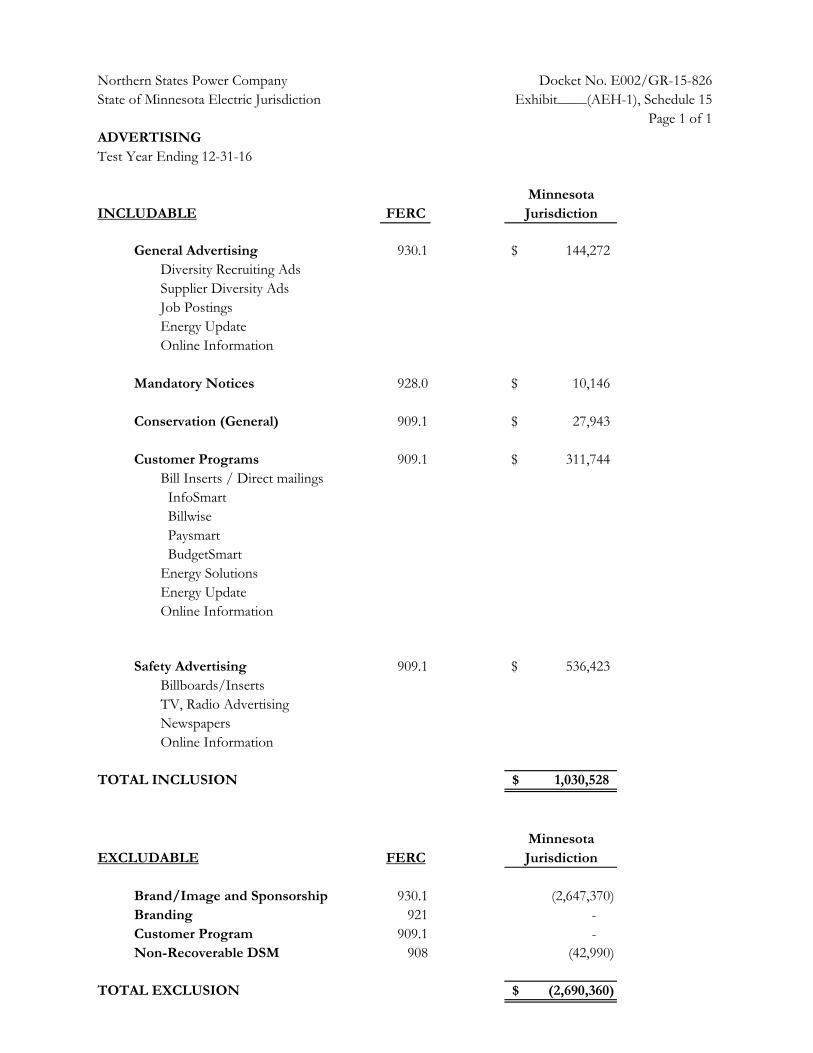
State of Minnesota Electric Jurisdiction
Test Year Ending 12-31-16
MinnesotaINCLUDABLE FERC Jurisdiction
General Advertising 930.1 144,272$ Diversity Recruiting AdsSupplier Diversity AdsJob PostingsEnergy UpdateOnline Information
Mandatory Notices 928.0 10,146$
Conservation (General) 909.1 27,943$
Customer Programs 909.1 311,744$ Bill Inserts / Direct mailings InfoSmart Billwise Paysmart BudgetSmartEnergy SolutionsEnergy UpdateOnline Information
Safety Advertising 909.1 536,423$ Billboards/InsertsTV, Radio AdvertisingNewspapersOnline Information
TOTAL INCLUSION 1,030,528$
MinnesotaEXCLUDABLE FERC Jurisdiction
Brand/Image and Sponsorship 930.1 (2,647,370) Branding 921 - Customer Program 909.1 - Non-Recoverable DSM 908 (42,990)
TOTAL EXCLUSION (2,690,360)$
Northern States Power Company
ADVERTISING
Docket No. E002/GR-15-826Exhibit____(AEH-1), Schedule 15
Page 1 of 1

Northern States Power CompanyState of Minnesota Electric Jurisdiction
Page 1 of 1
Test Year Ending December 31, 2016
MinnesotaINCLUDABLE Jurisdiction
Professional Association Dues 581,778$ 1,674,787$
Chamber of Commerce Dues 219,807$
TOTAL INCLUSION 2,476,372$
MinnesotaEXCLUDABLE Jurisdiction
Association DuesProfessional Association Dues (17,759)$
(1,205)$
TOTAL EXCLUSION (18,964)$
Docket No. E002/GR-15-826Exhibit___(AEH-1), Schedule 16
Association Dues
ORGANIZATIONAL DUES
Electric Utility Association Dues
Electric Utility Association Dues
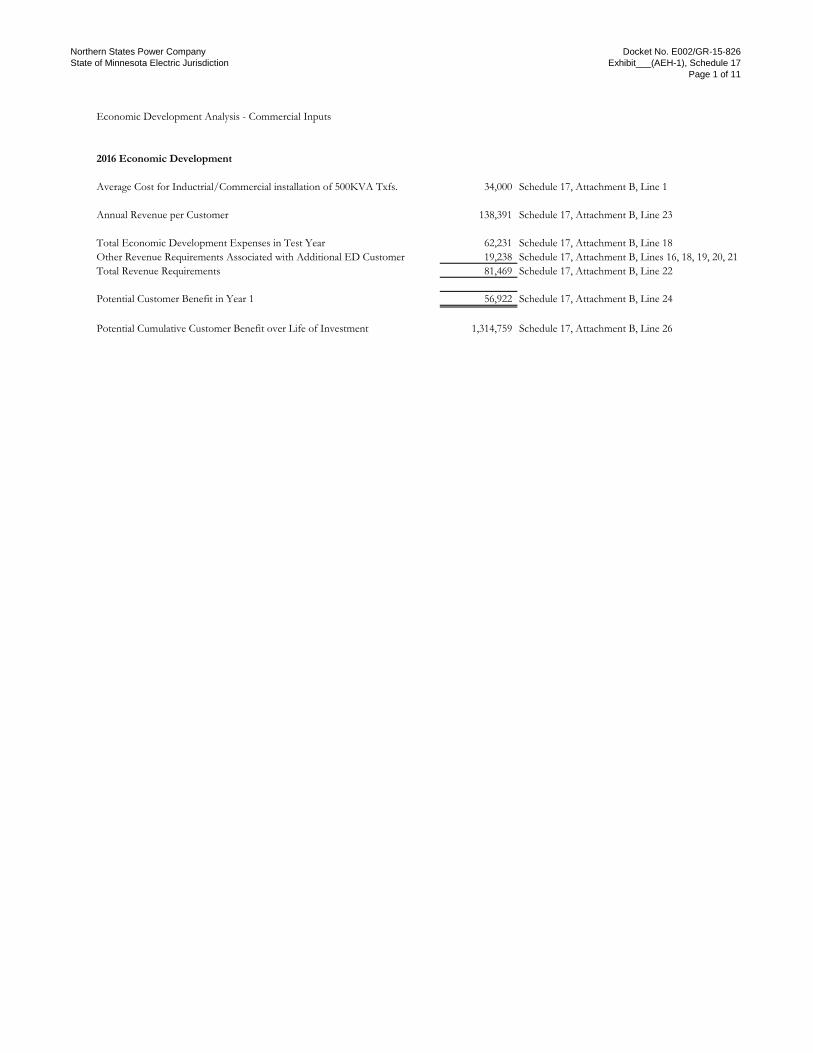
Northern States Power CompanyState of Minnesota Electric Jurisdiction
Docket No. E002/GR-15-826Exhibit___(AEH-1), Schedule 17
Page 1 of 11
Economic Development Analysis - Commercial Inputs
2016 Economic Development
Average Cost for Inductrial/Commercial installation of 500KVA Txfs. 34,000 Schedule 17, Attachment B, Line 1
Annual Revenue per Customer 138,391 Schedule 17, Attachment B, Line 23
Total Economic Development Expenses in Test Year 62,231 Schedule 17, Attachment B, Line 18Other Revenue Requirements Associated with Additional ED Customer 19,238 Schedule 17, Attachment B, Lines 16, 18, 19, 20, 21Total Revenue Requirements 81,469 Schedule 17, Attachment B, Line 22
Potential Customer Benefit in Year 1 56,922 Schedule 17, Attachment B, Line 24
Potential Cumulative Customer Benefit over Life of Investment 1,314,759 Schedule 17, Attachment B, Line 26
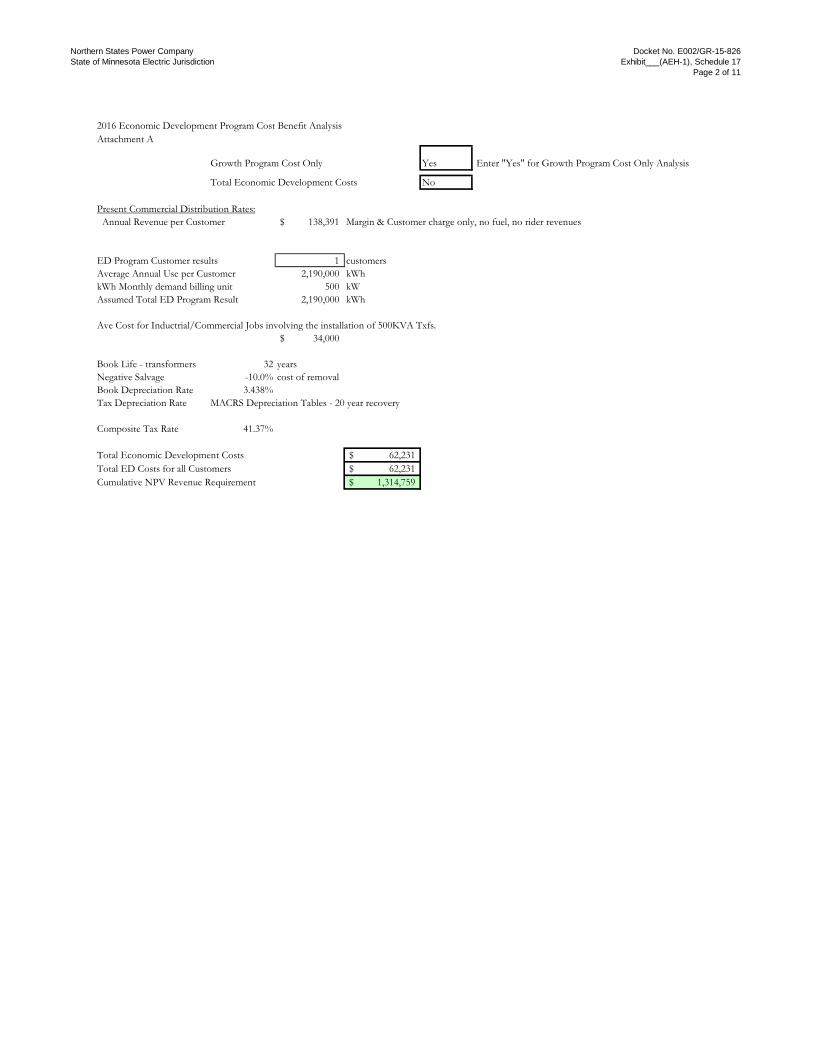
Northern States Power CompanyState of Minnesota Electric Jurisdiction
Docket No. E002/GR-15-826Exhibit___(AEH-1), Schedule 17
Page 2 of 11
2016 Economic Development Program Cost Benefit AnalysisAttachment A
Growth Program Cost Only Yes Enter "Yes" for Growth Program Cost Only Analysis
Total Economic Development Costs No
Present Commercial Distribution Rates: Annual Revenue per Customer 138,391$ Margin & Customer charge only, no fuel, no rider revenues
ED Program Customer results 1 customersAverage Annual Use per Customer 2,190,000 kWhkWh Monthly demand billing unit 500 kWAssumed Total ED Program Result 2,190,000 kWh
Ave Cost for Inductrial/Commercial Jobs involving the installation of 500KVA Txfs.34,000$
Book Life - transformers 32 yearsNegative Salvage -10.0% cost of removalBook Depreciation Rate 3.438%Tax Depreciation Rate MACRS Depreciation Tables - 20 year recovery
Composite Tax Rate 41.37%
Total Economic Development Costs 62,231$ Total ED Costs for all Customers 62,231$ Cumulative NPV Revenue Requirement 1,314,759$
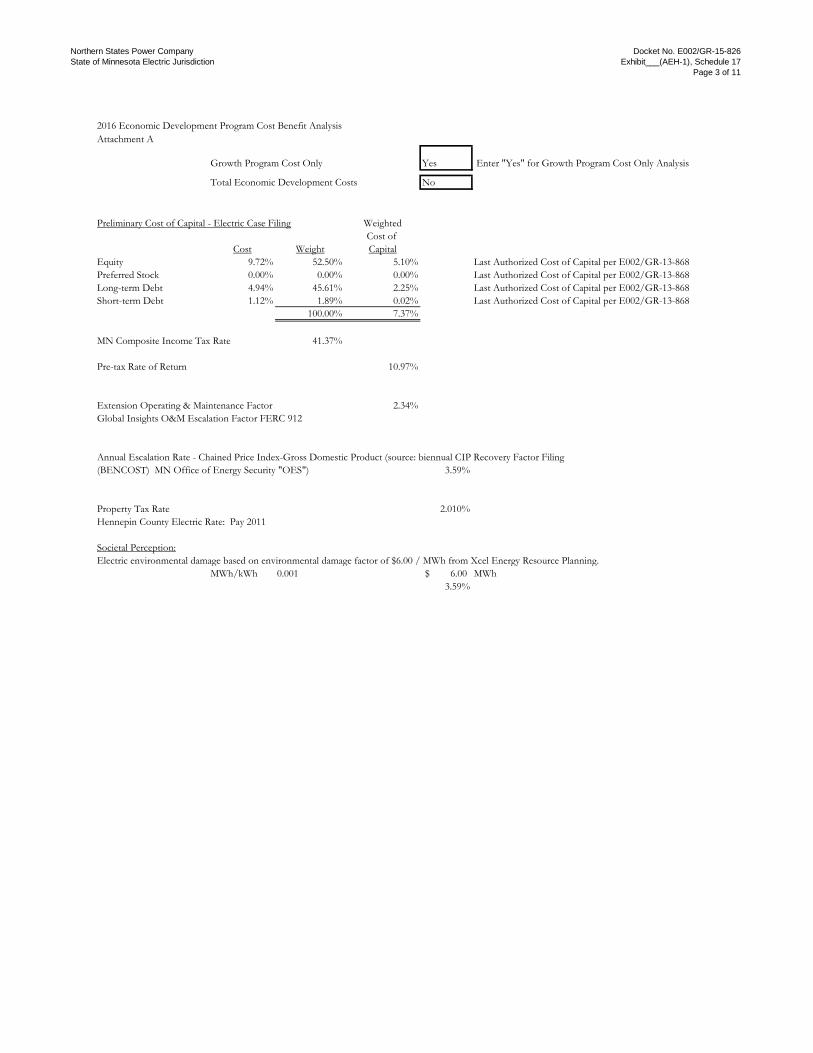
Northern States Power CompanyState of Minnesota Electric Jurisdiction
Docket No. E002/GR-15-826Exhibit___(AEH-1), Schedule 17
Page 3 of 11
2016 Economic Development Program Cost Benefit AnalysisAttachment A
Growth Program Cost Only Yes Enter "Yes" for Growth Program Cost Only Analysis
Total Economic Development Costs No
Preliminary Cost of Capital - Electric Case Filing WeightedCost of
Cost Weight CapitalEquity 9.72% 52.50% 5.10% Last Authorized Cost of Capital per E002/GR-13-868Preferred Stock 0.00% 0.00% 0.00% Last Authorized Cost of Capital per E002/GR-13-868Long-term Debt 4.94% 45.61% 2.25% Last Authorized Cost of Capital per E002/GR-13-868Short-term Debt 1.12% 1.89% 0.02% Last Authorized Cost of Capital per E002/GR-13-868
100.00% 7.37%
MN Composite Income Tax Rate 41.37%
Pre-tax Rate of Return 10.97%
Extension Operating & Maintenance Factor 2.34%Global Insights O&M Escalation Factor FERC 912
Annual Escalation Rate - Chained Price Index-Gross Domestic Product (source: biennual CIP Recovery Factor Filing(BENCOST) MN Office of Energy Security "OES") 3.59%
Property Tax Rate 2.010%Hennepin County Electric Rate: Pay 2011
Societal Perception:
MWh/kWh 0.001 6.00$ MWh3.59%
Electric environmental damage based on environmental damage factor of $6.00 / MWh from Xcel Energy Resource Planning.

Northern States Power CompanyState of Minnesota Electric Jurisdiction
Docket No. E002/GR-15-826Exhibit___(AEH-1), Schedule 17
Page 4 of 11
Net Present Value of Cash Flows Attachment B
YearLine Placed in Extension Extension ExtensionNo. Service Year No. Year No. Year No.
1 2 3 4REVENUE REQUIREMENTS ANALYSIS:
1 Total Cost 34,000$ 234 Total cost: 34,000$
5 Beginning Balance 34,000$ 6 Depreciation Expense (including negative salvage) 1,169$ 1,169$ 1,169$ 1,169$ 7 Ending Balance - Net Plant 32,831$ 31,663$ 30,494$ 29,325$ 8 Average Net Plant 33,416$ 32,247$ 31,078$ 29,909$
9 Tax Depreciation Rate 3.750% 7.219% 6.677% 6.177%10 Tax Depreciation Amount 1,275$ 2,454$ 2,270$ 2,100$ 11 Book - Tax Depreciation Difference (106)$ (1,286)$ (1,101)$ (931)$ 12 Cumulative Difference (106)$ (1,392)$ (2,493)$ (3,425)$ 13 Accumulated Deferred Income Taxes (ADIT) (44)$ (576)$ (1,032)$ (1,417)$ 14 Average ADIT (22)$ (310)$ (804)$ (1,224)$
15 Rate Base 33,394$ 31,937$ 30,274$ 28,685$
16 Return Requirement @ Pre-tax cost of capital 3,663$ 3,503$ 3,321$ 3,147$ 17 Distribution Costs:18 Economic Development Net Donations 62,231$
Societal Perspective - Net Benefit (Envrio Damage Costs - externalities) 13,612$ 14,100$ 14,607$ 15,131$
19 System Operating and Maintence Costs 794$ 823$ 852$ 883$ 20 Depreciation Expense 1,169$ 1,169$ 1,169$ 1,169$ 21 Property Taxes -$ 683$ 708$ 733$ 22 Total Revenue Requirement 81,469$ 20,279$ 20,657$ 21,063$
23 Customer Non-Energy Revenues at proposed rates 138,391$ 138,391$ 138,391$ 138,391$
24 Revenue Excess (Deficiency) 56,922$ 118,112$ 117,734$ 117,328$ 25 NPV of annual revenue excess (deficiency) @ Overall Return 53,015$ 102,454$ 95,116$ 88,282$ 26 Cumulative NPV 53,015$ 155,469$ 250,585$ 338,867$

Northern States Power CompanyState of Minnesota Electric Jurisdiction
Docket No. E002/GR-15-826Exhibit___(AEH-1), Schedule 17
Page 5 of 11
Net Present Value of Cash Flows Attachment B
LineNo.
REVENUE REQUIREMENTS ANALYSIS:1 Total Cost234 Total cost:
5 Beginning Balance6 Depreciation Expense (including negative salvage)7 Ending Balance - Net Plant8 Average Net Plant
9 Tax Depreciation Rate10 Tax Depreciation Amount11 Book - Tax Depreciation Difference12 Cumulative Difference13 Accumulated Deferred Income Taxes (ADIT)14 Average ADIT
15 Rate Base
16 Return Requirement @ Pre-tax cost of capital17 Distribution Costs:18 Economic Development Net Donations
Societal Perspective - Net Benefit (Envrio Damage Costs - externalities)
19 System Operating and Maintence Costs20 Depreciation Expense21 Property Taxes22 Total Revenue Requirement
23 Customer Non-Energy Revenues at proposed rates
24 Revenue Excess (Deficiency)25 NPV of annual revenue excess (deficiency) @ Overall Return26 Cumulative NPV
Extension Extension Extension ExtensionYear No. Year No. Year No. Year No.
5 6 7 8
1,169$ 1,169$ 1,169$ 1,169$ 28,156$ 26,988$ 25,819$ 24,650$ 28,741$ 27,572$ 26,403$ 25,234$
5.713% 5.285% 4.888% 4.522%1,942$ 1,797$ 1,662$ 1,537$ (774)$ (628)$ (493)$ (369)$
(4,198)$ (4,827)$ (5,320)$ (5,689)$ (1,737)$ (1,997)$ (2,201)$ (2,353)$ (1,577)$ (1,867)$ (2,099)$ (2,277)$
27,164$ 25,705$ 24,304$ 22,957$
2,980$ 2,820$ 2,666$ 2,518$
15,674$ 16,237$ 16,820$ 17,424$ 915$ 947$ 981$ 1,017$
1,169$ 1,169$ 1,169$ 1,169$ 760$ 787$ 815$ 844$
21,497$ 21,960$ 22,451$ 22,972$
138,391$ 138,391$ 138,391$ 138,391$
116,894$ 116,431$ 115,940$ 115,419$ 81,918$ 75,993$ 70,478$ 65,345$
420,784$ 496,777$ 567,254$ 632,600$

Northern States Power CompanyState of Minnesota Electric Jurisdiction
Docket No. E002/GR-15-826Exhibit___(AEH-1), Schedule 17
Page 6 of 11
Net Present Value of Cash Flows Attachment B
LineNo.
REVENUE REQUIREMENTS ANALYSIS:1 Total Cost234 Total cost:
5 Beginning Balance6 Depreciation Expense (including negative salvage)7 Ending Balance - Net Plant8 Average Net Plant
9 Tax Depreciation Rate10 Tax Depreciation Amount11 Book - Tax Depreciation Difference12 Cumulative Difference13 Accumulated Deferred Income Taxes (ADIT)14 Average ADIT
15 Rate Base
16 Return Requirement @ Pre-tax cost of capital17 Distribution Costs:18 Economic Development Net Donations
Societal Perspective - Net Benefit (Envrio Damage Costs - externalities)
19 System Operating and Maintence Costs20 Depreciation Expense21 Property Taxes22 Total Revenue Requirement
23 Customer Non-Energy Revenues at proposed rates
24 Revenue Excess (Deficiency)25 NPV of annual revenue excess (deficiency) @ Overall Return26 Cumulative NPV
Extension Extension Extension ExtensionYear No. Year No. Year No. Year No.
9 10 11 12
1,169$ 1,169$ 1,169$ 1,169$ 23,481$ 22,313$ 21,144$ 19,975$ 24,066$ 22,897$ 21,728$ 20,559$
4.462% 4.461% 4.462% 4.461%1,517$ 1,517$ 1,517$ 1,517$ (348)$ (348)$ (348)$ (348)$
(6,037)$ (6,385)$ (6,733)$ (7,081)$ (2,497)$ (2,641)$ (2,786)$ (2,929)$ (2,425)$ (2,569)$ (2,713)$ (2,858)$
21,640$ 20,327$ 19,015$ 17,702$
2,374$ 2,230$ 2,086$ 1,942$
18,049$ 18,697$ 19,368$ 20,064$ 1,053$ 1,091$ 1,130$ 1,171$ 1,169$ 1,169$ 1,169$ 1,169$
875$ 906$ 939$ 972$ 23,520$ 24,093$ 24,692$ 25,317$
138,391$ 138,391$ 138,391$ 138,391$
114,871$ 114,298$ 113,699$ 113,074$ 60,571$ 56,132$ 52,005$ 48,169$
693,171$ 749,302$ 801,307$ 849,476$

Northern States Power CompanyState of Minnesota Electric Jurisdiction
Docket No. E002/GR-15-826Exhibit___(AEH-1), Schedule 17
Page 7 of 11
Net Present Value of Cash Flows Attachment B
LineNo.
REVENUE REQUIREMENTS ANALYSIS:1 Total Cost234 Total cost:
5 Beginning Balance6 Depreciation Expense (including negative salvage)7 Ending Balance - Net Plant8 Average Net Plant
9 Tax Depreciation Rate10 Tax Depreciation Amount11 Book - Tax Depreciation Difference12 Cumulative Difference13 Accumulated Deferred Income Taxes (ADIT)14 Average ADIT
15 Rate Base
16 Return Requirement @ Pre-tax cost of capital17 Distribution Costs:18 Economic Development Net Donations
Societal Perspective - Net Benefit (Envrio Damage Costs - externalities)
19 System Operating and Maintence Costs20 Depreciation Expense21 Property Taxes22 Total Revenue Requirement
23 Customer Non-Energy Revenues at proposed rates
24 Revenue Excess (Deficiency)25 NPV of annual revenue excess (deficiency) @ Overall Return26 Cumulative NPV
Extension Extension Extension ExtensionYear No. Year No. Year No. Year No.
13 14 15 16
1,169$ 1,169$ 1,169$ 1,169$ 18,806$ 17,638$ 16,469$ 15,300$ 19,391$ 18,222$ 17,053$ 15,884$
4.462% 4.461% 4.462% 4.461%1,517$ 1,517$ 1,517$ 1,517$ (348)$ (348)$ (348)$ (348)$
(7,430)$ (7,778)$ (8,126)$ (8,474)$ (3,074)$ (3,218)$ (3,362)$ (3,506)$ (3,002)$ (3,146)$ (3,290)$ (3,434)$
16,389$ 15,076$ 13,764$ 12,451$
1,798$ 1,654$ 1,510$ 1,366$
20,784$ 21,530$ 22,303$ 23,104$ 1,213$ 1,256$ 1,301$ 1,348$ 1,169$ 1,169$ 1,169$ 1,169$ 1,007$ 1,043$ 1,081$ 1,120$
25,971$ 26,652$ 27,364$ 28,106$
138,391$ 138,391$ 138,391$ 138,391$
112,420$ 111,738$ 111,027$ 110,285$ 44,603$ 41,290$ 38,211$ 35,350$
894,079$ 935,369$ 973,580$ 1,008,930$

Northern States Power CompanyState of Minnesota Electric Jurisdiction
Docket No. E002/GR-15-826Exhibit___(AEH-1), Schedule 17
Page 8 of 11
Net Present Value of Cash Flows Attachment B
LineNo.
REVENUE REQUIREMENTS ANALYSIS:1 Total Cost234 Total cost:
5 Beginning Balance6 Depreciation Expense (including negative salvage)7 Ending Balance - Net Plant8 Average Net Plant
9 Tax Depreciation Rate10 Tax Depreciation Amount11 Book - Tax Depreciation Difference12 Cumulative Difference13 Accumulated Deferred Income Taxes (ADIT)14 Average ADIT
15 Rate Base
16 Return Requirement @ Pre-tax cost of capital17 Distribution Costs:18 Economic Development Net Donations
Societal Perspective - Net Benefit (Envrio Damage Costs - externalities)
19 System Operating and Maintence Costs20 Depreciation Expense21 Property Taxes22 Total Revenue Requirement
23 Customer Non-Energy Revenues at proposed rates
24 Revenue Excess (Deficiency)25 NPV of annual revenue excess (deficiency) @ Overall Return26 Cumulative NPV
Extension Extension Extension ExtensionYear No. Year No. Year No. Year No.
17 18 19 20
1,169$ 1,169$ 1,169$ 1,169$ 14,131$ 12,963$ 11,794$ 10,625$ 14,716$ 13,547$ 12,378$ 11,209$
4.462% 4.461% 4.462% 4.461%1,517$ 1,517$ 1,517$ 1,517$ (348)$ (348)$ (348)$ (348)$
(8,822)$ (9,170)$ (9,518)$ (9,866)$ (3,650)$ (3,794)$ (3,938)$ (4,082)$ (3,578)$ (3,722)$ (3,866)$ (4,010)$
11,138$ 9,825$ 8,512$ 7,200$
1,222$ 1,078$ 934$ 790$
23,933$ 24,792$ 25,682$ 26,604$ 1,396$ 1,447$ 1,499$ 1,552$ 1,169$ 1,169$ 1,169$ 1,169$ 1,160$ 1,202$ 1,245$ 1,289$
28,880$ 29,687$ 30,528$ 31,405$
138,391$ 138,391$ 138,391$ 138,391$
109,511$ 108,704$ 107,863$ 106,986$ 32,692$ 30,224$ 27,932$ 25,803$
1,041,622$ 1,071,846$ 1,099,777$ 1,125,580$

Northern States Power CompanyState of Minnesota Electric Jurisdiction
Docket No. E002/GR-15-826Exhibit___(AEH-1), Schedule 17
Page 9 of 11
Net Present Value of Cash Flows Attachment B
LineNo.
REVENUE REQUIREMENTS ANALYSIS:1 Total Cost234 Total cost:
5 Beginning Balance6 Depreciation Expense (including negative salvage)7 Ending Balance - Net Plant8 Average Net Plant
9 Tax Depreciation Rate10 Tax Depreciation Amount11 Book - Tax Depreciation Difference12 Cumulative Difference13 Accumulated Deferred Income Taxes (ADIT)14 Average ADIT
15 Rate Base
16 Return Requirement @ Pre-tax cost of capital17 Distribution Costs:18 Economic Development Net Donations
Societal Perspective - Net Benefit (Envrio Damage Costs - externalities)
19 System Operating and Maintence Costs20 Depreciation Expense21 Property Taxes22 Total Revenue Requirement
23 Customer Non-Energy Revenues at proposed rates
24 Revenue Excess (Deficiency)25 NPV of annual revenue excess (deficiency) @ Overall Return26 Cumulative NPV
Extension Extension Extension ExtensionYear No. Year No. Year No. Year No.
21 22 23 24
1,169$ 1,169$ 1,169$ 1,169$ 9,456$ 8,288$ 7,119$ 5,950$
10,041$ 8,872$ 7,703$ 6,534$
2.231%759$ 410$ 1,169$ 1,169$ 1,169$
(9,456)$ (8,288)$ (7,119)$ (5,950)$ (3,912)$ (3,429)$ (2,945)$ (2,462)$ (3,997)$ (3,670)$ (3,187)$ (2,703)$
6,044$ 5,202$ 4,516$ 3,831$
663$ 571$ 495$ 420$
27,559$ 28,549$ 29,574$ 30,635$ 1,608$ 1,666$ 1,726$ 1,788$ 1,169$ 1,169$ 1,169$ 1,169$ 1,336$ 1,384$ 1,433$ 1,485$
32,335$ 33,338$ 34,397$ 35,497$
138,391$ 138,391$ 138,391$ 138,391$ .
106,056$ 105,053$ 103,994$ 102,894$ 23,823$ 21,978$ 20,263$ 18,672$
1,149,403$ 1,171,381$ 1,191,644$ 1,210,316$

Northern States Power CompanyState of Minnesota Electric Jurisdiction
Docket No. E002/GR-15-826Exhibit___(AEH-1), Schedule 17
Page 10 of 11
Net Present Value of Cash Flows Attachment B
LineNo.
REVENUE REQUIREMENTS ANALYSIS:1 Total Cost234 Total cost:
5 Beginning Balance6 Depreciation Expense (including negative salvage)7 Ending Balance - Net Plant8 Average Net Plant
9 Tax Depreciation Rate10 Tax Depreciation Amount11 Book - Tax Depreciation Difference12 Cumulative Difference13 Accumulated Deferred Income Taxes (ADIT)14 Average ADIT
15 Rate Base
16 Return Requirement @ Pre-tax cost of capital17 Distribution Costs:18 Economic Development Net Donations
Societal Perspective - Net Benefit (Envrio Damage Costs - externalities)
19 System Operating and Maintence Costs20 Depreciation Expense21 Property Taxes22 Total Revenue Requirement
23 Customer Non-Energy Revenues at proposed rates
24 Revenue Excess (Deficiency)25 NPV of annual revenue excess (deficiency) @ Overall Return26 Cumulative NPV
Extension Extension Extension ExtensionYear No. Year No. Year No. Year No.
25 26 27 28
1,169$ 1,169$ 1,169$ 1,169$ 4,781$ 3,613$ 2,444$ 1,275$ 5,366$ 4,197$ 3,028$ 1,859$
1,169$ 1,169$ 1,169$ 1,169$ (4,781)$ (3,613)$ (2,444)$ (1,275)$ (1,978)$ (1,494)$ (1,011)$ (527)$ (2,220)$ (1,736)$ (1,253)$ (769)$
3,146$ 2,461$ 1,775$ 1,090$
345$ 270$ 195$ 120$
31,735$ 32,874$ 34,055$ 35,277$ 1,852$ 1,918$ 1,987$ 2,058$ 1,169$ 1,169$ 1,169$ 1,169$ 1,538$ 1,593$ 1,651$ 1,710$
36,639$ 37,825$ 39,056$ 40,334$
138,391$ 138,391$ 138,391$ 138,391$
101,752$ 100,566$ 99,335$ 98,057$ 17,198$ 15,831$ 14,563$ 13,389$
1,227,514$ 1,243,344$ 1,257,908$ 1,271,297$
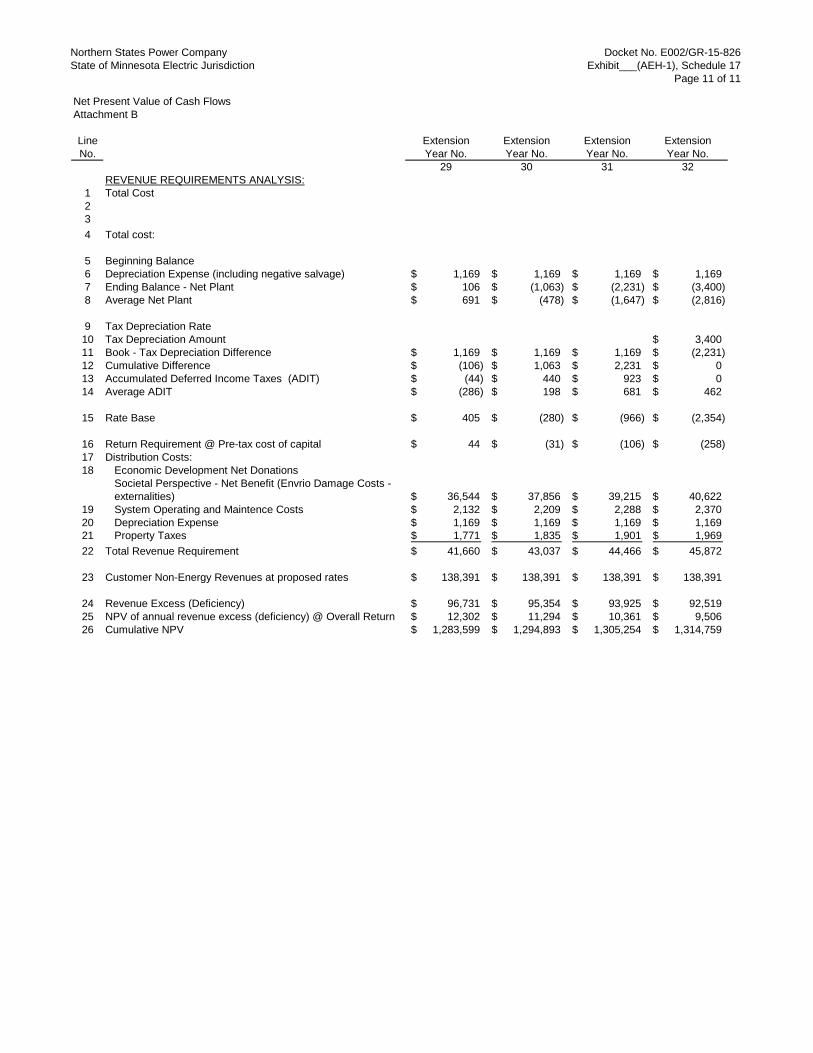
Northern States Power CompanyState of Minnesota Electric Jurisdiction
Docket No. E002/GR-15-826Exhibit___(AEH-1), Schedule 17
Page 11 of 11
Net Present Value of Cash Flows Attachment B
LineNo.
REVENUE REQUIREMENTS ANALYSIS:1 Total Cost234 Total cost:
5 Beginning Balance6 Depreciation Expense (including negative salvage)7 Ending Balance - Net Plant8 Average Net Plant
9 Tax Depreciation Rate10 Tax Depreciation Amount11 Book - Tax Depreciation Difference12 Cumulative Difference13 Accumulated Deferred Income Taxes (ADIT)14 Average ADIT
15 Rate Base
16 Return Requirement @ Pre-tax cost of capital17 Distribution Costs:18 Economic Development Net Donations
Societal Perspective - Net Benefit (Envrio Damage Costs - externalities)
19 System Operating and Maintence Costs20 Depreciation Expense21 Property Taxes22 Total Revenue Requirement
23 Customer Non-Energy Revenues at proposed rates
24 Revenue Excess (Deficiency)25 NPV of annual revenue excess (deficiency) @ Overall Return26 Cumulative NPV
Extension Extension Extension ExtensionYear No. Year No. Year No. Year No.
29 30 31 32
1,169$ 1,169$ 1,169$ 1,169$ 106$ (1,063)$ (2,231)$ (3,400)$ 691$ (478)$ (1,647)$ (2,816)$
3,400$ 1,169$ 1,169$ 1,169$ (2,231)$ (106)$ 1,063$ 2,231$ 0$ (44)$ 440$ 923$ 0$
(286)$ 198$ 681$ 462$
405$ (280)$ (966)$ (2,354)$
44$ (31)$ (106)$ (258)$
36,544$ 37,856$ 39,215$ 40,622$ 2,132$ 2,209$ 2,288$ 2,370$ 1,169$ 1,169$ 1,169$ 1,169$ 1,771$ 1,835$ 1,901$ 1,969$
41,660$ 43,037$ 44,466$ 45,872$
138,391$ 138,391$ 138,391$ 138,391$
96,731$ 95,354$ 93,925$ 92,519$ 12,302$ 11,294$ 10,361$ 9,506$
1,283,599$ 1,294,893$ 1,305,254$ 1,314,759$

Northern States Power Company Docket No. E002/GR-15-826 State of Minnesota Electric Jurisdiction Exhibit___(AEH-1), Schedule 18
Page 1 of 11
Non-Asset Based Trading Cost Study Introduction Northern States Power Company, doing business as Xcel Energy (Xcel Energy, NSPM, or the Company) agreed in its 2011 test year general electric rate case (Docket No. E002/GR-10-971 or 2010 Rate Case) to two items regarding non-asset based trading:
“The Company has agreed to submit an incremental and fully-allocated cost study of non-asset-based trading with its next rate case;”1 and
“…would remove non-asset based margins and their associated embedded costs from the revenue requirement…”2
This report summarizes the cost study undertaken by the Company to determine the fully allocated cost of non-asset based trading activity. Background There are two main categories of short-term wholesale trading; asset based transactions and non-asset based transactions. Asset based transactions involve the sales of excess energy or capacity from Company owned generation assets. Non-asset based transactions are undertaken as energy market opportunities to make revenues and are unrelated to meeting the needs of the Native Load customers (retail customers and requirements wholesale customers taking service at cost-based rates). Non-asset based trading transactions are those in which:
• Energy or capacity is purchased from a third party but is unrelated to serving native load
• That energy or capacity is resold for profit The costs that are being examined in this study are related exclusively to non-asset based trading. Prior to the 2010 Rate Case, the Company shared non-asset based margins with customers. In its 2009 test year general electric rate case (Docket No. E002/GR-08-
1 Docket No. E002/GR-10-971 ALJ Report, Findings of Fact, February 22, 2012; ALJ Findings 278 &315 2 Docket No. E002/GR-10-971 PUC Findings of Fact, Conclusions and Order, May 14, 2012; page 9
Northern States Power Company Docket No. E002/GR-15-826 State of Minnesota Electric Jurisdiction Exhibit___(AEH-1), Schedule 18
Page 2 of 11
1065 or 2008 Rate Case), the Company committed to perform both an incremental and fully distributed cost study of non-asset based trading activities as part of its next general electric rate case application. Therefore, the 2010 Rate Case included the first such study. In the settlement of the 2010 Rate Case proceedings, the Company agreed to change the ratemaking treatment of non-asset based trading margins: the fully allocated cost of non-asset based trading activity is now excluded from the Company’s revenue requirements, and the non-asset based trading margins are retained by the Company. This study provides support for the fully allocated cost adjustment made for the 2016 test year. In compliance with the requirements of the 2010 Rate Case order, an incremental cost study is also provided as a part of this report. However, as the Company no longer requests incremental cost treatment pursuant to the Settlement Agreement, the Company proposes that the incremental cost study requirement be terminated after this rate case. Definitions Incremental Costs In developing these studies, the Company has defined incremental costs as those costs that would cease to be incurred if the Company stopped performing non-asset based trading transactions. Fully Allocated Costs The definition that the Company is using to determine fully distributed costs includes the incremental costs along with a reasonable contribution of common overhead costs. Incremental Costs The first step taken to identify the incremental costs was to identify all expenses that are booked to the non-asset based trading account. Each cost has been reviewed to determine if it is directly incurred as a result of non-asset based trading activities. The amounts in these accounts fall into three categories:
1. Exclusively related labor 2. Labor-related overhead 3. Non-exclusively related
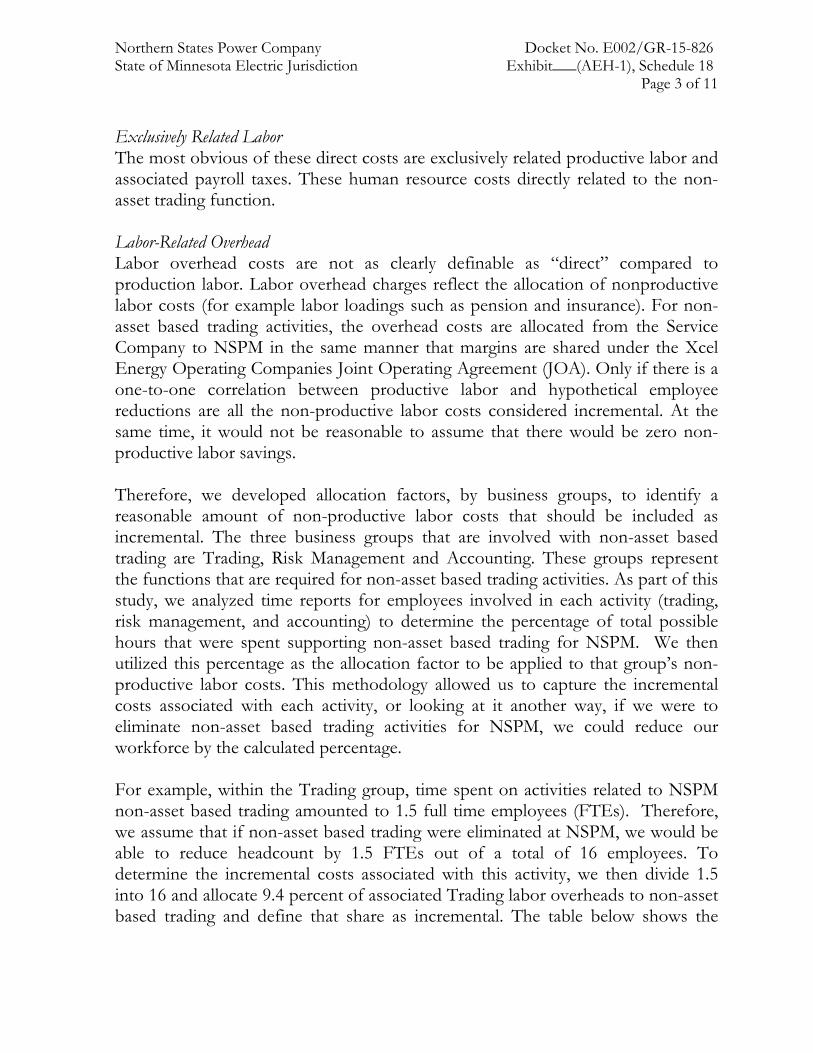
Northern States Power Company Docket No. E002/GR-15-826 State of Minnesota Electric Jurisdiction Exhibit___(AEH-1), Schedule 18
Page 3 of 11
Exclusively Related Labor The most obvious of these direct costs are exclusively related productive labor and associated payroll taxes. These human resource costs directly related to the non-asset trading function. Labor-Related Overhead Labor overhead costs are not as clearly definable as “direct” compared to production labor. Labor overhead charges reflect the allocation of nonproductive labor costs (for example labor loadings such as pension and insurance). For non-asset based trading activities, the overhead costs are allocated from the Service Company to NSPM in the same manner that margins are shared under the Xcel Energy Operating Companies Joint Operating Agreement (JOA). Only if there is a one-to-one correlation between productive labor and hypothetical employee reductions are all the non-productive labor costs considered incremental. At the same time, it would not be reasonable to assume that there would be zero non-productive labor savings. Therefore, we developed allocation factors, by business groups, to identify a reasonable amount of non-productive labor costs that should be included as incremental. The three business groups that are involved with non-asset based trading are Trading, Risk Management and Accounting. These groups represent the functions that are required for non-asset based trading activities. As part of this study, we analyzed time reports for employees involved in each activity (trading, risk management, and accounting) to determine the percentage of total possible hours that were spent supporting non-asset based trading for NSPM. We then utilized this percentage as the allocation factor to be applied to that group’s non-productive labor costs. This methodology allowed us to capture the incremental costs associated with each activity, or looking at it another way, if we were to eliminate non-asset based trading activities for NSPM, we could reduce our workforce by the calculated percentage. For example, within the Trading group, time spent on activities related to NSPM non-asset based trading amounted to 1.5 full time employees (FTEs). Therefore, we assume that if non-asset based trading were eliminated at NSPM, we would be able to reduce headcount by 1.5 FTEs out of a total of 16 employees. To determine the incremental costs associated with this activity, we then divide 1.5 into 16 and allocate 9.4 percent of associated Trading labor overheads to non-asset based trading and define that share as incremental. The table below shows the
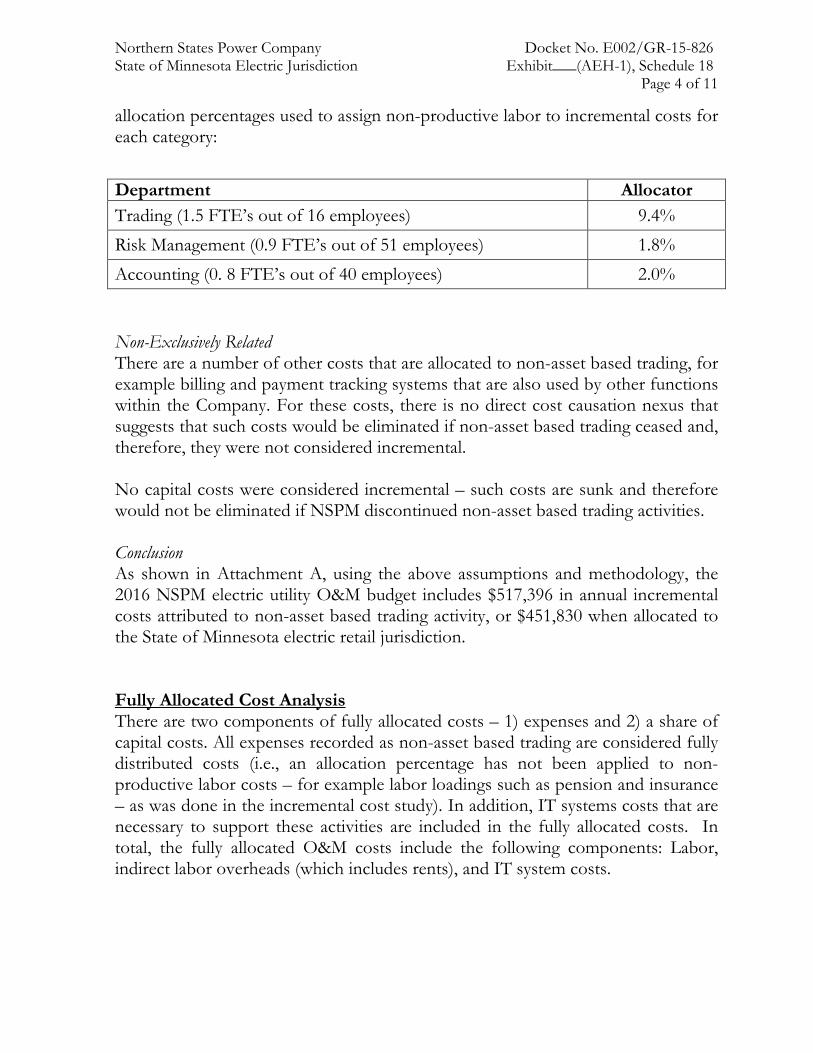
Northern States Power Company Docket No. E002/GR-15-826 State of Minnesota Electric Jurisdiction Exhibit___(AEH-1), Schedule 18
Page 4 of 11
allocation percentages used to assign non-productive labor to incremental costs for each category:
Department Allocator Trading (1.5 FTE’s out of 16 employees) 9.4%
Risk Management (0.9 FTE’s out of 51 employees) 1.8%
Accounting (0. 8 FTE’s out of 40 employees) 2.0% Non-Exclusively Related There are a number of other costs that are allocated to non-asset based trading, for example billing and payment tracking systems that are also used by other functions within the Company. For these costs, there is no direct cost causation nexus that suggests that such costs would be eliminated if non-asset based trading ceased and, therefore, they were not considered incremental. No capital costs were considered incremental – such costs are sunk and therefore would not be eliminated if NSPM discontinued non-asset based trading activities. Conclusion As shown in Attachment A, using the above assumptions and methodology, the 2016 NSPM electric utility O&M budget includes $517,396 in annual incremental costs attributed to non-asset based trading activity, or $451,830 when allocated to the State of Minnesota electric retail jurisdiction. Fully Allocated Cost Analysis There are two components of fully allocated costs – 1) expenses and 2) a share of capital costs. All expenses recorded as non-asset based trading are considered fully distributed costs (i.e., an allocation percentage has not been applied to non-productive labor costs – for example labor loadings such as pension and insurance – as was done in the incremental cost study). In addition, IT systems costs that are necessary to support these activities are included in the fully allocated costs. In total, the fully allocated O&M costs include the following components: Labor, indirect labor overheads (which includes rents), and IT system costs.
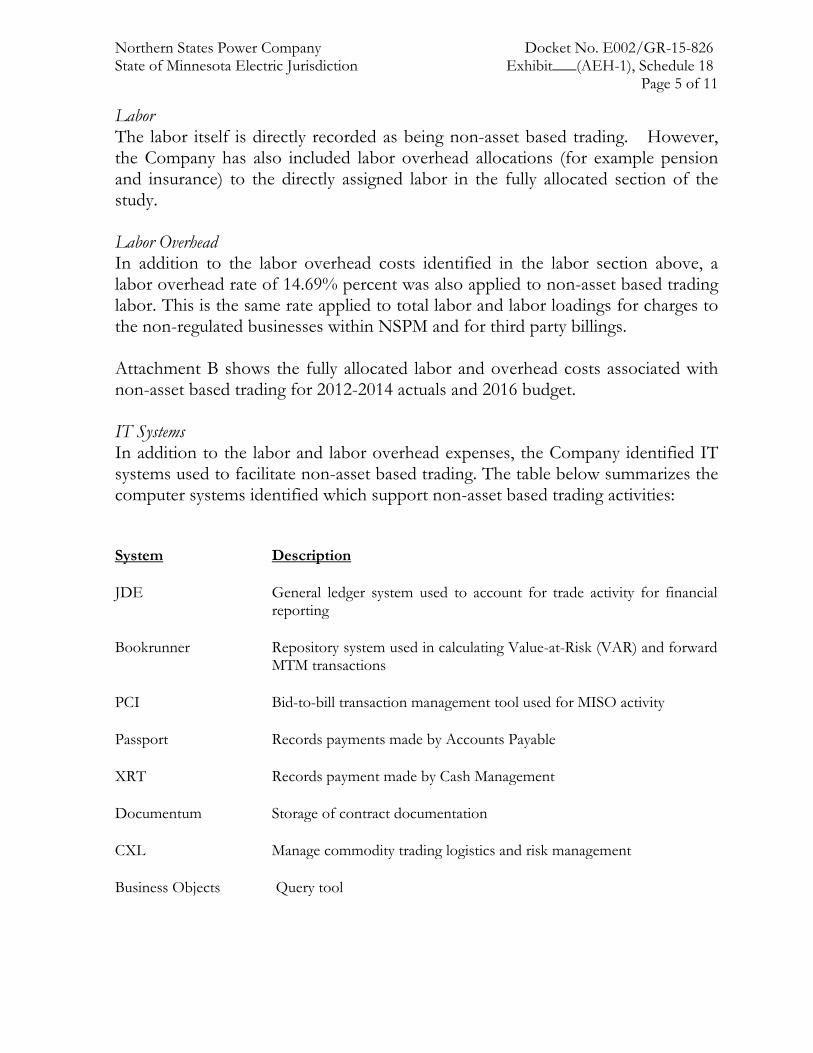
Northern States Power Company Docket No. E002/GR-15-826 State of Minnesota Electric Jurisdiction Exhibit___(AEH-1), Schedule 18
Page 5 of 11
Labor The labor itself is directly recorded as being non-asset based trading. However, the Company has also included labor overhead allocations (for example pension and insurance) to the directly assigned labor in the fully allocated section of the study. Labor Overhead In addition to the labor overhead costs identified in the labor section above, a labor overhead rate of 14.69% percent was also applied to non-asset based trading labor. This is the same rate applied to total labor and labor loadings for charges to the non-regulated businesses within NSPM and for third party billings. Attachment B shows the fully allocated labor and overhead costs associated with non-asset based trading for 2012-2014 actuals and 2016 budget. IT Systems In addition to the labor and labor overhead expenses, the Company identified IT systems used to facilitate non-asset based trading. The table below summarizes the computer systems identified which support non-asset based trading activities:
System Description
JDE General ledger system used to account for trade activity for financial reporting
Bookrunner Repository system used in calculating Value-at-Risk (VAR) and forward MTM transactions
PCI Bid-to-bill transaction management tool used for MISO activity
Passport Records payments made by Accounts Payable
XRT Records payment made by Cash Management
Documentum Storage of contract documentation
CXL Manage commodity trading logistics and risk management
Business Objects Query tool
Northern States Power Company Docket No. E002/GR-15-826 State of Minnesota Electric Jurisdiction Exhibit___(AEH-1), Schedule 18
Page 6 of 11
IT System O&M Expense – An analysis was conducted to determine the amount of IT System O&M expense is related to non-asset based trading. First, for each IT system listed above, the amount of O&M expense assigned to NSPM was identified. Then the portion of the NSPM IT system O&M expense allocated to non-asset based trading was calculated based upon the Non-Asset Revenue Percent (a ratio of NSPM non-asset based trading revenue to NSPM Electric Utility revenue). Please see the top half of Attachment C for the IT system O&M expense assigned to non-asset based trading for 2013 and 2014 actual and the 2015 and 2016 budgets. IT System Capital Revenue Requirements – An analysis was also conducted to determine the IT system capital revenue requirements associated with non-asset based trading. First, the rate base associated with the above listed IT systems was determined and the total 2016 budget rate base and depreciation expense (capital costs) for the above listed IT systems was calculated. Second, the Non-Asset Revenue Percent was applied to the capital costs to calculate the IT system capital costs attributable to non-asset based trading. (See the bottom half of Attachment C.) Third, the resulting rate base and depreciation expense was used to calculate the 2016 test year revenue requirements related to non-asset based trading. Attachment D shows the 2016 IT systems capital revenue requirement calculation. Conclusion As shown in Attachment E, using the above described assumptions and methodology, the 2016 budget includes $1,127,831 in annual fully allocated costs attributed to non-asset based trading activity for NSPM and $984,910 associated with the State of Minnesota electric retail jurisdiction.

Northern States Power Company Docket No. E002/GR-15-826 State of Minnesota Electric Jurisdiction Exhibit___(AEH-1), Schedule 18
Page 7 of 11
Northern States Power CompanySummary of Non-Asset Based Trading Costs Attachment AIncremental Costs
NSPM Incremental O&M Expenses 2012 2013 2014 Three Year Avg 2016 BudgetTrading 365,231$ 376,554$ 431,790$ 391,192$ 311,593$ Risk 89,919$ 124,614$ 146,791$ 120,442$ 148,585$ Accounting 34,997$ 52,845$ 32,334$ 40,059$ 57,218$
Total Incremental O&M Expenses 490,147$ 554,014$ 610,916$ 551,692$ 517,396$
Minnesota Jurisdiction Incremental O&M Expenses 2012 2013 2014 Three Year Avg 2016 Budget
Trading 320,947$ 330,298$ 377,987$ 343,077$ 272,107$ Risk 79,017$ 109,307$ 128,500$ 105,608$ 129,756$ Accounting 30,753$ 46,353$ 28,305$ 35,137$ 49,967$
Total Incremental O&M Expenses 430,716$ 485,958$ 534,792$ 483,822$ 451,830$
State of MN Jurisdictional Allocation Energy MN Jurisdictional Allocator 87.8749% 87.7158% 87.5394% 87.3278%

Northern States Power Company Docket No. E002/GR-15-826 State of Minnesota Electric Jurisdiction Exhibit___(AEH-1), Schedule 18
Page 8 of 11
Northern States Power CompanySummary of Non-Asset Based Trading Costs Attachment BFully Allocated Costs
NSPM O&M Expenses 2012 2013 2014 Three Year Avg 2016 BudgetTrading 773,176$ 737,274$ 787,449$ 765,966$ 514,992$ Risk 159,852$ 207,912$ 245,305$ 204,356$ 255,125$ Accounting 59,675$ 79,227$ 52,045$ 63,649$ 228,720$ Indirect Labor Overhead 98,689$ 100,819$ 177,587$ 125,699$ 109,196$
Total Fully Allocated O&M Expenses 1,091,393$ 1,125,232$ 1,262,387$ 1,159,671$ 1,108,033$
State of Minnesota O&M Expenses 2012 2013 2014 Three Year Avg 2016 BudgetTrading 679,428$ 646,705$ 689,328$ 671,821$ 449,731$ Risk 140,470$ 182,372$ 214,739$ 179,193$ 222,795$ Accounting 52,440$ 69,494$ 45,560$ 55,831$ 199,736$ Indirect Labor Overhead 86,723$ 88,434$ 155,459$ 110,205$ 95,358$
Total Fully Allocated O&M Expenses 959,061$ 987,006$ 1,105,086$ 1,017,051$ 967,621$
State of Minnesota Jurisdictional Allocation Energy MN Jurisdictional Allocator 87.8749% 87.7158% 87.5394% 87.3278%
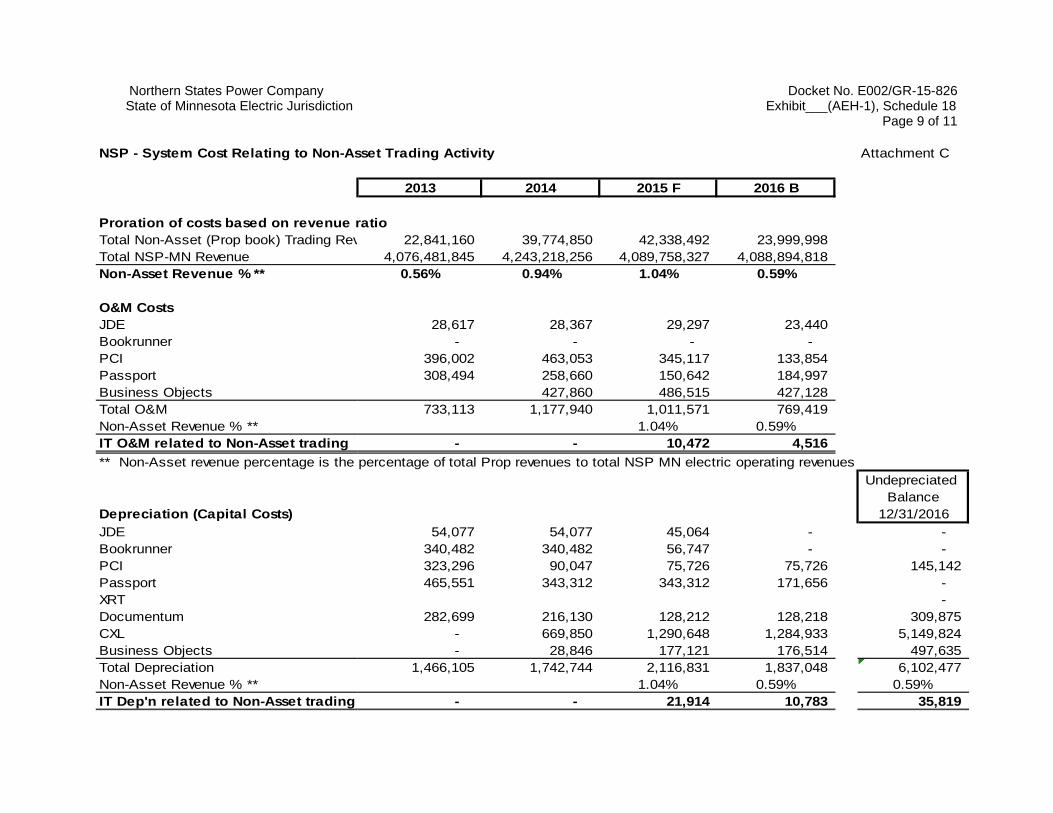
Northern States Power Company Docket No. E002/GR-15-826 State of Minnesota Electric Jurisdiction Exhibit___(AEH-1), Schedule 18
Page 9 of 11
NSP - System Cost Relating to Non-Asset Trading Activity Attachment C
2013 2014 2015 F 2016 B
Proration of costs based on revenue ratioTotal Non-Asset (Prop book) Trading Rev 22,841,160 39,774,850 42,338,492 23,999,998 Total NSP-MN Revenue 4,076,481,845 4,243,218,256 4,089,758,327 4,088,894,818Non-Asset Revenue % ** 0.56% 0.94% 1.04% 0.59%
O&M CostsJDE 28,617 28,367 29,297 23,440 Bookrunner - - - - PCI 396,002 463,053 345,117 133,854 Passport 308,494 258,660 150,642 184,997 Business Objects 427,860 486,515 427,128 Total O&M 733,113 1,177,940 1,011,571 769,419 Non-Asset Revenue % ** 1.04% 0.59%IT O&M related to Non-Asset trading - - 10,472 4,516 ** Non-Asset revenue percentage is the percentage of total Prop revenues to total NSP MN electric operating revenues
Undepreciated Balance
Depreciation (Capital Costs) 12/31/2016JDE 54,077 54,077 45,064 - - Bookrunner 340,482 340,482 56,747 - - PCI 323,296 90,047 75,726 75,726 145,142 Passport 465,551 343,312 343,312 171,656 - XRT - Documentum 282,699 216,130 128,212 128,218 309,875 CXL - 669,850 1,290,648 1,284,933 5,149,824 Business Objects - 28,846 177,121 176,514 497,635 Total Depreciation 1,466,105 1,742,744 2,116,831 1,837,048 6,102,477 Non-Asset Revenue % ** 1.04% 0.59% 0.59%IT Dep'n related to Non-Asset trading - - 21,914 10,783 35,819
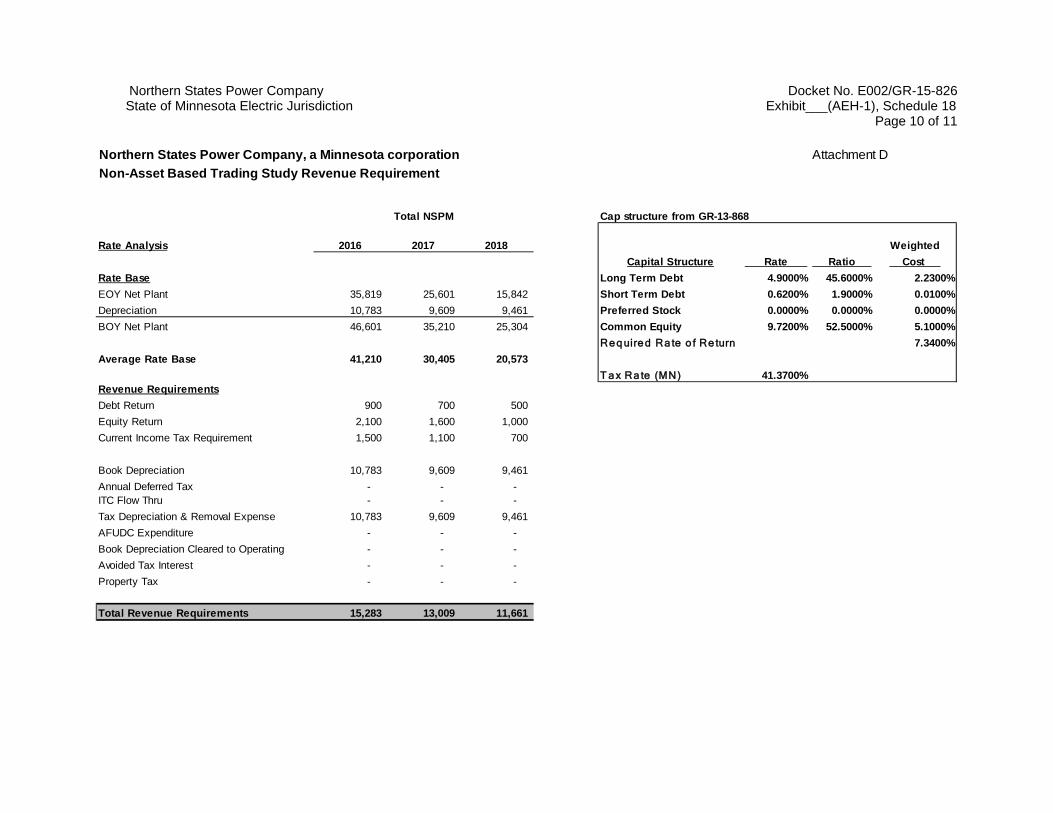
Northern States Power Company Docket No. E002/GR-15-826 State of Minnesota Electric Jurisdiction Exhibit___(AEH-1), Schedule 18
Page 10 of 11
Northern States Power Company, a Minnesota corporation Attachment DNon-Asset Based Trading Study Revenue Requirement
Cap structure from GR-13-868
Rate Analysis 2016 2017 2018 WeightedCapital Structure Rate Ratio Cost
Rate Base Long Term Debt 4.9000% 45.6000% 2.2300%EOY Net Plant 35,819 25,601 15,842 Short Term Debt 0.6200% 1.9000% 0.0100%Depreciation 10,783 9,609 9,461 Preferred Stock 0.0000% 0.0000% 0.0000%BOY Net Plant 46,601 35,210 25,304 Common Equity 9.7200% 52.5000% 5.1000%
Re q uire d Ra te o f Re turn 7.3400%Average Rate Base 41,210 30,405 20,573
T a x Ra te (MN) 41.3700%Revenue RequirementsDebt Return 900 700 500 Equity Return 2,100 1,600 1,000 Current Income Tax Requirement 1,500 1,100 700
Book Depreciation 10,783 9,609 9,461 Annual Deferred Tax - - - ITC Flow Thru - - - Tax Depreciation & Removal Expense 10,783 9,609 9,461 AFUDC Expenditure - - - Book Depreciation Cleared to Operating - - - Avoided Tax Interest - - - Property Tax - - -
Total Revenue Requirements 15,283 13,009 11,661
Total NSPM
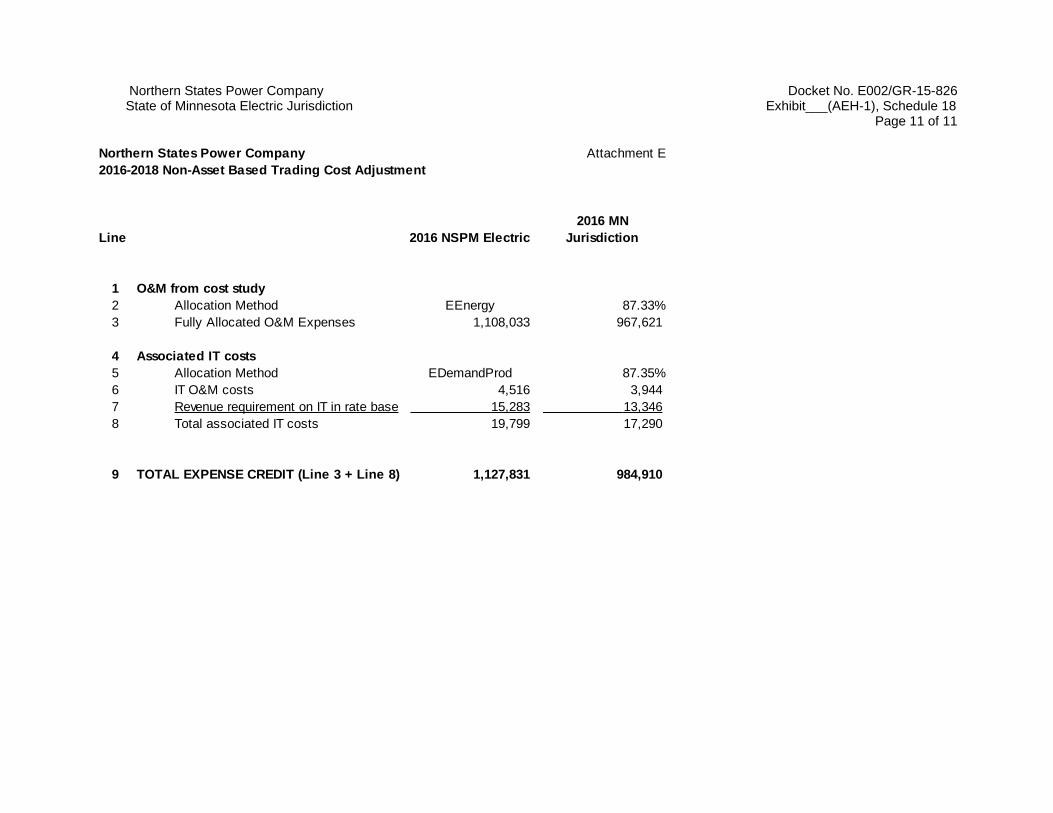
Northern States Power Company Docket No. E002/GR-15-826 State of Minnesota Electric Jurisdiction Exhibit___(AEH-1), Schedule 18
Page 11 of 11
Northern States Power Company Attachment E2016-2018 Non-Asset Based Trading Cost Adjustment
Line 2016 NSPM Electric2016 MN
Jurisdiction
1 O&M from cost study2 Allocation Method EEnergy 87.33%3 Fully Allocated O&M Expenses 1,108,033 967,621
4 Associated IT costs5 Allocation Method EDemandProd 87.35%6 IT O&M costs 4,516 3,944 7 Revenue requirement on IT in rate base 15,283 13,346 8 Total associated IT costs 19,799 17,290
9 TOTAL EXPENSE CREDIT (Line 3 + Line 8) 1,127,831 984,910
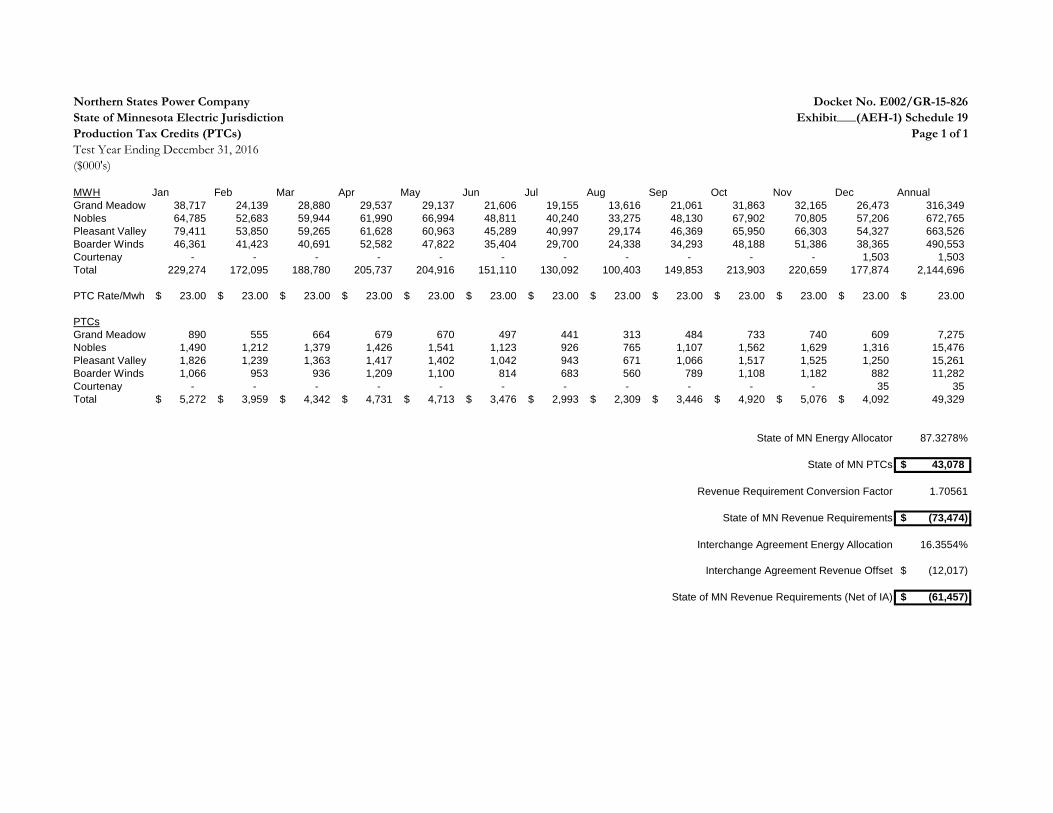
Northern States Power Company Docket No. E002/GR-15-826State of Minnesota Electric Jurisdiction Exhibit___(AEH-1) Schedule 19Production Tax Credits (PTCs) Page 1 of 1Test Year Ending December 31, 2016($000's)
MWH Jan Feb Mar Apr May Jun Jul Aug Sep Oct Nov Dec AnnualGrand Meadow 38,717 24,139 28,880 29,537 29,137 21,606 19,155 13,616 21,061 31,863 32,165 26,473 316,349 Nobles 64,785 52,683 59,944 61,990 66,994 48,811 40,240 33,275 48,130 67,902 70,805 57,206 672,765 Pleasant Valley 79,411 53,850 59,265 61,628 60,963 45,289 40,997 29,174 46,369 65,950 66,303 54,327 663,526 Boarder Winds 46,361 41,423 40,691 52,582 47,822 35,404 29,700 24,338 34,293 48,188 51,386 38,365 490,553 Courtenay - - - - - - - - - - - 1,503 1,503 Total 229,274 172,095 188,780 205,737 204,916 151,110 130,092 100,403 149,853 213,903 220,659 177,874 2,144,696
PTC Rate/Mwh 23.00$ 23.00$ 23.00$ 23.00$ 23.00$ 23.00$ 23.00$ 23.00$ 23.00$ 23.00$ 23.00$ 23.00$ 23.00$
PTCsGrand Meadow 890 555 664 679 670 497 441 313 484 733 740 609 7,275 Nobles 1,490 1,212 1,379 1,426 1,541 1,123 926 765 1,107 1,562 1,629 1,316 15,476 Pleasant Valley 1,826 1,239 1,363 1,417 1,402 1,042 943 671 1,066 1,517 1,525 1,250 15,261 Boarder Winds 1,066 953 936 1,209 1,100 814 683 560 789 1,108 1,182 882 11,282 Courtenay - - - - - - - - - - - 35 35 Total 5,272$ 3,959$ 4,342$ 4,731$ 4,713$ 3,476$ 2,993$ 2,309$ 3,446$ 4,920$ 5,076$ 4,092$ 49,329
State of MN Energy Allocator 87.3278%
State of MN PTCs 43,078$
Revenue Requirement Conversion Factor 1.70561
State of MN Revenue Requirements (73,474)$
Interchange Agreement Energy Allocation 16.3554%
Interchange Agreement Revenue Offset (12,017)$
State of MN Revenue Requirements (Net of IA) (61,457)$

Northern States Power Docket No. E002/GR-15-826State of Minnesota Electric Jurisdiction
Annual Revenue RequirementMonticello LCM/EPU Project Return
Weighted2016 Capital Structure Rates Ratios Costs
Long Term Debt 4.81% 46.24% 2.22%Short Term Debt 1.84% 1.26% 0.02%Preferred Stock 0.00% 0.00% 0.00%Common Equity 10.00% 52.50% 5.25%
Required Rate of Return 7.49%
Tax Rate (MN) 41.3700%IRS Pro-Rate Method Avg Bal Factor 26.8379%
Minnesota Demand Allocation 87.3461%
CostFull Return Portion 415,000
Zero Return Portion 335,718 44.7196% = Pro Rate Factor750,718
2016 Revenue Requirements(000's) Company Total MN Jur Company Total MN JurPlant Investment 723,210 631,696 323,417 282,492 RWIP 27,508 24,027 12,302 10,745 Total Project Spend 750,718 655,723 335,718 293,237 Depreciation Reserve 162,155 141,636 72,515 63,339 CWIP - - - - Accumulated Deferred Taxes 137,846 120,403 61,644 53,844 Total Rate Base 450,718 393,684 201,559 176,054
- Average Rate Base 450,718 393,684 201,559 176,054
- - Tax Preferenced Items: - - Tax Depreciation & Removal Expense 26,528 23,171 - - Avoided Tax Interest - - - -
- - - Debt Return 10,096 8,819 4,515 3,944 Equity Return 23,663 20,668 10,582 9,243 Current Income Tax Requirement 23,757 20,751 7,467 6,522
- - - Book Depreciation 41,303 36,076 - - Annual Deferred Tax (4,769) (4,165) - - AFUDC Expenditure - - - - Property Taxes - - - Total Revenue Requirements 94,050 82,149 22,563 19,708
Wisconsin Company Demand 15.8651%
IA Revvenue Offset 3,127
Total Revenue Requirements (Net of IA) 16,582
Full Project RR Zero Return Adjustment
Exhibit___(AEH-1), Schedule 20Page 1 of 1

Northern States Power Docket No. E002/GR-15-826State of Minnesota Electric Jurisdiction
Annual Revenue RequirementPrairie Island EPU Amortization and Debt Only Return
Weighted Weighted2016 Capital Structure Rates Ratios Costs Rates Ratios Costs
Long Term Debt 4.81% 46.24% 2.22% 4.81% 46.24% 2.22%Short Term Debt 1.84% 1.26% 0.02% 1.84% 1.26% 0.02%Preferred Stock 0.00% 0.00% 0.00% 0.00% 0.00% 0.00%Common Equity 10.00% 52.50% 5.25% 9.72% 52.50% 5.10%
Required Rate of Return 7.49% 7.34%
Tax Rate (MN) 41.3700%IRS Pro-Rate Method Avg Bal Factor 26.8379%
Minnesota Demand Allocation 74.3399%
2016 Revenue Requirements(000's) Company Total MN Jur Company Total MN JurPlant Investment 78,885 58,643 78,885 58,643 Depreciation Reserve 9,699 7,210 9,699 7,210 CWIP - - - - Accumulated Deferred Taxes 28,283 21,026 28,709 21,342 Total Rate Base 40,903 30,407 40,477 30,091
- Average Rate Base 40,903 30,407 40,477 30,091
- Tax Preferenced Items: - - Tax Depreciation & Removal Expense - - - Avoided Tax Interest - - - -
- - Debt Return 916 681 - - Equity Return 2,086 1,551 2,125 1,580 Current Income Tax Requirement 3,090 2,297 1,499 1,115
- - Book Depreciation 3,880 2,884 - - Annual Deferred Tax (1,586) (1,179) - - AFUDC Expenditure - - - - Property Taxes - - Total Revenue Requirements 8,386 6,234 3,625 2,694
Net Revenue Requirement 4,762 3,540
As Filed Last Authorized ROE
Full Project RR Zero Equity Return Adj
Exhibit___(AEH-1) Schedule 21Page 1 of 1
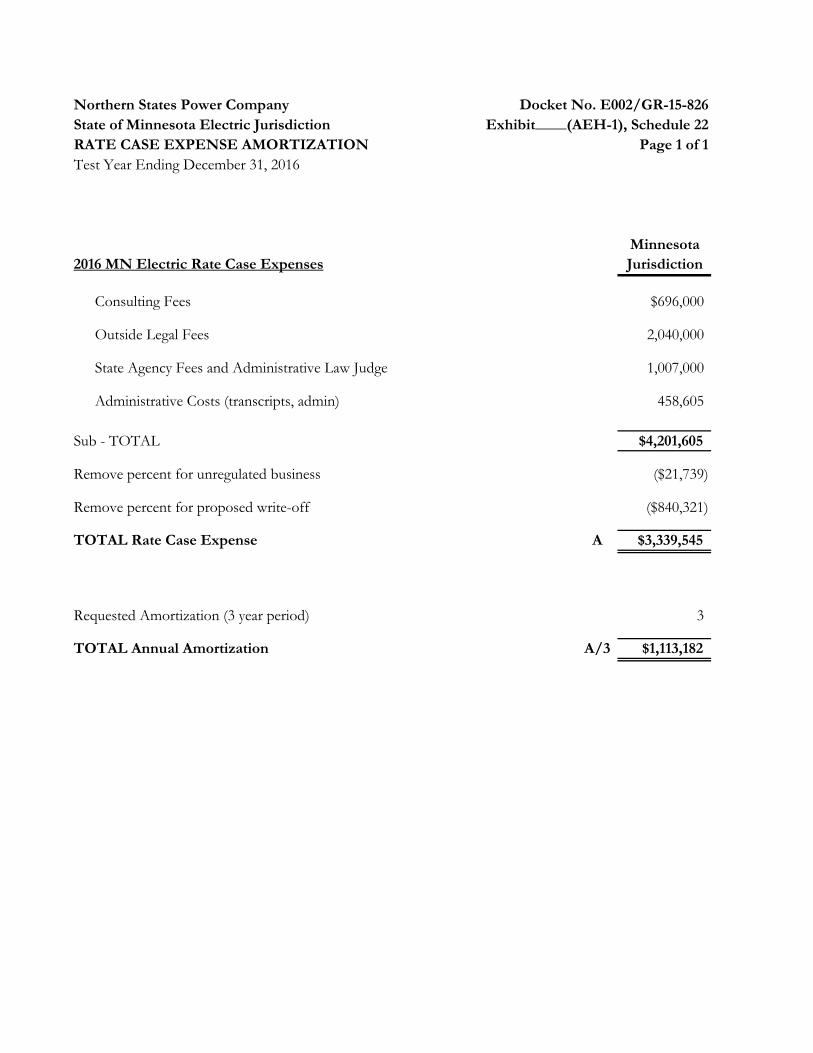
Northern States Power Company Docket No. E002/GR-15-826State of Minnesota Electric Jurisdiction Exhibit____(AEH-1), Schedule 22
Page 1 of 1Test Year Ending December 31, 2016
Minnesota2016 MN Electric Rate Case Expenses Jurisdiction
Consulting Fees $696,000
Outside Legal Fees 2,040,000
State Agency Fees and Administrative Law Judge 1,007,000
Administrative Costs (transcripts, admin) 458,605
Sub - TOTAL $4,201,605
Remove percent for unregulated business ($21,739)
Remove percent for proposed write-off ($840,321)
TOTAL Rate Case Expense A $3,339,545
Requested Amortization (3 year period) 3
TOTAL Annual Amortization A/3 $1,113,182
RATE CASE EXPENSE AMORTIZATION
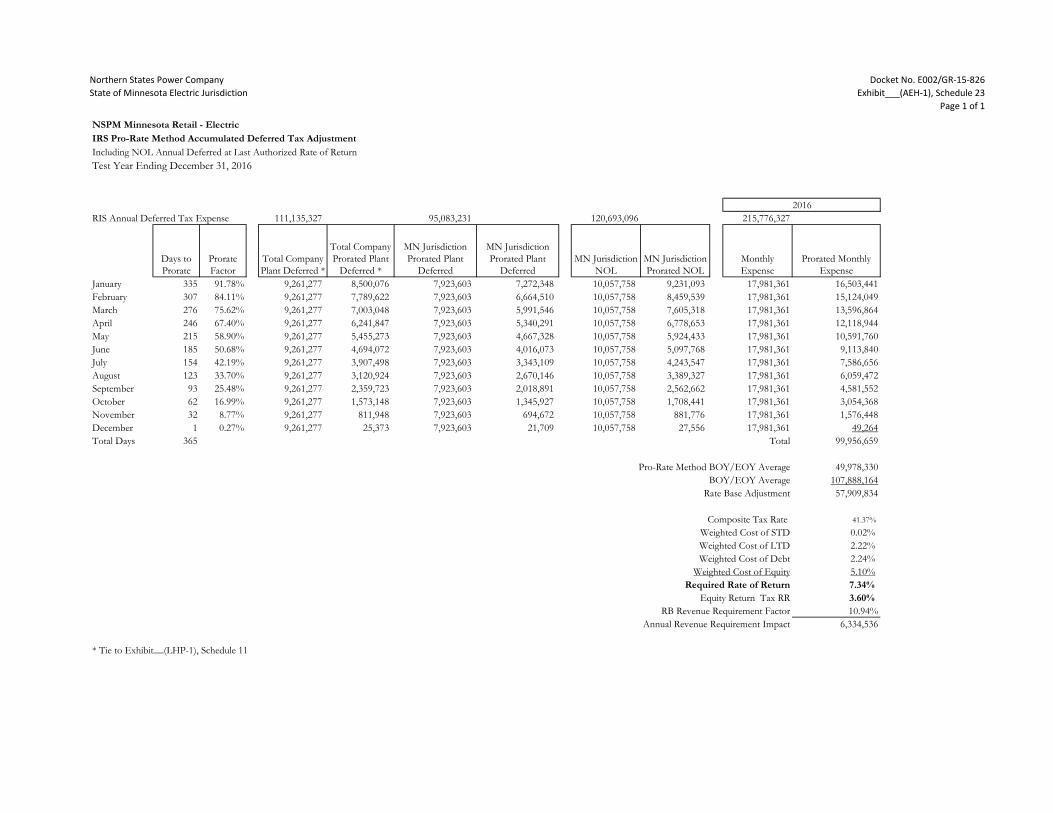
Northern States Power CompanyState of Minnesota Electric Jurisdiction
Docket No. E002/GR-15-826Exhibit___(AEH-1), Schedule 23
Page 1 of 1
NSPM Minnesota Retail - ElectricIRS Pro-Rate Method Accumulated Deferred Tax AdjustmentIncluding NOL Annual Deferred at Last Authorized Rate of ReturnTest Year Ending December 31, 2016
RIS Annual Deferred Tax Expense 111,135,327 95,083,231 120,693,096 215,776,327
Days to Prorate
Prorate Factor
Total Company Plant Deferred *
Total Company Prorated Plant
Deferred *
MN Jurisdiction Prorated Plant
Deferred
MN Jurisdiction Prorated Plant
DeferredMN Jurisdiction
NOLMN Jurisdiction Prorated NOL
Monthly Expense
Prorated Monthly Expense
January 335 91.78% 9,261,277 8,500,076 7,923,603 7,272,348 10,057,758 9,231,093 17,981,361 16,503,441February 307 84.11% 9,261,277 7,789,622 7,923,603 6,664,510 10,057,758 8,459,539 17,981,361 15,124,049March 276 75.62% 9,261,277 7,003,048 7,923,603 5,991,546 10,057,758 7,605,318 17,981,361 13,596,864April 246 67.40% 9,261,277 6,241,847 7,923,603 5,340,291 10,057,758 6,778,653 17,981,361 12,118,944May 215 58.90% 9,261,277 5,455,273 7,923,603 4,667,328 10,057,758 5,924,433 17,981,361 10,591,760June 185 50.68% 9,261,277 4,694,072 7,923,603 4,016,073 10,057,758 5,097,768 17,981,361 9,113,840July 154 42.19% 9,261,277 3,907,498 7,923,603 3,343,109 10,057,758 4,243,547 17,981,361 7,586,656August 123 33.70% 9,261,277 3,120,924 7,923,603 2,670,146 10,057,758 3,389,327 17,981,361 6,059,472September 93 25.48% 9,261,277 2,359,723 7,923,603 2,018,891 10,057,758 2,562,662 17,981,361 4,581,552October 62 16.99% 9,261,277 1,573,148 7,923,603 1,345,927 10,057,758 1,708,441 17,981,361 3,054,368November 32 8.77% 9,261,277 811,948 7,923,603 694,672 10,057,758 881,776 17,981,361 1,576,448December 1 0.27% 9,261,277 25,373 7,923,603 21,709 10,057,758 27,556 17,981,361 49,264Total Days 365 Total 99,956,659
Pro-Rate Method BOY/EOY Average 49,978,330BOY/EOY Average 107,888,164
Rate Base Adjustment 57,909,834
Composite Tax Rate 41.37%
Weighted Cost of STD 0.02%Weighted Cost of LTD 2.22%Weighted Cost of Debt 2.24%
Weighted Cost of Equity 5.10%Required Rate of Return 7.34%
Equity Return Tax RR 3.60%RB Revenue Requirement Factor 10.94%
Annual Revenue Requirement Impact 6,334,536
* Tie to Exhibit__(LHP-1), Schedule 11
2016
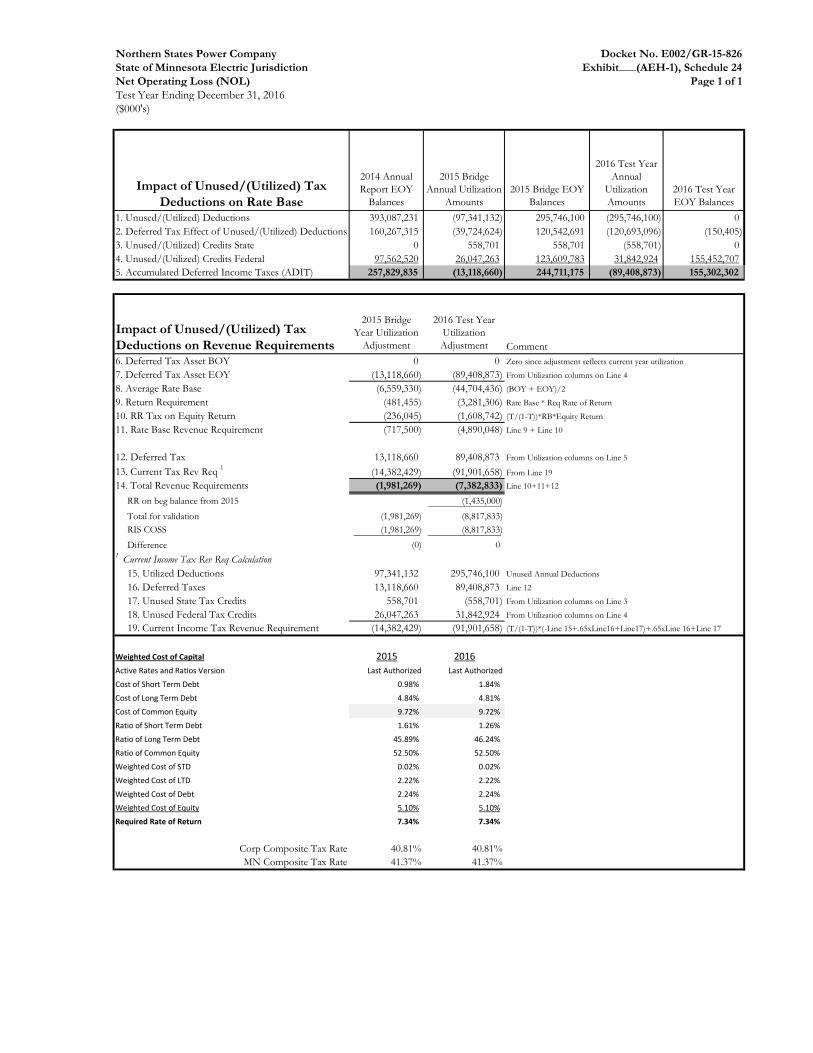
Northern States Power Company Docket No. E002/GR-15-826State of Minnesota Electric Jurisdiction Exhibit___(AEH-1), Schedule 24Net Operating Loss (NOL) Page 1 of 1Test Year Ending December 31, 2016($000's)
Impact of Unused/(Utilized) Tax Deductions on Rate Base
2014 Annual Report EOY
Balances
2015 Bridge Annual Utilization
Amounts2015 Bridge EOY
Balances
2016 Test Year Annual
Utilization Amounts
2016 Test Year EOY Balances
1. Unused/(Utilized) Deductions 393,087,231 (97,341,132) 295,746,100 (295,746,100) 02. Deferred Tax Effect of Unused/(Utilized) Deductions 160,267,315 (39,724,624) 120,542,691 (120,693,096) (150,405)3. Unused/(Utilized) Credits State 0 558,701 558,701 (558,701) 04. Unused/(Utilized) Credits Federal 97,562,520 26,047,263 123,609,783 31,842,924 155,452,7075. Accumulated Deferred Income Taxes (ADIT) 257,829,835 (13,118,660) 244,711,175 (89,408,873) 155,302,302
Impact of Unused/(Utilized) Tax Deductions on Revenue Requirements
2015 Bridge Year Utilization
Adjustment
2016 Test Year Utilization Adjustment Comment
6. Deferred Tax Asset BOY 0 0 Zero since adjustment reflects current year utilization
7. Deferred Tax Asset EOY (13,118,660) (89,408,873) From Utilization columns on Line 4
8. Average Rate Base (6,559,330) (44,704,436) (BOY + EOY)/2
9. Return Requirement (481,455) (3,281,306) Rate Base * Req Rate of Return
10. RR Tax on Equity Return (236,045) (1,608,742) (T/(1-T))*RB*Equity Return
11. Rate Base Revenue Requirement (717,500) (4,890,048) Line 9 + Line 10
12. Deferred Tax 13,118,660 89,408,873 From Utilization columns on Line 5
13. Current Tax Rev Req 1 (14,382,429) (91,901,658) From Line 1914. Total Revenue Requirements (1,981,269) (7,382,833) Line 10+11+12
RR on beg balance from 2015 (1,435,000)
Total for validation (1,981,269) (8,817,833) RIS COSS (1,981,269) (8,817,833)
Difference (0) 0 1 Current Income Tax Rev Req Calculation
15. Utilized Deductions 97,341,132 295,746,100 Unused Annual Deductions
16. Deferred Taxes 13,118,660 89,408,873 Line 12
17. Unused State Tax Credits 558,701 (558,701) From Utilization columns on Line 3
18. Unused Federal Tax Credits 26,047,263 31,842,924 From Utilization columns on Line 419. Current Income Tax Revenue Requirement (14,382,429) (91,901,658) (T/(1-T))*(-Line 15+.65xLine16+Line17)+.65xLine 16+Line 17
Weighted Cost of Capital 2015 2016Active Rates and Ratios Version Last Authorized Last Authorized
Cost of Short Term Debt 0.98% 1.84%
Cost of Long Term Debt 4.84% 4.81%
Cost of Common Equity 9.72% 9.72%
Ratio of Short Term Debt 1.61% 1.26%
Ratio of Long Term Debt 45.89% 46.24%
Ratio of Common Equity 52.50% 52.50%
Weighted Cost of STD 0.02% 0.02%
Weighted Cost of LTD 2.22% 2.22%
Weighted Cost of Debt 2.24% 2.24%
Weighted Cost of Equity 5.10% 5.10%
Required Rate of Return 7.34% 7.34%
Corp Composite Tax Rate 40.81% 40.81%MN Composite Tax Rate 41.37% 41.37%

Northern States Power Company Docket No. E002/GR-15-826State of Minnesota Electric Jurisdiction Exhibit___(AEH-1), Schedule 25
Page 1 of 1
CategoryMinnesota
Amount (000s) CommentsFuel and Purchased Power 1,078,508$ Docket GR-15-826, AEH-1, Sch. 11, line 6, col. 1
Costs Not Recoverable in Fuel Clause:Less Fuel Handling O&M Expenses (9,833)$ Less Non-Fuel Variable Interchange Expenses (5,001)$ Less Non-Asset Based Trading Expenses (14,671)$ Less Off-System Sales Net of Interchange (55,510)$ Less Windsource Fuel Costs (5,258)$ Subtotal (90,273)$
Interchange Agreement ImpactsLess Minnesota Fuel Costs Offset by Interchange Revenue (162,202)$
Total Minnesota Fuel Costs included in Cost of Service 826,033$
Minnesota Fuel Costs in Base Cost of Fuel Filing 829,073$ Docket MR-15-827, Base Fuel Cost, line 30, col. “Total"
Difference in Fuel Costs (3,040)$ Difference due to different Allocation Process*
Process Check using Difference in AllocatorsNet System Fuel Costs $1,120,558 Line 20 of Base Cost of Fuel Energy Allocator Net of Interchange used in Cost of Service 73.47%Sales Allocator used in Base Cost of Fuel 73.18%
Fuel Costs due to difference in Allocator (3,295)$ Difference due to different Allocation Process*
Unexplained Difference 255$ Percent of Total Fuel and Purchased Power 0.02%
monthly calculation of the Base Cost of Fuel and an annual calculation of the Cost of Service.* Fuel Costs check using the difference in Sales and Energy allocators is slightly different than the reconciliation above due to a
2016 TEST YEAR BASE COST OF FUEL RECONCILIATION

Northern States Power Company Docket No. E002/GR-15-826
State of Minnesota Electric Jurisdiction Exhibit___(AEH-1) Schedule 26
Annual Revenue Requirement Page 1 of 1
Minnesota Remaining Life
2016 Test Year Minnesota Electric Rate Case
($'s)
Weighted Cost of Debt 2.24% 2.26% 2.26%
Weighted Cost of Equity (Last Authorized ROE) 5.10% 5.10% 5.10%
Required Rate of Return 7.34% 7.36% 7.36%
Composite Tax Rate 41.37% 41.37% 41.37%
Jurisdictional Demand 87.3461% 87.3461% 87.3461%
Wisconsin IA Demand 15.8651% 15.8651% 15.8651%
Total Company
Rate Analysis 2015 Bridge 2016 2017 2018
Plant Investment
Depreciation Reserve (5,602,267) (16,880,749) (30,113,866)
CWIP
Accumulated Deferred Taxes 2,286,267 6,888,982 12,289,379
- 3,316,000 9,991,767 17,824,487
Average Rate Base - 3,316,000 9,991,767 17,824,487
Debt Return - 74,278 225,814 402,833
Equity Return - 169,116 509,580 909,049
Current Income Tax Requirement - (4,560,282) (4,381,820) (5,670,895)
Book Depreciation (11,204,532) (11,352,437) (15,113,797)
Annual Deferred Tax 4,572,536 4,632,895 6,167,895
ITC Flow Thru
Tax Depreciation & Removal Expense
AFUDC Expenditure
Avoided Tax Interest
Property Taxes
Total Revenue Requirements - (10,948,884) (10,365,967) (13,304,915)
MN Jurisdiction
Rate Analysis 2015 Bridge 2016 2017 2018
Plant Investment - - - -
Depreciation Reserve - (4,893,362) (14,744,676) (26,303,288)
CWIP - - - -
Accumulated Deferred Taxes - 1,996,965 6,017,257 10,734,293
- 2,896,397 8,727,419 15,568,994
Average Rate Base - 2,896,397 8,727,419 15,568,994
Debt Return - 64,879 197,240 351,859
Equity Return - 147,716 445,098 794,019
Current Income Tax Requirement - (3,983,229) (3,827,349) (4,953,306)
Book Depreciation - (9,786,721) (9,915,911) (13,201,312)
Annual Deferred Tax - 3,993,932 4,046,653 5,387,416
ITC Flow Thru - - - -
Tax Depreciation & Removal Expense - - - -
AFUDC Expenditure - - - -
Avoided Tax Interest - - - -
Property Taxes - - - -
Total Revenue Requirements - (9,563,423) (9,054,268) (11,621,324)
Other Revenues (Interchange) (1,517,247) (1,436,469) (1,843,735)
Total Revenue Requirements Net of Interchange (8,046,176) (7,617,799) (9,777,589)

Northern States Power Company Docket E002/GR-15-826State of Minnesota Electric Jurisdiction Exhibit___(AEH-1), Schedule 27TCR Rider Roll-In Timeline**** Page 1 of 1
2016 Test Year Jan - Mar 2017*** Apr 2017 - Dec 2018***Base Rates
TCR Rider Projects
CapX2020 Brookings* XCapX2020 Fargo* XCapX2020 La Crosse**
Big Stone - Brookings**
La Crosse - Madison**
MISO RECB Sch 26 and 26A net revenues**
Interim rates - No TCR Projects in 2016 or 2017
* Included in 2016 to 2018 Plan Years with 2016 and 2017 Interim rate adjustments to exclude from Interim rates; to be recovered in base rates and removed from the TCR Rider at conclusion of the case.** Removed from 2016 to 2018 Plan Year revenue requirement calculations (revenues and expenses), projects continue recovery in the TCR Rider
after the conclusion of the rate case.*** Projects "Rolled In" to final rates would be recovered for all of 2016 and 3 months (Jan - Mar) of 2017 through TCR Rider and 9 months (Apr - Dec) of 2017 through base rates. Date of recovery through base rates subject to change based on procedural schedule. **** The TCR Rider Roll-In Timeline is based on the Compliance Activities identified in the Direct Testimony of Mr. Burdick.
Note: At the close of the rate case TCR Rider revenues are to be trued-up back to Jan 1, 2016 to reflect rate case decisions (e.g. Cost of Capital).
Procedural Key Milestones from Nov 2015 to Mar 2017 (tentative subject to change based on procedural schedule)- November 2, 2015: 2015 Rate case filed- Week of November 2, 2015: 2016 TCR Rider Supplement filed- January 1, 2016: 2016 Interim Rates and 2016 TCR rate effective- October 1, 2016: 2017 TCR Rider petition filed- January 1, 2017: 2017 Interim Rates and TCR rate effective- March 1st, 2017: MPUC Multi-Year Rate Plan Order- April 1, 2017: Final Rates Implemented and TCR Tariff modification to remove CapX2020 Brookings and CapX2020 Fargo

Docket No. E002/GR-15-826Exhibit___(AEH-1), Appendix A
Docket No.
Party IR No. DescriptionAddressed in 2016 TY Case
12-961 DOC 106
Subject: Affiliated Interests Please provide a statement in writing setting forth: A. Any and all business affiliations or common business interest between any of Xcel Energy’s officers, directors or major stockholders (5 percent or more) and any of the following concerns: contractors, engineering firms, consultants, financial institutions, service and material suppliers, or other persons or companies doing business with Xcel Energy. B. The general nature and amount of any and all transactions with such person or companies. C. A complete description of the basis for pricing any materials and/or services involved in these transactions. D. Please identify any affiliated interest transactions and the amounts included in the current electric rate case. Appendix A
12-961 DOC 128
In the initial filing of its next rate case, the Company shall expand upon the information filed under Minnesota Rules 7825.4000(b) and 7825.4100(B), including balance sheet and income statement reconciliations between its FERC Form 1 and its general ledger accounts, for each of the three most recent calendar years relative to the rate case test year. The schedules provided shall be produced in like manner as requested and illustrated in the Department’s Information Request 128-Revised, marked in the record as Exhibit 163, DOC Attachment ACB-15. The Company shall also include explanations of the accounts that have large differences in amounts when compared between actuals and its test-year request (change of ±10 percent or more). Volume 3 Section IV
12-961 DOC 144
Subject: NSPM’s Non-Regulated Business Activities Please discuss why the Customer-Owned Street Lighting Maintenance and the Sherco Steam Sales to Liberty Paper activities are classified as non-regulated activities and how these activities are treated for rate-making (Stitt, IV. Cost Assignment Allocation and Framework, C. Allocation Methods and Factors, 3. Utility Allocations, E. Non-Regulated Business Activity Allocations). Appendix A
12-961 DOC 155
Subject: Below-the-line charges Reference: No specific reference A. Please indicate if any charges from Service Company, Xcel Corporate, or any charges from an entity assigned to NSP from below-the-line accounts (such as FERC Accounts 426.1 to 426.5) have been included in the test year. If yes, please provide a description of type of charge and amount of the charge in the test year. B. Please describe the Company’s policy to ensure below-the-line charges are not included in the test year.
Testimony Section V. Income Statement, Part B
12-961 DOC 170
Subject: Foundation Expense A. Please provide all 2014 test year amounts included in rate base and/or the revenue requirement, as well as any other financial implications from Xcel’s Foundation. Please include on a Total Company and Minnesota jurisdictional basis.
Testimony Section IV Part i & Section XI Part C
12-961 DOC 187
Subject: Rate Case Expenses Reference: Testimony of Anne E. Heuer, Exhibit___(AEH-1), Schedule 20. Please provide a comparison of the total requested rate case expenses and the actual rate case expenses incurred in each of the following rate cases: (1) E002/GR-05-1428; (2) E002/GR-08-1065; (3) E002/GR-10-971 and (4) E002/GR-12-961.
AEH-1, Schedule 22 Rate Case Expense
12-961 DOC 603
Volume III, Part III, Tab 4 has some spreadsheets showing research expenses for the test year. However, the spreadsheets neither show total contributions nor the amount allocated to Xcel’s Minnesota jurisdiction. Please provide a spreadsheet that shows totals and amounts allocated to Xcel’s Minnesota Jurisdiction.
Volume 3, Section III Commission Policy Information,
Item 4 Research Expenses
12-961 DOC 702
Subject: Revenue Requirement Determination 1) Please express Xcel Energy’s proposed revenue requirements in mathematical terms, using a breakdown of the revenue requirements similar to the one provided on page 26 of the “Electric Utility Cost Allocation Manual” of the National Association of Regulatory Utility Commissioners: tax rate, operating expenses excluding income and revenue taxes, rate base, rate of return, federal and state income taxes, other operating revenues, and any other items used by Xcel Energy. 2) Please quantify each item identified under your response to question 1 above.
Testimony Section II. Case Overview, Part A
12-961 DOC 703
Subject: Rate Base Determination 1) Please express Xcel Energy’s proposed rate base in mathematical terms, using a breakdown of the rate base similar to the one provided on page 27 of the “Electric Utility Cost Allocation Manual” of the National Association of Regulatory Utility Commissioners: accumulated depreciation reserves, accumulated provision for deferred income taxes, operating reserves, electric plant held for future use, construction work in progress, working capital, and any other items used by Xcel Energy. 2) Please quantify each item identified under your response to question 1 above. Testimony Section IV. Rate Base
12-961 DOC 704
Subject: Operating Expenses Determination 1) Please express Xcel Energy’s proposed operating expenses in mathematical terms, using a breakdown of the operating expenses similar to the one provided on page 30 of the “Electric Utility Cost Allocation Manual” of the National Association of Regulatory Utility Commissioners: operation and maintenance expenses, depreciation expense, miscellaneous amortization expenses, taxes other than income taxes, and any other items used by Xcel Energy. 2) Please quantify each item identified under your response to question 1 above.
Testimony Section V. Income Statement, Part B
12-961 DOC 1108
Subject: MISO Schedules and Attachments Reference: No specific reference A. For each MISO Schedule, please provide a brief description of the MISO charge (both revenues and expenses), how this charge is reflected in retail rates through rate cases, riders, or any other recovery mechanisms. Please include charges by MISO Schedule. If not reflected in retail rates, please provide a brief explanation for why this appropriate. B. For each MISO Attachment, please provide a brief description of the MISO charge (both revenues and expenses), how this charge is reflected in retail rates through rate cases, riders, or any other recovery mechanisms. Please include charges by MISO Attachment. If not reflected in retail rates, please provide a brief explanation for why this appropriate. Appendix A
12-961 DOC 1120
Subject: Net Operating Loss and Bonus Tax Depreciation Reference: Anne Heuer Direct Testimony on page 92 A. Please confirm the Company’s continued requirement to follow the resolution of the “Tax Normalization and Allowance for Net Operating Losses” – Exhibit 105 in Xcel’s last rate case (Docket E002/GR-10-971). Specifically, will the Company continue to give back to ratepayers annually the estimated $60.2 million over 2012 and 2015 in the last rate case in Exhibit 105 Attachment 1 and $85.4 million over 2013 to 2016 in the May 31, 2012 Rate Compliance Report for Regulatory Treatment of Net Operating Loss (Docket E002/GR-10-971)? Please explain your response. B. DOC is concerned that by including the utilization of the 2013 deferred tax normalization into the rate case rather than through an annual refund filing, the Company is attempting to change the intent of the resolution in Exhibit 105 to give back the updated $85.4 million on a continuing annual basis. Please explain why DOC should not be concerned by confirming the Company’s requirement to give the full no estimated $85.4 million as the amount is utilized for tax purposes.
Testimony Section V. Income Statement, Part D
12-961 DOC 1134 Subject: Study of Wholesale CustomersAEH-1, Schedule 12 Wholesale
Customer Study
12-961 DOC 1138
Subject: Production Tax Credits Reference: Please clearly show where the $18.8 million production tax credit which results in a $32.1 million reduction in test year revenue requirements is included in the 2014 test year. B. Please provide the allocator used in determining the Minnesota Jurisdictional amount for production tax credit and support why the allocator is reasonable.
AEH-1, Schedule 19 Production Tax Credits
12-961 MCC 100
Income tax: Please show the quantified results of calculating Xcel's total MN income tax liability for the 2014 test year. If because of zero taxes some deductions are unutilized, please explain how the unused tax credits are returned to retail ratepayers after 2014.
Testimony Section VII. Adjustments to Test Year, Part
F
Northern States Power Company
Revenue Requirements Discovery - 2016 TY Electric Rate CaseIndex
Page 1 of 97
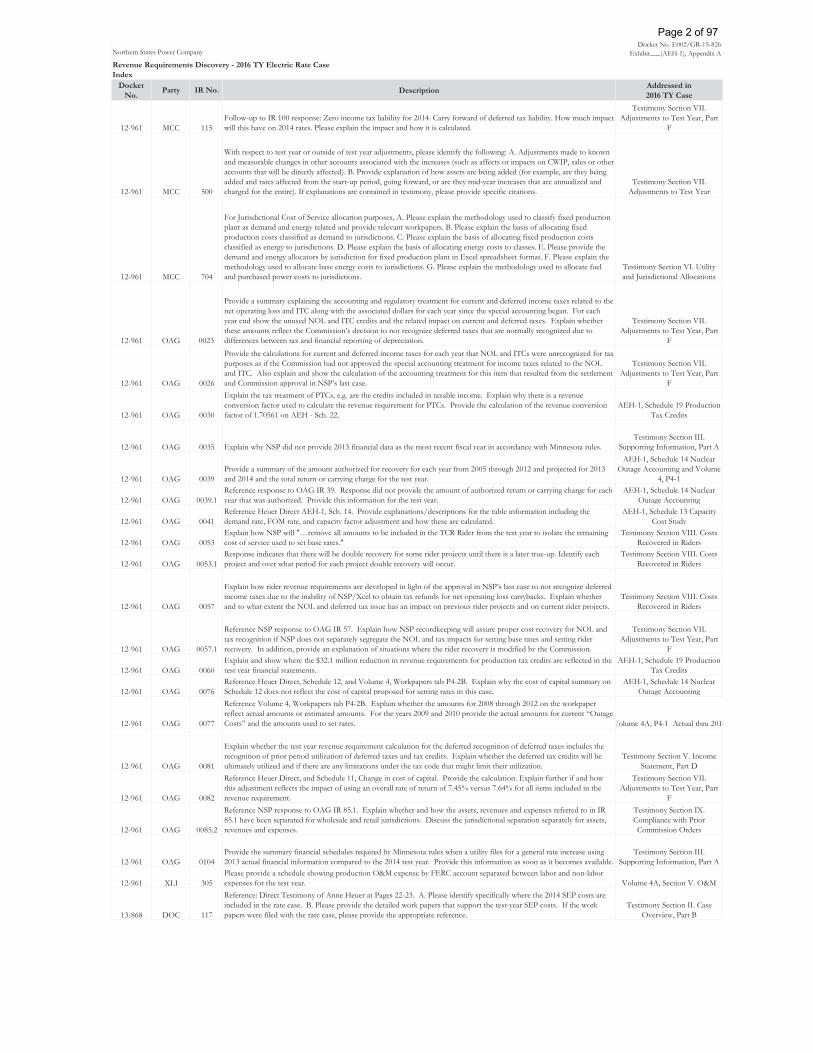
Docket No. E002/GR-15-826Exhibit___(AEH-1), Appendix A
Docket No.
Party IR No. DescriptionAddressed in 2016 TY Case
Northern States Power Company
Revenue Requirements Discovery - 2016 TY Electric Rate CaseIndex
12-961 MCC 115Follow-up to IR 100 response: Zero income tax liability for 2014. Carry forward of deferred tax liability. How much impact will this have on 2014 rates. Please explain the impact and how it is calculated.
Testimony Section VII. Adjustments to Test Year, Part
F
12-961 MCC 500
With respect to test year or outside of test year adjustments, please identify the following: A. Adjustments made to known and measurable changes in other accounts associated with the increases (such as affects or impacts on CWIP, sales or other accounts that will be directly affected). B. Provide explanation of how assets are being added (for example, are they being added and rates affected from the start-up period, going forward, or are they mid-year increases that are annualized and charged for the entire). If explanations are contained in testimony, please provide specific citations.
Testimony Section VII. Adjustments to Test Year
12-961 MCC 704
For Jurisdictional Cost of Service allocation purposes, A. Please explain the methodology used to classify fixed production plant as demand and energy related and provide relevant workpapers. B. Please explain the basis of allocating fixed production costs classified as demand to jurisdictions. C. Please explain the basis of allocating fixed production costs classified as energy to jurisdictions. D. Please explain the basis of allocating energy costs to classes. E. Please provide the demand and energy allocators by jurisdiction for fixed production plant in Excel spreadsheet format. F. Please explain the methodology used to allocate base energy costs to jurisdictions. G. Please explain the methodology used to allocate fuel and purchased power costs to jurisdictions.
Testimony Section VI. Utility and Jurisdictional Allocations
12-961 OAG 0023
Provide a summary explaining the accounting and regulatory treatment for current and deferred income taxes related to the net operating loss and ITC along with the associated dollars for each year since the special accounting began. For each year end show the unused NOL and ITC credits and the related impact on current and deferred taxes. Explain whether these amounts reflect the Commission’s decision to not recognize deferred taxes that are normally recognized due to differences between tax and financial reporting of depreciation.
Testimony Section VII. Adjustments to Test Year, Part
F
12-961 OAG 0026
Provide the calculations for current and deferred income taxes for each year that NOL and ITCs were unrecognized for tax purposes as if the Commission had not approved the special accounting treatment for income taxes related to the NOL and ITC. Also explain and show the calculation of the accounting treatment for this item that resulted from the settlement and Commission approval in NSP’s last case.
Testimony Section VII. Adjustments to Test Year, Part
F
12-961 OAG 0030
Explain the tax treatment of PTCs, e.g. are the credits included in taxable income. Explain why there is a revenue conversion factor used to calculate the revenue requirement for PTCs. Provide the calculation of the revenue conversion factor of 1.70561 on AEH - Sch. 22.
AEH-1, Schedule 19 Production Tax Credits
12-961 OAG 0035 Explain why NSP did not provide 2013 financial data as the most recent fiscal year in accordance with Minnesota rules. Testimony Section III.
Supporting Information, Part A
12-961 OAG 0039Provide a summary of the amount authorized for recovery for each year from 2005 through 2012 and projected for 2013 and 2014 and the total return or carrying charge for the test year.
AEH-1, Schedule 14 Nuclear Outage Accounting and Volume
4, P4-1
12-961 OAG 0039.1Reference response to OAG IR 39. Response did not provide the amount of authorized return or carrying charge for each year that was authorized. Provide this information for the test year.
AEH-1, Schedule 14 Nuclear Outage Accounting
12-961 OAG 0041Reference Heuer Direct AEH-1, Sch. 14. Provide explanations/descriptions for the table information including the demand rate, FOM rate, and capacity factor adjustment and how these are calculated.
AEH-1, Schedule 13 Capacity Cost Study
12-961 OAG 0053Explain how NSP will "…remove all amounts to be included in the TCR Rider from the test year to isolate the remaining cost of service used to set base rates."
Testimony Section VIII. Costs Recovered in Riders
12-961 OAG 0053.1Response indicates that there will be double recovery for some rider projects until there is a later true-up. Identify each project and over what period for each project double recovery will occur.
Testimony Section VIII. Costs Recovered in Riders
12-961 OAG 0057
Explain how rider revenue requirements are developed in light of the approval in NSP’s last case to not recognize deferred income taxes due to the inability of NSP/Xcel to obtain tax refunds for net operating loss carrybacks. Explain whether and to what extent the NOL and deferred tax issue has an impact on previous rider projects and on current rider projects.
Testimony Section VIII. Costs Recovered in Riders
12-961 OAG 0057.1
Reference NSP response to OAG IR 57. Explain how NSP recordkeeping will assure proper cost recovery for NOL and tax recognition if NSP does not separately segregate the NOL and tax impacts for setting base rates and setting rider recovery. In addition, provide an explanation of situations where the rider recovery is modified by the Commission.
Testimony Section VII. Adjustments to Test Year, Part
F
12-961 OAG 0060Explain and show where the $32.1 million reduction in revenue requirements for production tax credits are reflected in the test year financial statements.
AEH-1, Schedule 19 Production Tax Credits
12-961 OAG 0076Reference Heuer Direct, Schedule 12, and Volume 4, Workpapers tab P4-2B. Explain why the cost of capital summary on Schedule 12 does not reflect the cost of capital proposed for setting rates in this case.
AEH-1, Schedule 14 Nuclear Outage Accounting
12-961 OAG 0077
Reference Volume 4, Workpapers tab P4-2B. Explain whether the amounts for 2008 through 2012 on the workpaper reflect actual amounts or estimated amounts. For the years 2009 and 2010 provide the actual amounts for current “Outage Costs” and the amounts used to set rates. Volume 4A, P4-1 Actual thru 2014
12-961 OAG 0081
Explain whether the test year revenue requirement calculation for the deferred recognition of deferred taxes includes the recognition of prior period utilization of deferred taxes and tax credits. Explain whether the deferred tax credits will be ultimately utilized and if there are any limitations under the tax code that might limit their utilization.
Testimony Section V. Income Statement, Part D
12-961 OAG 0082
Reference Heuer Direct, and Schedule 11, Change in cost of capital. Provide the calculation. Explain further if and how this adjustment reflects the impact of using an overall rate of return of 7.45% versus 7.64% for all items included in the revenue requirement.
Testimony Section VII. Adjustments to Test Year, Part
F
12-961 OAG 0085.2
Reference NSP response to OAG IR 85.1. Explain whether and how the assets, revenues and expenses referred to in IR 85.1 have been separated for wholesale and retail jurisdictions. Discuss the jurisdictional separation separately for assets, revenues and expenses.
Testimony Section IX. Compliance with Prior Commission Orders
12-961 OAG 0104Provide the summary financial schedules required by Minnesota rules when a utility files for a general rate increase using 2013 actual financial information compared to the 2014 test year. Provide this information as soon as it becomes available.
Testimony Section III. Supporting Information, Part A
12-961 XLI 305Please provide a schedule showing production O&M expense by FERC account separated between labor and non-labor expenses for the test year. Volume 4A, Section V. O&M
13-868 DOC 117
Reference: Direct Testimony of Anne Heuer at Pages 22-23. A. Please identify specifically where the 2014 SEP costs are included in the rate case. B. Please provide the detailed work papers that support the test-year SEP costs. If the work papers were filed with the rate case, please provide the appropriate reference.
Testimony Section II. Case Overview, Part B
Page 2 of 97

Docket No. E002/GR-15-826Exhibit___(AEH-1), Appendix A
Docket No.
Party IR No. DescriptionAddressed in 2016 TY Case
Northern States Power Company
Revenue Requirements Discovery - 2016 TY Electric Rate CaseIndex
13-868 DOC 160
Reference: Mr. Robinson Direct Testimony page 13, Border Winds & Ms. Heuer Schedule 22. Please calculate the production tax credit amounts (PTCs) for Borders Wind for 2015 and 2016 assuming correct tax PTC rate and mwh based on the capacity factor the Company used in Docket No. E002/M-13-716. (Format consistent with Schedule 22).
AEH-1, Schedule 19 Production Tax Credits
13-868 DOC 2148
Reference: DOC July 2, 2014 Direct Testimony of Campbell in Docket No. E002/CI-13-754. Please calculate and show all calculations for the rate base, income statement and overall revenue requirement impacts for the following Monticello EPU prudency adjustment recommended by the Department for 2015: The Department recommended a disallowance of $71.42 million on a Minnesota jurisdictional basis (including AFUDC), which is estimated to be less than a $10.713 million annual revenue requirement reduction on a Minnesota jurisdictional basis for 2015 based on our investigation of Monticello LCM and EPU projects. The Department will include the final revenue requirement reduction for Monticello CI investigation docket in the revenue requirements of DOC witness Dale Lusti in his Surrebuttal Testimony (Schedules DVL-S-4 and DVL-S-7) in this rate case proceeding.
AEH-1, Schedule 20 Monticello LCM/EPU Return
13-868 DOC 1119
Reference: Anne Heuer Direct Testimony, Page 18, Other Amortization: For the $5 million increase in Other Amortizations, please explain why this amount should be recoverable in the current rate case and provide all supporting calculations and assumptions.
Testimony Section II. Case Overview, Part B
13-868 DOC 1172Subject: Interest on Customer Deposits. Reference: Heuer Direct, Page 129 and Adjustment A22. Please provide support for the adjustment to reduce test-year rate base by the average balance of customer deposits.
Testimony Section VII. Adjustments to Test Year,
Adjustment 3
13-868 DOC 1173
Subject: Donations. Reference: Heuer Direct, Pages 124-125, Adjustment A18 Volume 4, Tab A18, Workpaper A18-3: A. Please reproduce the workpaper A18-3 for actual donations for 2011, 2012 and 2013, test year requested and authorized donations for the 2011 and 2013 test years. B. Regarding the Corporate Contributions and Focus Area Grants categories on the A18-3 workpaper, please answer the following questions: 1. What is the general purpose of these two categories of contributions? 2. What types of organizations are typical recipients of the contributions in each category?
Volume 4B, Section VIII. Adjustments
13-868 DOC 2132
Subject: 2015 Forecast Cost of Service Study
Reference: Exhibit_____(AEH-1), Schedule 3 Exhibit_____(AEH-1), Schedule 4 Exhibit_____(AEH-1), Schedule 8 Exhibit_____(AEH-1), Schedule 9 Exhibit_____(AEH-1), Schedule 10 Exhibit_____(AEH-1), Schedule 11 Exhibit_____(AEH-1), Schedule 27
Please provide schedules that support the 2015 forecast $134,975,000 revenue deficiency as identified in Schedule 27, Page 5 of 6, Line 21 that are similar in nature to how schedules 3, 8, 9, 10 and 11 support Schedule 4. As it relates to schedules 8 and 9, only the 2015 numbers are requested.
Volume 3, Section II. Required Financial Information, Part 2.
Jurisdictional Financial Summary Schedules.
13-868 MCC 4When the Company grosses up a cost for tax purposes there is a multiplier used for assumed tax liability. Please provide calculation and any supporting documentation for how the tax percentage is developed.
Volume 3, Section II. Required Financial Information, Part 7.
Other Supplemental Information
13-868 MCC 6
The Chamber understands, with respect to income taxes as discussed in witness Heuer's testimony, the difference between:
million returned to ratepayers through riders. Please provide a bridge schedule illustrating and identifying the credits and which riders they flow through.
Testimony Section VII. Adjustments to Test Year, Part
F
13-868 MCC 110Witness Heuer's testimony provides the revenue requirement associated with the CIP incentive at $27.577 million for 2014 (see page 133). Were any such adjustments made for 2015? Please explain.
Testimony Section VII. Adjustments to Test Year, Part
C
13-868 MCC 151
Please provide the revenue requirements for Pleasant Valley and Borders if this investment were to be recovered from the Rider when the plants go in service in 2015? Please provide a narrative response along with the quantitative information in live Excel format with formulae intact.
Testimony Section II. Case Overview, Part B
13-868 MCC 152
Can Xcel use the PTC offset (Department's recommendation) associated with Pleasant Valley and Borders in the current case if it has net operating losses? Or does Xcel already have sufficient carryover deductions and PTC so that there is no practical current impact of adding Pleasant Valley and Borders' PTC offset? Please explain.
Testimony Section V. Income Statement, Part D
13-868 MCC 156
Please explain what method is used to allocate Other Production O&M on a jurisdictional basis and also provide the resulting % classification of demand/capacity related versus energy related. By Other Production O&M, we mean non fuel and non PP A related.
Testimony Section VI. Utility and Jurisdictional Allocations
13-868 MCC 208
For Xcel's recently announced Transco, please provide: a. Business structure of organization, ownership, and organization diagramb. Required regulatory approvals, FERC plus state by state plus schedulec. Projects to be included, capital investments, and revenue requirementsd. Projected impact on NSP-M and MN jurisdiction revenue requirements at least through 2018. Appendix A
13-868 OAG 196.1
Reference: Response to OAG IR 196 – DOE settlements. Attachment A shows the total payments received of $181,931,289. The total allocated to the Minnesota and Wisconsin jurisdictions total $178,360,326. Provide the reconciliation of these two amounts. Volume 4A, P4-5
13-868 OAG 105
For all responses show amounts for Total Company and the Minnesota jurisdictional electric unless indicated otherwise. Total Company is meant to include costs incurred by Xcel Energy Services and NSP Minnesota, both regulated and non-regulated operations. Reference: NOL and deferred taxes. Provide the historical (by year) and most recent status of tax NOL carryforwards and carrybacks and identify the deferred taxes that have and have not been utilized for the benefit of ratepayers.
Appendix A AEH-1, Schedule 24 Net
Operating Loss
13-868 OAG 117
For all responses show amounts for Total Company and the Minnesota jurisdictional electric unless indicated otherwise. Total Company is meant to include costs incurred by Xcel Energy Services and NSP Minnesota, both regulated and non-regulated operations. Reference: Sparby Direct, pg. 5. Explain and quantify the investments in transmission owned by NSP. Provide the total cost, the Minnesota retail jurisdictional cost, other state’s retail jurisdictional costs, and the wholesale jurisdictional costs that are represented in the test year. Provide the amount of revenues for 2012, 2013, and projected 2014 for transmission services in total and for the Minnesota jurisdiction. Provide a summary of transmission revenues that are included in the test year cost of service and the revenues that are not included in the test year, and explain the basis for not including revenues in the test year. Appendix A
Page 3 of 97
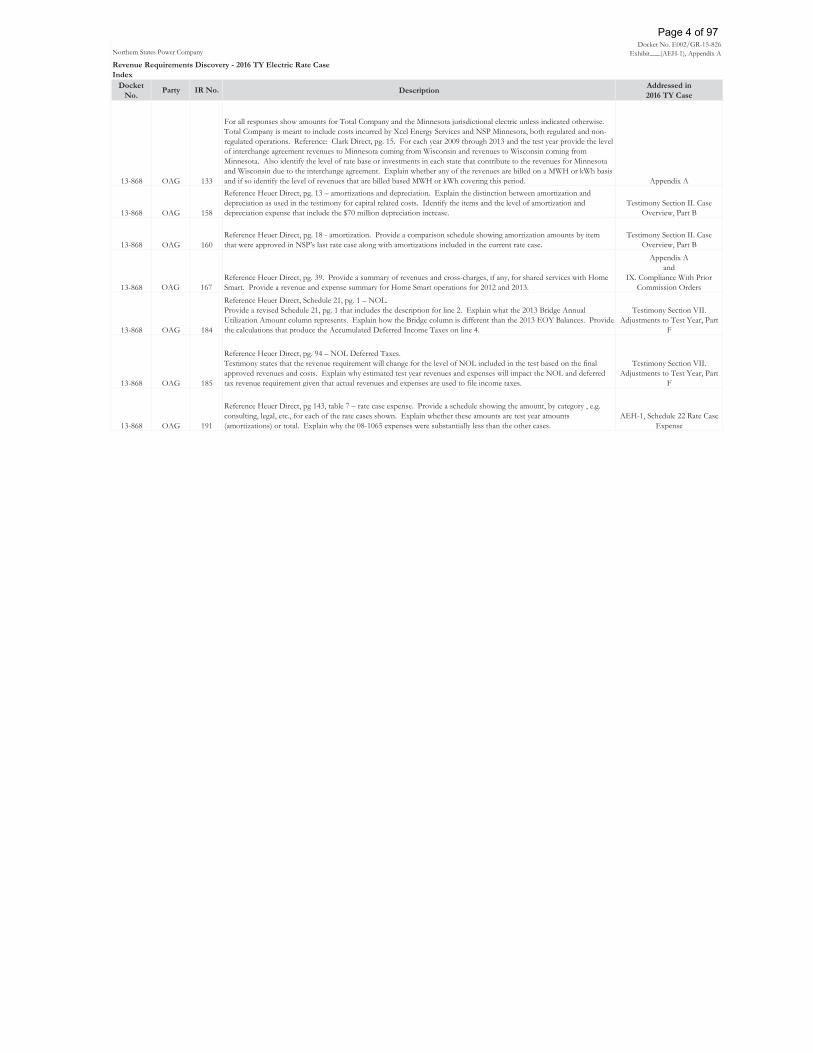
Docket No. E002/GR-15-826Exhibit___(AEH-1), Appendix A
Docket No.
Party IR No. DescriptionAddressed in 2016 TY Case
Northern States Power Company
Revenue Requirements Discovery - 2016 TY Electric Rate CaseIndex
13-868 OAG 133
For all responses show amounts for Total Company and the Minnesota jurisdictional electric unless indicated otherwise. Total Company is meant to include costs incurred by Xcel Energy Services and NSP Minnesota, both regulated and non-regulated operations. Reference: Clark Direct, pg. 15. For each year 2009 through 2013 and the test year provide the level of interchange agreement revenues to Minnesota coming from Wisconsin and revenues to Wisconsin coming from Minnesota. Also identify the level of rate base or investments in each state that contribute to the revenues for Minnesota and Wisconsin due to the interchange agreement. Explain whether any of the revenues are billed on a MWH or kWh basis and if so identify the level of revenues that are billed based MWH or kWh covering this period. Appendix A
13-868 OAG 158
Reference Heuer Direct, pg. 13 – amortizations and depreciation. Explain the distinction between amortization and depreciation as used in the testimony for capital related costs. Identify the items and the level of amortization and depreciation expense that include the $70 million depreciation increase.
Testimony Section II. Case Overview, Part B
13-868 OAG 160Reference Heuer Direct, pg. 18 - amortization. Provide a comparison schedule showing amortization amounts by item that were approved in NSP’s last rate case along with amortizations included in the current rate case.
Testimony Section II. Case Overview, Part B
13-868 OAG 167Reference Heuer Direct, pg. 39. Provide a summary of revenues and cross-charges, if any, for shared services with Home Smart. Provide a revenue and expense summary for Home Smart operations for 2012 and 2013.
Appendix Aand
IX. Compliance With Prior Commission Orders
13-868 OAG 184
Reference Heuer Direct, Schedule 21, pg. 1 – NOL. Provide a revised Schedule 21, pg. 1 that includes the description for line 2. Explain what the 2013 Bridge Annual Utilization Amount column represents. Explain how the Bridge column is different than the 2013 EOY Balances. Provide the calculations that produce the Accumulated Deferred Income Taxes on line 4.
Testimony Section VII. Adjustments to Test Year, Part
F
13-868 OAG 185
Reference Heuer Direct, pg. 94 – NOL Deferred Taxes. Testimony states that the revenue requirement will change for the level of NOL included in the test based on the final approved revenues and costs. Explain why estimated test year revenues and expenses will impact the NOL and deferred tax revenue requirement given that actual revenues and expenses are used to file income taxes.
Testimony Section VII. Adjustments to Test Year, Part
F
13-868 OAG 191
Reference Heuer Direct, pg 143, table 7 – rate case expense. Provide a schedule showing the amount, by category , e.g. consulting, legal, etc., for each of the rate cases shown. Explain whether these amounts are test year amounts (amortizations) or total. Explain why the 08-1065 expenses were substantially less than the other cases.
AEH-1, Schedule 22 Rate Case Expense
Page 4 of 97

Docket No. E002/GR-15-826 Exhibit___(AEH-1), Appendix A Docket No. E002/GR-12-961 Information Request No. DOC-106 __________________________________________________________________
Question: Subject: Affiliated Interests Please provide a statement in writing setting forth: A. Any and all business affiliations or common business interest between any of
Xcel Energy’s officers, directors or major stockholders (5 percent or more) and any of the following concerns: contractors, engineering firms, consultants, financial institutions, service and material suppliers, or other persons or companies doing business with Xcel Energy.
B. The general nature and amount of any and all transactions with such person or
companies. C. A complete description of the basis for pricing any materials and/or services
involved in these transactions. D. Please identify any affiliated interest transactions and the amounts included in
the current electric rate case.
Response: Xcel Energy Inc. owns 100 percent of the common stock of NSPM. All officers and directors of the Company (NSPM) are employees of Xcel Energy Inc. or Xcel Energy Services Inc. A. The Company submits annual reports of affiliate relationships by April 1st of
each year pursuant to Minnesota Public Utilities Commission (MPUC) Rule 7825.2200. The 2014 report was filed on April 1, 2015 and is included as Attachments A to this response.
Xcel Energy Inc. also submits interlocking directorate reports to the Federal Energy Regulatory Commission (FERC) to show any "interlocking" relationship between officers or directors of NSPM (or Xcel Energy Inc.) and entities doing business with NSPM or Xcel Energy Inc. Attachment B to this response provides a copy of the currently-effective Interlocking Directorate
Page 5 of 97
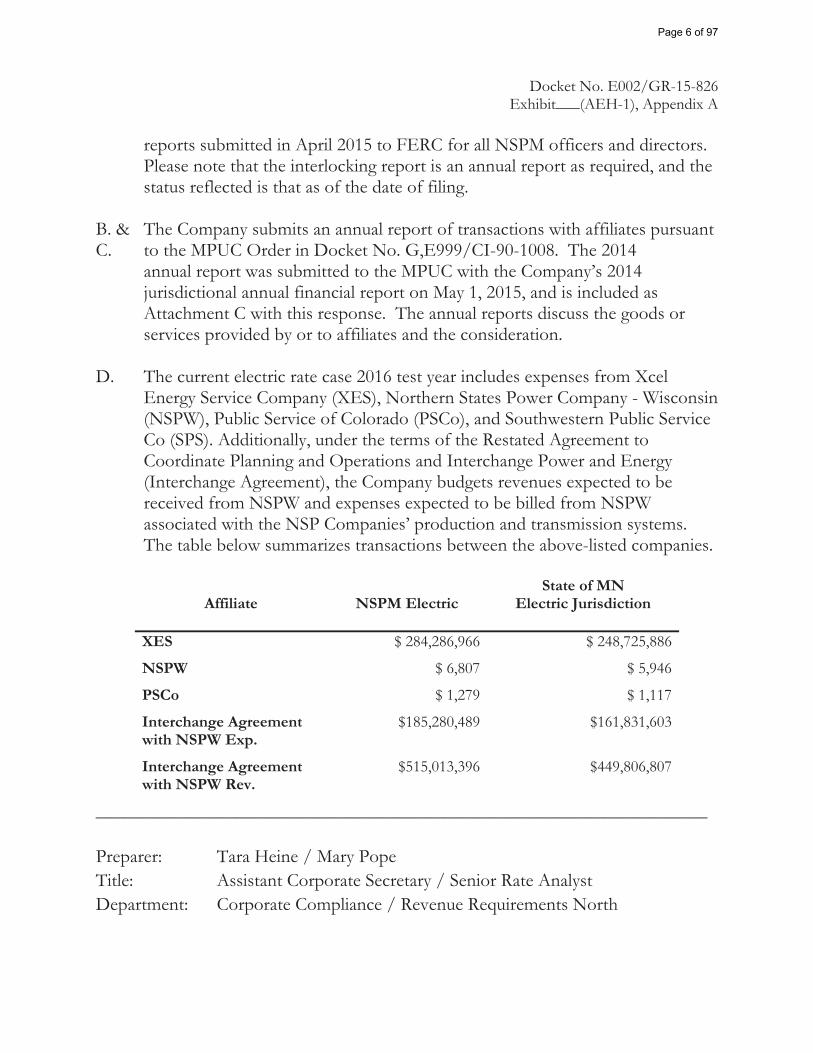
Docket No. E002/GR-15-826 Exhibit___(AEH-1), Appendix A
reports submitted in April 2015 to FERC for all NSPM officers and directors. Please note that the interlocking report is an annual report as required, and the status reflected is that as of the date of filing.
B. & The Company submits an annual report of transactions with affiliates pursuant C. to the MPUC Order in Docket No. G,E999/CI-90-1008. The 2014
annual report was submitted to the MPUC with the Company’s 2014 jurisdictional annual financial report on May 1, 2015, and is included as Attachment C with this response. The annual reports discuss the goods or services provided by or to affiliates and the consideration.
D. The current electric rate case 2016 test year includes expenses from Xcel
Energy Service Company (XES), Northern States Power Company - Wisconsin (NSPW), Public Service of Colorado (PSCo), and Southwestern Public Service Co (SPS). Additionally, under the terms of the Restated Agreement to Coordinate Planning and Operations and Interchange Power and Energy (Interchange Agreement), the Company budgets revenues expected to be received from NSPW and expenses expected to be billed from NSPW associated with the NSP Companies’ production and transmission systems. The table below summarizes transactions between the above-listed companies.
Affiliate
NSPM Electric
State of MN Electric Jurisdiction
XES $ 284,286,966 $ 248,725,886
NSPW $ 6,807 $ 5,946
PSCo $ 1,279 $ 1,117
Interchange Agreement with NSPW Exp.
$185,280,489 $161,831,603
Interchange Agreement with NSPW Rev.
$515,013,396 $449,806,807
_________________________________________________________________ Preparer: Tara Heine / Mary Pope Title: Assistant Corporate Secretary / Senior Rate Analyst Department: Corporate Compliance / Revenue Requirements North
Page 6 of 97

414 Nicollet MallMinneapolis, Minnesota 55401
April 1, 2015
--Via Electronic Filing-- Daniel P. Wolf Executive Secretary Minnesota Public Utilities Commission 121 7th Place East, Suite 350 St. Paul, MN 55101
RE: ANNUAL REPORT AFFILIATED INTEREST DOCKET NO. E,G999/PR-15-___
Dear Mr. Wolf:
Northern States Power Company, doing business as Xcel Energy, submits to the Minnesota Public Utilities Commission this Annual Report of Affiliated Interests as of March 31, 2015.
Minn. R. 7825.2200(A) requires public utilities providing electric or natural gas service in the State of Minnesota to submit a report to the Commission on April 1 of each year containing a description of various types of companies or persons who are affiliates of the utility as defined in Minn. Stat. §216B.48.
Northern States Power Company (NSPM) is a utility operating company subsidiary of Xcel Energy Inc. NSPM provides electric and natural gas service in the State of Minnesota. NSPM is registered with the Minnesota Secretary of State to do business under the trade name Xcel Energy. Xcel Energy Services Inc. (XES) is the service company within the Xcel Energy Inc. holding company structure.
We have electronically filed this document with the Commission, and copies have been served on the parties on the attached service list.
Please contact me at [email protected] or (612) 330-7529 if you have any questions regarding this filing.
Sincerely,
/s/
PAUL J LEHMAN MANAGER, REGULATORY COMPLIANCE AND FILINGS Enclosures c: Service List
Docket No. E002/GR-12-961 DOC Information Request No. 106 Attachment A
Docket No. E002/GR-15-826 Exhibit__(AEH-1), Appendix A
Page 7 of 97
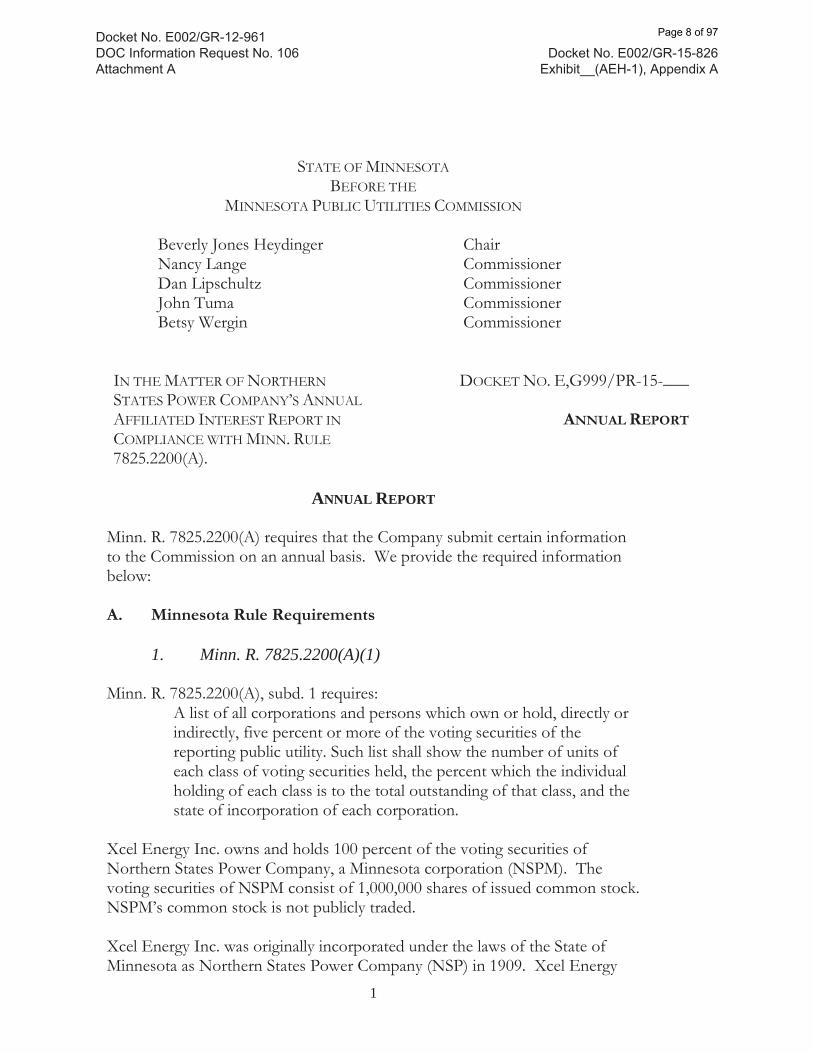
STATE OF MINNESOTA BEFORE THE
MINNESOTA PUBLIC UTILITIES COMMISSION
Beverly Jones Heydinger Nancy Lange Dan Lipschultz John Tuma Betsy Wergin
Chair Commissioner Commissioner Commissioner Commissioner
IN THE MATTER OF NORTHERN STATES POWER COMPANY’S ANNUAL AFFILIATED INTEREST REPORT IN COMPLIANCE WITH MINN. RULE 7825.2200(A).
DOCKET NO. E,G999/PR-15-___
ANNUAL REPORT
ANNUAL REPORT Minn. R. 7825.2200(A) requires that the Company submit certain information to the Commission on an annual basis. We provide the required information below: A. Minnesota Rule Requirements
1. Minn. R. 7825.2200(A)(1) Minn. R. 7825.2200(A), subd. 1 requires:
A list of all corporations and persons which own or hold, directly or indirectly, five percent or more of the voting securities of the reporting public utility. Such list shall show the number of units of each class of voting securities held, the percent which the individual holding of each class is to the total outstanding of that class, and the state of incorporation of each corporation.
Xcel Energy Inc. owns and holds 100 percent of the voting securities of Northern States Power Company, a Minnesota corporation (NSPM). The voting securities of NSPM consist of 1,000,000 shares of issued common stock. NSPM’s common stock is not publicly traded. Xcel Energy Inc. was originally incorporated under the laws of the State of Minnesota as Northern States Power Company (NSP) in 1909. Xcel Energy
1
Docket No. E002/GR-12-961 DOC Information Request No. 106 Attachment A
Docket No. E002/GR-15-826 Exhibit__(AEH-1), Appendix A
Page 8 of 97

Inc. as it exists today was formed as a result of a merger in August 2000 between New Century Energies Inc. (NCE) and NSP, with the surviving entity being NSP. When the merger was completed the company name was changed to Xcel Energy Inc. As described in the Docket No. E,G002/PA-99-1031, the common and preferred stock of NSP became preferred stock of Xcel Energy Inc. upon completion of the NSP/NCE merger in August 2000.
2. Minn. R. 7825.2200(A)(2) Minn. R. 7825.2200(A), subd. 2 requires:
A list of all corporations and persons which own or hold, directly or indirectly, five percent or more of the voting securities of any corporation in a chain or successive ownership of five percent or more of the voting securities of the reporting public utility. Such list will show the number of units of each class of securities held, the percent which the individual holding of each class is to the total outstanding of that class, and the state of incorporation of each corporation.
Xcel Energy Inc. owns 100 percent of the issued common stock of NSPM. The following table sets forth certain information as to each person or entity known to us to be the beneficial owner of more than 5 percent of Xcel Energy Inc.’s common stock: Name and Address of Beneficial Owner
Number of Shares Beneficially
Owned
Percent of Class BlackRock, Inc. 55 East 52nd Street New York, NY 10022
35,320,178(1)
7.00%
Franklin Resources, Inc. Charles B. Johnson Rupert H. Johnson, Jr. Franklin Advisers, Inc. Fiduciary Trust Company International One Franklin Parkway San Mateo, CA 94403
27,841,700(2) 5.50%
State Street Corporation State Street Financial Center One Lincoln Street Boston, MA 02111
26,153,296(3) 5.20%
The Vanguard Group, Inc. 100 Vanguard Blvd. Malvern, PA 19355
27,888,108(4) 5.51%
(1) The information contained in the table and this footnote with respect to BlackRock, Inc. is based solely on a Schedule 13G filed by the listed person with the SEC on February 9, 2015. The filing
2
Docket No. E002/GR-12-961 DOC Information Request No. 106 Attachment A
Docket No. E002/GR-15-826 Exhibit__(AEH-1), Appendix A
Page 9 of 97
indicates that as of December 31, 2014, BlackRock, Inc. had sole voting power for 30,973,237 shares and sole dispositive power for 35,320,178 shares.
(2) The information contained in the table and this footnote with respect to Franklin Resources, Inc. is based solely on a Schedule 13G filed by each of the listed persons with the SEC on February 10, 2015. The filing indicates that as of December 31, 2014, (a) the shares are held by investment companies and institutional accounts that are advised by subsidiaries of Franklin Resources, Inc. pursuant to advisory contracts which grant to such subsidiaries all investment and voting power over the shares, (b) Charles B. Johnson and Rupert H. Johnson, Jr. are the principal stockholders of Franklin Resources, Inc., (c) Franklin Advisers, Inc. one of the subsidiaries of Franklin Resources, Inc., had sole voting power for 27,626,014 shares and sole dispositive power for 27,826,014 shares and (d) Fiduciary Trust Company International, one of the subsidiaries of Franklin Resources, Inc., had sole voting power for 15,686 shares and sole dispositive power for 15,686 shares.
(3) The information contained in the table and this footnote with respect to State Street Corporation is based solely on a Schedule 13G filed by the listed person with the SEC on February 13, 2015. The filing indicates that as of December 31, 2014, State Street Corporation had sole voting power for 0 shares, shared voting power for 26,153,296 shares, sole dispositive power for 0 shares and shared dispositive power for 26,153,296 shares.
(4) The information contained in the table and this footnote with respect to The Vanguard Group, Inc. is based solely on a Schedule 13G filed by the listed person with the SEC on February 10, 2015, The filing indicates that as of December 31, 2014, The Vanguard Group, Inc. reported that it had sole voting power for 897,683 shares, sole dispositive power for 27,076,418 shares and shared dispositive power for 811,690 shares. The Vanguard Group, Inc. also reported that (i) Vanguard Fiduciary Trust Company, a wholly-owned subsidiary of The Vanguard Group, Inc., is the beneficial owner of 680,890 shares as a result of its serving as investment manager of collective trust accounts and (ii) Vanguard Investments Australia, Ltd., a wholly-owned subsidiary of The Vanguard Group, Inc., is the beneficial owner of 347,593 shares as a result of its serving as investment manager of Australian investment offerings.
3. Minn. R. 7825.2200(A)(3)
Minn. R. 7825.2200(A), subd. 3 requires:
A list of all corporations five percent or more of whose voting securities are owned by any corporation or person owning five percent or more of the voting securities of the reporting public utility, or by any corporation or person in any chain of successive ownership, of each public utility, as defined in sub-item (2). Such list should indicate the name of the affiliated corporation or person which owns five percent or more of the voting securities of each corporation listed.
See chart above.
4. Minn. R. 7825.2200(A)(4) Minn. R. 7825.2200(A), subd. 4 requires:
A list identifying all corporations operating a public utility or servicing organization furnishing management, supervisory, construction,
3
Docket No. E002/GR-12-961 DOC Information Request No. 106 Attachment A
Docket No. E002/GR-15-826 Exhibit__(AEH-1), Appendix A
Page 10 of 97
engineering, accounting, financial, legal, and similar approved in the services to the reporting public utility, which have one or more officers or one or more directors in common with the reporting public utility; and every other organization which has directors in common with the public utility where the number of common directors is more than one-third of the total number of directors of the reporting public utility.
Xcel Energy Services Inc. (XES) provides the Company with management, supervisory, construction, engineering, accounting, financial, legal, and similar services pursuant to a Utility Service Agreement previously approved by the Securities and Exchange Commission.1 The most recent standard form service and cost allocation agreement was approved by the Commission in Docket No. E,G002/AI-08-760 on January 29, 2009. In Docket No. E,G002/AI-10-690, Order dated March 15, 2011, the Commission directed the Company to change the formula for the general allocator used in allocating corporate expenses to substitute Allocated Labor Hours with Overtime in place of Number of Employees. The allocation of XES costs to the Company’s regulated utility operations in Minnesota under the Utility Service Agreement was also reviewed in the Company’s 2008, 2010 and 2012 electric general rate cases (Docket Nos. E002/GR-08-1065, E002/GR-10-971 and E002/GR-12-961), and 2009 natural gas general rate case (Docket No. G002/GR-09-1153). The allocation of XES costs to the Company’s regulated utility are currently under review in the Company’s 2013 electric rate case (Docket No. E002/GR-13-868). In addition, on March 24, 2014, the Company filed a petition (Docket No. E002/AI-14-234) with the Commission to update the Utility Service Agreement to reflect allocations consistent with the Company’s Cost Assignment and Allocation Manual as filed in the Company’s 2013 electric rate case. The Commission approved the Second Amendment to the Service Agreement in its November 20, 2014 Order. We provide a Legal Structure Chart as Attachment A to this filing. The Chart shows the utility operating company and intermediate holding company subsidiaries of Xcel Energy Inc. effective as of December 31, 2014, including percentage ownership. Attachment B to this filing provides the names of the principal officers and directors of NSPM. Certain of these officers and directors are also officers and/or directors of the other Xcel Energy operating companies (described
1 Effective February 8, 2006, federal jurisdiction over the Utility Service Agreement transferred from the SEC to the Federal Energy Regulatory Commission under the Public Utility Holding Company Act of 2005 (PUHCA 2005).
4
Docket No. E002/GR-12-961 DOC Information Request No. 106 Attachment A
Docket No. E002/GR-15-826 Exhibit__(AEH-1), Appendix A
Page 11 of 97

below) or other Xcel Energy Inc. subsidiaries. Attachment C provides the names of the officers and directors of Xcel Energy Inc., XES, the subsidiary or utility operating company affiliates of the Company, the intermediate holding company subsidiaries of Xcel Energy Inc., and the Xcel Energy Foundation.
B. Company Legal Structure In this Section, we provide discussion of the NSPM subsidiaries. NSPM directly owns 100 percent of the voting securities of the following subsidiaries:
• NSP Nuclear Corporation • United Power and Land Company
NSP Nuclear Corporation, in turn, owns 100 percent of the voting securities of Nuclear Management Company, LLC (NMC). NMC is the legal entity created to provide management services to NSPM’s Prairie Island and Monticello nuclear power plants. In September 2008, the nuclear operating license and operations management of both nuclear power plants were transferred to NSPM.2
Currently, NSP Nuclear Corporation is a shell company with no ongoing nuclear operations. NSPM also directly owns 32.8 percent of the voting securities of Private Fuel Storage LLC. Private Fuel Storage LLC is an entity created to pursue development of an interim spent nuclear fuel storage facility, until the United States Department of Energy establishes a permanent spent fuel storage facility as required by federal law. C. NSPM Affiliates In addition to NSPM, Xcel Energy Inc. owns 100 percent of the voting securities (common stock) of several utility operating company subsidiaries, which provide regulated electric and/or natural gas service. These companies are: Northern States Power Company, a Wisconsin corporation (NSPW); Public Service Company of Colorado (PSCo); and Southwestern Public Service Company (SPS). Xcel Energy Inc. also owns 100 percent of the common stock of WestGas InterState, Inc., a small FERC-regulated interstate gas pipeline serving portions of Wyoming; and Xcel Energy WYCO Inc., which owns 50
2 The Company submitted an informational filing regarding this integration on April 14, 2008 in Docket No. E002/AI-99-1652. We also submitted a status report concerning NMC on February 26, 2010 in the same docket.
5
Docket No. E002/GR-12-961 DOC Information Request No. 106 Attachment A
Docket No. E002/GR-15-826 Exhibit__(AEH-1), Appendix A
Page 12 of 97

percent of a regulated natural gas storage facility in Colorado through WYCO Development LLC. In 2013, the regulated operations of the utility operating company subsidiaries, WestGas and WYCO comprised approximately 99 percent of all Xcel Energy Inc. operating revenue. Xcel Energy Inc. also owns 100 percent of the voting securities of certain intermediate holding company subsidiaries: Xcel Energy Communications Group Inc.; Xcel Energy International Inc.; Xcel Energy Markets Holdings Inc.; Xcel Energy Retail Holdings Inc.; Xcel Energy Services Inc.; Xcel Energy Ventures Inc.; Xcel Energy Wholesale Group Inc. and Xcel Energy Transmission Holding Company L.L.C. The intermediate holding company subsidiaries of Xcel Energy Inc. in turn own (subject to limited exceptions) 100 percent of the voting securities of various second tier subsidiaries of Xcel Energy Inc. Xcel Energy Inc. also owns 100 percent of Xcel Energy Foundation, a Minnesota non-profit corporation.
6
Docket No. E002/GR-12-961 DOC Information Request No. 106 Attachment A
Docket No. E002/GR-15-826 Exhibit__(AEH-1), Appendix A
Page 13 of 97
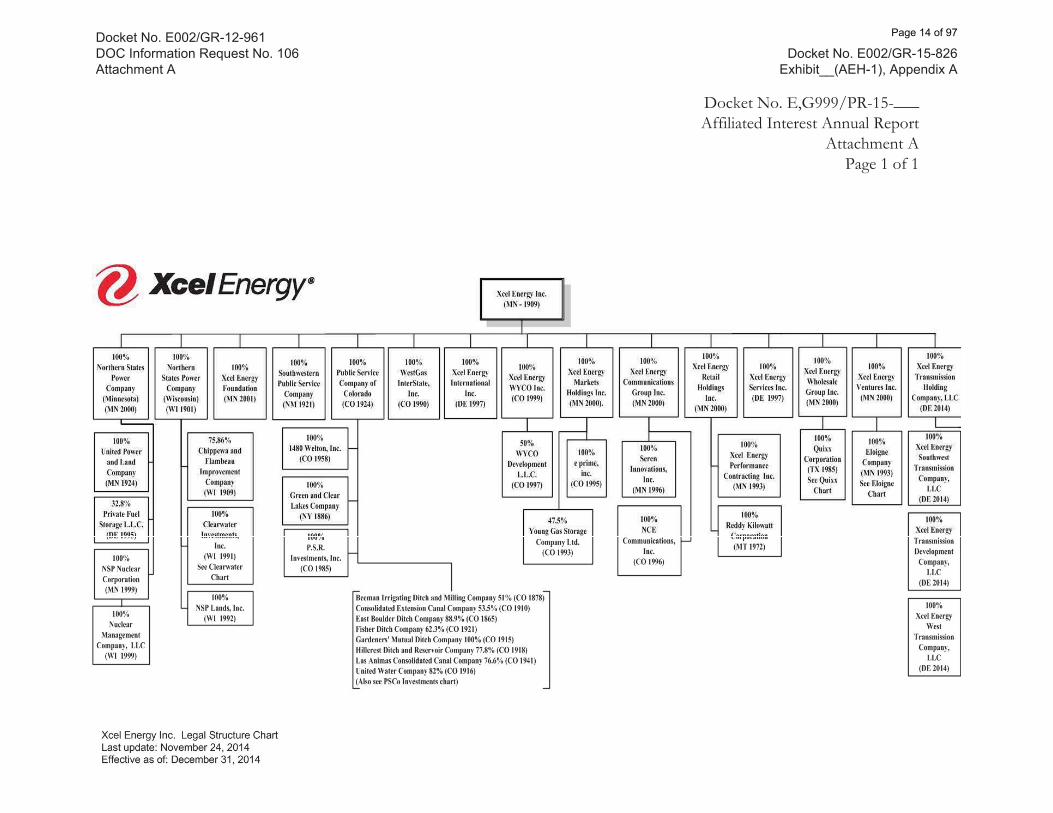
Docket No. E002/GR-12-961 DOC Information Request No. 106 Attachment A
Docket No. E002/GR-15-826 Exhibit__(AEH-1), Appendix A
Page 14 of 97
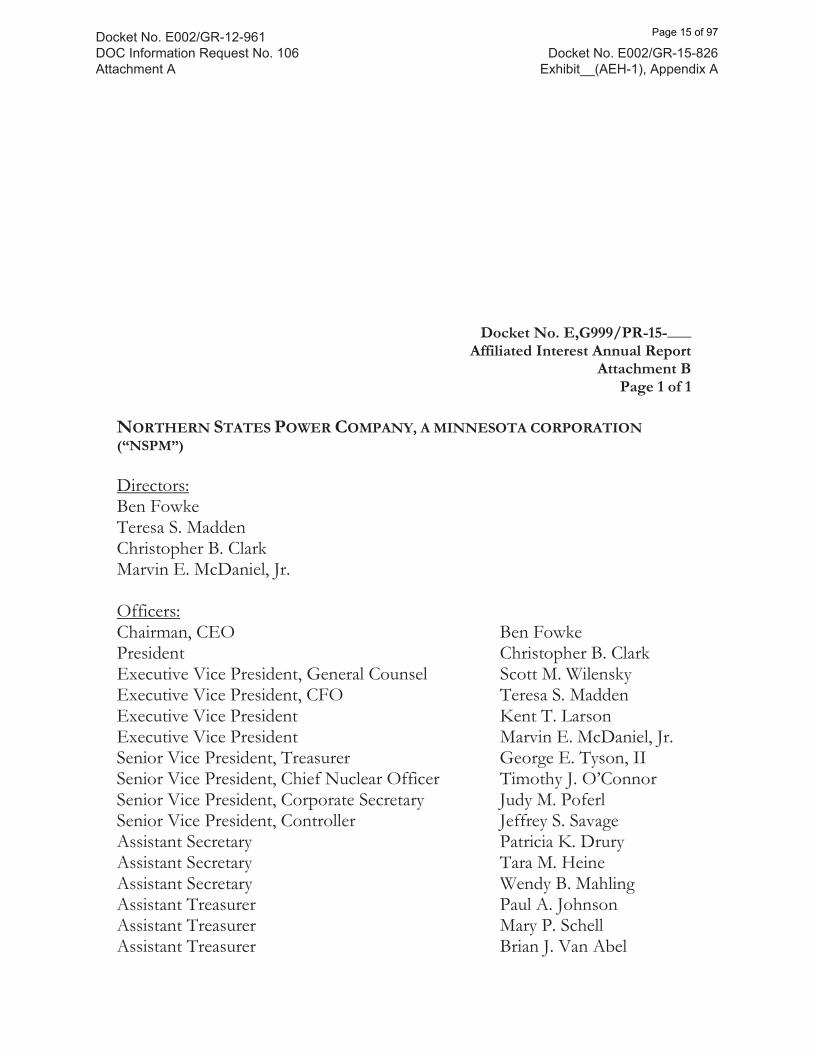
Docket No. E,G999/PR-15-___ Affiliated Interest Annual Report
Attachment B Page 1 of 1
NORTHERN STATES POWER COMPANY, A MINNESOTA CORPORATION (“NSPM”) Directors: Ben Fowke Teresa S. Madden Christopher B. Clark Marvin E. McDaniel, Jr. Officers: Chairman, CEO Ben Fowke President Christopher B. Clark Executive Vice President, General Counsel Scott M. Wilensky Executive Vice President, CFO Teresa S. Madden Executive Vice President Kent T. Larson Executive Vice President Marvin E. McDaniel, Jr. Senior Vice President, Treasurer George E. Tyson, II Senior Vice President, Chief Nuclear Officer Timothy J. O’Connor Senior Vice President, Corporate Secretary Judy M. Poferl Senior Vice President, Controller Jeffrey S. Savage Assistant Secretary Patricia K. Drury Assistant Secretary Tara M. Heine Assistant Secretary Wendy B. Mahling Assistant Treasurer Paul A. Johnson Assistant Treasurer Mary P. Schell Assistant Treasurer Brian J. Van Abel
Docket No. E002/GR-12-961 DOC Information Request No. 106 Attachment A
Docket No. E002/GR-15-826 Exhibit__(AEH-1), Appendix A
Page 15 of 97
Docket No. E,G999/PR-15-___ Affiliated Interest Annual Report
Attachment C Page 1 of 11
XCEL ENERGY INC. (HOLDING COMPANY PARENT OF NSPM)
Directors:1 Gail K. Boudreaux Richard K. Davis Ben Fowke Albert F. Moreno Richard T. O’Brien Christopher J. Policinski A. Patricia Sampson James J. Sheppard David A. Westerlund Kim Williams Timothy V. Wolf Officers: Chairman, President and CEO Ben Fowke Executive Vice President and
Group President, Operations Kent T. Larson Executive Vice President, General Counsel Scott M. Wilensky Senior Vice President, Corporate Secretary and
Executive Services Judy M. Poferl Executive Senior Vice President, CFO Teresa S. Madden Executive Vice President,
Group President, Utilities and CAO Marvin E. McDaniel, Jr. Senior Vice President, Treasurer George E. Tyson, II Senior Vice President, Controller Jeffrey S. Savage Assistant Secretary Patricia K. Drury Assistant Secretary Tara M. Heine Assistant Secretary Wendy B. Mahling Assistant Treasurer Paul A. Johnson Assistant Treasurer Mary P. Schell Assistant Treasurer Brian J. Van Abel
1 With the exception of Mr. Fowke, all Xcel Energy Inc. directors are independent.
Docket No. E002/GR-12-961 DOC Information Request No. 106 Attachment A
Docket No. E002/GR-15-826 Exhibit__(AEH-1), Appendix A
Page 16 of 97
Docket No. E,G999/PR-15-___ Affiliated Interest Annual Report
Attachment C Page 2 of 11
II. XCEL ENERGY SERVICES INC. (SERVICE COMPANY) Directors: Ben Fowke Teresa S. Madden Scott M. Wilensky Officers: Chairman, President and CEO Ben Fowke Executive Vice President, CFO Teresa S. Madden Executive Vice President, General Counsel Scott M. Wilensky Executive Vice President,
Group President, Utilities and CAO Marvin E. McDaniel, Jr. Executive Vice President and
Group President, Operations Kent T. Larson Senior Vice President & Chief Nuclear Officer Timothy J. O’Connor Senior Vice President, Corporate Secretary and
Executive Services Judy M. Poferl Senior Vice President and Treasurer George E. Tyson, II Senior Vice President and Controller Jeffrey S. Savage Assistant Secretary Patricia K. Drury Assistant Secretary Tara M. Heine Assistant Secretary Wendy B. Mahling Assistant Treasurer Paul A. Johnson Assistant Treasurer Mary P. Schell Assistant Treasurer Brian J. Van Abel
Docket No. E002/GR-12-961 DOC Information Request No. 106 Attachment A
Docket No. E002/GR-15-826 Exhibit__(AEH-1), Appendix A
Page 17 of 97

Docket No. E,G999/PR-15-___ Affiliated Interest Annual Report
Attachment C Page 3 of 11
III. SUBSIDIARIES OF THE COMPANY NSP NUCLEAR CORPORATION
Directors: Ben Fowke Timothy J. O’Connor Christopher B. Clark Officers: Chairman Ben Fowke President & CEO Ben Fowke Vice President & CFO Teresa S. Madden Vice President Timothy J. O’Connor Vice President & Secretary Judy M. Poferl Vice President & Treasurer George E. Tyson, II Assistant Secretary Patricia K. Drury Assistant Secretary Tara M. Heine Assistant Secretary Wendy B. Mahling Assistant Treasurer Paul A. Johnson Assistant Treasurer Mary P. Schell Assistant Treasurer Brian J. Van Abel
UNITED POWER AND LAND COMPANY
Directors: Lawrence A. Bick Dan Nygaard Christopher B. Clark Officers: Chairman & President Christopher B. Clark Vice President Lawrence A. Bick Vice President & Secretary Judy M. Poferl Vice President & Treasurer Mary P. Schell Assistant Secretary Patricia K. Drury Assistant Secretary Tara M. Heine Assistant Secretary Wendy B. Mahling Assistant Treasurer Paul A. Johnson Assistant Treasurer Eric V. Gray
Docket No. E002/GR-12-961 DOC Information Request No. 106 Attachment A
Docket No. E002/GR-15-826 Exhibit__(AEH-1), Appendix A
Page 18 of 97
Docket No. E,G999/PR-15-___ Affiliated Interest Annual Report
Attachment C Page 4 of 11
IV. UTILITY OPERATING COMPANY AFFILIATES OF COMPANY NORTHERN STATES POWER COMPANY, A WISCONSIN CORPORATION
Directors: Ben Fowke Teresa S. Madden Marvin E. McDaniel, Jr. Mark E. Stoering Officers: Chairman and CEO Ben Fowke President Mark E. Stoering Executive Vice President, General Counsel Scott M. Wilensky Executive Vice President, CFO Teresa S. Madden Executive Vice President Marvin E. McDaniel, Jr. Executive Vice President Kent T. Larson Senior Vice President, Treasurer George E. Tyson, II Senior Vice President, Corporate Secretary Judy M. Poferl Senior Vice President, Controller Jeffrey S. Savage Assistant Secretary Patricia K. Drury Assistant Secretary Jean C. Fox Assistant Secretary Tara M. Heine Assistant Secretary Wendy B. Mahling Assistant Treasurer Paul A. Johnson Assistant Treasurer Mary P. Schell Assistant Treasurer Brian J. Van Abel
Docket No. E002/GR-12-961 DOC Information Request No. 106 Attachment A
Docket No. E002/GR-15-826 Exhibit__(AEH-1), Appendix A
Page 19 of 97

Docket No. E,G999/PR-15-___ Affiliated Interest Annual Report
Attachment C Page 5 of 11
PUBLIC SERVICE COMPANY OF COLORADO
Directors: David L. Eves Ben Fowke Teresa S. Madden Marvin E. McDaniel, Jr. Officers: Chairman, CEO Ben Fowke President David L. Eves Executive Vice President, CFO Teresa S. Madden Executive Vice President, General Counsel Scott M. Wilensky Executive Vice President Marvin E. McDaniel, Jr. Executive Vice President Kent T. Larson Senior Vice President, Treasurer George E. Tyson, II Senior Vice President, Controller Jeffrey S. Savage Senior Vice President, Corporate Secretary Judy M. Poferl Assistant Secretary Patricia K. Drury Assistant Secretary Tara M. Heine Assistant Secretary Wendy B. Mahling Assistant Treasurer Paul A. Johnson Assistant Treasurer Mary P. Schell Assistant Treasurer Brian J. Van Abel
Docket No. E002/GR-12-961 DOC Information Request No. 106 Attachment A
Docket No. E002/GR-15-826 Exhibit__(AEH-1), Appendix A
Page 20 of 97

Docket No. E,G999/PR-15-___ Affiliated Interest Annual Report
Attachment C Page 6 of 11
SOUTHWESTERN PUBLIC SERVICE COMPANY
Directors: Ben Fowke David T. Hudson Teresa S. Madden Marvin E. McDaniel, Jr. Officers: Chairman, CEO Ben Fowke President David T. Hudson Executive Vice President, General Counsel Scott M. Wilensky Executive Vice President, CFO Teresa S. Madden Executive Vice President Marvin E. McDaniel, Jr. Executive Vice President Kent T. Larson Senior Vice President, Secretary Judy M. Poferl Senior Vice President, Treasurer George E. Tyson, II Senior Vice President, Controller Jeffrey S. Savage Assistant Secretary Patricia K. Drury Assistant Secretary Tara M. Heine Assistant Secretary Wendy B. Mahling Assistant Treasurer Paul A. Johnson Assistant Treasurer Mary P. Schell Assistant Treasurer Brian J. Van Abel WESTGAS INTERSTATE, INC. Directors: Cheryl F. Campbell Ben Fowke Principal Officers: Chairman, President & CEO Cheryl F. Campbell Vice President Gary Lakey Vice President & Treasurer George E. Tyson, II Vice President & Secretary Judy M. Poferl Assistant Secretary Patricia K. Drury Assistant Secretary Tara M. Heine Assistant Secretary Wendy B. Mahling Assistant Treasurer Paul A. Johnson Assistant Treasurer Mary P. Schell Assistant Treasurer Brian J. Van Abel
Docket No. E002/GR-12-961 DOC Information Request No. 106 Attachment A
Docket No. E002/GR-15-826 Exhibit__(AEH-1), Appendix A
Page 21 of 97

Docket No. E,G999/PR-15-___ Affiliated Interest Annual Report
Attachment C Page 7 of 11
V. INTERMEDIATE HOLDING COMPANY AFFILIATES OF COMPANY XCEL ENERGY COMMUNICATIONS GROUP INC. Directors: Ben Fowke Officers: Chairman, President & CEO Ben Fowke Vice President & CFO Teresa S. Madden Vice President & Secretary Judy M. Poferl Vice President & Treasurer George E. Tyson, II Vice President Marvin E. McDaniel, Jr. Assistant Secretary Patricia K. Drury Assistant Secretary Tara M. Heine Assistant Secretary Wendy B. Mahling Assistant Treasurer Paul A. Johnson Assistant Treasurer Mary P. Schell Assistant Treasurer Brian J. Van Abel
XCEL ENERGY INTERNATIONAL INC. Director: Ben Fowke Officers: Chairman, President & CEO Ben Fowke Vice President & Secretary Judy M. Poferl Vice President & Treasurer George E. Tyson, II Vice President & CFO Teresa S. Madden Assistant Secretary Patricia K. Drury Assistant Secretary Tara M. Heine Assistant Secretary Wendy B. Mahling Assistant Treasurer Paul A. Johnson Assistant Treasurer Mary P. Schell Assistant Treasurer Brian J. Van Abel
Docket No. E002/GR-12-961 DOC Information Request No. 106 Attachment A
Docket No. E002/GR-15-826 Exhibit__(AEH-1), Appendix A
Page 22 of 97

Docket No. E,G999/PR-15-___ Affiliated Interest Annual Report
Attachment C Page 8 of 11
XCEL ENERGY MARKETS HOLDINGS INC. Directors: Ben Fowke Officers: President & CEO Ben Fowke Vice President & CFO Teresa S. Madden Vice President & Secretary Judy M. Poferl Vice President & Treasurer George E. Tyson, II Assistant Secretary Patricia K. Drury Assistant Secretary Tara M. Heine Assistant Secretary Wendy B. Mahling Assistant Treasurer Paul A. Johnson Assistant Treasurer Mary P. Schell Assistant Treasurer Brian J. Van Abel XCEL ENERGY RETAIL HOLDINGS INC.
Directors: Ben Fowke Officers: Chair, President & CEO Ben Fowke Vice President & CFO Teresa S. Madden Vice President & Treasurer George E. Tyson, II Vice President & Secretary Judy M. Poferl Assistant Secretary Patricia K. Drury Assistant Secretary Tara M. Heine Assistant Secretary Wendy B. Mahling Assistant Treasurer Paul A. Johnson Assistant Treasurer Mary P. Schell Assistant Treasurer Brian J. Van Abel
Docket No. E002/GR-12-961 DOC Information Request No. 106 Attachment A
Docket No. E002/GR-15-826 Exhibit__(AEH-1), Appendix A
Page 23 of 97
Docket No. E,G999/PR-15-___ Affiliated Interest Annual Report
Attachment C Page 9 of 11
XCEL ENERGY VENTURES INC.
Director: Ben Fowke Officers: Chairman, President & CEO Ben Fowke Vice President & CFO Teresa S. Madden Vice President & Secretary Judy M. Poferl Vice President & Treasurer George E. Tyson, II Vice President Marvin E. McDaniel, Jr. Assistant Secretary Patricia K. Drury Assistant Secretary Tara M. Heine Assistant Secretary Wendy B. Mahling Assistant Treasurer Paul A. Johnson Assistant Treasurer Mary P. Schell Assistant Treasurer Brian J. Van Abel XCEL ENERGY WHOLESALE GROUP INC. Directors: Ben Fowke Officers: Chairman, President & CEO Ben Fowke Vice President & CFO Teresa S. Madden Vice President & Secretary Judy M. Poferl Vice President & Treasurer George E. Tyson, II Vice President Marvin E. McDaniel, Jr. Assistant Secretary Patricia K. Drury Assistant Secretary Tara M. Heine Assistant Secretary Wendy B. Mahling Assistant Treasurer Paul A. Johnson Assistant Treasurer Mary P. Schell Assistant Treasurer Brian J. Van Abel
Docket No. E002/GR-12-961 DOC Information Request No. 106 Attachment A
Docket No. E002/GR-15-826 Exhibit__(AEH-1), Appendix A
Page 24 of 97
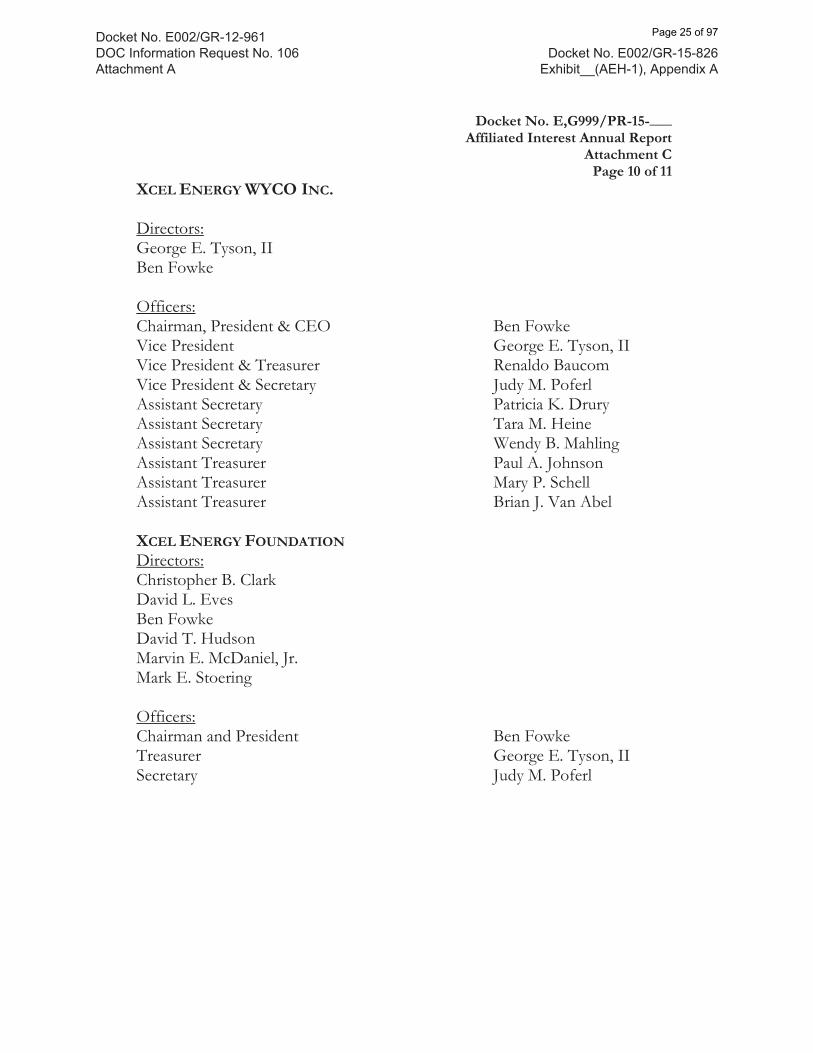
Docket No. E,G999/PR-15-___ Affiliated Interest Annual Report
Attachment C Page 10 of 11
XCEL ENERGY WYCO INC. Directors: George E. Tyson, II Ben Fowke Officers: Chairman, President & CEO Ben Fowke Vice President George E. Tyson, II Vice President & Treasurer Renaldo Baucom Vice President & Secretary Judy M. Poferl Assistant Secretary Patricia K. Drury Assistant Secretary Tara M. Heine Assistant Secretary Wendy B. Mahling Assistant Treasurer Paul A. Johnson Assistant Treasurer Mary P. Schell Assistant Treasurer Brian J. Van Abel XCEL ENERGY FOUNDATION
Directors: Christopher B. Clark David L. Eves Ben Fowke David T. Hudson Marvin E. McDaniel, Jr. Mark E. Stoering Officers: Chairman and President Ben Fowke Treasurer George E. Tyson, II Secretary Judy M. Poferl
Docket No. E002/GR-12-961 DOC Information Request No. 106 Attachment A
Docket No. E002/GR-15-826 Exhibit__(AEH-1), Appendix A
Page 25 of 97
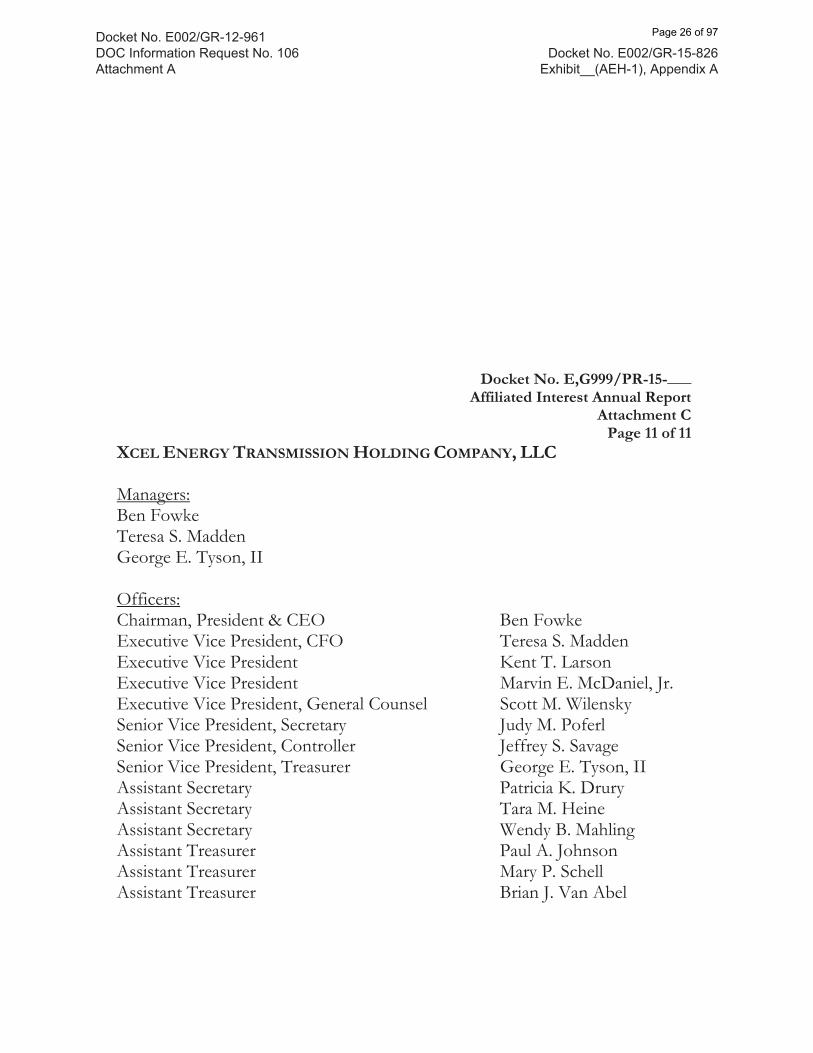
Docket No. E,G999/PR-15-___ Affiliated Interest Annual Report
Attachment C Page 11 of 11
XCEL ENERGY TRANSMISSION HOLDING COMPANY, LLC Managers: Ben Fowke Teresa S. Madden George E. Tyson, II Officers: Chairman, President & CEO Ben Fowke Executive Vice President, CFO Teresa S. Madden Executive Vice President Kent T. Larson Executive Vice President Marvin E. McDaniel, Jr. Executive Vice President, General Counsel Scott M. Wilensky Senior Vice President, Secretary Judy M. Poferl Senior Vice President, Controller Jeffrey S. Savage Senior Vice President, Treasurer George E. Tyson, II Assistant Secretary Patricia K. Drury Assistant Secretary Tara M. Heine Assistant Secretary Wendy B. Mahling Assistant Treasurer Paul A. Johnson Assistant Treasurer Mary P. Schell Assistant Treasurer Brian J. Van Abel
Docket No. E002/GR-12-961 DOC Information Request No. 106 Attachment A
Docket No. E002/GR-15-826 Exhibit__(AEH-1), Appendix A
Page 26 of 97
CERTIFICATE OF SERVICE I, Tiffany Hughes, hereby certify that I have this day served copies of the foregoing document or a summary thereof on the attached lists of persons:
xx by depositing a true and correct copy or summary thereof, properly enveloped with postage paid, in the United States Mail at Minneapolis, Minnesota; or
xx via electronic filing
XCEL ENERGY’S MISCELLANEOUS GAS AND ELECTRIC SERVICE LIST Dated this 1st day of April 2015 /s/ _______________________________ Tiffany Hughes Records Analyst
Docket No. E002/GR-12-961 DOC Information Request No. 106 Attachment A
Docket No. E002/GR-15-826 Exhibit__(AEH-1), Appendix A
Page 27 of 97
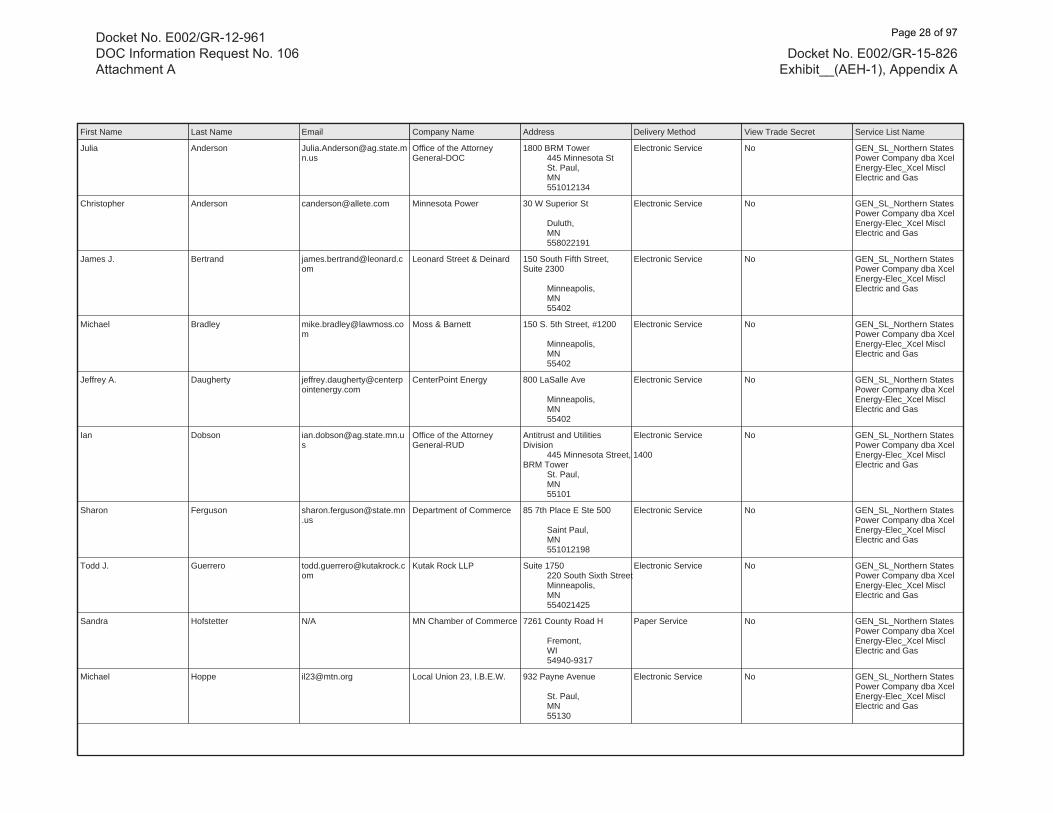
First Name Last Name Email Company Name Address Delivery Method View Trade Secret Service List Name
Julia Anderson [email protected]
Office of the AttorneyGeneral-DOC
1800 BRM Tower 445 Minnesota St St. Paul, MN 551012134
Electronic Service No GEN_SL_Northern StatesPower Company dba XcelEnergy-Elec_Xcel MisclElectric and Gas
Christopher Anderson [email protected] Minnesota Power 30 W Superior St
Duluth, MN 558022191
Electronic Service No GEN_SL_Northern StatesPower Company dba XcelEnergy-Elec_Xcel MisclElectric and Gas
James J. Bertrand [email protected]
Leonard Street & Deinard 150 South Fifth Street,Suite 2300
Minneapolis, MN 55402
Electronic Service No GEN_SL_Northern StatesPower Company dba XcelEnergy-Elec_Xcel MisclElectric and Gas
Michael Bradley [email protected]
Moss & Barnett 150 S. 5th Street, #1200
Minneapolis, MN 55402
Electronic Service No GEN_SL_Northern StatesPower Company dba XcelEnergy-Elec_Xcel MisclElectric and Gas
Jeffrey A. Daugherty [email protected]
CenterPoint Energy 800 LaSalle Ave
Minneapolis, MN 55402
Electronic Service No GEN_SL_Northern StatesPower Company dba XcelEnergy-Elec_Xcel MisclElectric and Gas
Ian Dobson [email protected]
Office of the AttorneyGeneral-RUD
Antitrust and UtilitiesDivision 445 Minnesota Street, 1400BRM Tower St. Paul, MN 55101
Electronic Service No GEN_SL_Northern StatesPower Company dba XcelEnergy-Elec_Xcel MisclElectric and Gas
Sharon Ferguson [email protected]
Department of Commerce 85 7th Place E Ste 500
Saint Paul, MN 551012198
Electronic Service No GEN_SL_Northern StatesPower Company dba XcelEnergy-Elec_Xcel MisclElectric and Gas
Todd J. Guerrero [email protected]
Kutak Rock LLP Suite 1750 220 South Sixth Street Minneapolis, MN 554021425
Electronic Service No GEN_SL_Northern StatesPower Company dba XcelEnergy-Elec_Xcel MisclElectric and Gas
Sandra Hofstetter N/A MN Chamber of Commerce 7261 County Road H
Fremont, WI 54940-9317
Paper Service No GEN_SL_Northern StatesPower Company dba XcelEnergy-Elec_Xcel MisclElectric and Gas
Michael Hoppe [email protected] Local Union 23, I.B.E.W. 932 Payne Avenue
St. Paul, MN 55130
Electronic Service No GEN_SL_Northern StatesPower Company dba XcelEnergy-Elec_Xcel MisclElectric and Gas
Docket No. E002/GR-12-961 DOC Information Request No. 106 Attachment A
Docket No. E002/GR-15-826 Exhibit__(AEH-1), Appendix A
Page 28 of 97

2
First Name Last Name Email Company Name Address Delivery Method View Trade Secret Service List Name
Tiffany Hughes [email protected]
Xcel Energy 414 Nicollet Mall FL 7
Minneapolis, MN 554011993
Electronic Service No GEN_SL_Northern StatesPower Company dba XcelEnergy-Elec_Xcel MisclElectric and Gas
Alan Jenkins [email protected] Jenkins at Law 2265 Roswell Road Suite 100 Marietta, GA 30062
Electronic Service No GEN_SL_Northern StatesPower Company dba XcelEnergy-Elec_Xcel MisclElectric and Gas
Richard Johnson [email protected]
Moss & Barnett 150 S. 5th Street Suite 1200 Minneapolis, MN 55402
Electronic Service No GEN_SL_Northern StatesPower Company dba XcelEnergy-Elec_Xcel MisclElectric and Gas
Mark J. Kaufman [email protected]
IBEW Local Union 949 12908 Nicollet AvenueSouth
Burnsville, MN 55337
Electronic Service No GEN_SL_Northern StatesPower Company dba XcelEnergy-Elec_Xcel MisclElectric and Gas
Thomas G. Koehler [email protected] Local Union #160, IBEW 2909 Anthony Ln
St Anthony Village, MN 55418-3238
Electronic Service No GEN_SL_Northern StatesPower Company dba XcelEnergy-Elec_Xcel MisclElectric and Gas
Michael Krikava [email protected] Briggs And Morgan, P.A. 2200 IDS Center 80 S 8th St Minneapolis, MN 55402
Electronic Service No GEN_SL_Northern StatesPower Company dba XcelEnergy-Elec_Xcel MisclElectric and Gas
Douglas Larson [email protected]
Dakota Electric Association 4300 220th St W
Farmington, MN 55024
Electronic Service No GEN_SL_Northern StatesPower Company dba XcelEnergy-Elec_Xcel MisclElectric and Gas
John Lindell [email protected] Office of the AttorneyGeneral-RUD
1400 BRM Tower 445 Minnesota St St. Paul, MN 551012130
Electronic Service No GEN_SL_Northern StatesPower Company dba XcelEnergy-Elec_Xcel MisclElectric and Gas
Pam Marshall [email protected] Energy CENTS Coalition 823 7th St E
St. Paul, MN 55106
Electronic Service No GEN_SL_Northern StatesPower Company dba XcelEnergy-Elec_Xcel MisclElectric and Gas
Andrew Moratzka [email protected] Stoel Rives LLP 33 South Sixth Street Suite 4200 Minneapolis, MN 55402
Electronic Service No GEN_SL_Northern StatesPower Company dba XcelEnergy-Elec_Xcel MisclElectric and Gas
Docket No. E002/GR-12-961 DOC Information Request No. 106 Attachment A
Docket No. E002/GR-15-826 Exhibit__(AEH-1), Appendix A
Page 29 of 97

3
First Name Last Name Email Company Name Address Delivery Method View Trade Secret Service List Name
David W. Niles [email protected]
Minnesota Municipal PowerAgency
Suite 300 200 South Sixth Street Minneapolis, MN 55402
Electronic Service No GEN_SL_Northern StatesPower Company dba XcelEnergy-Elec_Xcel MisclElectric and Gas
Richard Savelkoul [email protected]
Martin & Squires, P.A. 332 Minnesota Street SteW2750
St. Paul, MN 55101
Electronic Service No GEN_SL_Northern StatesPower Company dba XcelEnergy-Elec_Xcel MisclElectric and Gas
Ken Smith [email protected]
District Energy St. Paul Inc. 76 W Kellogg Blvd
St. Paul, MN 55102
Electronic Service No GEN_SL_Northern StatesPower Company dba XcelEnergy-Elec_Xcel MisclElectric and Gas
Ron Spangler, Jr. [email protected] Otter Tail Power Company 215 So. Cascade St. PO Box 496 Fergus Falls, MN 565380496
Electronic Service No GEN_SL_Northern StatesPower Company dba XcelEnergy-Elec_Xcel MisclElectric and Gas
Byron E. Starns [email protected] Leonard Street andDeinard
150 South 5th Street Suite 2300 Minneapolis, MN 55402
Electronic Service No GEN_SL_Northern StatesPower Company dba XcelEnergy-Elec_Xcel MisclElectric and Gas
James M. Strommen [email protected]
Kennedy & Graven,Chartered
470 U.S. Bank Plaza 200 South Sixth Street Minneapolis, MN 55402
Electronic Service No GEN_SL_Northern StatesPower Company dba XcelEnergy-Elec_Xcel MisclElectric and Gas
Eric Swanson [email protected] Winthrop Weinstine 225 S 6th St Ste 3500 Capella Tower Minneapolis, MN 554024629
Electronic Service No GEN_SL_Northern StatesPower Company dba XcelEnergy-Elec_Xcel MisclElectric and Gas
Lisa Veith [email protected] City of St. Paul 400 City Hall andCourthouse 15 West Kellogg Blvd. St. Paul, MN 55102
Electronic Service No GEN_SL_Northern StatesPower Company dba XcelEnergy-Elec_Xcel MisclElectric and Gas
Daniel P Wolf [email protected] Public Utilities Commission 121 7th Place East Suite 350 St. Paul, MN 551012147
Electronic Service No GEN_SL_Northern StatesPower Company dba XcelEnergy-Elec_Xcel MisclElectric and Gas
Docket No. E002/GR-12-961 DOC Information Request No. 106 Attachment A
Docket No. E002/GR-15-826 Exhibit__(AEH-1), Appendix A
Page 30 of 97

Northern States Power Company
Docket No. E002/GR-12-961DOC Information Request No. 106Attachment B
Docket No. E002/GR-15-826Exhibit__(AEH-1), Appendix A
30-Apr-15
FERC Form 561 is being filed on behalf of the following individuals:
Docket Number
Patricia K. Drury ID-7290-000
Benjamin G.S. Fowke III ID-4171-000
Tara M. Heine ID-5588-000
Paul A. Johnson ID-5635-000
Kent T. Larson ID-6245-000
Teresa S. Madden ID-3073-000
Wendy B. Mahling ID-7213-000
Marvin E. McDaniel ID-6150-000
Timothy J. O’Connor ID-7087-000
Judy M. Poferl ID-7148-000
Jeffrey S. Savage ID-6680-000
Mary P. Schell ID-5593-000
George E. Tyson, II ID-4175-000
Brian J. Van Abel ID-7433-000
Scott M. Wilensky ID-6679-000
FERC Form 561 is being filed on behalf of the following individuals who do not currently have a docket number assigned: Mark E. StoeringJean C. Fox
FERC Form 561 is not being filed on behalf of the following individuals who previously filed informational reports due to retirement or resignation:
David M. Sparby ID-5160-000 (retirement)
The utility contact is:Tara M. HeineAssistant Corporate SecretaryXcel Energy Inc.414 Nicollet Mall, Suite 500Minneapolis, MN 55401612-215-5391e mail: [email protected]
Page 31 of 97
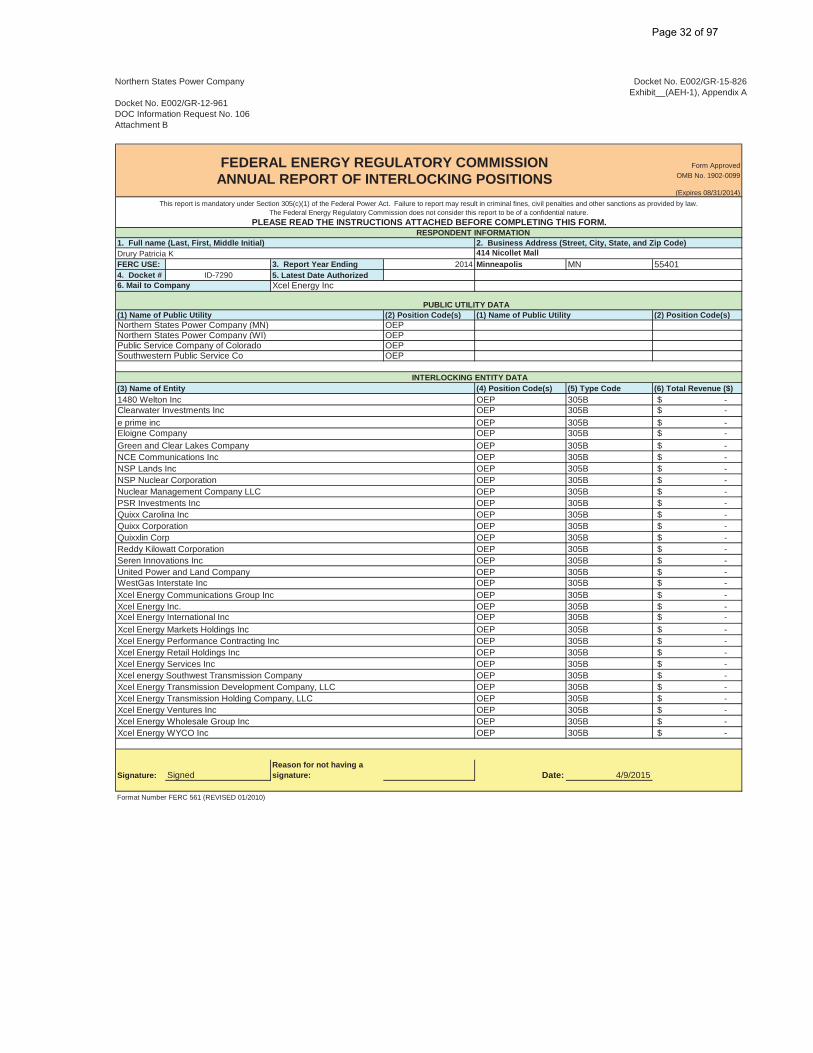
Northern States Power Company
Docket No. E002/GR-12-961DOC Information Request No. 106Attachment B
Docket No. E002/GR-15-826Exhibit__(AEH-1), Appendix A
Form ApprovedOMB No. 1902-0099
(Expires 08/31/2014)
RESPONDENT INFORMATION1. Full name (Last, First, Middle Initial) 2. Business Address (Street, City, State, and Zip Code)
FERC USE: 3. Report Year Ending 2014 Minneapolis MN 554014. Docket # ID-7290 5. Latest Date Authorized
PUBLIC UTILITY DATA(2) Position Code(s) (2) Position Code(s)
Northern States Power Company (MN) OEPNorthern States Power Company (WI) OEPPublic Service Company of Colorado OEPSouthwestern Public Service Co OEP
INTERLOCKING ENTITY DATA(4) Position Code(s) (5) Type Code (6) Total Revenue ($)
1480 Welton Inc OEP 305B -$Clearwater Investments Inc OEP 305B -$e prime inc OEP 305B -$Eloigne Company OEP 305B -$Green and Clear Lakes Company OEP 305B -$NCE Communications Inc OEP 305B -$NSP Lands Inc OEP 305B -$NSP Nuclear Corporation OEP 305B -$Nuclear Management Company LLC OEP 305B -$PSR Investments Inc OEP 305B -$Quixx Carolina Inc OEP 305B -$Quixx Corporation OEP 305B -$Quixxlin Corp OEP 305B -$Reddy Kilowatt Corporation OEP 305B -$Seren Innovations Inc OEP 305B -$United Power and Land Company OEP 305B -$WestGas Interstate Inc OEP 305B -$Xcel Energy Communications Group Inc OEP 305B -$Xcel Energy Inc. OEP 305B -$Xcel Energy International Inc OEP 305B -$Xcel Energy Markets Holdings Inc OEP 305B -$Xcel Energy Performance Contracting Inc OEP 305B -$Xcel Energy Retail Holdings Inc OEP 305B -$Xcel Energy Services Inc OEP 305B -$Xcel energy Southwest Transmission Company OEP 305B -$Xcel Energy Transmission Development Company, LLC OEP 305B -$Xcel Energy Transmission Holding Company, LLC OEP 305B -$Xcel Energy Ventures Inc OEP 305B -$Xcel Energy Wholesale Group Inc OEP 305B -$Xcel Energy WYCO Inc OEP 305B -$
Signature: SignedReason for not having a signature: Date: 4/9/2015
Format Number FERC 561 (REVISED 01/2010)
(1) Name of Public Utility
Xcel Energy Inc
Drury Patricia K
(1) Name of Public Utility
6. Mail to Company
This report is mandatory under Section 305(c)(1) of the Federal Power Act. Failure to report may result in criminal fines, civil penalties and other sanctions as provided by law.The Federal Energy Regulatory Commission does not consider this report to be of a confidential nature.
(3) Name of Entity
FEDERAL ENERGY REGULATORY COMMISSIONANNUAL REPORT OF INTERLOCKING POSITIONS
414 Nicollet Mall
PLEASE READ THE INSTRUCTIONS ATTACHED BEFORE COMPLETING THIS FORM.
Page 32 of 97
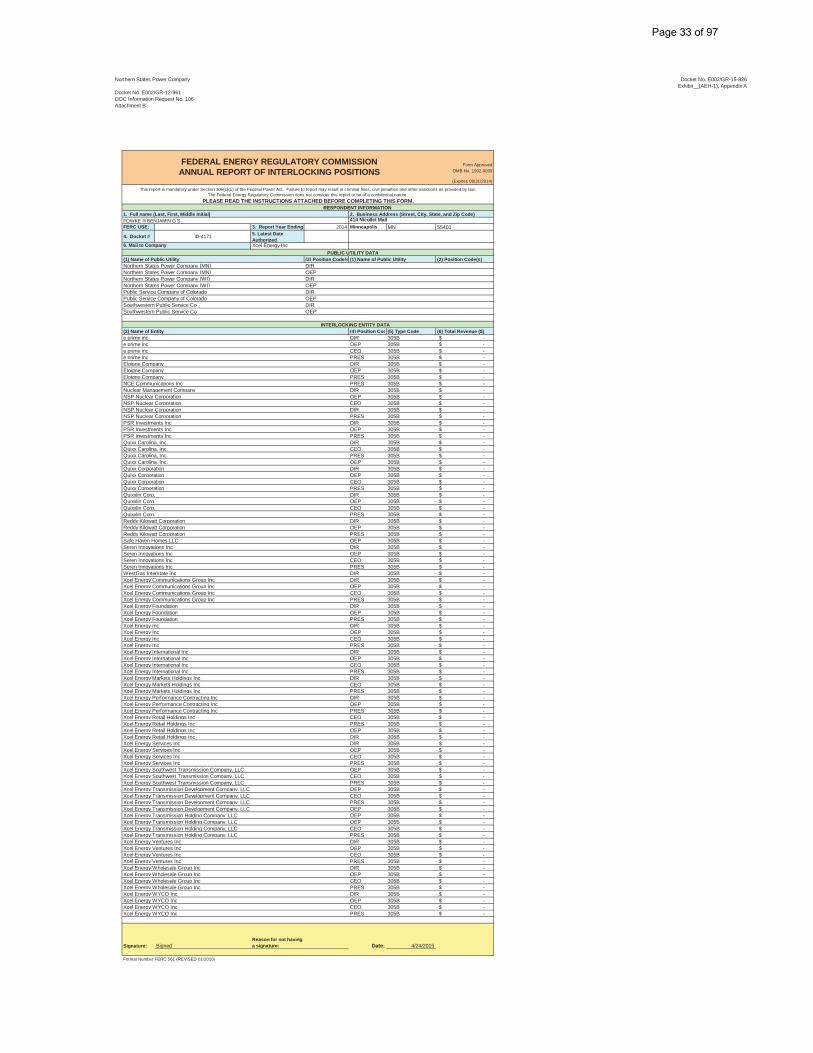
Northern States Power Company
Docket No. E002/GR-12-961DOC Information Request No. 106Attachment B
Docket No. E002/GR-15-826Exhibit__(AEH-1), Appendix A
Form ApprovedOMB No. 1902-0099
(Expires 08/31/2014)
RESPONDENT INFORMATION1. Full name (Last, First, Middle Initial) 2. Business Address (Street, City, State, and Zip Code)
FERC USE: 3. Report Year Ending 2014 Minneapolis MN 55401
4. Docket # ID-4171 5. Latest Date Authorized
PUBLIC UTILITY DATA(2) Position Code(s (2) Position Code(s)
Northern States Power Company (MN) DIRNorthern States Power Company (MN) OEPNorthern States Power Company (WI) DIRNorthern States Power Company (WI) OEPPublic Service Company of Colorado DIRPublic Service Company of Colorado OEPSouthwestern Public Service Co DIRSouthwestern Public Service Co OEP
INTERLOCKING ENTITY DATA(4) Position Cod (5) Type Code (6) Total Revenue ($)
e prime inc DIR 305B -$e prime inc OEP 305B -$e prime inc CEO 305B -$e prime inc PRES 305B -$Eloigne Company DIR 305B -$Eloigne Company OEP 305B -$Eloigne Company PRES 305B -$NCE Communications Inc PRES 305B -$Nuclear Management Company DIR 305B -$NSP Nuclear Corporation OEP 305B -$NSP Nuclear Corporation CEO 305B -$NSP Nuclear Corporation DIR 305B -$NSP Nuclear Corporation PRES 305B -$PSR Investments Inc DIR 305B -$PSR Investments Inc OEP 305B -$PSR Investments Inc PRES 305B -$Quixx Carolina, Inc. DIR 305B -$Quixx Carolina, Inc. CEO 305B -$Quixx Carolina, Inc. PRES 305B -$Quixx Carolina, Inc. OEP 305B -$Quixx Corporation DIR 305B -$Quixx Corporation OEP 305B -$Quixx Corporation CEO 305B -$Quixx Corporation PRES 305B -$Quixxlin Corp. DIR 305B -$Quixxlin Corp. OEP 305B -$Quixxlin Corp. CEO 305B -$Quixxlin Corp. PRES 305B -$Reddy Kilowatt Corporation DIR 305B -$Reddy Kilowatt Corporation OEP 305B -$Reddy Kilowatt Corporation PRES 305B -$Safe Haven Homes LLC OEP 305B -$Seren Innovations Inc DIR 305B -$Seren Innovations Inc OEP 305B -$Seren Innovations Inc CEO 305B -$Seren Innovations Inc PRES 305B -$WestGas Interstate Inc DIR 305B -$Xcel Energy Communications Group Inc DIR 305B -$Xcel Energy Communications Group Inc OEP 305B -$Xcel Energy Communications Group Inc CEO 305B -$Xcel Energy Communications Group Inc PRES 305B -$Xcel Energy Foundation DIR 305B -$Xcel Energy Foundation OEP 305B -$Xcel Energy Foundation PRES 305B -$Xcel Energy Inc DIR 305B -$Xcel Energy Inc OEP 305B -$Xcel Energy Inc CEO 305B -$Xcel Energy Inc PRES 305B -$Xcel Energy International Inc DIR 305B -$Xcel Energy International Inc OEP 305B -$Xcel Energy International Inc CEO 305B -$Xcel Energy International Inc PRES 305B -$Xcel Energy Markets Holdings Inc DIR 305B -$Xcel Energy Markets Holdings Inc CEO 305B -$Xcel Energy Markets Holdings Inc PRES 305B -$Xcel Energy Performance Contracting Inc DIR 305B -$Xcel Energy Performance Contracting Inc OEP 305B -$Xcel Energy Performance Contracting Inc PRES 305B -$Xcel Energy Retail Holdings Inc CEO 305B -$Xcel Energy Retail Holdings Inc PRES 305B -$Xcel Energy Retail Holdings Inc OEP 305B -$Xcel Energy Retail Holdings Inc DIR 305B -$Xcel Energy Services Inc DIR 305B -$Xcel Energy Services Inc OEP 305B -$Xcel Energy Services Inc CEO 305B -$Xcel Energy Services Inc PRES 305B -$Xcel Energy Southwest Transmission Company, LLC OEP 305B -$Xcel Energy Southwest Transmission Company, LLC CEO 305B -$Xcel Energy Southwest Transmission Company, LLC PRES 305B -$Xcel Energy Transmission Development Company, LLC OEP 305B -$Xcel Energy Transmission Development Company, LLC CEO 305B -$Xcel Energy Transmission Development Company, LLC PRES 305B -$Xcel Energy Transmission Development Company, LLC OEP 305B -$Xcel Energy Transmission Holding Company, LLC OEP 305B -$Xcel Energy Transmission Holding Company, LLC OEP 305B -$Xcel Energy Transmission Holding Company, LLC CEO 305B -$Xcel Energy Transmission Holding Company, LLC PRES 305B -$Xcel Energy Ventures Inc DIR 305B -$Xcel Energy Ventures Inc OEP 305B -$Xcel Energy Ventures Inc CEO 305B -$Xcel Energy Ventures Inc PRES 305B -$Xcel Energy Wholesale Group Inc DIR 305B -$Xcel Energy Wholesale Group Inc OEP 305B -$Xcel Energy Wholesale Group Inc CEO 305B -$Xcel Energy Wholesale Group Inc PRES 305B -$Xcel Energy WYCO Inc DIR 305B -$Xcel Energy WYCO Inc OEP 305B -$Xcel Energy WYCO Inc CEO 305B -$Xcel Energy WYCO Inc PRES 305B -$
Signature: SignedReason for not having a signature: Date: 4/24/2015
Format Number FERC 561 (REVISED 01/2010)
Xcel Energy Inc
(1) Name of Public Utility (1) Name of Public Utility
(3) Name of Entity
FEDERAL ENERGY REGULATORY COMMISSIONANNUAL REPORT OF INTERLOCKING POSITIONS
This report is mandatory under Section 305(c)(1) of the Federal Power Act. Failure to report may result in criminal fines, civil penalties and other sanctions as provided by law.The Federal Energy Regulatory Commission does not consider this report to be of a confidential nature.
PLEASE READ THE INSTRUCTIONS ATTACHED BEFORE COMPLETING THIS FORM.
FOWKE III BENJAMIN G S 414 Nicollet Mall
6. Mail to Company
Page 33 of 97
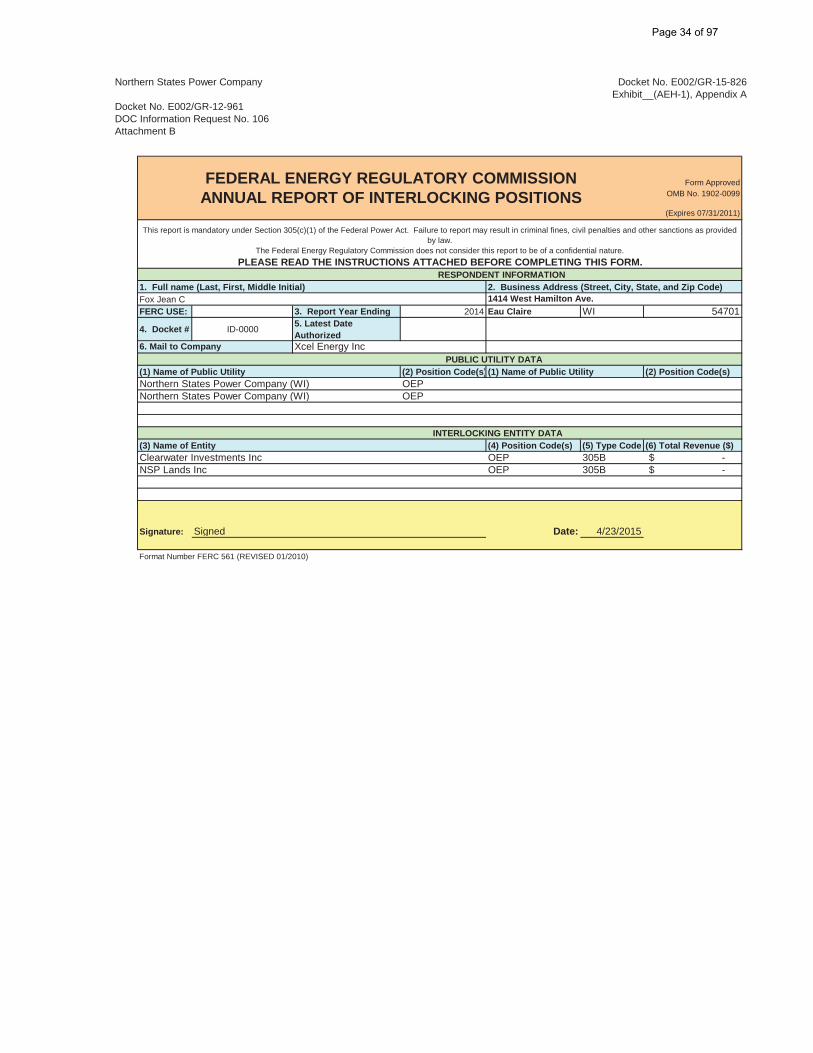
Northern States Power Company
Docket No. E002/GR-12-961DOC Information Request No. 106Attachment B
Docket No. E002/GR-15-826Exhibit__(AEH-1), Appendix A
Form ApprovedOMB No. 1902-0099
(Expires 07/31/2011)
RESPONDENT INFORMATION1. Full name (Last, First, Middle Initial) 2. Business Address (Street, City, State, and Zip Code)
FERC USE: 3. Report Year Ending 2014 Eau Claire WI 54701
4. Docket # ID-0000 5. Latest Date Authorized
PUBLIC UTILITY DATA(2) Position Code(s) (2) Position Code(s)
Northern States Power Company (WI) OEPNorthern States Power Company (WI) OEP
INTERLOCKING ENTITY DATA(4) Position Code(s) (5) Type Code (6) Total Revenue ($)
Clearwater Investments Inc OEP 305B -$ NSP Lands Inc OEP 305B -$
Signature: Signed Date: 4/23/2015
Format Number FERC 561 (REVISED 01/2010)
FEDERAL ENERGY REGULATORY COMMISSIONANNUAL REPORT OF INTERLOCKING POSITIONS
This report is mandatory under Section 305(c)(1) of the Federal Power Act. Failure to report may result in criminal fines, civil penalties and other sanctions as provided by law.
The Federal Energy Regulatory Commission does not consider this report to be of a confidential nature.PLEASE READ THE INSTRUCTIONS ATTACHED BEFORE COMPLETING THIS FORM.
Fox Jean C 1414 West Hamilton Ave.
(3) Name of Entity
6. Mail to Company Xcel Energy Inc
(1) Name of Public Utility (1) Name of Public Utility
Page 34 of 97
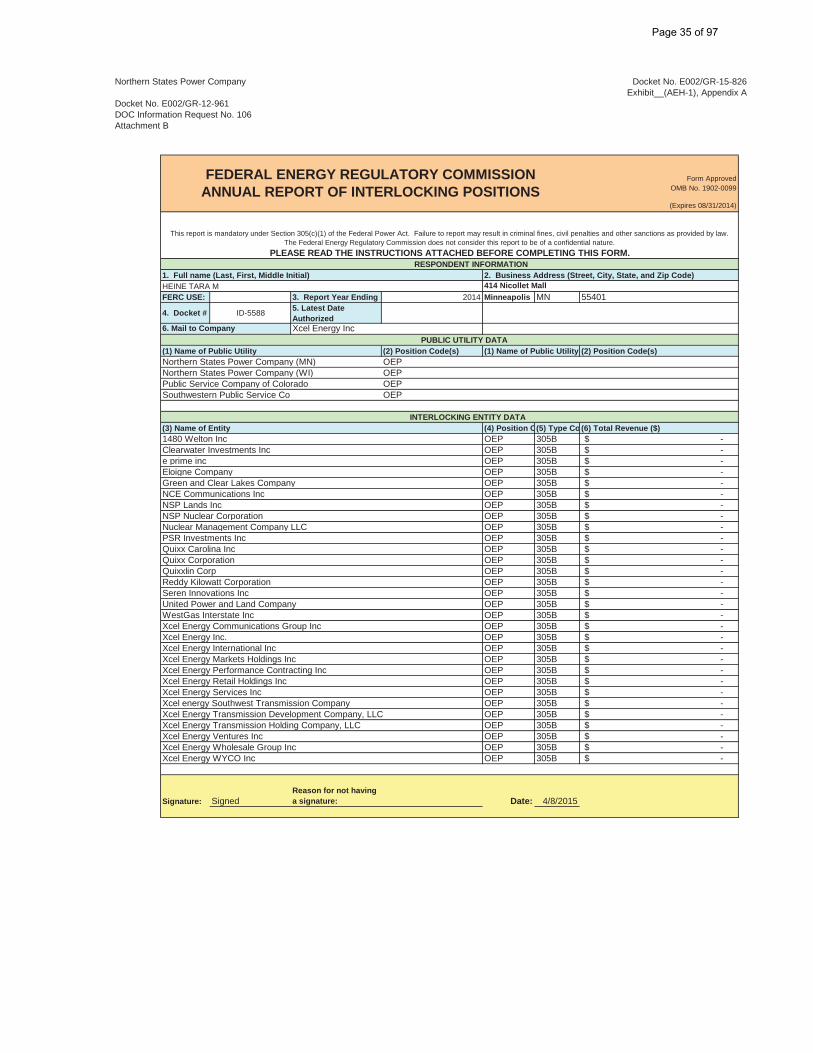
Northern States Power Company
Docket No. E002/GR-12-961DOC Information Request No. 106Attachment B
Docket No. E002/GR-15-826Exhibit__(AEH-1), Appendix A
Form ApprovedOMB No. 1902-0099
(Expires 08/31/2014)
RESPONDENT INFORMATION1. Full name (Last, First, Middle Initial) 2. Business Address (Street, City, State, and Zip Code)
FERC USE: 3. Report Year Ending 2014 Minneapolis MN 55401
4. Docket # ID-5588 5. Latest Date Authorized
PUBLIC UTILITY DATA(2) Position Code(s) (2) Position Code(s)
Northern States Power Company (MN) OEPNorthern States Power Company (WI) OEPPublic Service Company of Colorado OEPSouthwestern Public Service Co OEP
INTERLOCKING ENTITY DATA(4) Position C(5) Type Co (6) Total Revenue ($)
1480 Welton Inc OEP 305B -$ Clearwater Investments Inc OEP 305B -$ e prime inc OEP 305B -$ Eloigne Company OEP 305B -$ Green and Clear Lakes Company OEP 305B -$ NCE Communications Inc OEP 305B -$ NSP Lands Inc OEP 305B -$ NSP Nuclear Corporation OEP 305B -$ Nuclear Management Company LLC OEP 305B -$ PSR Investments Inc OEP 305B -$ Quixx Carolina Inc OEP 305B -$ Quixx Corporation OEP 305B -$ Quixxlin Corp OEP 305B -$ Reddy Kilowatt Corporation OEP 305B -$ Seren Innovations Inc OEP 305B -$ United Power and Land Company OEP 305B -$ WestGas Interstate Inc OEP 305B -$ Xcel Energy Communications Group Inc OEP 305B -$ Xcel Energy Inc. OEP 305B -$ Xcel Energy International Inc OEP 305B -$ Xcel Energy Markets Holdings Inc OEP 305B -$ Xcel Energy Performance Contracting Inc OEP 305B -$ Xcel Energy Retail Holdings Inc OEP 305B -$ Xcel Energy Services Inc OEP 305B -$ Xcel energy Southwest Transmission Company OEP 305B -$ Xcel Energy Transmission Development Company, LLC OEP 305B -$ Xcel Energy Transmission Holding Company, LLC OEP 305B -$ Xcel Energy Ventures Inc OEP 305B -$ Xcel Energy Wholesale Group Inc OEP 305B -$ Xcel Energy WYCO Inc OEP 305B -$
Signature: SignedReason for not having a signature: Date: 4/8/2015
FEDERAL ENERGY REGULATORY COMMISSIONANNUAL REPORT OF INTERLOCKING POSITIONS
This report is mandatory under Section 305(c)(1) of the Federal Power Act. Failure to report may result in criminal fines, civil penalties and other sanctions as provided by law.The Federal Energy Regulatory Commission does not consider this report to be of a confidential nature.
PLEASE READ THE INSTRUCTIONS ATTACHED BEFORE COMPLETING THIS FORM.
HEINE TARA M 414 Nicollet Mall
(3) Name of Entity
6. Mail to Company Xcel Energy Inc
(1) Name of Public Utility (1) Name of Public Utility
Page 35 of 97
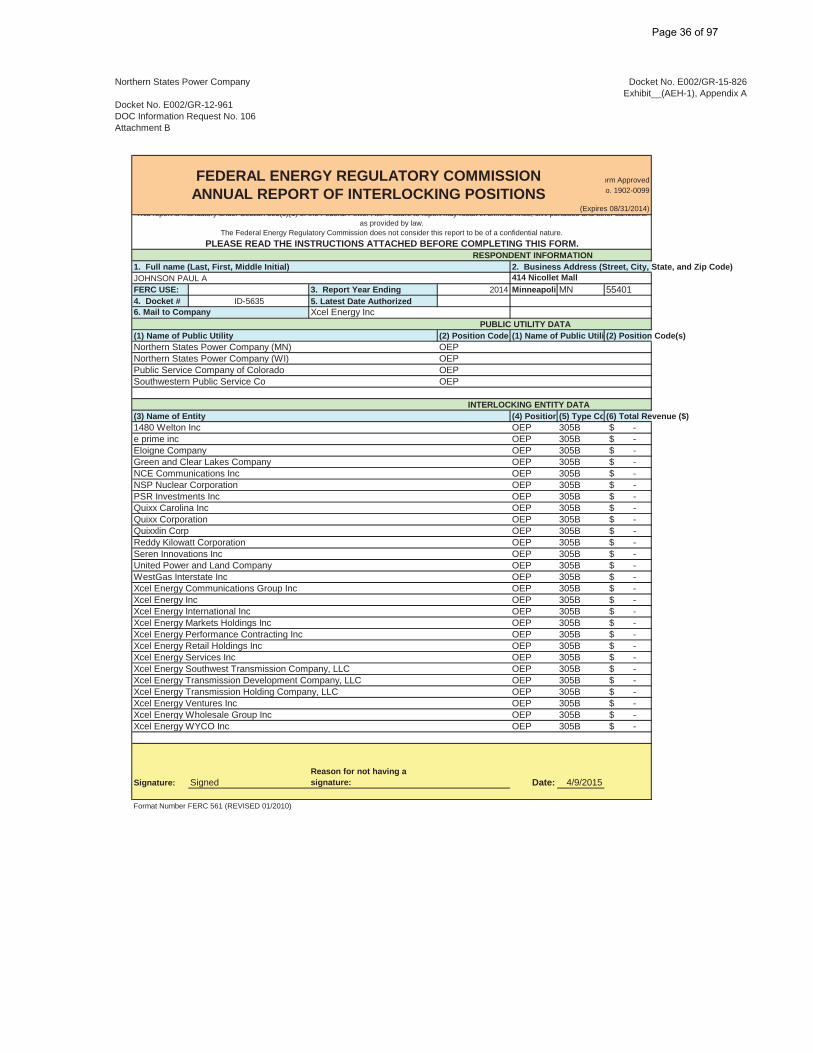
Northern States Power Company
Docket No. E002/GR-12-961DOC Information Request No. 106Attachment B
Docket No. E002/GR-15-826Exhibit__(AEH-1), Appendix A
orm ApprovedNo. 1902-0099
(Expires 08/31/2014)
RESPONDENT INFORMATION1. Full name (Last, First, Middle Initial) 2. Business Address (Street, City, State, and Zip Code)
FERC USE: 3. Report Year Ending 2014 MinneapolisMN 554014. Docket # ID-5635 5. Latest Date Authorized
PUBLIC UTILITY DATA(2) Position Code( (2) Position Code(s)
Northern States Power Company (MN) OEPNorthern States Power Company (WI) OEPPublic Service Company of Colorado OEPSouthwestern Public Service Co OEP
INTERLOCKING ENTITY DATA(4) Position(5) Type Co (6) Total Revenue ($)
1480 Welton Inc OEP 305B -$e prime inc OEP 305B -$Eloigne Company OEP 305B -$Green and Clear Lakes Company OEP 305B -$NCE Communications Inc OEP 305B -$NSP Nuclear Corporation OEP 305B -$PSR Investments Inc OEP 305B -$Quixx Carolina Inc OEP 305B -$Quixx Corporation OEP 305B -$Quixxlin Corp OEP 305B -$Reddy Kilowatt Corporation OEP 305B -$Seren Innovations Inc OEP 305B -$United Power and Land Company OEP 305B -$WestGas Interstate Inc OEP 305B -$Xcel Energy Communications Group Inc OEP 305B -$Xcel Energy Inc OEP 305B -$Xcel Energy International Inc OEP 305B -$Xcel Energy Markets Holdings Inc OEP 305B -$Xcel Energy Performance Contracting Inc OEP 305B -$Xcel Energy Retail Holdings Inc OEP 305B -$Xcel Energy Services Inc OEP 305B -$Xcel Energy Southwest Transmission Company, LLC OEP 305B -$Xcel Energy Transmission Development Company, LLC OEP 305B -$Xcel Energy Transmission Holding Company, LLC OEP 305B -$Xcel Energy Ventures Inc OEP 305B -$Xcel Energy Wholesale Group Inc OEP 305B -$Xcel Energy WYCO Inc OEP 305B -$
Signature: SignedReason for not having a signature: Date: 4/9/2015
Format Number FERC 561 (REVISED 01/2010)
FEDERAL ENERGY REGULATORY COMMISSIONANNUAL REPORT OF INTERLOCKING POSITIONS
This report is mandatory under Section 305(c)(1) of the Federal Power Act. Failure to report may result in criminal fines, civil penalties and other sanctions as provided by law.
The Federal Energy Regulatory Commission does not consider this report to be of a confidential nature.PLEASE READ THE INSTRUCTIONS ATTACHED BEFORE COMPLETING THIS FORM.
JOHNSON PAUL A 414 Nicollet Mall
(3) Name of Entity
6. Mail to Company Xcel Energy Inc
(1) Name of Public Utility (1) Name of Public Utilit
Page 36 of 97

Northern States Power Company
Docket No. E002/GR-12-961DOC Information Request No. 106Attachment B
Docket No. E002/GR-15-826Exhibit__(AEH-1), Appendix A
Form ApprovedOMB No. 1902-0099
(Expires 08/31/2014)
RESPONDENT INFORMATION1. Full name (Last, First, Middle Initial) 2. Business Address (Street, City, State, and Zip Code)
FERC USE: 3. Report Year Ending 2014 Minneapolis MN 55401
4. Docket # ID-6245-000 5. Latest Date Authorized
PUBLIC UTILITY DATA(2) Position Code(s) (2) Position Code(s)VP
Northern States Power Company (WI) VPPublic Service Company of Colorado VPSouthwestern Public Service Co VP
INTERLOCKING ENTITY DATA(4) Position Code(s) (5) Type Code (6) Total Revenue ($)DIR 305B -$OEP 305B -$VP 305B -$OEP 305B -$
Xcel Energy Southwest Transmission Company, LLC VP 305B -$Xcel Energy Transmission Development Company, LLC VP 305B -$Xcel Energy Transmission Holding Company, LLC VP 305B -$
Signature: SignedReason for not having a signature: Date: 4/9/2015
Format Number FERC 561 (REVISED 01/2010)
FEDERAL ENERGY REGULATORY COMMISSIONANNUAL REPORT OF INTERLOCKING POSITIONS
This report is mandatory under Section 305(c)(1) of the Federal Power Act. Failure to report may result in criminal fines, civil penalties and other sanctions as provided by law.The Federal Energy Regulatory Commission does not consider this report to be of a confidential nature.
PLEASE READ THE INSTRUCTIONS ATTACHED BEFORE COMPLETING THIS FORM.
LARSON KENT T. 414 Nicollet Mall
6. Mail to Company Xcel Energy Inc.
(1) Name of Public Utility (1) Name of Public UtilityNorthern States Power Company (MN)
(3) Name of EntityNuclear Management Company LLCQuixx CorporationXcel Energy Services Inc.Xcel Energy Services Inc.
Page 37 of 97
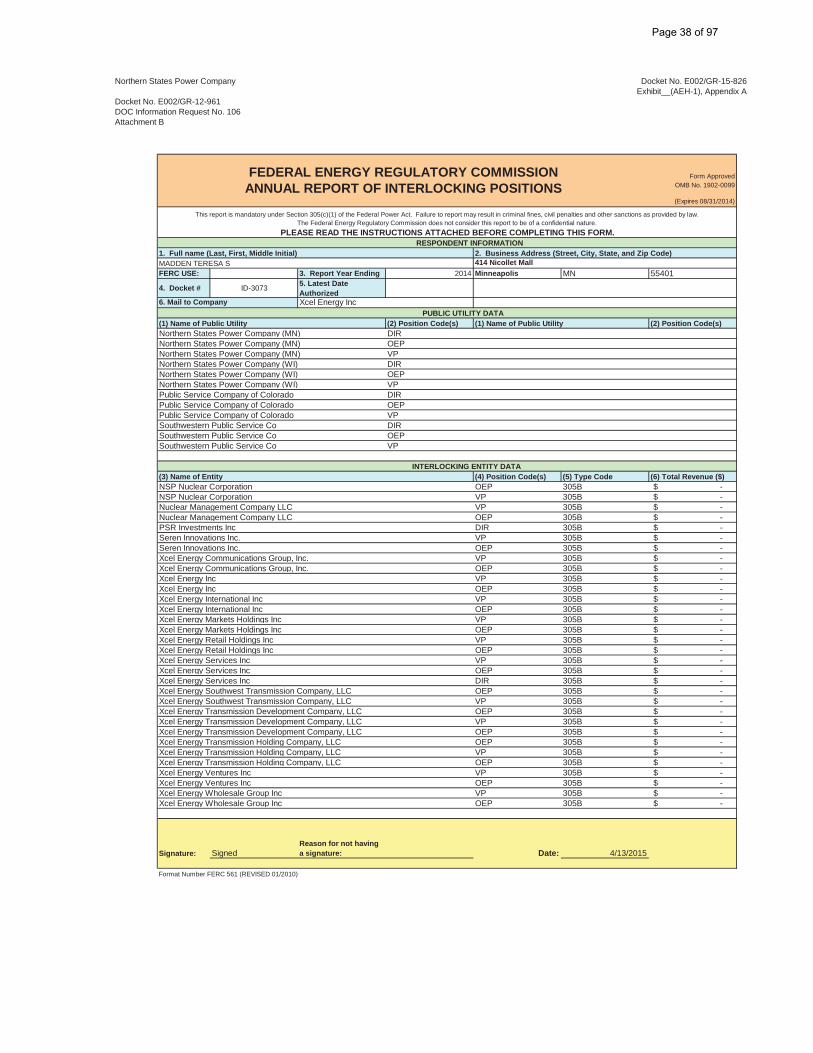
Northern States Power Company
Docket No. E002/GR-12-961DOC Information Request No. 106Attachment B
Docket No. E002/GR-15-826Exhibit__(AEH-1), Appendix A
Form ApprovedOMB No. 1902-0099
(Expires 08/31/2014)
RESPONDENT INFORMATION1. Full name (Last, First, Middle Initial) 2. Business Address (Street, City, State, and Zip Code)
FERC USE: 3. Report Year Ending 2014 Minneapolis MN 55401
4. Docket # ID-3073 5. Latest Date Authorized
PUBLIC UTILITY DATA(2) Position Code(s) (2) Position Code(s)
Northern States Power Company (MN) DIRNorthern States Power Company (MN) OEPNorthern States Power Company (MN) VPNorthern States Power Company (WI) DIRNorthern States Power Company (WI) OEPNorthern States Power Company (WI) VPPublic Service Company of Colorado DIRPublic Service Company of Colorado OEPPublic Service Company of Colorado VPSouthwestern Public Service Co DIRSouthwestern Public Service Co OEPSouthwestern Public Service Co VP
INTERLOCKING ENTITY DATA(4) Position Code(s) (5) Type Code (6) Total Revenue ($)
NSP Nuclear Corporation OEP 305B -$NSP Nuclear Corporation VP 305B -$Nuclear Management Company LLC VP 305B -$Nuclear Management Company LLC OEP 305B -$PSR Investments Inc DIR 305B -$Seren Innovations Inc. VP 305B -$Seren Innovations Inc. OEP 305B -$Xcel Energy Communications Group, Inc. VP 305B -$Xcel Energy Communications Group, Inc. OEP 305B -$Xcel Energy Inc VP 305B -$Xcel Energy Inc OEP 305B -$Xcel Energy International Inc VP 305B -$Xcel Energy International Inc OEP 305B -$Xcel Energy Markets Holdings Inc VP 305B -$Xcel Energy Markets Holdings Inc OEP 305B -$Xcel Energy Retail Holdings Inc VP 305B -$Xcel Energy Retail Holdings Inc OEP 305B -$Xcel Energy Services Inc VP 305B -$Xcel Energy Services Inc OEP 305B -$Xcel Energy Services Inc DIR 305B -$Xcel Energy Southwest Transmission Company, LLC OEP 305B -$Xcel Energy Southwest Transmission Company, LLC VP 305B -$Xcel Energy Transmission Development Company, LLC OEP 305B -$Xcel Energy Transmission Development Company, LLC VP 305B -$Xcel Energy Transmission Development Company, LLC OEP 305B -$Xcel Energy Transmission Holding Company, LLC OEP 305B -$Xcel Energy Transmission Holding Company, LLC VP 305B -$Xcel Energy Transmission Holding Company, LLC OEP 305B -$Xcel Energy Ventures Inc VP 305B -$Xcel Energy Ventures Inc OEP 305B -$Xcel Energy Wholesale Group Inc VP 305B -$Xcel Energy Wholesale Group Inc OEP 305B -$
Signature: SignedReason for not having a signature: Date: 4/13/2015
Format Number FERC 561 (REVISED 01/2010)
FEDERAL ENERGY REGULATORY COMMISSIONANNUAL REPORT OF INTERLOCKING POSITIONS
This report is mandatory under Section 305(c)(1) of the Federal Power Act. Failure to report may result in criminal fines, civil penalties and other sanctions as provided by law.The Federal Energy Regulatory Commission does not consider this report to be of a confidential nature.
PLEASE READ THE INSTRUCTIONS ATTACHED BEFORE COMPLETING THIS FORM.
MADDEN TERESA S 414 Nicollet Mall
(3) Name of Entity
6. Mail to Company Xcel Energy Inc
(1) Name of Public Utility (1) Name of Public Utility
Page 38 of 97
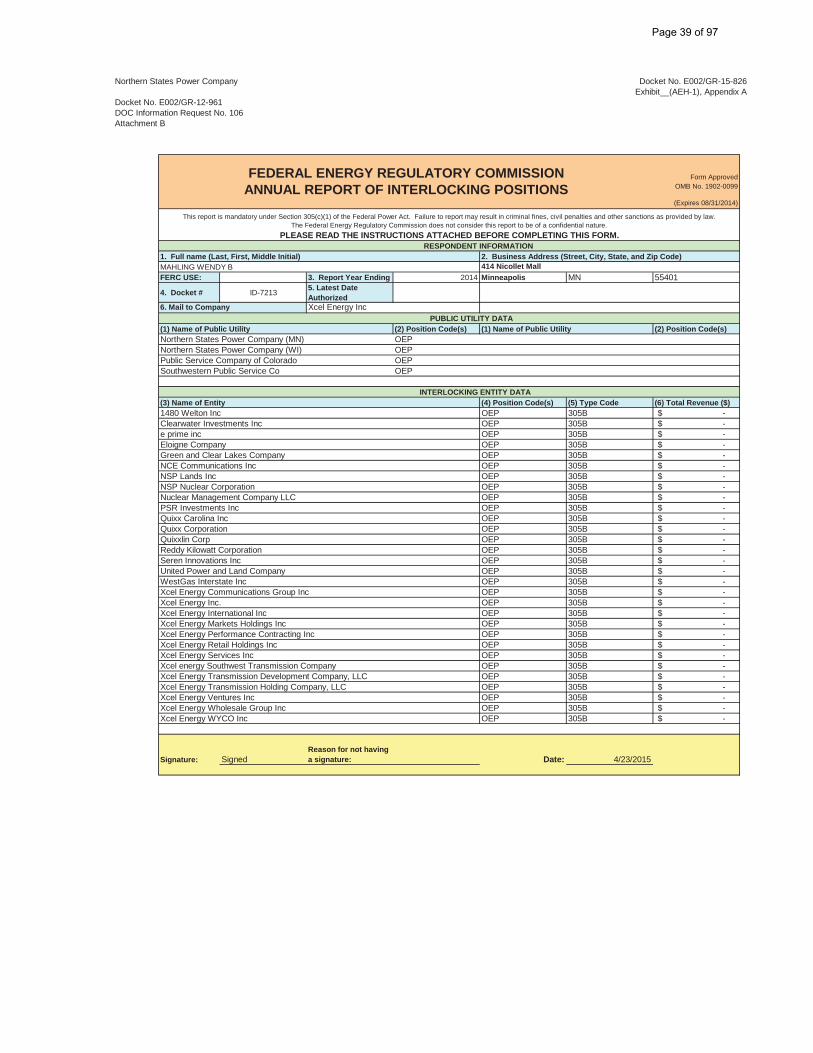
Northern States Power Company
Docket No. E002/GR-12-961DOC Information Request No. 106Attachment B
Docket No. E002/GR-15-826Exhibit__(AEH-1), Appendix A
Form ApprovedOMB No. 1902-0099
(Expires 08/31/2014)
RESPONDENT INFORMATION1. Full name (Last, First, Middle Initial) 2. Business Address (Street, City, State, and Zip Code)
FERC USE: 3. Report Year Ending 2014 Minneapolis MN 55401
4. Docket # ID-7213 5. Latest Date Authorized
PUBLIC UTILITY DATA(2) Position Code(s) (2) Position Code(s)
Northern States Power Company (MN) OEPNorthern States Power Company (WI) OEPPublic Service Company of Colorado OEPSouthwestern Public Service Co OEP
INTERLOCKING ENTITY DATA(4) Position Code(s) (5) Type Code (6) Total Revenue ($)
1480 Welton Inc OEP 305B -$Clearwater Investments Inc OEP 305B -$e prime inc OEP 305B -$Eloigne Company OEP 305B -$Green and Clear Lakes Company OEP 305B -$NCE Communications Inc OEP 305B -$NSP Lands Inc OEP 305B -$NSP Nuclear Corporation OEP 305B -$Nuclear Management Company LLC OEP 305B -$PSR Investments Inc OEP 305B -$Quixx Carolina Inc OEP 305B -$Quixx Corporation OEP 305B -$Quixxlin Corp OEP 305B -$Reddy Kilowatt Corporation OEP 305B -$Seren Innovations Inc OEP 305B -$United Power and Land Company OEP 305B -$WestGas Interstate Inc OEP 305B -$Xcel Energy Communications Group Inc OEP 305B -$Xcel Energy Inc. OEP 305B -$Xcel Energy International Inc OEP 305B -$Xcel Energy Markets Holdings Inc OEP 305B -$Xcel Energy Performance Contracting Inc OEP 305B -$Xcel Energy Retail Holdings Inc OEP 305B -$Xcel Energy Services Inc OEP 305B -$Xcel energy Southwest Transmission Company OEP 305B -$Xcel Energy Transmission Development Company, LLC OEP 305B -$Xcel Energy Transmission Holding Company, LLC OEP 305B -$Xcel Energy Ventures Inc OEP 305B -$Xcel Energy Wholesale Group Inc OEP 305B -$Xcel Energy WYCO Inc OEP 305B -$
Signature: SignedReason for not having a signature: Date: 4/23/2015
FEDERAL ENERGY REGULATORY COMMISSIONANNUAL REPORT OF INTERLOCKING POSITIONS
This report is mandatory under Section 305(c)(1) of the Federal Power Act. Failure to report may result in criminal fines, civil penalties and other sanctions as provided by law.The Federal Energy Regulatory Commission does not consider this report to be of a confidential nature.
PLEASE READ THE INSTRUCTIONS ATTACHED BEFORE COMPLETING THIS FORM.
MAHLING WENDY B 414 Nicollet Mall
(3) Name of Entity
6. Mail to Company Xcel Energy Inc
(1) Name of Public Utility (1) Name of Public Utility
Page 39 of 97

Northern States Power Company
Docket No. E002/GR-12-961DOC Information Request No. 106Attachment B
Docket No. E002/GR-15-826Exhibit__(AEH-1), Appendix A
Form ApprovedOMB No. 1902-0099
(Expires 08/31/2014)
RESPONDENT INFORMATION1. Full name (Last, First, Middle Initial) 2. Business Address (Street, City, State, and Zip Code)
FERC USE: 3. Report Year Ending 2014 Minneapolis MN 55401
4. Docket # ID-6150 5. Latest Date Authorized
PUBLIC UTILITY DATA(2) Position Code(s) (2) Position Code(s)
Northern States Power Company (MN) VPNorthern States Power Company (WI) VPPublic Service Company of Colorado VPSouthwestern Public Service Co VP
INTERLOCKING ENTITY DATA(4) Position Code(s) (5) Type Code (6) Total Revenue ($)
NCE Communications Inc DIR 305B -$NCE Communications Inc VP 305B -$Xcel Energy Communications Group Inc VP 305B -$Xcel Energy Foundation DIR 305B -$Xcel Energy Inc. VP 305B -$Xcel Energy Inc. OEP 305B -$Xcel Energy Services Inc VP 305B -$Xcel Energy Services Inc OEP 305B -$Xcel Energy Southwest Transmission Company, LLC VP 305B -$Xcel Energy Transmission Development Company, LLC VP 305B -$Xcel Energy Transmission Holding Company, LLC VP 305B -$Xcel Energy Ventures Inc VP 305B -$Xcel Energy Wholesale Group Inc VP 305B -$
Signature: SignedReason for not having a signature: Date: 4/17/2015
Format Number FERC 561 (REVISED 01/2010)
FEDERAL ENERGY REGULATORY COMMISSIONANNUAL REPORT OF INTERLOCKING POSITIONS
This report is mandatory under Section 305(c)(1) of the Federal Power Act. Failure to report may result in criminal fines, civil penalties and other sanctions as provided by law.The Federal Energy Regulatory Commission does not consider this report to be of a confidential nature.
PLEASE READ THE INSTRUCTIONS ATTACHED BEFORE COMPLETING THIS FORM.
MCDANIEL JR MARVIN E 414 Nicollet Mall
(3) Name of Entity
6. Mail to Company Xcel Energy Inc
(1) Name of Public Utility (1) Name of Public Utility
Page 40 of 97
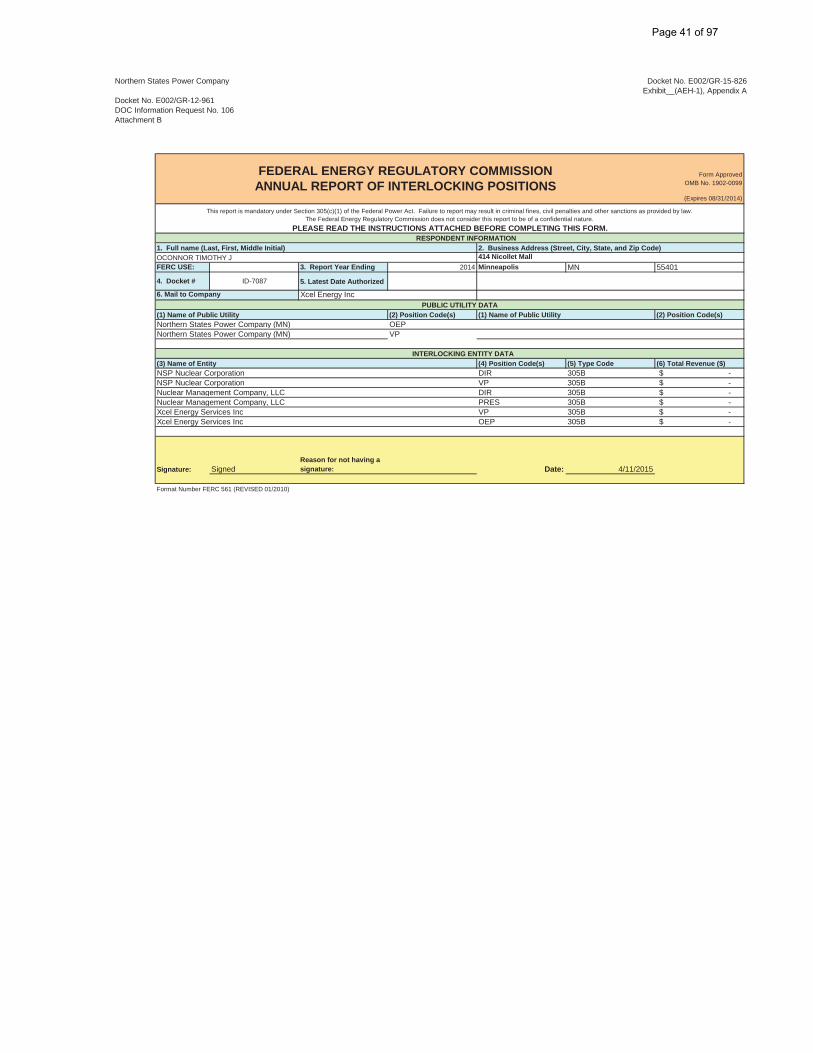
Northern States Power Company
Docket No. E002/GR-12-961DOC Information Request No. 106Attachment B
Docket No. E002/GR-15-826Exhibit__(AEH-1), Appendix A
Form ApprovedOMB No. 1902-0099
(Expires 08/31/2014)
RESPONDENT INFORMATION1. Full name (Last, First, Middle Initial) 2. Business Address (Street, City, State, and Zip Code)
FERC USE: 3. Report Year Ending 2014 Minneapolis MN 55401
4. Docket # ID-7087 5. Latest Date Authorized
PUBLIC UTILITY DATA(2) Position Code(s) (2) Position Code(s)
Northern States Power Company (MN) OEPNorthern States Power Company (MN) VP
INTERLOCKING ENTITY DATA(4) Position Code(s) (5) Type Code (6) Total Revenue ($)
NSP Nuclear Corporation DIR 305B -$NSP Nuclear Corporation VP 305B -$Nuclear Management Company, LLC DIR 305B -$Nuclear Management Company, LLC PRES 305B -$Xcel Energy Services Inc VP 305B -$Xcel Energy Services Inc OEP 305B -$
Signature: SignedReason for not having a signature: Date: 4/11/2015
Format Number FERC 561 (REVISED 01/2010)
FEDERAL ENERGY REGULATORY COMMISSIONANNUAL REPORT OF INTERLOCKING POSITIONS
This report is mandatory under Section 305(c)(1) of the Federal Power Act. Failure to report may result in criminal fines, civil penalties and other sanctions as provided by law.The Federal Energy Regulatory Commission does not consider this report to be of a confidential nature.
PLEASE READ THE INSTRUCTIONS ATTACHED BEFORE COMPLETING THIS FORM.
OCONNOR TIMOTHY J 414 Nicollet Mall
(3) Name of Entity
6. Mail to Company Xcel Energy Inc
(1) Name of Public Utility (1) Name of Public Utility
Page 41 of 97

Northern States Power Company
Docket No. E002/GR-12-961DOC Information Request No. 106Attachment B
Docket No. E002/GR-15-826Exhibit__(AEH-1), Appendix A
Form ApprovedOMB No. 1902-0099
(Expires 08/31/2014)
RESPONDENT INFORMATION1. Full name (Last, First, Middle Initial) 2. Business Address (Street, City, State, and Zip Code)
FERC USE: 3. Report Year Ending 2014 Minneapolis MN 55401
4. Docket # ID-7148 5. Latest Date Authorized
PUBLIC UTILITY DATA(2) Position Code(s) (2) Position Code(s)
Northern States Power Company (MN) DIRNorthern States Power Company (MN) VPNorthern States Power Company (MN) SECNorthern States Power Company (WI) VPNorthern States Power Company (WI) SECPublic Service Company of Colorado VPPublic Service Company of Colorado SECSouthwestern Public Service Co VPSouthwestern Public Service Co SEC
INTERLOCKING ENTITY DATA(4) Position Code(s) (5) Type Code (6) Total Revenue ($)
1480 Welton Inc SEC 305B -$1480 Welton Inc VP 305B -$Clearwater Investments Inc VP 305B -$Clearwater Investments Inc SEC 305B -$e prime inc SEC 305B -$e prime inc VP 305B -$e prime inc DIR 305B -$Eloigne Company SEC 305B -$Eloigne Company VP 305B -$Eloigne Company DIR 305B -$Green and Clear Lakes Company SEC 305B -$Green and Clear Lakes Company VP 305B -$NCE Communications Inc SEC 305B -$NCE Communications Inc VP 305B -$NSP Lands Inc SEC 305B -$NSP Lands Inc VP 305B -$NSP Nuclear Corporation VP 305B -$NSP Nuclear Corporation SEC 305B -$Nuclear Management Company LLC VP 305B -$Nuclear Management Company LLC SEC 305B -$PSR Investments Inc SEC 305B -$PSR Investments Inc VP 305B -$Quixx Carolina Inc VP 305B -$Quixx Carolina Inc SEC 305B -$Quixx Corporation VP 305B -$Quixx Corporation SEC 305B -$Quixxlin Corp VP 305B -$Quixxlin Corp SEC 305B -$Reddy Kilowatt Corporation SEC 305B -$Reddy Kilowatt Corporation VP 305B -$Seren Innovations Inc SEC 305B -$Seren Innovations Inc VP 305B -$United Power and Land Company VP 305B -$United Power and Land Company SEC 305B -$WestGas Interstate Inc VP 305B -$WestGas Interstate Inc SEC 305B -$Xcel Energy Communications Group Inc SEC 305B -$Xcel Energy Communications Group Inc VP 305B -$Xcel Energy Inc VP 305B -$Xcel Energy Inc SEC 305B -$Xcel Energy International Inc SEC 305B -$Xcel Energy International Inc VP 305B -$Xcel Energy Markets Holdings Inc SEC 305B -$Xcel Energy Markets Holdings Inc VP 305B -$Xcel Energy Performance Contracting Inc VP 305B -$Xcel Energy Performance Contracting Inc SEC 305B -$Xcel Energy Retail Holdings Inc VP 305B -$Xcel Energy Retail Holdings Inc SEC 305B -$Xcel Energy Services Inc SEC 305B -$Xcel Energy Services Inc VP 305B -$Xcel Energy Southwest Transmission Company, LLC SEC 305B -$Xcel Energy Southwest Transmission Company, LLC VP 305B -$Xcel Energy Transmission Development Company, LLC SEC 305B -$Xcel Energy Transmission Development Company, LLC VP 305B -$Xcel Energy Transmission Holding Company, LLC SEC 305B -$Xcel Energy Transmission Holding Company, LLC VP 305B -$Xcel Energy Ventures Inc VP 305B -$Xcel Energy Ventures Inc SEC 305B -$Xcel Energy Wholesale Group Inc VP 305B -$Xcel Energy Wholesale Group Inc SEC 305B -$Xcel Energy WYCO Inc VP 305B -$Xcel Energy WYCO Inc SEC 305B -$
Signature: SignedReason for not having a signature: Date: 4/21/2015
Format Number FERC 561 (REVISED 01/2010)
FEDERAL ENERGY REGULATORY COMMISSIONANNUAL REPORT OF INTERLOCKING POSITIONS
This report is mandatory under Section 305(c)(1) of the Federal Power Act. Failure to report may result in criminal fines, civil penalties and other sanctions as provided by law.The Federal Energy Regulatory Commission does not consider this report to be of a confidential nature.
PLEASE READ THE INSTRUCTIONS ATTACHED BEFORE COMPLETING THIS FORM.
Poferl Judy M 414 Nicollet Mall
(3) Name of Entity
6. Mail to Company Xcel Energy Inc
(1) Name of Public Utility (1) Name of Public Utility
Page 42 of 97
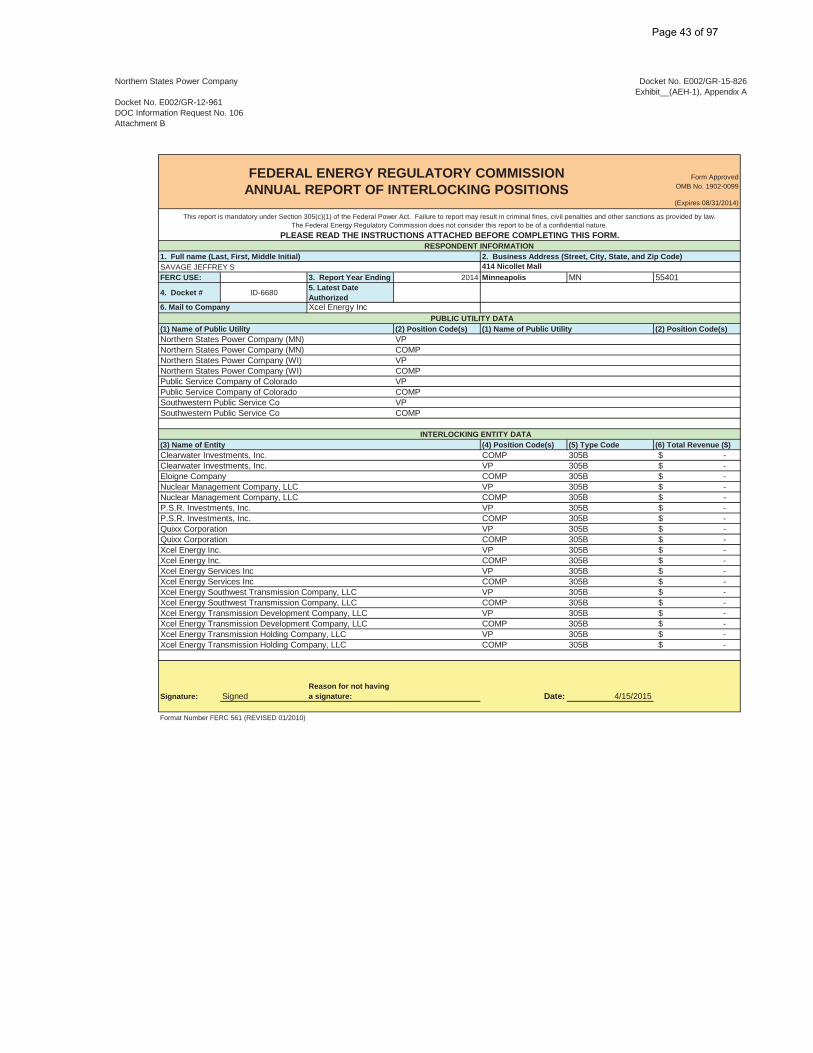
Northern States Power Company
Docket No. E002/GR-12-961DOC Information Request No. 106Attachment B
Docket No. E002/GR-15-826Exhibit__(AEH-1), Appendix A
Form ApprovedOMB No. 1902-0099
(Expires 08/31/2014)
RESPONDENT INFORMATION1. Full name (Last, First, Middle Initial) 2. Business Address (Street, City, State, and Zip Code)
FERC USE: 3. Report Year Ending 2014 Minneapolis MN 55401
4. Docket # ID-6680 5. Latest Date Authorized
PUBLIC UTILITY DATA(2) Position Code(s) (2) Position Code(s)
Northern States Power Company (MN) VPNorthern States Power Company (MN) COMPNorthern States Power Company (WI) VPNorthern States Power Company (WI) COMPPublic Service Company of Colorado VPPublic Service Company of Colorado COMPSouthwestern Public Service Co VPSouthwestern Public Service Co COMP
INTERLOCKING ENTITY DATA(4) Position Code(s) (5) Type Code (6) Total Revenue ($)
Clearwater Investments, Inc. COMP 305B -$Clearwater Investments, Inc. VP 305B -$Eloigne Company COMP 305B -$Nuclear Management Company, LLC VP 305B -$Nuclear Management Company, LLC COMP 305B -$P.S.R. Investments, Inc. VP 305B -$P.S.R. Investments, Inc. COMP 305B -$Quixx Corporation VP 305B -$Quixx Corporation COMP 305B -$Xcel Energy Inc. VP 305B -$Xcel Energy Inc. COMP 305B -$Xcel Energy Services Inc VP 305B -$Xcel Energy Services Inc COMP 305B -$Xcel Energy Southwest Transmission Company, LLC VP 305B -$Xcel Energy Southwest Transmission Company, LLC COMP 305B -$Xcel Energy Transmission Development Company, LLC VP 305B -$Xcel Energy Transmission Development Company, LLC COMP 305B -$Xcel Energy Transmission Holding Company, LLC VP 305B -$Xcel Energy Transmission Holding Company, LLC COMP 305B -$
Signature: SignedReason for not having a signature: Date: 4/15/2015
Format Number FERC 561 (REVISED 01/2010)
FEDERAL ENERGY REGULATORY COMMISSIONANNUAL REPORT OF INTERLOCKING POSITIONS
This report is mandatory under Section 305(c)(1) of the Federal Power Act. Failure to report may result in criminal fines, civil penalties and other sanctions as provided by law.The Federal Energy Regulatory Commission does not consider this report to be of a confidential nature.
PLEASE READ THE INSTRUCTIONS ATTACHED BEFORE COMPLETING THIS FORM.
SAVAGE JEFFREY S 414 Nicollet Mall
(3) Name of Entity
6. Mail to Company Xcel Energy Inc
(1) Name of Public Utility (1) Name of Public Utility
Page 43 of 97

Northern States Power Company
Docket No. E002/GR-12-961DOC Information Request No. 106Attachment B
Docket No. E002/GR-15-826Exhibit__(AEH-1), Appendix A
Form ApprovedOMB No. 1902-0099
(Expires 08/31/2014)
RESPONDENT INFORMATION1. Full name (Last, First, Middle Initial) 2. Business Address (Street, City, State, and Zip Code)
FERC USE: 3. Report Year Ending 2014 Minneapolis MN 554014. Docket # ID-5593 5. Latest Date Authorized
PUBLIC UTILITY DATA(2) Position Code(s) (2) Position Code(s)
Northern States Power Company (MN) OEPNorthern States Power Company (WI) OEPPublic Service Company of Colorado OEPSouthwestern Public Service Co OEP
INTERLOCKING ENTITY DATA(4) Position Code(s) (5) Type Code (6) Total Revenue ($)
1480 Welton Inc OEP 305B -$ Clearwater Investments Inc OEP 305B -$ e prime inc OEP 305B -$ Eloigne Company OEP 305B -$ Green and Clear Lakes Company OEP 305B -$ NCE Communications Inc OEP 305B -$ NSP Lands Inc OEP 305B -$ NSP Nuclear Corporation OEP 305B -$ PSR Investments Inc OEP 305B -$ Quixx Carolina Inc OEP 305B -$ Quixx Corporation OEP 305B -$ Quixxlin Corp OEP 305B -$ Reddy Kilowatt Corporation OEP 305B -$ Seren Innovations Inc OEP 305B -$ United Power and Land Company TREA 305B -$ United Power and Land Company VP 305B -$ WestGas Interstate Inc OEP 305B -$ Xcel Energy Communications Group Inc OEP 305B -$ Xcel Energy Inc OEP 305B -$ Xcel Energy International Inc OEP 305B -$ Xcel Energy Markets Holdings Inc OEP 305B -$ Xcel Energy Performance Contracting Inc OEP 305B -$ Xcel Energy Retail Holdings Inc OEP 305B -$ Xcel Energy Services Inc OEP 305B -$ Xcel Energy Southwest Transmission Company, LLC OEP 305B -$ Xcel Energy Transmission Development Company, LLC OEP 305B -$ Xcel Energy Transmission Holding Company, LLC OEP 305B -$ Xcel Energy Ventures Inc OEP 305B -$ Xcel Energy Wholesale Group Inc OEP 305B -$ Xcel Energy WYCO Inc OEP 305B -$
Signature: SignedReason for not having a signature: Date: 4/13/2015
Format Number FERC 561 (REVISED 01/2010)
FEDERAL ENERGY REGULATORY COMMISSIONANNUAL REPORT OF INTERLOCKING POSITIONS
This report is mandatory under Section 305(c)(1) of the Federal Power Act. Failure to report may result in criminal fines, civil penalties and other sanctions as provided by law.The Federal Energy Regulatory Commission does not consider this report to be of a confidential nature.
PLEASE READ THE INSTRUCTIONS ATTACHED BEFORE COMPLETING THIS FORM.
SCHELL MARY P 414 Nicollet Mall
(3) Name of Entity
6. Mail to Company Xcel Energy Inc
(1) Name of Public Utility (1) Name of Public Utility
Page 44 of 97

Northern States Power Company
Docket No. E002/GR-12-961DOC Information Request No. 106Attachment B
Docket No. E002/GR-15-826Exhibit__(AEH-1), Appendix A
Form ApprovedOMB No. 1902-0099
(Expires 08/31/2014)
RESPONDENT INFORMATION1. Full name (Last, First, Middle Initial) 2. Business Address (Street, City, State, and Zip Code)
FERC USE: 3. Report Year Ending 2014 Eau Claire WI 54701
4. Docket # ID-0000 5. Latest Date Authorized
PUBLIC UTILITY DATA(2) Position Code(s) (2) Position Code(s)
Northern States Power Company (WI) DIRNorthern States Power Company (WI) CEONorthern States Power Company (WI) PRES
INTERLOCKING ENTITY DATA(4) Position Code(s) (5) Type Code (6) Total Revenue ($)
Chippewa and Flambeau Improvement Company DIR 305B -$ Chippewa and Flambeau Improvement Company PRES 305B -$ Clearwater Investments Inc DIR 305B -$ Clearwater Investments Inc PRES 305B -$ NSP Lands Inc DIR 305B -$ NSP Lands Inc PRES 305B -$ Xcel Energy Foundation DIR 305B -$
Signature: SignedReason for not having a signature: Date: 4/23/2015
Format Number FERC 561 (REVISED 01/2010)
FEDERAL ENERGY REGULATORY COMMISSIONANNUAL REPORT OF INTERLOCKING POSITIONS
This report is mandatory under Section 305(c)(1) of the Federal Power Act. Failure to report may result in criminal fines, civil penalties and other sanctions as provided by law.The Federal Energy Regulatory Commission does not consider this report to be of a confidential nature.
PLEASE READ THE INSTRUCTIONS ATTACHED BEFORE COMPLETING THIS FORM.
Stoering Mark E 1414 West Hamilton Ave
(3) Name of Entity
6. Mail to Company Xcel Energy Inc
(1) Name of Public Utility (1) Name of Public Utility
Page 45 of 97
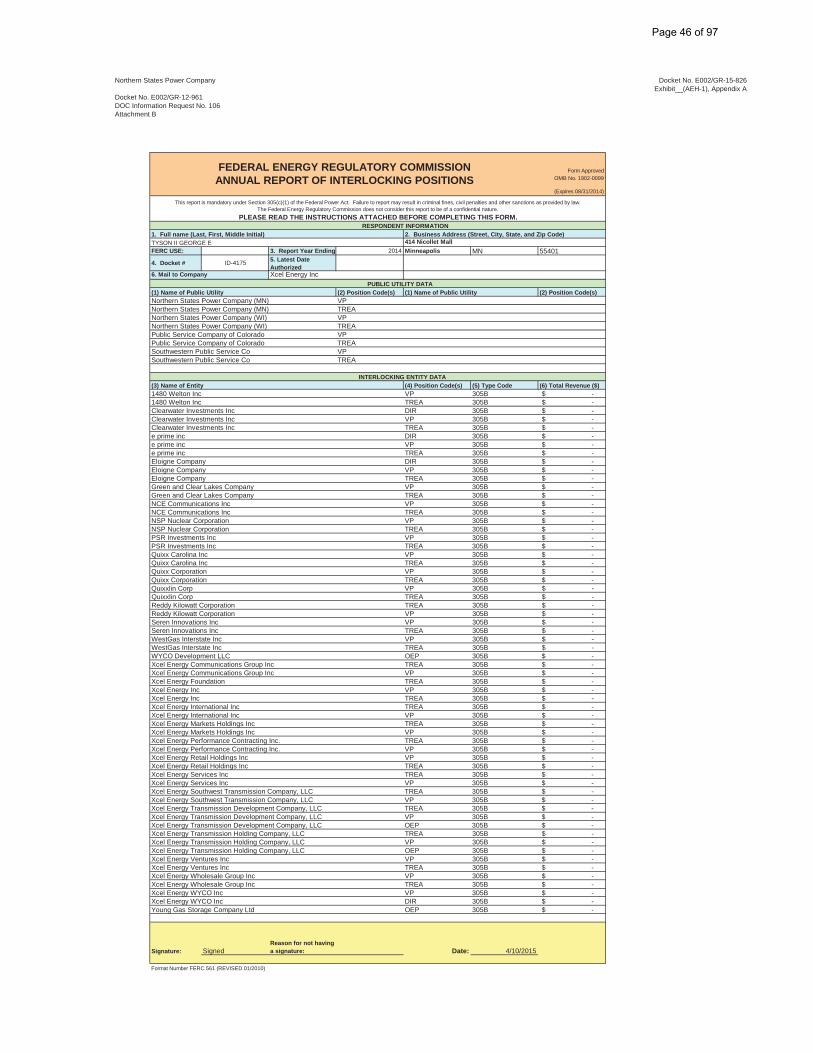
Northern States Power Company
Docket No. E002/GR-12-961DOC Information Request No. 106Attachment B
Docket No. E002/GR-15-826Exhibit__(AEH-1), Appendix A
Form ApprovedOMB No. 1902-0099
(Expires 08/31/2014)
RESPONDENT INFORMATION1. Full name (Last, First, Middle Initial) 2. Business Address (Street, City, State, and Zip Code)
FERC USE: 3. Report Year Ending 2014 Minneapolis MN 55401
4. Docket # ID-4175 5. Latest Date Authorized
PUBLIC UTILITY DATA(2) Position Code(s) (2) Position Code(s)
Northern States Power Company (MN) VPNorthern States Power Company (MN) TREANorthern States Power Company (WI) VPNorthern States Power Company (WI) TREAPublic Service Company of Colorado VPPublic Service Company of Colorado TREASouthwestern Public Service Co VPSouthwestern Public Service Co TREA
INTERLOCKING ENTITY DATA(4) Position Code(s) (5) Type Code (6) Total Revenue ($)
1480 Welton Inc VP 305B -$1480 Welton Inc TREA 305B -$Clearwater Investments Inc DIR 305B -$Clearwater Investments Inc VP 305B -$Clearwater Investments Inc TREA 305B -$e prime inc DIR 305B -$e prime inc VP 305B -$e prime inc TREA 305B -$Eloigne Company DIR 305B -$Eloigne Company VP 305B -$Eloigne Company TREA 305B -$Green and Clear Lakes Company VP 305B -$Green and Clear Lakes Company TREA 305B -$NCE Communications Inc VP 305B -$NCE Communications Inc TREA 305B -$NSP Nuclear Corporation VP 305B -$NSP Nuclear Corporation TREA 305B -$PSR Investments Inc VP 305B -$PSR Investments Inc TREA 305B -$Quixx Carolina Inc VP 305B -$Quixx Carolina Inc TREA 305B -$Quixx Corporation VP 305B -$Quixx Corporation TREA 305B -$Quixxlin Corp VP 305B -$Quixxlin Corp TREA 305B -$Reddy Kilowatt Corporation TREA 305B -$Reddy Kilowatt Corporation VP 305B -$Seren Innovations Inc VP 305B -$Seren Innovations Inc TREA 305B -$WestGas Interstate Inc VP 305B -$WestGas Interstate Inc TREA 305B -$WYCO Development LLC OEP 305B -$Xcel Energy Communications Group Inc TREA 305B -$Xcel Energy Communications Group Inc VP 305B -$Xcel Energy Foundation TREA 305B -$Xcel Energy Inc VP 305B -$Xcel Energy Inc TREA 305B -$Xcel Energy International Inc TREA 305B -$Xcel Energy International Inc VP 305B -$Xcel Energy Markets Holdings Inc TREA 305B -$Xcel Energy Markets Holdings Inc VP 305B -$Xcel Energy Performance Contracting Inc. TREA 305B -$Xcel Energy Performance Contracting Inc. VP 305B -$Xcel Energy Retail Holdings Inc VP 305B -$Xcel Energy Retail Holdings Inc TREA 305B -$Xcel Energy Services Inc TREA 305B -$Xcel Energy Services Inc VP 305B -$Xcel Energy Southwest Transmission Company, LLC TREA 305B -$Xcel Energy Southwest Transmission Company, LLC VP 305B -$Xcel Energy Transmission Development Company, LLC TREA 305B -$Xcel Energy Transmission Development Company, LLC VP 305B -$Xcel Energy Transmission Development Company, LLC OEP 305B -$Xcel Energy Transmission Holding Company, LLC TREA 305B -$Xcel Energy Transmission Holding Company, LLC VP 305B -$Xcel Energy Transmission Holding Company, LLC OEP 305B -$Xcel Energy Ventures Inc VP 305B -$Xcel Energy Ventures Inc TREA 305B -$Xcel Energy Wholesale Group Inc VP 305B -$Xcel Energy Wholesale Group Inc TREA 305B -$Xcel Energy WYCO Inc VP 305B -$Xcel Energy WYCO Inc DIR 305B -$Young Gas Storage Company Ltd OEP 305B -$
Signature: SignedReason for not having a signature: Date: 4/10/2015
Format Number FERC 561 (REVISED 01/2010)
FEDERAL ENERGY REGULATORY COMMISSIONANNUAL REPORT OF INTERLOCKING POSITIONS
This report is mandatory under Section 305(c)(1) of the Federal Power Act. Failure to report may result in criminal fines, civil penalties and other sanctions as provided by law.The Federal Energy Regulatory Commission does not consider this report to be of a confidential nature.
PLEASE READ THE INSTRUCTIONS ATTACHED BEFORE COMPLETING THIS FORM.
TYSON II GEORGE E 414 Nicollet Mall
(3) Name of Entity
6. Mail to Company Xcel Energy Inc
(1) Name of Public Utility (1) Name of Public Utility
Page 46 of 97
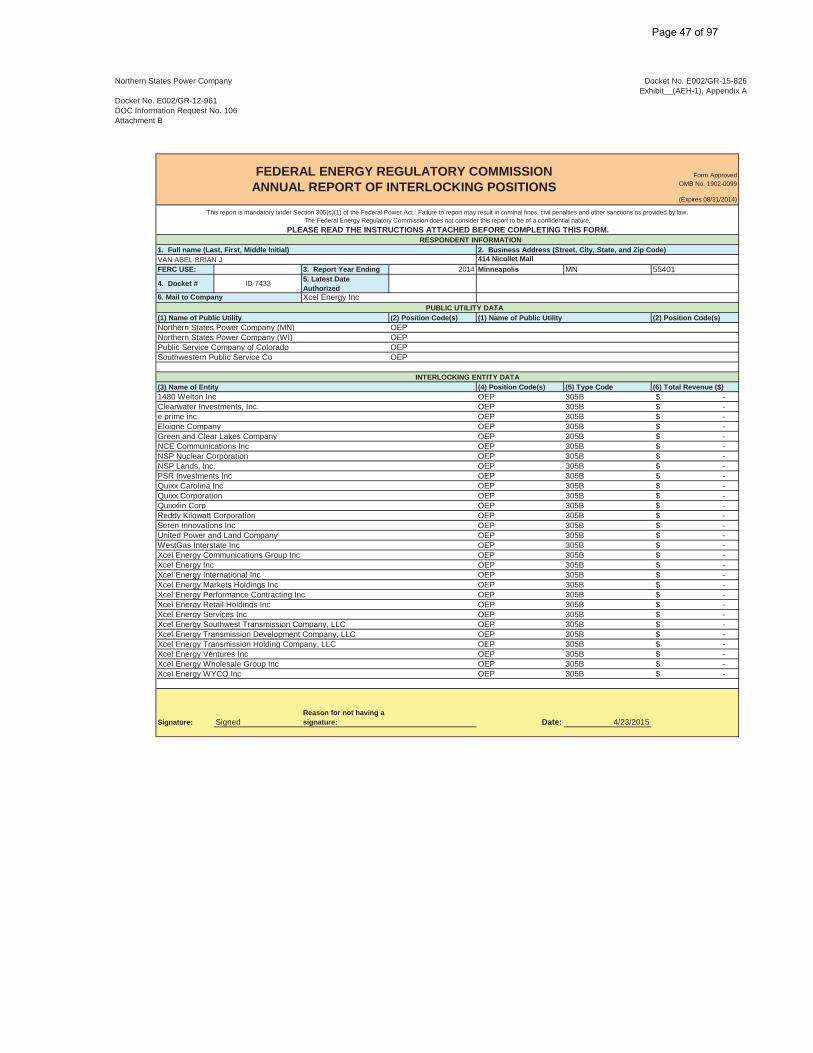
Northern States Power Company
Docket No. E002/GR-12-961DOC Information Request No. 106Attachment B
Docket No. E002/GR-15-826Exhibit__(AEH-1), Appendix A
Form ApprovedOMB No. 1902-0099
(Expires 08/31/2014)
RESPONDENT INFORMATION1. Full name (Last, First, Middle Initial) 2. Business Address (Street, City, State, and Zip Code)
FERC USE: 3. Report Year Ending 2014 Minneapolis MN 55401
4. Docket # ID-7433 5. Latest Date Authorized
PUBLIC UTILITY DATA(2) Position Code(s) (2) Position Code(s)
Northern States Power Company (MN) OEPNorthern States Power Company (WI) OEPPublic Service Company of Colorado OEPSouthwestern Public Service Co OEP
INTERLOCKING ENTITY DATA(4) Position Code(s) (5) Type Code (6) Total Revenue ($)
1480 Welton Inc OEP 305B -$Clearwater Investments, Inc. OEP 305B -$e prime inc OEP 305B -$Eloigne Company OEP 305B -$Green and Clear Lakes Company OEP 305B -$NCE Communications Inc OEP 305B -$NSP Nuclear Corporation OEP 305B -$NSP Lands, Inc. OEP 305B -$PSR Investments Inc OEP 305B -$Quixx Carolina Inc OEP 305B -$Quixx Corporation OEP 305B -$Quixxlin Corp OEP 305B -$Reddy Kilowatt Corporation OEP 305B -$Seren Innovations Inc OEP 305B -$United Power and Land Company OEP 305B -$WestGas Interstate Inc OEP 305B -$Xcel Energy Communications Group Inc OEP 305B -$Xcel Energy Inc OEP 305B -$Xcel Energy International Inc OEP 305B -$Xcel Energy Markets Holdings Inc OEP 305B -$Xcel Energy Performance Contracting Inc OEP 305B -$Xcel Energy Retail Holdings Inc OEP 305B -$Xcel Energy Services Inc OEP 305B -$Xcel Energy Southwest Transmission Company, LLC OEP 305B -$Xcel Energy Transmission Development Company, LLC OEP 305B -$Xcel Energy Transmission Holding Company, LLC OEP 305B -$Xcel Energy Ventures Inc OEP 305B -$Xcel Energy Wholesale Group Inc OEP 305B -$Xcel Energy WYCO Inc OEP 305B -$
Signature: SignedReason for not having a signature: Date: 4/23/2015
FEDERAL ENERGY REGULATORY COMMISSIONANNUAL REPORT OF INTERLOCKING POSITIONS
This report is mandatory under Section 305(c)(1) of the Federal Power Act. Failure to report may result in criminal fines, civil penalties and other sanctions as provided by law.The Federal Energy Regulatory Commission does not consider this report to be of a confidential nature.
PLEASE READ THE INSTRUCTIONS ATTACHED BEFORE COMPLETING THIS FORM.
VAN ABEL BRIAN J 414 Nicollet Mall
(3) Name of Entity
6. Mail to Company Xcel Energy Inc
(1) Name of Public Utility (1) Name of Public Utility
Page 47 of 97
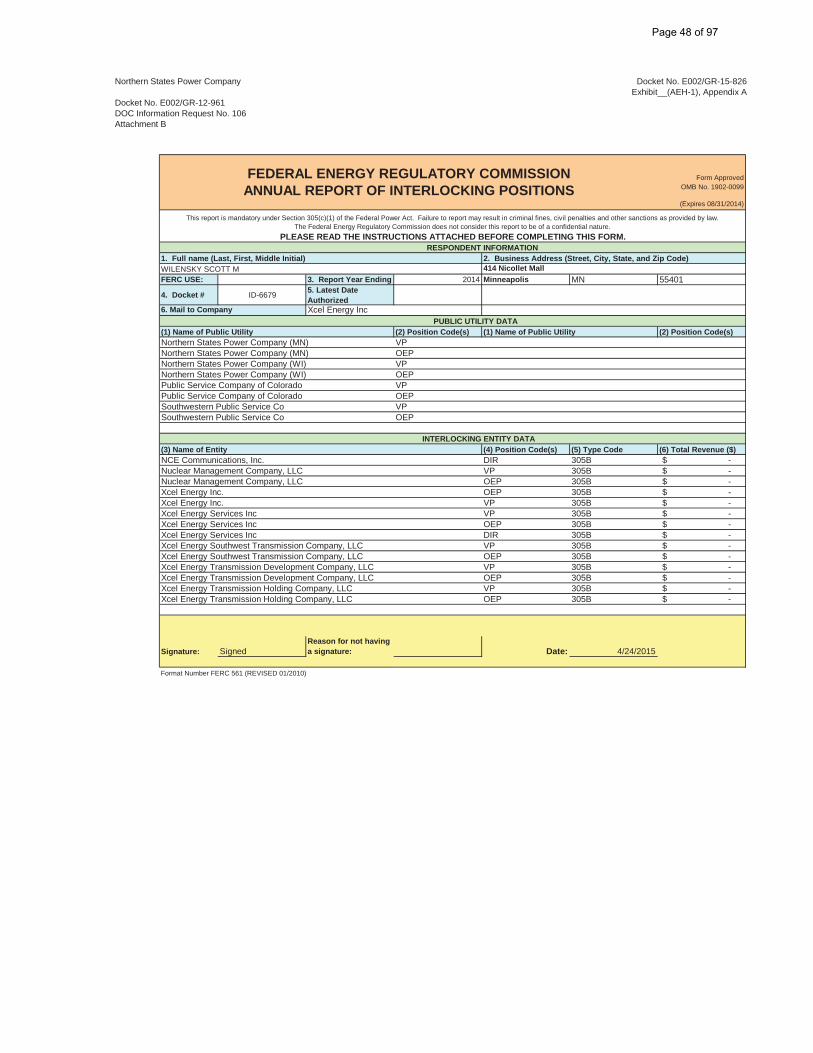
Northern States Power Company
Docket No. E002/GR-12-961DOC Information Request No. 106Attachment B
Docket No. E002/GR-15-826Exhibit__(AEH-1), Appendix A
Form ApprovedOMB No. 1902-0099
(Expires 08/31/2014)
RESPONDENT INFORMATION1. Full name (Last, First, Middle Initial) 2. Business Address (Street, City, State, and Zip Code)
FERC USE: 3. Report Year Ending 2014 Minneapolis MN 55401
4. Docket # ID-6679 5. Latest Date Authorized
PUBLIC UTILITY DATA(2) Position Code(s) (2) Position Code(s)
Northern States Power Company (MN) VPNorthern States Power Company (MN) OEPNorthern States Power Company (WI) VPNorthern States Power Company (WI) OEPPublic Service Company of Colorado VPPublic Service Company of Colorado OEPSouthwestern Public Service Co VPSouthwestern Public Service Co OEP
INTERLOCKING ENTITY DATA(4) Position Code(s) (5) Type Code (6) Total Revenue ($)
NCE Communications, Inc. DIR 305B -$ Nuclear Management Company, LLC VP 305B -$ Nuclear Management Company, LLC OEP 305B -$ Xcel Energy Inc. OEP 305B -$ Xcel Energy Inc. VP 305B -$ Xcel Energy Services Inc VP 305B -$ Xcel Energy Services Inc OEP 305B -$ Xcel Energy Services Inc DIR 305B -$ Xcel Energy Southwest Transmission Company, LLC VP 305B -$ Xcel Energy Southwest Transmission Company, LLC OEP 305B -$ Xcel Energy Transmission Development Company, LLC VP 305B -$ Xcel Energy Transmission Development Company, LLC OEP 305B -$ Xcel Energy Transmission Holding Company, LLC VP 305B -$ Xcel Energy Transmission Holding Company, LLC OEP 305B -$
Signature: SignedReason for not having a signature: Date: 4/24/2015
Format Number FERC 561 (REVISED 01/2010)
FEDERAL ENERGY REGULATORY COMMISSIONANNUAL REPORT OF INTERLOCKING POSITIONS
This report is mandatory under Section 305(c)(1) of the Federal Power Act. Failure to report may result in criminal fines, civil penalties and other sanctions as provided by law.The Federal Energy Regulatory Commission does not consider this report to be of a confidential nature.
PLEASE READ THE INSTRUCTIONS ATTACHED BEFORE COMPLETING THIS FORM.
WILENSKY SCOTT M 414 Nicollet Mall
(3) Name of Entity
6. Mail to Company Xcel Energy Inc
(1) Name of Public Utility (1) Name of Public Utility
Page 48 of 97
Northern States Power Company
Docket No. E002/GR-12-961DOC Information Request No. 106Attachment C
Docket No. E002/GR-15-826Exhibit__(AEH-1), Appendix A
JURISDICTIONAL ANNUAL REPORTFor Calendar Year 2014(Minnesota Jurisdiction)
Title of Schedule Page Numbers
Composite Statistics 1General Information and Assessable Operating Revenue 2Identity of Respondent 3Control Over Respondent 4Organization Chart 5Board of Directors 6Principal General Officers 7Voting Powers and Elections 8Stockholders 9-10Important Changes During the Year 11-12Regulated/Nonregulated Annual Reporting 13Rate of Return Calculations 14-15Allocation Statistics 16-17Billing Cycles 18-21Taxes Accrued, Prepaid & Charged During Year 22-24Emission Allowances 25-27Operating & Maintenance Expenses 28Sales and Degree Days Data 29-30Electric Plant in Service 31-34Analysis of the Depreciation Reserve for the Year 35-38Summary of the Depreciation Accrual for the Year 39-42Materials & Supplies 43Accumlated Deferred Income Taxes account 281, 282, 283 44-47Statement of Income for the Year 48-49Attestation 50
ELECTRIC UTILITY
TABLE OF CONTENTS
Page 49 of 97
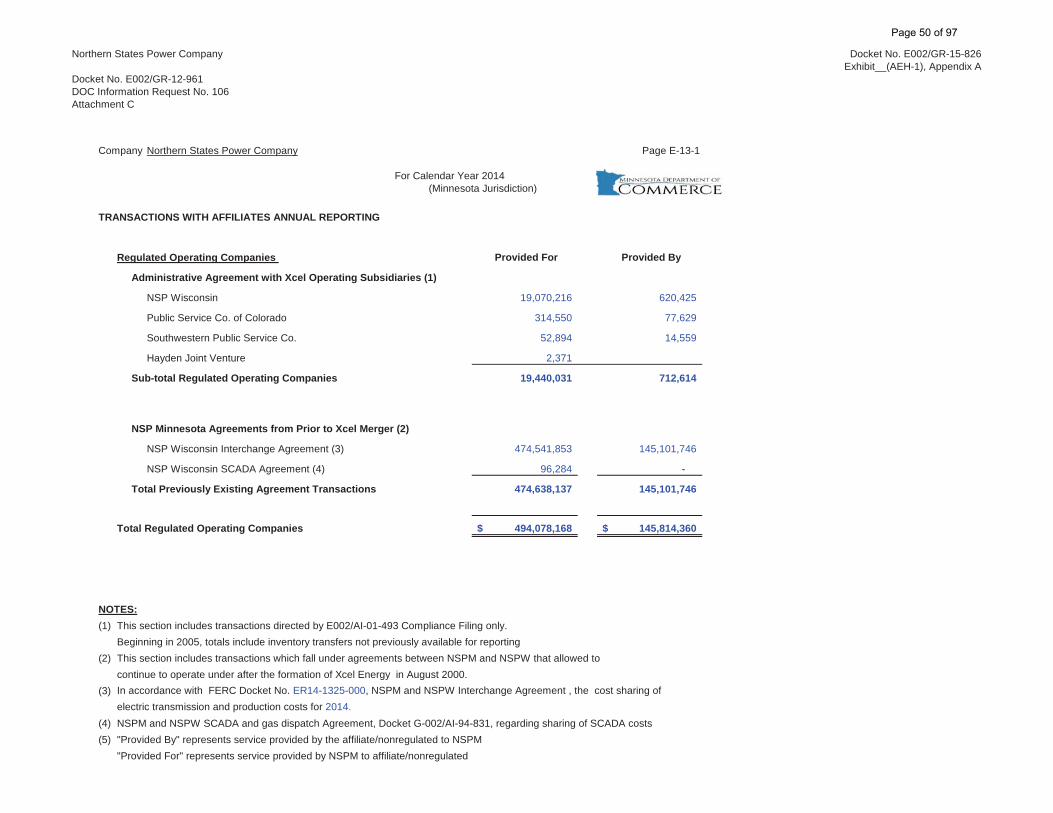
Northern States Power Company
Docket No. E002/GR-12-961DOC Information Request No. 106Attachment C
Docket No. E002/GR-15-826Exhibit__(AEH-1), Appendix A
Company Northern States Power Company Page E-13-1
For Calendar Year 2014(Minnesota Jurisdiction)
TRANSACTIONS WITH AFFILIATES ANNUAL REPORTING
Regulated Operating Companies Provided For Provided By
Administrative Agreement with Xcel Operating Subsidiaries (1)
NSP Wisconsin 19,070,216 620,425
Public Service Co. of Colorado 314,550 77,629
Southwestern Public Service Co. 52,894 14,559
Hayden Joint Venture 2,371
Sub-total Regulated Operating Companies 19,440,031 712,614
NSP Minnesota Agreements from Prior to Xcel Merger (2)
NSP Wisconsin Interchange Agreement (3) 474,541,853 145,101,746
NSP Wisconsin SCADA Agreement (4) 96,284 -
Total Previously Existing Agreement Transactions 474,638,137 145,101,746
Total Regulated Operating Companies 494,078,168$ 145,814,360$
NOTES:(1) This section includes transactions directed by E002/AI-01-493 Compliance Filing only.
Beginning in 2005, totals include inventory transfers not previously available for reporting(2) This section includes transactions which fall under agreements between NSPM and NSPW that allowed to
continue to operate under after the formation of Xcel Energy in August 2000.(3) In accordance with FERC Docket No. ER14-1325-000, NSPM and NSPW Interchange Agreement , the cost sharing of
electric transmission and production costs for 2014.(4) NSPM and NSPW SCADA and gas dispatch Agreement, Docket G-002/AI-94-831, regarding sharing of SCADA costs (5) "Provided By" represents service provided by the affiliate/nonregulated to NSPM
"Provided For" represents service provided by NSPM to affiliate/nonregulated
Page 50 of 97
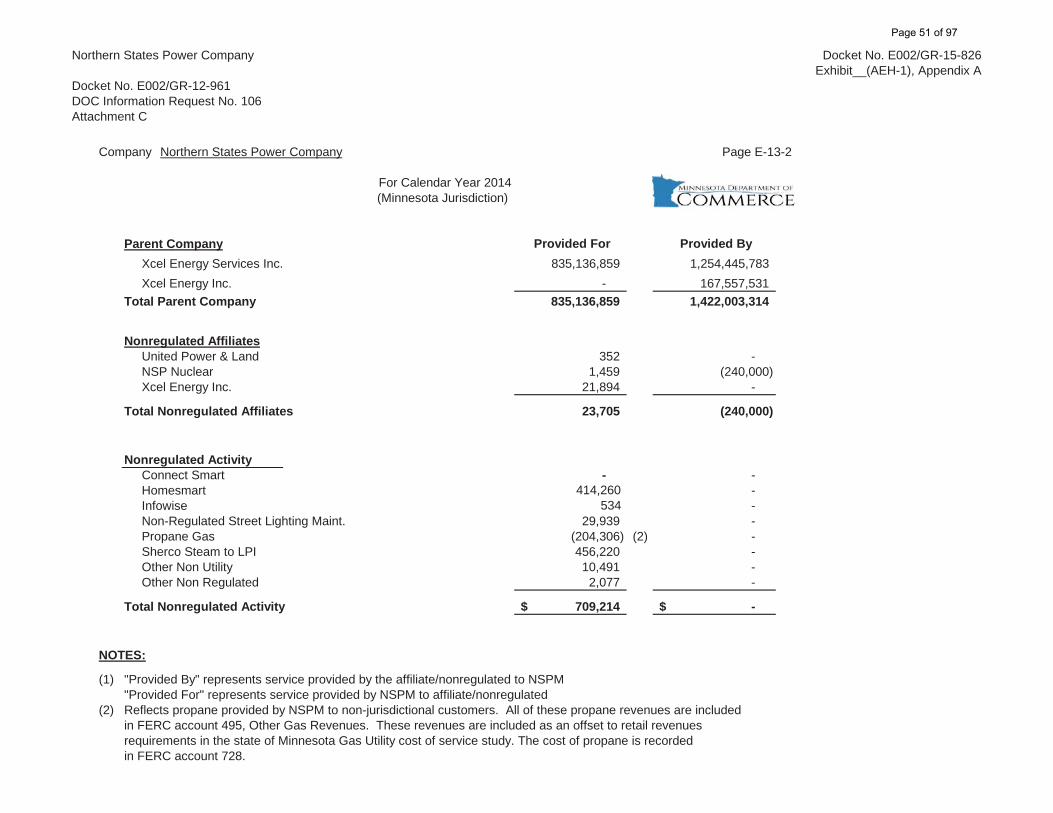
Northern States Power Company
Docket No. E002/GR-12-961DOC Information Request No. 106Attachment C
Docket No. E002/GR-15-826Exhibit__(AEH-1), Appendix A
Company Northern States Power Company Page E-13-2
For Calendar Year 2014(Minnesota Jurisdiction)
Parent Company Provided For Provided By Xcel Energy Services Inc. 835,136,859 1,254,445,783Xcel Energy Inc. - 167,557,531
Total Parent Company 835,136,859 1,422,003,314
Nonregulated AffiliatesUnited Power & Land 352 -NSP Nuclear 1,459 (240,000)Xcel Energy Inc. 21,894 -
Total Nonregulated Affiliates 23,705 (240,000)
Nonregulated ActivityConnect Smart - -Homesmart 414,260 -Infowise 534 -Non-Regulated Street Lighting Maint. 29,939 -Propane Gas (204,306) (2) -Sherco Steam to LPI 456,220 -Other Non Utility 10,491 -Other Non Regulated 2,077 -
Total Nonregulated Activity 709,214$ -$
NOTES:
(1) "Provided By" represents service provided by the affiliate/nonregulated to NSPM"Provided For" represents service provided by NSPM to affiliate/nonregulated
(2) Reflects propane provided by NSPM to non-jurisdictional customers. All of these propane revenues are includedin FERC account 495, Other Gas Revenues. These revenues are included as an offset to retail revenues requirements in the state of Minnesota Gas Utility cost of service study. The cost of propane is recorded in FERC account 728.
Page 51 of 97

Northern States Power Company
Docket No. E002/GR-12-961DOC Information Request No. 106Attachment C
Docket No. E002/GR-15-826Exhibit__(AEH-1), Appendix A
Company Northern States Power Company Page E-13-3
For Calendar Year 2014(Minnesota Jurisdiction)
TRANSACTIONS WITH AFFILIATES ANNUAL REPORTING *
Service Company Charges to NSPM Utility Operating Company for 2014
Functional Class Indirect Charges Direct Charges Total
Administrative and General $ 148,880,948 $ 43,230,141 $ 192,111,089 Customer Accounting 22,116,364 141,181 22,257,545Customer Service and Information 598,732 1,425,516 2,024,249Distribution 4,120,763 5,797,447 9,918,210Gas Production 309,098 309,098Gas Storage 18,363 18,363Power Production 3,174,089 22,902,731 26,076,819Regional Markets 260,839 260,839Customer Sales 2,336 2,336Transmission 6,114,613 13,695,845 19,810,458Utility Plant 131,804,357 131,804,357 Non-Utility Plant 1,122,876 1,122,876 Receivable 477,668 477,668 Clearing 20,674,676 20,674,676 Regulatory Assets 15,830,433 15,830,433 Regulatory Liabilities 408,790 408,790 Taxes 3,989,832 3,432,461 7,422,292 Other Income 14,957 (49,637) (34,680)Other Income Deductions 5,703,279 370,094 6,073,372 Interest Charges 276 190,701 190,977 Money Pool Activity - 34,000,000 Insurance Premiums 25,686,014 Shared Asset Credit - (29,136,859)Grand Total 194,713,853$ 262,045,916$ 487,308,924$
* Information provided based on Company's FERC Form 1 filing, page 429.
Page 52 of 97

Northern States Power Company
Docket No. E002/GR-12-961DOC Information Request No. 106Attachment C
Docket No. E002/GR-15-826Exhibit__(AEH-1), Appendix A
Company: Northern States Power Company Page E-13-4
For Calendar Year 2014(Minnesota Jurisdiction)
Administrative Services Agreement between Northern States Power Company and other Xcel Energy Inc. Utility Operating Company Subsidiaries Reporting Requirements Stipulated in MPUC Docket No. E-002/AI-01-493
As a condition of approval of the Administrative Services Agreement ("Agreement") between Northern States Power Companyd/b/a Xcel Energy ("Xcel Energy" or "the Company") and its utility operating company affiliates, MPUC Docket No. E-002/AI-01-493 (order dated June 22, 2001), Xcel Energy agreed to provide the following annual reporting recommended by the Department of Commerce.By order dated April 10, 2002, the Commission authorized the Company to provide the information contemporaneous with affiliatetransaction portion of the May 1st jurisdictional financial report.
A Heading that identifies the type of transactionsThe transactions included in the amounts shown on page E-13-1 are made up of costs associated with providing incidental services,lease arrangements, use of equipment, and other goods provided at cost by the Company to an operating company affiliate,or by the affiliate to the Company.
The identity of the affiliated parties in the first sentenceThe other utility operating company parties to the Agreement are Northern States Power Company (Wisconsin) ("NSPW"),Public Service Company of Colorado ("PSCO") and Southwestern Public Service Company. Page E-13-1 lists the Xcel Energy affiliateincluded in the Agreement and the dollars charged to the affiliate by the Company or to the Company by the affiliate under the Agreement.
A general description of the nature and terms of the agreement, including the effective date of the contract or arrangement and the length of the contract or arrangementThe Agreement allows the operating utilities to share a limited amount of services, leasing arrangements, equipment, and other goods between them when it is mutually beneficial to the operating utilities involved. The Agreement allows these transactions to occur on an "at-cost" basis,consistent with U.S. Securities and Exchange Commission rules applicable to registered holding company systems. This costing methodology is also consistent with the fully allocated costing principles adopted by the MPUC in Docket No. G,E999/CI-90-1008.
Page 53 of 97

Northern States Power Company
Docket No. E002/GR-12-961DOC Information Request No. 106Attachment C
Docket No. E002/GR-15-826Exhibit__(AEH-1), Appendix A
Company Northern States Power Company Page E-13-5
For Calendar Year 2014(Minnesota Jurisdiction)
Administrative Services Agreement between Northern States Power Company and other Xcel Energy Inc. Utility Operating Company Subsidiaries Reporting Requirements Stipulated in MPUC Docket No. E-002/AI-01-493
A list and the past history of all current contracts or agreements between the utility and the affiliate, the consideration received by the affiliate for such contracts oragreements, and a summary of the relevant costs records related to these ongoing transactions.Page E-13-1 shows the additional agreements under which Xcel Energy and NSPW currently provide services (see footnote 2). The gasSCADA and gas dispatch cost sharing agreement was approved in MPUC Docket No. G002/AI-94-831. The“Restated Agreement to Coordinate Planning and Operations and Interchange Power and Energy" between the Company and NSPW was accepted for filing in FERC Docket No. ER14-1325-000 effective January 1, 2014, restating the similar 1984 "Interchange Agreement", and allocates electric production and transmission costs for the integrated electric system. Both agreements existed prior to the formation Xcel Energy Inc. and were assigned to the Company as part of the August 2000 merger transactions.
The amount of compensation and, if applicable, a brief description of the cost allocation methodology or market information used to determine cost or price.The price or cost of the goods or services was based on the actual cost to the operating utility company providing the goods or services.
If the service or good acquired from an affiliate is competitively available, an explanation must be included stating whether competitive bidding was used, and if it was used, a copy of the proposal or a summary must be included. If it is not competitively bid, an explanation must be included stating why bidding was not used.For 2014, the goods and services provided were billed at cost to the operating utility company affiliate and were provided on a limited "as available" basis. For this reason, there were no situations were competitive bidding was warranted.
If the arrangement is in writing, a copy of that document must be attached.Other than the Agreement, there were no arrangements made in writing for 2014.
Page 54 of 97

Northern States Power Company
Docket No. E002/GR-12-961DOC Information Request No. 106Attachment C
Docket No. E002/GR-15-826Exhibit__(AEH-1), Appendix A
Company Northern States Power Company Page E-13-6
For Calendar Year 2014(Minnesota Jurisdiction)
XCEL ENERGY COMPLIANCE REPORTING RELATED TO DOCKET NO. G,E-999/CI-90-1008
Introduction
Pursuant to the Commission’s order setting filing requirements, Northern States Power Company d/b/a Xcel Energy (“Xcel Energy”)responded to the Commission’s ordering paragraph (3) in Docket No. G, E-999/CI-90-1008, the investigation into the competitiveimpact of appliance sales and service practices of Minnesota gas and electric utilities:
“Within 60 days of the date of this order, each utility party to this proceeding shall submit a filing explaining: 1) whether its method of allocation is a fully allocated costing approach; 2) whether it complies with the recommended cost allocation principles; and 3) if it does not comply with the recommended cost allocation principles, whether its methods would accomplish similar results.”
Xcel Energy had multiple non-regulated services and subsidiaries. We follow the same cost allocation process for both of these types ofactivities. The cost allocation approach is a fully allocated costing method as approved by the Commission in our electric and gas ratecases (E002/GR-92-1185 and G002/GR-92-1186).
The Commission’s stated hierarchical cost allocation principles are:
1. Tariffed rate shall be used to value tariffed services provided to the non-regulated activity.
2. Costs shall be directly assigned to either regulated or non-regulated activities whenever possible.
3. Costs that cannot be directly assigned are common costs, which shall be grouped into homogeneous cost categories Each cost category shall be allocated based on direct analysis of the origin of the costs whenever possible. If direct analysis is not possible, common costs shall be allocated based upon an indirect cost-causative linkage to another cost category or group of cost categories for which direct assignment or allocation is available.
4. Whenever neither direct nor indirect measures of cost causation can be found, the cost category shall be allocated based upon a general allocator computed by using the ratio of all expenses directly assigned or attributed to regulated and non-regulated activities.
Page 55 of 97
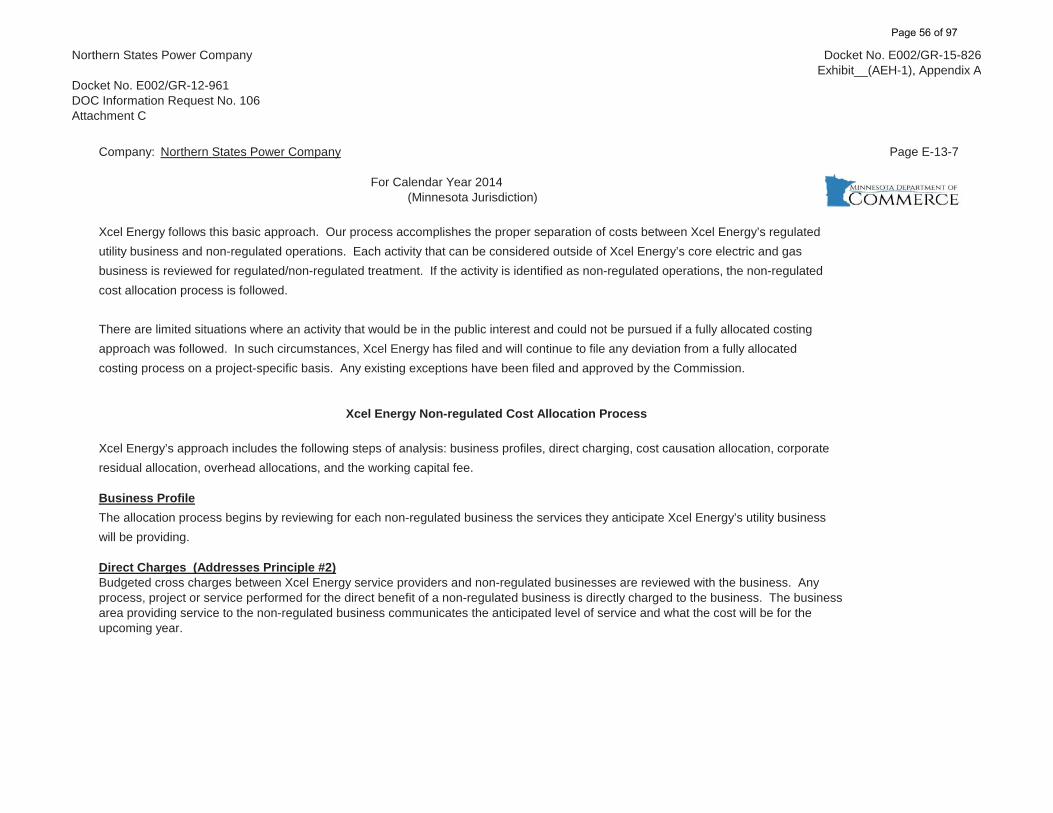
Northern States Power Company
Docket No. E002/GR-12-961DOC Information Request No. 106Attachment C
Docket No. E002/GR-15-826Exhibit__(AEH-1), Appendix A
Company: Northern States Power Company Page E-13-7
For Calendar Year 2014(Minnesota Jurisdiction)
Xcel Energy follows this basic approach. Our process accomplishes the proper separation of costs between Xcel Energy’s regulated utility business and non-regulated operations. Each activity that can be considered outside of Xcel Energy’s core electric and gas business is reviewed for regulated/non-regulated treatment. If the activity is identified as non-regulated operations, the non-regulated cost allocation process is followed.
There are limited situations where an activity that would be in the public interest and could not be pursued if a fully allocated costing approach was followed. In such circumstances, Xcel Energy has filed and will continue to file any deviation from a fully allocatedcosting process on a project-specific basis. Any existing exceptions have been filed and approved by the Commission.
Xcel Energy Non-regulated Cost Allocation Process
Xcel Energy’s approach includes the following steps of analysis: business profiles, direct charging, cost causation allocation, corporate residual allocation, overhead allocations, and the working capital fee.
Business ProfileThe allocation process begins by reviewing for each non-regulated business the services they anticipate Xcel Energy’s utility businesswill be providing.
Direct Charges (Addresses Principle #2)Budgeted cross charges between Xcel Energy service providers and non-regulated businesses are reviewed with the business. Any process, project or service performed for the direct benefit of a non-regulated business is directly charged to the business. The business area providing service to the non-regulated business communicates the anticipated level of service and what the cost will be for the upcoming year.
Page 56 of 97
Northern States Power Company
Docket No. E002/GR-12-961DOC Information Request No. 106Attachment C
Docket No. E002/GR-15-826Exhibit__(AEH-1), Appendix A
Company: Northern States Power Company Page E-13-8
For Calendar Year 2014(Minnesota Jurisdiction)
Actual charges for labor are assigned to the non-regulated business by either setting up a fixed labor distribution or though exception time reporting. The non-labor charges are directly charged. This process enables charging for all service that is provided; including what may not have been anticipated at budget time.
Cost Causation Allocations (Addresses Principle #2)If no direct charge has been established for a service expected it be provided, a cost causation allocation is developed. Direct charging is preferred, however, if a service is expected to be provided and was not budgeted as a direct charge, an estimate of the cost of the service is made and allocated to the non-regulated business. An example of this would be, when a service is being provided, but it is atsuch a minimal level that it would be very difficult or cost prohibitive to charge on a direct basis.
Overhead Costs (Addresses Principle #3)The overhead allocation factor captures indirect costs associated with providing services to others. Xcel Energy currently uses separate rates for labor and non-labor costs. The labor overhead rate was developed based on employee related expenses (such as employee programs, employee relations, training, employment, compensation and benefits program development costs, diversity, safety), office equipment needs, and supervision of the service provider. The non-labor overhead rate is developed based on procurement and material-related costs. The overhead factor is applied to all direct charges.
Corporate Residual AllocationFor non-regulated services wholly contained within the NSP Minnesota, a portion of NSP Minnesota’s corporation costs are assigned based on the relative size of the non-regulated business.
Working Capital Fee (Addresses Principle #3)The fee is based on the current Prime Rate and is reviewed and updated quarterly. This fee is to compensate the regulated business forthe cost of working capital used by the non-regulated businesses.
SummaryXcel Energy’s process has been reviewed in a number of dockets including our most recent general rate cases and complies with the common objective stated in the instant docket.
Page 57 of 97

Northern States Power Company
Docket No. E002/GR-12-961DOC Information Request No. 106Attachment C
Docket No. E002/GR-15-826Exhibit__(AEH-1), Appendix A
Company: Northern States Power Company Page E-13-9
For Calendar Year 2014(Minnesota Jurisdiction)
Xcel Energy Services Cost AllocationsSummary of Review and Monitoring of Indirect Cost Allocations
As a condition of approval of the Service Agreement, between Xcel Energy Services, Inc. (“XLS” or “Service Company”) andNorthern States Power Company d/b/a Xcel Energy, MPUC Docket No. G,E002/AI-00-1251, Xcel Energy agreed to provide,with our Minnesota jurisdictional annual report, a summary of the review and monitoring done to ensure appropriate allocation ofservice company costs. In addition, the report was required to identify any changes in cost allocators or changes to companies thatare allocated such costs. On August 1, 2000, XLS began operating as the Service Company of Xcel Energy Inc. The indirect costallocators implemented at that time were those approved by the MPUC in the above docket.
Changes to Indirect Cost Allocators - MethodsThe indirect cost allocation methods approved in the MPUC Docket No. E,G002/AI-14-0234 were used in the 2014 costs allocationsincluded in this filing.
Changes to Indirect Cost Allocators – Companies Added/DeletedFor the year ended December 31, 2014, some minor changes were made in the Xcel Energy Inc. affiliate companies included inthe XLS indirect cost allocators. A summary of these changes is included on 13-10 through 13-15 of this report.
Changes to Indirect Cost Allocators – Updated Base DataFor the year ended December 31, 2014, no updates were made to the base data used to develop the indirect cost allocators.
Summary of Review and Monitoring of Indirect Cost AllocatorsFor the year ended December 31, 2014, monthly detailed statements were sent to the affiliate company financial organizationsThese statements included all billings (both direct billings and indirect cost allocations) to them from XLS for their review andapproval. In addition, detailed statements were also provided to the service function service providers for their review. As aresult, both service receivers (affiliate companies) and service providers (service functions) initiated discussions with XLS which,in some cases, resulted in adjustments to billings and changes in indirect cost allocators. The changes included on 13-10 through13-15 of this report is a log of the changes that were made to the indirect cost allocators as a result of this process.
Page 58 of 97
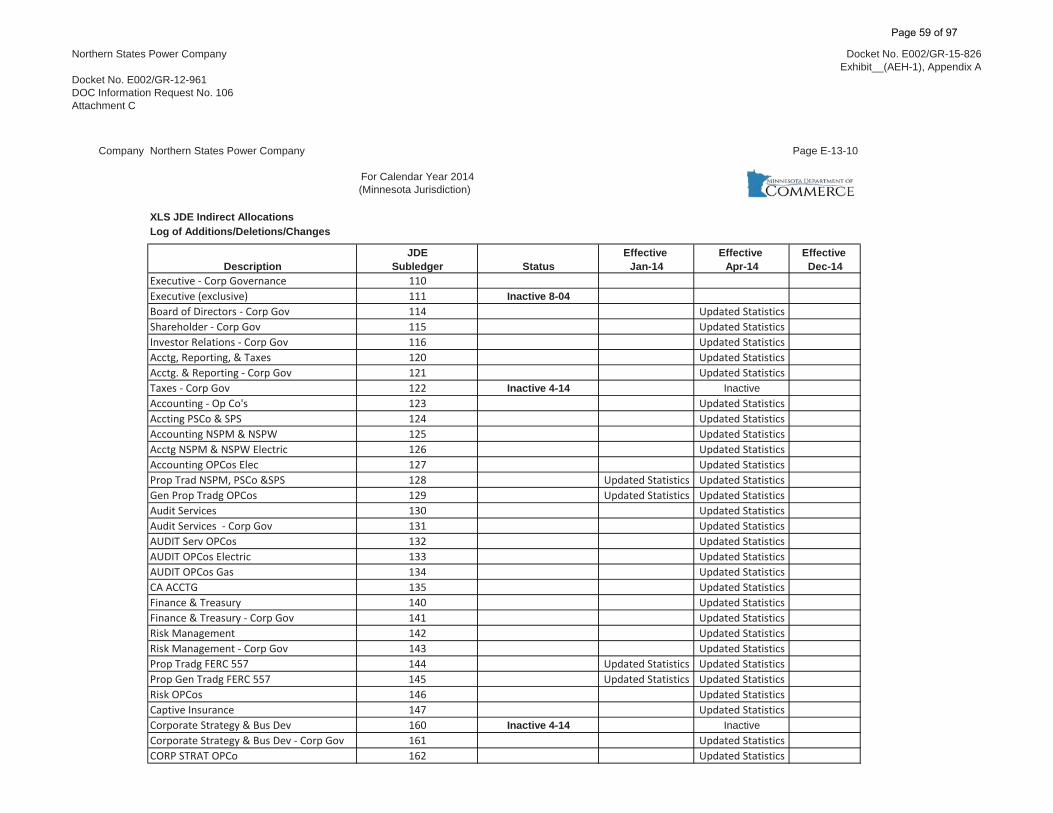
Northern States Power Company
Docket No. E002/GR-12-961DOC Information Request No. 106Attachment C
Docket No. E002/GR-15-826Exhibit__(AEH-1), Appendix A
Company Northern States Power Company Page E-13-10
For Calendar Year 2014(Minnesota Jurisdiction)
XLS JDE Indirect AllocationsLog of Additions/Deletions/Changes
JDE Effective Effective Effective Description Subledger Status Jan-14 Apr-14 Dec-14
Executive - Corp Governance 110Executive (exclusive) 111 Inactive 8-04Board of Directors - Corp Gov 114 Updated StatisticsShareholder - Corp Gov 115 Updated StatisticsInvestor Relations - Corp Gov 116 Updated StatisticsAcctg, Reporting, & Taxes 120 Updated StatisticsAcctg. & Reporting - Corp Gov 121 Updated StatisticsTaxes - Corp Gov 122 Inactive 4-14 InactiveAccounting - Op Co's 123 Updated StatisticsAccting PSCo & SPS 124 Updated StatisticsAccounting NSPM & NSPW 125 Updated StatisticsAcctg NSPM & NSPW Electric 126 Updated StatisticsAccounting OPCos Elec 127 Updated StatisticsProp Trad NSPM, PSCo &SPS 128 Updated Statistics Updated StatisticsGen Prop Tradg OPCos 129 Updated Statistics Updated StatisticsAudit Services 130 Updated StatisticsAudit Services - Corp Gov 131 Updated StatisticsAUDIT Serv OPCos 132 Updated StatisticsAUDIT OPCos Electric 133 Updated StatisticsAUDIT OPCos Gas 134 Updated StatisticsCA ACCTG 135 Updated StatisticsFinance & Treasury 140 Updated StatisticsFinance & Treasury - Corp Gov 141 Updated StatisticsRisk Management 142 Updated StatisticsRisk Management - Corp Gov 143 Updated StatisticsProp Tradg FERC 557 144 Updated Statistics Updated StatisticsProp Gen Tradg FERC 557 145 Updated Statistics Updated StatisticsRisk OPCos 146 Updated StatisticsCaptive Insurance 147 Updated StatisticsCorporate Strategy & Bus Dev 160 Inactive 4-14 InactiveCorporate Strategy & Bus Dev - Corp Gov 161 Updated StatisticsCORP STRAT OPCo 162 Updated Statistics
Page 59 of 97

Northern States Power Company
Docket No. E002/GR-12-961DOC Information Request No. 106Attachment C
Docket No. E002/GR-15-826Exhibit__(AEH-1), Appendix A
Company Northern States Power Company Page E-13-11
For Calendar Year 2014(Minnesota Jurisdiction)
XLS JDE Indirect AllocationsLog of Additions/Deletions/Changes (Cont'd)
JDE Effective Effective Effective Description Subledger Status Jan-14 Apr-14 Dec-14
Legal OPCo Elec 163 Updated StatisticsLegal OPCo Gas 164 Updated StatisticsLegal 170 Updated StatisticsLegal - Corp Governance 171 Updated StatisticsLEGAL NSPM & NSPW 172 Updated StatisticsLEGAL NSPM & NSPW Electric 173 Updated StatisticsLEGAL OPCos 174 Updated StatisticsCommunications - Corp Gov 180 Updated StatisticsEmployee Communications 181 Updated StatisticsXcel Foundation 182 Updated StatisticsEmployee Communications - exclusive 183 Inactive 4-07Branding 184 Updated StatisticsCustomer Safety Advertising/Information Costs 185 Updated StatisticsHR Corp Governance 189 Updated StatisticsHR (Diversity/Safety/Emp Relations) 190 Updated StatisticsHR - Energy Supply 191 Inactive 4-13HR - Energy Delivery 192 Inactive 4-13HR - Retail 193 Inactive 4-13Payroll - South 194 Inactive 8-04Payroll - North 195 Inactive 8-04HR - Energy Markets 196 Inactive 1-14 InactiveHR - Op Co's 197 Updated StatisticsPayroll 198 Updated StatisticsHR - Recruitment 199 Updated StatisticsFacilities 200 Inactive 5-11Facilities - Admin 201 Inactive 5-11Supply Chain Special Programs 220 Inactive 1-08HR - Benefits 240 Inactive 8-04Customer Service (inclusive) 400 Inactive 12-04Customer Service - South 401 Inactive 12-04Customer Service - North 402 Inactive 12-04Customer Service IT - FERC 903 403 Updated Statistics
Page 60 of 97
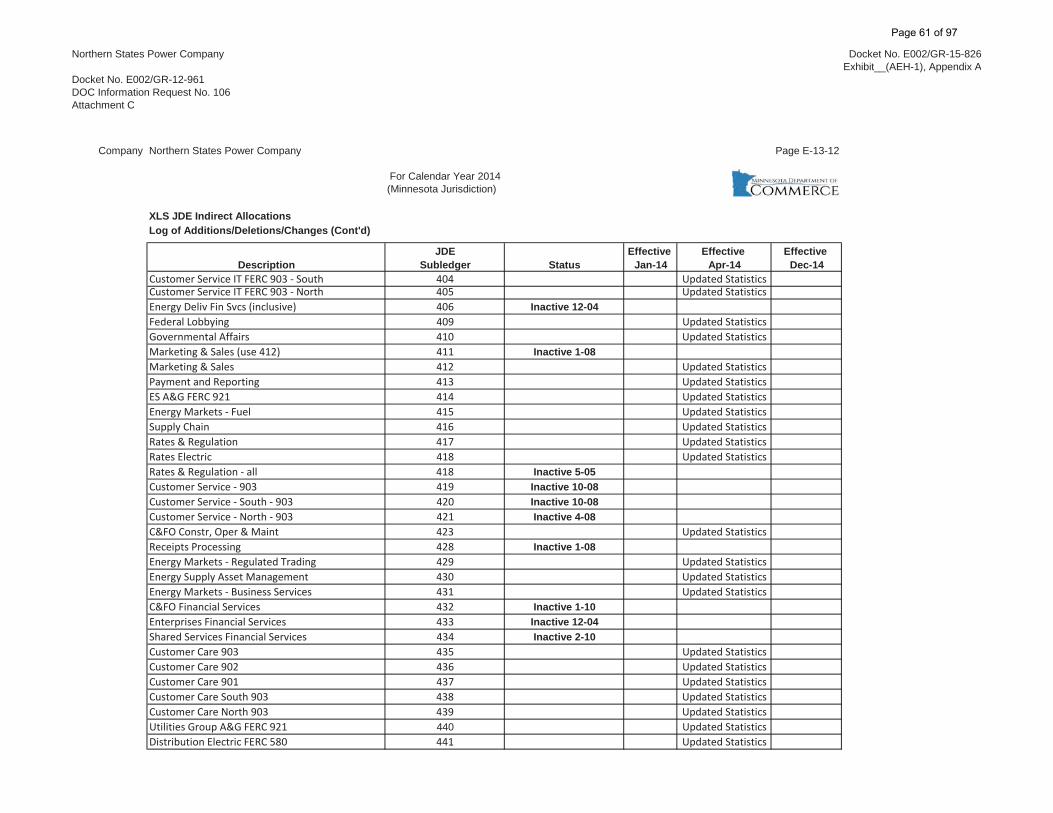
Northern States Power Company
Docket No. E002/GR-12-961DOC Information Request No. 106Attachment C
Docket No. E002/GR-15-826Exhibit__(AEH-1), Appendix A
Company Northern States Power Company Page E-13-12
For Calendar Year 2014(Minnesota Jurisdiction)
XLS JDE Indirect AllocationsLog of Additions/Deletions/Changes (Cont'd)
JDE Effective Effective Effective Description Subledger Status Jan-14 Apr-14 Dec-14
Customer Service IT FERC 903 - South 404 Updated StatisticsCustomer Service IT FERC 903 - North 405 Updated StatisticsEnergy Deliv Fin Svcs (inclusive) 406 Inactive 12-04Federal Lobbying 409 Updated StatisticsGovernmental Affairs 410 Updated StatisticsMarketing & Sales (use 412) 411 Inactive 1-08Marketing & Sales 412 Updated StatisticsPayment and Reporting 413 Updated StatisticsES A&G FERC 921 414 Updated StatisticsEnergy Markets - Fuel 415 Updated StatisticsSupply Chain 416 Updated StatisticsRates & Regulation 417 Updated StatisticsRates Electric 418 Updated StatisticsRates & Regulation - all 418 Inactive 5-05Customer Service - 903 419 Inactive 10-08Customer Service - South - 903 420 Inactive 10-08Customer Service - North - 903 421 Inactive 4-08C&FO Constr, Oper & Maint 423 Updated StatisticsReceipts Processing 428 Inactive 1-08Energy Markets - Regulated Trading 429 Updated StatisticsEnergy Supply Asset Management 430 Updated StatisticsEnergy Markets - Business Services 431 Updated StatisticsC&FO Financial Services 432 Inactive 1-10Enterprises Financial Services 433 Inactive 12-04Shared Services Financial Services 434 Inactive 2-10Customer Care 903 435 Updated StatisticsCustomer Care 902 436 Updated StatisticsCustomer Care 901 437 Updated StatisticsCustomer Care South 903 438 Updated StatisticsCustomer Care North 903 439 Updated StatisticsUtilities Group A&G FERC 921 440 Updated StatisticsDistribution Electric FERC 580 441 Updated Statistics
Page 61 of 97
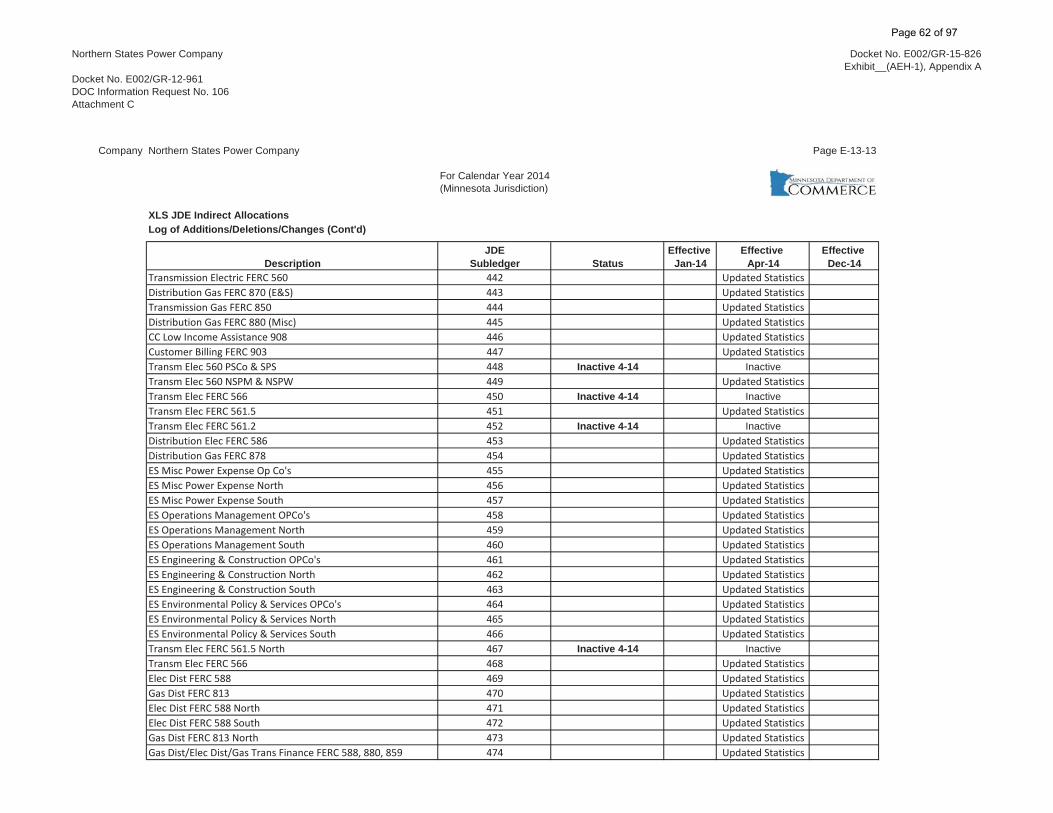
Northern States Power Company
Docket No. E002/GR-12-961DOC Information Request No. 106Attachment C
Docket No. E002/GR-15-826Exhibit__(AEH-1), Appendix A
Company Northern States Power Company Page E-13-13
For Calendar Year 2014(Minnesota Jurisdiction)
XLS JDE Indirect AllocationsLog of Additions/Deletions/Changes (Cont'd)
JDE Effective Effective Effective Description Subledger Status Jan-14 Apr-14 Dec-14
Transmission Electric FERC 560 442 Updated StatisticsDistribution Gas FERC 870 (E&S) 443 Updated StatisticsTransmission Gas FERC 850 444 Updated StatisticsDistribution Gas FERC 880 (Misc) 445 Updated StatisticsCC Low Income Assistance 908 446 Updated StatisticsCustomer Billing FERC 903 447 Updated StatisticsTransm Elec 560 PSCo & SPS 448 Inactive 4-14 InactiveTransm Elec 560 NSPM & NSPW 449 Updated StatisticsTransm Elec FERC 566 450 Inactive 4-14 InactiveTransm Elec FERC 561.5 451 Updated StatisticsTransm Elec FERC 561.2 452 Inactive 4-14 InactiveDistribution Elec FERC 586 453 Updated StatisticsDistribution Gas FERC 878 454 Updated StatisticsES Misc Power Expense Op Co's 455 Updated StatisticsES Misc Power Expense North 456 Updated StatisticsES Misc Power Expense South 457 Updated StatisticsES Operations Management OPCo's 458 Updated StatisticsES Operations Management North 459 Updated StatisticsES Operations Management South 460 Updated StatisticsES Engineering & Construction OPCo's 461 Updated StatisticsES Engineering & Construction North 462 Updated StatisticsES Engineering & Construction South 463 Updated StatisticsES Environmental Policy & Services OPCo's 464 Updated StatisticsES Environmental Policy & Services North 465 Updated StatisticsES Environmental Policy & Services South 466 Updated StatisticsTransm Elec FERC 561.5 North 467 Inactive 4-14 InactiveTransm Elec FERC 566 468 Updated StatisticsElec Dist FERC 588 469 Updated StatisticsGas Dist FERC 813 470 Updated StatisticsElec Dist FERC 588 North 471 Updated StatisticsElec Dist FERC 588 South 472 Updated StatisticsGas Dist FERC 813 North 473 Updated StatisticsGas Dist/Elec Dist/Gas Trans Finance FERC 588, 880, 859 474 Updated Statistics
Page 62 of 97
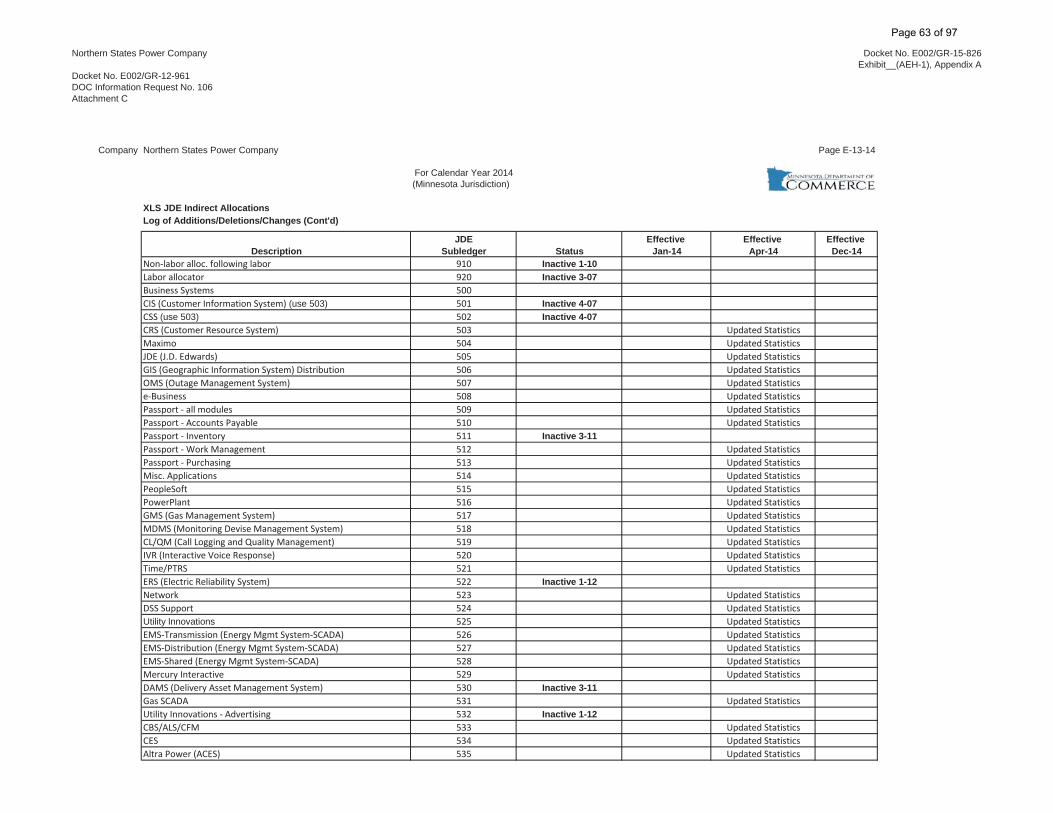
Northern States Power Company
Docket No. E002/GR-12-961DOC Information Request No. 106Attachment C
Docket No. E002/GR-15-826Exhibit__(AEH-1), Appendix A
Company Northern States Power Company Page E-13-14
For Calendar Year 2014(Minnesota Jurisdiction)
XLS JDE Indirect AllocationsLog of Additions/Deletions/Changes (Cont'd)
JDE Effective Effective Effective Description Subledger Status Jan-14 Apr-14 Dec-14
Non-labor alloc. following labor 910 Inactive 1-10Labor allocator 920 Inactive 3-07Business Systems 500CIS (Customer Information System) (use 503) 501 Inactive 4-07CSS (use 503) 502 Inactive 4-07CRS (Customer Resource System) 503 Updated StatisticsMaximo 504 Updated StatisticsJDE (J.D. Edwards) 505 Updated StatisticsGIS (Geographic Information System) Distribution 506 Updated StatisticsOMS (Outage Management System) 507 Updated Statisticse-Business 508 Updated StatisticsPassport - all modules 509 Updated StatisticsPassport - Accounts Payable 510 Updated StatisticsPassport - Inventory 511 Inactive 3-11Passport - Work Management 512 Updated StatisticsPassport - Purchasing 513 Updated StatisticsMisc. Applications 514 Updated StatisticsPeopleSoft 515 Updated StatisticsPowerPlant 516 Updated StatisticsGMS (Gas Management System) 517 Updated StatisticsMDMS (Monitoring Devise Management System) 518 Updated StatisticsCL/QM (Call Logging and Quality Management) 519 Updated StatisticsIVR (Interactive Voice Response) 520 Updated StatisticsTime/PTRS 521 Updated StatisticsERS (Electric Reliability System) 522 Inactive 1-12Network 523 Updated StatisticsDSS Support 524 Updated StatisticsUtility Innovations 525 Updated StatisticsEMS-Transmission (Energy Mgmt System-SCADA) 526 Updated StatisticsEMS-Distribution (Energy Mgmt System-SCADA) 527 Updated StatisticsEMS-Shared (Energy Mgmt System-SCADA) 528 Updated StatisticsMercury Interactive 529 Updated StatisticsDAMS (Delivery Asset Management System) 530 Inactive 3-11Gas SCADA 531 Updated StatisticsUtility Innovations - Advertising 532 Inactive 1-12CBS/ALS/CFM 533 Updated StatisticsCES 534 Updated StatisticsAltra Power (ACES) 535 Updated Statistics
Page 63 of 97
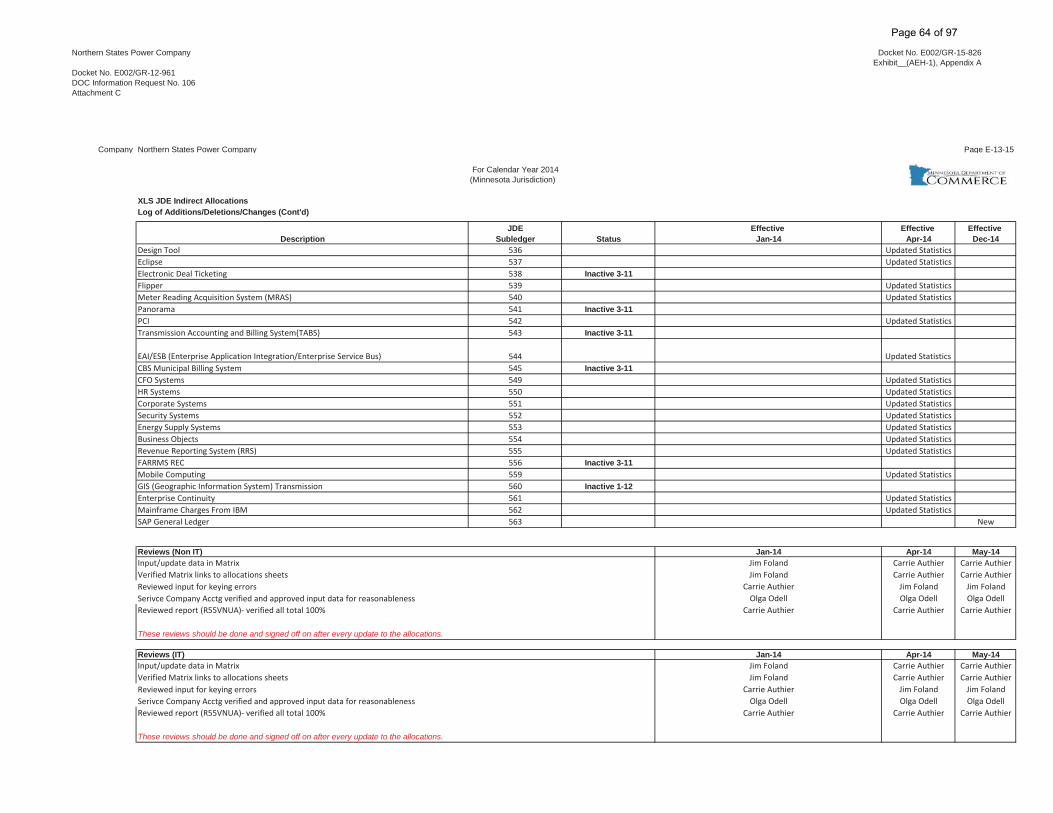
Northern States Power Company
Docket No. E002/GR-12-961DOC Information Request No. 106Attachment C
Docket No. E002/GR-15-826Exhibit__(AEH-1), Appendix A
Company Northern States Power Company Page E-13-15
For Calendar Year 2014(Minnesota Jurisdiction)
XLS JDE Indirect AllocationsLog of Additions/Deletions/Changes (Cont'd)
JDE Effective Effective Effective Description Subledger Status Jan-14 Apr-14 Dec-14
Design Tool 536 Updated StatisticsEclipse 537 Updated StatisticsElectronic Deal Ticketing 538 Inactive 3-11Flipper 539 Updated StatisticsMeter Reading Acquisition System (MRAS) 540 Updated StatisticsPanorama 541 Inactive 3-11PCI 542 Updated StatisticsTransmission Accounting and Billing System(TABS) 543 Inactive 3-11
EAI/ESB (Enterprise Application Integration/Enterprise Service Bus) 544 Updated StatisticsCBS Municipal Billing System 545 Inactive 3-11CFO Systems 549 Updated StatisticsHR Systems 550 Updated StatisticsCorporate Systems 551 Updated StatisticsSecurity Systems 552 Updated StatisticsEnergy Supply Systems 553 Updated StatisticsBusiness Objects 554 Updated StatisticsRevenue Reporting System (RRS) 555 Updated StatisticsFARRMS REC 556 Inactive 3-11Mobile Computing 559 Updated StatisticsGIS (Geographic Information System) Transmission 560 Inactive 1-12Enterprise Continuity 561 Updated StatisticsMainframe Charges From IBM 562 Updated StatisticsSAP General Ledger 563 New
Reviews (Non IT) Jan-14 Apr-14 May-14Input/update data in Matrix Jim Foland Carrie Authier Carrie AuthierVerified Matrix links to allocations sheets Jim Foland Carrie Authier Carrie AuthierReviewed input for keying errors Carrie Authier Jim Foland Jim FolandSerivce Company Acctg verified and approved input data for reasonableness Olga Odell Olga Odell Olga OdellReviewed report (R55VNUA)- verified all total 100% Carrie Authier Carrie Authier Carrie Authier
These reviews should be done and signed off on after every update to the allocations.
Reviews (IT) Jan-14 Apr-14 May-14Input/update data in Matrix Jim Foland Carrie Authier Carrie AuthierVerified Matrix links to allocations sheets Jim Foland Carrie Authier Carrie AuthierReviewed input for keying errors Carrie Authier Jim Foland Jim FolandSerivce Company Acctg verified and approved input data for reasonableness Olga Odell Olga Odell Olga OdellReviewed report (R55VNUA)- verified all total 100% Carrie Authier Carrie Authier Carrie Authier
These reviews should be done and signed off on after every update to the allocations.
Page 64 of 97
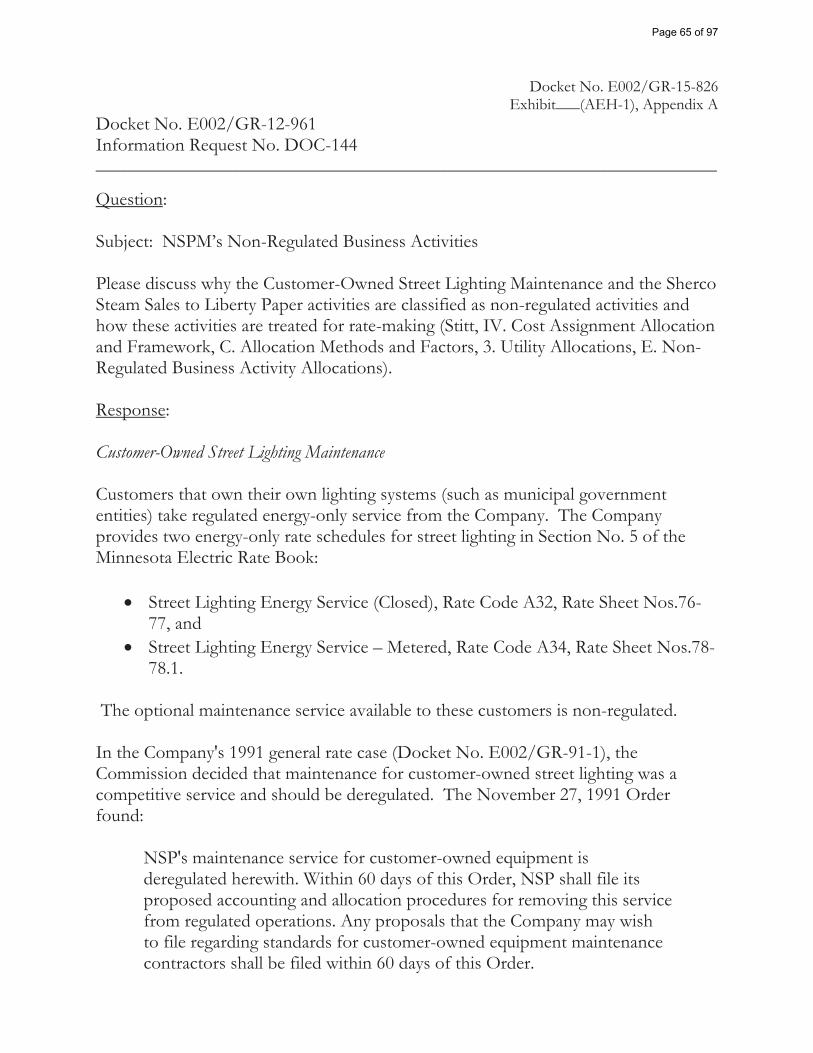
Docket No. E002/GR-15-826 Exhibit___(AEH-1), Appendix A Docket No. E002/GR-12-961 Information Request No. DOC-144 __________________________________________________________________
Question: Subject: NSPM’s Non-Regulated Business Activities Please discuss why the Customer-Owned Street Lighting Maintenance and the Sherco Steam Sales to Liberty Paper activities are classified as non-regulated activities and how these activities are treated for rate-making (Stitt, IV. Cost Assignment Allocation and Framework, C. Allocation Methods and Factors, 3. Utility Allocations, E. Non-Regulated Business Activity Allocations).
Response: Customer-Owned Street Lighting Maintenance Customers that own their own lighting systems (such as municipal government entities) take regulated energy-only service from the Company. The Company provides two energy-only rate schedules for street lighting in Section No. 5 of the Minnesota Electric Rate Book:
Street Lighting Energy Service (Closed), Rate Code A32, Rate Sheet Nos.76-77, and Street Lighting Energy Service – Metered, Rate Code A34, Rate Sheet Nos.78-78.1.
The optional maintenance service available to these customers is non-regulated.
In the Company's 1991 general rate case (Docket No. E002/GR-91-1), the Commission decided that maintenance for customer-owned street lighting was a competitive service and should be deregulated. The November 27, 1991 Order found:
NSP's maintenance service for customer-owned equipment is deregulated herewith. Within 60 days of this Order, NSP shall file its proposed accounting and allocation procedures for removing this service from regulated operations. Any proposals that the Company may wish to file regarding standards for customer-owned equipment maintenance contractors shall be filed within 60 days of this Order.
Page 65 of 97
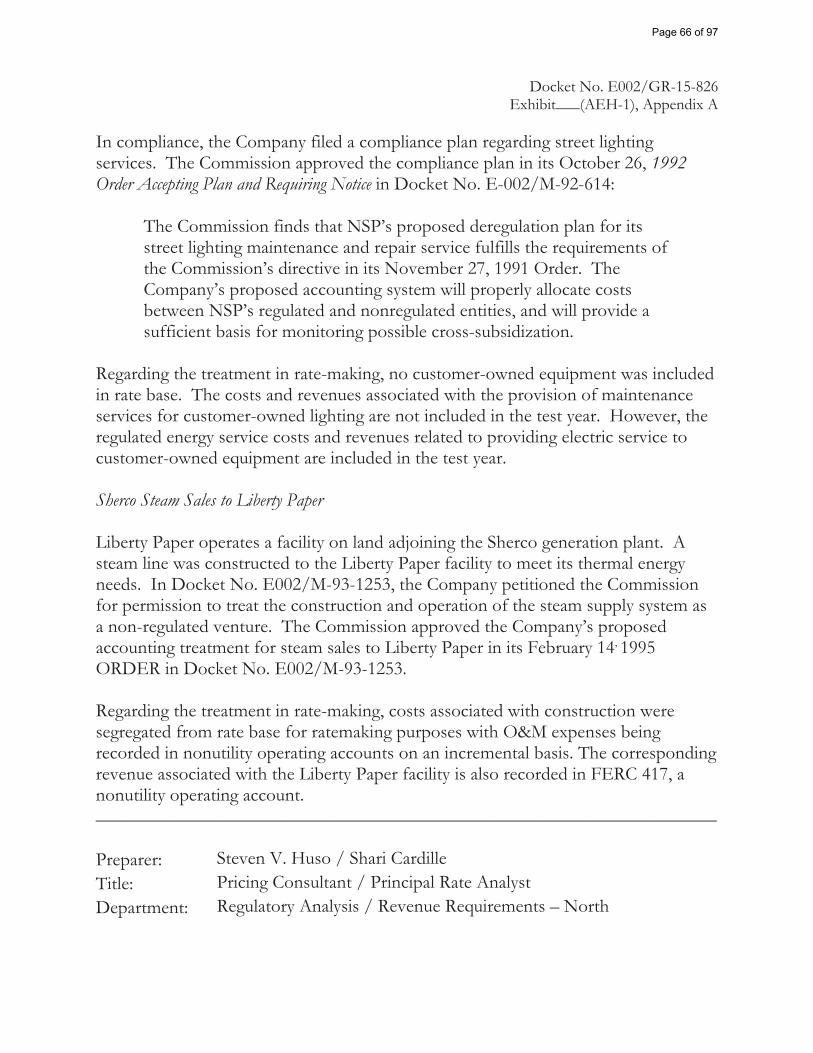
Docket No. E002/GR-15-826 Exhibit___(AEH-1), Appendix A In compliance, the Company filed a compliance plan regarding street lighting services. The Commission approved the compliance plan in its October 26, 1992 Order Accepting Plan and Requiring Notice in Docket No. E-002/M-92-614:
The Commission finds that NSP’s proposed deregulation plan for its street lighting maintenance and repair service fulfills the requirements of the Commission’s directive in its November 27, 1991 Order. The Company’s proposed accounting system will properly allocate costs between NSP’s regulated and nonregulated entities, and will provide a sufficient basis for monitoring possible cross-subsidization.
Regarding the treatment in rate-making, no customer-owned equipment was included in rate base. The costs and revenues associated with the provision of maintenance services for customer-owned lighting are not included in the test year. However, the regulated energy service costs and revenues related to providing electric service to customer-owned equipment are included in the test year. Sherco Steam Sales to Liberty Paper Liberty Paper operates a facility on land adjoining the Sherco generation plant. A steam line was constructed to the Liberty Paper facility to meet its thermal energy needs. In Docket No. E002/M-93-1253, the Company petitioned the Commission for permission to treat the construction and operation of the steam supply system as a non-regulated venture. The Commission approved the Company’s proposed accounting treatment for steam sales to Liberty Paper in its February 14, 1995 ORDER in Docket No. E002/M-93-1253. Regarding the treatment in rate-making, costs associated with construction were segregated from rate base for ratemaking purposes with O&M expenses being recorded in nonutility operating accounts on an incremental basis. The corresponding revenue associated with the Liberty Paper facility is also recorded in FERC 417, a nonutility operating account. __________________________________________________________________ Preparer: Steven V. Huso / Shari Cardille Title: Pricing Consultant / Principal Rate Analyst Department: Regulatory Analysis / Revenue Requirements – North
Page 66 of 97
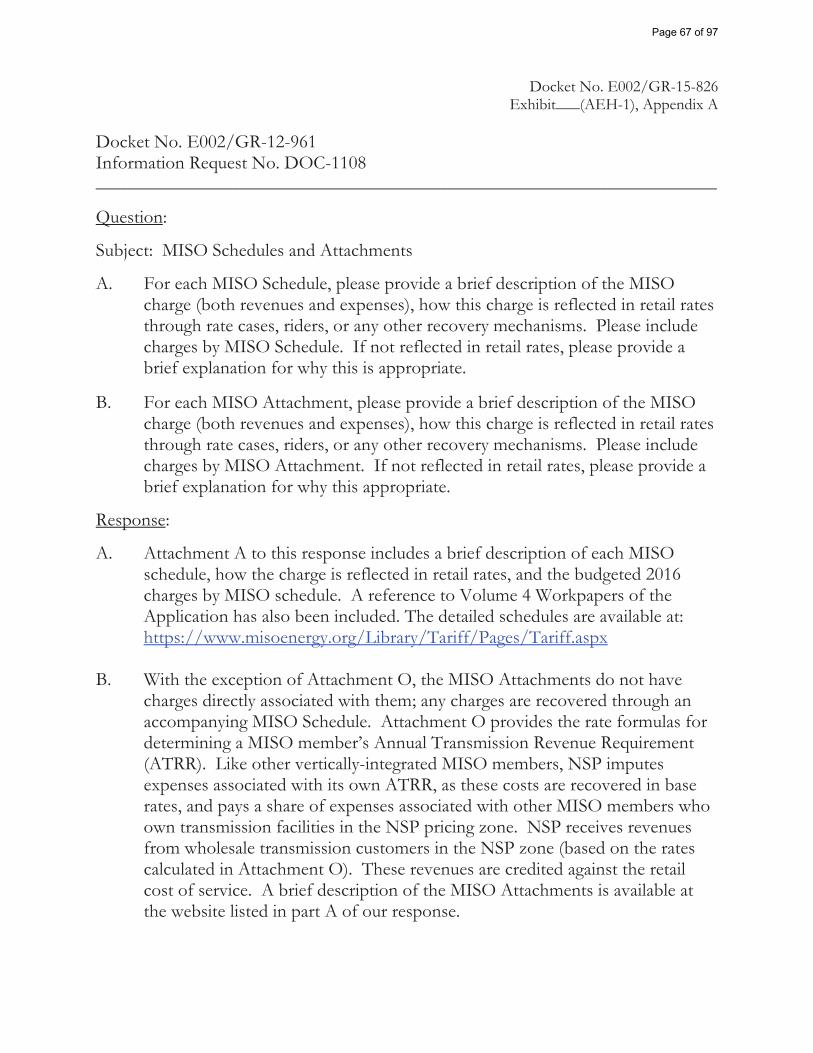
Docket No. E002/GR-15-826 Exhibit___(AEH-1), Appendix A Docket No. E002/GR-12-961 Information Request No. DOC-1108 __________________________________________________________________
Question:
Subject: MISO Schedules and Attachments
A. For each MISO Schedule, please provide a brief description of the MISO charge (both revenues and expenses), how this charge is reflected in retail rates through rate cases, riders, or any other recovery mechanisms. Please include charges by MISO Schedule. If not reflected in retail rates, please provide a brief explanation for why this is appropriate.
B. For each MISO Attachment, please provide a brief description of the MISO
charge (both revenues and expenses), how this charge is reflected in retail rates through rate cases, riders, or any other recovery mechanisms. Please include charges by MISO Attachment. If not reflected in retail rates, please provide a brief explanation for why this appropriate.
Response:
A. Attachment A to this response includes a brief description of each MISO schedule, how the charge is reflected in retail rates, and the budgeted 2016 charges by MISO schedule. A reference to Volume 4 Workpapers of the Application has also been included. The detailed schedules are available at: https://www.misoenergy.org/Library/Tariff/Pages/Tariff.aspx
B. With the exception of Attachment O, the MISO Attachments do not have charges directly associated with them; any charges are recovered through an accompanying MISO Schedule. Attachment O provides the rate formulas for determining a MISO member’s Annual Transmission Revenue Requirement (ATRR). Like other vertically-integrated MISO members, NSP imputes expenses associated with its own ATRR, as these costs are recovered in base rates, and pays a share of expenses associated with other MISO members who own transmission facilities in the NSP pricing zone. NSP receives revenues from wholesale transmission customers in the NSP zone (based on the rates calculated in Attachment O). These revenues are credited against the retail cost of service. A brief description of the MISO Attachments is available at the website listed in part A of our response.
Page 67 of 97
Docket No. E002/GR-15-826 Exhibit___(AEH-1), Appendix A
__________________________________________________________________ Preparer: Thomas Kramer / Nick Morlan Title: Principal Rate Analyst / Principal Financial Consultant Department: Revenue Requirements – North / Transmission Accounting
2
Page 68 of 97
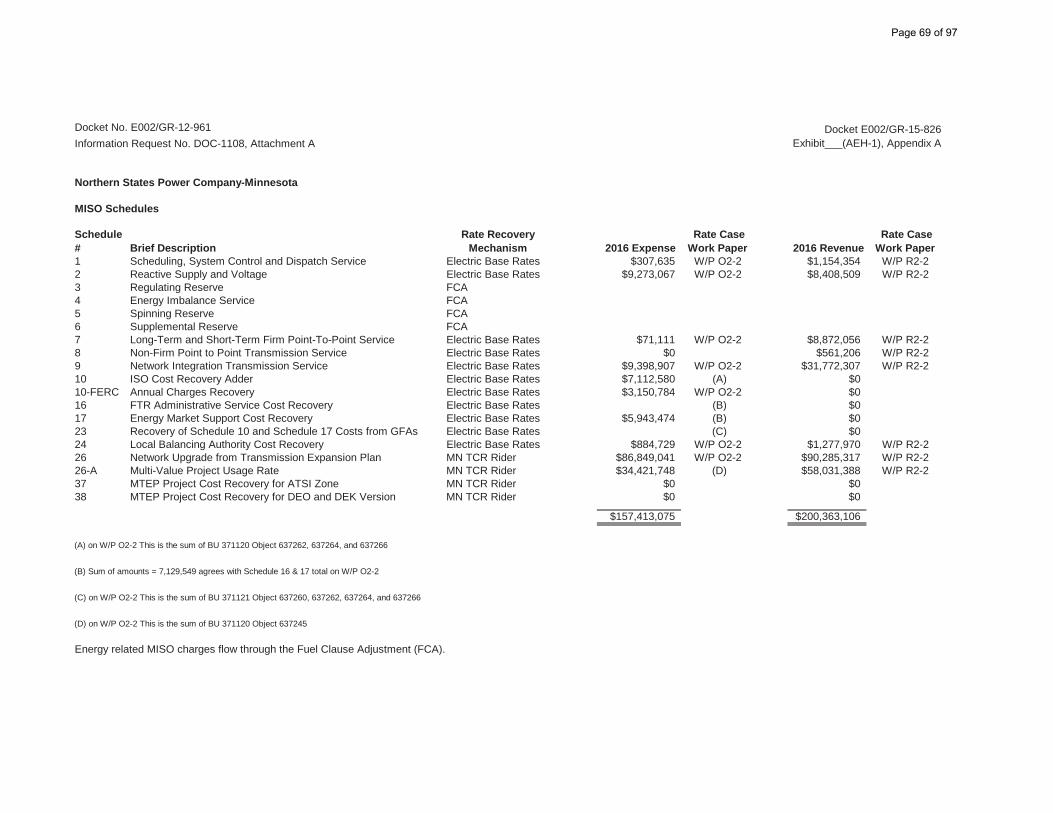
Docket E002/GR-15-826Exhibit___(AEH-1), Appendix A
Northern States Power Company-Minnesota
MISO Schedules
Schedule # Brief Description
Rate Recovery Mechanism 2016 Expense
Rate Case Work Paper 2016 Revenue
Rate Case Work Paper
1 Scheduling, System Control and Dispatch Service Electric Base Rates $307,635 W/P O2-2 $1,154,354 W/P R2-22 Reactive Supply and Voltage Electric Base Rates $9,273,067 W/P O2-2 $8,408,509 W/P R2-23 Regulating Reserve FCA4 Energy Imbalance Service FCA5 Spinning Reserve FCA6 Supplemental Reserve FCA7 Long-Term and Short-Term Firm Point-To-Point Service Electric Base Rates $71,111 W/P O2-2 $8,872,056 W/P R2-28 Non-Firm Point to Point Transmission Service Electric Base Rates $0 $561,206 W/P R2-29 Network Integration Transmission Service Electric Base Rates $9,398,907 W/P O2-2 $31,772,307 W/P R2-210 ISO Cost Recovery Adder Electric Base Rates $7,112,580 (A) $010-FERC Annual Charges Recovery Electric Base Rates $3,150,784 W/P O2-2 $016 FTR Administrative Service Cost Recovery Electric Base Rates (B) $017 Energy Market Support Cost Recovery Electric Base Rates $5,943,474 (B) $023 Recovery of Schedule 10 and Schedule 17 Costs from GFAs Electric Base Rates (C) $024 Local Balancing Authority Cost Recovery Electric Base Rates $884,729 W/P O2-2 $1,277,970 W/P R2-226 Network Upgrade from Transmission Expansion Plan MN TCR Rider $86,849,041 W/P O2-2 $90,285,317 W/P R2-226-A Multi-Value Project Usage Rate MN TCR Rider $34,421,748 (D) $58,031,388 W/P R2-237 MTEP Project Cost Recovery for ATSI Zone MN TCR Rider $0 $038 MTEP Project Cost Recovery for DEO and DEK Version MN TCR Rider $0 $0
$157,413,075 $200,363,106
(A) on W/P O2-2 This is the sum of BU 371120 Object 637262, 637264, and 637266
(B) Sum of amounts = 7,129,549 agrees with Schedule 16 & 17 total on W/P O2-2
(C) on W/P O2-2 This is the sum of BU 371121 Object 637260, 637262, 637264, and 637266
(D) on W/P O2-2 This is the sum of BU 371120 Object 637245
Energy related MISO charges flow through the Fuel Clause Adjustment (FCA).
Docket No. E002/GR-12-961Information Request No. DOC-1108, Attachment A
Page 69 of 97
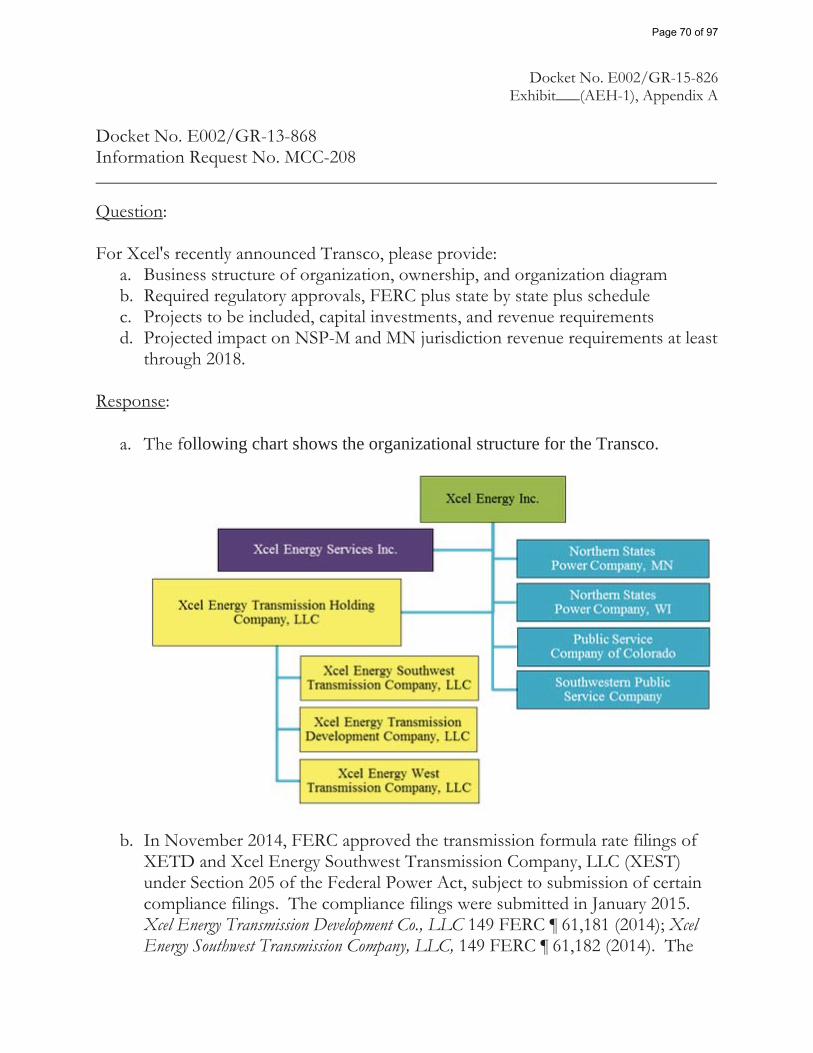
Docket No. E002/GR-15-826 Exhibit___(AEH-1), Appendix A
Docket No. E002/GR-13-868 Information Request No. MCC-208 __________________________________________________________________
Question:
For Xcel's recently announced Transco, please provide: a. Business structure of organization, ownership, and organization diagram b. Required regulatory approvals, FERC plus state by state plus schedule c. Projects to be included, capital investments, and revenue requirements d. Projected impact on NSP-M and MN jurisdiction revenue requirements at least
through 2018. Response:
a. The following chart shows the organizational structure for the Transco.
b. In November 2014, FERC approved the transmission formula rate filings of
XETD and Xcel Energy Southwest Transmission Company, LLC (XEST) under Section 205 of the Federal Power Act, subject to submission of certain compliance filings. The compliance filings were submitted in January 2015. Xcel Energy Transmission Development Co., LLC 149 FERC ¶ 61,181 (2014); Xcel Energy Southwest Transmission Company, LLC, 149 FERC ¶ 61,182 (2014). The
Page 70 of 97
Docket No. E002/GR-15-826 Exhibit___(AEH-1), Appendix A
XEST formula rate filing, to be included in the Southwest Power Pool, Inc. OATT, was set for settlement judge procedures after certain parties protested the filing, and remains in settlement judge procedures. The parties have reached a settlement in principle and expect to file a settlement before October 30, 2015. FERC also approved the FPA Section 204 financing filing submitted by XETD and XEST. Xcel Energy Southwest Transmission Company, LLC et al, 150 FERC ¶ 61,169 (2015). On September 22, 2015, FERC issued deficiency letters asserting the January 2015 XETD and XEST compliance filings describing the allocations of costs by Xcel Energy Services Inc. (XES) to XETD and XEST were deficient and requiring submission of additional information. On October 16, 2015, FERC granted extensions of time to submit the responses, and XETD and XEST will submit further compliance filings in November 2015. The XETD and XEST formula rate compliance filings are pending FERC action. In July, 2015, the Minnesota PUC issued an order approving the August 2014 affiliated interest agreement filing submitted by NSPM in Docket No. E002/AI-14-759. No other state filings have been submitted. No other state pre-approvals were required.
It is expected that Transco opportunities in the MISO region would be largely defined by the MISO Order No. 1000 competitive process tariff. Order No. 1000 was upheld on appeal by the D.C. Circuit Court of Appeals. The appeals of the MISO and SPP regional compliance filings are pending in the 7th Circuit Court of Appeals and D.C. Circuit Court of Appeals, respectively.
c. There are no Projects, and therefore neither capital investment nor revenue
requirements. The first proposed competitive project is a $17.5 million (SPP cost estimate) investment in SPP that is scheduled to be bid at the same time as the MN Electric Rate Case 15-826. The second proposed project is $58M (MISO cost estimate) investment in MISO that is scheduled to be bid in the first half of 2016.
d. Xcel Energy Inc.’s Transco initiative is not expected to have any impact on the
NSPM and State of Minnesota electric jurisdiction revenue requirements in the 2016 test year or years 2017 – 2018 of our current electric rate case.
2
Page 71 of 97
Docket No. E002/GR-15-826 Exhibit___(AEH-1), Appendix A
The Company proposed, and the MPUC approved, a “true-up” mechanism to address test year impacts of Transco activities in the affiliated interest filing in Docket No. E002/AI-14-759.
_________________________________________________________________ Preparer: Cheryl A. Bredenbeck Title: Director, Transmission Investment Development Department: Transmission Investment
3
Page 72 of 97
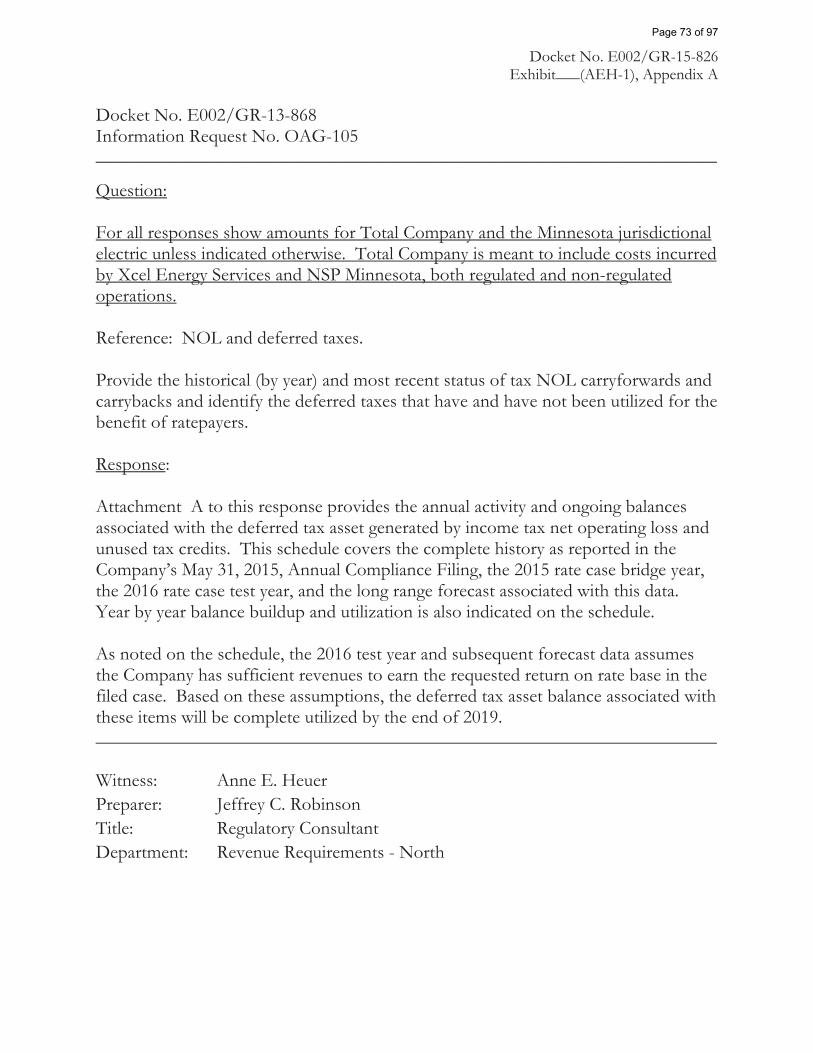
Docket No. E002/GR-15-826 Exhibit___(AEH-1), Appendix A
Docket No. E002/GR-13-868 Information Request No. OAG-105 __________________________________________________________________
Question: For all responses show amounts for Total Company and the Minnesota jurisdictional electric unless indicated otherwise. Total Company is meant to include costs incurred by Xcel Energy Services and NSP Minnesota, both regulated and non-regulated operations. Reference: NOL and deferred taxes. Provide the historical (by year) and most recent status of tax NOL carryforwards and carrybacks and identify the deferred taxes that have and have not been utilized for the benefit of ratepayers. Response: Attachment A to this response provides the annual activity and ongoing balances associated with the deferred tax asset generated by income tax net operating loss and unused tax credits. This schedule covers the complete history as reported in the Company’s May 31, 2015, Annual Compliance Filing, the 2015 rate case bridge year, the 2016 rate case test year, and the long range forecast associated with this data. Year by year balance buildup and utilization is also indicated on the schedule. As noted on the schedule, the 2016 test year and subsequent forecast data assumes the Company has sufficient revenues to earn the requested return on rate base in the filed case. Based on these assumptions, the deferred tax asset balance associated with these items will be complete utilized by the end of 2019. __________________________________________________________________ Witness: Anne E. Heuer Preparer: Jeffrey C. Robinson Title: Regulatory Consultant Department: Revenue Requirements - North
Page 73 of 97
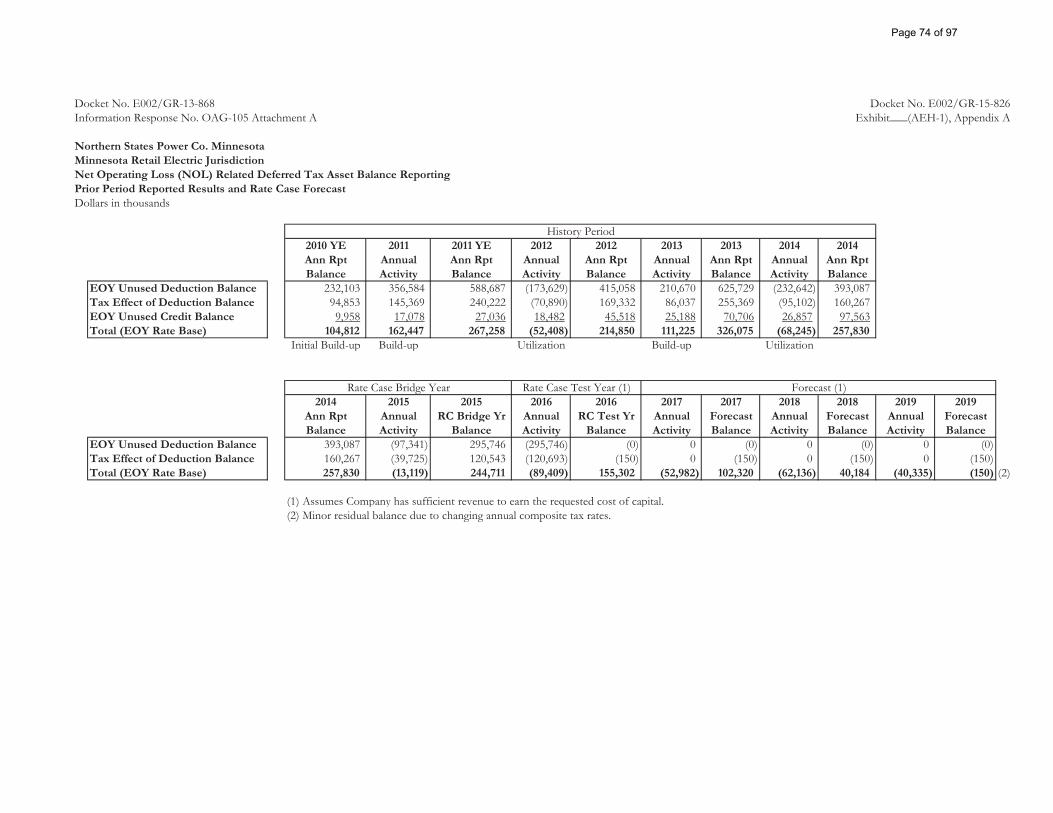
Docket No. E002/GR-13-868Information Response No. OAG-105 Attachment A
Northern States Power Co. MinnesotaMinnesota Retail Electric JurisdictionNet Operating Loss (NOL) Related Deferred Tax Asset Balance ReportingPrior Period Reported Results and Rate Case ForecastDollars in thousands
2010 YE 2011 2011 YE 2012 2012 2013 2013 2014 2014Ann Rpt Annual Ann Rpt Annual Ann Rpt Annual Ann Rpt Annual Ann RptBalance Activity Balance Activity Balance Activity Balance Activity Balance
EOY Unused Deduction Balance 232,103 356,584 588,687 (173,629) 415,058 210,670 625,729 (232,642) 393,087Tax Effect of Deduction Balance 94,853 145,369 240,222 (70,890) 169,332 86,037 255,369 (95,102) 160,267EOY Unused Credit Balance 9,958 17,078 27,036 18,482 45,518 25,188 70,706 26,857 97,563Total (EOY Rate Base) 104,812 162,447 267,258 (52,408) 214,850 111,225 326,075 (68,245) 257,830
Initial Build-up Build-up Utilization Build-up Utilization
2014 2015 2015 2016 2016 2017 2017 2018 2018 2019 2019Ann Rpt Annual RC Bridge Yr Annual RC Test Yr Annual Forecast Annual Forecast Annual ForecastBalance Activity Balance Activity Balance Activity Balance Activity Balance Activity Balance
EOY Unused Deduction Balance 393,087 (97,341) 295,746 (295,746) (0) 0 (0) 0 (0) 0 (0)Tax Effect of Deduction Balance 160,267 (39,725) 120,543 (120,693) (150) 0 (150) 0 (150) 0 (150)Total (EOY Rate Base) 257,830 (13,119) 244,711 (89,409) 155,302 (52,982) 102,320 (62,136) 40,184 (40,335) (150) (2)
(1) Assumes Company has sufficient revenue to earn the requested cost of capital.(2) Minor residual balance due to changing annual composite tax rates.
History Period
Rate Case Bridge Year Rate Case Test Year (1) Forecast (1)
Docket No. E002/GR-15-826Exhibit___(AEH-1), Appendix A
Page 74 of 97
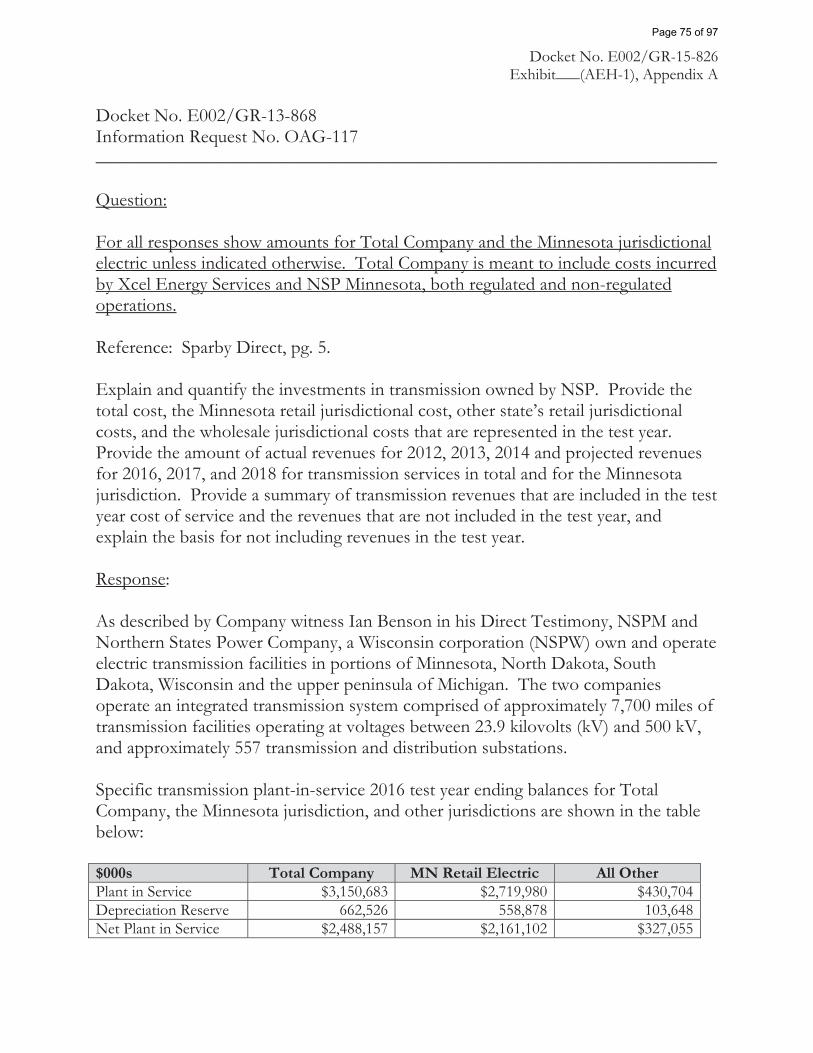
Docket No. E002/GR-15-826 Exhibit___(AEH-1), Appendix A
Docket No. E002/GR-13-868 Information Request No. OAG-117 __________________________________________________________________ Question: For all responses show amounts for Total Company and the Minnesota jurisdictional electric unless indicated otherwise. Total Company is meant to include costs incurred by Xcel Energy Services and NSP Minnesota, both regulated and non-regulated operations. Reference: Sparby Direct, pg. 5. Explain and quantify the investments in transmission owned by NSP. Provide the total cost, the Minnesota retail jurisdictional cost, other state’s retail jurisdictional costs, and the wholesale jurisdictional costs that are represented in the test year. Provide the amount of actual revenues for 2012, 2013, 2014 and projected revenues for 2016, 2017, and 2018 for transmission services in total and for the Minnesota jurisdiction. Provide a summary of transmission revenues that are included in the test year cost of service and the revenues that are not included in the test year, and explain the basis for not including revenues in the test year. Response: As described by Company witness Ian Benson in his Direct Testimony, NSPM and Northern States Power Company, a Wisconsin corporation (NSPW) own and operate electric transmission facilities in portions of Minnesota, North Dakota, South Dakota, Wisconsin and the upper peninsula of Michigan. The two companies operate an integrated transmission system comprised of approximately 7,700 miles of transmission facilities operating at voltages between 23.9 kilovolts (kV) and 500 kV, and approximately 557 transmission and distribution substations. Specific transmission plant-in-service 2016 test year ending balances for Total Company, the Minnesota jurisdiction, and other jurisdictions are shown in the table below: $000s Total Company MN Retail Electric All Other Plant in Service $3,150,683 $2,719,980 $430,704 Depreciation Reserve 662,526 558,878 103,648 Net Plant in Service $2,488,157 $2,161,102 $327,055
Page 75 of 97
Docket No. E002/GR-15-826 Exhibit___(AEH-1), Appendix A
The 2016 test year includes all revenues allocated to the State of Minnesota electric jurisdiction associated with base rate recovery. The total transmission revenues included in base rates for Minnesota Company in the 2016 test year are displayed in Attachment A to this response. The transmission revenues include revenue recovered from MISO for Schedule 1 (Scheduling, System Control and Dispatch Services), Schedule 2 (Reactive Supply and Voltage), Network Transmission and Transmission Expansion Plan Revenues. The revenues in the attachment are provided at a Minnesota Company level and allocated to all other state jurisdictions. The only transmission revenues not included in the test year are transmission revenues allocated to the North and South Dakota jurisdictions and those recovered through the rider. The transmission revenues in Attachment A also include all Interchange Agreement Transmission revenues. The Interchange Agreement revenues are also provided at a Minnesota Company level and allocated to all other state jurisdictions. Attachment A also includes actual revenues for 2012, 2013, 2014 and test year for 2016, 2017, 2018. ________________________________________________________________ Witness: Ian Benson Preparer: Shari Cardille/Jeff Hafner Title: Principal Rate Analyst/Senior Rate Analyst Department: Revenue Requirements/Revenue Requirements
2
Page 76 of 97
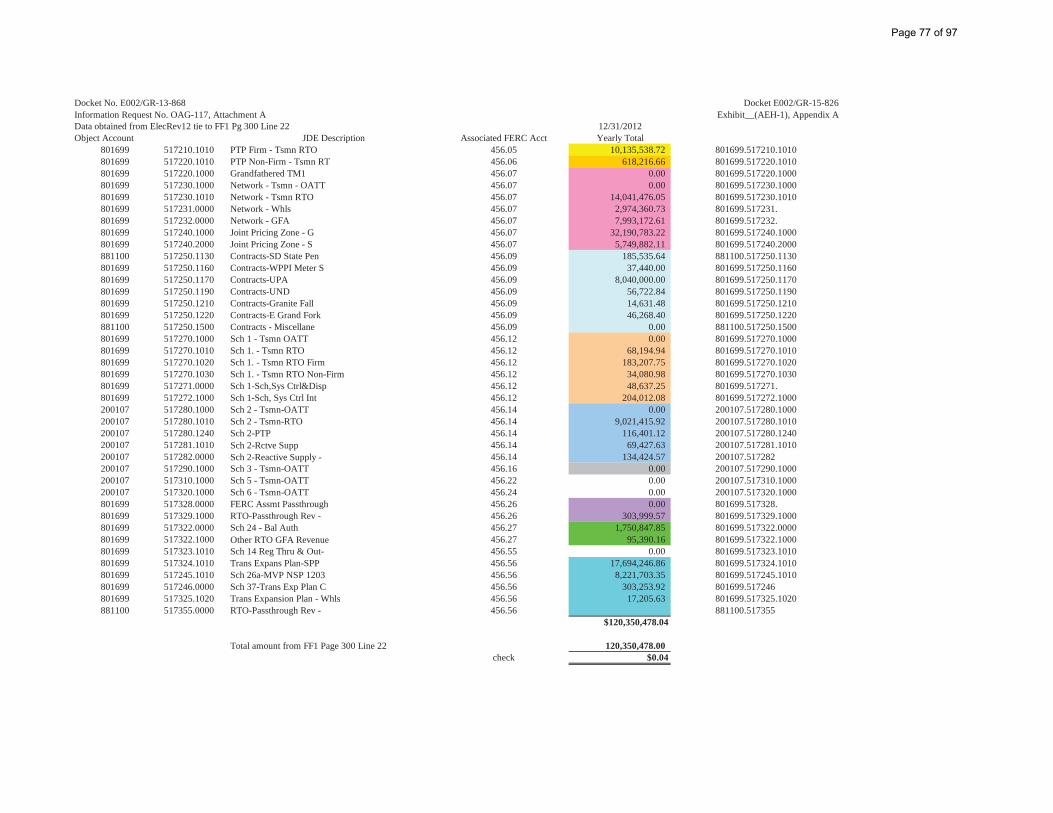
Docket No. E002/GR-13-868Information Request No. OAG-117, Attachment AData obtained from ElecRev12 tie to FF1 Pg 300 Line 22 12/31/2012Object Account JDE Description Associated FERC Acct Yearly Total
801699 517210.1010 PTP Firm - Tsmn RTO 456.05 10,135,538.72 1 801699.517210.1010801699 517220.1010 PTP Non-Firm - Tsmn RT 456.06 618,216.66 2 801699.517220.1010801699 517220.1000 Grandfathered TM1 456.07 0.00 3 801699.517220.1000801699 517230.1000 Network - Tsmn - OATT 456.07 0.00 3 801699.517230.1000801699 517230.1010 Network - Tsmn RTO 456.07 14,041,476.05 3 801699.517230.1010801699 517231.0000 Network - Whls 456.07 2,974,360.73 3 801699.517231.801699 517232.0000 Network - GFA 456.07 7,993,172.61 3 801699.517232.801699 517240.1000 Joint Pricing Zone - G 456.07 32,190,783.22 3 801699.517240.1000801699 517240.2000 Joint Pricing Zone - S 456.07 5,749,882.11 3 801699.517240.2000881100 517250.1130 Contracts-SD State Pen 456.09 185,535.64 4 881100.517250.1130801699 517250.1160 Contracts-WPPI Meter S 456.09 37,440.00 4 801699.517250.1160801699 517250.1170 Contracts-UPA 456.09 8,040,000.00 4 801699.517250.1170801699 517250.1190 Contracts-UND 456.09 56,722.84 4 801699.517250.1190801699 517250.1210 Contracts-Granite Fall 456.09 14,631.48 4 801699.517250.1210801699 517250.1220 Contracts-E Grand Fork 456.09 46,268.40 4 801699.517250.1220881100 517250.1500 Contracts - Miscellane 456.09 0.00 4 881100.517250.1500801699 517270.1000 Sch 1 - Tsmn OATT 456.12 0.00 5 801699.517270.1000801699 517270.1010 Sch 1. - Tsmn RTO 456.12 68,194.94 5 801699.517270.1010801699 517270.1020 Sch 1. - Tsmn RTO Firm 456.12 183,207.75 801699.517270.1020801699 517270.1030 Sch 1. - Tsmn RTO Non-Firm 456.12 34,080.98 801699.517270.1030801699 517271.0000 Sch 1-Sch,Sys Ctrl&Disp 456.12 48,637.25 5 801699.517271.801699 517272.1000 Sch 1-Sch, Sys Ctrl Int 456.12 204,012.08 5 801699.517272.1000200107 517280.1000 Sch 2 - Tsmn-OATT 456.14 0.00 6 200107.517280.1000200107 517280.1010 Sch 2 - Tsmn-RTO 456.14 9,021,415.92 6 200107.517280.1010200107 517280.1240 Sch 2-PTP 456.14 116,401.12 6 200107.517280.1240200107 517281.1010 Sch 2-Rctve Supp 456.14 69,427.63 6 200107.517281.1010200107 517282.0000 Sch 2-Reactive Supply - 456.14 134,424.57 6 200107.517282200107 517290.1000 Sch 3 - Tsmn-OATT 456.16 0.00 7 200107.517290.1000200107 517310.1000 Sch 5 - Tsmn-OATT 456.22 0.00 200107.517310.1000200107 517320.1000 Sch 6 - Tsmn-OATT 456.24 0.00 200107.517320.1000801699 517328.0000 FERC Assmt Passthrough 456.26 0.00 10 801699.517328.801699 517329.1000 RTO-Passthrough Rev - 456.26 303,999.57 10 801699.517329.1000801699 517322.0000 Sch 24 - Bal Auth 456.27 1,750,847.85 8 801699.517322.0000801699 517322.1000 Other RTO GFA Revenue 456.27 95,390.16 8 801699.517322.1000801699 517323.1010 Sch 14 Reg Thru & Out- 456.55 0.00 801699.517323.1010801699 517324.1010 Trans Expans Plan-SPP 456.56 17,694,246.86 9 801699.517324.1010801699 517245.1010 Sch 26a-MVP NSP 1203 456.56 8,221,703.35 801699.517245.1010801699 517246.0000 Sch 37-Trans Exp Plan C 456.56 303,253.92 9 801699.517246801699 517325.1020 Trans Expansion Plan - Whls 456.56 17,205.63 9 801699.517325.1020881100 517355.0000 RTO-Passthrough Rev - 456.56 9 881100.517355
$120,350,478.04
Total amount from FF1 Page 300 Line 22 120,350,478.00check $0.04
Docket E002/GR-15-826Exhibit__(AEH-1), Appendix A
Page 77 of 97
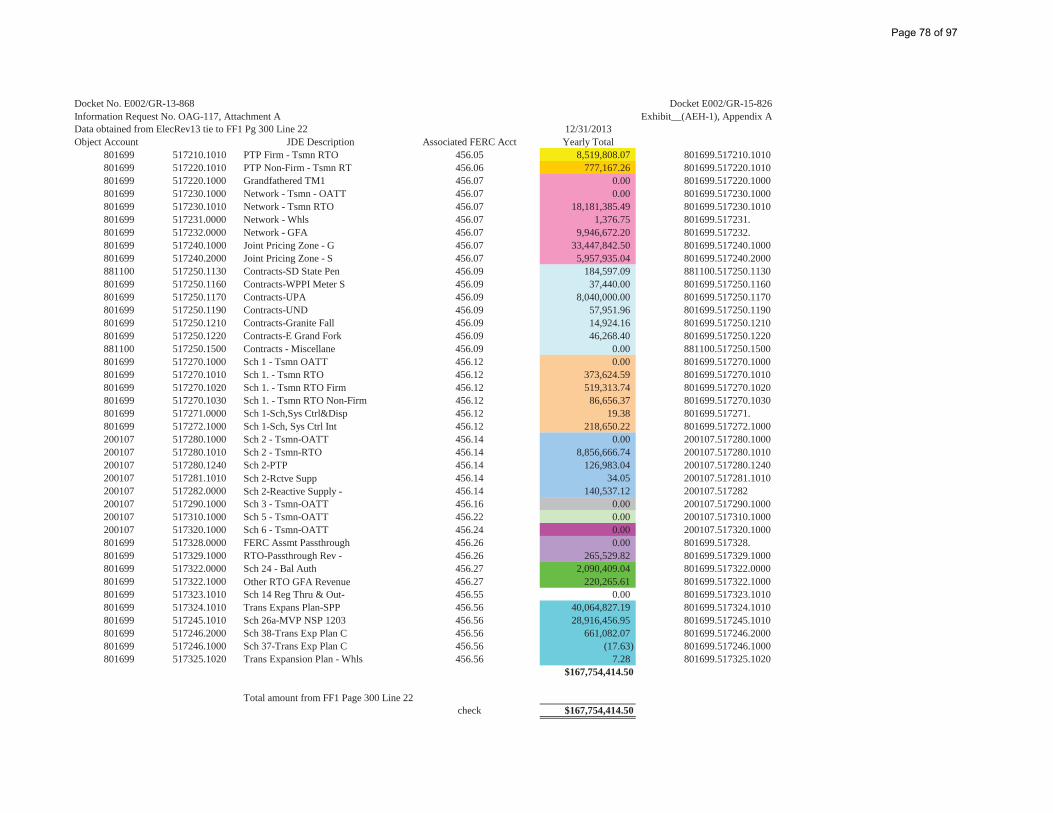
Docket No. E002/GR-13-868Information Request No. OAG-117, Attachment AData obtained from ElecRev13 tie to FF1 Pg 300 Line 22 12/31/2013Object Account JDE Description Associated FERC Acct Yearly Total
801699 517210.1010 PTP Firm - Tsmn RTO 456.05 8,519,808.07 1 801699.517210.1010801699 517220.1010 PTP Non-Firm - Tsmn RT 456.06 777,167.26 2 801699.517220.1010801699 517220.1000 Grandfathered TM1 456.07 0.00 3 801699.517220.1000801699 517230.1000 Network - Tsmn - OATT 456.07 0.00 3 801699.517230.1000801699 517230.1010 Network - Tsmn RTO 456.07 18,181,385.49 3 801699.517230.1010801699 517231.0000 Network - Whls 456.07 1,376.75 3 801699.517231.801699 517232.0000 Network - GFA 456.07 9,946,672.20 3 801699.517232.801699 517240.1000 Joint Pricing Zone - G 456.07 33,447,842.50 3 801699.517240.1000801699 517240.2000 Joint Pricing Zone - S 456.07 5,957,935.04 3 801699.517240.2000881100 517250.1130 Contracts-SD State Pen 456.09 184,597.09 4 881100.517250.1130801699 517250.1160 Contracts-WPPI Meter S 456.09 37,440.00 4 801699.517250.1160801699 517250.1170 Contracts-UPA 456.09 8,040,000.00 4 801699.517250.1170801699 517250.1190 Contracts-UND 456.09 57,951.96 4 801699.517250.1190801699 517250.1210 Contracts-Granite Fall 456.09 14,924.16 4 801699.517250.1210801699 517250.1220 Contracts-E Grand Fork 456.09 46,268.40 4 801699.517250.1220881100 517250.1500 Contracts - Miscellane 456.09 0.00 4 881100.517250.1500801699 517270.1000 Sch 1 - Tsmn OATT 456.12 0.00 5 801699.517270.1000801699 517270.1010 Sch 1. - Tsmn RTO 456.12 373,624.59 5 801699.517270.1010801699 517270.1020 Sch 1. - Tsmn RTO Firm 456.12 519,313.74 801699.517270.1020801699 517270.1030 Sch 1. - Tsmn RTO Non-Firm 456.12 86,656.37 801699.517270.1030801699 517271.0000 Sch 1-Sch,Sys Ctrl&Disp 456.12 19.38 5 801699.517271.801699 517272.1000 Sch 1-Sch, Sys Ctrl Int 456.12 218,650.22 5 801699.517272.1000200107 517280.1000 Sch 2 - Tsmn-OATT 456.14 0.00 6 200107.517280.1000200107 517280.1010 Sch 2 - Tsmn-RTO 456.14 8,856,666.74 6 200107.517280.1010200107 517280.1240 Sch 2-PTP 456.14 126,983.04 6 200107.517280.1240200107 517281.1010 Sch 2-Rctve Supp 456.14 34.05 6 200107.517281.1010200107 517282.0000 Sch 2-Reactive Supply - 456.14 140,537.12 6 200107.517282200107 517290.1000 Sch 3 - Tsmn-OATT 456.16 0.00 7 200107.517290.1000200107 517310.1000 Sch 5 - Tsmn-OATT 456.22 0.00 200107.517310.1000200107 517320.1000 Sch 6 - Tsmn-OATT 456.24 0.00 200107.517320.1000801699 517328.0000 FERC Assmt Passthrough 456.26 0.00 10 801699.517328.801699 517329.1000 RTO-Passthrough Rev - 456.26 265,529.82 10 801699.517329.1000801699 517322.0000 Sch 24 - Bal Auth 456.27 2,090,409.04 8 801699.517322.0000801699 517322.1000 Other RTO GFA Revenue 456.27 220,265.61 8 801699.517322.1000801699 517323.1010 Sch 14 Reg Thru & Out- 456.55 0.00 801699.517323.1010801699 517324.1010 Trans Expans Plan-SPP 456.56 40,064,827.19 9 801699.517324.1010801699 517245.1010 Sch 26a-MVP NSP 1203 456.56 28,916,456.95 801699.517245.1010801699 517246.2000 Sch 38-Trans Exp Plan C 456.56 661,082.07 9 801699.517246.2000801699 517246.1000 Sch 37-Trans Exp Plan C 456.56 (17.63) 801699.517246.1000801699 517325.1020 Trans Expansion Plan - Whls 456.56 7.28 9 801699.517325.1020
$167,754,414.50
Total amount from FF1 Page 300 Line 22check $167,754,414.50
Docket E002/GR-15-826Exhibit__(AEH-1), Appendix A
Page 78 of 97
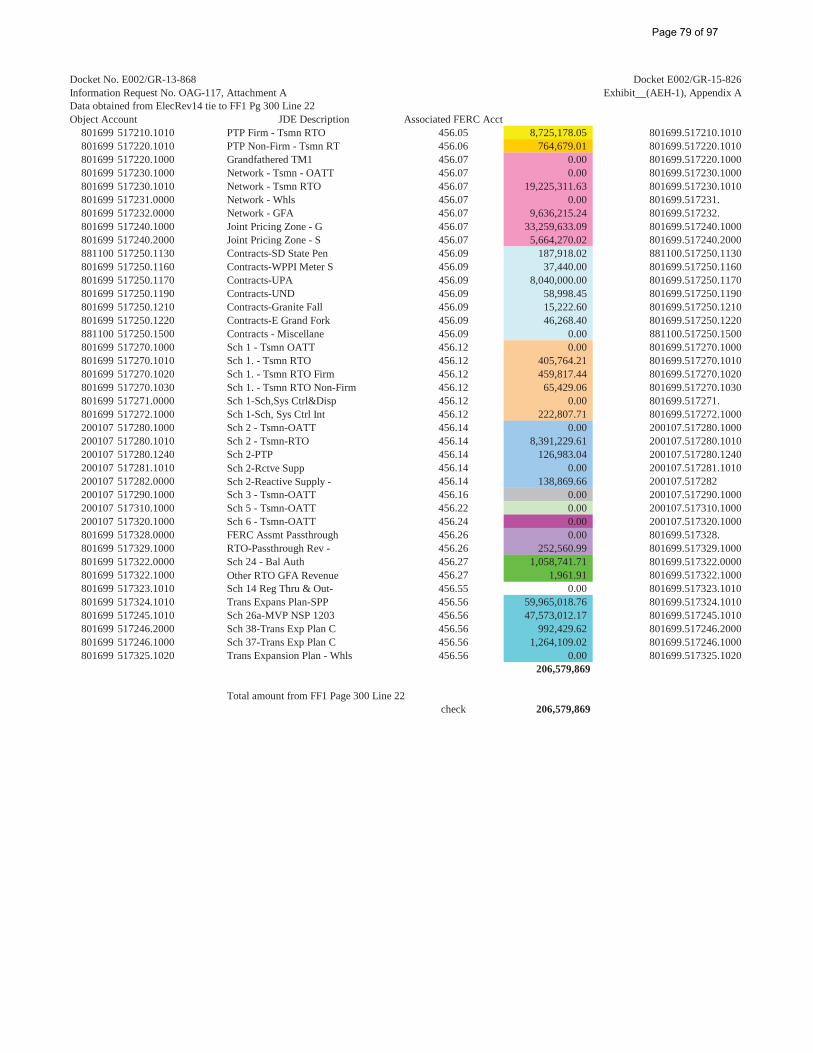
Docket No. E002/GR-13-868Information Request No. OAG-117, Attachment AData obtained from ElecRev14 tie to FF1 Pg 300 Line 22Object Account JDE Description Associated FERC Acct
801699 517210.1010 PTP Firm - Tsmn RTO 456.05 8,725,178.05 801699.517210.1010801699 517220.1010 PTP Non-Firm - Tsmn RT 456.06 764,679.01 801699.517220.1010801699 517220.1000 Grandfathered TM1 456.07 0.00 801699.517220.1000801699 517230.1000 Network - Tsmn - OATT 456.07 0.00 801699.517230.1000801699 517230.1010 Network - Tsmn RTO 456.07 19,225,311.63 801699.517230.1010801699 517231.0000 Network - Whls 456.07 0.00 801699.517231.801699 517232.0000 Network - GFA 456.07 9,636,215.24 801699.517232.801699 517240.1000 Joint Pricing Zone - G 456.07 33,259,633.09 801699.517240.1000801699 517240.2000 Joint Pricing Zone - S 456.07 5,664,270.02 801699.517240.2000881100 517250.1130 Contracts-SD State Pen 456.09 187,918.02 881100.517250.1130801699 517250.1160 Contracts-WPPI Meter S 456.09 37,440.00 801699.517250.1160801699 517250.1170 Contracts-UPA 456.09 8,040,000.00 801699.517250.1170801699 517250.1190 Contracts-UND 456.09 58,998.45 801699.517250.1190801699 517250.1210 Contracts-Granite Fall 456.09 15,222.60 801699.517250.1210801699 517250.1220 Contracts-E Grand Fork 456.09 46,268.40 801699.517250.1220881100 517250.1500 Contracts - Miscellane 456.09 0.00 881100.517250.1500801699 517270.1000 Sch 1 - Tsmn OATT 456.12 0.00 801699.517270.1000801699 517270.1010 Sch 1. - Tsmn RTO 456.12 405,764.21 801699.517270.1010801699 517270.1020 Sch 1. - Tsmn RTO Firm 456.12 459,817.44 801699.517270.1020801699 517270.1030 Sch 1. - Tsmn RTO Non-Firm 456.12 65,429.06 801699.517270.1030801699 517271.0000 Sch 1-Sch,Sys Ctrl&Disp 456.12 0.00 801699.517271.801699 517272.1000 Sch 1-Sch, Sys Ctrl Int 456.12 222,807.71 801699.517272.1000200107 517280.1000 Sch 2 - Tsmn-OATT 456.14 0.00 200107.517280.1000200107 517280.1010 Sch 2 - Tsmn-RTO 456.14 8,391,229.61 200107.517280.1010200107 517280.1240 Sch 2-PTP 456.14 126,983.04 200107.517280.1240200107 517281.1010 Sch 2-Rctve Supp 456.14 0.00 200107.517281.1010200107 517282.0000 Sch 2-Reactive Supply - 456.14 138,869.66 200107.517282200107 517290.1000 Sch 3 - Tsmn-OATT 456.16 0.00 200107.517290.1000200107 517310.1000 Sch 5 - Tsmn-OATT 456.22 0.00 200107.517310.1000200107 517320.1000 Sch 6 - Tsmn-OATT 456.24 0.00 200107.517320.1000801699 517328.0000 FERC Assmt Passthrough 456.26 0.00 801699.517328.801699 517329.1000 RTO-Passthrough Rev - 456.26 252,560.99 801699.517329.1000801699 517322.0000 Sch 24 - Bal Auth 456.27 1,058,741.71 801699.517322.0000801699 517322.1000 Other RTO GFA Revenue 456.27 1,961.91 801699.517322.1000801699 517323.1010 Sch 14 Reg Thru & Out- 456.55 0.00 801699.517323.1010801699 517324.1010 Trans Expans Plan-SPP 456.56 59,965,018.76 801699.517324.1010801699 517245.1010 Sch 26a-MVP NSP 1203 456.56 47,573,012.17 801699.517245.1010801699 517246.2000 Sch 38-Trans Exp Plan C 456.56 992,429.62 801699.517246.2000801699 517246.1000 Sch 37-Trans Exp Plan C 456.56 1,264,109.02 801699.517246.1000801699 517325.1020 Trans Expansion Plan - Whls 456.56 0.00 801699.517325.1020
206,579,869
Total amount from FF1 Page 300 Line 22check 206,579,869
Docket E002/GR-15-826Exhibit__(AEH-1), Appendix A
Page 79 of 97
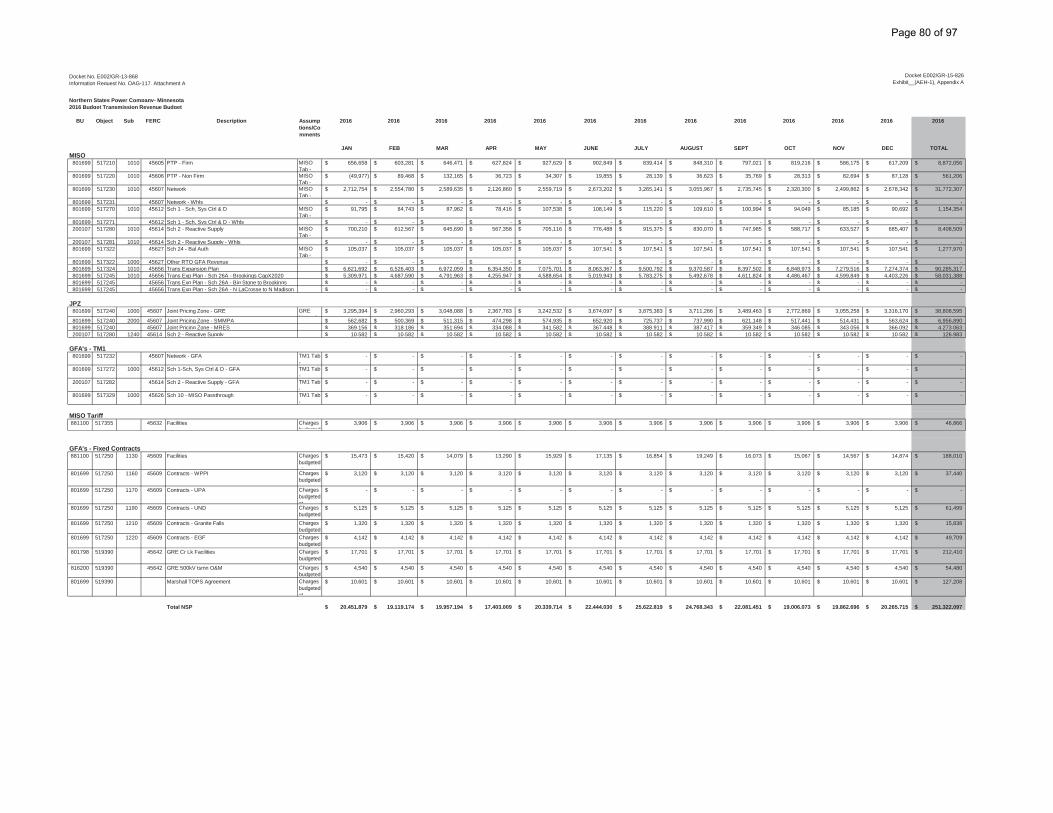
Docket No. E002/GR-13-868Information Request No. OAG-117, Attachment A
Northern States Power Company- Minnesota2016 Budget Transmission Revenue Budget
BU Object Sub FERC Description Assumptions/Comments
2016 2016 2016 2016 2016 2016 2016 2016 2016 2016 2016 2016 2016
JAN FEB MAR APR MAY JUNE JULY AUGUST SEPT OCT NOV DEC TOTALMISO
801699 517210 1010 45605 PTP - Firm MISO Tab -
656,658$ 603,281$ 646,471$ 627,824$ 927,629$ 902,849$ 839,414$ 848,310$ 797,021$ 819,216$ 586,175$ 617,209$ 8,872,056$
801699 517220 1010 45606 PTP - Non Firm MISO Tab -
(49,977)$ 89,468$ 132,165$ 36,723$ 34,307$ 19,855$ 28,139$ 36,623$ 35,769$ 28,313$ 82,694$ 87,128$ 561,206$
801699 517230 1010 45607 Network MISO Tab -
2,712,754$ 2,554,780$ 2,589,635$ 2,126,860$ 2,559,719$ 2,673,202$ 3,265,141$ 3,055,967$ 2,735,745$ 2,320,300$ 2,499,862$ 2,678,342$ 31,772,307$
801699 517231 45607 Network - Whls -$ -$ -$ -$ -$ -$ -$ -$ -$ -$ -$ -$ -$801699 517270 1010 45612 Sch 1 - Sch, Sys Ctrl & D MISO
Tab - 91,795$ 84,743$ 87,962$ 78,416$ 107,538$ 108,149$ 115,220$ 109,610$ 100,994$ 94,049$ 85,185$ 90,692$ 1,154,354$
801699 517271 45612 Sch 1 - Sch, Sys Ctrl & D - Whls -$ -$ -$ -$ -$ -$ -$ -$ -$ -$ -$ -$ -$200107 517280 1010 45614 Sch 2 - Reactive Supply MISO
Tab -700,210$ 612,567$ 645,690$ 567,358$ 705,116$ 776,488$ 915,375$ 830,070$ 747,985$ 588,717$ 633,527$ 685,407$ 8,408,509$
200107 517281 1010 45614 Sch 2 - Reactive Supply - Whls -$ -$ -$ -$ -$ -$ -$ -$ -$ -$ -$ -$ -$801699 517322 45627 Sch 24 - Bal Auth MISO
Tab - 105,037$ 105,037$ 105,037$ 105,037$ 105,037$ 107,541$ 107,541$ 107,541$ 107,541$ 107,541$ 107,541$ 107,541$ 1,277,970$
801699 517322 1000 45627 Other RTO GFA Revenue -$ -$ -$ -$ -$ -$ -$ -$ -$ -$ -$ -$ -$801699 517324 1010 45656 Trans Expansion Plan 6,621,692$ 6,526,403$ 6,972,059$ 6,354,350$ 7,075,701$ 8,063,367$ 9,500,792$ 9,370,587$ 8,397,502$ 6,848,973$ 7,279,516$ 7,274,374$ 90,285,317$801699 517245 1010 45656 Trans Exp Plan - Sch 26A - Brookings CapX2020 5,309,971$ 4,687,590$ 4,791,963$ 4,255,947$ 4,588,654$ 5,019,943$ 5,783,275$ 5,492,678$ 4,611,824$ 4,486,467$ 4,599,849$ 4,403,226$ 58,031,388$801699 517245 45656 Trans Exp Plan - Sch 26A - Big Stone to Brookings -$ -$ -$ -$ -$ -$ -$ -$ -$ -$ -$ -$ -$801699 517245 45656 Trans Exp Plan - Sch 26A - N LaCrosse to N Madison -$ -$ -$ -$ -$ -$ -$ -$ -$ -$ -$ -$ -$
JPZ801699 517240 1000 45607 Joint Pricing Zone - GRE GRE
N t k3,295,394$ 2,960,293$ 3,048,088$ 2,367,783$ 3,242,532$ 3,674,097$ 3,875,383$ 3,711,266$ 3,489,463$ 2,772,869$ 3,055,258$ 3,316,170$ 38,808,595$
801699 517240 2000 45607 Joint Pricing Zone - SMMPA 562,682$ 500,369$ 511,315$ 474,298$ 574,935$ 652,920$ 725,737$ 737,990$ 621,148$ 517,441$ 514,431$ 563,624$ 6,956,890$801699 517240 45607 Joint Pricing Zone - MRES 369,156$ 318,186$ 351,694$ 334,088$ 341,582$ 367,448$ 388,911$ 387,417$ 359,349$ 346,085$ 343,056$ 366,092$ 4,273,063$200107 517280 1240 45614 Sch 2 - Reactive Supply 10,582$ 10,582$ 10,582$ 10,582$ 10,582$ 10,582$ 10,582$ 10,582$ 10,582$ 10,582$ 10,582$ 10,582$ 126,983$
GFA's - TM1801699 517232 45607 Network - GFA TM1 Tab
- -$ -$ -$ -$ -$ -$ -$ -$ -$ -$ -$ -$ -$
801699 517272 1000 45612 Sch 1-Sch, Sys Ctrl & D - GFA TM1 Tab -
-$ -$ -$ -$ -$ -$ -$ -$ -$ -$ -$ -$ -$
200107 517282 45614 Sch 2 - Reactive Supply - GFA TM1 Tab -
-$ -$ -$ -$ -$ -$ -$ -$ -$ -$ -$ -$ -$
801699 517329 1000 45626 Sch 10 - MISO Passthrough TM1 Tab -
-$ -$ -$ -$ -$ -$ -$ -$ -$ -$ -$ -$ -$
MISO Tariff881100 517355 45632 Facilities Charges
budgeted3,906$ 3,906$ 3,906$ 3,906$ 3,906$ 3,906$ 3,906$ 3,906$ 3,906$ 3,906$ 3,906$ 3,906$ 46,866$
GFA's - Fixed Contracts881100 517250 1130 45609 Facilities Charges
budgeted at
15,473$ 15,420$ 14,079$ 13,290$ 15,929$ 17,135$ 16,854$ 19,249$ 16,073$ 15,067$ 14,567$ 14,874$ 188,010$
801699 517250 1160 45609 Contracts - WPPI Charges budgeted t
3,120$ 3,120$ 3,120$ 3,120$ 3,120$ 3,120$ 3,120$ 3,120$ 3,120$ 3,120$ 3,120$ 3,120$ 37,440$
801699 517250 1170 45609 Contracts - UPA Charges budgeted at
-$ -$ -$ -$ -$ -$ -$ -$ -$ -$ -$ -$ -$
801699 517250 1190 45609 Contracts - UND Charges budgeted
5,125$ 5,125$ 5,125$ 5,125$ 5,125$ 5,125$ 5,125$ 5,125$ 5,125$ 5,125$ 5,125$ 5,125$ 61,499$
801699 517250 1210 45609 Contracts - Granite Falls Charges budgeted
1,320$ 1,320$ 1,320$ 1,320$ 1,320$ 1,320$ 1,320$ 1,320$ 1,320$ 1,320$ 1,320$ 1,320$ 15,838$
801699 517250 1220 45609 Contracts - EGF Charges budgeted
4,142$ 4,142$ 4,142$ 4,142$ 4,142$ 4,142$ 4,142$ 4,142$ 4,142$ 4,142$ 4,142$ 4,142$ 49,709$
801798 519390 45642 GRE Cr Lk Facilities Charges budgeted
17,701$ 17,701$ 17,701$ 17,701$ 17,701$ 17,701$ 17,701$ 17,701$ 17,701$ 17,701$ 17,701$ 17,701$ 212,410$
816200 519390 45642 GRE 500kV tsmn O&M Charges budgeted
4,540$ 4,540$ 4,540$ 4,540$ 4,540$ 4,540$ 4,540$ 4,540$ 4,540$ 4,540$ 4,540$ 4,540$ 54,480$
801699 519390 Marshall TOPS Agreement Charges budgeted at
10,601$ 10,601$ 10,601$ 10,601$ 10,601$ 10,601$ 10,601$ 10,601$ 10,601$ 10,601$ 10,601$ 10,601$ 127,208$
Total NSP 20,451,879$ 19,119,174$ 19,957,194$ 17,403,009$ 20,339,714$ 22,444,030$ 25,622,819$ 24,768,343$ 22,081,451$ 19,006,073$ 19,862,696$ 20,265,715$ 251,322,097$
Docket E002/GR-15-826Exhibit__(AEH-1), Appendix A
Page 80 of 97
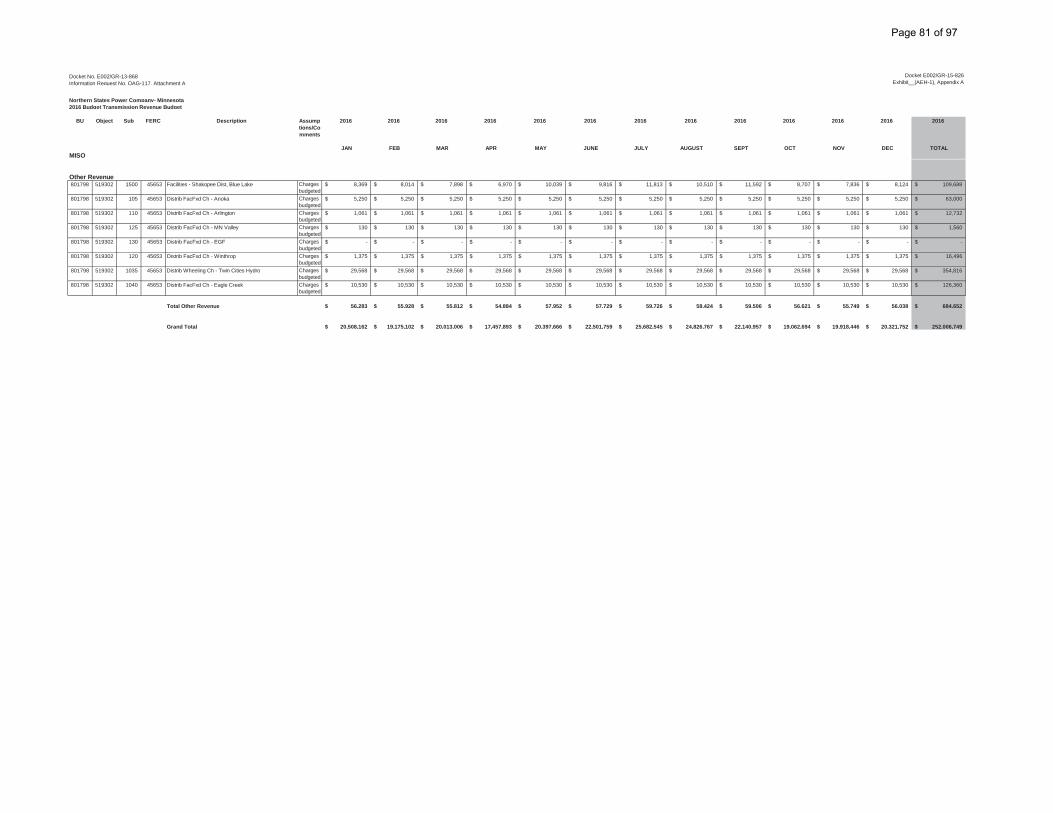
Docket No. E002/GR-13-868Information Request No. OAG-117, Attachment A
Northern States Power Company- Minnesota2016 Budget Transmission Revenue Budget
BU Object Sub FERC Description Assumptions/Comments
2016 2016 2016 2016 2016 2016 2016 2016 2016 2016 2016 2016 2016
JAN FEB MAR APR MAY JUNE JULY AUGUST SEPT OCT NOV DEC TOTALMISO
Docket E002/GR-15-826Exhibit__(AEH-1), Appendix A
Other Revenue801798 519302 1500 45653 Facilities - Shakopee Dist, Blue Lake Charges
budgeted 8,369$ 8,014$ 7,898$ 6,970$ 10,039$ 9,816$ 11,813$ 10,510$ 11,592$ 8,707$ 7,836$ 8,124$ 109,688$
801798 519302 105 45653 Distrib FacFxd Ch - Anoka Charges budgeted
5,250$ 5,250$ 5,250$ 5,250$ 5,250$ 5,250$ 5,250$ 5,250$ 5,250$ 5,250$ 5,250$ 5,250$ 63,000$
801798 519302 110 45653 Distrib FacFxd Ch - Arlington Charges budgeted
1,061$ 1,061$ 1,061$ 1,061$ 1,061$ 1,061$ 1,061$ 1,061$ 1,061$ 1,061$ 1,061$ 1,061$ 12,732$
801798 519302 125 45653 Distrib FacFxd Ch - MN Valley Charges budgeted
130$ 130$ 130$ 130$ 130$ 130$ 130$ 130$ 130$ 130$ 130$ 130$ 1,560$
801798 519302 130 45653 Distrib FacFxd Ch - EGF Charges budgeted
-$ -$ -$ -$ -$ -$ -$ -$ -$ -$ -$ -$ -$
801798 519302 120 45653 Distrib FacFxd Ch - Winthrop Charges budgeted
1,375$ 1,375$ 1,375$ 1,375$ 1,375$ 1,375$ 1,375$ 1,375$ 1,375$ 1,375$ 1,375$ 1,375$ 16,496$
801798 519302 1035 45653 Distrib Wheeling Ch - Twin Cities Hydro Charges budgeted
29,568$ 29,568$ 29,568$ 29,568$ 29,568$ 29,568$ 29,568$ 29,568$ 29,568$ 29,568$ 29,568$ 29,568$ 354,816$
801798 519302 1040 45653 Distrib FacFxd Ch - Eagle Creek Charges budgeted
10,530$ 10,530$ 10,530$ 10,530$ 10,530$ 10,530$ 10,530$ 10,530$ 10,530$ 10,530$ 10,530$ 10,530$ 126,360$
Total Other Revenue 56,283$ 55,928$ 55,812$ 54,884$ 57,952$ 57,729$ 59,726$ 58,424$ 59,506$ 56,621$ 55,749$ 56,038$ 684,652$
Grand Total 20,508,162$ 19,175,102$ 20,013,006$ 17,457,893$ 20,397,666$ 22,501,759$ 25,682,545$ 24,826,767$ 22,140,957$ 19,062,694$ 19,918,446$ 20,321,752$ 252,006,749$
Page 81 of 97
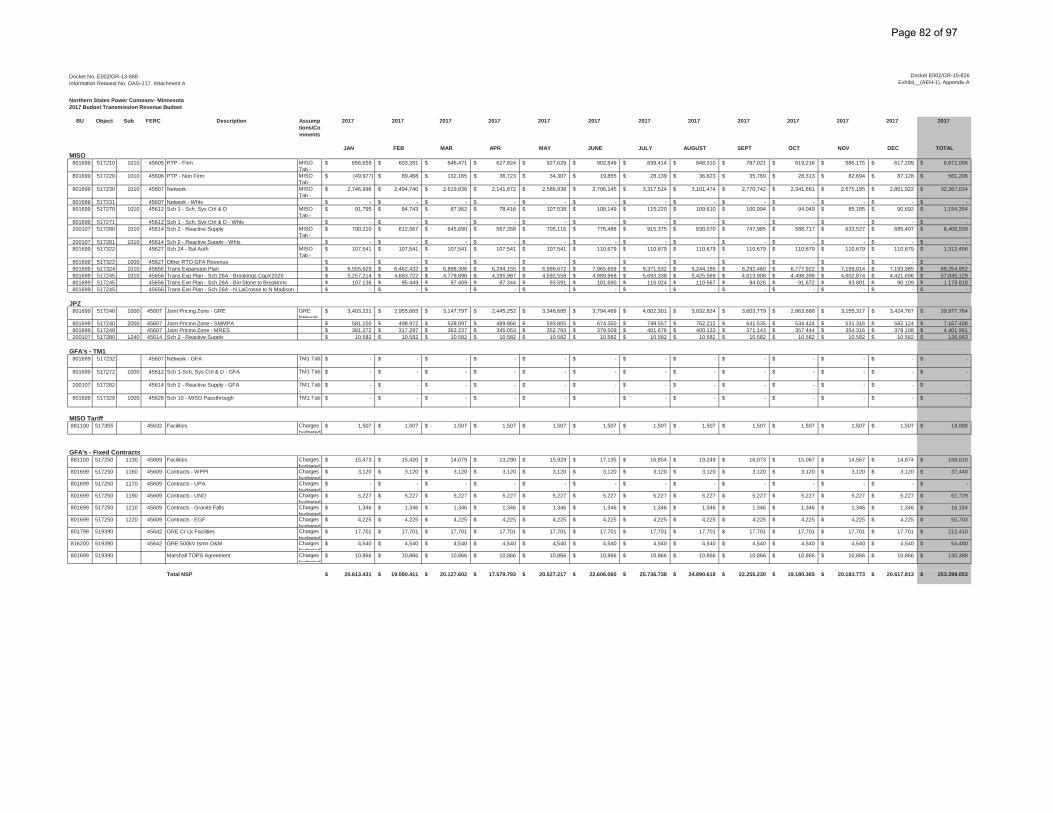
Docket No. E002/GR-13-868Information Request No. OAG-117, Attachment A
Northern States Power Company- Minnesota2017 Budget Transmission Revenue Budget
BU Object Sub FERC Description Assumptions/Comments
2017 2017 2017 2017 2017 2017 2017 2017 2017 2017 2017 2017 2017
JAN FEB MAR APR MAY JUNE JULY AUGUST SEPT OCT NOV DEC TOTALMISO
801699 517210 1010 45605 PTP - Firm MISO Tab -
656,658$ 603,281$ 646,471$ 627,824$ 927,629$ 902,849$ 839,414$ 848,310$ 797,021$ 819,216$ 586,175$ 617,209$ 8,872,056$
801699 517220 1010 45606 PTP - Non Firm MISO Tab -
(49,977)$ 89,468$ 132,165$ 36,723$ 34,307$ 19,855$ 28,139$ 36,623$ 35,769$ 28,313$ 82,694$ 87,128$ 561,206$
801699 517230 1010 45607 Network MISO Tab -
2,746,996$ 2,494,740$ 2,619,836$ 2,141,872$ 2,588,938$ 2,706,145$ 3,317,514$ 3,101,474$ 2,770,742$ 2,341,661$ 2,675,195$ 2,861,922$ 32,367,034$
801699 517231 45607 Network - Whls -$ -$ -$ -$ -$ -$ -$ -$ -$ -$ -$ -$ -$801699 517270 1010 45612 Sch 1 - Sch, Sys Ctrl & D MISO
Tab - 91,795$ 84,743$ 87,962$ 78,416$ 107,538$ 108,149$ 115,220$ 109,610$ 100,994$ 94,049$ 85,185$ 90,692$ 1,154,354$
801699 517271 45612 Sch 1 - Sch, Sys Ctrl & D - Whls -$ -$ -$ -$ -$ -$ -$ -$ -$ -$ -$ -$ -$200107 517280 1010 45614 Sch 2 - Reactive Supply MISO
Tab -700,210$ 612,567$ 645,690$ 567,358$ 705,116$ 776,488$ 915,375$ 830,070$ 747,985$ 588,717$ 633,527$ 685,407$ 8,408,509$
200107 517281 1010 45614 Sch 2 - Reactive Supply - Whls -$ -$ -$ -$ -$ -$ -$ -$ -$ -$ -$ -$ -$801699 517322 45627 Sch 24 - Bal Auth MISO
Tab - 107,541$ 107,541$ 107,541$ 107,541$ 107,541$ 110,679$ 110,679$ 110,679$ 110,679$ 110,679$ 110,679$ 110,679$ 1,312,456$
801699 517322 1000 45627 Other RTO GFA Revenue -$ -$ -$ -$ -$ -$ -$ -$ -$ -$ -$ -$ -$801699 517324 1010 45656 Trans Expansion Plan 6,555,629$ 6,462,432$ 6,898,306$ 6,294,155$ 6,999,672$ 7,965,659$ 9,371,532$ 9,244,185$ 8,292,460$ 6,777,922$ 7,199,014$ 7,193,985$ 89,254,952$801699 517245 1010 45656 Trans Exp Plan - Sch 26A - Brookings CapX2020 5,257,214$ 4,683,722$ 4,779,896$ 4,285,987$ 4,592,558$ 4,989,968$ 5,693,338$ 5,425,569$ 4,613,908$ 4,498,398$ 4,602,874$ 4,421,696$ 57,845,129$801699 517245 45656 Trans Exp Plan - Sch 26A - Big Stone to Brookings 107,136$ 95,449$ 97,409$ 87,344$ 93,591$ 101,690$ 116,024$ 110,567$ 94,026$ 91,672$ 93,801$ 90,109$ 1,178,818$801699 517245 45656 Trans Exp Plan - Sch 26A - N LaCrosse to N Madison -$ -$ -$ -$ -$ -$ -$ -$ -$ -$ -$ -$ -$
JPZ801699 517240 1000 45607 Joint Pricing Zone - GRE GRE
Network3,403,221$ 2,955,665$ 3,147,797$ 2,445,252$ 3,348,685$ 3,794,469$ 4,002,301$ 3,832,824$ 3,603,779$ 2,863,688$ 3,155,317$ 3,424,767$ 39,977,764$
801699 517240 2000 45607 Joint Pricing Zone - SMMPA 581,150$ 498,972$ 528,097$ 489,866$ 593,805$ 674,350$ 749,557$ 762,212$ 641,535$ 534,424$ 531,316$ 582,124$ 7,167,408$801699 517240 45607 Joint Pricing Zone - MRES 381,272$ 317,297$ 363,237$ 345,053$ 352,793$ 379,509$ 401,676$ 400,133$ 371,143$ 357,444$ 354,316$ 378,108$ 4,401,981$200107 517280 1240 45614 Sch 2 - Reactive Supply 10,582$ 10,582$ 10,582$ 10,582$ 10,582$ 10,582$ 10,582$ 10,582$ 10,582$ 10,582$ 10,582$ 10,582$ 126,983$
GFA's - TM1801699 517232 45607 Network - GFA TM1 Tab
- -$ -$ -$ -$ -$ -$ -$ -$ -$ -$ -$ -$ -$
801699 517272 1000 45612 Sch 1-Sch, Sys Ctrl & D - GFA TM1 Tab -
-$ -$ -$ -$ -$ -$ -$ -$ -$ -$ -$ -$ -$
200107 517282 45614 Sch 2 - Reactive Supply - GFA TM1 Tab -
-$ -$ -$ -$ -$ -$ -$ -$ -$ -$ -$ -$ -$
801699 517329 1000 45626 Sch 10 - MISO Passthrough TM1 Tab -
-$ -$ -$ -$ -$ -$ -$ -$ -$ -$ -$ -$ -$
MISO Tariff881100 517355 45632 Facilities Charges
budgeted1,507$ 1,507$ 1,507$ 1,507$ 1,507$ 1,507$ 1,507$ 1,507$ 1,507$ 1,507$ 1,507$ 1,507$ 18,088$
GFA's - Fixed Contracts881100 517250 1130 45609 Facilities Charges
budgeted15,473$ 15,420$ 14,079$ 13,290$ 15,929$ 17,135$ 16,854$ 19,249$ 16,073$ 15,067$ 14,567$ 14,874$ 188,010$
801699 517250 1160 45609 Contracts - WPPI Charges budgeted
3,120$ 3,120$ 3,120$ 3,120$ 3,120$ 3,120$ 3,120$ 3,120$ 3,120$ 3,120$ 3,120$ 3,120$ 37,440$
801699 517250 1170 45609 Contracts - UPA Charges budgeted
-$ -$ -$ -$ -$ -$ -$ -$ -$ -$ -$ -$ -$
801699 517250 1190 45609 Contracts - UND Charges budgeted
5,227$ 5,227$ 5,227$ 5,227$ 5,227$ 5,227$ 5,227$ 5,227$ 5,227$ 5,227$ 5,227$ 5,227$ 62,729$
801699 517250 1210 45609 Contracts - Granite Falls Charges budgeted
1,346$ 1,346$ 1,346$ 1,346$ 1,346$ 1,346$ 1,346$ 1,346$ 1,346$ 1,346$ 1,346$ 1,346$ 16,154$
801699 517250 1220 45609 Contracts - EGF Charges budgeted
4,225$ 4,225$ 4,225$ 4,225$ 4,225$ 4,225$ 4,225$ 4,225$ 4,225$ 4,225$ 4,225$ 4,225$ 50,703$
801798 519390 45642 GRE Cr Lk Facilities Charges budgeted
17,701$ 17,701$ 17,701$ 17,701$ 17,701$ 17,701$ 17,701$ 17,701$ 17,701$ 17,701$ 17,701$ 17,701$ 212,410$
816200 519390 45642 GRE 500kV tsmn O&M Charges budgeted
4,540$ 4,540$ 4,540$ 4,540$ 4,540$ 4,540$ 4,540$ 4,540$ 4,540$ 4,540$ 4,540$ 4,540$ 54,480$
801699 519390 Marshall TOPS Agreement Charges budgeted
10,866$ 10,866$ 10,866$ 10,866$ 10,866$ 10,866$ 10,866$ 10,866$ 10,866$ 10,866$ 10,866$ 10,866$ 130,388$
Total NSP 20,613,431$ 19,080,411$ 20,127,602$ 17,579,793$ 20,527,217$ 22,606,060$ 25,736,738$ 24,890,618$ 22,255,230$ 19,180,365$ 20,183,773$ 20,617,813$ 253,399,053$
Docket E002/GR-15-826Exhibit__(AEH-1), Appendix A
Page 82 of 97

Docket No. E002/GR-13-868Information Request No. OAG-117, Attachment A
Northern States Power Company- Minnesota2017 Budget Transmission Revenue Budget
BU Object Sub FERC Description Assumptions/Comments
2017 2017 2017 2017 2017 2017 2017 2017 2017 2017 2017 2017 2017
JAN FEB MAR APR MAY JUNE JULY AUGUST SEPT OCT NOV DEC TOTALMISO
Docket E002/GR-15-826Exhibit__(AEH-1), Appendix A
Other Revenue801798 519302 1500 45653 Facilities - Shakopee Dist, Blue Lake Charges
budgeted8,796$ 8,782$ 8,084$ 8,631$ 7,392$ 9,202$ 12,936$ 13,615$ 11,666$ 8,654$ 7,876$ 8,268$ 113,902$
801798 519302 105 45653 Distrib FacFxd Ch - Anoka Charges budgeted
5,250$ 5,250$ 5,250$ 5,250$ 5,250$ 5,250$ 5,250$ 5,250$ 5,250$ 5,250$ 5,250$ 5,250$ 63,000$
801798 519302 110 45653 Distrib FacFxd Ch - Arlington Charges budgeted
1,082$ 1,082$ 1,082$ 1,082$ 1,082$ 1,082$ 1,082$ 1,082$ 1,082$ 1,082$ 1,082$ 1,082$ 12,986$
801798 519302 125 45653 Distrib FacFxd Ch - MN Valley Charges budgeted
130$ 130$ 130$ 130$ 130$ 130$ 130$ 130$ 130$ 130$ 130$ 130$ 1,560$
801798 519302 130 45653 Distrib FacFxd Ch - EGF Charges budgeted
-$ -$ -$ -$ -$ -$ -$ -$ -$ -$ -$ -$ -$
801798 519302 120 45653 Distrib FacFxd Ch - Winthrop Charges budgeted
1,375$ 1,375$ 1,375$ 1,375$ 1,375$ 1,375$ 1,375$ 1,375$ 1,375$ 1,375$ 1,375$ 1,375$ 16,500$
801798 519302 1035 45653 Distrib Wheeling Ch - Twin Cities Hydro Charges budgeted
29,568$ 29,568$ 29,568$ 29,568$ 29,568$ 29,568$ 29,568$ 29,568$ 29,568$ 29,568$ 29,568$ 29,568$ 354,816$
801798 519302 1040 45653 Distrib FacFxd Ch - Eagle Creek Charges budgeted
10,530$ 10,530$ 10,530$ 10,530$ 10,530$ 10,530$ 10,530$ 10,530$ 10,530$ 10,530$ 10,530$ 10,530$ 126,360$
Total Other Revenue 56,731$ 56,717$ 56,019$ 56,567$ 55,327$ 57,137$ 60,871$ 61,550$ 59,601$ 56,589$ 55,811$ 56,203$ 689,124$
Grand Total 20,670,162$ 19,137,128$ 20,183,621$ 17,636,360$ 20,582,544$ 22,663,198$ 25,797,609$ 24,952,168$ 22,314,831$ 19,236,955$ 20,239,584$ 20,674,017$ 254,088,177$
Page 83 of 97
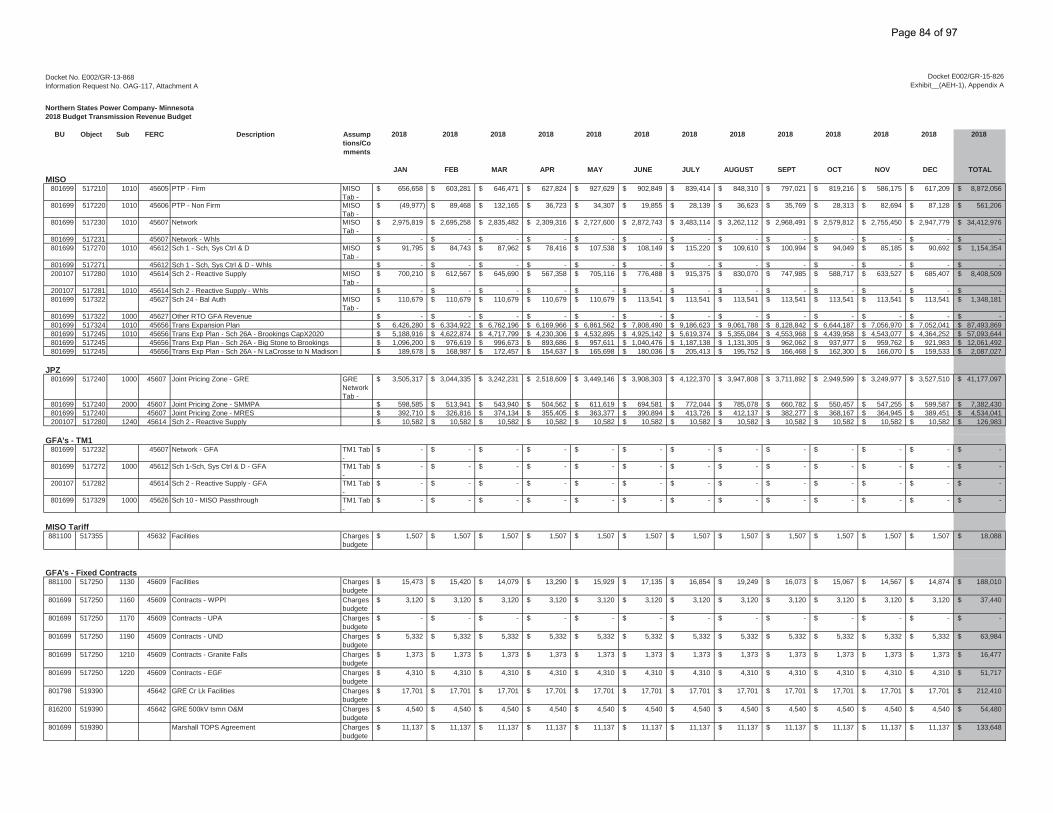
Docket No. E002/GR-13-868Information Request No. OAG-117, Attachment A
Northern States Power Company- Minnesota2018 Budget Transmission Revenue Budget
BU Object Sub FERC Description Assumptions/Comments
2018 2018 2018 2018 2018 2018 2018 2018 2018 2018 2018 2018 2018
JAN FEB MAR APR MAY JUNE JULY AUGUST SEPT OCT NOV DEC TOTALMISO
801699 517210 1010 45605 PTP - Firm MISO Tab -
656,658$ 603,281$ 646,471$ 627,824$ 927,629$ 902,849$ 839,414$ 848,310$ 797,021$ 819,216$ 586,175$ 617,209$ 8,872,056$
801699 517220 1010 45606 PTP - Non Firm MISO Tab -
(49,977)$ 89,468$ 132,165$ 36,723$ 34,307$ 19,855$ 28,139$ 36,623$ 35,769$ 28,313$ 82,694$ 87,128$ 561,206$
801699 517230 1010 45607 Network MISO Tab -
2,975,819$ 2,695,258$ 2,835,482$ 2,309,316$ 2,727,600$ 2,872,743$ 3,483,114$ 3,262,112$ 2,968,491$ 2,579,812$ 2,755,450$ 2,947,779$ 34,412,976$
801699 517231 45607 Network - Whls -$ -$ -$ -$ -$ -$ -$ -$ -$ -$ -$ -$ -$801699 517270 1010 45612 Sch 1 - Sch, Sys Ctrl & D MISO
Tab - 91,795$ 84,743$ 87,962$ 78,416$ 107,538$ 108,149$ 115,220$ 109,610$ 100,994$ 94,049$ 85,185$ 90,692$ 1,154,354$
801699 517271 45612 Sch 1 - Sch, Sys Ctrl & D - Whls -$ -$ -$ -$ -$ -$ -$ -$ -$ -$ -$ -$ -$200107 517280 1010 45614 Sch 2 - Reactive Supply MISO
Tab -700,210$ 612,567$ 645,690$ 567,358$ 705,116$ 776,488$ 915,375$ 830,070$ 747,985$ 588,717$ 633,527$ 685,407$ 8,408,509$
200107 517281 1010 45614 Sch 2 - Reactive Supply - Whls -$ -$ -$ -$ -$ -$ -$ -$ -$ -$ -$ -$ -$801699 517322 45627 Sch 24 - Bal Auth MISO
Tab - 110,679$ 110,679$ 110,679$ 110,679$ 110,679$ 113,541$ 113,541$ 113,541$ 113,541$ 113,541$ 113,541$ 113,541$ 1,348,181$
801699 517322 1000 45627 Other RTO GFA Revenue -$ -$ -$ -$ -$ -$ -$ -$ -$ -$ -$ -$ -$801699 517324 1010 45656 Trans Expansion Plan 6,426,280$ 6,334,922$ 6,762,196$ 6,169,966$ 6,861,562$ 7,808,490$ 9,186,623$ 9,061,788$ 8,128,842$ 6,644,187$ 7,056,970$ 7,052,041$ 87,493,869$801699 517245 1010 45656 Trans Exp Plan - Sch 26A - Brookings CapX2020 5,188,916$ 4,622,874$ 4,717,799$ 4,230,306$ 4,532,895$ 4,925,142$ 5,619,374$ 5,355,084$ 4,553,968$ 4,439,958$ 4,543,077$ 4,364,252$ 57,093,644$801699 517245 45656 Trans Exp Plan - Sch 26A - Big Stone to Brookings 1,096,200$ 976,619$ 996,673$ 893,686$ 957,611$ 1,040,476$ 1,187,138$ 1,131,305$ 962,062$ 937,977$ 959,762$ 921,983$ 12,061,492$801699 517245 45656 Trans Exp Plan - Sch 26A - N LaCrosse to N Madison 189,678$ 168,987$ 172,457$ 154,637$ 165,698$ 180,036$ 205,413$ 195,752$ 166,468$ 162,300$ 166,070$ 159,533$ 2,087,027$
JPZ801699 517240 1000 45607 Joint Pricing Zone - GRE GRE
Network Tab -
3,505,317$ 3,044,335$ 3,242,231$ 2,518,609$ 3,449,146$ 3,908,303$ 4,122,370$ 3,947,808$ 3,711,892$ 2,949,599$ 3,249,977$ 3,527,510$ 41,177,097$
801699 517240 2000 45607 Joint Pricing Zone - SMMPA 598,585$ 513,941$ 543,940$ 504,562$ 611,619$ 694,581$ 772,044$ 785,078$ 660,782$ 550,457$ 547,255$ 599,587$ 7,382,430$801699 517240 45607 Joint Pricing Zone - MRES 392,710$ 326,816$ 374,134$ 355,405$ 363,377$ 390,894$ 413,726$ 412,137$ 382,277$ 368,167$ 364,945$ 389,451$ 4,534,041$200107 517280 1240 45614 Sch 2 - Reactive Supply 10,582$ 10,582$ 10,582$ 10,582$ 10,582$ 10,582$ 10,582$ 10,582$ 10,582$ 10,582$ 10,582$ 10,582$ 126,983$
GFA's - TM1801699 517232 45607 Network - GFA TM1 Tab
--$ -$ -$ -$ -$ -$ -$ -$ -$ -$ -$ -$ -$
801699 517272 1000 45612 Sch 1-Sch, Sys Ctrl & D - GFA TM1 Tab -
-$ -$ -$ -$ -$ -$ -$ -$ -$ -$ -$ -$ -$
200107 517282 45614 Sch 2 - Reactive Supply - GFA TM1 Tab -
-$ -$ -$ -$ -$ -$ -$ -$ -$ -$ -$ -$ -$
801699 517329 1000 45626 Sch 10 - MISO Passthrough TM1 Tab -
-$ -$ -$ -$ -$ -$ -$ -$ -$ -$ -$ -$ -$
MISO Tariff881100 517355 45632 Facilities Charges
budgete1,507$ 1,507$ 1,507$ 1,507$ 1,507$ 1,507$ 1,507$ 1,507$ 1,507$ 1,507$ 1,507$ 1,507$ 18,088$
GFA's - Fixed Contracts881100 517250 1130 45609 Facilities Charges
budgete15,473$ 15,420$ 14,079$ 13,290$ 15,929$ 17,135$ 16,854$ 19,249$ 16,073$ 15,067$ 14,567$ 14,874$ 188,010$
801699 517250 1160 45609 Contracts - WPPI Charges budgete
3,120$ 3,120$ 3,120$ 3,120$ 3,120$ 3,120$ 3,120$ 3,120$ 3,120$ 3,120$ 3,120$ 3,120$ 37,440$
801699 517250 1170 45609 Contracts - UPA Charges budgete
-$ -$ -$ -$ -$ -$ -$ -$ -$ -$ -$ -$ -$
801699 517250 1190 45609 Contracts - UND Charges budgete
5,332$ 5,332$ 5,332$ 5,332$ 5,332$ 5,332$ 5,332$ 5,332$ 5,332$ 5,332$ 5,332$ 5,332$ 63,984$
801699 517250 1210 45609 Contracts - Granite Falls Charges budgete
1,373$ 1,373$ 1,373$ 1,373$ 1,373$ 1,373$ 1,373$ 1,373$ 1,373$ 1,373$ 1,373$ 1,373$ 16,477$
801699 517250 1220 45609 Contracts - EGF Charges budgete
4,310$ 4,310$ 4,310$ 4,310$ 4,310$ 4,310$ 4,310$ 4,310$ 4,310$ 4,310$ 4,310$ 4,310$ 51,717$
801798 519390 45642 GRE Cr Lk Facilities Charges budgete
17,701$ 17,701$ 17,701$ 17,701$ 17,701$ 17,701$ 17,701$ 17,701$ 17,701$ 17,701$ 17,701$ 17,701$ 212,410$
816200 519390 45642 GRE 500kV tsmn O&M Charges budgete
4,540$ 4,540$ 4,540$ 4,540$ 4,540$ 4,540$ 4,540$ 4,540$ 4,540$ 4,540$ 4,540$ 4,540$ 54,480$
801699 519390 Marshall TOPS Agreement Charges budgete
11,137$ 11,137$ 11,137$ 11,137$ 11,137$ 11,137$ 11,137$ 11,137$ 11,137$ 11,137$ 11,137$ 11,137$ 133,648$
Docket E002/GR-15-826Exhibit__(AEH-1), Appendix A
Page 84 of 97
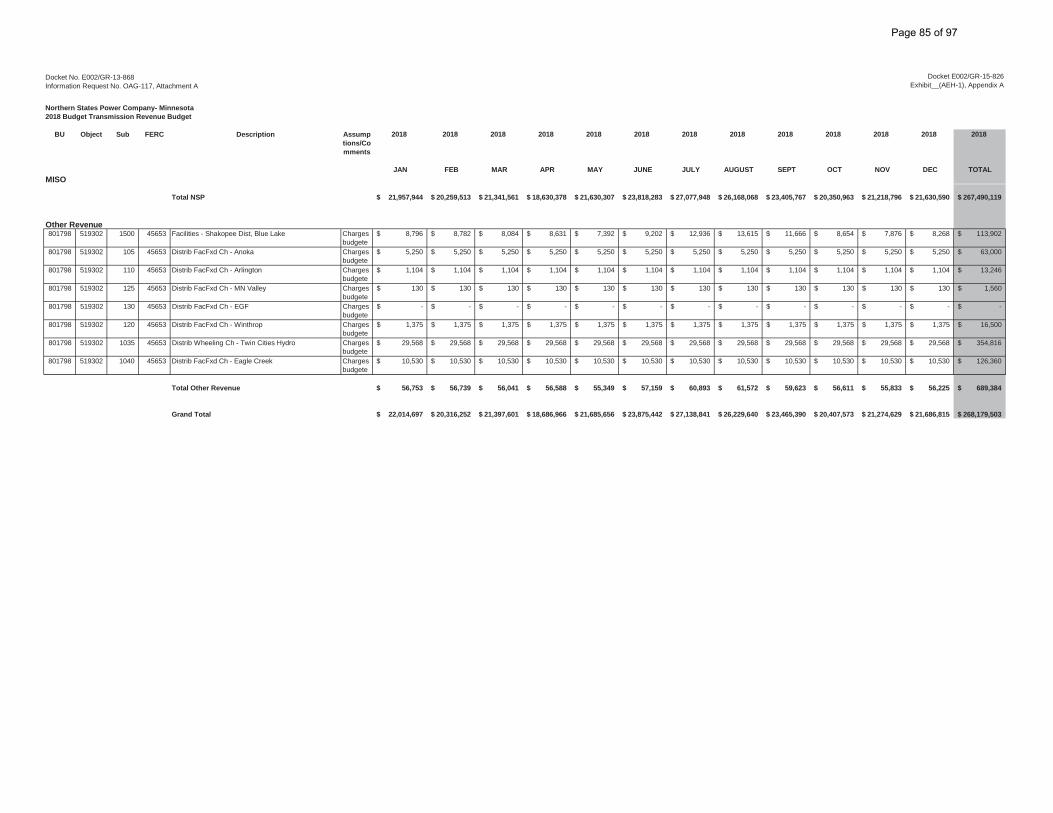
Docket No. E002/GR-13-868Information Request No. OAG-117, Attachment A
Northern States Power Company- Minnesota2018 Budget Transmission Revenue Budget
BU Object Sub FERC Description Assumptions/Comments
2018 2018 2018 2018 2018 2018 2018 2018 2018 2018 2018 2018 2018
JAN FEB MAR APR MAY JUNE JULY AUGUST SEPT OCT NOV DEC TOTALMISO
Docket E002/GR-15-826Exhibit__(AEH-1), Appendix A
Total NSP 21,957,944$ 20,259,513$ 21,341,561$ 18,630,378$ 21,630,307$ 23,818,283$ 27,077,948$ 26,168,068$ 23,405,767$ 20,350,963$ 21,218,796$ 21,630,590$ 267,490,119$
Other Revenue801798 519302 1500 45653 Facilities - Shakopee Dist, Blue Lake Charges
budgete8,796$ 8,782$ 8,084$ 8,631$ 7,392$ 9,202$ 12,936$ 13,615$ 11,666$ 8,654$ 7,876$ 8,268$ 113,902$
801798 519302 105 45653 Distrib FacFxd Ch - Anoka Charges budgete
5,250$ 5,250$ 5,250$ 5,250$ 5,250$ 5,250$ 5,250$ 5,250$ 5,250$ 5,250$ 5,250$ 5,250$ 63,000$
801798 519302 110 45653 Distrib FacFxd Ch - Arlington Charges budgete
1,104$ 1,104$ 1,104$ 1,104$ 1,104$ 1,104$ 1,104$ 1,104$ 1,104$ 1,104$ 1,104$ 1,104$ 13,246$
801798 519302 125 45653 Distrib FacFxd Ch - MN Valley Charges budgete
130$ 130$ 130$ 130$ 130$ 130$ 130$ 130$ 130$ 130$ 130$ 130$ 1,560$
801798 519302 130 45653 Distrib FacFxd Ch - EGF Charges budgete
-$ -$ -$ -$ -$ -$ -$ -$ -$ -$ -$ -$ -$
801798 519302 120 45653 Distrib FacFxd Ch - Winthrop Charges budgete
1,375$ 1,375$ 1,375$ 1,375$ 1,375$ 1,375$ 1,375$ 1,375$ 1,375$ 1,375$ 1,375$ 1,375$ 16,500$
801798 519302 1035 45653 Distrib Wheeling Ch - Twin Cities Hydro Charges budgete
29,568$ 29,568$ 29,568$ 29,568$ 29,568$ 29,568$ 29,568$ 29,568$ 29,568$ 29,568$ 29,568$ 29,568$ 354,816$
801798 519302 1040 45653 Distrib FacFxd Ch - Eagle Creek Charges budgete
10,530$ 10,530$ 10,530$ 10,530$ 10,530$ 10,530$ 10,530$ 10,530$ 10,530$ 10,530$ 10,530$ 10,530$ 126,360$
Total Other Revenue 56,753$ 56,739$ 56,041$ 56,588$ 55,349$ 57,159$ 60,893$ 61,572$ 59,623$ 56,611$ 55,833$ 56,225$ 689,384$
Grand Total 22,014,697$ 20,316,252$ 21,397,601$ 18,686,966$ 21,685,656$ 23,875,442$ 27,138,841$ 26,229,640$ 23,465,390$ 20,407,573$ 21,274,629$ 21,686,815$ 268,179,503$
Page 85 of 97

Docket No. E002/GR-13-868Information Request No. OAG-117, Attachment A
Total Company and Minnesota State Transmission Revenues
12/31/2012 12/31/2013 12/31/2014 12/31/2016 12/31/2017 12/31/2018 12/31/2012 12/31/2013 12/31/2014 12/31/2016 12/31/2017 12/31/2018Object Account JDE Description Associated FERC Acct Yearly Total Yearly Total Yearly Total 2016 Budget 2017 Budget 2018 Budget Yearly Total Yearly Total Yearly Total 2016 Budget 2017 Budget 2018 Budget
801699 517210.1010 PTP Firm - Tsmn RTO 456.05 10,135,538.72 8,519,808.07 8,725,178.05 8,872,055.53 8,872,055.53 8,872,055.53 8,929,713.68 7,473,217.81 7,637,008.74 7,749,394.50 7,749,394.50 7,749,394.50801699 517220.1010 PTP Non-Firm - Tsmn RT 456.06 618,216.66 777,167.26 764,679.01 561,205.73 561,205.73 561,205.73 544,667.42 681,698.48 669,311.30 490,191.32 490,191.32 490,191.32801699 517220.1000 Grandfathered TM1 456.07 0.00 0.00 0.00 0.00 0.00 0.00 0.00 0.00 0.00 0.00 0.00 0.00801699 517230.1000 Network - Tsmn - OATT 456.07 0.00 0.00 0.00 0.00 0.00 0.00 0.00 0.00 0.00 0.00 0.00 0.00801699 517230.1010 Network - Tsmn RTO 456.07 14,041,476.05 18,181,385.49 19,225,311.63 31,772,306.79 32,367,034.21 34,412,976.04 12,370,961.64 15,947,947.73 16,827,607.66 27,751,870.86 28,271,342.07 30,058,392.46801699 517231.0000 Network - Whls 456.07 2,974,360.73 1,376.75 0.00 0.00 0.00 0.00 2,620,501.03 1,207.63 0.00 0.00 0.00 0.00801699 517232.0000 Network - GFA 456.07 7,993,172.61 9,946,672.20 9,636,215.24 0.00 0.00 0.00 7,042,224.86 8,724,803.09 8,434,425.02 0.00 0.00 0.00801699 517240.1000 Joint Pricing Zone - G 456.07 32,190,783.22 33,447,842.50 33,259,633.09 38,808,594.90 39,977,764.49 41,177,097.42 28,361,045.74 29,339,042.63 29,111,624.69 33,897,794.11 34,919,018.15 35,966,588.69801699 517240.2000 Joint Pricing Zone - S 456.07 5,749,882.11 5,957,935.04 5,664,270.02 6,956,890.01 7,167,408.05 7,382,430.29 5,065,818.64 5,226,050.38 4,957,844.92 6,076,572.10 6,260,451.40 6,448,264.94801699 517240.0000 Joint Pricing Zone - M 456.07 0.00 0.00 0.00 4,273,063.13 4,401,981.20 4,534,040.64 0.00 0.00 0.00 3,732,353.99 3,844,958.90 3,960,307.67881100 517250.1130 Contracts-SD State Pen 456.09 185,535.64 184,597.09 187,918.02 188,009.54 188,009.54 188,009.54 163,462.46 161,920.81 164,481.64 164,219.00 164,219.00 164,219.00801699 517250.1160 Contracts-WPPI Meter S 456.09 37,440.00 37,440.00 37,440.00 37,440.00 37,440.00 37,440.00 32,985.76 32,840.80 32,770.63 32,702.38 32,702.38 32,702.38801699 517250.1170 Contracts-UPA 456.09 8,040,000.00 8,040,000.00 8,040,000.00 0.00 0.00 0.00 7,083,481.20 7,052,350.32 7,037,283.36 0.00 0.00 0.00801699 517250.1190 Contracts-UND 456.09 56,722.84 57,951.96 58,998.45 61,499.08 62,729.07 63,983.65 49,974.52 50,833.03 51,640.40 53,717.05 54,791.39 55,887.22801699 517250.1210 Contracts-Granite Fall 456.09 14,631.48 14,924.16 15,222.60 15,837.60 16,154.40 16,477.44 12,890.77 13,090.85 13,324.10 13,833.53 14,110.24 14,392.40801699 517250.1220 Contracts-E Grand Fork 456.09 46,268.40 46,268.40 46,268.40 49,709.16 50,703.36 51,717.48 40,763.85 40,584.70 40,497.99 43,419.01 44,287.41 45,173.20801798 519390.0000 GRE Cr Lk Facilities 456.42 212,410.44 212,410.44 212,410.44 0.00 0.00 0.00 185,532.24 185,532.24 185,532.24816200 519390.0000 GRE 500kV tsmn O&M 456.42 54,480.00 54,480.00 54,480.00 0.00 0.00 0.00 47,586.16 47,586.16 47,586.16801699 519390.0000 Marshall TOPS Agreement 127,207.71 130,387.90 133,647.60 0.00 0.00 0.00 111,110.97 113,888.74 116,735.96881100 517250.1500 Contracts - Miscellane 456.09 0.00 0.00 0.00 0.00 0.00 0.00 0.00 0.00 0.00801699 517270.1000 Sch 1 - Tsmn OATT 456.12 0.00 0.00 0.00 0.00 0.00 0.00 0.00 0.00 0.00 0.00 0.00 0.00801699 517270.1010 Sch 1. - Tsmn RTO 456.12 68,194.94 373,624.59 405,764.21 1,154,354.29 1,154,354.29 1,154,354.29 60,081.79 327,727.80 355,158.92 1,008,283.46 1,008,283.46 1,008,283.46801699 517270.1020 Sch 1. - Tsmn RTO Firm 456.12 183,207.75 519,313.74 459,817.44 0.00 0.00 0.00 161,411.52 455,520.20 402,470.85 0.00 0.00 0.00801699 517270.1030 Sch 1. - Tsmn RTO Non-Firm 456.12 34,080.98 86,656.37 65,429.06 0.00 0.00 0.00 30,026.37 76,011.33 57,269.01 0.00 0.00 0.00801699 517271.0000 Sch 1-Sch,Sys Ctrl&Disp 456.12 48,637.25 19.38 0.00 0.00 0.00 0.00 42,850.88 17.00 0.00 0.00 0.00 0.00801699 517272.1000 Sch 1-Sch, Sys Ctrl Int 456.12 204,012.08 218,650.22 222,807.71 0.00 0.00 0.00 179,740.76 191,790.79 195,020.02 0.00 0.00 0.00200107 517280.1000 Sch 2 - Tsmn-OATT 456.14 0.00 0.00 0.00 0.00 0.00 0.00 0.00 0.00 0.00200107 517280.1010 Sch 2 - Tsmn-RTO 456.14 9,021,415.92 8,856,666.74 8,391,229.61 8,408,508.55 8,408,508.55 8,408,508.55 7,948,138.07 7,768,696.08 7,344,709.02 7,344,504.29 7,344,504.29 7,344,504.29200107 517280.1240 Sch 2-PTP 456.14 116,401.12 126,983.04 126,983.04 126,983.04 126,983.04 126,983.04 102,552.88 111,384.19 111,146.22 110,914.73 110,914.73 110,914.73200107 517281.1010 Sch 2-Rctve Supp 456.14 69,427.63 34.05 0.00 0.00 0.00 0.00 61,167.82 29.87 0.00 0.00 0.00 0.00200107 517282.0000 Sch 2-Reactive Supply - 456.14 134,424.57 140,537.12 138,869.66 0.00 0.00 0.00 118,432.08 123,273.26 121,550.39 0.00 0.00 0.00200107 517290.1000 Sch 3 - Tsmn-OATT 456.16 0.00 0.00 0.00 0.00 0.00 0.00 0.00 0.00 0.00 0.00 0.00 0.00200107 517310.1000 Sch 5 - Tsmn-OATT 456.22 0.00 0.00 0.00 0.00 0.00 0.00 0 0 0 0 0 0200107 517320.1000 Sch 6 - Tsmn-OATT 456.24 0.00 0.00 0.00 0.00 0.00 0.00 0 0 0 0 0 0801699 517328.0000 FERC Assmt Passthrough 456.26 0.00 0.00 0.00 0.00 0.00 0.00 0.00 0.00 0.00 0.00 0.00 0.00801699 517329.1000 RTO-Passthrough Rev - 456.26 303,999.57 265,529.82 252,560.99 0.00 0.00 0.00 267,832.74 232,911.61 221,062.59 0.00 0.00 0.00801699 517322.0000 Sch 24 - Bal Auth 456.27 1,750,847.85 2,090,409.04 1,058,741.71 1,277,969.67 1,312,456.33 1,348,180.83 1,542,549.48 1,833,619.01 926,699.68 1,116,256.66 1,146,379.42 1,177,583.38801699 517322.1000 Other RTO GFA Revenue 456.27 95,390.16 220,265.61 1,961.91 0.00 0.00 0.00 84,041.59 193,207.74 1,717.23 0.00 0.00 0.00801699 517323.1010 Sch 14 Reg Thru & Out- 456.55 0.00 0.00 0.00 0.00 0.00 0.00 0 0 0 0 0 0801699 517324.1010 Trans Expans Plan-SPP 456.56 17,694,246.86 40,064,827.19 59,965,018.76 90,285,317.12 89,254,952.00 87,493,869.00 15,589,162.31 35,143,183.69 52,486,421.48 78,860,703.38 77,960,719.63 76,422,482.31801699 517245.0000 Trans Exp Plan - Sch 26A - Bi 456.56 0.00 0.00 1,178,817.71 14,148,519.18 0.00 0.00 0.00 0.00 1,029,651.30 12,358,179.72801699 517245.1010 Sch 26a-MVP NSP 1203 456.56 8,221,703.35 28,916,456.95 47,573,012.17 58,031,388.43 57,845,128.83 57,093,644.19 7,243,567.30 25,364,301.55 41,639,896.38 50,688,154.57 50,525,464.08 49,869,071.55801699 517246.2000 Sch 38-Trans Exp Plan C 456.56 661,082.07 992,429.62 0.00 0.00 0.00 0.00 579,873.43 868,657.77 0.00 0.00 0.00801699 517246.1000 Sch 37-Trans Exp Plan C 456.56 303,253.92 (17.63) 1,264,109.02 0.00 0.00 0.00 267,175.80 (15.46) 1,106,454.40 0.00 0.00 0.00801699 517325.1020 Trans Expansion Plan - Whls 456.56 17,205.63 7.28 0.00 0.00 0.00 0.00 15,158.68 6.39 0.00 0.00 0.00 0.00881100 517355.0000 RTO-Passthrough Rev - 456.56 0.00 0.00 46,866.48 18,087.84 18,087.84 0.00 0.00 0.00 40,936.04 15,799.02 15,799.02
$120,350,478.04 $167,754,414.50 $206,579,869.42 $251,322,097.19 $253,399,052.52 $267,490,118.73 $106,032,381.67 $147,147,126.71 $180,816,054.43 $219,520,050.33 $221,334,189.81 $233,642,186.60
Total amount from FF1 Page 300 Line 22 120,350,478.00 167,754,415.00 206,579,869.00check $0.04 -$0.50 $0.42
Demand Allocation (MN State)2012 88.1030%2013 87.7158%2014 87.5284%
2016/2017/2018 87.3461%
Total Company MN State
Docket E002/GR-15-826Exhibit__(AEH-1), Appendix A
Page 86 of 97

Docket No. E002/GR-13-868Information Request No. OAG-117, Attachment A
Interchange Transmission RevenuesMN Company
2012 Act 2013 Act 2014 Act 2016 Bud 2017 Plan Year 2018 Plan YearInterchange Transmission Revenu 42,632,106 36,789,427 36,866,599 60,206,488 63,618,112 65,815,951
Docket E002/GR-15-826Exhibit__(AEH-1), Appendix A
Page 87 of 97
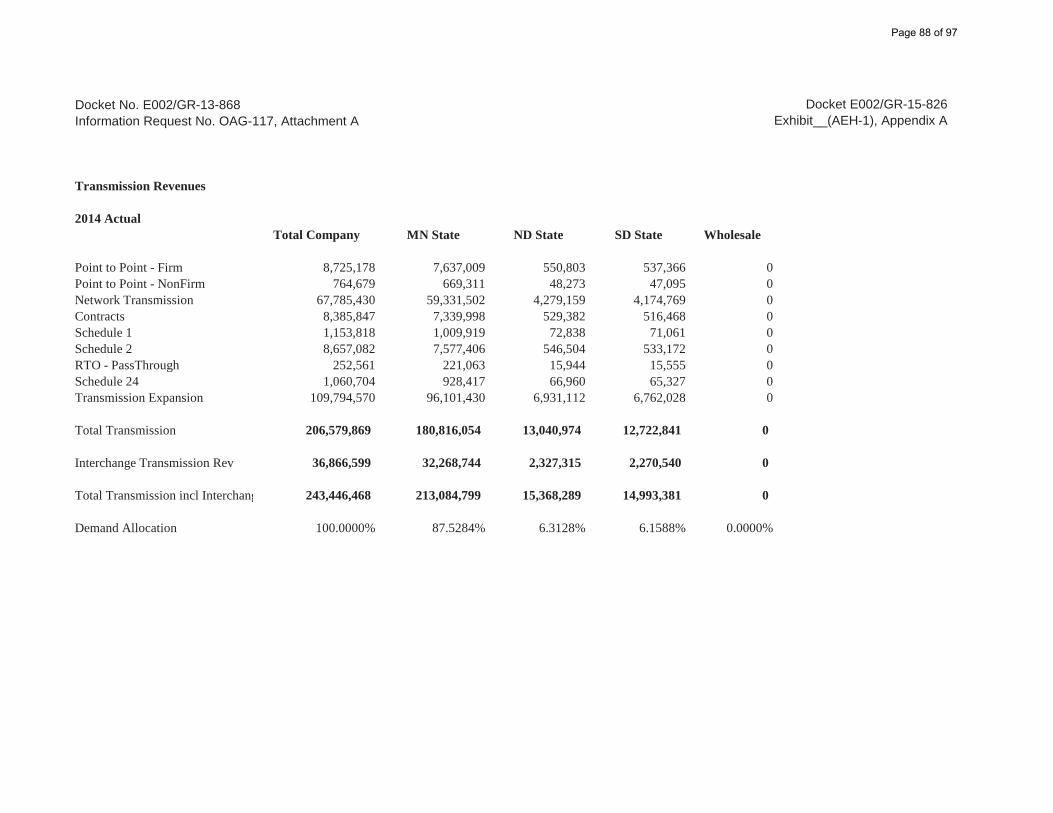
Docket No. E002/GR-13-868Information Request No. OAG-117, Attachment A
Transmission Revenues
2014 ActualTotal Company MN State ND State SD State Wholesale
Point to Point - Firm 8,725,178 7,637,009 550,803 537,366 0Point to Point - NonFirm 764,679 669,311 48,273 47,095 0Network Transmission 67,785,430 59,331,502 4,279,159 4,174,769 0Contracts 8,385,847 7,339,998 529,382 516,468 0Schedule 1 1,153,818 1,009,919 72,838 71,061 0Schedule 2 8,657,082 7,577,406 546,504 533,172 0RTO - PassThrough 252,561 221,063 15,944 15,555 0Schedule 24 1,060,704 928,417 66,960 65,327 0Transmission Expansion 109,794,570 96,101,430 6,931,112 6,762,028 0
Total Transmission 206,579,869 180,816,054 13,040,974 12,722,841 0
Interchange Transmission Rev 36,866,599 32,268,744 2,327,315 2,270,540 0
Total Transmission incl Interchang 243,446,468 213,084,799 15,368,289 14,993,381 0
Demand Allocation 100.0000% 87.5284% 6.3128% 6.1588% 0.0000%
Docket E002/GR-15-826Exhibit__(AEH-1), Appendix A
Page 88 of 97

Docket No. E002/GR-13-868Information Request No. OAG-117, Attachment A
Transmission Revenues
Docket E002/GR-15-826Exhibit__(AEH-1), Appendix A
2013 Actual
Total Company MN State ND State SD State Wholesale
Point to Point - Firm 8,519,808 7,473,218 520,262 521,770 4,558Point to Point - NonFirm 777,167 681,698 47,458 47,595 416Network Transmission 67,535,212 59,239,051 4,124,038 4,135,991 36,131Contracts 8,381,182 7,351,620 511,797 513,280 4,484Schedule 1 1,198,264 1,051,067 73,172 73,384 641Schedule 2 9,124,221 8,003,383 557,171 558,786 4,881RTO - PassThrough 265,530 232,912 16,215 16,262 142Schedule 24 2,310,675 2,026,827 141,101 141,510 1,236Transmission Expansion 69,642,356 61,087,350 4,252,710 4,265,037 37,259
Total Transmission 167,754,415 147,147,127 10,243,923 10,273,616 89,749
Interchange Transmission Rev 36,789,427 32,270,140 2,246,546 2,253,058 19,682
Total Transmission incl Interchang 204,543,842 179,417,267 12,490,470 12,526,674 109,431
Demand Allocation 100.0000% 87.7158% 6.1065% 6.1242% 0.0535%
Page 89 of 97
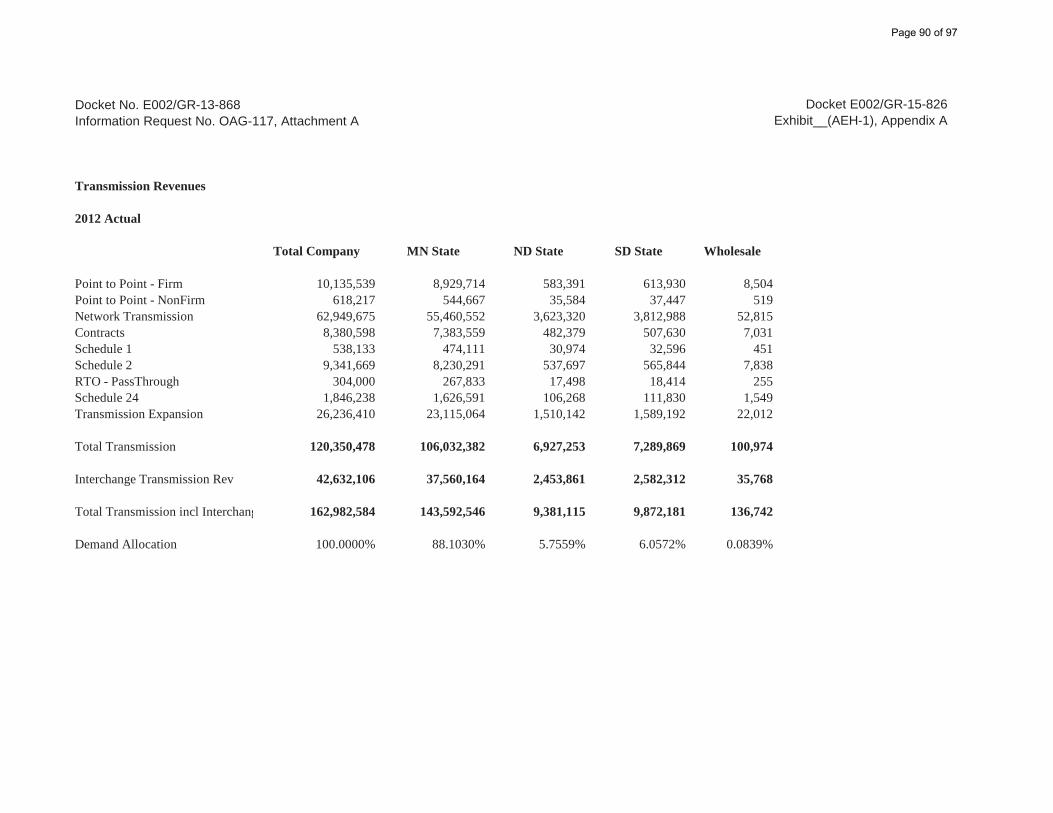
Docket No. E002/GR-13-868Information Request No. OAG-117, Attachment A
Transmission Revenues
Docket E002/GR-15-826Exhibit__(AEH-1), Appendix A
2012 Actual
Total Company MN State ND State SD State Wholesale
Point to Point - Firm 10,135,539 8,929,714 583,391 613,930 8,504Point to Point - NonFirm 618,217 544,667 35,584 37,447 519Network Transmission 62,949,675 55,460,552 3,623,320 3,812,988 52,815Contracts 8,380,598 7,383,559 482,379 507,630 7,031Schedule 1 538,133 474,111 30,974 32,596 451Schedule 2 9,341,669 8,230,291 537,697 565,844 7,838RTO - PassThrough 304,000 267,833 17,498 18,414 255Schedule 24 1,846,238 1,626,591 106,268 111,830 1,549Transmission Expansion 26,236,410 23,115,064 1,510,142 1,589,192 22,012
Total Transmission 120,350,478 106,032,382 6,927,253 7,289,869 100,974
Interchange Transmission Rev 42,632,106 37,560,164 2,453,861 2,582,312 35,768
Total Transmission incl Interchang 162,982,584 143,592,546 9,381,115 9,872,181 136,742
Demand Allocation 100.0000% 88.1030% 5.7559% 6.0572% 0.0839%
Page 90 of 97
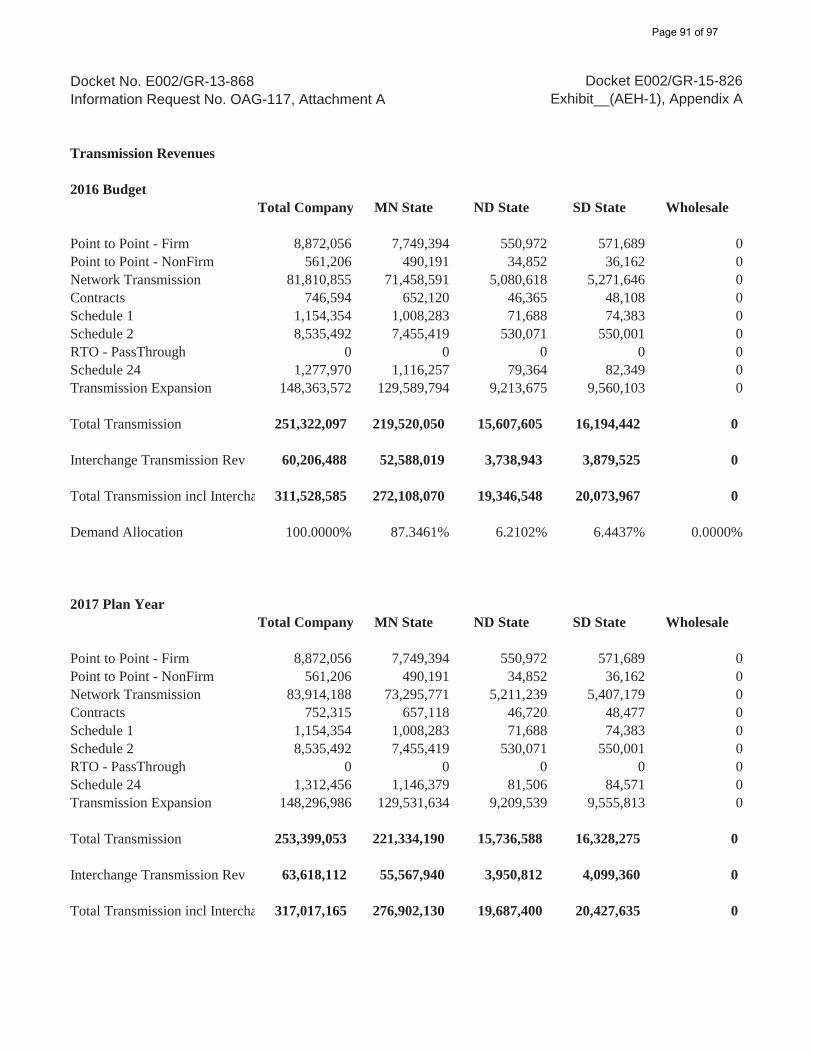
Docket No. E002/GR-13-868Information Request No. OAG-117, Attachment A
Transmission Revenues
2016 BudgetTotal Company MN State ND State SD State Wholesale
Point to Point - Firm 8,872,056 7,749,394 550,972 571,689 0Point to Point - NonFirm 561,206 490,191 34,852 36,162 0Network Transmission 81,810,855 71,458,591 5,080,618 5,271,646 0Contracts 746,594 652,120 46,365 48,108 0Schedule 1 1,154,354 1,008,283 71,688 74,383 0Schedule 2 8,535,492 7,455,419 530,071 550,001 0RTO - PassThrough 0 0 0 0 0Schedule 24 1,277,970 1,116,257 79,364 82,349 0Transmission Expansion 148,363,572 129,589,794 9,213,675 9,560,103 0
Total Transmission 251,322,097 219,520,050 15,607,605 16,194,442 0
Interchange Transmission Rev 60,206,488 52,588,019 3,738,943 3,879,525 0
Total Transmission incl Intercha 311,528,585 272,108,070 19,346,548 20,073,967 0
Demand Allocation 100.0000% 87.3461% 6.2102% 6.4437% 0.0000%
2017 Plan YearTotal Company MN State ND State SD State Wholesale
Point to Point - Firm 8,872,056 7,749,394 550,972 571,689 0Point to Point - NonFirm 561,206 490,191 34,852 36,162 0Network Transmission 83,914,188 73,295,771 5,211,239 5,407,179 0Contracts 752,315 657,118 46,720 48,477 0Schedule 1 1,154,354 1,008,283 71,688 74,383 0Schedule 2 8,535,492 7,455,419 530,071 550,001 0RTO - PassThrough 0 0 0 0 0Schedule 24 1,312,456 1,146,379 81,506 84,571 0Transmission Expansion 148,296,986 129,531,634 9,209,539 9,555,813 0
Total Transmission 253,399,053 221,334,190 15,736,588 16,328,275 0
Interchange Transmission Rev 63,618,112 55,567,940 3,950,812 4,099,360 0
Total Transmission incl Intercha 317,017,165 276,902,130 19,687,400 20,427,635 0
Docket E002/GR-15-826Exhibit__(AEH-1), Appendix A
Page 91 of 97
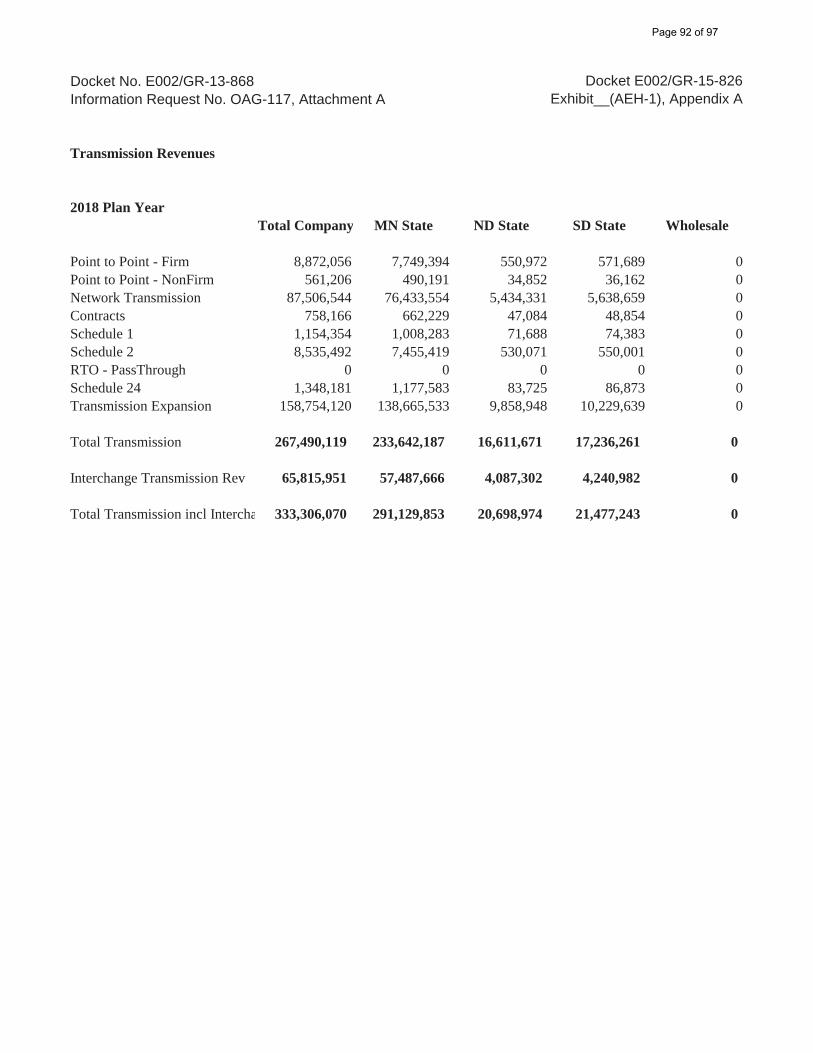
Docket No. E002/GR-13-868Information Request No. OAG-117, Attachment A
Transmission Revenues
Docket E002/GR-15-826Exhibit__(AEH-1), Appendix A
2018 Plan YearTotal Company MN State ND State SD State Wholesale
Point to Point - Firm 8,872,056 7,749,394 550,972 571,689 0Point to Point - NonFirm 561,206 490,191 34,852 36,162 0Network Transmission 87,506,544 76,433,554 5,434,331 5,638,659 0Contracts 758,166 662,229 47,084 48,854 0Schedule 1 1,154,354 1,008,283 71,688 74,383 0Schedule 2 8,535,492 7,455,419 530,071 550,001 0RTO - PassThrough 0 0 0 0 0Schedule 24 1,348,181 1,177,583 83,725 86,873 0Transmission Expansion 158,754,120 138,665,533 9,858,948 10,229,639 0
Total Transmission 267,490,119 233,642,187 16,611,671 17,236,261 0
Interchange Transmission Rev 65,815,951 57,487,666 4,087,302 4,240,982 0
Total Transmission incl Intercha 333,306,070 291,129,853 20,698,974 21,477,243 0
Page 92 of 97

Docket No. E002/GR-15-826 Exhibit___(AEH-1), Appendix A
Docket No. E002/GR-13-868 Information Request No. OAG-133 __________________________________________________________________ Question:
For all responses show amounts for Total Company and the Minnesota jurisdictional electric unless indicated otherwise. Total Company is meant to include costs incurred by Xcel Energy Services and NSP Minnesota, both regulated and non-regulated operations. Reference: Clark Direct, pg. 15. For each year 2010 through 2014 and the test year provide the level of interchange agreement revenues to Minnesota coming from Wisconsin and revenues to Wisconsin coming from Minnesota. Also identify the level of rate base or investments in each state that contribute to the revenues for Minnesota and Wisconsin due to the interchange agreement. Explain whether any of the revenues are billed on a MWH or kWh basis and if so identify the level of revenues that are billed based MWH or kWh covering this period. Response: Table 1 below provides the requested information for the Interchange Agreement billings from NSP-Minnesota to NSP-Wisconsin. Table 2 below provides the requested information for the Interchange Agreement billings from NSP-Wisconsin to NSP-Minnesota. The following provides a description of the amounts included in each column in Table 1 and Table 2.
Column A provides the dollar amount of total billings for the year. This includes items such as production and transmission O&M expenses, fuel and purchased power expenses, production and transmission fixed charges and carrying charges on fuel inventory balances. Column B provides the total production and transmission fixed charges. Fixed charges are the revenue requirements related to the plant investment and include items such as return on rate base, current and deferred income taxes, book depreciation, property insurance, and property taxes. Column C provides the average rate base amounts in which the fixed charge amounts in column B are based. These are the levels of rate base in each
Page 93 of 97
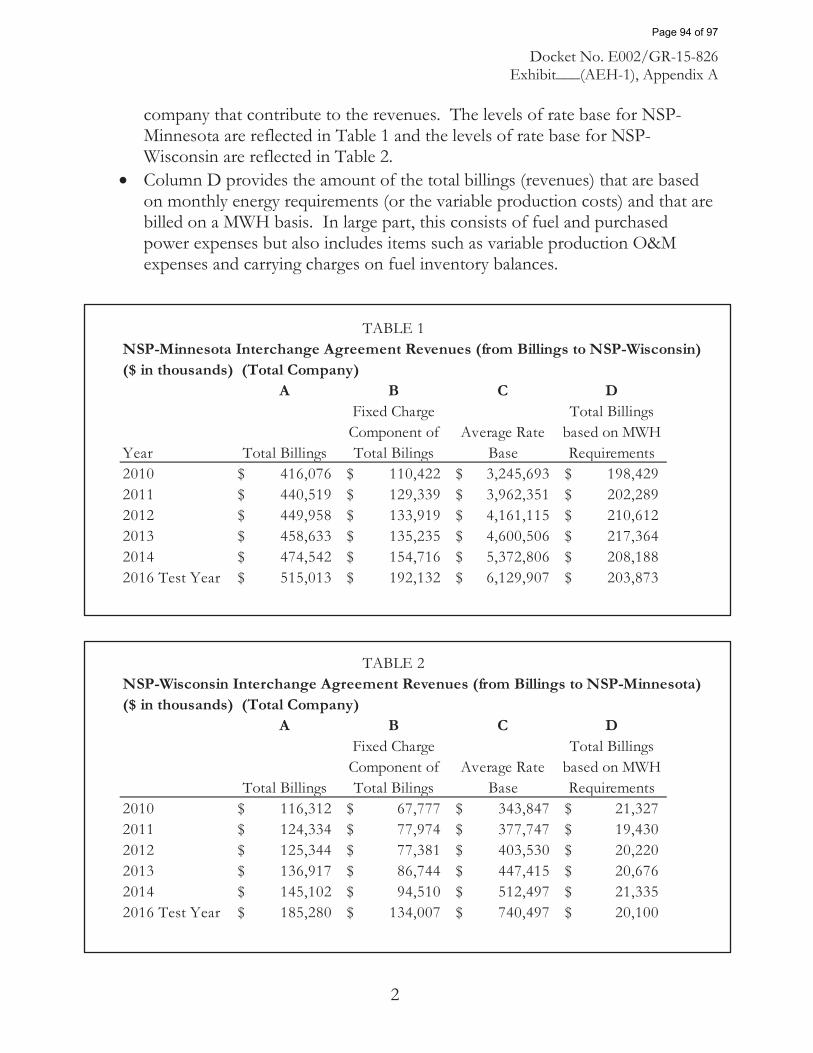
Docket No. E002/GR-15-826 Exhibit___(AEH-1), Appendix A
company that contribute to the revenues. The levels of rate base for NSP-Minnesota are reflected in Table 1 and the levels of rate base for NSP-Wisconsin are reflected in Table 2. Column D provides the amount of the total billings (revenues) that are based on monthly energy requirements (or the variable production costs) and that are billed on a MWH basis. In large part, this consists of fuel and purchased power expenses but also includes items such as variable production O&M expenses and carrying charges on fuel inventory balances.
NSP-Minnesota Interchange Agreement Revenues (from Billings to NSP-Wisconsin)($ in thousands) (Total Company)
A B C D
Year Total Billings
Fixed Charge Component of Total Bilings
Average Rate Base
Total Billings based on MWH Requirements
2010 416,076$ 110,422$ 3,245,693$ 198,429$ 2011 440,519$ 129,339$ 3,962,351$ 202,289$ 2012 449,958$ 133,919$ 4,161,115$ 210,612$ 2013 458,633$ 135,235$ 4,600,506$ 217,364$ 2014 474,542$ 154,716$ 5,372,806$ 208,188$ 2016 Test Year 515,013$ 192,132$ 6,129,907$ 203,873$
TABLE 1
NSP-Wisconsin Interchange Agreement Revenues (from Billings to NSP-Minnesota)($ in thousands) (Total Company)
A B C D
Total Billings
Fixed Charge Component of Total Bilings
Average Rate Base
Total Billings based on MWH Requirements
2010 116,312$ 67,777$ 343,847$ 21,327$ 2011 124,334$ 77,974$ 377,747$ 19,430$ 2012 125,344$ 77,381$ 403,530$ 20,220$ 2013 136,917$ 86,744$ 447,415$ 20,676$ 2014 145,102$ 94,510$ 512,497$ 21,335$ 2016 Test Year 185,280$ 134,007$ 740,497$ 20,100$
TABLE 2
2
Page 94 of 97

Docket No. E002/GR-15-826 Exhibit___(AEH-1), Appendix A
________________________________________________________________ Witness: Anne E. Heuer Preparer: Karen Everson Title: Director Department: Utility Accounting
3
Page 95 of 97

PUBLIC DOCUMENT: TRADE SECRET INFORMATION EXCISED – PUBLIC DATA –
Docket No. E002/GR-15-826 Exhibit___(AEH-1), Appendix A
Docket No. E002/GR-13-868 Information Request No. OAG-167 __________________________________________________________________ Question: Provide a summary of revenues and cross-charges, if any, for shared services with Home Smart. Provide a revenue and expense summary for Home Smart operations for 2014. Response: Please see Attachment A to this response for a summary of actual HomeSmart revenues and cross-charges for 2014. Attachment A is marked “NON-PUBLIC,” as it contains information that is trade secret data as defined by Minn. Stat. §13.37(1)(b). This information has independent economic value from not being generally known to, and not being readily ascertainable by, other parties who could obtain economic value from its disclosure or use. Thus Xcel Energy maintains this information as a trade secret pursuant to Minn. Rule 7829.0500. __________________________________________________________________ Witness: Anne E. Heuer Preparer: Don Reiter / Mary Pope Title: Operations Manager / Senior Rate Analyst Department: HomeSmart Minnesota / Revenue Requirements North
Page 96 of 97

Northern States Power Company PUBLIC DOCUMENT: TRADE SECRET INFORMATION EXCISED--PUBLIC DATA--
Docket No. E002/GR-15-826Exhibit__(AEH-1), Appendix A
Northern States Power Company Docket No. E002/GR-13-868OAG Information Request No. 167
Attachment A - Page 1 of 1HomeSmart Cross Charges: Revenues and Expense
2014 Actual Description[TRADE SECRET BEGINS
Sales Revenues Sales revenues (water heaters, furnaces, central AC etc) 90% of sales to service plan customers Service Plan Revenues Service plan revenuesTotal Revenues Total revenues
TRADE SECRET ENDS]
2014 Actual Description[TRADE SECRET BEGINS
Cost Of Goods Sold (COGS) Equipment costs paid to suppliers and payments to subcontractors for service parts and service labor .
Outside Services Customer Care Fee billed to HomeSmart by customer care area of Xcel EnergyConsulting Prof Service Legal Xcel Energy legal feesNetwork Voice Xcel Energy phone system feesNetwork Data Network data chargesDistributed System Services IT system feesApp Dev & Maint Fees paid to IT to maintain HomeSmart applicationNon Energy HomeSmart bad debt reserve feesSpace Facility charges Rice Street rentCust Billing Services to Other Costs for billing HomeSmart customers via CRS billing systemShared Assets Costs Shared asset costsOperating Co Overheads Company overheads Other Deductions After hours phone center call roll over charges ( calls taken by Sky Park Center Point)Total Cross Charges Total cross charges paid to Xcel
Total Direct Charges Direct expenses incurred by HomeSmartTotal Expenses HomeSmart O&M expense total
Total Expenses and COGS HomeSmart Total Expense and COGSTRADE SECRET ENDS]
Page 97 of 97