Consolidated Financial Statements, Supplemental Schedules and ...

Employer ID No: 13-5645888 Plan Number: 333
Consolidated Financial Supplemental Schedules and
Report of Independent Certified Public Accountants
PENTEGRA DEFINED BENEFIT PLAN
FOR FINANCIAL INSTITUTIONS
As of June 30, 2016 and 2015, and
for the year ended June 30, 2016

PENTEGRA DEFINED BENEFIT PLAN FOR FINANCIAL INSTITUTIONS
TABLE OF CONTENTS
Page
Report of Independent Certified Public Accountants 1 - 2
Consolidated Financial Statements
Consolidated Statements of Net Assets Available for Benefits as of
June 30, 2016 and 2015 3
Consolidated Statement of Changes in Net Assets Available for
Benefits for the Year Ended June 30, 2016 4
Notes to Consolidated Financial Statements as of
June 30, 2016 and 2015 and for the Year Ended June 30, 2016 5 - 20
Supplemental Schedules
Form 5500, Schedule H, Part IV, Line 4i - Schedule of Assets (Held at End of Year)
as of June 30, 2016 22 - 31
Form 5500, Schedule H, Part IV, Line 4j - Schedule of Reportable Transactions
for the Year Ended June 30, 2016 32
Note: All other schedules required by Section 2520.103-10 of the Department of Labor’s Rules and
Regulations for Reporting and Disclosure under the Employee Retirement Income Security Act of
1974 have been omitted because they are not applicable.

REPORT OF INDEPENDENT CERTIFIED PUBLIC ACCOUNTANTS
To the Board of Directors and Participants of
The Pentegra Defined Benefit Plan for Financial Institutions
We have audited the accompanying consolidated financial statements of the Pentegra Defined Benefit Plan for
Financial Institutions (the “Plan”), which comprise the consolidated statements of net assets available for benefits
as of June 30, 2016 and 2015 and the related consolidated statement of changes in net assets available for benefits
for the year ended June 30, 2016, and the related notes to the financial statements.
Management’s responsibility for the financial statements
Management is responsible for the preparation and fair presentation of these consolidated financial statements in
accordance with accounting principles generally accepted in the United States of America; this includes the design,
implementation, and maintenance of internal control relevant to the preparation and fair presentation of consolidated
financial statements that are free from material misstatement, whether due to fraud or error.
Auditor’s responsibility
Our responsibility is to express an opinion on these consolidated financial statements based on our audits. We
conducted our audits in accordance with auditing standards generally accepted in the United States of America.
Those standards require that we plan and perform the audit to obtain reasonable assurance about whether the
consolidated financial statements are free from material misstatement.
An audit involves performing procedures to obtain audit evidence about the amounts and disclosures in the
consolidated financial statements. The procedures selected depend on the auditor’s judgment, including the
assessment of the risks of material misstatement of the consolidated financial statements, whether due to fraud or
error. In making those risk assessments, the auditor considers internal control relevant to the Plan’s preparation and
fair presentation of the consolidated financial statements in order to design audit procedures that are appropriate in
the circumstances, but not for the purpose of expressing an opinion on the effectiveness of the Plan’s internal
control. Accordingly, we express no such opinion. An audit also includes evaluating the appropriateness of
accounting policies used and the reasonableness of significant accounting estimates made by management, as well
as evaluating the overall presentation of the consolidated financial statements.
We believe that the audit evidence we have obtained is sufficient and appropriate to provide a basis for our audit
opinion.
Grant Thornton LLP 757 Third Avenue, 9th Floor New York, NY 10017
T 212.599.0100 F 212.370.4520 GrantThornton.com linkd.in/GrantThorntonUS twitter.com/GrantThorntonUS
Grant Thornton LLP U.S. member firm of Grant Thornton International Ltd

- 2 -
Opinion
In our opinion, the consolidated financial statements referred to above present fairly, in all material respects, the
financial status of the Pentegra Defined Benefit Plan for Financial Institutions as of June 30, 2016 and 2015, and
the changes in its financial status for the year ended June 30, 2016 in accordance with accounting principles
generally accepted in the United States of America.
Supplementary information
Our audits were conducted for the purpose of forming an opinion on the financial statements as a whole. The
supplemental schedules, Schedule H, Part IV, Line 4i - Schedule of assets (held at end of year) as of June 30, 2016
and Schedule H, Part IV Line 4j - schedule of reportable transactions for the year ended June 30, 2016, are presented
for purposes of additional analysis and are not a required part of the financial statements, but are supplementary
information required by the Department of Labor’s Rules and Regulations for Reporting and Disclosure under the
Employee Retirement Income Security Act of 1974. Such supplementary information is the responsibility of the
Plan’s management and was derived from and relates directly to the underlying accounting and other records used
to prepare the consolidated financial statements. The information has been subjected to the auditing procedures
applied in the audit of the consolidated financial statements and certain additional procedures. These additional
procedures included comparing and reconciling the information directly to the underlying accounting and other
records used to prepare the consolidated financial statements or to the consolidated financial statements themselves,
and other additional procedures in accordance with auditing standards generally accepted in the United States of
America. In our opinion, the supplemental schedules are fairly stated, in all material respects, in relation to the
consolidated financial statements as a whole.
New York, New York
April 17, 2017

PENTEGRA DEFINED BENEFIT PLAN FOR FINANCIAL INSTITUTIONS Consolidated Statements of Net Assets Available for Benefits As of June 30, 2016 and 2015
(in thousands)
The accompanying notes are an integral part of these financial statements.
- 3 -
2016 2015
ASSETS
Investments, at fair value 3,245,680$ 3,199,917$
Accrued investment income 11,697 14,294
Accounts receivable 12,420 9,630
Employer contributions receivable 35,858 49,210
Receivables for securities sold, not yet settled 5,132 23,323
Goodwill and intangible assets 13,461 13,882
Cash 10,831 14,611
Other assets 4,896 4,641
Total assets 3,339,975 3,329,508
LIABILITIES
Accounts payable and other liabilities 23,886 28,474
Payables for securities purchased, not yet settled 5,571 19,445
Total liabilities 29,457 47,919
Net assets available for benefits 3,310,518$ 3,281,589$

PENTEGRA DEFINED BENEFIT PLAN FOR FINANCIAL INSTITUTIONS Consolidated Statement of Changes in Net Assets Available for Benefits For the year ended June 30, 2016
(in thousands)
The accompanying notes are an integral part of this financial statement.
- 4 -
ADDITIONS
Contributions 149,512$
Investment income/(loss)
Net appreciation in fair value of investments 62,949
Interest 59,011
Dividends 9,016
Less:
Administrative asset fee (13,646)
Investment advisory services (899)
Net investment income 116,431
Administrative and service income 55,390
Other 689
Total additions 322,022
DEDUCTIONS
Benefit payments 204,513
Administrative expenses 67,413
Other 1,617
Total deductions 273,543
Net increase 48,479
TRANSFER OF ASSETS
Transfers into the Plan 1,787
Transfers out of the Plan (21,337)
Total increase in net assets 28,929
NET ASSETS AVAILABLE FOR BENEFITS
Beginning of year 3,281,589 End of year 3,310,518$

PENTEGRA DEFINED BENEFIT PLAN FOR FINANCIAL INSTITUTIONS Notes to Consolidated Financial Statements As of June 30, 2016 and 2015, and for the year ended June 30, 2016
(Amounts in thousands)
- 5 -
1. DESCRIPTION OF THE PLAN
The following description of the Pentegra Defined Benefit Plan for Financial Institutions (the “Plan”)
is provided for general information purposes only. Participants should refer to their respective
Summary Plan Descriptions for more complete information including pension benefits.
General
A description of the Plan’s Comprehensive Retirement Program, effective July 1, 2012, has been
published in the Plan’s Regulations, 27th Revision (the “Regulations”). This document, and various
amendments to it, have been made available to participating employers and their participants
by being posted on the Plan sponsor website. The Plan operates as a multiple employer plan
under the Employee Retirement Income Security Act of 1974 (“ERISA”) and the Internal Revenue
Code (“IRC”). As such, all plan assets back all plan liabilities. The Plan files one Form 5500 on
behalf of all employers who participate in the Plan. The Bank of New York Mellon (“BNY Mellon”)
serves as the trustee of the Plan. The Plan is subject to the provisions of ERISA and the IRC. The
Plan’s management is responsible for monitoring and controlling the activity of the Plan in
accordance with the provisions of ERISA and the IRC.
The Plan’s consolidated financial statements include the consolidation of the results of operations
and net assets of Pentegra Services, Inc. (“PSI”), a wholly-owned subsidiary of the Plan (see
Note 12).
2. SUMMARY OF SIGNIFICANT ACCOUNTING POLICIES
Basis of Accounting
The accompanying consolidated financial statements have been prepared on the accrual basis
of accounting in accordance with accounting principles generally accepted in the United States
of America (“U.S. GAAP”).
Cash
The Plan maintains cash balances with U.S. financial institutions, which at times, may exceed
federally insured limits. The Plan has not experienced any losses in such accounts and believes it it
not exposed to any significant credit risk on cash.
Use of Estimates
The preparation of consolidated financial statements in conformity with U.S. GAAP requires plan
management to make estimates and assumptions that affect the reported amounts of assets,
liabilities and changes therein, disclosure of contingent assets and liabilities, and the actuarial
present value of accumulated benefits and changes therein at the date of the consolidated
financial statements. Actual results could differ significantly from those estimates. Estimates that
are particularly susceptible to change include assumptions used in determining the actuarial
present value of accumulated plan benefits and the fair value of investments.

PENTEGRA DEFINED BENEFIT PLAN FOR FINANCIAL INSTITUTIONS Notes to Consolidated Financial Statements As of June 30, 2016 and 2015, and for the year ended June 30, 2016
(Amounts in thousands)
- 6 -
Risk and Uncertainties
Investment securities (see Notes 6, 7 and 8) are exposed to various risks, such as interest rate, credit
risk and overall market volatility. Due to the level of risk associated with certain investment
securities, it is reasonably possible that changes in the values of investment securities will occur in
the near term and that such changes could materially affect the amounts reported in the
consolidated financial statements.
Income Recognition
Purchases and sales of securities are recorded on a trade-date basis. Interest income is recorded
on an accrual basis. Dividend income is recorded on the ex-dividend date.
Realized gains and losses on the sales of investment securities are recorded as the difference
between proceeds received and cost. Cost is determined on an average cost basis. Net
appreciation or depreciation includes realized gains and losses and the change in the fair value
of securities held for the year ended June 30, 2016.
Investment Valuation
Investments are stated at fair value. Fair value of a financial instrument is the amount that would
be received to sell an asset or paid to transfer a liability in an orderly transaction between market
participants at the measurement date (see Note 6).
Administrative Expenses
In addition to the administrative expenses of PSI (see Note 12), administrative expenses incurred to
administer the Plan, including audit, legal, PBGC insurance premium, consulting and board
meeting expenses are assessed to participating employers and are paid out of the Plan assets.
Fiduciary liability insurance premiums aggregating $358 were paid by participating employers
directly and are not reflected in the Plan’s consolidated financial statements for the year ended
June 30, 2016.
Payment of Benefits
Benefit payments to participants are recorded upon distribution. As of June 30, 2016 and 2015,
net assets available for benefits included $12,587 and $10,986, respectively, of benefits due to
participants who have withdrawn from the Plan, or beneficiaries who have not yet received their
distribution.
Contributions
The Plan accepts employer contributions for the current plan year up to eight and a half months
after the Plan year end as allowed by ERISA. Certain contributions from employers on Schedule SB
of Form 5500 represent reimbursements to the Plan for administrative services and are therefore
recorded as such on the consolidated financial statements.

PENTEGRA DEFINED BENEFIT PLAN FOR FINANCIAL INSTITUTIONS Notes to Consolidated Financial Statements As of June 30, 2016 and 2015, and for the year ended June 30, 2016
(Amounts in thousands)
- 7 -
Vesting
Participants are vested immediately in their contributions plus interest thereon. Participants should
refer to their respective Summary Plan Descriptions to determine the vesting schedule for benefits
accrued for employer provided benefits.
Pension Benefits
Pension benefits are provided to participants under several types of retirement options based
upon years of continuous service and age. Retirement benefits are paid to participants in various
forms of joint and survivor annuities. A lump-sum payment option may also be available.
Participants should refer to their respective Summary Plan Descriptions for more information.
Recent Accounting Pronouncements
In May, 2015, the Financial Accounting Standards Board (“FASB”) issued Accounting Standards
Update (“ASU”) No. 2015-07 Fair Value Measurement (Topic 820): Disclosures for Investments in
Certain Entities that Calculate Net Asset Value per Share (or its Equivalent). ASU 2015-07 removes
the requirement to categorize within the fair value hierarchy all investments for which fair value is
measured using net asset value (“NAV”) per share as a practical expedient. For nonpublic
business entities, ASU 2015-07 is effective for fiscal years beginning after December 15, 2016.
Accordingly, the Plan has chosen not to early adopt ASU 2015-12 and is currently in the process of
evaluating the impact the adoption of this new standard will have on the Plan financial
statements.
3. SUMMARY OF ACTUARIAL ASSUMPTIONS
Actuarial Cost Methods
The actuarial cost method used to value all benefits is the traditional unit credit method. As part
of the valuation process, the funded status of each participating employer is separately
determined. Employers in an unfunded position are billed for their required contributions.
Employers in an over-funded position can use their surplus to offset all or a portion of their
contribution requirement.
Actuarial Asset Valuation
The actuarial valuation uses the market value of assets.
Actuarial Valuation Assumptions
The significant assumptions used in the actuarial valuation are:
For the 2016 and 2015 valuation, the interest rates used for determining the minimum
required contribution are based on the three segment yield rates for 2015 and 2014,
respectively, under the Highway and Transportation Funding Act of 2014 (“HATFA”) with
90%-110% corridors surrounding the 25 year average of the 24 month average segment

PENTEGRA DEFINED BENEFIT PLAN FOR FINANCIAL INSTITUTIONS Notes to Consolidated Financial Statements As of June 30, 2016 and 2015, and for the year ended June 30, 2016
(Amounts in thousands)
- 8 -
rates as of September 30, 2015 and September 30, 2014, respectively, as described in IRS
Notice 2014-53. The rates are as follows:
2016 Rate
Year
1-5 4.43 %
6-20 5.91
21+ 6.65
2015 Rate
Year
1-5 4.72 %
6-20 6.11
21+ 6.81
Normal retirement is assumed to occur at ages 45-70. For the period prior to retirement,
withdrawals, deaths, and disabilities are anticipated.
For the 2016 and 2015 actuarial valuation, separate rates for non-annuitants (based on
Retired Pensioner 2000 Mortality Tables (“RP-2000”) “employees” table without collar or
amount adjustments, projected to 2031 and 2030, respectively, using scale AA) and
annuitants (based on RP-2000 “Healthy Annuitants” table without collar or amount
adjustments projected to 2023 and 2022, respectively using scale AA) were used.
The interest rate assumed for lump sum benefits is the same as the valuation interest rate,
as required by the Pension Protection Act of 2006 (“PPA”) as amended by MAP-21.
Normal cost for each employer includes the estimated administrative expenses for the
plan year, as required under PPA.
An interest rate of 3.57% was used to determine the actuarial present value of
accumulated plan benefits under Accounting Standards Codification (“ASC”) 960, Plan
Accounting-Defined Benefit Pension Plans, as of July 1, 2016. The rate used for this
measurement as of July 1, 2015 was 6.25%.
The foregoing actuarial assumptions are based on the presumption that the Plan will continue. If
the Plan were to terminate, different actuarial assumptions and other factors might be applicable
in determining the actuarial present value of accumulated plan benefits.
4. FUNDING POLICY
The Plan is a defined benefit pension plan to which employers make contributions based upon
calculations prepared annually by the Plan’s outside actuary, Willis Towers Watson. The
calculations are designed to determine the amounts necessary to fund the target normal cost of

PENTEGRA DEFINED BENEFIT PLAN FOR FINANCIAL INSTITUTIONS Notes to Consolidated Financial Statements As of June 30, 2016 and 2015, and for the year ended June 30, 2016
(Amounts in thousands)
- 9 -
pension benefits and the 7 year amortization of the Plan’s funding shortfall. The Plan met the
minimum funding requirements of ERISA for the years ended June 30, 2016 and 2015.
Certain participating employers have elected to participate on a contributory basis, whereby
participants are required to contribute a percentage of their salaries. Participants are always
100% vested in the value of their contributions. Participants’ accumulated contributions, including
interest, were $8,473 and $7,713 at June 30, 2016 and 2015, respectively. Pursuant to federal
regulations, the interest rate credited to these contributions at June 30, 2016 and 2015, was 2.12%
and 2.18%, respectively.
5. ACCUMULATED PLAN BENEFITS
Accumulated plan benefits are those future periodic payments and lump-sum distributions, which
are attributable under the Plan’s provisions to service rendered by employees as of the valuation
date. Accumulated plan benefits include benefits expected to be paid to (1) retired or
terminated employees, (2) beneficiaries of employees who have died, and (3) present
employees. The actuarial present value of accumulated plan benefits is determined by an
independent actuary and it is that amount that results from applying actuarial assumptions to
adjust the accumulated plan benefits to reflect the time value of money (through discounts for
interest) and the probability of payment (by means of decrements such as for death, disability,
withdrawal, or retirement) between the valuation date and the expected date of payment.
The actuarial present value of accumulated plan benefits as of June 30, 2016 and 2015 is as
follows:
2016 2015
Vested benefits for:
Retirees and beneficiaries currently receiving payments 1,892,965$ 1,326,818$
Other participants 2,830,588 1,899,359
Total vested benefits 4,723,553 3,226,177
Nonvested benefits 44,245 29,399
Total actuarial present value of
accumulated plan benefits 4,767,798$ 3,255,576$

PENTEGRA DEFINED BENEFIT PLAN FOR FINANCIAL INSTITUTIONS Notes to Consolidated Financial Statements As of June 30, 2016 and 2015, and for the year ended June 30, 2016
(Amounts in thousands)
- 10 -
The changes in the actuarial present value of accumulated plan benefits for the year ended
June 30, 2016 is as follows:
2016
Changes in accumulated plan benefits
Beginning of year 3,255,576$
Increase (decrease) during the year attributable to:
Interest due to decrease in the discount period 196,466
Benefits paid (204,513)
Withdrawn employers (23,113)
New employers -
Changes in benefits adopted by certain employers 295 Assumption changes 1,431,117
Benefits accumulated and actuarial experience 111,970
Net increase 1,512,222
End of year 4,767,798$
6. FAIR VALUE MEASUREMENTS
ASC 820, Fair Value Measurements and Disclosures, provides a framework for measuring fair value.
That framework provides a fair value hierarchy that prioritizes the inputs to valuation techniques
used to measure fair value, as follows: Level 1, which refers to securities valued using unadjusted
quoted prices from active markets for identical assets; Level 2, which refers to securities not traded
on an active market but for which observable market inputs are readily available; and Level 3,
which refers to securities valued based on significant unobservable inputs. Assets and liabilities are
classified in their entirety based on the lowest level of input that is significant to the fair value
measurement.
Asset Valuation Techniques
Valuation techniques used need to maximize the use of observable inputs and minimize the use of
unobservable inputs. The following is a description of the valuation methodologies used for assets
at fair value. There have been no changes in the methodologies used at June 30, 2016 and 2015.
Mutual funds are valued at the daily closing price as reported by the fund. Mutual funds
held by the Plan are open-end mutual funds that are registered with the U.S. Securities and
Exchange Commission (“SEC”). These funds are required to publish their daily NAV and to
transact at that price. The mutual funds held by the Plan are deemed to be actively
traded.
Common stocks are valued at quoted prices in active markets.
Corporate debt securities (excluding equity linked notes [“ELN’s”]), interest rate swaps, and
preferred stocks are valued by management based on information provided by BNY

PENTEGRA DEFINED BENEFIT PLAN FOR FINANCIAL INSTITUTIONS Notes to Consolidated Financial Statements As of June 30, 2016 and 2015, and for the year ended June 30, 2016
(Amounts in thousands)
- 11 -
Mellon, using the following techniques: matrix pricing, market pricing, market
corroborated pricing and inputs such as yield curves and indices.
U.S. government securities are valued at prevailing market prices traded on the secondary
markets or are valued by management based on information provided by BNY Mellon
using the following observable inputs: matrix pricing, market pricing, market corroborated
pricing and inputs such as yield curves and indices.
Common collective trust funds (“Funds”) are valued at NAV, which is calculated by the
investment manager or sponsor of the Fund based on the fair value of the underlying
assets of each fund. Equity funds have a primary objective of matching the performance
of an index of a particular segment of the financial market, such as Standard & Poor’s 500
Index. Fixed income funds are invested primarily in investment grade corporate and
government bonds and seek to match the performance of particular bond index such as
the Barclays Capital U.S. Long Term Credit Index. The short-term funds are primarily
invested in shorter maturity government and corporate securities. As of June 30, 2016 and
2015, the Funds can be redeemed daily with 1-2 days’ notice. As of June 30, 2016 and
2015, the Plan had no unfunded commitments for the Funds.
ELN’s are in the category of A-rated corporate debt securities, are valued at bid price that
the originating trading desk would be willing to execute a trade (see Note 8).
Real estate funds are valued at NAV, which is calculated by the investment manager or
sponsor of the Funds which is based on data obtained from real estate appraisals,
comparables, or valued based on valuation techniques such as the cash flow projection
model. Redemption from these Funds varies as per the Funds’ cash flow availability. As of
June 30, 2016 and 2015, the Plan had remaining capital commitments for additional
contributions to real estate funds of $18,800 and $2,000, respectively. As of June 30, 2016
and 2015, the Plan had reserve commitments of $0 and $750, respectively, which may or
may not be called during the life of the investment.
Private equity investments are valued at NAV, which is calculated by the fund manager
and is based on the valuation of the underlying investments, which include inputs such as
cost, operating results, discounted future cash flows and market based comparable data.
For the year ended June 30, 2016, $6,845 of these funds can be redeemed quarterly with a
65 day notice period while $375,940 are not liquid and subject to the distributions of the
fund manager. For the year ended June 30, 2015, $45,784 of these funds can be
redeemed monthly or quarterly with a 5-65 days’ notice while $264,007 are not liquid and
subject to the distributions of the fund manager. There are various strategies employed
including: private debt and equity investments, combining core long holdings of equities
with short sales of stock or stock index options, event driven and other directional. As of
June 30, 2016 and 2015, the Plan had remaining capital commitments for additional
contributions to the limited partnerships totaling $307,187 and $283,586, respectively.

PENTEGRA DEFINED BENEFIT PLAN FOR FINANCIAL INSTITUTIONS Notes to Consolidated Financial Statements As of June 30, 2016 and 2015, and for the year ended June 30, 2016
(Amounts in thousands)
- 12 -
The following tables set forth by level within the fair value hierarchy a summary of the Plan’s
investments measured at fair value on a recurring basis at June 30, 2016 and 2015:
Quoted Prices
in Active Significant
Markets for Other Significant
Identical Observable Unobservable
Assets Inputs Inputs
(Level 1) (Level 2) (Level 3) Total
Mutual funds 209,921$ - $ - $ 209,921$
Common stocks
Financial services 35,940 - - 35,940
Materials and services 5,239 - - 5,239
Total common stocks 41,179 - - 41,179
Corporate debt securities
AAA credit rating - 162 - 162
AA credit rating - 173,146 - 173,146
A credit rating - 349,063 6,309 355,372
BBB credit rating - 255,567 - 255,567
Not rated * - 220,986 - 220,986
Total corporate debt securities - 998,924 6,309 1,005,233
Government securities 62,206 211,126 - 273,332
Municipal and other government debt and other 22 177,223 - 177,245
Private equity - 6,845 375,940 382,785
Preferred stock - 19,019 - 19,019
Common collective trust funds - equity - 588,513 - 588,513
Common collective trust funds - fixed income - 426,432 - 426,432
Common collective trust funds - short term - 44,713 - 44,713
Real estate funds - - 77,308 77,308
Total 313,328$ 2,472,795$ 459,557$ 3,245,680$
Fair Value Measurements as of June 30, 2016
* Includes Doubleline Opportunistic Income Fund Ltd.

PENTEGRA DEFINED BENEFIT PLAN FOR FINANCIAL INSTITUTIONS Notes to Consolidated Financial Statements As of June 30, 2016 and 2015, and for the year ended June 30, 2016
(Amounts in thousands)
- 13 -
Quoted Prices
in Active Significant
Markets for Other Significant
Identical Observable Unobservable
Assets Inputs Inputs
(Level 1) (Level 2) (Level 3) Total
Mutual funds 223,873$ - $ - $ 223,873$
Common stocks
Financial services 23,343 - - 23,343
Materials and services 62 - - 62
Total common stocks 23,405 - - 23,405
Corporate debt securities
AAA credit rating - 6,098 - 6,098
AA credit rating - 117,760 - 117,760
A credit rating - 447,327 6,545 453,872
BBB credit rating - 338,199 - 338,199
Not rated* - 203,529 - 203,529
Total corporate debt securities - 1,112,913 6,545 1,119,458
Government securities 62,603 111,149 - 173,752
Municipal and other government debt and other 120 146,350 - 146,470
Private equity - 45,784 264,007 309,791
Preferred stock - 1,233 - 1,233
Common collective trust funds - equity - 610,411 - 610,411
Common collective trust funds - fixed income - 453,248 - 453,248
Common collective trust funds - short term - 51,654 - 51,654
Real estate funds - - 86,622 86,622
Total 310,001$ 2,532,742$ 357,174$ 3,199,917$
Fair Value Measurements as of June 30, 2015
* Includes Doubleline Opportunistic Income Fund Ltd.

PENTEGRA DEFINED BENEFIT PLAN FOR FINANCIAL INSTITUTIONS Notes to Consolidated Financial Statements As of June 30, 2016 and 2015, and for the year ended June 30, 2016
(Amounts in thousands)
- 14 -
The Plan’s policy is to recognize all transfers between levels at the beginning of the reporting
period. For the year ended June 30, 2016, there were no transfers.
The following table presents a reconciliation of the beginning and ending balances of the fair
value measurements using significant unobservable inputs (Level 3) for the year ended June 30,
2016.
Real Corporate
Private Estate Debt Sec. CCT
Equity Funds (ELN’s) Equity Total
Beginning balance - June 30, 2015 264,007$ 86,622$ 6,545$ - $ 357,174$
Realized gains 16,104 2,606 - - 18,710
Unrealized gains (losses) 5,865 1,177 (236) - 6,806
Purchases 147,078 10,429 - - 157,507
Issuances - - - - -
Settlements (57,114) (23,526) - - (80,640)
Transfers into Level 3 - - - - -
Ending balance - June 30, 2016 375,940$ 77,308$ 6,309$ - $ 459,557$
The amount of total gains or losses for the
period included in changes in net assets
attributable to the change in unrealized
gains or losses related to assets still held
at the reporting date 8,710$ 197$ (236)$ - $ 8,671$
June 30, 2016
Fair Value Measurements Using Significant Unobservable Inputs (Level 3)

PENTEGRA DEFINED BENEFIT PLAN FOR FINANCIAL INSTITUTIONS Notes to Consolidated Financial Statements As of June 30, 2016 and 2015, and for the year ended June 30, 2016
(Amounts in thousands)
- 15 -
The following tables set forth a summary of the Plan’s investments with a reported NAV at June 30,
2016 and 2015:
Other Redemption
Fair Unfunded Redemption Redemption Notice
Investment Value Commitment Frequency Restrictions Period
Common collective trust funds - equity 588,513$ - $ daily None 1-2 days
Common collective trust funds - fixed
income426,432 - daily None 1-2 days
Private equity - liquid 6,845 - quarterly None 65 days
Private equity - illiquid 375,940 307,187 subject to distributions by fund manager None NA
Real estate funds 77,308 18,800 varies as per funds’ cash flow availability None NA
Total 1,475,038$ 325,987$
Fair Value Estimated Using Net Asset Value Per Share
June 30, 2016
Other Redemption
Fair Unfunded Redemption Redemption Notice
Investment Value Commitment Frequency Restrictions Period
Common collective trust funds - equity 610,411$ - $ daily None 1-2 days
Common collective trust funds - fixed 453,248 - daily None 1-2 days
Private equity - liquid 45,784 - monthly, quarterly None 5-65 days
Private equity - illiquid 264,007 283,586 subject to distributions by fund manager None NA
Real estate funds 86,622 2,000 varies as per funds’ cash flow availability None NA
Total 1,460,072$ 285,586$
Fair Value Estimated Using Net Asset Value Per Share
June 30, 2015

PENTEGRA DEFINED BENEFIT PLAN FOR FINANCIAL INSTITUTIONS Notes to Consolidated Financial Statements As of June 30, 2016 and 2015, and for the year ended June 30, 2016
(Amounts in thousands)
- 16 -
The following table represents the Plan’s Level 3 financial instruments, the valuation techniques
used to measure the fair value of those financial instruments as of June 30, 2016, and the
significant unobservable inputs and the ranges of values for these inputs:
Principal Valuation Significant Range of Significant Weighted
Instrument Fair Value Technique Unobservable Inputs Input Values Average
Corporate Debt Sec (ELN’s) 6,309 Option Valuation Model Volatility 17.0%-27.0% 18.7%
Private Equity 375,940 Practical Expedient Net Asset Value N/A N/A
Market Approach * Multiples .9x-23.4x N/A
Discount Rate 4.0%-35.0% N/A
Discounted Cashflow * Discount Rate 5.2%-30.0% N/A
Multiples 4.0x-14.0x N/A
Revenue Growth 4.5%-207.1% 10.2%
Real Estate 77,308 Practical Expedient Net Asset Value N/A N/A
Market Comparables * Multiples .9%-1.1% N/A
Discounted Cashflow * Discount Rate 1.5%-10.0% N/A
N/A-audited data not provided by fund managers in most recent financial report
Quantitative Information about Significant Unobservable Inputs Used in Level 3 Fair Value Measurements June 30, 2016
In estimating the fair value of the investments in Level 3, the Plan may use third-party pricing
sources or appraisers. In substantiating the reasonableness of the pricing data provided by third
parties, a variety of factors are evaluated including review of methods and assumptions used by
external sources, recently executed transactions, existing contracts, economic conditions, industry
and market developments, and overall credit ratings.
* The investment’s NAV is calculated by the fund manager based on these principal valuation
techniques and inputs.

PENTEGRA DEFINED BENEFIT PLAN FOR FINANCIAL INSTITUTIONS Notes to Consolidated Financial Statements As of June 30, 2016 and 2015, and for the year ended June 30, 2016
(Amounts in thousands)
- 17 -
7. INVESTMENTS
For the year ended June 30, 2016, the Plan’s investments (including gains and losses on
investments bought and sold, as well as held during the year) appreciated in value by $62,949 as
presented in the consolidated statement of changes in net assets available for benefits as follows:
Net appreciation (depreciation) in fair value of investments
whose fair value was determined based on quoted market prices:
Mutual funds (14,477)$
Common stocks (9,144)
U.S. treasuries 68
Net appreciation (depreciation) in fair value of investments
whose fair value was estimated:
Private equity 21,094
Preferred stocks (906)
Government securities 11,046
Corporate debt securities 11,547
Common collective trust funds - equity (16,592)
Common collective trust funds - fixed income 43,614
Real estate funds 3,783
Municipal and other government debt and other 12,916
Net appreciation in fair value of investments 62,949$
The Plan’s investments that represent 5% or more of net assets available for benefits as of June 30,
2016 and 2015, are as follows:
2016 2015
Blackrock Equity Index Fund** 179,905$ *
* This investment did not represent 5% of the Plan’s net assets available for benefits.
** The BlackRock Equity Index Fund invests in a portfolio of equity securities with the objective of
approximating the capitalization weighted total return of US publicly traded larger capitalized
companies as represented by the S&P 500 Index. There are no restrictions on redemptions from
the Fund.
8. DERIVATIVES
Derivative financial instruments are used as hedging investments and to provide incremental
income. The Plan holds equity linked notes covering a notional amount of $5,000 and $20,000 and
an estimated fair value of $6,309 and $21,822 as of June 30, 2016 and 2015, respectively. An

PENTEGRA DEFINED BENEFIT PLAN FOR FINANCIAL INSTITUTIONS Notes to Consolidated Financial Statements As of June 30, 2016 and 2015, and for the year ended June 30, 2016
(Amounts in thousands)
- 18 -
equity linked note consists of a discounted fixed income instrument plus a longer term call option
on an underlying equity market index, such as the Standard & Poor’s 500. When the note matures,
the Plan will receive the principal of the note plus the value of the option. If the value of the
underlying equity market has appreciated, the option will appreciate commensurately. If the
underlying equity market has not appreciated, the value of the option will be zero and the Plan
will receive the maturity value of the note. At June 30, 2016, approximately 78% of the equity
linked notes was comprised of the discounted fixed income instrument and 22% was comprised of
the call option. At June 30, 2015, approximately 89% of the equity linked notes was comprised of
the discounted fixed income instrument and 11% was comprised of the call option.
The following tables summarizes the Plan’s use of derivatives and the effect on the consolidated
statements of net assets available for benefits as of June 30, 2016 and 2015, respectively, and the
consolidated statement of changes in net assets available for benefits for the year ended June 30,
2016.
Consolidated Statements of Net Asset LiabilityAssets Available for Benefits Derivatives Derivatives Total
Equity linked notes Assets - investments at fair value 6,309$ - $ 6,309$
Total derivatives 6,309$ - $ 6,309$
Fair Value of Derivative Instruments as of June 30, 2016
Consolidated Statements of Net Asset LiabilityAssets Available for Benefits Derivatives Derivatives Total
Equity linked notes Assets - investments at fair value 21,822$ - $ 21,822$
Total derivatives 21,822$ - $ 21,822$
Fair Value of Derivative Instruments as of June 30, 2015
Consolidated Statements of
Changes in Net Assets Available Realized Net Unrealized
for Benefits Gain Depreciation Total
Equity linked notes Net appreciation/(depreciation) in fair value
of investments - $ (512)$ (512)$
Total derivatives - $ (512)$ (512)$
for the Year Ended June 30, 2016
Changes in Net Assets Available for Benefits
Effect of Derivative Instruments on the Consolidated Statement of

PENTEGRA DEFINED BENEFIT PLAN FOR FINANCIAL INSTITUTIONS Notes to Consolidated Financial Statements As of June 30, 2016 and 2015, and for the year ended June 30, 2016
(Amounts in thousands)
- 19 -
9. EXEMPT PARTIES-IN-INTEREST TRANSACTIONS
Certain Plan investments are managed by BNY Mellon. BNY Mellon is the trustee of the Plan and,
therefore, these transactions qualify as party-in-interest transactions. Investments managed by
BNY Mellon which totaled $97,965 and $104,334 as of June 30, 2016 and 2015, respectively, are
included in the consolidated statements of net assets available for benefits. Income earned on
these investments was $709 for the year ended June 30, 2016, and is included in interest as shown
in the consolidated statement of changes in net assets available for benefits. Fees paid by the
Plan for investment management services of $262 for the year ended June 30, 2016, are included
in investment advisory services as shown in the consolidated statement of changes in net assets
available for benefits. The Board of Directors of the Plan are comprised of executive officers of
participating employers of the Plan and as such are participants in the Plan. In addition,
investments held by the Plan of $2,675 and $2,464 as of June 30, 2016 and 2015, respectively, are
fixed income securities backed by the Federal Home Loan Banking system. Some of the banks in
this system are participating employers in the Plan.
10. PLAN TERMINATION
The Board of Directors shall have the right to amend or terminate the Plan or trust agreement
subject to the provisions set forth in ERISA, at any time in whole or in part, for any reason, and
without the consent of any participating employer or participant, and each employer by its
adoption of the Plan and Trust shall be deemed to have delegated this authority to the Board of
Directors. No amendment, however, shall impair such rights of payment as the participant would
have had, if such amendment had not been made, with respect to benefits accrued prior to such
amendment. In the event that the Plan is terminated, the net assets of the Plan will be allocated
for payment of benefits to the participants in an order of priority determined in accordance with
ERISA, applicable regulations thereunder and the Plan document.
Certain benefits under the Plan are insured by the Pension Benefit Guaranty Corporation (“PBGC”)
if the Plan terminates. Generally, the PBGC guarantees most vested normal-age retirement
benefits, early retirement benefits, and certain disability and survivor’s pensions. However, the
PBGC does not guarantee all types of benefits under the Plan, and the amount of benefit
protection is subject to certain limitations. Vested benefits under the Plan are guaranteed at the
level in effect on the date of the Plan’s termination, subject to a statutory ceiling on the amount of
an individual’s monthly benefit.
11. FEDERAL INCOME TAX STATUS
The Internal Revenue Service (“IRS”) has determined and informed the Plan most recently by letter
dated February 12, 2015, that the Plan’s Regulations and related trust are designed in
accordance with the applicable sections of the IRC. Subsequent to receiving the determination
letter, several amendments to the Regulations have been approved that will not impact the Plan's
tax-qualified status. The Plan administrator and the Plan’s tax counsel believe that the Plan’s
Regulations are designed and are currently being operated in compliance with the applicable
requirements of the IRC and the Plan and related trust continue to be tax-exempt.

PENTEGRA DEFINED BENEFIT PLAN FOR FINANCIAL INSTITUTIONS Notes to Consolidated Financial Statements As of June 30, 2016 and 2015, and for the year ended June 30, 2016
(Amounts in thousands)
- 20 -
U.S. GAAP requires plan management to evaluate tax positions taken by the Plan and recognize
a tax liability (or asset) if the Plan has taken an uncertain position that more likely than not would
not be sustained upon examination by the IRS. The Plan is subject to routine audits by taxing
jurisdictions; however, there are currently no audits for any tax periods in progress. The Plan
administrator believes it is no longer subject to income tax examinations for years prior to 2012.
However, the Plan could be open indefinitely to a Department of Labor (“DOL”) audit.
12. CONSOLIDATED FINANCIAL STATEMENTS
The Plan’s consolidated financial statements include the accounts of the Plan and PSI.
Intercompany transactions and balances have been eliminated.
PSI is a full service retirement benefits consulting firm providing plan design, compliance and
administration, strategic consulting, actuarial services, trust and custody services, investment
management to qualified and nonqualified plans and BOLI (bank owned life insurance services).
Fee income is recognized as services are performed. Income related to the operations of PSI in
the amount of $37,540 for the year ended June 30, 2016, is included in administrative and service
income in the consolidated statement of changes in net assets available for benefits as presented
herein.
Administrative expenses related to the operations of PSI totaled $34,477 for the year ended
June 30, 2016. PSI administrative expenses include payroll, other employee, professional, office
and other expenses.
Non-interest bearing cash from PSI as presented on Form 5500 is included in other assets in the
consolidated statements of net assets available for benefits in the amount of $10,722 and $14,226
as of June 30, 2016 and 2015, respectively.
Management makes certain complex judgments with respect to its goodwill and intangible assets
which are a direct result of PSI’s acquisitions of Advanced Pension Solution during the year ended
June 30, 2013, Alliance Benefit Group during the year ended June 30, 2011 and the subsidiaries of
Retirement System Group Inc. during the year ended June 30, 2009. These include assumptions
and estimates used to determine the fair value of the amount reported. Fair value is determined
using historical financial statements, financial projections, comparable company public filings, the
purchase agreement, and other relevant company data. Goodwill totaled $8,786 and $8,786
and intangible assets, net of amortization totaled $4,674 and $5,095 as of June 30, 2016 and 2015,
respectively, and are included on the consolidated statements of net assets available for benefits.
13. SUBSEQUENT EVENTS
Subsequent events were evaluated through April 17, 2017, which is the date the consolidated
financial statements are available to be issued. During the period from July 1, 2016 through
April 17, 2017, the Plan made approximately $150,000 in capital commitments, of which
approximately $12,509 has been funded.

SUPPLEMENTAL SCHEDULES

Employer ID No: 13-5645888 Plan Number: 333
PENTEGRA DEFINED BENEFIT PLAN FOR FINANCIAL INSTITUTIONS Form 5500, Schedule H, Part IV, Line 4i - Schedule of Assets (Held at End of Year) As of June 30, 2016
- 22 -
(d) (e)
(a) Cost Current Value
Cusip Rate Maturity Par Value
* FEDERAL HOME LN BK CONS BD 3133XKQX6 4.875% 17-May-17 425,000$ 451,961$ 440,967$
* FEDERAL HOME LN BK CONS BD 3133XMQ87 5.000% 17-Nov-17 90,000 95,569 95,359
* FEDERAL HOME LN BK CONS BD 313379XK0 3.100% 29-Jun-32 2,000,000 2,086,800 2,138,260
FEDERAL FARM CR BK CONS BD 3133EA5P9 3.050% 19-Jul-32 3,775,000 3,866,355 4,018,412
FEDERAL FARM CR BK CONS BD 3133EC7M0 2.920% 17-Dec-30 4,500,000 4,341,195 4,768,290
FEDERAL FARM CR BK CONS BD 3133EEK74 2.680% 13-May-25 4,450,000 4,493,788 4,756,828
FEDERAL FARM CR BK CONS BD 3133EEL40 2.860% 18-May-27 5,000,000 4,974,250 5,341,950
FEDERAL FARM CR BK CONS BD 3133EEQA1 2.790% 17-Mar-28 3,000,000 2,991,540 3,200,460
FEDERAL FARM CR BK CONS BD 3133EEY20 2.400% 17-Jun-22 3,000,000 3,055,260 3,183,000
FEDERAL HOME LN MTG CORP 3134G7FY2 2.000% 29-Jul-20 5,000,000 5,000,000 5,006,050
FEDERAL HOME LN MTG CORP 3137EAAM1 5.000% 16-Feb-17 715,000 773,094 735,134
FEDERAL HOME LN MTG CORP 3137EABP3 4.875% 13-Jun-18 100,000 106,781 108,079
FEDERAL HOME LN MTG CORP STRIP 3134A4CP7 0.000% 15-Mar-31 10,000,000 5,647,400 6,756,800
FEDERAL HOME LN MTG CORP STRIP 3134A32L9 0.000% 15-Mar-27 7,468,000 5,659,995 5,837,736
FEDERAL JUDICIARY OFFICE BLDG 313490CD4 0.000% 15-Feb-20 8,615,000 857,633 8,052,441
FEDERAL JUDICIARY OFFICE BLDG 313490BW3 0.000% 15-Aug-16 8,265,000 1,074,779 8,255,330
FEDERAL NATL MTG ASSN 3135G0ZA4 1.875% 19-Feb-19 5,000,000 5,089,900 5,138,350
FEDERAL NATL MTG ASSN 31359MFJ7 7.125% 15-Jan-30 230,000 289,584 360,845
FEDERAL NATL MTG ASSN 31359MFP3 7.250% 15-May-30 205,000 262,080 326,094
FEDERAL NATL MTG ASSN 31364FCB5 6.090% 27-Sep-27 2,960,000 3,876,682 4,154,034
FEDERAL NATL MTG ASSN 31359MEL3 0.000% 1-Jun-17 5,000,000 4,939,150 4,971,900
FEDERAL NATL MTG ASSN STRIP 31364EAV6 0.000% 8-Oct-27 9,440,000 6,535,977 7,238,026
FEDERAL NATL MTG ASSN STRIP 31359YQK6 0.000% 15-Jul-32 5,000,000 2,275,000 3,152,700
FEDERAL NATL MTG ASSN STRIP 31359YCX3 0.000% 15-Jan-28 5,000,000 3,456,000 3,682,900
FEDERAL NATL MTG ASSN STRIP 31359YBF3 0.000% 15-May-28 5,000,000 3,555,250 3,643,100
FEDERAL NATL MTG ASSN STRIP 31358DDR2 0.000% 15-May-30 5,800,000 3,872,370 4,060,986
FEDERAL NATL MTG ASSN STRIP 31358C4Y9 0.000% 6-Aug-28 3,757,000 2,623,851 2,718,828
FEDERAL NATL MTG ASSN STRIP 31358C4X1 0.000% 6-Feb-28 1,700,000 1,229,338 1,288,481
FINANCING CORP STRIP 317705AA9 10.700% 6-Oct-17 2,000,000 2,162,500 2,254,280
FINANCING CORP STRIP 31771KAD9 0.000% 30-Nov-17 6,000,000 5,668,200 5,932,860
FINANCING CORP STRIP 31771EAM3 0.000% 6-Dec-18 9,200,000 3,271,922 9,018,668
FINANCING CORP STRIP 31771CEY7 0.000% 30-May-17 909,000 109,335 902,792
FINANCING CORP STRIP 31771CC45 0.000% 30-May-17 165,000 19,846 163,873
FINANCING CORP STRIP PO 31771KAA5 0.000% 26-Sep-19 5,000,000 4,700,620 4,849,250
ISRAEL ST AID 465139JE4 0.000% 15-May-23 3,059,000 2,539,704 2,683,783
RESOLUTION FDG CORP 761157AD8 8.875% 15-Jul-20 1,000,000 994,010 1,306,590
RESOLUTION FDG CORP PRIN STRIP 76116FAD9 0.000% 15-Jul-20 5,000,000 4,576,150 4,773,350
RESOLUTION FDG CORP STRIP 76116EGK0 0.000% 15-Jan-27 4,000,000 3,101,560 3,187,880
RESOLUTION FDG CORP STRIP 76116EHM5 0.000% 15-Apr-29 9,000,000 6,051,690 6,653,610
RESOLUTION FDG CORP STRIP 76116EHJ2 0.000% 15-Oct-27 8,615,000 6,134,788 6,590,647
RESOLUTION FDG CORP STRIP 76116EHH6 0.000% 15-Apr-27 5,000,000 3,860,000 3,887,300
(c)
Description of Investment Including (b)
Identity of Issuer, Borrower,
Lessor or Similar Party
Maturity Date, Rate of Interest,
Collateral, par or Maturity Value

Employer ID No: 13-5645888 Plan Number: 333
PENTEGRA DEFINED BENEFIT PLAN FOR FINANCIAL INSTITUTIONS Form 5500, Schedule H, Part IV, Line 4i - Schedule of Assets (Held at End of Year) As of June 30, 2016
- 23 -
(d) (e)
Cost Current Value
Cusip Rate Maturity Par Value
RESOLUTION FDG CORP STRIP 76116EGL8 0.000% 15-Jul-27 5,000,000$ 3,656,800$ 3,921,350$
SBA GTD PARTN CTFS 2013-20I 1 83162CVU4 3.620% 1-Sep-33 18,749,738 19,281,069 20,485,963
SBA GTD PARTN CTFS 2013-20J 1 83162CVV2 3.370% 1-Oct-33 4,139,836 4,199,993 4,421,800
SBA GTD PARTN CTFS 2013-20K 1 83162CVX8 3.380% 1-Nov-33 4,109,068 4,148,072 4,397,319
TENNESSEE VALLEY AUTH BD 880591DV1 4.700% 15-Jul-33 5,743,000 6,895,046 7,114,428
TENNESSEE VALLEY AUTH STRIP 88059FBG5 0.000% 1-May-30 1,100,000 697,345 729,355
TENNESSEE VALLEY AUTH STRIP 88059ESQ8 0.000% 1-May-30 1,400,000 886,200 928,270
TENNESSEE VALLEY AUTH STRIP 88059ENN0 0.000% 15-Jan-28 3,211,000 2,134,705 2,345,603
TENNESSEE VALLEY AUTH STRIP 88059E5L4 0.000% 15-Mar-33 3,000,000 1,788,000 1,822,950
TENNESSEE VALLEY AUTH STRIP 88059E5E0 0.000% 15-Mar-30 3,100,000 1,976,374 2,065,809
TENNESSEE VALLEY AUTH STRIP 88059EU85 0.000% 15-Jun-30 5,273,000 3,246,624 3,479,653
TENNESSEE VALLEY AUTH STRIP 88059EU77 0.000% 15-Dec-29 5,614,000 3,588,076 3,776,931
U S TREASURY BOND 912810DX3 7.500% 15-Nov-16 770,000 972,187 790,397
U S TREASURY BOND 912810EL8 8.000% 15-Nov-21 790,000 1,072,548 1,075,546
U S TREASURY BOND 912810EQ7 6.250% 15-Aug-23 750,000 892,852 1,005,263
U S TREASURY BOND 912810ET1 7.625% 15-Feb-25 240,000 326,025 362,016
U S TREASURY BOND 912810FB9 6.125% 15-Nov-27 125,000 149,336 184,521
U S TREASURY BOND 912810FM5 6.250% 15-May-30 300,000 367,078 471,552
U S TREASURY BOND 912810FP8 5.375% 15-Feb-31 675,000 745,031 1,001,133
U S TREASURY NOTE 912828GH7 4.625% 15-Feb-17 750,000 811,463 769,515
U S TREASURY NOTE 912828HA1 4.750% 15-Aug-17 980,000 1,065,444 1,025,746
U S TREASURY NOTE 912828HR4 3.500% 15-Feb-18 850,000 843,359 889,908
U S TREASURY NOTE 912828JH4 4.000% 15-Aug-18 445,000 455,916 477,418
U S TREASURY NOTE 912828JR2 3.750% 15-Nov-18 910,000 913,413 976,830
U S TREASURY NOTE 912828M64 1.250% 15-Nov-18 1,080,000 1,080,802 1,095,185
U S TREASURY NOTE 912828M72 0.875% 30-Nov-17 4,750,000 4,741,637 4,769,665
U S TREASURY NOTE 912828N22 1.250% 15-Dec-18 4,540,000 4,535,959 4,605,603
U S TREASURY NOTE 912828N55 1.000% 31-Dec-17 3,620,000 3,635,431 3,642,625
U S TREASURY NOTE 912828N97 0.592% 31-Jan-18 3,160,000 3,164,213 3,165,972
U S TREASURY NOTE 912828P20 0.750% 31-Jan-18 5,055,000 5,051,643 5,068,649
U S TREASURY NOTE 912828P53 0.750% 15-Feb-19 4,720,000 4,690,711 4,729,204
U S TREASURY NOTE 912828P95 1.000% 15-Mar-19 1,490,000 1,496,228 1,502,635
U S TREASURY NOTE 912828Q52 0.875% 15-Apr-19 4,200,000 4,190,332 4,220,034
U S TREASURY NOTE 912828R85 0.875% 15-Jun-19 4,355,000 4,377,626 4,376,601
U S TREASURY NOTE 912828TS9 0.625% 30-Sep-17 5,290,000 5,282,521 5,294,973
U S TREASURY NOTE 912828UU2 0.750% 31-Mar-18 4,360,000 4,341,592 4,371,903
U S TREASURY NOTE 912828XF2 1.125% 15-Jun-18 705,000 707,145 712,078
U S TREASURY NOTE 912828XP0 0.625% 31-Jul-17 1,345,000 1,343,124 1,346,318
US TREAS-CPI INFLAT 912828UX6 0.125% 15-Apr-18 4,211,962 4,283,949 4,274,467
TOTAL US GOVERNMENT SECURITIES 295,349,603 240,707,772 273,331,409
Lessor or Similar Party Collateral, par or Maturity Value
(c)
(b) Description of Investment Including
Identity of Issuer, Borrower, Maturity Date, Rate of Interest,

Employer ID No: 13-5645888 Plan Number: 333
PENTEGRA DEFINED BENEFIT PLAN FOR FINANCIAL INSTITUTIONS Form 5500, Schedule H, Part IV, Line 4i - Schedule of Assets (Held at End of Year) As of June 30, 2016
- 24 -
(d) (e)
(a) Cost Current Value
Cusip Rate Maturity Par Value
AARP INC/DC 144A 00036AAB1 7.500% 1-May-31 5,000,000$ 6,703,200$ 7,224,850$
AIG LIFE HOLDINGS INC 00138GAA7 8.500% 1-Jul-30 9,282,000 12,711,804 12,058,432
ALBANIA GOVERNMENT INTERNATION NA4075274 0.000% 31-Aug-25 10,000,000 6,900,000 7,500,000
ALTRIA GROUP INC 02209SAD5 9.700% 10-Nov-18 4,000,000 5,273,800 4,766,040
AMERICA MOVIL SAB DE CV 02364WBD6 3.125% 16-Jul-22 8,000,000 7,863,920 8,208,160
AMERIPRISE FINANCIAL INC 03076CAD8 7.300% 28-Jun-19 5,000,000 6,198,450 5,796,400
AMGEN INC 031162BN9 3.625% 15-May-22 5,000,000 5,202,400 5,381,350
AMGEN INC 031162BQ2 2.125% 15-May-17 2,000,000 2,018,000 2,016,680
ANTHEM INC 94973VBH9 2.250% 15-Aug-19 5,000,000 4,974,150 5,044,550
ANTHEM INC 94973VBJ5 3.500% 15-Aug-24 6,000,000 5,959,719 6,211,920
ASSOCIATES CORP OF NORTH AMERI 046003JU4 6.950% 1-Nov-18 5,000,000 5,075,200 5,565,500
ASTRAZENECA PLC 046353AD0 6.450% 15-Sep-37 70,000 77,236 95,544
AT&T INC 00206RCY6 5.200% 15-Mar-20 4,500,000 5,037,525 5,034,330
ATLANTIC MARINE CORPS COM 144A 048677AC2 5.373% 1-Dec-50 3,820,546 3,753,801 3,959,995
AURORA MILITARY HOUSING L 144A 05178RAB1 5.625% 15-Dec-35 5,000,000 5,331,050 5,425,000
AURORA MILITARY HOUSING L 144A 05178TAA9 5.820% 15-Jul-34 2,500,000 2,761,300 2,738,750
BANK OF AMERICA CORP 060505DA9 5.420% 15-Mar-17 5,000,000 4,549,850 5,140,500
BANK OF AMERICA CORP 06053FAA7 4.100% 24-Jul-23 5,000,000 5,217,550 5,356,700
BANK OF AMERICA CORP 638585AP4 7.250% 15-Oct-25 5,300,000 5,978,382 6,496,528
BARCLAYS BANK PLC NIKKEI 225 INDX & JAP YEN ELN 06738KGD7 0.000% 12-Apr-17 5,000,000 5,000,000 6,309,500
BECTON DICKINSON AND CO 075887BF5 3.734% 15-Dec-24 3,000,000 3,116,970 3,231,420
BELVOIR LAND LLC 144A 081331AE0 5.300% 15-Dec-35 2,682,510 2,810,519 2,897,352
BERKSHIRE HATHAWAY FINANCE COR 084664BQ3 4.250% 15-Jan-21 3,000,000 3,142,500 3,336,540
BERKSHIRE HATHAWAY FINANCE COR 084664BZ3 2.900% 15-Oct-20 2,000,000 2,083,380 2,123,480
BERKSHIRE HATHAWAY FINANCE COR 084664CG4 1.700% 15-Mar-19 3,000,000 3,028,710 3,049,020
BLACKROCK INC 09247XAH4 4.250% 24-May-21 8,000,000 8,812,600 8,975,040
BLACKROCK INC 09247XAJ0 3.375% 1-Jun-22 5,000,000 5,241,950 5,432,400
BLACKSTONE HOLDINGS FINAN 144A 09256BAB3 5.875% 15-Mar-21 7,000,000 7,090,580 8,202,320
BRANCH BANKING & TRUST CO 07330NAG0 1.050% 1-Dec-16 3,000,000 3,000,900 3,002,430
BRISTOL-MYERS SQUIBB CO 110122AT5 2.000% 1-Aug-22 5,000,000 4,685,850 5,075,950
BRITISH TELECOMMUNICATIONS PLC 111021AE1 9.375% 15-Dec-30 325,000 440,566 500,721
CANADIAN PACIFIC RAILWAY CO 136440AL8 9.450% 1-Aug-21 1,250,000 1,424,061 1,641,113
CARDINAL HEALTH INC 14149YAY4 3.200% 15-Mar-23 9,125,000 9,104,685 9,519,383
CATERPILLAR FINANCIAL SERVICES 14912L5F4 2.850% 1-Jun-22 5,000,000 4,993,700 5,232,900
CATERPILLAR INC 149123CC3 3.400% 15-May-24 10,000,000 10,417,050 10,747,000
CBS CORP 124857AM5 3.700% 15-Aug-24 5,000,000 4,921,800 5,221,600
CHARLES SCHWAB CORP/THE 808513AM7 3.450% 13-Feb-26 5,000,000 5,010,350 5,332,500
CIBOLO CANYONS SPECIAL IM 144A 69342WAB7 3.000% 20-Aug-20 5,888,942 5,881,581 5,874,220
CITICORP LEASE PASS-THROU 144A 17305BAB7 8.040% 15-Dec-19 10,000,000 11,411,500 11,745,900
CITIGROUP INC 172967AM3 6.875% 1-Jun-25 6,000,000 7,515,510 7,489,680
CITIGROUP INC 172967GS4 1.750% 1-May-18 4,000,000 4,009,680 4,017,600
Lessor or Similar Party Collateral, par or Maturity Value
(c)
(b) Description of Investment Including
Identity of Issuer, Borrower, Maturity Date, Rate of Interest,

Employer ID No: 13-5645888 Plan Number: 333
PENTEGRA DEFINED BENEFIT PLAN FOR FINANCIAL INSTITUTIONS Form 5500, Schedule H, Part IV, Line 4i - Schedule of Assets (Held at End of Year) As of June 30, 2016
- 25 -
(d) (e)
(a) Cost Current Value
Cusip Rate Maturity Par Value
COMCAST CABLE HOLDINGS LLC 879240AQ2 10.125% 15-Apr-22 2,500,000$ 2,857,925$ 3,386,000$
COMMONWEALTH EDISON CO 202795HS2 6.150% 15-Sep-17 3,000,000 3,369,900 3,180,270
CONTINENTAL AIRLINES 2000-2 CL 210805DD6 7.707% 2-Oct-22 2,814,734 2,935,767 3,069,748
COVENTRY HEALTH CARE INC 222862AJ3 5.450% 15-Jun-21 3,000,000 3,500,850 3,423,540
CSX TRANSPORTATION INC 126410LK3 9.750% 15-Jun-20 1,512,000 1,518,940 1,929,614
CVS HEALTH CORP 126650BH2 5.750% 1-Jun-17 3,000,000 3,282,660 3,128,310
CVS HEALTH CORP 126650BJ8 6.250% 1-Jun-27 5,000,000 6,418,990 6,200,600
CVS HEALTH CORP 126650CH1 1.900% 20-Jul-18 5,000,000 5,067,500 5,075,650
DOUBLELINE OPPORTUNISTIC FUND 999Z89702 0.000% 0-Jan-00 87,653 100,000,000 124,872,618
DUKE ENERGY FLORIDA LLC 341099CB3 5.900% 1-Mar-33 1,335,000 1,657,763 1,675,225
EBAY INC 278642AL7 3.450% 1-Aug-24 8,000,000 7,977,030 8,177,280
ELECTRICITE DE FRANCE SA 144A 268317AB0 6.500% 26-Jan-19 5,000,000 5,755,000 5,619,250
EXELON GENERATION CO LLC 30161MAJ2 5.750% 1-Oct-41 167,000 186,594 173,152
FINIAL HOLDINGS INC 989822AA9 7.125% 15-Oct-23 4,193,000 5,043,844 5,026,946
FISHERS LANE ASSOCIATES L 144A 33803WAB5 5.477% 5-Aug-40 13,250,000 13,565,293 15,644,275
FISHERS LANE LLC 144A 33804JAA5 2.029% 5-Apr-17 9,000,000 9,000,000 9,000,000
FLORIDA POWER & LIGHT CO 341081EP8 5.850% 1-Feb-33 3,883,000 4,837,014 4,973,541
FORT BENNING FAMILY COMMU 144A 346845AK6 6.090% 15-Jan-51 4,740,000 4,610,274 4,799,250
FORT EUSTIS/FORT STORY HO 144A 347314BF2 5.510% 15-Dec-40 5,000,000 5,448,850 5,338,200
FORT IRWIN LAND LLC 144A 347466AC8 5.170% 15-Dec-35 10,890,000 11,500,602 12,000,236
FORT KNOX MILITARY HOUSIN 144A 347508AA1 5.815% 15-Feb-52 9,896,800 11,213,174 11,502,259
GENERAL AMERICAN LIFE INS 144A 368770AA1 7.625% 15-Jan-24 5,000,000 4,172,550 6,218,900
GENERAL MILLS INC 370334BT0 3.650% 15-Feb-24 8,000,000 8,218,080 8,732,480
GENERAL MILLS INC 370334BV5 2.200% 21-Oct-19 5,000,000 4,994,150 5,119,950
GEORGIA-PACIFIC LLC 373298BP2 7.250% 1-Jun-28 5,104,000 6,964,867 7,025,911
GEORGIA-PACIFIC LLC 373298BR8 7.750% 15-Nov-29 4,247,000 6,152,374 6,151,185
GMAC COMMERCIAL MO BLIS A 144A 36186XAD9 5.174% 10-Jul-50 2,000,000 1,955,000 2,090,000
GMAC COMMERCIAL MO PRES A 144A 36186EAA7 6.240% 10-Oct-41 15,330,495 17,584,555 17,706,722
GOLDMAN SACHS GROUP INC/THE 38141EC23 3.850% 8-Jul-24 5,000,000 4,997,850 5,301,550
GOLDMAN SACHS GROUP INC/THE 38141GGQ1 5.250% 27-Jul-21 5,000,000 5,640,100 5,642,400
GOLDMAN SACHS GROUP INC/THE 38141GVM3 4.000% 3-Mar-24 5,000,000 5,136,800 5,345,350
HOME DEPOT INC/THE 437076AZ5 2.700% 1-Apr-23 4,000,000 4,053,720 4,197,000
HOME DEPOT INC/THE 437076BC5 3.750% 15-Feb-24 5,000,000 5,261,150 5,604,550
HP COMMUNITIES LLC 144A 44329HAJ3 5.780% 15-Mar-46 11,000,000 11,097,790 12,578,500
INTEL CORP 458140AM2 2.700% 15-Dec-22 5,000,000 5,028,050 5,231,000
INTEL CORP 458140AN0 4.000% 15-Dec-32 6,700,000 6,985,156 7,248,395
INTEL CORP 458140AR1 3.100% 29-Jul-22 5,000,000 5,124,800 5,353,650
INTERNATIONAL BANK FOR RECONST 45905UBH6 0.000% 1-May-30 5,000,000 3,435,150 3,424,800
INTERNATIONAL BUSINESS MACHINE 459200AM3 7.000% 30-Oct-25 20,000 23,334 27,191
JBG/ROCKVILLE NCI CAMPUS 144A 46611JAB8 6.100% 15-Jul-33 4,000,000 4,700,000 5,093,320
Lessor or Similar Party Collateral, par or Maturity Value
(c)
(b) Description of Investment Including
Identity of Issuer, Borrower, Maturity Date, Rate of Interest,
Employer ID No: 13-5645888 Plan Number: 333
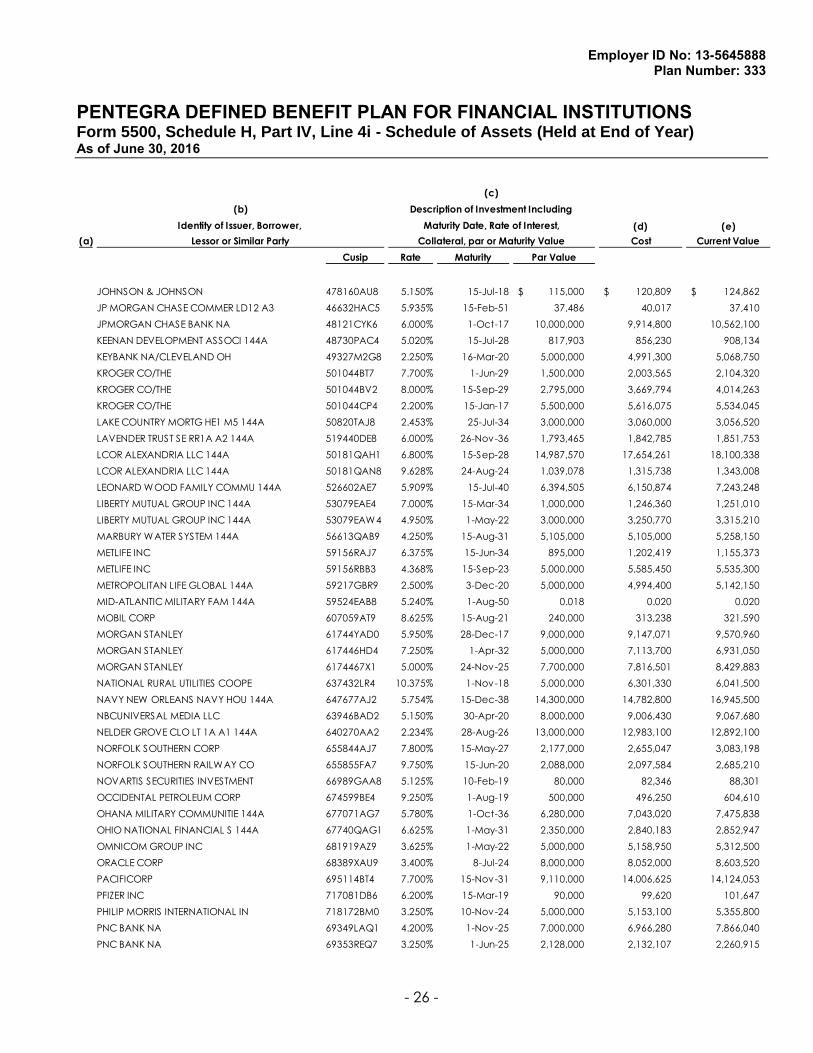
PENTEGRA DEFINED BENEFIT PLAN FOR FINANCIAL INSTITUTIONS Form 5500, Schedule H, Part IV, Line 4i - Schedule of Assets (Held at End of Year) As of June 30, 2016
- 26 -
(d) (e)
(a) Cost Current Value
Cusip Rate Maturity Par Value
JOHNSON & JOHNSON 478160AU8 5.150% 15-Jul-18 115,000$ 120,809$ 124,862$
JP MORGAN CHASE COMMER LD12 A3 46632HAC5 5.935% 15-Feb-51 37,486 40,017 37,410
JPMORGAN CHASE BANK NA 48121CYK6 6.000% 1-Oct-17 10,000,000 9,914,800 10,562,100
KEENAN DEVELOPMENT ASSOCI 144A 48730PAC4 5.020% 15-Jul-28 817,903 856,230 908,134
KEYBANK NA/CLEVELAND OH 49327M2G8 2.250% 16-Mar-20 5,000,000 4,991,300 5,068,750
KROGER CO/THE 501044BT7 7.700% 1-Jun-29 1,500,000 2,003,565 2,104,320
KROGER CO/THE 501044BV2 8.000% 15-Sep-29 2,795,000 3,669,794 4,014,263
KROGER CO/THE 501044CP4 2.200% 15-Jan-17 5,500,000 5,616,075 5,534,045
LAKE COUNTRY MORTG HE1 M5 144A 50820TAJ8 2.453% 25-Jul-34 3,000,000 3,060,000 3,056,520
LAVENDER TRUST SE RR1A A2 144A 519440DE8 6.000% 26-Nov-36 1,793,465 1,842,785 1,851,753
LCOR ALEXANDRIA LLC 144A 50181QAH1 6.800% 15-Sep-28 14,987,570 17,654,261 18,100,338
LCOR ALEXANDRIA LLC 144A 50181QAN8 9.628% 24-Aug-24 1,039,078 1,315,738 1,343,008
LEONARD WOOD FAMILY COMMU 144A 526602AE7 5.909% 15-Jul-40 6,394,505 6,150,874 7,243,248
LIBERTY MUTUAL GROUP INC 144A 53079EAE4 7.000% 15-Mar-34 1,000,000 1,246,360 1,251,010
LIBERTY MUTUAL GROUP INC 144A 53079EAW4 4.950% 1-May-22 3,000,000 3,250,770 3,315,210
MARBURY WATER SYSTEM 144A 56613QAB9 4.250% 15-Aug-31 5,105,000 5,105,000 5,258,150
METLIFE INC 59156RAJ7 6.375% 15-Jun-34 895,000 1,202,419 1,155,373
METLIFE INC 59156RBB3 4.368% 15-Sep-23 5,000,000 5,585,450 5,535,300
METROPOLITAN LIFE GLOBAL 144A 59217GBR9 2.500% 3-Dec-20 5,000,000 4,994,400 5,142,150
MID-ATLANTIC MILITARY FAM 144A 59524EAB8 5.240% 1-Aug-50 0.018 0.020 0.020
MOBIL CORP 607059AT9 8.625% 15-Aug-21 240,000 313,238 321,590
MORGAN STANLEY 61744YAD0 5.950% 28-Dec-17 9,000,000 9,147,071 9,570,960
MORGAN STANLEY 617446HD4 7.250% 1-Apr-32 5,000,000 7,113,700 6,931,050
MORGAN STANLEY 6174467X1 5.000% 24-Nov-25 7,700,000 7,816,501 8,429,883
NATIONAL RURAL UTILITIES COOPE 637432LR4 10.375% 1-Nov-18 5,000,000 6,301,330 6,041,500
NAVY NEW ORLEANS NAVY HOU 144A 647677AJ2 5.754% 15-Dec-38 14,300,000 14,782,800 16,945,500
NBCUNIVERSAL MEDIA LLC 63946BAD2 5.150% 30-Apr-20 8,000,000 9,006,430 9,067,680
NELDER GROVE CLO LT 1A A1 144A 640270AA2 2.234% 28-Aug-26 13,000,000 12,983,100 12,892,100
NORFOLK SOUTHERN CORP 655844AJ7 7.800% 15-May-27 2,177,000 2,655,047 3,083,198
NORFOLK SOUTHERN RAILWAY CO 655855FA7 9.750% 15-Jun-20 2,088,000 2,097,584 2,685,210
NOVARTIS SECURITIES INVESTMENT 66989GAA8 5.125% 10-Feb-19 80,000 82,346 88,301
OCCIDENTAL PETROLEUM CORP 674599BE4 9.250% 1-Aug-19 500,000 496,250 604,610
OHANA MILITARY COMMUNITIE 144A 677071AG7 5.780% 1-Oct-36 6,280,000 7,043,020 7,475,838
OHIO NATIONAL FINANCIAL S 144A 67740QAG1 6.625% 1-May-31 2,350,000 2,840,183 2,852,947
OMNICOM GROUP INC 681919AZ9 3.625% 1-May-22 5,000,000 5,158,950 5,312,500
ORACLE CORP 68389XAU9 3.400% 8-Jul-24 8,000,000 8,052,000 8,603,520
PACIFICORP 695114BT4 7.700% 15-Nov-31 9,110,000 14,006,625 14,124,053
PFIZER INC 717081DB6 6.200% 15-Mar-19 90,000 99,620 101,647
PHILIP MORRIS INTERNATIONAL IN 718172BM0 3.250% 10-Nov-24 5,000,000 5,153,100 5,355,800
PNC BANK NA 69349LAQ1 4.200% 1-Nov-25 7,000,000 6,966,280 7,866,040
PNC BANK NA 69353REQ7 3.250% 1-Jun-25 2,128,000 2,132,107 2,260,915
Lessor or Similar Party Collateral, par or Maturity Value
(c)
(b) Description of Investment Including
Identity of Issuer, Borrower, Maturity Date, Rate of Interest,

Employer ID No: 13-5645888 Plan Number: 333
PENTEGRA DEFINED BENEFIT PLAN FOR FINANCIAL INSTITUTIONS Form 5500, Schedule H, Part IV, Line 4i - Schedule of Assets (Held at End of Year) As of June 30, 2016
- 27 -
(d) (e)
(a) Cost Current Value
Cusip Rate Maturity Par Value
PNC FINANCIAL SERVICES GROUP I 693476BF9 6.700% 10-Jun-19 5,000,000$ 5,975,100$ 5,733,100$
PNC FINANCIAL SERVICES GROUP I 693476BN2 3.300% 8-Mar-22 5,000,000 5,141,950 5,317,550
PRIVATE EXPORT FUNDING CORP 742651DR0 2.050% 15-Nov-22 5,000,000 4,878,118 5,149,900
PROCTER & GAMBLE CO/THE 742718DN6 4.700% 15-Feb-19 130,000 130,936 142,492
PRUDENTIAL FINANCIAL INC 74432QAH8 5.400% 13-Jun-35 6,919,000 7,891,811 7,842,825
PSEG POWER LLC 69362BAJ1 8.625% 15-Apr-31 4,000,000 5,698,400 5,005,320
PUBLIC SERVICE CO OF OKLAHOMA 744533BJ8 6.625% 15-Nov-37 5,000,000 6,502,750 6,402,500
RIO TINTO FINANCE USA LTD 767201AD8 7.125% 15-Jul-28 500,000 617,788 634,715
ROYAL BANK OF CANADA 78008S7D2 2.200% 27-Jul-18 7,000,000 7,129,360 7,137,480
ROYAL BANK OF CANADA 78010UNX1 1.200% 23-Jan-17 5,000,000 5,009,800 5,007,700
SOUTHERN CALIFORNIA EDISON CO 842400ES8 6.000% 15-Jan-34 3,000,000 3,975,960 3,970,290
STATOIL ASA 656531AC4 7.750% 15-Jun-23 100,000 116,246 132,680
TOPAZ SOLAR FARMS LLC 144A 89054XAA3 5.750% 30-Sep-39 5,517,246 5,741,025 6,282,267
TOWD POINT MORTGAGE 5 A1B 144A 89171VAK3 2.750% 25-May-55 8,924,566 8,974,768 9,035,320
TRANSALTA CORP 89346DAC1 6.900% 15-May-18 6,000,000 5,989,740 6,167,700
UNITED TECHNOLOGIES CORP 913017AT6 6.700% 1-Aug-28 50,000 52,937 67,458
UNITED TECHNOLOGIES CORP 913017BV0 3.100% 1-Jun-22 8,000,000 8,316,950 8,527,520
UNITEDHEALTH GROUP INC 91324PBT8 3.375% 15-Nov-21 5,000,000 5,302,950 5,396,500
UNITEDHEALTH GROUP INC 91324PBZ4 2.750% 15-Feb-23 5,000,000 5,024,500 5,139,650
UNITEDHEALTH GROUP INC 91324PCP5 3.750% 15-Jul-25 5,000,000 5,359,800 5,485,600
US BANCORP 91159HHC7 3.000% 15-Mar-22 8,000,000 8,160,050 8,508,800
US BANCORP 91159HHG8 3.700% 30-Jan-24 3,000,000 3,149,280 3,300,030
USF&G CAPITAL III 144A 90330SAA8 8.312% 1-Jul-46 1,536,500 2,081,917 2,057,035
VALIDUS HOLDINGS LTD 91915WAB8 8.875% 26-Jan-40 2,000,000 2,490,244 2,746,620
VELOCITY COMMERCIAL 1 AFL 144A 92258MAA5 0.029179 25-Jun-45 7,469,874 7,535,235 7,507,223
VERIZON COMMUNICATIONS INC 92343VBR4 5.150% 15-Sep-23 5,000,000 5,706,000 5,823,150
VERIZON COMMUNICATIONS INC 92343VBZ6 5.050% 15-Mar-34 5,000,000 5,514,700 5,549,500
VERIZON COMMUNICATIONS INC 92343VCH5 2.625% 21-Feb-20 5,000,000 5,059,750 5,174,350
VERIZON COMMUNICATIONS INC 92343VCQ5 4.400% 1-Nov-34 4,300,000 4,409,994 4,433,945
WACHOVIA BANK COMMERCIA C28 A4 92978MAE6 5.572% 15-Oct-48 3,670,151 3,957,455 3,668,830
WACHOVIA CORP 337358BH7 7.574% 1-Aug-26 4,000,000 5,046,840 5,209,480
WAL-MART STORES INC 931142BF9 7.550% 15-Feb-30 6,000,000 8,578,020 9,153,120
WAL-MART STORES INC 931142DP5 3.300% 22-Apr-24 4,000,000 4,144,760 4,381,840
WALT DISNEY CO/THE 25468PCW4 2.350% 1-Dec-22 4,000,000 3,965,240 4,135,400
WALT DISNEY CO/THE 25468PDF0 3.150% 17-Sep-25 5,000,000 5,298,950 5,528,000
WASTE MANAGEMENT INC 902917AH6 7.000% 15-Jul-28 7,661,000 9,491,558 10,433,286
WELLS FARGO & CO 94974BFJ4 3.450% 13-Feb-23 5,000,000 5,006,700 5,173,650
WELLS FARGO & CO 94974BGA2 3.300% 9-Sep-24 11,000,000 10,871,580 11,537,130
WELLTOWER INC 42217KBC9 4.500% 15-Jan-24 2,500,000 2,630,800 2,710,925
Lessor or Similar Party Collateral, par or Maturity Value
(c)
(b) Description of Investment Including
Identity of Issuer, Borrower, Maturity Date, Rate of Interest,

Employer ID No: 13-5645888 Plan Number: 333
PENTEGRA DEFINED BENEFIT PLAN FOR FINANCIAL INSTITUTIONS Form 5500, Schedule H, Part IV, Line 4i - Schedule of Assets (Held at End of Year) As of June 30, 2016
- 28 -
(d) (e)
(a) Cost Current Value
Cusip Rate Maturity Par Value
WFRBS COMMERCIAL MO C4 A2 144A 92936CAC3 3.45% 15-Jun-44 152,404$ 154,690$ 152,335$
XLIT LTD 98372PAK4 6.25% 15-May-27 6,633,000 7,977,575 7,981,290
TOTAL CORPORATE DEBT INSTRUMENTS 786,501,428 947,935,381 1,005,233,408
CALIFORNIA ST UNIV REVENUE 13077CTM6 6.43% 1-Nov-30 6,800,000 8,943,836 9,059,436
CMWLTH FING AUTH PA 20281PCT7 6.22% 1-Jun-39 5,350,000 6,530,157 6,752,182
CONTRA COSTA CA CMNTY CLG DIST 212204FA4 6.50% 1-Aug-34 1,905,000 2,425,903 2,622,156
DIST OF COLUMBIA REVENUE 25483VEC4 7.63% 1-Oct-35 9,510,000 11,664,360 10,643,117
EL PASO TX 283734JD4 6.02% 15-Aug-35 3,000,000 3,526,710 3,830,040
HOUSTON TX HGR EDU FIN CORP 442378EG6 8.75% 15-May-26 2,060,000 2,451,400 2,594,755
IRVINE RANCH CA WTR DIST 4636324P1 6.62% 1-May-40 5,300,000 6,927,563 7,442,525
LA PAZ CNTY AZ INDL DEV AUTH I 50375EAP6 5.20% 1-Dec-16 350,000 358,309 352,408
LA PAZ CNTY AZ INDL DEV AUTH I 50375EAQ4 5.75% 1-Dec-17 250,000 258,308 255,818
LA PAZ CNTY AZ INDL DEV AUTH I 50375EAR2 6.00% 1-Dec-18 400,000 416,520 416,708
LA PAZ CNTY AZ INDL DEV AUTH I 50375EAS0 6.25% 1-Dec-19 375,000 393,803 398,314
LA PAZ CNTY AZ INDL DEV AUTH I 50375EAT8 5.40% 1-Dec-20 935,000 935,000 943,724
LA PAZ CNTY AZ INDL DEV AUTH I 50375EAU5 5.75% 1-Dec-21 700,000 700,000 712,383
LA PAZ CNTY AZ INDL DEV AUTH I 50375EAV3 5.95% 1-Dec-22 1,205,000 1,205,000 1,234,016
LA PAZ CNTY AZ INDL DEV AUTH I 50375EBB6 6.90% 1-Dec-34 4,100,000 4,034,564 4,179,212
LA PAZ CNTY AZ INDL DEV AUTH I 50375EBC4 7.00% 1-Dec-40 4,500,000 4,420,755 4,564,215
MET TRANSPRTN AUTH NY REVENUE 59259YGF0 6.81% 15-Nov-40 3,500,000 4,478,145 5,099,815
NEW JERSEY ST ECON DEV AUTH LE 645913AA2 7.43% 15-Feb-29 5,000,000 6,412,739 6,182,650
NEW YORK NY 64966HYE4 5.02% 1-Mar-22 2,000,000 2,199,360 2,344,920
NEW YORK NY 64966HYM6 5.97% 1-Mar-36 3,430,000 4,274,740 4,672,380
NEW YORK NY 64966LYY1 3.60% 1-Aug-28 10,000,000 9,982,440 10,377,400
NEW YORK CITY NY HSG DEV CORP 64966NAB3 6.17% 1-Jun-36 5,785,000 7,073,493 6,999,850
NEW YORK CITY NY TRANSITIONAL 64971WFJ4 2.85% 1-Aug-22 4,000,000 4,070,920 4,244,640
NEW YORK CITY NY TRANSITIONAL 64971WVD9 3.16% 1-Aug-25 5,000,000 4,979,100 5,331,350
NEW YORK ST URBAN DEV CORP REV 650035S74 1.04% 15-Mar-17 4,000,000 3,997,520 4,008,440
NEW YORK ST URBAN DEV CORP REV 650035TD0 5.77% 15-Mar-39 5,105,000 6,338,215 6,545,325
NEW YORK ST TRANSPRTN DEV CORP 650116BH8 3.47% 1-Jul-28 7,000,000 7,152,320 7,248,430
NEW YORK ST TRANSPRTN DEV CORP 650116BJ4 3.57% 1-Jul-29 2,975,000 3,046,549 3,090,400
OGLETHORPE GA PWR CORP 67704LAA9 5.53% 1-Jan-35 19,500,000 21,480,070 22,521,915
PORT AUTH OF NEW YORK & NEW JE 73358WUG7 3.77% 15-Oct-27 7,455,000 7,626,912 7,981,398
TEXAS ST PUBLIC FIN AUTH CHRT 88276PCH7 8.13% 15-Feb-27 9,235,000 10,915,404 11,784,414
TEXAS ST PUBLIC FIN AUTH CHRT 88276PDD5 7.50% 15-Aug-30 1,000,000 1,085,000 1,084,890
TUCSON AZ COPS 898735PQ2 6.75% 1-Jul-30 5,000,000 6,223,950 6,453,250
VIRGIN ISLANDS PUBLIC FIN AUTH 927676RZ1 5.25% 1-Oct-27 4,300,000 4,454,757 4,750,081
Lessor or Similar Party Collateral, par or Maturity Value
(c)
(b) Description of Investment Including
Identity of Issuer, Borrower, Maturity Date, Rate of Interest,

Employer ID No: 13-5645888 Plan Number: 333
PENTEGRA DEFINED BENEFIT PLAN FOR FINANCIAL INSTITUTIONS Form 5500, Schedule H, Part IV, Line 4i - Schedule of Assets (Held at End of Year) As of June 30, 2016
- 29 -
(d) (e)
(a) Cost Current Value
Cusip Rate Maturity Par Value
TOTAL STATE AND MUNICIPAL SECURITIES 151,025,000$ 170,983,822$ 176,722,557$
FARM CREDIT BANK OF TEXAS 30767E307 0.00 15,000 18,692,850 17,779,688
FIRSTAR REALTY LLC 144A 33765A202 0.00 1,000 914,950 1,239,375
TOTAL PREFERRED 16,000 19,607,800 19,019,063
ENTREPRENEUR US ALL CAP-INST 293828505 12,981,053 129,434,609 126,175,831
ENTREPRENEUR US LRG CAP-RTL 293828604 7,553,378 75,551,981 80,443,475
ENTREPRENEURSHARES GLBL-INST 293828208 279,590 3,000,000 3,301,957
TOTAL MUTUAL FUNDS 20,814,021 207,986,590 209,921,263
3M CO 88579Y101 400 28,690 70,048
FS BANCORP/LAGRANGE IN 30262T106 16,896 760,320 1,119,360
FORTRESS TRANSPORTATION & INFR 34960P101 1,602,471 26,048,166 14,726,708
GOLUB CAPITAL BDC INC 38173M102 1,398,076 21,299,382 25,263,233
TOTAL EQUITY- COMMON STOCKS 3,017,843 48,136,558 41,179,350
A & M CAPITAL PARTNERS LP 99VVAXFT8 13,025,688 9,911,200 13,025,688
AEA MEZZANINE FUND III LP 99VVAVPT1 7,195,107 7,221,154 7,195,107
ARCLIGHT ENERGY PARTNERS FD VI 99VVA61H8 10,134,775 10,418,235 10,134,775
BISON CAPITAL PARTNERS IV L.P 99VVAVP04 9,619,950 7,040,928 9,619,950
CENTERFIELD CAPITAL PARTNERS 99VVAPLN1 7,896,790 8,174,381 7,896,790
DC CAPITAL PARTNERS FUND II 99VVBBUX9 3,210,616 3,457,573 3,210,616
DYAL II PENSION INVESTORS LP 99VVA3GR7 7,657,333 9,354,864 7,657,333
DYAL III PENSION INVESTORS LP 99VVA6A88 8,857,391 8,732,340 8,857,391
DYAL OFFSHORE INVESTORS LP 99VVAKWD2 12,528,098 14,857,911 12,528,098
GOLDPOINT PARTNERS 99VVAZEX5 14,771,111 10,990,815 14,771,111
GOLUB CAPITAL INVESTMENT 99VVA3H70 3,333,333 50,000,000 50,000,000
HARBERT MEZZANINE PARTNERS III 99VVA3K68 8,882,804 10,268,756 8,882,804
HIGHSTAR CAPITAL GP IV L.P. 99VVALMM1 18,811,121 18,058,339 18,811,121
ICG NORTH AMERICAN PRIVATE 99VVA0Q50 5,034,865 4,958,809 5,034,865
LOVELL MINNICK EQUITY PARTNERS 99VVA49P7 3,393,461 3,609,365 3,393,461
MEDLEY OPPORTUNIFY FUND II L P 99VVAT3G8 13,980,120 15,498,052 13,980,120
MIDOCEAN TACTICAL CREDIT FUND 99VVBCB75 4,470,779 4,481,127 4,470,779
MML CAPITAL PARTNERS FUND VI EX99WH5L2 3,527,109 4,089,276 3,918,442
MONARCH CAPITAL PARTNERS 99VVA3K50 16,905,411 16,692,693 16,905,411
MORGAN STANLEY IFHF SPV LP 99VVAJMK0 420,671 172,049 420,671
NB SECONDARY OPPORTUNITIES 99VVAXKM7 8,796,798 7,117,830 8,796,798
NB STRATEGIC CO-INVESTMENT PARTNERS II LP 99VVATAM7 13,531,823 12,693,128 13,531,823
NB STRATEGIC CO-INVESTMENT PARTNERS III LP 99VVA6634 1,845,360 1,976,844 1,845,360
NEW CANAAN FUNDING MEZZANINE V 99VVAPLZ4 6,075,833 8,447,851 6,075,833
NEW CANAAN FUNDING MEZZANINE VI 99VVA8BY6 1,355,422 1,422,894 1,355,422
Lessor or Similar Party Collateral, par or Maturity Value
(c)
(b) Description of Investment Including
Identity of Issuer, Borrower, Maturity Date, Rate of Interest,

Employer ID No: 13-5645888 Plan Number: 333
PENTEGRA DEFINED BENEFIT PLAN FOR FINANCIAL INSTITUTIONS Form 5500, Schedule H, Part IV, Line 4i - Schedule of Assets (Held at End of Year) As of June 30, 2016
- 30 -
(d) (e)
(a) Cost Current Value
Cusip Rate Maturity Par Value
NYLCAP MEZZANINE PARTNERS III 999313315 23,175,643$ 24,324,251$ 23,175,643$
PEP HY CITE HOLDING L P 99VVAZSG7 8,661,523 9,420,790 8,661,523
PWP GROWTH EQUITY FUND 1 LP 99VVA1RP3 23,692,249 19,425,485 23,692,249
RCP DIRECT II FEEDER LTD 99VVA08C5 9,987,915 9,780,000 9,987,915
RCP FUND VIII FEEDER LTD 99VVAT3F0 7,820,596 6,750,000 7,820,596
RCP SOF II FEEDER LP 99VVAR422 8,910,898 7,943,748 8,910,898
RFE INVT PARTNERS VIII L P 99VVATNT8 10,364,169 9,278,532 10,364,169
STIEVEN FINANCIAL OFFSHORE 99VVAQ9L7 2,444 4,000,000 6,845,011
TRILANTIC CAPITAL PARTNERS V 99VVAQC33 10,673,595 11,429,057 10,673,595
TRINITY HUNT PARTNERS IV LP 99VVATGT6 19,121,537 14,754,640 19,121,537
VCFA PRIVATE EQUITY PART IV LP 99VVABVY7 621,198 3,013,144 621,198
VCFA VENTURE PARTNERS III LP 999058266 590,771 2,622,435 590,771
TOTAL PRIVATE EQUITY 328,883,947 372,388,496 382,784,874
BEACON CAPITAL STRATEGIC 99VVA8CL3 6,241,378 5,884,548 6,241,378
MORGAN STANLEY RE III - INTL 99VVABVW1 53,618 1,418,726 53,618
OAKTREE RE VI CAYMAN 99VVAXF84 21,194,820 16,729,024 21,294,225
SENTINEL REAL ESTATE FUND 999178023 604 39,350,443 49,718,599
TOTAL REAL ESTATE FUNDS 27,490,420 63,382,741 77,307,820
BLACKROCK EAFE EQUITY INDEX 999G05866 144,677 20,922,069 29,179,545
BLACKROCK EQUITY INDEX FUND 99VVAHQK0 246,920 138,161,042 179,904,889
BLACKROCK INT TERM CREDIT BD 999F25668 2,016,323 96,479,579 107,639,410
BLACKROCK INTERMEDIATE 999G05841 170,095 4,501,358 5,630,868
BLACKROCK LONG TERM CREDIT BD 999G05874 1,192,228 88,689,969 96,946,959
BLACKROCK RUSSELL 1000 VALUE 99VVAHQL8 679,974 36,616,581 70,864,477
BLACKROCK RUSSELL 2000 EQUITY 999G05858 1,203,690 13,871,185 45,608,886
BLACKROCK RUSSELL 2000 GROWTH 99VVALMN9 1,231,915 25,420,955 40,027,120
SSGA S & P 500 FLAGSHIP 999G05833 280,772 97,232,500 137,602,463
SSGA 20+ YEAR HIGH QUALITY US 999G36978 4,622,383 61,717,901 70,426,623
SSGA 5-20 YEAR HIGH QUALITY US 999G36960 7,591,628 85,461,909 101,803,726
SSGA LONG CREDIT INDEX 999G05825 1,068,650 36,527,669 43,984,553
SSGA RUSSELL 2000 GROWTH FUND 99VVALMP4 636,223 12,914,140 19,928,416
SSGA S&P MIDCAP 400 INDEX NL 99VVAQ9F0 317,156 45,353,482 65,397,203
Lessor or Similar Party Collateral, par or Maturity Value
(c)
(b) Description of Investment Including
Identity of Issuer, Borrower, Maturity Date, Rate of Interest,

Employer ID No: 13-5645888 Plan Number: 333
PENTEGRA DEFINED BENEFIT PLAN FOR FINANCIAL INSTITUTIONS Form 5500, Schedule H, Part IV, Line 4i - Schedule of Assets (Held at End of Year) As of June 30, 2016
- 31 -
(d) (e)
(a) Cost Current Value
Cusip Rate Maturity Par Value
* BNY EB TEMP INV FD 996115960 44,713,479$ 44,713,479$ 44,713,479$
TOTAL COMMON COLLECTIVE 66,116,113 808,583,818 1,059,658,617
BAR HARBOR BK & TR CO ME CD 0.60% 11-Oct-16 100,000 100,000 100,000
EVERBANK JACKSONVILLE FLA CD 0.75% 16-Feb-17 100,000 100,000 100,000
GOLDMAN SACHS BANK CD 0.60% 11-Aug-16 100,000 100,000 100,000
SANTANDER BANK CD 0.95% 24-Aug-17 100,000 100,000 100,000
WELLS FARGO BK CD 0.90% 12-May-17 100,000 100,000 100,000
TOTAL CERTIFICATE OF DEPOSITS 500,000 500,000 500,000
PEOPLES UNITED BANK 21,797 21,797
TOTAL INTEREST BEARING CASH 21,797 21,797
TOTAL INVESTMENTS 3,245,680,159$
* PARTY-IN-INTEREST
Lessor or Similar Party Collateral, par or Maturity Value
(c)
(b) Description of Investment Including
Identity of Issuer, Borrower, Maturity Date, Rate of Interest,

Employer ID No: 13-5645888 Plan Number: 333
PENTEGRA DEFINED BENEFIT PLAN FOR FINANCIAL INSTITUTIONS Form 5500, Schedule H, Part IV, Line 4j - Schedule of Reportable Transactions For the year ended June 30, 2016
- 32 -
(h)
(a) (b) (c) (d) (e) (f) (g) Current Value of (i)
Identity of Description of Purchase Selling Lease Number of Expense Incurred Cost of Asset on Transaction Net Gain or
Party Involved Asset Price Price Rental Transactions with Transaction Asset Date (Loss)
Series in the Same Security
Bank of New York-Mellon BNY Mellon Cash Reserve 174,803,242$ N/A - $ 128$ - $ - $ 174,803,242$ - $
Bank of New York-Mellon BNY Mellon Cash Reserve N/A 174,803,242 - 127 - 174,803,242 174,803,242 -
Bank of New York-Mellon BNY EB TEMP INV FD 780,307,063 N/A - 400 - - 780,307,063 -
Bank of New York-Mellon BNY EB TEMP INV FD N/A 787,247,746 - 319 - 787,247,746 787,247,746 -