Public Disclosure Authorized UNIVERSAL HEALTH COVERAGE...
42
UNIVERSAL HEALTH COVERAGE STUDY SERIES No. 27 Please cite this paper as: Lavado, R., Hayrapetyan, S., and Kharazyan, S. 2018. “Expansion of the Benefits Package: The Experience of Armenia ”. Universal Health Care Coverage Series No. 27, World Bank Group, Washington, DC. Public Disclosure Authorized Public Disclosure Authorized Public Disclosure Authorized Public Disclosure Authorized
-
Upload
hoangkhanh -
Category
Documents
-
view
222 -
download
0
Transcript of Public Disclosure Authorized UNIVERSAL HEALTH COVERAGE...

UNIVERSAL HEALTH COVERAGE STUDY SERIES No. 27
Please cite this paper as: Lavado, R., Hayrapetyan, S., and Kharazyan, S. 2018. “Expansion of the Benefits Package: The Experience of Armenia”. Universal Health Care Coverage Series No. 27, World Bank Group, Washington, DC.
Pub
lic D
iscl
osur
e A
utho
rized
Pub
lic D
iscl
osur
e A
utho
rized
Pub
lic D
iscl
osur
e A
utho
rized
Pub
lic D
iscl
osur
e A
utho
rized

2
3
UNIVERSAL HEALTH COVERAGE STUDY SERIES No. 27
Expansion of the Benefits Package:
The Experience of Armenia
Rouselle F. Lavado, Susanna Hayrapetyan and Samvel Kharazyan
The World Bank, Washington, DC, 2018

4
ABBREVIATIONS AND ACRONYMS
ADB
AMD
BBP
BOR
BTR
Asian Development Bank
Armenian Dram
Basic Benefit Package
Bed Occupancy Rates
Bed Turnover Rates
DRG Diagnosis Related Group
FBP Family Benefit Program
GDP Gross Domestic Product
HFMIS
ICD
ILCS
Health Financing Management Information System
International Classification of Diseases
Integrated Living Conditions Survey
MDG Millennium Development Goals
MOH Ministry of Health
MOF Ministry of Finance
MTEF Medium Term Expenditure Framework
NCD
NHS
Non-Communicable Diseases
National Health Service
OOP Out-of-Pocket
PBF Performance Based Financing
PHC Primary Health Care
SDGs Sustainable Development Goal
SHA State Health Agency
SHAIE State Hygiene and Anti-Epidemic Inspectorate
UHC
USAID
WHO
Universal Health Coverage
United States Agency for International Development
World Health Organization

5
Contents
Preface to the second round of the Universal Health Coverage Study Series ............................. 7
Acknowledgement ....................................................................................................................... 8
About the Authors ....................................................................................................................... 9
Executive Summary ................................................................................................................... 10
1. Introduction ........................................................................................................................ 11
2. Overview of Armenia’s Health System ............................................................................. 12
3. The Basic Benefit Package ................................................................................................ 19
4. Sustainability of BBP amidst Economic, Epidemiologic, and Demographic Challenges . 27
5. Pending Agenda ................................................................................................................. 31
Table of Annexes
Annex 1: Additional Tables and Figures ...................................................................................... 36
Annex 2: List of Poor, Vulnerable and Special Categories .......................................................... 39
Table of Tables
Table 1. Inpatient and Outpatient Utilization, 2014 ..................................................................... 15
Table 2. Outpatient BBP Coverage ............................................................................................... 22
Table 3. BBP Inpatient Care Coverage ......................................................................................... 24
Table 4. Data on BBP Coverage .................................................................................................. 26
Table 5. Catastrophic and Impoverishing Expenditures .............................................................. 28
Table 6. Outline of Pabón Lasso Diagram .................................................................................... 33
Table of Figures
Figure 1. Health’s Share of Government Expenditures, Selected Countries, 2014 ...................... 12
Figure 2. Armenia’s Health Financing Sources, 2004-2014 ......................................................... 13

6
Figure 3. Flow of Funds ............................................................................................................... 14
Figure 4. Health Financing Transition in Armenia, 1995-2014................................................... 15
Figure 5. Outpatient contacts for Armenia and Comparison Countries ........................................ 17
Figure 6. Hospital Beds and Physicians per 1000, 1980-2014 ..................................................... 18
Figure 7. OOP as % of Total Health Expenditure vs. Income (2014) .......................................... 27
Figure 8. Per Capita Expenditure, Gross and Net of Health Spending ......................................... 29
Figure 9. Armenia’s Growing NCD Burden ................................................................................. 30
Figure 10. GDP in Armenia is Projected to Fall ........................................................................... 31
Figure 11. Distribution of Disabled Categories 2 and 3 ............................................................... 32
Figure 12. Armenia Benchmarked against European Average in 2014 ........................................ 33
Figure 13. Pabón Lasso for Armenian Marzes (2015) .................................................................. 34

7
Preface to the second round of the Universal Health Coverage Study Series
All over the world countries are implementing pro-poor reforms to advance universal health
coverage. The widespread trend to expand coverage resulted in the inclusion of the “achieving
universal health coverage by 2030” target in the Sustainable Development Agenda. Progress is
monitored through indicators measuring gains in financial risk protection and in access to quality
essential health-care services.
The Universal Health Coverage (UHC) Studies Series was launched in 2013 with the objective of
sharing knowledge regarding pro-poor reforms advancing UHC in developing countries. The
series is aimed at policy-makers and UHC reform implementers in low- and middle-income
countries. The Series recognizes that there are many policy paths to achieve UHC and therefore
does not endorse a specific path or model.
The Series consists of country case studies and technical papers. The case studies employ a
standardized approach aimed at understanding the tools –policies, instruments and institutions-
used to expand health coverage across three dimensions: population, health services and
affordability. The approach relies on a protocol involving around 300 questions structured to
provide a detailed understanding of how countries are implementing UHC reforms in the following
areas:
• Progressive Universalism: expanding population coverage while ensuring that the poor
and vulnerable are not left behind;
• Strategic Purchasing: expanding the statutory benefits package and developing incentives
for its effective delivery by health-care providers;
• Raising revenues to finance health care in fiscally sustainable ways;
• Improving the availability and quality of health-care providers; and,
• Strengthening accountability to ensure the fulfillment of promises made between
citizens, governments and health institutions.
By 2017, the Series had published 24 country case studies and conducted a systematic literature
review on the impact of UHC reforms. In 2018 the Series will publish an additional15 case studies,
A book analyzing and comparing the initial 24 country case studies is also available: Going
Universal: How 24 Developing Countries are Implementing UHC Reforms from the Bottom Up.
Links to the Series and the book are included below.
Daniel Cotlear, D. Phil.
Manager and Editor
Universal Health Coverage Study Series
Links:
http://www.worldbank.org/en/topic/health/publication/universal-health-coverage-study-series
http://www.worldbank.org/en/topic/universalhealthcoverage/publication/going-universal-how-
24-countries-are-implementing-universal-health-coverage-reforms-from-bottom-up

8
Acknowledgement
The authors would like to thank Aneesa Arur, Owen Smith, Somil Nagpal, Gabriel Francis, Lire
Ersado, Daniel Cotlear, Moritz Meyer, Matteo Morgandi, Laura Bailey, Mercy Miyang Tembon,
Enis Baris, and participants from the Author’s Workshop for their helpful comments.
9
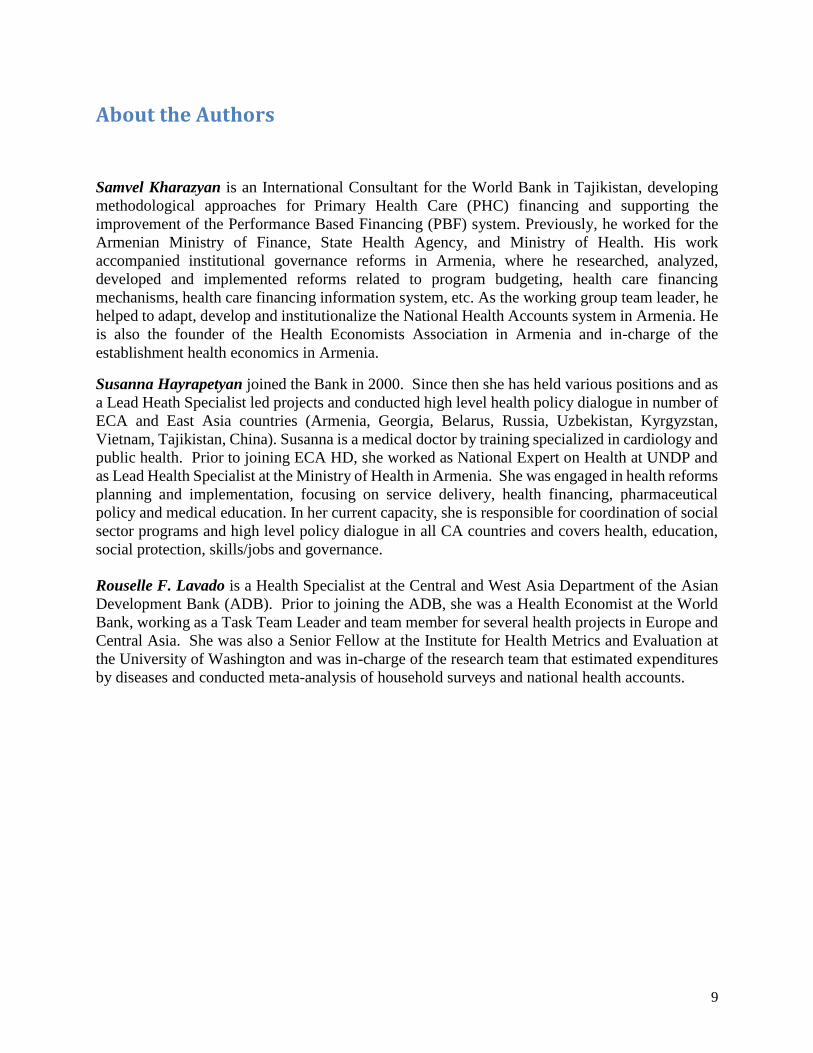
About the Authors
Samvel Kharazyan is an International Consultant for the World Bank in Tajikistan, developing
methodological approaches for Primary Health Care (PHC) financing and supporting the
improvement of the Performance Based Financing (PBF) system. Previously, he worked for the
Armenian Ministry of Finance, State Health Agency, and Ministry of Health. His work
accompanied institutional governance reforms in Armenia, where he researched, analyzed,
developed and implemented reforms related to program budgeting, health care financing
mechanisms, health care financing information system, etc. As the working group team leader, he
helped to adapt, develop and institutionalize the National Health Accounts system in Armenia. He
is also the founder of the Health Economists Association in Armenia and in-charge of the
establishment health economics in Armenia.
Susanna Hayrapetyan joined the Bank in 2000. Since then she has held various positions and as
a Lead Heath Specialist led projects and conducted high level health policy dialogue in number of
ECA and East Asia countries (Armenia, Georgia, Belarus, Russia, Uzbekistan, Kyrgyzstan,
Vietnam, Tajikistan, China). Susanna is a medical doctor by training specialized in cardiology and
public health. Prior to joining ECA HD, she worked as National Expert on Health at UNDP and
as Lead Health Specialist at the Ministry of Health in Armenia. She was engaged in health reforms
planning and implementation, focusing on service delivery, health financing, pharmaceutical
policy and medical education. In her current capacity, she is responsible for coordination of social
sector programs and high level policy dialogue in all CA countries and covers health, education,
social protection, skills/jobs and governance.
Rouselle F. Lavado is a Health Specialist at the Central and West Asia Department of the Asian
Development Bank (ADB). Prior to joining the ADB, she was a Health Economist at the World
Bank, working as a Task Team Leader and team member for several health projects in Europe and
Central Asia. She was also a Senior Fellow at the Institute for Health Metrics and Evaluation at
the University of Washington and was in-charge of the research team that estimated expenditures
by diseases and conducted meta-analysis of household surveys and national health accounts.

10
Executive Summary
The legacy of the Semashko system left Armenia with an oversized and overstaffed health system.
Beginning in the 1990s the country focused on re-designing its health system in an attempt to
rationalize resources. In order to improve the efficiency, access and quality of health care service
provision, the Government undertook supply-side reforms. These reforms included: (a)
strengthening Primary Health Care (PHC) provision; (b) downsizing excess hospital capacity; and,
(c) changing provider payment mechanisms and introducing a purchaser-provider split.
Armenia introduced the Basic Benefit Package (BBP) in 1999 for the socially vulnerable
population to target the so-called socially important diseases. The package utilizes public
resources to finance, through provider contracts, PHC and emergency services for all Armenian
citizens, with co-payment exemptions for the poor and vulnerable. In addition, selected inpatient
services are provided for free for the poor, vulnerable and other specific categories.
Unfortunately, low public health spending levels and incomplete demand-side health financing
reform have resulted in serious shortcomings in financial risk protection outcomes. Armenia’s
public health financing is among the lowest in the region. High co-payments for BBP covered
services, lack of in-patient care coverage for the non-vulnerable population and outpatient
pharmaceuticals for all, have resulted in household out-of-pocket (OOP) spending being the
predominant source of financing for health in the country. As Armenia is grappling with an aging
society and a health care system struggling to adjust to morbidity and mortality epidemiological
changes, its path to Universal Health Coverage (UHC) requires increased funding from
prepaid//pooled sources in order to sustain and make further progress on improving population
health outcomes and financial risk protection.
11
1. Introduction
1. With a Gross National Income per capita of US$4,020, Armenia is classified as a lower
middle-income country, ranked next to El Salvador, Kosovo, Samoa, and Tunisia. A commitment
to UHC is enshrined in the country’s constitution. Armenia has already attained some of the key
health-related Sustainable Development Goals (SDGs), with some of the country’s health
outcomes closer to those of higher income countries: life expectancy is 75 years; the maternal
mortality ratio is 25 per 100,000 live births; the neonatal mortality rate is 7 per 1,000 live births,
and the under-five mortality is 14 per 1,000 live births.
2. Nevertheless, the country’s health system faces several challenges. In recent years,
improvements in population health outcomes have been slower than in neighboring countries.
Achievement of UHC implies access to quality health services when needed for the entire
population without facing undue financial hardship in the process: improvements in both service
coverage and financial coverage. Armenia fares poorly with regard to the latter. Recent reforms
have resulted in a system where general government revenue-financed public spending for health
provides extensive coverage through a BBP of essential health services. However, its public
financing for health is among the lowest in the region. Co-payments for services covered under
BBP as well as lack of coverage for expensive aspects of health care, in particular hospital care
and outpatient pharmaceuticals, have resulted in OOP spending by households – a generally
inefficient and inequitable modality -- being the predominant source of financing for health in the
country. High levels of OOP spending increase the risk of households impoverishment when faced
with significant health spending, and reduce the potential redistributive capacity of the health
financing system.
3. In addition, the country faces significant demographic challenges that will impact health
spending patterns. While the total population is projected to decrease slightly by 2030, the share
aged 65+ is set to rise from 10 to almost 20 percent of the total population by 2030. This
demographic shift and other associated factors suggest that Armenia will have to reduce its reliance
on OOP health spending and increase public health financing in order to sustain and improve
population health outcomes and achieve UHC.
4. This paper examines the Armenian health system, with a focus on the BBP program. It
takes stock of implemented reforms and analyzes the pending agenda. The paper is organized as
follows. Section 2 provides a general overview of Armenia’s health system, focusing on financing
and health service delivery. Section 3 describes the BBP program including its institutional
architecture, beneficiary targeting, BBP services and fund management, and related information
dissemination. Section 4 discusses the sustainability of the BBP program amidst economic,
epidemiologic, and demographic challenges. The last section focuses on the pending agenda
related to targeting, integrated care, and coverage of the non-vulnerable population.

12
2. Overview of Armenia’s Health System
5. Total health expenditure per capita in Armenia was US$162 in 2014, approximately 4.5
percent of Gross Domestic Product (GDP). Health’s share of government expenditure was about
7 percent in 2014, lower than the global average (Figure 1). In 2014, 39 percent of total health
expenditure was sourced from public spending, 8 percent from international loans and grants and
the Armenian diaspora and 51 percent from household OOP. Resources from employers in the
form of voluntary health insurance accounted for only 2 percent of total health expenditure (see
Figure 2).
Figure 1. Health’s Share of Government Expenditures, Selected Countries, 2014
Source: World Health Organization (WHO) Global Health Expenditure Database 2016.
0
5
10
15
Health as % of total goverment expenditure
Global unweighted average: 11.8 percent

13
Figure 2. Armenia’s Health Financing Sources, 2004-2014
Source: Armenia National Health Accounts, various years.
6. OOP household spending remains the largest source of health financing in Armenia. While
the proportion has decreased from a peak of 77 percent in 2000, at 51 percent it remains
significantly higher than for countries within a similar socioeconomic context. Further reductions
are unlikely unless there is a significant increase in public funding to cover essential health services
or/and a reduction in treatment costs through efficiency gains in payment mechanisms.
7. Figure 3 illustrates the financing flows in Armenia’s health system. Government funds
from general taxation are transferred to various programs, which are managed by the State Hygiene
and Anti-Epidemic Inspectorate (SHAIE), State Health Agency (SHA), and other Ministry of
Health (MOH) subordinates. Budgets are set with the Ministry of Finance (MOF) during the
budget cycle, creating the basis for the annually prepared Medium-Term Expenditure Framework
(MTEF). Nearly all of the publicly sourced funds come from the central government, with barely
0.1 percent deriving from local government budgetary contributions in 2012.
24% 27%34% 36% 39% 39% 37%
45%38% 37% 39%
0%0%
0%0%
0% 0%0%
1%
1% 3%2%
68% 60%52% 48%
51% 52% 55%47%
54% 53% 51%
7%13% 14% 15%
10% 8% 7% 8% 6% 8% 8%
0%
10%
20%
30%
40%
50%
60%
70%
80%
90%
100%
2004 2005 2006 2007 2008 2009 2010 2011 2012 2013 2014
Rest of the World
Households out of pocket payments
Resources of employers/privateventures
Public Spending

14
Figure 3. Flow of Funds
Source: WHO, Armenia: Health in Transition, 2011.
8. Non-poor patients pay considerably more OOP for health services compared to the poor
and extremely poor patients (according to the Integrated Living Conditions Survey (ILCS) 2014
on average they paid Armenian Dram (AMD) 3548, 1320 and 562, respectively). The differences
partly reflect the financial protection for the poor and vulnerable provided by the BBP (also called
state certificate programs). This will be discussed in detail in the next section.
9. Since the mid-1990s total health spending rose rapidly while external financing declined,
widening the financing gap that has largely been filled through OOP payments, currently
accounting for approximately 50 percent of total health spending. OOP payments are made up of
formal co-payments for services under the BBP, direct payments for services not covered by the
BBP (most notably hospital care for non-vulnerable and outpatient pharmaceuticals for all
population) and informal payments.

15
Figure 4. Health Financing Transition in Armenia, 1995-2014
10. Armenia’s public health system focuses on the control of communicable diseases. SHAEI
is responsible for disease notification and surveillance as well as the coordination of prevention
activities, health education, prevention of population safety hazards, etc. Starting in 2012, the
health sector expanded its focus to include non-communicable diseases.
Table 1. Inpatient and Outpatient Utilization, 2014
Source of raw data: ILCS, 2014.
Consumption
Decile
% which utilized
PHC facilities in past
month
% which went to hospitals
for outpatient care in the
past year
% which were admitted to a
hospital for inpatient care at least
once in the past year
Poorest 1 4.1 4.1 3.7
2 6.6 4.6 3.6
3 5.2 4.5 4.0
4 5.7 5.2 3.5
5 8.0 6.4 5.2
6 8.1 7.4 5.1
7 8.9 5.9 3.8
8 9.8 6.7 4.4
9 11.1 8.3 5.2
Richest 10 13.6 11.6 6.8
Total 8.1 6.5 4.5
16
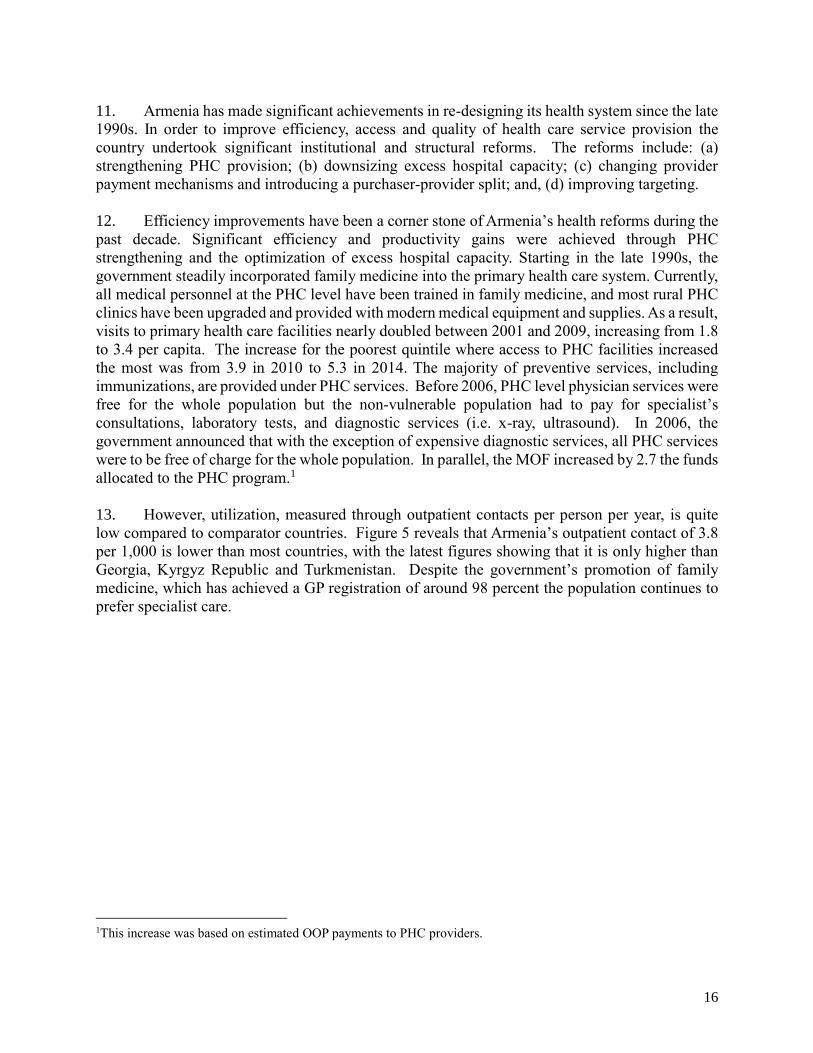
11. Armenia has made significant achievements in re-designing its health system since the late
1990s. In order to improve efficiency, access and quality of health care service provision the
country undertook significant institutional and structural reforms. The reforms include: (a)
strengthening PHC provision; (b) downsizing excess hospital capacity; (c) changing provider
payment mechanisms and introducing a purchaser-provider split; and, (d) improving targeting.
12. Efficiency improvements have been a corner stone of Armenia’s health reforms during the
past decade. Significant efficiency and productivity gains were achieved through PHC
strengthening and the optimization of excess hospital capacity. Starting in the late 1990s, the
government steadily incorporated family medicine into the primary health care system. Currently,
all medical personnel at the PHC level have been trained in family medicine, and most rural PHC
clinics have been upgraded and provided with modern medical equipment and supplies. As a result,
visits to primary health care facilities nearly doubled between 2001 and 2009, increasing from 1.8
to 3.4 per capita. The increase for the poorest quintile where access to PHC facilities increased
the most was from 3.9 in 2010 to 5.3 in 2014. The majority of preventive services, including
immunizations, are provided under PHC services. Before 2006, PHC level physician services were
free for the whole population but the non-vulnerable population had to pay for specialist’s
consultations, laboratory tests, and diagnostic services (i.e. x-ray, ultrasound). In 2006, the
government announced that with the exception of expensive diagnostic services, all PHC services
were to be free of charge for the whole population. In parallel, the MOF increased by 2.7 the funds
allocated to the PHC program.1
13. However, utilization, measured through outpatient contacts per person per year, is quite
low compared to comparator countries. Figure 5 reveals that Armenia’s outpatient contact of 3.8
per 1,000 is lower than most countries, with the latest figures showing that it is only higher than
Georgia, Kyrgyz Republic and Turkmenistan. Despite the government’s promotion of family
medicine, which has achieved a GP registration of around 98 percent the population continues to
prefer specialist care.
1This increase was based on estimated OOP payments to PHC providers.

17
Figure 5. Outpatient contacts for Armenia and Comparison Countries
Source: WHO Health for All 2016
14. Hospitals reduced existing excess capacity through hospital mergers, downsizing of bed
capacity and elimination of redundant spaces and service. Between 2005 and 2011, Armenia
achieved a 40 percent reduction in public hospitals, a process that is still ongoing. To support
hospital capacity optimization, the government invested in hospital modernization and on training
clinical staff on clinical case-management. In addition, hospitals have been granted greater
decision-making autonomy, in particular with respect to expenditures and staffing decisions.
15. Hospital care continues to dominate the national health system, absorbing 42.3 percent of
the annual budget in 2012, compared with 37.2 percent for primary care. While the primary care
budget appears high when compared to other countries in the region, the Armenian figure includes
spending on specialists based in multi-profile polyclinics. Hospital capacity, measured in terms of
the number of beds and facilities in the country, has fallen considerably since independence, from
9.1 hospital beds available (per 1,000 people) in 1990 to 3.9 in 2012 (see Figure 6). This is low
compared to other countries of the former Soviet Union. The reduction in available beds was
supported through the reform of purchasing mechanisms oriented toward outputs instead of inputs.
Bed occupancy rates have improved to 62.2 percent in 2013 from a low of 28.21 percent in 2000
(WHO Health for All Database). The average length of stay in acute care hospitals, 6.5 days in
2013, has also declined significantly from 14 days in 1995. Despite having attained the minimum
WHO norm for aggregate numbers of workers, the key health human resource issue is the unequal
health personnel distribution across regions (marzes).

18
Figure 6. Hospital Beds and Physicians per 1000, 1980-2014
Source: World Development Indicators Database
16. The introduction of a purchaser-provider split significantly changed the financing of
Armenia’s health care system. The State Health Agency, established in 1998, is responsible for
contracting health care providers and paying them based on the volume of work performed.
Provider payment mechanisms were reformed to introduce capitation plus performance incentives
(in 2010) for general practitioners and family doctors, while hospital financing has been
transformed from inefficient input-based line-item budgeting to an output-based combination of
global budget, fee-for-service, and case-based payments for hospitals.
17. The provider payment reforms were accompanied with the establishment of a Health
Financing Management Information System (HFMIS) labeled MIDAS. MIDAS allows for data
collection on population enrollment and patient encounter and registers the chronically ill patients.
The e-Hospital system supports data collection on patient services delivered by hospitals. Both
systems are technically, organizationally and institutionally well implemented, and virtually work
in all health facilities. The systems generate a variety of predefined reports on performance
indicators, registered cases, distribution of funds, expenses, etc., while also allowing for more
flexible online reporting.
18. Following the post-independence public service decentralization, operation and ownership
of most primary care services and hospitals was devolved to regional and local governments. Local
governments can make health personnel employment decisions, while resource financial
management and procurement are managed by the facilities upon agreement with local
government authorities.

19
3. The Basic Benefit Package
19. Following the collapse of the Soviet Union, the government realized that it could not afford
the old Semashko system, which guaranteed free primary, secondary and tertiary medical services
to the entire population. The Semashko system resulted in the over-construction of facilities and
over-hiring of staff since financial flows were related to norms rather than actual health system
demand. In order to rationalize resource use, the government decided to earmark budgetary
resources as a means of targeting the socially vulnerable population and the so-called socially
important diseases. The budget funds PHC services and emergency services for all Armenian
citizens, with co-payments (typically 50 percent of the cost) for some services and exemptions or
reduced co-payments for the poor and vulnerable (see Table 1 for details).2 In addition, inpatient
services are provided for free (exceptions include high-tech health care services) for the poor,
vulnerable and special categories.3 This program is called the BBP.4
20. The BBP was instituted via the State Health Targeting Program (AL-139) that was enacted
on 30 December 2000 and became effective January 16, 2001. Before the law was enacted,
between 1997 and 2000, the government issued yearly decrees outlining the BBP’s implementation
rules. Initial mistrust in the system due to significant arrears to facilities (in 1999) caused by the
absence of volume controls and an economic downturn was overcome following enactment of the
law, which assured facility payments and improved the BBP program’s legitimacy.
21. In the second half of 2000 global budgeting was implemented, which instituted the
maximum amount of contract per facility. Starting in 2001, the government also started to
implement program budgeting, while the BBP program became a protected budget item. In
addition, in partnership with the World Bank, two working groups were created in 2000 in charge
of optimizing facility plans, global budget rules and regulations, and centralizing the procurement
of medicines.
22. The BBP is periodically reviewed, with the range of services and/or population groups
covered being extended or reduced, depending on the level of funding available.
23. Targeting. There are 29 categories of individuals who qualify for BBP coverage, ranging
from the disabled, children under 7, pregnant women, and anyone who qualifies for the Family
2 The co-payment schedule in Armenia is expressed as a flat fee rather than as a percent of the cost. The fee differs
depending on treatment complication, geographic location and type of service. There are four fee steps for surgeries,
for instance, depending on the level of complication. The co-payment for the first level of complication is 50,000
drams for marzes, 80,000 drams for Yerevan patients and 120,000 drams for specialized services (like abdominal-
reconstruction surgery, regardless of geographic location of hospitals). For the highest-level complication, the co-
payment is 2.5 times more. Regardless of complication, the amount that SHA reimburses to facilities is 107,900 drams
and 217,900 drams (for specialized services like abdominal-reconstruction surgery). Hence, co-payment rates can
range from 46% to 137%. 3 Decree N 318-N dated March 4, 2004 defines the list of socially vulnerable and special groups of the population.
These categories are occasionally revised, and are available in the State Orders. The latest version is available in
http://moh.am/OrenqGorcox/MAR-1515.pdf. 4 HiT 2013 section 3.3.1, and interview with officials in Armenia.
20
Benefit Program (FBP). Annex 2 includes the complete list of qualifying categories as well as the
differences in coverage and co-payment schedules for various groups.
24. The FBP was introduced in 1999 as a social assistance program that provides unconditional
cash transfers to the poor.5 Households applying to receive FBP payments, must apply to the
Regional Centers for Social Services, which rate them based on estimated income, social category,
disability level, housing status, etc.6 Households whose score exceed the qualifying cutoff (in 2014
lowered to 30 from 36 to expand coverage) are eligible to receive free inpatient care under the
BBP.7 8
25. BBP beneficiaries do not need to be specially registered or have an associated ID card since
they should already have documents demonstrating their BBP affiliation provided by other
ministries (for example, the disabled have a Certificate of Disability, and Family Benefit Program
recipients have a document from the Regional Centers for Social Services). When beneficiaries
receive a hospitalization referral or visit a PHC facility or hospital, they must present documents
demonstrating their vulnerable status. There are no costs associated with this certification method
for the beneficiaries, however there are cost implications for medical facilities since they have to
copy patient registration forms and maintain the electronic registration system.9
26. Purchasing services. The MOH contracts all health facilities through the SHA, which is
in charge of paying the facilities and monitoring their reports. SHA purchases BBP from almost
all public and private providers in Armenia. The MOH approves the participation of the health
facilities in the BBP following an annual application submission. Some providers, such as rural
PHC facilities, do not need to submit applications and are automatically included. There are two
sets of regulations guiding facilities: PHC providers are under a simple regulation scheme while
hospitals are under a more complicated one. Two to three providers lost the right to participate in
the BBP during the last few years due to fraud and poor service quality.
27. Budgeting. The BBP budget is based on a medium-term expenditure framework that
stipulates the level of government health expenditures as percent of GDP.10 The MTEF is used in
the establishment of the state budget, which is approved by the Parliament. Program budgets, and
in turn the benefit package, are established from the state budget. Delivery of the benefit package
is monitored over the course of the year, with the monitoring reports used when preparing the
following year MTEF.
28. Each year each health program is allocated a budget. Currently, the BBP includes 25 health
programs that funnel money through the facilities; there are six outpatient programs, 18 inpatient
5 FBP Evaluation, 2016 p.7. The name of the program has been changed to “Family living standards enhancement
benefits” but is still commonly referred to as the FBP. 6 FBP Evaluation 2016, p.7-8. 7 Angel-Urdinola and Jain, 2006 Appendix, gives the FBP formula. 8 Higher score signifies higher vulnerability. 9 Estimated annual cost for facilities is about 30 million AMD. 10 MTEF for 2014-2025 is in decree N442-N (03/27/14). MTEF figures are indicative and can be changed depending
on economic conditions.
21
programs, and one for both.11 Facilities draw down their funds from the health programs where
annually a global budget is set for all facilities. For each program, the annual resources allocated
are divided into equal monthly installments. If the facility provides services beyond the maximum
amount estimated for the month, the excess utilization is subtracted from the following month’s
budget. Two or three times a year, the SHA rebalances the facilities global budget to reflect actual
cases/services. Facilities that provided more services than calculated may receive additional
resources depending on budget availability and subject to MOF and Prime Minister approval.
29. The budget is determined using the PHC registered population and cash flow projections
(for inpatient services). Since PHC providers are paid through capitation, each patient must
register to its PHC facility in order to receive the capitated rate. Facilities are required to report to
the SHA actual services delivered, though the agency does not verify service delivery, except for
those under the Performance Based Financing (PBF) project..12
30. A case-based payment system, introduced in 1999, is used to pay hospitals. Providers
report individual cases to the SHA, which then annually audits a number of facilities. ICD
(International Classification of Diseases) codes are used to record every case but SHA pays using
locally developed codes (a grouping of related ICD codes). The value of different services is
formulated by the SHA using: daily hospital costs, average length of stay for a particular service
and the service complication coefficient.13 Program budget items are paid to facilities through the
treasury system.
31. BBP programs report their budget execution to the MOF. The MOH has an online portal,
which includes program information utilization, facility budgets, etc. The data generated and
collected through the portal is used to improve program performance; such as when in 2010 the
Working Group used utilization data from the SHA database to determine that the packages with
low volumes should be eliminated.
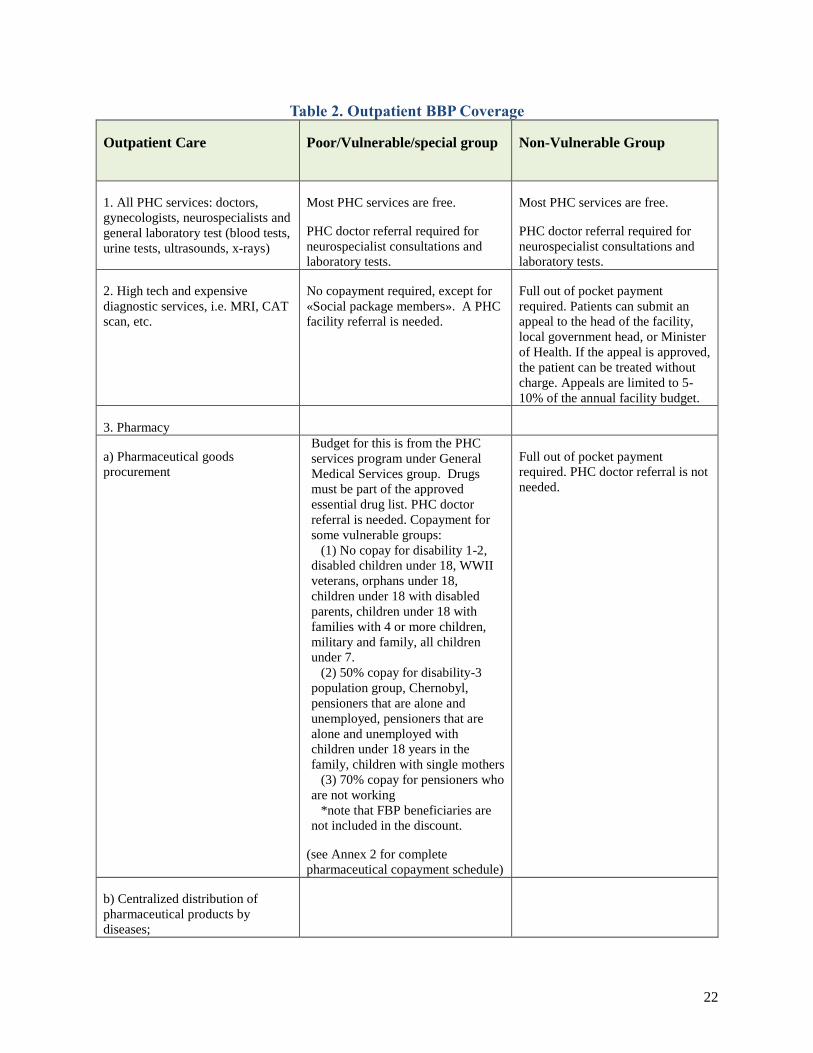
32. Benefits. The BBP is divided into two parts—the first part is available for the whole
population while the second part is only for the poor, vulnerable, and special groups. BBP services
for the whole population are mostly outpatient services that include primary care, maternity
services, and sanitary epidemiological services. Ambulance services are provided free of charge
for all. Selected outpatient pharmaceuticals are also provided through the BBP (see Table 2).
11 Examples of the programs are: Under the Outpatient Program (a) General medical services, (b) Specialized services,
(c) Dentistry; and, (d) Laboratory Tests. Under the Inpatient Program: (a) General Inpatient; (b) Specialized; and, (c)
Mother and Child. 12 PBF services serve as an incentive for PHC providers to provide priority programs such as screening (pap smear,
glucose and hypertension tests), immunization, reproductive health, etc. There is a protocol to validate the PBF
services done jointly by the SHA and World Bank project implementation unit. 13 This payment method started through technical assistance (TA) of a World Bank project. There is an ongoing United
States Agency for International Development (USAID) study to apply the Diagnosis Related Group (DRG) to child
health services but this has not yet been implemented.
22
Table 2. Outpatient BBP Coverage
Outpatient Care Poor/Vulnerable/special group Non-Vulnerable Group
1. All PHC services: doctors,
gynecologists, neurospecialists and
general laboratory test (blood tests,
urine tests, ultrasounds, x-rays)
Most PHC services are free.
PHC doctor referral required for
neurospecialist consultations and
laboratory tests.
Most PHC services are free.
PHC doctor referral required for
neurospecialist consultations and
laboratory tests.
2. High tech and expensive
diagnostic services, i.e. MRI, CAT
scan, etc.
No copayment required, except for
«Social package members». A PHC
facility referral is needed.
Full out of pocket payment
required. Patients can submit an
appeal to the head of the facility,
local government head, or Minister
of Health. If the appeal is approved,
the patient can be treated without
charge. Appeals are limited to 5-
10% of the annual facility budget.
3. Pharmacy
a) Pharmaceutical goods
procurement
Budget for this is from the PHC
services program under General
Medical Services group. Drugs
must be part of the approved
essential drug list. PHC doctor
referral is needed. Copayment for
some vulnerable groups:
(1) No copay for disability 1-2,
disabled children under 18, WWII
veterans, orphans under 18,
children under 18 with disabled
parents, children under 18 with
families with 4 or more children,
military and family, all children
under 7.
(2) 50% copay for disability-3
population group, Chernobyl,
pensioners that are alone and
unemployed, pensioners that are
alone and unemployed with
children under 18 years in the
family, children with single mothers
(3) 70% copay for pensioners who
are not working
*note that FBP beneficiaries are
not included in the discount.
(see Annex 2 for complete
pharmaceutical copayment schedule)
Full out of pocket payment
required. PHC doctor referral is not
needed.
b) Centralized distribution of
pharmaceutical products by
diseases;

23
Outpatient Care Poor/Vulnerable/special group Non-Vulnerable Group
- Diabetes Fully covered by the Government.
PHC doctor referral needed.
Approximately 68% covered by the
Government. PHC doctor referral
needed.
- Tuberculosis Fully covered by the Government.
PHC doctor referral needed.
Fully covered by the Government.
PHC doctor referral needed.
- Mental health Fully covered by the Government.
PHC doctor referral needed.
Fully covered by the Government.
PHC doctor referral needed.
- Cancer and Hematological
(malignant form)
Fully covered by the Government.
Mainly morphine. PHC doctor
referral is needed.
Fully covered by the Government.
Mainly morphine. PHC doctor
referral is needed.
- Epilepsy Fully covered by the Government.
PHC doctor referral from is needed.
Fully covered by the Government.
PHC doctor referral is needed.
- Hemodialysis Fully covered by the Government.
PHC doctor referral is needed.
Fully covered by the Government.
PHC doctor referral is needed.
- Chronic Diseases Fully covered by the Government.
PHC doctor referral is needed.
Fully covered by the Government.
PHC doctor referral is needed.
4. Child immunization, screenings
for cancer, diabetes, reproductive
health, hypertension, oral hygiene
and newborns
No copayment. Does not require
PHC facility referral.
No copayment. Does not require
PHC facility referral.
5. Dental services No copayment. Does not require
PHC facility referral.
Full out of pocket payment.
6. Ambulance care Fully covered by the Government. Fully covered by the Government.14
33. Inpatient treatment for around 200 socially significant conditions is provided with no co-
payment for selected poor/vulnerable/special groups (see Annex 2 for inpatient eligibility) while
the non-vulnerable population must pay a co-payment based on an approved MOH pricelist. There
is no copayment required for ten MOH labeled priority diseases/conditions, such as tuberculosis,
infections, Spontaneous Vaginal Delivery (SVD), mental health, malignant cancer, hematology,
chemotherapy, hemodialysis, antenatal care, delivery services, and reproductive health, for the
poor/vulnerable/special groups, while varying percentages are paid by non-vulnerable groups.
Diseases included in “High Tech and Expensive Services” require full OOP payment from all,
however, patients can submit an appeal to the MOH to receive treatment without OOP expenses.
14 In 2011, a Chinese grant provided emergency ambulances. Previously, ambulances were not very good and often
needed patient contributions to pay for gasoline.

24
Appeals are limited to 10 percent of the annual facility budget. Finally, conditions/diseases that
are not included in the list above (i.e. liver disease, injuries) require PHC provider referral for the
poor/vulnerable/special groups while the non-vulnerable groups must pay full OOP, unless granted
an appeal by the facility head, local government head, or MOH.
Table 3. BBP Inpatient Care Coverage
INPATIENT CARE Poor/Vulnerable/special group Non-Vulnerable Group
1. Patients with the diseases
approved by the MoH and
classified under diseases and
health statuses that need
emergency care.
No copayment. PHC facility referral
not required.
Copayment required. MOH
approved a pricelist (Yerevan vs
Marzes) that includes the payment
share. PHC facility referral not
required.
2. Patients with MOH approved
diseases
- Tuberculosis No copayment. PHC facility referral
from is required.
No copayment. PHC facility
referral is required.
- Infections No copayment. PHC facility referral
is required.
No copayment. PHC facility
referral is required.
- Spontaneous Vaginal Delivery
(SVD)
No copayment. PHC facility referral
is required.
Copayment required. MOH
approved a pricelist (Yerevan vs
Marzes) that includes the payment
share. PHC facility referral is
required.
- Mental Health and Narcology No copayment. PHC facility referral
not required.
No copayment. PHC facility
referral not required.
- Cancer (Malignant) No copayment. PHC facility referral
required.
Copayment required. MOH
approved a pricelist (Yerevan vs
Marzes) that includes the payment
share.
- Hematology (Malignant) No copayment. PHC facility referral
required.
Copayment required. MOH
approved a pricelist (Yerevan vs
Marzes) that includes the payment
share.
- Chemotherapy No copayment, but there is a
spending limit on medicine.
50% copayment. MOH approved a
pricelist (Yerevan vs Marzes) that
includes the payment share.
- Hemodialysis No copayment. PHC facility referral
required.
No copayment. PHC facility
referral required.

25
INPATIENT CARE Poor/Vulnerable/special group Non-Vulnerable Group
- Antenatal care No copayment. PHC facility referral
required.
No copayment. PHC facility
referral required.
- Delivery services No copayment. PHC facility referral
required.
No copayment. PHC facility
referral required.
- Reproductive Health No copayment. PHC facility referral
required.
Full out of pocket payment.
3. Conditions for which “high tech
and expensive services” are
required (i.e. cardiovascular
interventions, cosmetic surgery,
organ transplant, etc.)
Full out of pocket payment, with
some exceptions.
Patient can submit an appeal to the
Minister of Health. If approved,
patient can be treated without
charges. Appeals are limited to 10%
of annual facility budget.
Full out of pocket payment.
Patient can submit an appeal to the
Minister of Health. If approved,
patient can be treated without
charges. Appeals are limited to
10% of annual facility budget.
4. Conditions not included in any of
the above (i.e. liver disease, sprains,
diabetes complications requiring
hospitalization, etc.).
PHC facility referral required. Once
referred patients are placed on the
hospital wait list.
Full out of pocket payment.
Patient can submit appeal to facility
head, local government head, or
Minister of Health. If approved,
patient can be treated without
charges. Appeals are limited to 5-
10% of annual facility budget.
34. Referral system. Though all BBP hospitalizations need a PHC provider referral, this
requirement is not strongly enforced. For example, if a poor/vulnerable patient does not obtain a
PHC provider referral prior to a hospitalization, they can retroactively obtain the referral so that
the hospitalization can be considered free under the BBP.
35. Information to consumers. Information regarding beneficiary entitlements is available in
the MOH and SHA websites. Entitlement and price lists information is also found within the
facilities. There is an MOH hotline for complaints, where agents register complaints, which must
be resolved within five days unless a hospital inspection is needed. If the complaint is serious,
there is a mediation with the hospital, and if not resolved, the Ministry is involved, extending the
process to a maximum of 3 weeks.
36. Information Environment. Given that PHC services are paid for through capitation,
residents must register with a PHC provider in order to receive free services. According to the
SHA database, approximately 98 percent of the population is registered. In order to avoid
duplicates and inconsistencies, the system matches all surnames with birth dates. The system could
be further improved if the data was cross-checked with the State Population Registry. Currently,
a manual database merger is conducted once or twice a year between the SHA and the Ministry of
Social affairs. As previously mentioned, the registration of vulnerable/special people is outside the
purview of the MOH and SHA.

26
37. BBP Coverage. The BBP covers primary health care services for 100 percent of the
population. According to administrative data, 38 percent of the population is covered for
inpatient services.15
Table 4. Data on BBP Coverage
Type of Coverage Description Coverage
(millions)
Coverage (% of total
population)
Contributory
compulsory health
insurance schemes
There is no mandatory health insurance in
Armenia.
0 0
Contributory voluntary
health insurance
schemes
Voluntary private health insurance for
corporations and individuals.
0.03216 1.1%
Non-contributory health
insurance schemes
Basic Benefit Package (inpatient coverage) for
the poor and vulnerable groups; Special
Package for civil servants and military
personnel.
1.15 ~38%
Non-contributory
National Health Service
(NHS) provision for
enrolled participants
(does not include NHS
scheme coverage for
non-insured populations)
BBP primary health care services 3.01 100%--the entire
population is covered
for PHC services but
only 98% is registered.
38. BBP Design. During the initial years following the establishment of the SHA, there was a
working group assigned to support the BBP design, evaluate its cost-effectiveness, burden of
disease, and other criteria. However, over time the BBP has been increasingly influenced by
budget availability and political considerations. Currently there is no area of the health system
designed to examine and update the BBP. Proposed changes must be agreed upon by the MOH
and the MOF, incorporated in the MTEF, expressed in the annual government budget message and
finally sent to the national assembly for budget appropriations.17 The most recent health program,
Heart Surgery Program, was introduced in 2015 following research revealing that heart surgery is
among the leading cause of financial hardship among patients.
15 ILCS 2014 data estimates that BBP national coverage (inpatient eligibility) is 27 percent, however this figure likely
underestimates coverage given that the survey does not provide estimates for all BBP categories. Administrative data
provides an estimate of 38 percent. The breakdown is found in Annex 2. 16 The data is for 2012, https://armenpress.am/arm/news/736135/ 17 http://minfin.am/index.php?cat=72&lang=1

27
4. Sustainability of BBP amidst Economic, Epidemiologic, and Demographic Challenges
39. Despite improvements and successes, the health system is not bereft of problems. The low
level of public funding, high out of pocket costs, and poor financial protection in Armenia are more
typical of lower-income countries. At 1.6 percent of GDP, public health financing is among the
lowest in the world, even lower than the average for low-income countries. Lack of full service
payment for BBP beneficiaries, poor targeting, and low BBP reimbursement fees leads to high
levels of informal payments for those in exempt categories, as well as lack of coverage for
expensive health care aspects such as outpatient pharmaceuticals. This has resulted in OOP
spending by households – a generally inefficient and inequitable financing modality -- being the
predominant source of financing for health in the country: accounting for 53 percent of total health
expenditures (THE), well above the recommended WHO level of 20 percent (Figure 7). In terms
of comparator countries, only Tajikistan and Georgia have a higher OOP spending share. Despite
PHC services being supposedly free, around 11 percent of the population, 32 percent from the
poorest decile and 4.2 percent from the richest decile (ILCS, 2014, see Annex 1) foregoes primary
health because they cannot afford it. Consumer satisfaction regarding financial access to
healthcare and drugs is dismal at 9.5 percent and 8.5 percent, respectively. Finally, poor targeting
results in the lack of full BBP coverage for many poor, exposing them to substantial
impoverishment risks and posing as an obstacle to financial risk protection for the Armenian
population.
Figure 7. OOP as % of Total Health Expenditure vs. Income (2014)
Source: WHO Global Health Expenditure Database, 2016

28
40. High OOP spending is associated with an increased likelihood of falling into poverty. The
incidence of catastrophic health spending in Armenia is high, with 4.9 percent of the population
spending more than 25 percent of household expenditures on health. Estimates from Armenia’s
2013 ILCS revealed that 2.5 percent of Armenian households were poor as a result of high health
OOP; higher than for similar countries in the region (see Table 5).
Table 5. Catastrophic and Impoverishing Expenditures
% of the population spending more than 25%
of household expenditures on health
% of the population that
became impoverished due
to OOP
Survey year
Armenia 4.9% 2.5% 2013
Belarus 0.2% 0.0% 2011
Estonia 2.7% 0.2% 2007
Georgia 9.0% 5.3% 2013
Croatia 0.3% 0.0% 2010
Kazakhstan 0.1% 0.0% 2013
Kyrgyz 0.9% 1.0% 2010
Russia 8.3% 0.8% 2013
Tajikistan 0.8% 2.2% 2009
Turkey 0.3% 0.2% 2012
Ukraine 1.1% 0.0% 2013
41. High household expenditures on health can push households into poverty. Figure 8 shows
households ranked by per capita consumption expenditure (x-axis) and per capita health
expenditure (y-axis). The spikes reveal differences between households before and after health
spending. The figure depicts relatively weak financial risk protection where even households in
the richest quintile fell below subsistence expenditure levels (poverty line) after spending on
health.

29
Figure 8. Per Capita Expenditure, Gross and Net of Health Spending
Source: Authors’ calculation using ILCS
42. The two main causes for Armenia’s high OOP are: (1) insufficient funds for BBP service
provision, and (2) exorbitant pharmaceutical prices. Though BBP provider reimbursements are
supposed to cover the “full” cost of health care provision, recent estimates reveal that they actually
cover roughly half of the cost of most services.18 Facilities finance BBP recipient services with
other revenue sources, such as with out-of-pocket payments of the non-vulnerable population. In
addition, patients often have to make unofficial payments to health staff in order to receive certain
services.
43. Pharmaceuticals are a significant household expenditure in Armenia amounting for 74
percent of total household OOP health expenditure in 2014. The MOH has a Centralized Drug
Procurement Program that provides drugs free of charge for certain diseases such as TB,
HIV/AIDS, diabetes, cancer, and some psychiatric conditions. Very few pharmaceuticals are
provided through the BBP. Though the BBP’s Special Drug Program is supposed to cover essential
drugs,19 it has a limited budget and beneficiaries are poorly targeted (FBP beneficiaries are not
entitled to this benefit (see Annex 2)). While there are nearly 30 registered wholesalers, 3 control
three-fourths of the market. Furthermore, no regulations for opening pharmacies, has resulted in
an excess of pharmacies, around 1900 in the country, of which half are operating in Yerevan.
Prices in private pharmacies (which predominate) are high by international standards and
18 Given that reimbursement is the same for public and private providers, anecdotal evidence reveals that private
providers limit the number of poor and vulnerable BBP beneficiaries that they treat to around 15-20 percent of their
total cases. 19 The essential drug list based on WHO recommendations was last updated and approved in 2013.
-10
-5
0
5
Con
sum
ptio
n as
mul
tiple
of P
L
0 .2 .4 .6 .8 1
Cumulative proportion of population, ranked from poorest to richest
pre-OOP consumption
post-OOP consumption
30
unaffordable for most households. There are no legal or regulatory provisions regarding medicine
prices and the Armenian government does not run an active national medicines price-monitoring
system for wholesale or retail prices. Pharmaceutical products are also subject to a 20 percent
value added tax.
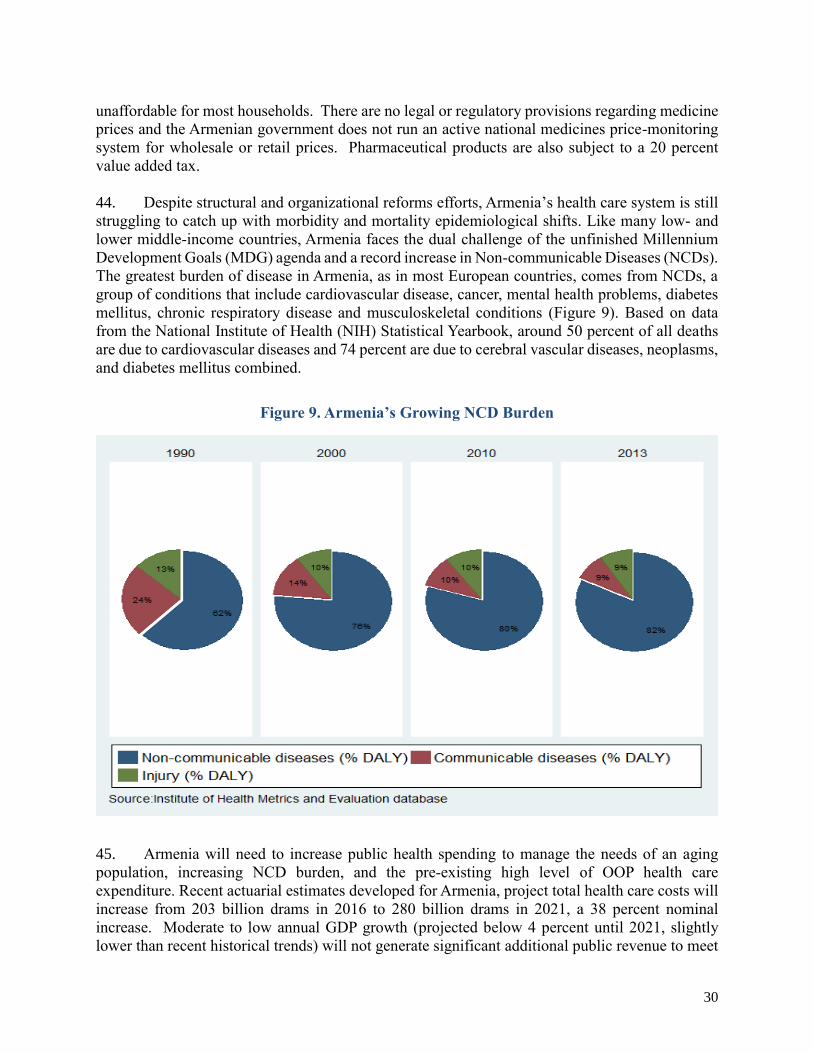
44. Despite structural and organizational reforms efforts, Armenia’s health care system is still
struggling to catch up with morbidity and mortality epidemiological shifts. Like many low- and
lower middle-income countries, Armenia faces the dual challenge of the unfinished Millennium
Development Goals (MDG) agenda and a record increase in Non-communicable Diseases (NCDs).
The greatest burden of disease in Armenia, as in most European countries, comes from NCDs, a
group of conditions that include cardiovascular disease, cancer, mental health problems, diabetes
mellitus, chronic respiratory disease and musculoskeletal conditions (Figure 9). Based on data
from the National Institute of Health (NIH) Statistical Yearbook, around 50 percent of all deaths
are due to cardiovascular diseases and 74 percent are due to cerebral vascular diseases, neoplasms,
and diabetes mellitus combined.
Figure 9. Armenia’s Growing NCD Burden
45. Armenia will need to increase public health spending to manage the needs of an aging
population, increasing NCD burden, and the pre-existing high level of OOP health care
expenditure. Recent actuarial estimates developed for Armenia, project total health care costs will
increase from 203 billion drams in 2016 to 280 billion drams in 2021, a 38 percent nominal
increase. Moderate to low annual GDP growth (projected below 4 percent until 2021, slightly
lower than recent historical trends) will not generate significant additional public revenue to meet

31
Armenia’s growing budgetary needs for competing health, pension, energy, infrastructure, and
tourism priorities (Figure 10).
Figure 10. GDP in Armenia is Projected to Fall
46. Due to the tight future fiscal space, Armenia will likely need to implement a mandatory
health insurance scheme to reduce out of pocket costs. Additional revenue will have to come from
the rationalization of Armenia’s numerous BBPs and eligibility categories as well as efficiency
gains via modern and strategic purchasing/provider payment systems, targeting revisions, care
integration, pharmaceutical reforms, etc.
5. Pending Agenda
Revisions in Targeting
47. As previously noted, the BBP and state certificate programs are providing a level of
financial protection for the poor. Even small improvements in targeting have led to substantial
gains. Given that approximately 30 percent of Armenia’s 3 million inhabitants live below the
poverty line, a one percentage point increase in coverage of the poor and an equivalent decrease
in coverage of the non-poor results in an additional 9,000 poor people becoming eligible and the
same number of non-poor becoming ineligible.

32
48. For instance, individuals who qualify for BBP coverage include all those with a level 2 or
3 disability.20 Figure 11 reveals that these categories are fairly evenly distributed by consumption
decile. BBP coverage could be more progressive applying a better cutoff score and thereby
limiting higher income beneficiaries. A more progressive ranking could also contribute to
determine the scope of BBP coverage or the level of copayment. For example, individuals with
lower scores could have lower copayments or be exempt from copayments for more services than
those with higher scores. These are revenue neutral policies that would not incur significant
administrative costs given that there already is an FBP scoring mechanism in place.
Figure 11. Distribution of Disabled Categories 2 and 3
Integration of Care
49. The number of existing health facilities in Armenia exceed the country’s actual needs.
Table 6 compares Armenia’s hospital system efficiency within the country and with countries at
similar levels of development using a graphical method called Pabón Lasso (Asbu, et al., 2012).
The method involves determining 4 regions, bounded by selected comparison values of bed
turnover rates (BTR) and bed occupancy rates (BOR).
20 The Government of Armenia has a methodology for assigning disability levels. See Government Decision No.750-
N of 13 June 2003: “On Approval of the Classifiers and Criteria for Assigning Disability Groups during Medico-
Social Expertise.” A reference to this legislation is available at
http://www.unescapsdd.org/files/documents/DPC_Armenia.doc. Disability Level 1 is the most severe disability level,
and 3 is the least severe.
10 1112
10 10 10
89
10 10
0
10
20
30
40
50
Pe
rce
nt in
each d
ecile
1 2 3 4 5 6 7 8 9 10
decileSource: ILCS 2014 and World Bank calculations
Distribution of Disabled Category 2 or 3

33
Table 6. Outline of Pabón Lasso Diagram
Occupancy Rate
Tu
rno
ver
Rat
e Quadrant II (high BTR, low BOR)
Excess bed capacity, unnecessary
hospitalization, many patients admitted to
hospitalization, predominance of normal
deliveries
Quadrant III (high BTR, high
BOR)
Good performance, small
proportion of unused beds
Quadrant I (low BTR, low BOR)
Excess bed supply, less need for
hospitalization, low demand/utilization
Quadrant IV (low BTR, high
BOR)
Large proportion of severe cases,
predominance of chronic cases
Note: from (Asbu, et al., 2012)
50. Figure 12 compares European countries average BTR and BOR.21 Armenia is positioned
in quadrant “I”, suggesting that the country’s hospitals have an excess capacity of beds and low
utilization.
Figure 12. Armenia Benchmarked against European Average in 2014
Source: WHO Health for Everyone 2016
51. Pabón Lasso can also be used within Armenia, using data from the marzes. According to Figure
13, Yerevan is the only marze with an efficient hospital sector, with most of the marzes located
21 The comparator countries are the list of countries in the “Health for All” database: http://www.euro.who.int/en/data-
and-evidence/databases/european-health-for-all-family-of-databases-hfa-db

34
in quadrant I, revealing an oversupply of beds and lack of demand. The MOH run facilities are
also located in this quadrant.
Figure 13. Pabón Lasso for Armenian Marzes (2015)
Source: Armenia MoH
52. The data in the diagrams suggests that in the short-run, Armenia may obtain efficiency
improvements without additional funding. Even though Armenia has achieved some efficiency
gains through hospital optimization, service delivery is still not well integrated. Health facilities,
their functions, medical standards and clinical practice guidelines should be re-assessed
holistically and the optimization plan22 revisited. The establishment of an integrated model for
rural health services could likely achieve efficiency gains in rural areas.
SHA Governance
53. In order to further pool risks the government is discussing the possibility of administering
the BBP and Civil Servants package through private health insurance companies. Private insurers
would act as third party administrators to purchase services, while program beneficiaries would be
randomly assigned to the insurers. The insurers would then pay claims using previously
established rates to a set of providers chosen by the government.
54. Based on international experience, a single purchaser and payer system such as the SHA
system pools risks more efficiently and equitably, and is structurally a more effective purchaser
given its significant market share. In fact, there are few international examples of purchaser
competition (Belgium, the Czech Republic, Germany, the Netherlands, the Russian Federation, the
Slovak Republic, and Switzerland), and in those cases, private insurance is heavily regulated. For
OECD countries with private insurance involvement, the scope of work is generally focused on
22 The last optimization plan was in November 2016 (Decree N 1911). This defined the general master optimization
plans for the regional health care delivery systems.

35
covering complementary and supplementary insurance, but not the mandatory basic benefit
package.
55. International experience suggests that competition among purchasers is technically more
complex and involves higher transaction and administrative costs than a single purchaser system
(WHO, 2015).23 Following international best practices the SHA is a single risk pool and purchaser.
However, SHA does not have the mandate (e.g., authority, incentives, information and instruments)
to be a strategic purchaser, which would improve the system’s efficiency.
56. When the SHA was first established, it was envisioned as the first step towards
implementation of a Mandatory Health Insurance Fund. Nevertheless, the SHA still lacks several
important aspects of modern payment systems including: effective gatekeeper and referral
systems, limited managed care use, lack of effective spending caps, and weak and limited
regulation of private sector health spending.
57. The SHA is not a strategic purchaser and because it is under the auspices of the MOH, is
granted limited autonomy to initiate major initiatives, such as budget program changes. Every
program budget adjustment has to go through the MOH and the MOF. Furthermore, the funds it
manages are too limited to pay incentives for finance development/improvements. BBP funding is
a small share of revenue for private hospitals and the SHA has no fiscal space for negotiation with
providers. Currently, the SHA does not have health or health system role or objectives – as it is
narrowly focused on processing facility payments.
58. Armenia faces a challenging future fiscal situation. The country must increase health
spending in order to achieve UHC, improve financial protection, and deal with future cost
pressures from the demographic, epidemiological, and nutritional transitions, as well as from
technology growth. Given moderate GDP growth and revenue projections, Armenia should pool
funds for non-vulnerable groups (and/or their employers if they are employed) to pay premiums
for a Mandatory Health Insurance Fund through an individual and/or employer mandate, and/or
develop a special catastrophic BBP. In order to establish a Mandatory Health Insurance Fund, the
SHA must become a strategic purchaser.
23 WHO (2015). “Analysis of options for purchasing market structure under the NHS”. Barcelona: World Health
Organization Regional Office for
Europe. http://www.moh.gov.cy/moh/moh.nsf/EEBCAF0CDB3C0C4FC22577BB0026941E/$file/2015_04%20W
HO%20Analysis%20of%20Options%20for%20Purchasing%20Market%20Structure%20under%20NHS.pdf\

36
Annex 1: Additional Tables and Figures
Table A. Primary health care utilization rate by region
Source: Social Snapshot and Poverty in Armenia.
Table B. Inpatient and Outpatient Utilization, 2014
Source of raw data: ILCS, 2014.
Year 2010 2011 2012 2013 2014
Yerevan 40.7% 38.5% 38.9% 32.3% 36.3%
Other urban 37.6% 35.1% 35.1% 31.2% 42.7%
Rural 35.3% 31.8% 26.2% 25.1% 34.4%
Total 37.9% 35.2% 32.7% 29.3% 37.6%
Consumption
Decile
% which utilized
PHC facilities in past
month
% which went to hospitals
for outpatient care in the
past year
% which were admitted to a
hospital for inpatient care at least
once in the past year
Poorest 1 4.1 4.1 3.7
2 6.6 4.6 3.6
3 5.2 4.5 4.0
4 5.7 5.2 3.5
5 8.0 6.4 5.2
6 8.1 7.4 5.1
7 8.9 5.9 3.8
8 9.8 6.7 4.4
9 11.1 8.3 5.2
Richest 10 13.6 11.6 6.8
Total 8.1 6.5 4.5

37
Table C. Health-seeking behaviour when ill, 2014
Consumption
Decile
% of
population
who were
sick for at
least one day
in the past
month
% who went to
PHC facilities
among those
who were sick
for at least one
day
% of population
who were sick
for more than 3
days in the past
month
% of those who
went to PHC
facilities among
those who were
sick for more
than 3 days
% of
population
who were sick
for more than
3 days and
forewent care
for financial
reasons
Poorest 1 12.5 23.3 7.4 36.3 31.8
2 12.0 32.8 8.3 42.2 19.1
3 11.1 32.7 9.0 37.3 16.3
4 13.4 30.4 10.2 36.6 15.7
5 13.2 44.3 11.4 42.9 11.6
6 14.6 40.7 12.1 42.5 8.0
7 18.5 33.0 15.2 37.7 10.3
8 16.2 44.9 13.6 45.4 5.7
9 18.4 39.2 15.4 41.1 6.5
Richest 10 20.2 46.9 17.4 47.0 4.2
Total 15.0 37.6 12.0 41.5 11.1
Source of raw data: ILCS, 2014.
38
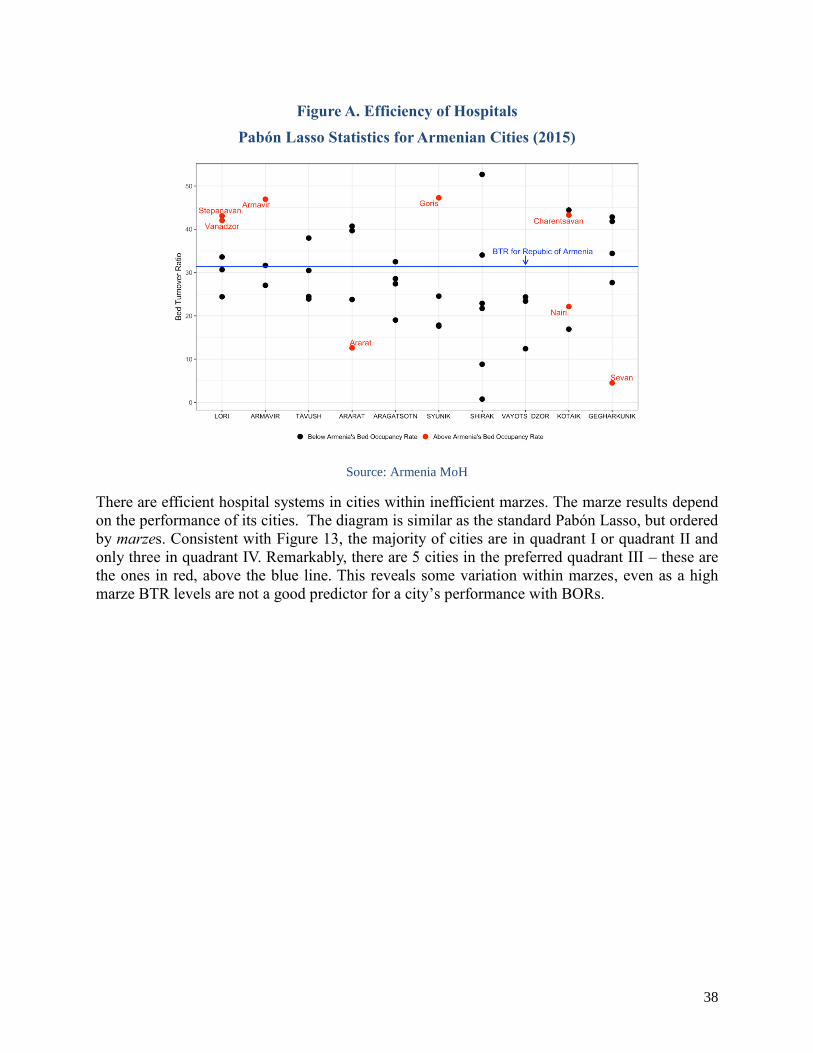
Figure A. Efficiency of Hospitals
Pabón Lasso Statistics for Armenian Cities (2015)
Source: Armenia MoH
There are efficient hospital systems in cities within inefficient marzes. The marze results depend
on the performance of its cities. The diagram is similar as the standard Pabón Lasso, but ordered
by marzes. Consistent with Figure 13, the majority of cities are in quadrant I or quadrant II and
only three in quadrant IV. Remarkably, there are 5 cities in the preferred quadrant III – these are
the ones in red, above the blue line. This reveals some variation within marzes, even as a high
marze BTR levels are not a good predictor for a city’s performance with BORs.

39
Annex 2: List of Poor, Vulnerable and Special Categories
Poor/Vulnerable/Special Population
Categories
Beneficiaries,
2015
Of which
the number
of FBP
beneficiaries
(with a score
over 30)
qualify as
another
vulnerable
group
Inpatient
care
eligibility
Participation
and % of
copayment
in Special
Drug
Program
Number %
Total 1,617,032 74,748 1,150,752
Poor and near poor 402,197
Qualify to receive FBP (score over 30) 402,197 included not included
Vulnerable group 233,171 61,961
Disabled, group I 10,259 3,468 included 0
Disabled, group II 80,307 17,421 included 0
Disabled, group III 101,722 9,386 included 50
WW II veterans and those related to them 943 included 0
Orphans or children without parental care
up to 18 years old and those related to
them.
333 122 included 0
Children between 8 and 12 years old and
those over 65 in need of specific dental
care.
Data not
available
not
included not included
Children up to 18 years old in families
with disabled members.
Data not
available included 0
Children up to 18 years old in families
with 4 or more children. 28,909 28,418 included 0
Up to 18 years old disabled children 7,796 3,146 included 0
Children in orphanages and adults in
nursing homes 2,902 included 100
Special group 981,664 12,787
Women of reproductive age 58,000 included not included
Children - up to 7 years’ old** 285,866 included 0
Children up to 18 years’ old in special
care dispensary institutions** 30,018 included not included
Children up to 18 years’ old having one
parent**** 13,200 12,787 included not included
14-15 years old males of military age* 35,000 included not included

40
Military personnel and their family
members, family members of those who
died in defense of Armenia and retired or
disabled personnel receiving military
pensions*, ***
4,512 included 0
Rescue personnel and their family
members, as well as retired or
disabled rescue servants, and family
members of those who died*
7,000 included not included
Incarcerated individuals Data not
available included not included
Those involved in Chernobyl nuclear plant
cleanup. 644 included 50
Trafficking victims Data not
available included not included
Asylum seekers Data not
available included not included
Social package beneficiaries* 100,000 included not included
Military age men (inpatient services, and
diagnosed through hospital examination)
*
55,000 included not included
Children (Up to 18 years old) of single
mothers**** 1,309
not
included 50
Unemployed pensioners 390,223 not
included 70
* - Expert estimations
** - Database enrolled population, SHA
*** - There are 4512 family members of military personnel that died in defence of Armenia
**** - In MLSA RA databases registered children of single mothers or single parents, only when they are
registered in any benefit programs of government

41