Public Disclosure Authorized Back and Create a Better ... · Gunung Sitoli Teluk Dalam Map of Nias...
116
Managing Resources to Build Back and Create a Better Future for Nias Nias Public Expenditure Analysis 2007 NPEA 40822 Public Disclosure Authorized Public Disclosure Authorized Public Disclosure Authorized Public Disclosure Authorized
Transcript of Public Disclosure Authorized Back and Create a Better ... · Gunung Sitoli Teluk Dalam Map of Nias...

Managing Resources to Build Back and Create a Better Future
for Nias
N i a s P u b l i c E x p e n d i t u r e A n a l y s i s 2 0 0 7
NPEA
40822
Pub
lic D
iscl
osur
e A
utho
rized
Pub
lic D
iscl
osur
e A
utho
rized
Pub
lic D
iscl
osur
e A
utho
rized
Pub
lic D
iscl
osur
e A
utho
rized

THE WORLD BANK OFFICE JAKARTAJakarta Stock Exchange Building Tower II/12-13th Fl.Jl. Jend. Sudirman Kav. 52-53Jakarta 12910Tel: (6221) 5299-3000Fax: (6221) 5299-3111
THE WORLD BANKThe World Bank1818 H Street N.W.Washington, D.C. 20433 USATel: (202) 458-1876Fax: (202) 522-1557/1560Email : [email protected] : www.worldbank.org
First Edition printed in July 2007
Cover photographsTop left, top right and bottom right: Copyright © Aji Yahuti RamyakimBottom middle: Copyright © Eka Hasfi AdhaBottom left : Copyright © Enrique Blanco Armas
Inside photos Copyright © Aji Yahuti Ramyakim: Executive Summary, Chapter 1 and Annexes. Copyright © Eka Hasfi Adha: Chapters 4 to 7. Copyright © Enrique Blanco Armas: Chapters 2 and 3.
Managing Resources to Build Back and Create a Better Future for Nias is a product of staff of the World Bank. The fi ndings, interpretation and conclusion expressed herein do not necessarily refl ect the views of the Board of Executive Directors of the World Bank or the government they represent.
The World Bank does not guarantee the accuracy of the data included in this work. The boundaries, colors, denomination and other information shown on any map in this work do not imply any judgement on the part of the World Bank concerning the legal status of any territory or the endorsement of acceptance of such boundaries.
For any questions regarding this report, please contact Wolfgang Fengler, [email protected] or Cut Dian Agustina, [email protected].

Managing Resources to Build Back
and Create a Better Futurefor Nias
Nias Public Expenditure Analysis 2007


iManaging Resources to Build Back and Create a Better Future for Nias
Nias Public Expenditure Analysis 2007
Foreword
Already one of the poorest regions in Indonesia, the island of Nias was badly aff ected by the twin disasters of the 26 December 2004 tsunami and a devastating earthquake that struck three months later, on 28 March 2005. Almost 1,000 lives were lost in the two disasters and buildings and infrastructure were destroyed in coastal areas and across the island. The Government of Indonesia and the international community responded generously following the earthquake, with nearly US$500 million being allocated for reconstruction by December 2006 — slightly higher than the estimated value of the damage and losses caused by the two disasters.
Now, more than two years after the disasters, and despite the signifi cant progress that has undoubtedly been made, some troubling trends are starting to emerge, of which this report takes stock. In particular, funds are not being disbursed at the desired pace as the reconstruction eff ort faces enormous implementation challenges. Although there seem to be suffi cient funds for the reconstruction of the island, there are still worrying geographical and sectoral gaps in the reconstruction process, creating unnecessary imbalances. Also, despite the involvement of the two district governments in the reconstruction process, their budget allocations for operations and maintenance are very small. This jeopardizes the longer-term sustainability of the reconstruction work that is being undertaken.
The two district governments should be playing a key role in the current reconstruction eff ort and, more importantly, in the future development of the island. In view of this, this report also analyzes the district governments’ use of public fi nances since 2001, when decentralization was implemented in Indonesia. The island of Nias, as with the rest of Indonesia, experienced an increase in district government revenues and responsibilities after 2001. However, both districts in the island — Nias and Nias Selatan — have not benefi ted as much from decentralization as other poor regions, particularly until 2005. As a result, overall spending on social and infrastructure services is lower than in most other parts of Sumatra and Indonesia, despite a record 50 percent spending on education. The Nias Public Expenditure Analysis off ers recommendations on how to increase the amount of public resources going to the island, as well as how to improve the eff ectiveness of public spending — critical in the face of low per capita revenues and the developmental needs of the island.
This report is the result of close collaboration between the World Bank, the Demographic Institute at the Faculty of Economics, University of Indonesia, and the BRR-Nias offi ce, as well as the two district governments on the island of Nias.
The allocation of signifi cant resources for reconstruction, as well as the decentralization process, entails both opportunities and challenges for the development of Nias. We hope that this report assists in making use of those opportunities and overcoming the challenges by informing the planning and budgeting process of the two district governments in Nias, and analyzing constraints in public fi nancial management in both districts, as well as identifying key gaps in the reconstruction process.
Christian ReyCoordinator of the Aceh and Nias Recovery Program,
World Bank
William SabandarHead of Rehabilitation and Reconstruction Agency
(BRR) Nias

Managing Resources to Build Back and Create a Better Future for Nias
Nias Public Expenditure Analysis 2007
ii
Acknowledgments
This report was prepared by a team from the World Bank led by Cut Dian Agustina, together with Ahya Ihsan and Peter Rooney. The core team comprised Adrianus Hendrawan, Harry Masyrafah, Sukmawah Yuningsih and Sylvia Njotomihardjo. The team from the Demographic Institute at the Faculty of Economics, University of Indonesia, was led by Suahasil Nazara and included Mulia Hamonangan L. Tobing, Bernard Nazara and Triasih Djutaharta. Deni Friawan prepared the background of the report and managed the initial data collection and analysis.
Enrique Blanco Armas and Wolfgang Fengler coordinated and oversaw the overall process. Arnold Lopulalan provided outreach and facilitation to the two district governments and donors in Nias. The team received guidance throughout the process from Victor Bottini (Resident Representative of the World Bank in Aceh) and Joel Hellman (Chief Governance Advisor and Aceh Coordinator, World Bank).
The report benefi ted from valuable inputs from peer reviewers Kai Kaiser and Javier Arze from the World Bank. Valuable comments were also received from Bambang Suharnoko, Eleonora Suk Mei Tan, and Bastian Zaini. Thanks also go to Elvi Farida for logistical support. Special thanks go to Peter Milne for editing and Arsianti for assisting with formatting and production. Thanks also go to Aji Yahuti Ramyakim, Eka Hasfi Adha and Enrique Blanco Armas for allowing the use of their photographs.
The team would like to express its gratitude to all those who participated in the seminar discussions in Nias and all the technical agencies (Dinas) involved in the data collection and analysis. The team is especially grateful to Bapak Binahati Baeha (bupati of Nias district) and Bapak Fahuwusa Laia (bupati of Nias Selatan district), and Bapak William Sabandar (Head of BRR-Nias offi ce) for their support and commitment.
Thanks go the British, Dutch and Singaporean government, who provided substantial fi nancial support.

iiiManaging Resources to Build Back and Create a Better Future for Nias
Nias Public Expenditure Analysis 2007
KAB. NIAS
KAB. NIAS SELATAN
KEPULAUANHINAKO
KEPULAUAN BATU
Gunung Sitoli
Teluk Dalam
Map of Nias
Jambi
Pakanbaru
Palembang
Medan
PULAUNIAS
Banda Aceh
NORTH SUMATRA

Managing Resources to Build Back and Create a Better Future for Nias
Nias Public Expenditure Analysis 2007
iv
Glossary of Terms
APBD Regional Government Budget (Anggaran Pendapatan dan Belanja Daerah)APBN State Budget (Anggaran Pendapatan dan Belanja Negara)Bappeda Regional Development Planning Agency (Badan Perencanaan Pembangunan Daerah)Bappenas National Development Planning Agency (Badan Perencanaan Pembangunan Nasional)BCG Bacillus of Calmette and GuerinBKD Regional Civil Service Board (Badan Kepegawaian Daerah)BPHTB Land and building transfer fee (Bea Perolehan Hak atas Tanah dan Bangunan)BPS Central Bureau of Statistics (Badan Pusat Statistik) BPS-SK Financial statistics from Central Bureau of Statistics (Statistik Keuangan Badan Pusat Statistik)BRR Rehabilitation and Reconstruction Agency (Badan Rehabilitasi dan Rekonstruksi)Bupati District Head DAK Special Allocation Fund (Dana Alokasi Khusus)D&L Damage and LossDAU General Allocation Fund (Dana Alokasi Umum)Decon Deconcentration FundsDesa VillageDinas Local Technical Agency Offi ceDPRD Provincial House of Representatives (regional parliament) (Dewan Perwakilan Rakyat Daerah)DPT Combined vaccination against diphtheria, pertussis, whooping cough and tetanusFGD Focus Group DiscussionsGDP Gross Domestic ProductGER Gross Enrollment RateGoI Government of IndonesiaGRDP Gross Regional Domestic ProductHDI Human Development IndexIDP Internally Displaced PersonIOM International Organization for MigrationKabupaten District (regency)Kecamatan SubdistrictKelurahan Urban villageKepmen Ministerial Decree (Keputusan Menteri)Keppres Presidential Decision (Keputusan Presiden)Km KilometerKota City (urban district)LG Local GovernmentMDF Multi-Donor FundMDG Millennium Development GoalMoF Ministry of FinanceMoHA Ministry of Home Aff airsMoNE Ministry of National EducationNGO Non-Governmental OrganizationO&M Operations and MaintenancePAD Own-Source Revenue (Pendapatan Asli Daerah)PBB Land and Building Tax (Pajak Bumi dan Bangunan)PDAM Local Water Supply Utility (Perusahaan Daerah Air Minum)Perpu Regulation in Lieu of Law (Peraturan Pemerintah Penggati Undang-Undang)Perda Regional Regulation (Peraturan Daerah)PFM Public Financial Management PLN National Electricity Company (Perusahaan Listrik Negara)Podes BPS Village Potential Survey (Potensi Desa)Polindes Village Maternity Center (Pos Persalinan Desa)Puskesmas Community Health Center at Subdistrict Level (Pusat Kesehatan Masyarakat)

vManaging Resources to Build Back and Create a Better Future for Nias
Nias Public Expenditure Analysis 2007
Posyandu Integrated Health Service Unit (Pusat Pelayanan Terpadu)Pustu Subcommunity Health Center (Puskesmas Pembantu)RGDP Regional GDPSD Primary School (Sekolah Dasar)SDO Subsidy for Autonomous Region (Subsidi untuk Daerah Otonom)SIKD Regional Finance Information System (Sistem Informasi Keuangan Daerah)SME Small/Medium EnterpriseSMP Junior High School (Sekolah Menengah Pertama) STR Student Teacher RatioSumut Province of North Sumatra (Sumatra Utara)Susenas BPS National Socio-Economic Survey (Survei Sosial Ekonomi Nasional)UNDP United Nations Development ProgramUnicef United Nations Children’s FundUnesco United Nations Educational, Sciencifi c and Cultural Organization WB World BankWHO World Health Organization

Managing Resources to Build Back and Create a Better Future for Nias
Nias Public Expenditure Analysis 2007
vi
Table of Contents
Foreword i
Acknowledgments ii
Map of Nias iii
Glossary of Terms iv
Table of Contents vi
List of Figures vii
List of Tables ix
EXECUTIVE SUMMARY xi
Fiscal Conditions on the Island of Nias xii
Public Service Delivery xiv
Agenda for Implementation xvi
CHAPTER 1 Economic and Social Conditions on Nias Island 1
Poverty and Social Conditions 2
Economic Structure and Growth 3
Impact of the Tsunami and Earthquake 4
CHAPTER 2 Revenue and Financing 7
Revenue 8
Overall Revenue Picture in Nias 8
General Allocation Fund (DAU) 11
Own-Source Revenue (PAD) 12
Tax-Sharing Revenue 14
Natural Resources (Non-Tax) Revenue-Sharing 15
Special Allocation Fund (DAK) 16
Financing and Borrowing 18
Recommendations 19
CHAPTER 3 Expenditure 21
Overall Expenditure in Nias and Nias Selatan 22
Routine vs Development Expenditure 23
Routine Expenditure 24
Development Expenditure 26
Apparatus vs Public Expenditure 27
Planned vs Realized Expenditure 28
Reconstruction Spending in Nias 28
BRR Reconstruction Progress 30
Recommendations 30

viiManaging Resources to Build Back and Create a Better Future for Nias
Nias Public Expenditure Analysis 2007
CHAPTER 4 Education 33
Education Outcomes and Facilities 34
Spending on Education 37
Impact of Earthquake and Reconstruction Spending on Education 40
Recommendations 40
CHAPTER 5 Health 43
Health Systems and Outcomes 44
Spending on Health 47
Impact of the Tsunami and Earthquake on Health Facilities 49
Recommendations 50
CHAPTER 6 Infrastructure 51
Infrastructure Conditions on Nias Island 52
Infrastructure Spending 54
Impact of Earthquake and Reconstruction Spending on Infrastructure 57
Recommendations 57
CHAPTER 7 District Government Capacity in Fiscal Management 59
Decentralization and the Proliferation of Districts and Sub-Districts 60
Financial Management 62
Recommendations 63
Annexes 65
Annex A: Key Issues and Recommendations 66
Annex B: Figures and Tables 69
Annex C: Methodological Note 84
Annex D: The Nias Public Expenditure Analysis (NPEA) Program 86
Annex E: Minutes of NPEA Seminar and Focus Group Discussion 89
References 93
List of Figures
Figure 1 Nias island’s revenue pre- and post-decentralization, and after the earthquake xii
Figure 2 Nias and Nias Selatan district government revenues, 1996-2006 xiii
Figure 3 Revenue per capita by district in North Sumatra, 2004 xiii
Figure 1.1 Poverty rates by district in North Sumatra, 2004 2
Figure 1.2 Per capita GRDP by district in North Sumatra, 2005 3
Figure 1.3 Composition of Nias island’s economy, 2005 4

Managing Resources to Build Back and Create a Better Future for Nias
Nias Public Expenditure Analysis 2007
viii
Figure 1.4 Monthly infl ation rates for Nias island, North Sumatra and Indonesia, 2005 5
Figure 2.1 Revenue of Nias pre- and post-decentralization, and after the earthquake 8
Figure 2.2 District government revenues in Nias and Nias Selatan, 1996-2006 8
Figure 2.3 Revenue per capita by district in North Sumatra, 2004 10
Figure 2.4 DAU allocations for Nias and Nias Selatan 11
Figure 2.5 DAU per capita by district in North Sumatra, 2005-06 12
Figure 2.6 Composition of Nias island local taxes, 1999-2005 13
Figure 2.7 Composition of tax-sharing revenue in Nias and Nias Selatan, 1999-2006 15
Figure 2.8 Composition of non-tax revenues in Nias and Nias Selatan pre- and post-decentralization, 1997-
2005 16
Figure 2.9 Trend of DAK allocations for Nias and Nias Selatan 17
Figure 2.10 Composition of DAK allocations to Nias island, 2002-05 17
Figure 2.11 Budget surplus and defi cit in Nias and Nias Selatan, 1994-2005 18
Figure 3.1 Nias public spending pre and post decentralization, and after the earthquake 22
Figure 3.2 Nias and Nias Selatan expenditure 23
Figure 3.3 Shares of district government expenditure in Nias and Nias Selatan 24
Figure 3.4 Overall sectoral expenditure in Nias and Nias Selatan, 2001-05 24
Figure 3.5 Sectoral composition of routine expenditure in Nias and Nias Selatan 25
Figure 3.6 Sectoral composition and trends in development expenditure in Nias and Nias Selatan 27
Figure 3.7 Project allocations vs reconstruction needs for Nias island, December 2006 29
Figure 3.8 Reconstruction disbursement in Nias and Nias Selatan 29
Figure 4.1 Literacy rates of Nias and Nias Selatan by district in North Sumatra, 2005 34
Figure 4.2 Nias island GER at primary, junior, and senior secondary levels, 2001-05 35
Figure 4.3 Mean years of schooling by district in North Sumatra, 2005 35
Figure 4.4 Primary schools per 1,000 primary school-aged children by sub-district in Nias/ Nias Selatan, 2005 36
Figure 4.5 STR for primary/junior secondary levels by sub-district in Nias Selatan, 2005 37
Figure 4.6 Sources of education expenditure in Nias and Nias Selatan, 2005 38
Figure 4.7 Education expenditure and percentage of total expenditure of Nias in aggregate, 2001-05 38
Figure 4.8 Per capita education spending by district in North Sumatra, 2004 39
Figure 4.9 Components of education routine expenditure in Nias and Nias Selatan, 2001-05 40
Figure 5.1 Percentage of deliveries attended by trained medical workers, 2001-05 44
Figure 5.2 Ratio of doctors and midwives per 10,000 population by district in North Sumatra, 2005 45
Figure 5.3 Ratio of public health facilities per 10,000 population 46
Figure 5.4 The distribution of usage of health service facilities, 2005 46
Figure 5.5 Sources of health expenditure in Nias and Nias Selatan, 2005 47
Figure 5.6 Health expenditure and its share of total expenditure in Nias and Nias Selatan, 2001-05 47
Figure 5.7 Per capita health spending by district in North Sumatra, 2004 48
Figure 5.8 Components of health routine expenditure in Nias and Nias Selatan, 2001-05 49
Figure 6.1 Percentage of households with access to clean water by district in North Sumatra, 2005 52
Figure 6.2 Percentage of households with electricity by district in North Sumtra, 2005 53
Figure 6.3 Infrastructure expenditure and its share of total expenditure on Nias island, 2001-05 54

ixManaging Resources to Build Back and Create a Better Future for Nias
Nias Public Expenditure Analysis 2007
Figure 6.4 Per capita spending on infrastructure by district in North Sumatra, 2004 55
Figure 6.5 Average development spending in sub-sectors, 2001-05 56
Figure 6.6 Components of infrastructure routine expenditure in Nias and Nias Selatan, 2001-05 56
Figure 7.1 Personnel expenditure and civil servant numbers in Nias and Nias Selatan, 2000-06 61
Figure 7.2 Ratio of population to civil servants by district in North Sumatra, 2004 61
Figure 7.3 Civil servant educational attainment by district/city in North Sumatra, 2004 62
Figure 7.4 PFM performance in Nias and Nias Selatan 63
Figure B.8.1 Per capita PAD by district in North Sumatra, 2004 69
Figure B.8.2 Nias and Nias Selatan’s tax-sharing revenue, 1997-2006 70
Figure B.8.3 Tax-sharing per capita by district in North Sumatra, 2005 70
Figure B.8.4 Non-tax revenue-sharing and its share of total revenue in Nias and Nias Selatan 71
Figure B.8.5 Population, area and DAU allocation by district in North Sumatra 71
Figure B.8.6 Per capita DAU and revenue-sharing (2005) and poverty rate (2004) by district in North Sumatra 72
Figure B.8.7 Per capita DAU 2006 and Human Development Index, 2005 72
Figure B.8.8 Per capita DAK allocations by district in North Sumatra, 2006 73
Figure B.8.9 Per capita and share of routine expenditure by district in North Sumatra, 2004 73
Figure B.8.10 Per capita and share of development expenditure by district in North Sumatra, 2004 74
Figure B.8.11 District government budget format: old vs new budget format 74
Figure B.8.12 BRR sectoral allocations and disbursements, 2005 and 2006 76
List of Tables
Table 1.1 Economic and social indicators for Nias and Nias Selatan 3
Table 1.2 Estimated damage and loss assessment for Nias island 5
Table 2.1 Composition of Nias and Nias Selatan district revenues 9
Table 2.2 Share of revenue components to total revenue in Nias and Nias Selatan 10
Table 2.3 Composition of Nias island PAD, 1999-2005 13
Table 2.4 Nias and Nias Selatan tax-sharing revenue 14
Table 2.5 Accumulated reserves in Nias and Nias Selatan, 2001-05 18
Table 3.1 Routine expenditure by economic classifi cation in Nias and Nias Selatan 25
Table 3.2 Sectoral composition of development expenditure in Nias and Nias Selatan 26
Table 3.3 Apparatus and public expenditures in Nias and Nias Selatan, 2005 28
Table 3.4 Planned vs realized expenditure in Nias and Nias Selatan 28
Table 4.1 Service area for school for Nias and Nias Selatan, 2005 36
Table 4.2 Student teacher ratios in Nias and Nias Selatan, 2005 36
Table 4.3 Routine and development education expenditure for Nias island, 2001-05 39
Table 5.1 Health indicators in Nias and Nias Selatan 44
Table 5.2 Immunization coverage on Nias island, 2005 45
Table 5.3 Health expenditure in Nias and Nias Selatan by routine and development, 2001-05 48
Table 5.4 Impact of earthquake on health facilities in Nias and Nias Selatan, 2005 50
Table 6.1 Road condition in Nias and Nias Selatan, 2001-05 53

Managing Resources to Build Back and Create a Better Future for Nias
Nias Public Expenditure Analysis 2007
x
Table 6.2 Infrastructure routine and development expenditure 2001-05 55
Table 6.3 Damage to, and reconstruction progress in, infrastructure 57
Table B.8.1 Nias island’s reconstruction progress 69
Table B.8.2 Results of the PFM survey in Nias and Nias Selatan 75
Table B.8.3 Health personnel on Nias island, 2000-05 75
Table B.8.4 The distribution of health personnel in Nias and Nias Selatan, 2005 76
Table B.8.5 Estimated budget allocation and disbursement of reconstruction funds in Aceh and Nias, December
2006 77
Table B.8.6 The composition of district government revenues in Nias and Nias Selatan 78
Table B.8.7 The composition of district government revenues in North Sumatra, 2004 79
Table B.8.8 Routine and development expenditures by district in North Sumatra, 2004 80
Table B.8.9 Routine expenditure by economic classifi cation and district in North Sumatra, 2004 81
Table B.8.10 Development expenditure by sector and district in North Sumatra, 2004 82
Table B.8.11 Education, health, and infrastructure expenditures by routine, and development and by district
in North Sumatra, 2004 83

EXECUTIVE SUMMARY
Nias Public Expenditure Analysis 2007
Managing Resources to Build Back and Create a Better Future for Nias
Nias Public Expenditure Analysis 2007
xii
EXECUTIVE SUMMARY
Fiscal Conditions on the Island of Nias
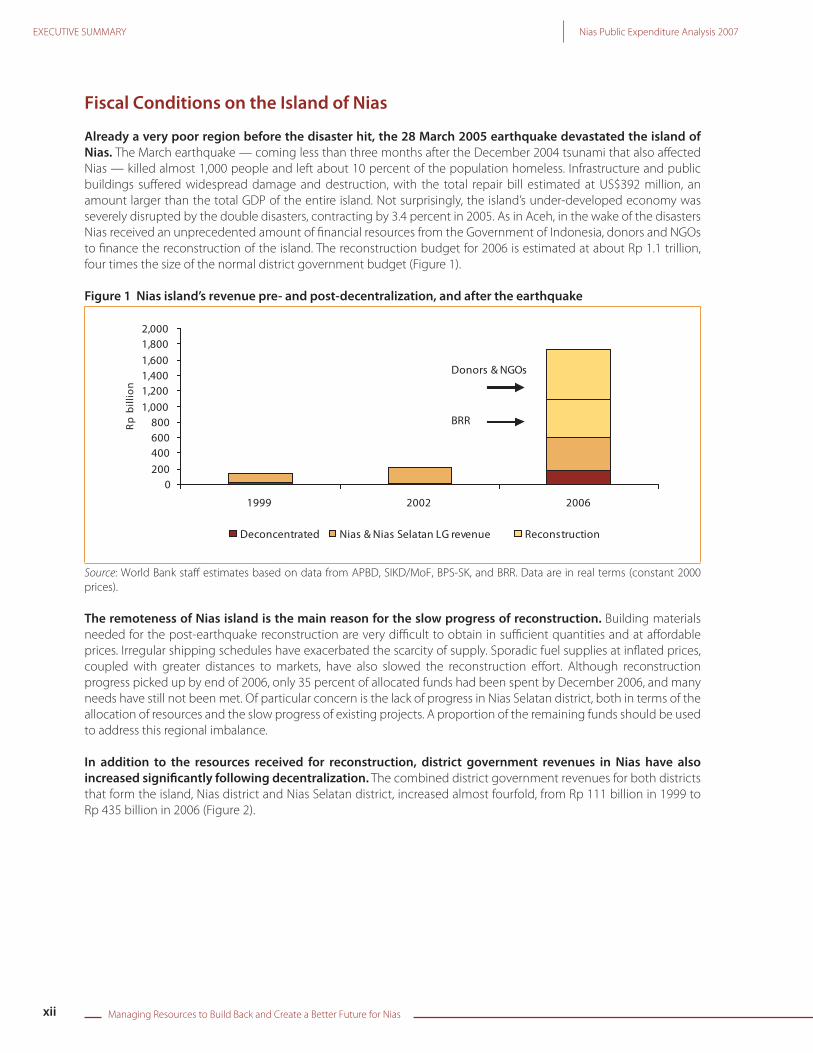
Already a very poor region before the disaster hit, the 28 March 2005 earthquake devastated the island of Nias. The March earthquake — coming less than three months after the December 2004 tsunami that also aff ected Nias — killed almost 1,000 people and left about 10 percent of the population homeless. Infrastructure and public buildings suff ered widespread damage and destruction, with the total repair bill estimated at US$392 million, an amount larger than the total GDP of the entire island. Not surprisingly, the island’s under-developed economy was severely disrupted by the double disasters, contracting by 3.4 percent in 2005. As in Aceh, in the wake of the disasters Nias received an unprecedented amount of fi nancial resources from the Government of Indonesia, donors and NGOs to fi nance the reconstruction of the island. The reconstruction budget for 2006 is estimated at about Rp 1.1 trillion, four times the size of the normal district government budget (Figure 1).
Figure 1 Nias island’s revenue pre- and post-decentralization, and after the earthquake
0200
400600800
1,000
1,2001,4001,600
1,8002,000
1999 2002 2006
noilli
b p
R
Deconcentrated Nias & Nias Selatan LG revenue Reconstruction
BRR
Donors & NGOs
Source: World Bank staff estimates based on data from APBD, SIKD/MoF, BPS-SK, and BRR. Data are in real terms (constant 2000 prices).
The remoteness of Nias island is the main reason for the slow progress of reconstruction. Building materials needed for the post-earthquake reconstruction are very diffi cult to obtain in suffi cient quantities and at aff ordable prices. Irregular shipping schedules have exacerbated the scarcity of supply. Sporadic fuel supplies at infl ated prices, coupled with greater distances to markets, have also slowed the reconstruction eff ort. Although reconstruction progress picked up by end of 2006, only 35 percent of allocated funds had been spent by December 2006, and many needs have still not been met. Of particular concern is the lack of progress in Nias Selatan district, both in terms of the allocation of resources and the slow progress of existing projects. A proportion of the remaining funds should be used to address this regional imbalance.
In addition to the resources received for reconstruction, district government revenues in Nias have also increased signifi cantly following decentralization. The combined district government revenues for both districts that form the island, Nias district and Nias Selatan district, increased almost fourfold, from Rp 111 billion in 1999 to Rp 435 billion in 2006 (Figure 2).

xiiiManaging Resources to Build Back and Create a Better Future for Nias
Nias Public Expenditure Analysis 2007 EXECUTIVE SUMMARY
Figure 2 Nias and Nias Selatan district government revenues, 1996-2006
0
50
100
150
200
250
300
350
400
450
500
1996
1997
1998
1999
2000
2001
2002
2003
2004
2005
2006*Rp
bill
ion
Nias Nias Selatan
Source: World Bank staff estimates based on data from APBD, SIKD/MoF, BPS-SK. Data are in real terms (constant 2000 prices).
Note : *Planned budget.
Despite a signifi cant increase in transfers from the central government in 2006, Nias and Nias Selatan continue to receive among the lowest per capita revenues of all districts in North Sumatra. Unlike many other districts in Indonesia, transfers from the central government have failed to address disparities in income levels for these two districts. Nias and Nias Selatan, despite being the two poorest districts in North Sumatra, continue to receive some of the lowest allocations in the province in terms of revenue per capita. Nias Selatan district has the lowest per capita revenue of only Rp 295,000, while Nias district has per capita revenue of Rp 497,000. Revenue per capita of both districts is still far below the national average of Rp 772,000, as well as below the provincial average of Rp 702,000 (Figure 3). The fi scal situation is very diff erent from that encountered in Aceh, where average per capita public revenue was about Rp 1.3 million in 2004, more than fi ve times Nias Selatan district’s per capita public revenue. In Aceh the fi scal situation is expected to improve still further, as the Special Autonomy Fund (2 percent of national DAU allocation) related to Aceh’s special autonomy status will start fl owing in 2008.
Figure 3 Revenue per capita by district in North Sumatra, 2004
0.0
0.2
0.4
0.6
0.8
1.0
1.2
1.4
1.6
Kota Sibolga
Kab. Pakpak Bharat
Kota Tebing Tinggi
Kota Padang Sidempuan
Kota Tanjung Balai
Kota Pematang Siantar
Kota Binjai
National
Kab. Tapanuli Utara
Kab. Toba Samosir
Kab. Tanah Karo
North Sum
atra average
Kab. Tapanuli Tengah
Kab. Dairi
Kab. Hum
bang Hasundutan
Kab. Mandailing N
atal
Kota Medan
Kab. Tapanuli Selatan
Kab. Simalungun
Kab. Nias
Kab. Langkat
Kab. Labuhan Batu
Kab. Asahan
Kab. Deli Serdang
Kab. Nias Selatan
Rp m
illio
n
Source: World Bank staff estimates based on data from APBD, SIKD/MoF, BPS.
Low per capita public revenue is related to relatively low General Allocation Fund (DAU) allocations from the central government to Nias and Nias Selatan. The DAU is the main source of revenue for both districts, accounting for about 82 percent of total revenue in 2006. In real terms, the DAU allocation for Nias and Nias Selatan remained stable from 2001 until a disproportionate increase in 2006. The criteria used for DAU allocations are not favorable

Managing Resources to Build Back and Create a Better Future for Nias
Nias Public Expenditure Analysis 2007
xiv
EXECUTIVE SUMMARY
for the two districts on Nias. Fifty percent of the DAU allocation goes to cover the salaries of civil servants. However, because of the relatively lower number of civil servants per capita in both districts, Nias and Nias Selatan receive low per capita DAU allocations despite their low human development indicators and GDP per capita. Nias island has very few alternative sources of revenue to the DAU, while Aceh, in addition to larger per capita DAU allocations, benefi ts from the special allocation of oil and gas revenues through revenue-sharing, signifi cantly increasing total revenues. The Special Allocation Fund (DAK) could be used by the central government to fi nance development expenditures on the island. Indeed, the DAK has increased signifi cantly over the past few years, and accounted for 10 percent of total revenues in 2006. The two district governments in Nias, however, have expressed their concerns over the diffi culties of complying with the DAK’s general, specifi c and technical criteria, which resulted in Nias Selatan district failing to receive any DAK allocation in 2004.
Improving local capacity is crucial given greater authority and responsibilities following decentralization and the low capacity of the two district governments in Nias. Before decentralization, district governments in Indonesia were simply representatives of the central government expected to execute the center’s policies and programs. Decentralization has since awarded far greater control to district governments in managing their budgets and civil services. As a result, district governments have assumed a much more crucial role in development, with greater authority over budget allocations and responsibilities. For public service provision, where responsibilities have been largely decentralized, district governments now control and spend a large percentage of the funds. Increased roles and responsibilities have created pressure on limited district government capacity. The World Bank and LGSP-USAID implemented a Public Financial Management (PFM) survey on the island, which found very low capacity levels in the management of local public fi nances. Nias district scored 38 percent overall (poor), while Nias Selatan district’s average score was only 14 percent (very poor). Comparison of the survey results for the two districts in Nias with those of the same survey in Aceh (World Bank, 2007b) indicates that most districts in Aceh scored higher than Nias district, while no district in Aceh scored lower than Nias Selatan district. This low capacity is exacerbated by diffi culties in attracting and maintaining qualifi ed staff to the island due to its remoteness and the lack of incentive mechanisms. One indicator of this is that the majority of civil servants on the island have only completed senior secondary school.
Spending patterns of the two district governments in Nias have improved in some respects but there remain areas of serious concern. Spending on education absorbs the bulk of expenditure in the two districts. However, it has been decreasing in recent years, while expenditure on government apparatus now absorbs a disproportionate share of funds. Similarly, infrastructure, a key area for the development of the island given the remoteness of many of its villages and the distance from Sumatra, has seen a sharp decrease in the allocation of funds since decentralization. Routine expenditure, primarily for paying civil servants’ salaries, commands an increasing share of funds, leaving limited funds for maintaining existing assets or investing in improved public services. Another worrying trend is the large allocation of funds for offi cial travel. In 2005, the two district governments’ allocations for travel doubled the allocation for operation and maintenance of public assets. Many of these trends are common in Aceh and other regions in Indonesia. After decentralization, district governments’ routine spending has experienced disproportionate increases, while development spending increases seem to favor government apparatus to the detriment of sectors more likely to have a benefi cial impact on poverty, such as education, health or infrastructure.
Public Service Delivery
Education
Nias and Nias Selatan districts have some of the lowest education outcomes in North Sumatra. Adult literacy rates on Nias island increased in recent years to 85.8 percent in 2005, but the two districts still have the two lowest adult literacy rates of North Sumatra. A relatively large percentage of the adult population of the island has never attended school. Low adult literacy and enrollment rates on the island are somewhat surprising giving the relatively large number of education facilities available. The average distance to school is lower and the number of schools per child is signifi cantly higher than the provincial and national averages. However, these averages mask inequalities between sub-districts, resulting in unmet needs in an otherwise suffi cient network of education facilities. On the other hand, the student teacher ratio is relatively high, particularly in Nias Selatan district, indicating the need for better teacher distribution towards areas where needs are highest. Inequalities between sub-districts are even starker, with some sub-districts having student teacher ratios as high as 70, far higher than the average for the island as a whole. Classroom conditions are another major issue on the island, with over 80 percent of classrooms in bad condition.

xvManaging Resources to Build Back and Create a Better Future for Nias
Nias Public Expenditure Analysis 2007 EXECUTIVE SUMMARY
Given the high spending levels in education — over 40 percent in both districts — it is unlikely that education spending can increase its share of district budgets. A large share of total spending on education on the island does not translate into high per capita education spending. In fact, both districts have signifi cantly lower per capita public spending on education than the provincial average, with Nias Selatan district having the lowest per capita education spending in the province. A more effi cient use of existing resources is therefore the only way to improve the delivery of public education. Spending in both districts should be geared towards fi lling gaps in teacher distribution, as well as improving the maintenance of classrooms. Current spending patterns do not allocate suffi cient resources for the maintenance of existing classrooms, with most routine expenditure fi nancing teachers’ salaries.
Health
Despite improvements in recent years, health outcomes in Nias island still lag behind provincial and national averages. Nias island has a much higher infant mortality rate than North Sumatra and Indonesia as a whole. The percentage of children under fi ve with poor nutrition is far higher than provincial and national averages, and immunization coverage is signifi cantly lower on the island. Health facilities do not seem to be the main problem: while Nias district has more health facilities per capita than the provincial average, Nias Selatan district has slightly fewer than the provincial average. However, the availability of health personnel is more of a problem, with very low personnel-to-population ratios in both districts. In Nias Selatan district, for example, there are only seven doctors serving a population of almost 290,000. This lack of health personnel is exacerbated by the unequal distribution of health workers among sub-districts across the island, creating signifi cant gaps in under-developed areas.
In per capita terms, public spending on health is signifi cantly lower on the island compared with North Sumatra or Indonesia as a whole. Nias Selatan district has the lowest per capita spending among districts in North Sumatra, while per capita spending in Nias district, although somewhat higher, is still far below both the average for North Sumatra and for Indonesia as a whole. The share of health spending in total expenditure increased from 5 percent in 2001 to 8 percent in 2005, in line with the national average of 7 percent. Therefore, the scope for further increases in the total level of health spending is now limited. But increases in health spending have gone mostly to routine functions, primarily to pay for the salaries of health personnel. Spending should go towards fi lling the gaps in health personnel distribution in more remote areas, as well as for the operation and maintenance of existing health facilities.
Infrastructure
Access to basic infrastructure, such as clean water, sanitation and electricity on the island, consistently lags behind the averages for North Sumatra and Indonesia as a whole. Both districts, but particularly Nias Selatan, have some of the lowest access levels to basic infrastructure in North Sumatra. The road network is extremely limited in rural areas and both the construction of new roads and the maintenance of existing roads are very expensive and time-consuming due to the lack of machinery and the need to ship in most materials. The road network, despite being clearly insuffi cient to serve the needs of the population, has not been expanded since the beginning of the decade. Only 20 percent of the road network on the island is asphalted, with a large proportion comprising earth roads that are unusable in the rainy season. The road network has been deteriorating steadily since the beginning of the decade, and the March 2005 earthquake only worsened an already critical situation. This situation explains why about 44 percent of villages on the island — 42 percent and 50 percent for Nias district and Nias Selatan district, respectively — are only accessible by four-wheel drive vehicles.
Despite the identifi ed needs in the infrastructure sector, in real terms overall spending on infrastructure in both districts declined signifi cantly from Rp 58 billion in 2001 to Rp 25 billion in 2005. As a share of total expenditure, spending declined from 29 percent in 2001 to 11 percent in 2005. The low priority given to this leading sector in recent years has hindered the development eff ort to open access to more isolated villages in Nias and Nias Selatan districts. The continuing trend of declining district expenditure on infrastructure in 2006 can be partly explained by the large contributions for infrastructure coming from the central government and the reconstruction funds. The distribution of local funds for infrastructure is mostly directed to public works for transport, water supplies and irrigation, with 82 percent of all development spending going into roads, water and irrigation development. The operation and maintenance of existing infrastructure has received relatively little attention, with personnel costs accounting for the largest share of routine spending in both districts. Meanwhile, offi cial travel is absorbing an increasing share of funds in both districts.

Managing Resources to Build Back and Create a Better Future for Nias
Nias Public Expenditure Analysis 2007
xvi
EXECUTIVE SUMMARY
Agenda for Implementation
• Central government should increase its allocation of resources � primarily through the DAK � to Nias and Nias Selatan. Both districts have relatively low per capita revenues, due to low DAU allocations and the absence of signifi cant alternative revenue sources. The new DAU allocation criteria that earmark 50 percent of the DAU for complete coverage of civil service salaries have not benefi ted either district, but especially disadvantage Nias Selatan, given the small relative umber of civil servants in this district. Although in the long term the island should aim at increasing own-source revenue to limit its dependency on central government transfers, in the short to medium term a larger volume of resources will be necessary to improve public service provision, particularly given that the two districts have the highest poverty rates in North Sumatra. The DAU formula should be more sensitive to poverty and fi scal gaps, as opposed to benefi ting districts with the largest wage bills. Alternatively, increasing the DAK allocation appears to be another option for the two districts, since it is a discretionary central government budget earmarked for under-developed regions.
• District governments need to improve public spending patterns while simultaneously improving
their fi scal positions. Current budgets are not fully spent (which makes calling for increased resources questionable) and spending patterns have room for improvement: the trend towards increasing spending on government apparatus should be corrected in favor of increased spending in other areas with greater potential for improving the well-being of the population, such as health or infrastructure.
• Both districts need to improve their public fi nancial management capacity in order to improve spending patterns. The current large volume of funds available to assist the two district governments in the recovery of the island, and the international presence, as well as the reconstruction needs, should be seen as an opportunity to increase district government capacity in managing public funds.
• District governments need to improve the allocation of resources within each sector, particularly since further expenditure increases in some sectors are unlikely. The key constraint in the delivery of quality education and healthcare does not seem to be the availability of facilities, although the condition of facilities is an issue given that the tsunami and the March earthquake damaged a large number of facilities. The focus should be on rehabilitating existing facilities, as well as allocating enough funds for the operation and maintenance of those facilities, while also improving the quality of services delivered. The number of teachers and health personnel is insuffi cient and large inequalities exist between the two main cities on the island and the more remote areas. Coverage gaps should be fi lled by transferring personnel to more remote areas.
• District governments need to be more involved in the reconstruction of the island. The impressive response to the disasters in Aceh and Nias represents an opportunity to build both places back better. However, the lack of progress in reconstruction on Nias island needs to be addressed before it is too late. Both district governments should take a more active role, collaborating with BRR and other partners on the island, particularly in light of the phasing out of the BRR towards the end of 2008. Of particular concern, given that major public infrastructure such as roads and bridges, schools, and health facilities have been rebuilt or repaired, is that all these assets will impose additional operational and maintenance costs on the two district governments going forward.

CHAPTER 1Economic and Social Conditions on
Nias Island
Nias Public Expenditure Analysis 2007

Managing Resources to Build Back and Create a Better Future for Nias
Nias Public Expenditure Analysis 2007
2
CHAPTER 1 Economic and Social Conditions on Nias Island
Poverty and Social Conditions
The Nias group of islands, comprising one main island and 130 far smaller islands, form the largest island group on the west coast of Sumatra. The Nias island group is part of North Sumatra province and divided into two administrative districts, Nias and Nias Selatan. Nias district was originally created in 1946 by the Government of Indonesia. This district was offi cially divided into the two administrative units in 2003 with the formation of Nias Selatan district in addition to Nias district. Nias district has a population of 442,019, consisting of 14 kecamatan (sub-districts), four kelurahan (urban villages) and 439 desa (rural villages). Nias Selatan district, which includes most of the smaller islands, has a population of 271,026, comprising eight sub-districts, two urban villages and 212 rural villages. Gunung Sitoli, located on the northeast coast, is the capital of Nias district, while the capital of Nias Selatan district is Teluk Dalam, situated on the southern coast.
Nias and Nias Selatan districts have the two highest poverty levels in North Sumatra, well above the Indonesian average (about 16.7 percent in 2004). Out of 370 districts in Indonesia for which data were available in 2004, Nias and Nias Selatan were among the top 10 percent of districts with the highest poverty rates. An estimated 226,000 people on Nias island were living below the poverty line in 2004 (Figure 1.1). While poverty rates in Indonesia decreased signifi cantly after 2000 as the country started to recover from the fi nancial crisis, poverty levels have remained high on the island, at about 31 percent since 2002, and almost certainly worsened after the 2005 earthquake.
Figure 1.1 Poverty rates by district in North Sumatra, 2004
0255075
100125150175200
Kota
Binjai
Kota
Meda
n
Kab.
Deli S
erdan
g
Kota
Sibolg
a
Kota
Tebin
g Ting
gi
Kota
Pema
tang S
iantar
Kota
Tanju
ng Ba
lai
Kab.
Asah
an
Kota
Pada
ng Sid
empu
an
Kab.
Labu
han B
atu
Kab.
Simalu
ngun
Kab.
Tapa
nuli U
tara
Kab.
Lang
kat
Kab.
Tana
h Karo
Kab.
Toba
Samo
sir
Kab.
Mand
ailing
Natal
Kab.
Dairi
Kab.
Tapa
nuli S
elatan
Kab.
Tapa
nuli T
enga
h
Kab.
Nias
Kab.
Nias S
elatan
Rp' 0
00
0%
5%
10%
15%
20%
25%
30%
35%
Poverty headcount Poverty rate
Source: BPS.
Both districts, but particularly Nias Selatan, lag behind the national averages for most social outcomes (Table 1.1). The score on the Human Development Index in Nias district improved from 61.8 in 2002 to 66.1 in 2005,1 but remains under the North Sumatra province and national averages of 72 and 69.6, respectively, in 2005. Similarly, the infant mortality rate also improved from 40.9 in 2002 to 36.1 per 1,000 live births in 2005, while the provincial and national averages were 33.5 and 32.8 per 1,000 live births, respectively, in 2005. In the education sector, the gross enrollment rate at the junior and senior secondary level is still low, at around 74 and 42 percent, respectively, compared with 92 and 70 percent in North Sumatra. The proportion of adults who have never attended school is relatively high, at 23 percent for those aged 15 and above.
1 The HDI data for 2002 was based on the whole island, while the data for 2005 was based on only Nias district, and did not cover Nias Selatan.

3Managing Resources to Build Back and Create a Better Future for Nias
Nias Public Expenditure Analysis 2007 CHAPTER 1 Economic and Social Conditions on Nias Island
Table 1.1 Economic and social indicators for Nias and Nias Selatan
Nias Nias Selatan North Sumatra Indonesia
GDP per capita 2005 (Rp) 4,888,905 5,060,626 11,106,258 12,627,167
Poverty rate 2004 (%) 31.6 32.2 14.9 16.7
Adult literacy rate, 2005 (% of people aged 15 and above)
85.8 62.5 95.6 91.7
GER junior secondary 2005 (%) 76.0 70.0 91.5 82.4
Human Development Index 2005 66.1 63.9 72.0 69.6
Life expectancy 2005 (years) 68.7 67.9 68.7 68.1
Source: BPS Indonesia, BPS Nias and Nias Selatan, Susenas.
Economic Structure and Growth
In terms of per capita GRDP, both districts are well below the provincial average (Figure 1.2). In 2005, per capita GRDP in Nias district was Rp 5.1 million and Rp 4.9 million in Nias Selatan district, or less than half the provincial average of Rp 11.1 million. The economy of the island grew relatively rapidly after 2000, at an average of 6.6 percent annually compared with less than 5 percent for North Sumatra or Indonesia as a whole, narrowing the income gap with the rest of the province. However, the economy contracted by 3.4 percent in 2005 as a result of the tsunami and earthquake, interrupting, if only temporarily, the previous growth trend. Low per capita GRDP and high poverty rates are refl ected in relatively low human development indicators, as discussed in detail later in this report.
Figure 1.2 Per capita GRDP by district in North Sumatra, 2005
0
5
10
15
20
25
Kota Medan
Kab. Asahan
Kab. Labuhan Batu
Kab. Deli Serdang
National
Kab. Toba Samosir
Kab. Tanah Karo
Kota Pematang Siantar
Kota Tanjung Balai
North Sumatra
Kota Binjai
Kota Sibolga
Kota Tebing Tinggi
Kab. Humbang Hasundutan
Kab. Dairi
Kab. Langkat
Kab. Serdang Bedagai
Kab. Samosir
Kab. Tapanuli Utara
Kab. Simalungun
Kota Padang Sidempuan
Kab. Pakpak Bharat
Kab. Tapanuli Selatan
Kab. Mandailing Natal
Kab. Nias Selatan
Kab. Nias
Kab. Tapanuli Tengah
Rp m
illion
Source: BPS.
The island’s economy is predominantly agricultural, accounting for 42 percent of GRDP (Figure 1.3). The industrial and manufacturing sector on Nias island is very small, accounting for about 2 percent of GRDP, compared with 27 percent for North Sumatra as a whole. Trade services account for a large share of the economy, most of these supplied by small-scale businesses in the trade and hospitality sectors (market stalls, petty traders, restaurants, and rickshaw drivers).
The agriculture sector employs the largest share of the workforce in both districts. In 2005, about 87 percent of the workforce in Nias district was absorbed in the agriculture sector, followed by the fi shery and social service sectors, at 4.7 percent and 4.4 percent of total workforce, respectively. In Nias Selatan, agriculture absorbed 88 percent of the workforce, followed by the manufacturing and fi shery sectors, at 7.7 percent and 1.4 percent of total workers, respectively.

Managing Resources to Build Back and Create a Better Future for Nias
Nias Public Expenditure Analysis 2007
4
CHAPTER 1 Economic and Social Conditions on Nias Island
Figure 1.3 Composition of Nias island’s economy, 2005
Trade, Restaurant, &
Hotel22.1%
Transport & Communication
6.9%
Financial Services5.5%
Mining and Quarrying
2.3%
Electricity, Gas, & Water
0.4%
Construction7.9%
Manufacturing Industry
1.8%
Agriculture43.0%
Services10.1%
Source: BPS.
The two districts are economically similar. There are no major diff erences in the sectoral breakdowns of GRDP between the two districts. The only noticeable diff erences can be found in agriculture where Nias Selatan district has a larger share (45.3 percent of GRDP compared with 40.6 percent in Nias district) and in the trade services sector, which carries signifi cantly more weight in the economy of Nias district. The structure of the island’s economy hardly changed from 2000 to 2005, with the share of agriculture decreasing slightly, particularly in Nias Selatan district, with a corresponding increase in the importance of services in the economy.
Impact of the Tsunami and Earthquake2
The December 2004 tsunami and the March 2005 earthquake caused severe damage and destruction to the island’s infrastructure and economy, both of which were already weak prior to the disasters. The tsunami hit several villages on the north coast killing over 100 people. The earthquake on 28 March 2005, measuring 8.7 on the Richter scale, killed about 850 people, while an estimated 71,000 people, or about 10 percent of the population of the island, lost their homes. The housing sector was the worst hit, with 13,000 houses destroyed and 24,000 badly damaged. Transportation infrastructure was also badly damaged: 12 large and small ports were destroyed, and more than 1,000km of roads were rendered impassable. Most of the casualties were in urban areas as a consequence of Gunung Sitoli’s proximity to the epicenter. Total damage was estimated at US$392 million, equivalent to 108 percent of the island’s GDP (Table 1.2).
2 This section derived largely from (BRR and World Bank, 2006b) and (BRR and Partners, 2006).

5Managing Resources to Build Back and Create a Better Future for Nias
Nias Public Expenditure Analysis 2007 CHAPTER 1 Economic and Social Conditions on Nias Island
Table 1.2 Estimated damage and loss assessment for Nias island3
SectorEstimated damage
(US$ million)Social sectors 56Education 23Health 23Community, culture, and religion 10Infrastructure 306Housing 160Transport 70Electricity, water & sanitation, and communication 76Productive Sectors 1Cross-sectoral (governance and environment) 29Total 392
Source: BRR Aceh-Nias.
The widespread damage has had an infl ationary impact leading to higher costs of living on the island. Higher infl ation is particularly the result of increases in the prices of basic food staples and transportation. For example, the price of rice increased by 23 percent following the earthquake. The already limited transportation system worsened the situation as this constrained the supply of goods and materials. The monthly infl ation rate on the island rose to 9.5 percent in April 2005 and 11.5 percent in October 2005, compared with 1.5 percent infl ation and 0.12 percent monthly defl ation in North Sumatra as a whole at similar points of time (Figure 1.4).
Figure 1.4 Monthly infl ation rates for Nias island, North Sumatra and Indonesia, 2005
-5
0
5
10
15
20
Janu
ary
Febr
uary
March Ap
ril
May
June July
Augu
st
Sept
embe
r
Octo
ber
Nove
mbe
r
Dece
mbe
r
Perce
nt
Nias North Sumatra National
Source: BPS Nias.
The remoteness of Nias island has slowed the progress of reconstruction. Building materials are diffi cult to obtain in suffi cient quantities and at aff ordable prices. Irregular shipping schedules have exacerbated the scarcity of supply. Sporadic fuel supplies exacerbated infl ation and together with the long distances to markets prevented the rapid implementation of the reconstruction eff ort. By the end of 2006, however, reconstruction had started to pick up speed. Almost 5,400 new and 350 non-permanent houses had been built and more than 300km of roads built or repaired. One hospital in Gunung Sitoli, 19 health facilities, and 124 permanent schools had been rebuilt or repaired with the aim of restoring health and education service provision (Annexes Table 1.2.). These eff orts were made collectively by a multitude of domestic and international partners comprising 42 international NGOs, 24 national NGOs, 13 United Nations agencies, and eight government agencies.
3 The Nias damage and loss assessment was carried out by IOM (IOM, June 2005). Using the IOM damage and loss data, the aggregate sectoral and fi nancial impact was calculated by applying data international standard ECLAC-methodology, which had also been used to estimate the damage and losses from the tsunami.

Managing Resources to Build Back and Create a Better Future for Nias
Nias Public Expenditure Analysis 2007
6
CHAPTER 1 Economic and Social Conditions on Nias Island
However, many needs are still not being met. According to the Ministry of Social Welfare, as of March 2007 more than 5,000 houses still need to be built for IDPs. As for schools, less than half of the damaged schools have been rebuilt or repaired. With the current level of reconstruction, the local economy is expected to revive as reconstruction spending brings a boost to a variety of sectors, such as transportation, construction and food processing. The district governments are also expected to develop stronger capacity given their growing participation in reconstruction planning and fi nancing, helped by support from donors and NGOs.

CHAPTER 2Revenue and Financing
Nias Public Expenditure Analysis 2007

Managing Resources to Build Back and Create a Better Future for Nias8
CHAPTER 2 Revenue and Financing
Revenue
Overall Revenue Picture in Nias
Nias and Nias Selatan districts received an unprecedented amount of fi nancial resources from the reconstruction budget in 2006, surpassing district government budgets by almost four times. Following the earthquake in March 2005, Nias received additional resources from the central government, as well as from international and domestic donors. In 2006, Nias island is estimated to have received about Rp 1.1 trillion in reconstruction funds, of which Rp 488 billion came from BRR and about Rp 644 billion came from donors and NGOs (Figure 2.1). Similar to other districts in Indonesia, Nias island benefi ted from decentralization before reconstruction funds started to fl ow into the region. Decentralization increased district revenues almost fourfold, from Rp 111 billion in 1999 to Rp 435 billion in 2006 in total.
Figure 2.1 Revenue of Nias pre- and post-decentralization, and after the earthquake
0200
400600
8001,0001,200
1,4001,600
1,8002,000
1999 2002 2006
Rp b
illio
n
Deconcentrated Nias & Nias Selatan LG revenue Reconstruction
BRR
Donors & NGOs
Source: World Bank staff estimates based on data from APBD, SIKD/MoF, BPS-SK, and BRR. Data are in real terms (constant 2000 prices).
Figure 2.2 District government revenues in Nias and Nias Selatan, 1996-2006
0
50
100
150
200
250
300
350
400
450
500
1996
1997
1998
1999
2000
2001
2002
2003
2004
2005
2006*
Rp b
illion
Nias Nias Selatan
Source: World Bank staff estimates based on data from APBD, SIKD/MoF, BPS-SK. Data are in real terms (constant 2000 prices). Note: *Planned budget.
Nias Public Expenditure Analysis 2007

The aggregate revenue of Nias and Nias Selatan districts increased signifi cantly in 2006 mainly due to a sharp increase in the DAU transfer. The DAU is the main source of revenue going to Nias and Nias Selatan districts. The DAU on average accounts for 82 percent of total revenue for the two districts, signifi cantly more than the district average in Indonesia, which is 62 percent of total revenue (World Bank, 2007a). Transfers made up an average of 98 percent of revenues in Nias island before decentralization and remained high after decentralization, at 93 percent. In absolute terms, transfers increased almost fourfold, from Rp 108 billion in 1999 to Rp 423 billion in 2006 (Table 2.1).
Table 2.1 Composition of Nias and Nias Selatan district revenues Rp million at constant 2000 prices
1999 2002
2004 2006 planned
NiasNias
Selatan Total Nias*Nias
Selatan* Total*
Own-Source Revenue 2,319 5,319 5,701 718 6,419 3,591 1,698 5,290
Tax Revenue-Sharing 8,461 15,950 9,690 7,438 17,127 6,064 4,734 10,798
Non-tax Revenue-Sharing 669 1,127 917 - 917 582 - 582
SDO 40,522 - - - - - - -
Inpres 58,986 - - - - - -
DAU - 180,448 118,296 52,500 170,796 222,780 136,944 359,724
DAK - 616 7,085 - 7,085 22,781 22,132 44,913
Others 152 2,473 21,789 2,708 24,497 9,648 4,902 14,550
Total 111,110 205,932 163,477 63,364 226,841 265,446 170,410 435,856
Source: World Bank staff estimates based on data from APBD, SIKD/MoF, BPS-SK. Note: * Planned budget.
The DAK has also gained in importance and contributed to the increase in total revenue following decentralization. The DAK, starting from a very low base, increased more than 30 times from Rp 616 million in 2002 to Rp 7.1 billion in 2004, and then to Rp 20 billion in 2005 (Annexes Table B.8.6). The increase in other revenues was largely the result of fi nancial assistance from the provincial government. Revenues from the province increased from Rp 115 million in 2001 to Rp 15 billion in 2005.
Decentralization has not signifi cantly changed the shares of own-source revenue and revenue-sharing to overall revenue. The contribution of own-source revenue and revenue-sharing to total revenue only increased from an average of 2 percent and 7 percent, respectively, before decentralization, to 3 percent and 8 percent after decentralization (Table 2.2). Revenue-sharing is largely comprised of tax sharing rather than non-tax sharing. As a resource-poor region, the island relies to a great extent on the redistribution of oil and gas non-tax revenue sharing from North Sumatra and its own limited forestry and fi shery sectors for non-tax revenue-sharing. However, since the island was divided into two districts in 2003, Nias Selatan district has received no non-tax revenue-sharing revenue.4
4 The forestry activities in Nias Selatan conducted by PT. Geruti and PT. Teluk Nauli have been halted since 2004. As the result, Nias Selatan does not receive any revenue from forestry land rent or royalties. For fi sheries and oil and gas distribution revenue-sharing from North Sumatra, it is possible that this revenue still belongs to Nias district.
Nias Public Expenditure Analysis 2007
9Managing Resources to Build Back and Create a Better Future for Nias
CHAPTER 2 Revenue and Financing

Managing Resources to Build Back and Create a Better Future for Nias
Nias Public Expenditure Analysis 2007
10
CHAPTER 2 Revenue and Financing
Table 2.2 Share of revenue components to total revenue in Nias and Nias SelatanPercent
1997 1998 1999 2000% avrg
pre-Dec2001 2002 2003 2004 2005
% avrg post-Dec
Own source revenue
3 1 2 2 2 2 3 4 3 2 3
Revenue sharing 10 6 8 7 7 7 8 7 8 8 8
SDO 20 47 36 53 39 - - - - - -
Inpres 68 46 53 39 51 - - - - - -
DAU - - - - - 88 88 88 75 74 82
DAK - - - - - 0 0.30 1 3 8 2
Others 0.2 0.1 0.1 0 0 2 1 0.5 11 8 5
Total transfer 97 99 98 98 98 95 96 95 86 89 93
Total revenue 100 100 100 100 100 100 100 100 100 100 100
Source: World Bank staff estimates based on data from APBD, SIKD/MoF, BPS-SK.
The two districts have among the lowest per capita revenues in North Sumatra. Nias Selatan district has Indonesia’s lowest per capita revenue at only Rp 295,000, while Nias district has per capita revenue of Rp 497,000. Revenue per capita for both districts is far below the national average of Rp 772,000 and the provincial average of Rp 702,000. Nias Selatan district received only one-fi fth of the revenue per capita of the richest district in North Sumatra (Figure 2.3)
Figure 2.3 Revenue per capita by district in North Sumatra, 2004
0.00.20.40.60.81.01.21.41.6
Kota Sibolga
Kab. Pakpak Bharat
Kota Tebing Tinggi
Kota Padang Sidempuan
Kota Tanjung Balai
Kota Pematang Siantar
Kota Binjai
National
Kab. Tapanuli Utara
Kab. Toba Samosir
Kab. Tanah Karo
North Sum
atra average
Kab. Tapanuli Tengah
Kab. Dairi
Kab. Hum
bang Hasundutan
Kab. Mandailing N
atal
Kota Medan
Kab. Tapanuli Selatan
Kab. Simalungun
Kab. Nias
Kab. Langkat
Kab. Labuhan Batu
Kab. Asahan
Kab. Deli Serdang
Kab. Nias Selatan
Rp m
illio
n
Source: World Bank staff estimates based on data from APBD, SIKD/MoF, BPS.
Transfers from central government still fail to address the disparities between districts. Nias and Nias Selatan districts have the highest poverty rates and the lowest Human Development Index (HDI) ratings in North Sumatra. Despite this, they do not receive higher allocations of DAU than other districts with lower poverty rates and higher HDIs (Annexes Figure B.8.6) in terms of the DAU and revenue-sharing per capita. In 2005, the two districts still did not receive larger per capita allocations than other districts in North Sumatra. Both districts receive similar allocations to districts with lower poverty rates, such as Simalungun (Annexes Figure B.8.5). Despite the large increase in the DAU in 2006 this issue has still not been addressed.

11Managing Resources to Build Back and Create a Better Future for Nias
Nias Public Expenditure Analysis 2007 CHAPTER 2 Revenue and Financing
General Allocation Fund (DAU)
Similar to other district governments in Indonesia, the DAU is the main source of revenue for Nias and Nias Selatan districts. The DAU is a discretionary block grant that is intended to address fi scal disparities between provinces and kabupaten/kota. The size of the grant varies widely based on a specifi c formula that attempts to align fi scal capacity and the fi scal needs of district governments. In real terms, the DAU allocation for Nias district (and Nias Selatan district from 2004) was stable from 2001 until a disproportionate increase in 2006. In total, the DAU increased by more than 100 percent in 2006. In Nias district, the DAU increased from an average of Rp 155 billion in 2001-05 to Rp 223 billion in 2006. Nias Selatan district experienced an increase from an average Rp 54 billion in 2004-05 to Rp 137 billion in 2006 (Figure 2.4).
Figure 2.4 DAU allocations for Nias and Nias Selatan
0
50
100
150
200
250
300
350
400
2001 2002 2003 2004 2005 2006
noillib pR
Nias Nias Selatan
Source: World Bank staff estimates based on data from MoF. Data are in real terms (constant 2000 prices).
The signifi cant increase in the DAU nationwide has also increased the DAU per capita in Nias and Nias Selatan. In 2005, Nias Selatan district was the third lowest per capita recipient in North Sumatra with per capita allocation of Rp 285,000. The situation signifi cantly changed in 2006, when the district’s per capita DAU increased to Rp 716,000. As for Nias district, per capita DAU increased from Rp 391,000 in 2005 to Rp 714,000 in 2006 (Figure 2.5). The re-estimation of land area as one of main components of the DAU allocation formula has also benefi ted Nias and Nias Selatan. In 2005, the area of Nias Selatan district, which includes many smaller islands, was seriously under-estimated, at 1,825 km². The estimation of area was signifi cantly increased to 3,090 km² in 2006. The DAU allocation for Nias Selatan district increased further from Rp 194 billion in 2006 to Rp 231 billion in 2007.

Managing Resources to Build Back and Create a Better Future for Nias
Nias Public Expenditure Analysis 2007
12
CHAPTER 2 Revenue and Financing
Figure 2.5 DAU per capita by district in North Sumatra, 2005-06
0 200 400 600 800 1,000 1,200 1,400
Kota Medan
Kab. Asahan
Kab. Serdang Berdagai
Kab. Tapanuli Selatan
Kab. Dairi
Kab. Humbang
Kab. Tanah Karo
Kota Tanjung Balai
Kota Sibolga
Rp '000
Nias
Nias Selatan
DAU per capita 2005
Nias Selatan
0 500 1,000 1,500 2,000 2,500 3,000 3,500 4,000
Kota Medan
Kab. Labuhan Batu
Kab. Simalungun
Kab. Mandailing Natal
Kota Binjai
Kab. Dairi
Kota Tanjung Balai
Kota Tebing Tinggi
Kota Sibolga
Rp '000
Nias
DAU per capita 2006
Source: World Bank staff estimates based on data from MoF.
Despite the increase, Nias Selatan district still receives a relatively low DAU allocation. Although Nias Selatan district sits at the bottom of most of the fi scal needs indicators compared with other districts in North Sumatra, this is not refl ected in its DAU allocation. In 2005, the district had the lowest Human Development Index rating, the highest cost index, and the second-lowest GRDP per capita, and yet in terms of DAU allocations it is one of the districts with the lowest per capita allocations. The reason for this is that both Nias and Nias Selatan districts (but particularly Nias Selatan) have relatively small numbers of civil servants, which results in lower DAU allocations to cover personnel expenses.
Both Nias and Nias Selatan districts managed to have their budgets approved before April 2007 and therefore avoided being penalized by having their DAU transfers cut. A recent decree by the Ministry of Finance states that district governments will be sanctioned by having their DAU allocations cut by up to 25 percent if their budgets are not approved by the end of March — in the current fi nancial year this means by the end of March 2007. The threat of sanctions by the Ministry of Finance has greatly improved the budget approval time, and the districts of Nias and Nias Selatan are no exception. In 2006, prior to the decree, Nias district approved its budget in August 2006, while Nias Selatan district only approved its 2006 budget in December 2006.
Own-Source Revenue (PAD)5
Own-source revenue has historically played an insignifi cant role in district government revenues in Indonesia, and even less of a role in Nias and Nias Selatan. The major potential taxes continue to be administered and collected by the central government. In 2004, PAD on average contributed slightly more than 8 percent of total district government revenue nationwide (World Bank, 2007a). The contribution of PAD — which broadly consists of four categories: local taxes, retributions, profi ts from locally-owned enterprises, and other eligible own-source revenues — to total revenue is even smaller in Nias and Nias Selatan districts. Overall, PAD in the two districts only represents 3 percent of total revenue after decentralization, a slight increase from 2 percent pre-decentralization.
Despite its low contribution to total revenue, PAD increased signifi cantly on Nias island following decentralization, but then experienced a sharp decline in 2004 and 2005. From 1999 to 2003 PAD increased almost fourfold (Table 2.3). This increase was partly due to an expansion of the local tax base and a large increase of other eligible own-source revenue.6 The declining of PAD in 2004 and 2005 was due to low revenue gained from
5 Local taxes and retributions are regulated by Law No. 34/2000 and government regulations (PP No. 65/2001 and PP No. 66/2001). Local government is given some autonomy to expand local tax (should meet “good tax criteria” and be approved by the MoF) and retributions. Law No. 34/2000 stipulates seven types of local taxes (hotel tax, restaurant tax, entertainment tax, advertisement tax, street lighting tax, mining resource type C tax, and parking tax) and three type of retributions (general services, business services, and special licensing).
6 Other own-source revenue among others includes: selling local assets, giro services, deposit interest, third party donation, and revenue from tax and retribution debts.

13Managing Resources to Build Back and Create a Better Future for Nias
Nias Public Expenditure Analysis 2007 CHAPTER 2 Revenue and Financing
local tax collection and other eligible own-sources revenue. In 2005, the sharp decrease was probably caused by the March earthquake, which severely damaged local property and businesses, thus reducing the local tax base. The implementation of decentralization has also altered the composition of PAD on the island. Local retribution was the main source of PAD, contributing more than 60 percent of Nias island’s PAD prior to decentralization. After decentralization, this fell to around 46 percent, on average, in 2001-05. The contributions of other eligible PAD have increased signifi cantly following decentralization.
Table 2.3 Composition of Nias island PAD, 1999-2005Rp million at constant 2000 prices
Own-Source Revenue
1999 2001 2002 2003 2004 2005
% % % % % %
Local Taxes 845 36.4 1,996 39.1 1,655 31.1 1,884 21.0 1,724 26.9 1,450 28.4
Retributions 1,474 63.6 768 15.0 1,375 25.9 2,693 30.0 3,405 53.0 2,330 45.6
Profi t from Reg. Owned Enterp.
0 0.0 0 0.0 159 3.0 0 0.0 0 0.0 0 0.0
Other Own-Source Revenues
0 0.0 2,347 45.9 2,129 40.0 4,392 49.0 1,291 20.1 1,328 26.0
Total 2,319 100.0 5,111 100.0 5,319 100.0 8,969 100.0 6,419 100.0 5,108 100.0
Source: World Bank staff calculations based on data from SIKD/MoF and World Bank Decentralization database. Data are in real terms.
Since decentralization the extracting and processing of mining resource type C tax has become the main source of local taxes.7 Before decentralization, street lighting tax was the major contributor to local taxes. From 2001 to 2005, mining resource type C tax contributed, on average, 53 percent of district tax revenues, followed by street lighting tax with a 32 percent share (Figure 2.6).
Figure 2.6 Composition of Nias island local taxes,8 1999-2005
0%
20%
40%
60%
80%
100%
9991
1002
2002
3002
4002
5002
Other
Utilization of undergroundand surface water tax
Mining resource type C tax
Street lighting tax
Entertainment tax
Hotel and restaurant tax
Advertisement tax
Source: World Bank staff calculations based on data from SIKD/MoF and World Bank Decentralization database. Data are in real terms (constant 2000 prices).
A provincial comparison indicates that Nias and Nias Selatan districts have among the lowest per capita PAD in North Sumatra. Nias Selatan district is ranked the lowest and Nias district is the fi fth lowest in terms of PAD per capita. Of note, all district governments in North Sumatra have per capita PAD below the national average. The
7 Type C mining includes base mineral such as bentonit, andesit, pumice, zeolit and limestone.
8 Tax on utilization of underground and surface water principally belongs to the provincial government but is shared with district govern-ments as stipulated by Law No. 34/2000. However, the two district governments on Nias recorded this tax as local tax in 2001 and 2002 local budget. Hotel tax and restaurant tax were separated after decentralization. However, the two district governments are still recording them as single account. In addition, parking tax, which is local tax, was not recorded in the district budgets. Most likely the district governments classifi ed parking tax as user charges.

Managing Resources to Build Back and Create a Better Future for Nias
Nias Public Expenditure Analysis 2007
14
CHAPTER 2 Revenue and Financing
variation among districts ranges from Rp 128,310 in Medan to only Rp 3,343 in Nias Selatan. The data also suggest that the current local tax and retribution structures favor urban areas (kota) with their increased economic activity and thus larger tax bases compared with rural areas (kabupaten) (Annexes Figure B.8.1).
After decentralization, there has been an attempt to maximize PAD on Nias island. Today, similar to other district governments, the two district governments on Nias are considering creating new local taxes and retributions, such as levying a warehouse license charge and charges on coastal commodities. These intentions stem from the perception that local autonomy allows districts to impose levies to fund district budgets after decentralization. However, any attempts to create new local taxes and retributions should be carefully planned and evaluated. Over-extending PAD may harm the local economy, as it risks increasing the cost of doing business.
Tax-Sharing Revenue
Tax-sharing revenue comprises primarily land and building tax (PBB), land and building transfer fees (BPHTB), and personal income tax (PPh). According to the sharing arrangements as stipulated in Law No. 33/2004, district governments receive allocations of 81 percent, 80 percent, and 20 percent as shares of PBB, BPHTB, and PPh, respectively. Although PBB and BPHTB are administered by the central government, the responsibility for tax billing and collection is divided between the central and district governments. The central government’s deconcentrated tax offi ce is in charge of printing and sending notifi cations of the due amount and date, while district governments are responsible for following up on tax collection after billings have been sent. The central government’s share of PBB and BPHTB is directly transferred back to district governments, with an allocation of 65 percent distributed equally to all kabupaten/kota in Indonesia and 35 percent allocated as an incentive for kabupaten/kota that achieve their targets. In addition to the tax-sharing from central government, district governments are also entitled to receive tax-sharing from provincial governments from vehicle and water taxes.
The revenue from tax-sharing rose by 88 percent between 1999 and 2002. With the exception of 2003, it continued to increase from 1999 to 2005. The increase after decentralization is largely the result of new sharing arrangements for personal income tax. In the past, income tax was fully retained by the central government.
Despite increases in real terms, the share of tax-sharing to total revenue has fl uctuated and is projected to decline sharply in 2006. The contribution of tax-sharing to total revenue ranged between 6.4 percent and 7.7 percent in 2001-05 and is estimated to fall to only 2.5 percent in 2006. This decline is caused by the large increase in the DAU and DAK allocations to both districts in 2006 (Table 2.4).
Table 2.4 Nias and Nias Selatan tax-sharing revenue Rp million at constant 2000 prices
Year
Nias Nias Selatan Nias Aggregate
Tax Sharing
Total Revenue
% Tax-Sharing to Total
Revenue
Tax Sharing
Total Revenue
% Tax-Sharing to Total
Revenue
Tax Sharing
Total Revenue
% Tax-Sharing to Total
Revenue
1999 8,461 111,110 7.6 8,461 111,110 7.6
2001 13,472 206,597 6.5 13,472 206,597 6.5
2002 15,950 205,932 7.7 15,950 205,932 7.7
2003 13,733 216,101 6.4 13,733 216,101 6.4
2004 9,690 163,477 5.9 7,438 63,364 11.7 17,127 226,841 7.6
2005 10,373 162,069 6.4 7,755 82,721 9.4 18,128 244,790 7.4
2006* 6,064 265,446 2.3 4,734 170,410 2.8 10,798 435,856 2.5
Source: World Bank staff estimates based on data from APBD, SIKD/MoF, BPS-SK. Note: *Planned budget.

15Managing Resources to Build Back and Create a Better Future for Nias
Nias Public Expenditure Analysis 2007 CHAPTER 2 Revenue and Financing
Land and building tax is the major source of the tax-sharing revenue for both Nias and Nias Selatan districts and contributed up to 81 percent of total tax-sharing in 2005. This was followed by income tax and transfer fees on land and buildings, with an average share of 12 percent and 8 percent of tax-sharing revenue, respectively (Figure 2.7). The large share of land and building tax is evident nationwide, accounting for almost half of all tax-sharing revenue in 2004. This points to the importance of land and building tax for developing regions where the expansion in the use of land is relatively rapid. For income tax, although its role has increased in recent years, its relatively small share refl ects the continuing limited income tax base in Nias and Nias Selatan districts.
Figure 2.7 Composition of tax-sharing revenue in Nias and Nias Selatan, 1999-2006
2006*
0
0.2
0.4
0.6
0.8
1
1999 2001 2002 2003 2004 2005
Land and Building Tax (PBB) Real Estate Transfer Tax (BPHTB)
Income Tax (PPh) Fuel Tax
Other Tax-Sharing
Nias
2006*
Nias Selatan
0%
20%
40%
60%
80%
100%
2004 2005
Land a nd B uilding Tax (PBB) Real E state Transfer Tax ( BPHTB)
Income Tax ( PPh) Fuel T ax
Other Tax-Sharing
Source: World Bank staff estimates based on data from APBD, SIKD/MoF, BPS-SK.Note: *Planned budget.
Nias and Nias Selatan districts recorded the lowest tax-sharing revenue per capita compared with other districts in North Sumatra in 2005. All district governments in North Sumatra, except Pakpak Bharat, have per capita tax-sharing revenues below the national average. As a recently separated district, Nias Selatan has been left behind by other newly formed districts in North Sumatra, such as Pakpak Bharat, Humbang Hasundutan, and Samosir. These three new districts achieved tax-sharing per capita revenues above the provincial average of Rp 79,794. Pakpak Bharat district has the highest tax-sharing per capita revenue at almost Rp 350,000, about 10 times higher than Nias and Nias Selatan’s per capita tax-sharing revenues (Annexes Figure B.8.4).
Natural Resources (Non-Tax) Revenue-Sharing
Law No.33/2004 expands the coverage of non-tax revenue-sharing to include the forestry, general mining, fi sheries, oil, gas, and geothermal sectors. Prior to decentralization, non-tax sharing covered only the forestry and mining sectors. The sharing arrangements diff er across types of natural resources and levels of government (central, provincial, producing and non-producing district governments).9 Except for oil and gas revenue-sharing, regional governments retain 80 percent of all revenue from shared natural resources. A distinction is made between producing and non-producing districts. From this 80 percent of total revenue transferred to regional governments, 80 percent (or 64 percent of the original total revenue) is transferred to districts governments. Of this, half is earmarked for producing districts and the other half is distributed equally between the non-producing districts (including cities). This ensures that in general producing districts receive a greater share given that there are more non-producing districts in a province.
The contribution of non-tax revenue-sharing towards total revenue is very small. Its contribution to total revenue, on average, is only less than 1 percent, even lower than PAD contributions. Nonetheless, this form of revenue showed a steady increase after decentralization, although it then experienced a sharp decline in 2004 and 2005.
9 For details of the sharing arrangements between central, provincial, and district governments, see Law No. 33/2004.

Managing Resources to Build Back and Create a Better Future for Nias
Nias Public Expenditure Analysis 2007
16
CHAPTER 2 Revenue and Financing
The initial increase was partly driven by an expansion in the types of natural resources included in revenue-sharing. The decline in 2004 was caused by a sharp drop in revenue from the forestry sector. In 2005, revenue from forestry continued to decline along with a contraction in revenues from fi sheries and oil sharing (Annexes Figure B.8.4).
The composition of non-tax revenue-sharing changed before and after decentralization. The introduction of decentralization, which expanded the types of natural resources to be shared with district governments, is behind this transformation. Forestry and “others” categories were the main sources before decentralization. Following decentralization, oil and fi sheries gained in importance. While fi shery revenues come largely from the locally-owned fi shery industry, oil revenues come from revenue-sharing with other oil producing districts in North Sumatra (Figure 2.8). However, despite being stipulated in the law, Nias and Nias Selatan districts receive no revenue-sharing from mining, gas, or geothermal, as North Sumatra has no districts that are active in these sectors.
Figure 2.8 Composition of non-tax revenues in Nias and Nias Selatan pre- and post-decentralization, 1997-2005
0%
20%
40%
60%
80%
100%
1997 1998 1999 2001 2002 2003 2004 2005
Others
State land right issue
Oil
Fishery resource fee
Fishery corporation fee
Forestry-land rent (IHPH)
Forestry-resource rent(IHH)/(PSDH)
Source: World Bank staff calculations based on data from SIKD/MoF and World Bank Decentralization database. Data are in real terms (constant 2000 prices).
Special Allocation Fund (DAK)
The Special Allocation Fund (DAK) is an earmarked or conditional transfer aimed at fi nancing specifi c needs in the regions or programs that are national priorities and not covered by the DAU. The DAK is fi nanced from the national budget (APBN) and is transferred quarterly directly to district governments based on project progress. Unlike the DAU, the district is required to provide a matching fund from its own district budget (APBD) at a minimum of 10 percent of the project budget, the only exception being district governments with limited fi scal capacity. This ensures that district governments make provision for operational costs. The DAK is allocated based on three criteria: (i) general criteria (related to the net fi scal position of a district by subtracting civil servants’ salaries from total revenue and dividing the total by the national average), (ii) special criteria (provinces that are eligible based on the size of coastal areas, confl ict and under-development), and (iii) technical criteria (set by sectoral departments in the central government in consultation with the MoF and MoHA).
Despite their small contribution to overall revenues, DAK allocations for Nias and Nias Selatan have risen markedly every year. DAK allocations increased by a factor of 15 in real terms from Rp 1.3 billion in 2003 to more than Rp 20 billion in 2005, and more than doubled in 2006 to Rp 44 billion (Figure 2.9). This large increase is partly due to the expansion of the sectors covered by the DAK allocation. Along with this steady increase, the DAK’s share of total revenue increased to 8 percent in 2005, from less than 1 percent on average in 2001-04. This is relatively higher than the national average of 2.2 percent of total revenue in 2004. The two districts receive almost equal shares of DAK.

17Managing Resources to Build Back and Create a Better Future for Nias
Nias Public Expenditure Analysis 2007 CHAPTER 2 Revenue and Financing
Figure 2.9 Trend of DAK allocations for Nias and Nias Selatan
0
10
20
30
40
50
2002 2003 2004 2005 2006
Rp b
illio
n
Source: World Bank staff calculations based on data from SIKD/MoF and World Bank Decentralization database. Data are in real terms (constant 2000 prices).
Since 2003, the coverage of the DAK has been expanded to cover several additional sectors, such as infrastructure, education, health, government facilities, agriculture, fi sheries, and the environment. In 2002, the DAK was used only to fi nance reforestation. In 2003, the DAK allocated for Nias island was mainly to fi nance infrastructure projects. Starting in 2004, the DAK was expanded to cover sectors such as education, health, fi sheries, and agriculture. In 2005, the DAK was allocated to two main sectors: infrastructure (31 percent) and education (31 percent) (Figure 2.10).
Figure 2.10 Composition of DAK allocations to Nias island, 2002-05
0%
20%
40%
60%
80%
100%
2002 2003 2004 2005
Agriculture
Government facilities
Education
Health
Infrastructure (road,water, and irrigation)
Forestry
Source: World Bank staff calculations based on data from SIKD/MoF and World Bank Decentralization database.
Although Nias Selatan district was newly established and relatively poor, it did not receive any DAK transfer in 2004. According to the local government secretary of Nias district, the requirement to fulfi ll the general, specifi c and technical criteria makes it diffi cult for the two districts in Nias to qualify for DAK transfers. Even if the criteria are met, the additional requirement to provide matching funding and to meet nationally set development objectives further reduces the scale of DAK transfers.
In terms of per capita DAK transfers, prior to 2005 the two districts on Nias were not a priority despite their relative poverty and isolation. In 2005, this situation started to improve somewhat as DAK contributions increased.

Managing Resources to Build Back and Create a Better Future for Nias
Nias Public Expenditure Analysis 2007
18
CHAPTER 2 Revenue and Financing
In 2006, Nias received per capita DAK transfers of Rp 73,000 (a 141 percent increase on the previous year), while Nias Selatan district received Rp 115,000 per capita (a 119 percent increase on the previous year) (Annexes Figure B.8.8). Nonetheless, given the challenging circumstances of the two districts it is surprising that they have not been prioritized for higher DAK allocations.
Financing and Borrowing
Budget balance has fl uctuated after decentralization.10 Nias island generated a surplus after 2000, which accounted of 2 percent of the total budget, but then went into a defi cit of 5 percent in 2003. In 2005, the district governments of Nias and Nias Selatan generated a substantial unspent balance of 11 percent of the total budget, indicating the low capacity of the district governments in implementing their programs (Figure 2.11).
Figure 2.11 Budget surplus and defi cit in Nias and Nias Selatan, 1994-2005
-8
-6
-4
-2
0
2
4
6
8
10
12
14
1994 1995 1996 1997 1998 1999 2000 2001 2002 2003 2004 2005
tnecreP
Source: World Bank staff calculations based on data from SIKD/MoF and World Bank Decentralization database. Data are in real terms (constant 2000 prices).
Nias and Nias Selatan have no record of borrowing transactions in their budgets and had both accumulated signifi cant reserves by the end of 2005. Nias district’s reserves have increased by 7 percent from Rp 13 billion in 2001 to Rp 108 billion in 2005. Even as a newly created district, Nias Selatan was still able to accumulate a reserve of Rp 42.5 billion in 2005, an increase of almost fi ve times on the previous year (Table 2.5). Table 2.5 Accumulated reserves in Nias and Nias Selatan, 2001-05 Rp million at constant 2000 prices
2001 2002 2003 2004 2005
Nias
Budget balance (surplus/defi cit) 4,963 10,080 (12,128) 69,918 86,774
Carry over 8,046 12,204 23,049 13,082 21,252
Reserves end of period 13,009 22,284 10,921 82,999 108,026
Nias Selatan
Budget balance (surplus/defi cit) 9,041 21,235
Carry over 365 21,252
Reserves end of period 9,406 42,486
Source: World Bank staff calculations based on data from SIKD/MoF and World Bank Decentralization database. Data are in real terms.
10 The calculation of net budget surplus and defi cit does not take into account loan, repayment, and carry over from previous years as well as into following years.

19Managing Resources to Build Back and Create a Better Future for Nias
Nias Public Expenditure Analysis 2007 CHAPTER 2 Revenue and Financing
The accumulation of reserves is often caused by delays in budget approval and delays in the transfer of revenue-sharing funds from the central government. These delays slow project implementation. The amounts not disbursed then appear as surpluses in district governments’ budgets and are carried forward to the next fi scal year. To support timely disbursal, the budget approval process needs to be streamlined and transfers of shared revenues from the central government must occur on a quarterly basis (World Bank, 2007a). Most of the unspent budget funds sit in deposit accounts with commercial banks, but are nonetheless recorded by Bank Indonesia.
Recommendations
Improve and clarify the allocation mechanism of non-tax revenue-sharing for Nias Selatan district. Nias Selatan has received no revenue from natural resources revenue-sharing since 2004, although it is entitled to receive revenue-sharing allocations from oil and gas revenues generated in North Sumatra.
Conduct analysis to determine why Nias Selatan does not receive shared revenue from the fi sheries sector. As a district that is part of an island group, the lack of shared revenue from fi sheries is perplexing. It is possible that this revenue is still being captured by Nias district, thus denying resources to the budget of Nias Selatan district.
The two district governments should focus on stimulating economic activities rather than seeking to maximize own-source revenue in the short term. Seeking to maximize PAD by taxing additional activities could act as a disincentive to economic activity. A plethora of new local tax regulations may also be confusing and diffi cult to administer. District governments need to carefully consider the cost of collection implied in new PAD regulations to ensure that each levy is economically viable.
The central government needs to improve the fi scal position of the two districts by continuing the policy of allocating the DAK to lagging regions. Although the DAU has increased signifi cantly in Nias and Nias Selatan the transfer does not take into suffi cient account indicators such as poverty level, cost index, and Human Development Index ratings. The failure of the DAU to address the fi scal imbalances that aff ect the two districts is a cause of concern and should be carefully and jointly analyzed by both the central and the two district governments.
Maintain the timely approval of budgets going forward and allocate unspent resources eff ectively. To support timely disbursal, the budget approval process needs to be streamlined and transfers of shared revenues from the central government must occur on a quarterly basis. This requires timely production estimates from the sectoral ministries.

Managing Resources to Build Back and Create a Better Future for Nias
Nias Public Expenditure Analysis 2007
20
CHAPTER 2 Revenue and Financing

CHAPTER 3 Expenditure
Nias Public Expenditure Analysis 2007

Managing Resources to Build Back and Create a Better Future for Nias
Nias Public Expenditure Analysis 2007
22
CHAPTER 3 Expenditure
Overall Expenditure in Nias and Nias Selatan
The implementation of decentralization in 2001 has signifi cantly changed the expenditure pattern between the central and regional (provincial and district) governments. Regional governments assumed a greater role after decentralization, with greater authority over budget allocations and regional spending. The share of regional spending in total government expenditure in Indonesia rose from 17 percent pre-decentralization to more than 30 percent after decentralization (World Bank, 2002). District governments are now responsible for most service delivery functions in many sectors, including health and education. In addition, civil servants in the regions previously under the authority of the central government were transferred to regional governments and fi nanced from regional government budgets.
Total public expenditure in Nias and Nias Selatan districts has risen markedly since decentralization and the March 2005 earthquake. Taking district governments’ budgets, deconcentration funds and the reconstruction budget together, total public resources spent in Nias and Nias Selatan districts have increased by more than 12 times their pre-decentralization level in real terms. Total public expenditure increased from Rp 113 billion in 1999 to Rp 1.7 trillion in 2006 (Figure 3.1). This increase was driven by large increases in all revenue sources. In 2006, regular district government spending alone increased by more than three times compared with the 1999 spending level. At the same time, the central government also spent substantial resources. On top of regular government spending, the two districts also received significant resources from donors, NGOs, and the central government to build back improved public infrastructure and services after the March 2005 earthquake.
Figure 3.1 Nias public spending pre and post decentralization, and after the earthquake
1681221
401
196113
1,132
0
250
500
750
1000
1250
1500
1750
1999 2002 2006
Reconstruction spending
Nias & Nias Selatan LG expenditure
Deconcentration Fund (Central Govt)
Rp b
illio
n
Source: World Bank staff estimates based on data from APBD, SIKD/MoF, BPS-SK, and BRR. Data are in real terms (constant 2000 prices).
In real terms, regular district government spending increased by a factor of 3.6 between 1999 and 2006 (Figure 3.2). In nominal terms, expenditure rose from Rp 101 billion in 1999 to Rp 569 billion in 2006. In 2001-03, district government spending increased steadily. Although expenditure actually increased in nominal terms, it declined slightly in 2004 and 2005 in real terms. The large increase in inter-governmental transfers from central to district governments after decentralization accounts for the largest share of the expenditure increase. In 2006, both Nias and Nias Selatan also benefi ted greatly from a substantial increase in the DAU allocation nationwide, almost doubling the two district governments’ spending.

23Managing Resources to Build Back and Create a Better Future for Nias
Nias Public Expenditure Analysis 2007 CHAPTER 3 Expenditure
Figure 3.2 Nias and Nias Selatan expenditure
Nias & Nias Selatan
Nias
0
100
200
300
400
500
4991
5991
6991
7991
8991
9991
0002
1002
2002
3002
4002
5002
6002
noillib pR
*
Source: World Bank staff estimates based on data from APBD, SIKD/MoF, BPS-SK, and BRR. Data are in real terms (constant 2000 prices). Note: *Planned budget.
Routine vs Development Expenditure11
Since the implementation of decentralization, Nias and Nias Selatan districts have consistently spent the majority of their resources on routine expenditure, leaving limited resources for development. Prior to decentralization, the composition of spending was more balanced. Before 1998, an average of 65 percent of spending on the island went towards development functions. Since then, spending has become increasingly dominated by routine expenditure. Over 2001-05, routine spending on average made up 66 percent of total Nias and Nias Selatan expenditures (Figure 3.3) The transfer of responsibility for the payment of most regionally based civil servants’ salaries from the central to district governments contributed substantially to the high share of routine spending in 2002. In addition, the splitting of Nias Selatan district from Nias district in 2003 further drove the increase in routine spending in 2004. In contrast, development spending has continuously declined since decentralization, with an average share of 34 percent of total expenditure in 2005.
11 The Ministerial Decree (Kepmendagri No. 29/2002) has changed the local government budget format from a distinction between routine and development expenditures to apparatus and public expenditures. However, the expenditure analysis in this section is based on the old for-mat classifi cation of routine and development expenditure to enable a comparison of budget data over time. Expenditure items in the pre-2003 budgets cannot be converted into the new format, but post-2003 budgets can be converted to the old format (Figure B.6).

Managing Resources to Build Back and Create a Better Future for Nias
Nias Public Expenditure Analysis 2007
24
CHAPTER 3 Expenditure
Figure 3.3 Shares of district government expenditure in Nias and Nias Selatan
Routine Expenditure
Development Expenditure
1994 1995 1996 1997 1998 1999 2000 2001 2002 2003 2004 2005
)%( erutidnepxe latot fo erahS
Source: World Bank staff estimates based on data from APBD, SIKD/MoF, BPS-SK.
Sectoral spending is dominated by the education sector, averaging 43.5 percent of total spending over 2001-05 (Figure 3.4). Government administration received the second-largest share of total spending, at an average 21 percent. This share rose throughout the period, crowding out spending on infrastructure, which has been declining since 2003.
Figure 3.4 Overall sectoral expenditure in Nias and Nias Selatan, 2001-05
0
20
40
60
80
100
2001 2002 2003 2004 2005
noilli
b p
R
General govt adm. Infrastructure HealthEducation & culture Other sectors Subsidy & other exp.Unexpected exp.
Source: World Bank staff estimates based on data from APBD, SIKD/MoF, BPS-SK. Data are in real terms (constant 2000 prices).
Routine Expenditure
By 2005, routine expenditure had more than doubled on pre-decentralization levels. The largest share of routine spending was allocated for personnel costs. Over 2001-05, on average personnel expenses accounted for 75 percent of total routine expenditure. Spending on goods and services accounted for on average 9 percent of total routine spending. Financial assistance to sub-districts and villages gained in importance, making up 9 percent of routine expenditure in 2005. Nias and Nias Selatan, similar to other districts in Indonesia, have not paid suffi cient attention to operations and maintenance. The allocation for operations and maintenance was relatively small, accounting for only 1.5 percent of routine spending on average. In 2005, offi cial travel expenses also increased by a factor of fi ve in real terms on their 1999 levels, and the two district governments currently spend more than twice as much on travel as they spend on operations and maintenance. The other categories — which are ambiguously defi ned (e.g., miscellaneous expenses, expenses not included in miscellaneous expenses, and unexpected expenses)— increased

25Managing Resources to Build Back and Create a Better Future for Nias
Nias Public Expenditure Analysis 2007 CHAPTER 3 Expenditure
almost threefold in 2003, but have subsequently decreased. Despite their function as fungible funds, these categories should be carefully scrutinized since they have the potential for misuse (Table 3.1). In per capita terms, the two districts spent less than provincial and national averages. However, as a percentage share of total expenditure, both districts allocated more than the national and provincial averages (Annexes Figure B.8.9)
Table 3.1 Routine expenditure by economic classifi cation in Nias and Nias Selatan
Rp billion at constant 2000 prices
Routine Expenditure
1999* 2001 2002 2003 2004 2005
% % % % % %
Personnel Exp. 41.8 68.9 88.3 81.2 102.2 75.8 106.3 69.4 118.5 76.1 114.5 76.1
Goods Exp. 10.4 17.1 9.2 8.5 11.6 8.6 17.7 11.5 16.7 10.7 12.1 8.1
Operational/Maintenance Exp. 0.6 0.9 1.4 1.3 2.5 1.9 2.2 1.4 1.6 1.0 2.5 1.7
Travel Exp. 1.0 1.7 1.1 1.0 2.9 2.1 3.9 2.5 5.0 3.2 5.5 3.7
Miscellaneous Exp. 3.3 5.4 3.7 3.4 7.4 5.5 10.8 7.1 2.4 1.5 0.0 0.0
Financial Assistance to the Lower Level Govt
3.6 6.0
1.5 1.4 1.6 1.2 2.9 1.9 8.7 5.6 13.7 9.1
Exp. not included in Misc. Exp. 2.5 2.3 5.8 4.3 8.7 5.7 0.9 0.6 0.0 0.0
Unexpected Exp. 1.1 1.0 0.7 0.5 0.7 0.5 1.9 1.2 2.1 1.4
Total 60.6 100.0 108.7 100.0 134.8 100.0 153.3 100.0 155.7 100.0 150.5 100.0
Source: World Bank staff estimates based on data from APBD, SIKD/MoF, BPS-SK. Data are in real terms. Note: * Disaggregate data for fi nancial assistance to the lower level of government. Expenses that are not included in miscellaneous expenses and unexpected expenses categories were not available for 1999.
The largest proportion of routine expenditure was in the education sector, mostly to cover teachers’ salaries paid by districts governments since decentralization in 2001. On average, routine education expenditure accounted for 56 percent of total routine spending over the period 2001-05. Although in absolute terms this stayed stable at about Rp 78 billion, its share declined over time from 67 percent in 2001 to 48 percent in 2005 (Figure 3.5). The declining share of spending on education has been replaced by increased spending on government apparatus, which represents the second-largest share of routine expenditure. Over 2001-05, this increased substantially, both in absolute terms (more than doubling) and as a share of routine expenditure (rising from 21 percent to 30 percent). This trend should be analyzed further by the two district governments. Routine spending on health workers and health administration remains relatively small, averaging 7 percent of total routine expenditure in 2001-05.
Figure 3.5 Sectoral composition of routine expenditure in Nias and Nias Selatan
29.1%29.3%23.3%21.3%20.5%
7.6%7.3%
7.2%8.5%
4.3%
48.2%50.2%
55.6%60.5%
66.8%
0
40
80
120
160
2001 2002 2003 2004 2005
noillib
pR
General govt adm. Infrastructure HealthEducation & culture Other sectors Subsidy & other exp.Unexpected exp.
Source: World Bank staff estimates based on data from APBD, SIKD/MoF, BPS-SK. Data are in real terms (constant 2000 prices).

Managing Resources to Build Back and Create a Better Future for Nias
Nias Public Expenditure Analysis 2007
26
CHAPTER 3 Expenditure
Development Expenditure
District government development expenditure in Nias and Nias Selatan more than doubled after decentralization, but has declined subsequently. Development spending increased from Rp 47 billion in 1999 to almost Rp 100 billion in 2001. However, it decreased sharply in 2002 and has fl uctuated since then (Table 3.2). Following a 100 percent increase in the DAU allocation in 2006, it is expected that development spending will increase signifi cantly again. Decentralization has also altered the sectoral composition of development spending. In the past, regional development and the road and transport sector largely dominated development spending. While infrastructure remained the main sector after decentralization, its share has declined and has been substituted by increasing shares for the government apparatus and education sectors. This transformation refl ects the impact of decentralization whereby budget allocations are now decided at the local level. Compared with provincial and national averages, Nias and Nias Selatan districts have the lowest per capita level of spending on development functions, well below both national and provincial averages. In terms of share of total development expenditure, Nias district allocates less than the provincial and national averages, while Nias Selatan district is almost on a par with the provincial average of 30 percent (Annexes Figure B.8.10).
Table 3.2 Sectoral composition of development expenditure in Nias and Nias Selatan
Rp billion at constant 2000 prices
Sector
1999 2001 2002 2003 2004 2005% % % % % %
Government apparatus 2.0 3.9 3.6 3.9 6.9 11.2 3.9 5.2 12.6 22.6 16.5 24.0Agriculture 1.2 2.3 4.3 4.7 4.5 7.4 1.8 2.4 3.5 6.2 1.5 2.2
Industry and trade 0.8 1.5 2.6 2.8 0.9 1.5 2.4 3.2 1.2 2.1 0.3 0.4
Labor force 0.05 0.1 0.05 0.1 0.65 1.1 0.93 1.2 0.00 0.0 0.0 0.0
Health, social welfare 2.5 4.8 6.5 7.0 3.9 6.4 5.2 7.0 3.9 7.1 6.4 9.3
Education and culture 6.3 12.1 19.6 21.1 9.9 16.2 11.1 14.8 6.9 12.5 20.8 30.2Environment and spatial planning
0.4 0.7 0.0 0.0 0.0 0.0 0.1 0.1 0.3 0.6 0.5 0.8
Family planning and demography
0.00 0.0 0.00 0.0 0.10 0.2 0.71 1.0 2.74 4.9 0.9 1.3
Infrastructure 39.0 74.7 56.1 60.4 34.2 56.0 48.8 65.1 24.4 43.9 22.1 32.0Mineral and energy 0.1 0.2 0.0 0.0 0.0 0.0 0.0 0.0 0.0 0.0 0.0 0.0Transport, water & irrigation
16.3 31.2 37.7 40.6 22.9 37.5 39.4 52.5 23.4 42.0 21.4 31.0
Tourism and telecommunication
0.2 0.4 1.0 1.1 0.4 0.7 0.1 0.2 0.7 1.3 0.6 0.9
Regional dev., housing and settlement
22.4 42.9 17.4 18.7 10.8 17.7 9.3 12.4 0.3 0.6 0.0 0.0
Total 52.2 100.0 92.9 100.0 61.0 100.0 75.0 100.0 55.6 100.0 69.0 100.0
Source: World Bank staff estimates based on data from APBD, SIKD/MoF, BPS-SK. Data are in real terms.
Most development expenditure is allocated for infrastructure (mainly to the road, water and irrigation sub-sectors) and education. Both in real terms and as a share of total development expenditure, infrastructure spending declined signifi cantly after decentralization, from Rp 39 billion (75 percent) in 1999 to Rp 32 billion (32 percent) in 2005. Education increased in importance after decentralization and represented 30 percent of development spending in 2005. In real terms, the allocation for education tripled by 2005 from pre-decentralization levels. Spending on government apparatus increased more than eightfold from 1999 to 2005. Its share of total development spending increased continuously from less than 4 percent in 1999 to 24 percent in 2005. The substantial increase in 2004 was probably due to the additional support needed for the new district government facilities and infrastructure in Nias Selatan district (Figure 3.6).

27Managing Resources to Build Back and Create a Better Future for Nias
Nias Public Expenditure Analysis 2007 CHAPTER 3 Expenditure
Figure 3.6 Sectoral composition and trends in development expenditure in Nias and Nias Selatan
0
10
20
30
40
50
2001 2002 2003 2004 2005
noillib pR
General govt adm. Infrastructure Health
Education & culture Other sectors
Source: World Bank staff estimates based on data from APBD, SIKD/MoF, BPS-SK. Data are in real terms (constant 2000 prices).
Apparatus vs Public Expenditure
The introduction of Ministerial Decree No. 29/2002 (Kepmen No. 29/2002) has changed the district government budget format from a routine and development classifi cation to an apparatus and public expenditure category. The new budget format has markedly changed the structure of expenditure, while the revenue structure has remained largely the same. The new format of expenditure aff ects mainly the structure of district budgets, as it focuses on benefi ciaries rather than programs and projects. Under the new structure, spending on activities and programs that benefi t the general public are reported under public expenditure, while spending on programs earmarked for the government apparatus are reported under apparatus expenditure. The new revenue format excludes carry-over and borrowing accounts, and follows the unifi ed budget structure that classifi es expenditure into government apparatus and public expenditure. In addition, the new budget format has a separate fi nancing account, which includes all borrowing transactions, reserves, and other fi nancing fl ows. Among the revenue items now considered fi nancing infl ows are loans and carry-overs from the previous year. Among expenditures or fi nancing outfl ows are the carry-overs into the following year and payments of loan principal. In addition, the new budget format also includes items such as transfers from/into reserve funds and sales/acquisitions of fi nancial assets into fi nancing accounts.
Based on the new budget format, Nias and Nias Selatan districts have mixed budget allocations. Nias district started using the new budget format in 2004, while Nias Selatan district only started using the new format in 2005, regardless of the fact that the regulation became active in 2003. Looking at allocations for 2005, in Nias district almost three quarters of the budget was allocated to apparatus expenditure, while the public expenditure category accounted for only 24 percent of total expenditure. In contrast, Nias Selatan district spent its budget to a greater extent on projects that benefi ted the public (52 percent), while apparatus expenses only accounted for 32 percent. Both district governments allocated relatively small shares of their budgets for capital expenditure: 11 percent of Nias district’s budget and only 5 percent of Nias Selatan district’s budget (Table 3.3).

Managing Resources to Build Back and Create a Better Future for Nias
Nias Public Expenditure Analysis 2007
28
CHAPTER 3 Expenditure
Table 3.3 Apparatus and public expenditures in Nias and Nias Selatan, 2005Rp billion
ExpenditureNias Nias Selatan Total
% % %
Apparatus Expense 159.2 71 31.5 36 190.7 61General Administration 141.3 63 25.4 29 166.7 54
Operational & Maintenance 12.4 6 4.1 5 16.4 5
Capital 5.6 2 2.0 2 7.5 2
Public Expense 52.8 24 45.0 52 97.9 31General Administration 2.0 1 22.2 26 24.2 8
Operational & Maintenance 31.6 14 20.2 23 51.8 17
Capital 19.3 9 2.6 3 21.9 7
Unexpected Expenses 2.1 1 0.9 1 3.0 1Financial Assistance & Sharing Exp 9.8 4 9.6 11 19.4 6Total 224.0 100 87.0 100 311.0 100
Source: World Bank staff estimates based on data from APBD, SIKD-MoF.
Planned vs Realized Expenditure
Nias and Nias Selatan district governments have under-spent their planned expenditures, especially on development programs. In 2004, the two district governments were only able to spend 79 percent of planned expenditure for development programs. This level of realization failed to improve in 2005, when the two district governments were only able to spend 64 percent of their development budgets. Routine expenditure showed a higher realization rate of 98 percent in 2004 and 92 percent in 2005 (Table 3.4). The better realization performance of routine expenditure is because most routine spending is used to fi nance the operations and salaries of district government offi cials and do not require complex project preparation. Low absorptive capacity of district governments, together with delays in budget approval processes leaving limited time for project implementation, explain the low realization rate of development spending. Furthermore, the very low realization rate seen in 2005 was also a result of the earthquake, which unsurprisingly disrupted work on the budget approval processes.
Table 3.4 Planned vs realized expenditure in Nias and Nias Selatan Rp billion
Expenditures
2004 2005Planned Realized % realization Planned Realized % realization
Personnel 157 156 99 169 162 96Goods & services 24 22 91 19 17 92Operation & maintenance 2 2 87 4 4 95Offi cial travel 7 7 93 9 8 92Other 4 3 83 - - 0Financial assistance & unexpected expenses 16 15 97 31 22 73Total Routine 210 205 98 233 215 92Total Development 93 73 79 154 98 64
Source: World Bank staff estimates based on data from APBD, SIKD/MoF, BPS-SK.
Reconstruction Spending in Nias
US$495 million had been allocated for the recovery and reconstruction process on Nias island by end of December 2006 (Figure 3.7). This amount slightly exceeded the estimated needs, at US$423 million, and is expected to increase in coming years, especially from the government budget (via BRR) until 2009. These additional funds provide an opportunity for the two districts on Nias island to improve their public services and infrastructure. In order

29Managing Resources to Build Back and Create a Better Future for Nias
Nias Public Expenditure Analysis 2007 CHAPTER 3 Expenditure
to upgrade public services and infrastructure on the island, which were already inadequate before the earthquake, BRR estimates that an additional US$1 billion is needed (BRR, 2006). Donors play an important role on the island and have contributed US$200 million, or 40 percent of total allocated funds, followed by the central government (BRR) and NGOs, with contributions of US$131 million and US$159 million, respectively. Although in aggregate the fi nancing needs have been met, Nias Selatan district remains underfunded and as much as US$19 million is still needed to meet the identifi ed needs of that district.
Figure 3.7 Project allocations vs reconstruction needs for Nias island, December 2006
Donors(204)
D & L (392)
GoI(131)
NGOs(160)
0
100
200
300
400
500
600
1 2
noillim $
SU
ProgramNeeds
Aggregate (Nias and Nias Selatan combined)
(231) (161)
(353)
(142)
0
50
100
150
200
250
300
350
400
Nias Nias Selatan
noilli
m $S
U
Needs Program
Disaggregate Nias and Nias Selatan
Source: World Bank staff estimates, BRR, and IOM Post Disaster Damage Assessment.
Disbursement is relatively slow in Nias and Nias Selatan. By the end of December 2006 only 35 percent of allocated funds had been realized. The remoteness of the islands, high transportation costs in ferrying materials from Sumatra, poor transportation networks within the island group, a lack of skilled labor, and a lack of construction materials are key challenges in Nias and Nias Selatan. Nias district’s disbursement rates are lower than those in Aceh, where half of all allocated funds had been spent by the end of December 2006. While Nias district has made relatively better progress, with 43 percent of its allocated funds disbursed by the end of December 2006, the lack of progress in Nias Selatan district is alarming: by the end of December 2006 only 18 percent of funds had been spent (Figure 3.8).
Figure 3.8 Reconstruction disbursement in Nias and Nias Selatan
Aggregate (Nias and Nias Selatan combined)
GoI(131) (76)
NGOs(159)
(60) (41)
Donors(204)
0
100
200
300
400
500
600
Project Disbursement
noilli
m $
SU
(35%)
Disaggregate Nias and Nias Selatan
Program(353)
Program(142) Disbursement
(18%)
0
100
200
300
400
Nias N ias Selatan
noilli
m $
SU
Disbursement
(43%)
Source: World Bank staff estimates/BRR.

Managing Resources to Build Back and Create a Better Future for Nias
Nias Public Expenditure Analysis 2007
30
CHAPTER 3 Expenditure
BRR Reconstruction Progress
BRR’s budget allocation for Nias and Nias Selatan increased by eight times from US$13 million in 2005 to US$118 in 2006. In total, BRR’s accumulative allocation reached US$131 million in 2006. This vast increase in BRR’s allocation in 2006 seems to have been unequally divided between the two districts. Nias district received ten times more in 2006, up from US$11 million in 2005 to US$115 million in 2006. Meanwhile, the overall fi nancial needs in Nias Selatan district remain unmet: BRR only allocated a US$2.7 million in 2006, a slight increase on US$1.5 million in 2005. The future allocation should take into account geographical needs and aim at closing this regional gap.
Overall, housing and infrastructure sectors received the largest allocation from the BRR budget. In total, BRR has allocated US$100 million, or 76 percent of total budget, for this sector (Annexes Figure B.8.12.). This priority is in line with the level of sectoral damage resulting from the earthquake. Housing and infrastructure sectors were severely damaged, accounting for 77 percent of total damage, valued at US$305 million. Health and education received the second-largest allocation.
Despite facing many challenges in the fi eld, BRR recorded relatively high disbursement rates compared with other reconstruction players on the island. As of December 2006, BRR had disbursed about 60 percent of its 2005 and 2006 budgets, equivalent to US$75 million. Disbursement ratios vary across sectors, with health and education having relatively prompt disbursement rates compared with other sectors. By the end of December 2006, 75 percent of allocated budget for these two sectors combined had been spent. Institutional development and housing/infrastructure made least progress, with only 46 percent and 56 percent of their budgets disbursed, respectively, by the end of 2006.
Recommendations
The two district governments on Nias island need to restrain expenditures on routine functions and restrain spending on government apparatus. Routine expenditure more than doubled between 1999 and 2005. More worrying, its share of total expenditure increased to 66 percent on average in 2001-05, two thirds of which went towards paying salaries. Special attention should also be given to the increases in travel expenses and the “others” category of routine expenditure. Spending on operations and maintenance should be increased, especially given the growing need to maintain infrastructure built during the reconstruction process. There is obviously a need to ensure that demands to raise routine expenditure items are balanced against the need to invest in key sectors for the future long-term development of the island.
Public services and infrastructure should be the priorities of development expenditure. Consequently, the allocation of development expenditure for government apparatus should be scrutinized. Sectoral development spending on infrastructure has gradually declined, replaced by an increase in spending on government apparatus. The relatively higher allocation on education in recent years should be maintained. The larger transfers from the central government should be proportionately allocated to development expenditure, which should translate into improved public services and infrastructure.
The gap between planned and realized expenditure should be closed. There is evidence that the two district governments are not able to realize their budgets as planned, particularly with regard to development expenditure. The two district governments should improve their budget approval processes and their capacities to implement projects. With a sharp increase in revenue and expenditure in recent years it is critical to ensure that district government capacity also improves.
The two district governments need to ensure that reconstruction and rehabilitation eff orts are sustainable beyond the end of BRR’s mandate in 2009. Total expenditure is likely to fall and the district governments will need to secure fi nancial resources to maintain and develop infrastructure and also improve their capacity to take over BRR’s functions. BRR and the two district governments on the island must ensure that realization of reconstruction budgets is increased as much as possible. Strict budget cycles may not be in the best interests of the reconstruction eff ort.

31Managing Resources to Build Back and Create a Better Future for Nias
Nias Public Expenditure Analysis 2007 CHAPTER 3 Expenditure
The regional gap between Nias and Nias Selatan districts on the allocation of reconstruction funds should be closed. A re-evaluation of planned budgets and programs needs to be conducted in order to achieve a proportional balance between the two districts. Future budget allocations and project implementation should seek to close this gap. Nias Selatan district is still under-funded given its needs, and progress is extremely slow. It lags far behind Nias district. Nias Selatan district is entitled to receive more funds given the widespread damage and extremely small budget allocation from BRR compared with Nias district. Better coordination between the district governments and central government, donors, and NGOs is needed to address this funding gap.

Managing Resources to Build Back and Create a Better Future for Nias
Nias Public Expenditure Analysis 2007
32
CHAPTER 3 Expenditure

CHAPTER 4Education
Nias Public Expenditure Analysis 2007

Managing Resources to Build Back and Create a Better Future for Nias
Nias Public Expenditure Analysis 2007
34
CHAPTER 4 Education
Education Outcomes and Facilities
Nias and Nias Selatan districts have registered some improvements across a range of indicators in recent years. However, many indicators still lag behind those of other districts, particularly in the case of Nias Selatan. Of particular concern are the lower literacy rates and the rates of enrollment for junior and senior secondary levels, as well as the unequal distribution of schools and teachers across sub-districts in the two districts.
Nias and Nias Selatan have the two lowest literacy rates in North Sumatra. The adult literacy rate in Nias district increased from 82.9 percent in 2002 to 85.8 percent in 2005, but is still below the national average. Nias Selatan district had the lowest literacy rate of all districts in North Sumatra in 2005 at only 62.5 percent (Figure 4.1). The relatively low literacy rates in the two districts are partly explained by the high percentage of the population aged 15 and over who have never attended school. In 2005, 13.5 percent of the population aged 15 and over had never attended school in Nias district, while the fi gure for Nias Selatan district is 39.2 percent. Of the total school-age population (age ≥ 5) 14.5 percent has never attended school in Nias district and 33.5 percent in Nias Selatan district.
Figure 4.1 Literacy rates of Nias and Nias Selatan by district in North Sumatra, 2005
0
20
40
60
80
100
Kota Sibolga
Kab. Tap
anuli Selatan
Kota Pematang Siantar
Kota Medan
Kota Padang Sidemp
uan
Kab. M
andailing Natal
Kota Tebing Tinggi
Kota Tanjung Balai
Kota Binjai
Kab. Tob
a Samosir
Kab. Tanah Karo
Kab. D
airi
Kab. D
eli Serdang
Kab. Pakp
ak Bharat
Kab. Sim
alungun
Kab. Serdang Berdagai
Kab. Sam
osir
Kab. Tap
anuli Tengah
Kab. Lab
uhan Batu
Kab. Tap
anuli Utara
Kab. Langkat
Kab. A
sahan
North Sum
atra average
Kab. H
umb
ang Hasundutan
National average
Kab. N
ias
Kab. N
ias Selatan
Perc
ent
Source: World Bank staff estimates based on data from BPS (Susenas, 2005).
The gross enrollment rates (GER) for junior and senior secondary levels in Nias and Nias Selatan are consistently lower than the North Sumatra and national averages. Gross enrollment rates for the primary level increased from 107 percent in 2001 to 109 percent in 2005 (Figure 4.2). Gross enrollment rates for junior and senior secondary levels have been stable since 2003 — in the range of 67 to 76 percent for junior secondary, and 30 to 42 percent for senior secondary. An increase in 2005 enrollment rates for primary schools was partly due to the growing number of kindergarten students, of whom about half continue to the next level.12 There was an increase of 20 percent in the number of kindergarten students, from 1,234 students in 2003 to 1,483 students in 2004. The slight increase in the enrollment rates of junior secondary in 2005 could be due to the higher percentage of primary students that passed the fi nal year exams, from 87 percent in 2003 to 99 percent in 2004.
12 Based on data from Education Bureau in Nias island the number of kindergarten students in Nias who continued to the primary level in 2004 was 53 percent.

35Managing Resources to Build Back and Create a Better Future for Nias
Nias Public Expenditure Analysis 2007 CHAPTER 4 Education
Figure 4.2 Nias island GER at primary, junior, and senior secondary levels, 2001-05 13
100%
105%
110%
115%
2001 2002 2003 2004 2005
Nias North Sumatera avrg National avrg
Primary
50%60%70%
80%90%
100%
2001 2002 2003 2004 2005
Nias North Sumatera avrg National avrg
Junior Secondary
0%
20%
40%
60%
80%
2001 2002 2003 2004 2005
Nias North Sumatera avrg National avrg
Senior Secondary
Source: World Bank staff estimates based on data from BPS (Susenas, 2001-05).
In line with their low enrollment rates, Nias and Nias Selatan have the lowest mean years of schooling among districts in North Sumatra. Nias and Nias Selatan districts have mean years of schooling of 5.6 and 6.6, respectively, while the national average is 7.4 (Figure 4.3). The fi gure is not entirely unexpected since, according to a World Bank report (World Bank, 2006a), less than 60 percent of children born in Indonesia in 1980 have completed lower secondary school and around 40 percent have completed upper secondary school.
Figure 4.3 Mean years of schooling by district in North Sumatra, 2005
0
2
4
6
8
10
12
Kota Medan
Kota Pematang Siantar
Kota Padang Sidempuan
Kota Binjai
Kota Tebing Tinggi
Kab. Toba Samosir
Kota Sibolga
Kab. Samosir
Kab. Tanah Karo
Kab. Deli Serdang
Kota Tanjung Balai
Kab. Simalungun
Kab. Tapanuli Utara
North Sum
atra average
Kab. Hum
bang Hasundutan
Kab. Tapanuli Selatan
Kab. Serdang Berdagai
Kab. Labuhan Batu
National average
Kab. Dairi
Kab. Asahan
Kab. Langkat
Kab. Pakpak Bharat
Kab. Tapanuli Tengah
Kab. Mandailing N
atal
Kab. Nias
Kab. Nias Selatan
Year
s
Source: World Bank staff estimates based on data from Susenas, 2005.
However, the low enrollment rates do not necessarily indicate a lack of access to school in Nias and Nias Selatan.14 In 2005, Nias district had 419 elementary schools, 78 junior secondary schools and 35 senior secondary schools, while in Nias Selatan district there were 298 elementary schools, 68 junior secondary schools, and 42 senior secondary schools. Access to schools varies at each education level. In Nias district the average service area for elementary, junior, and senior secondary schools is 8km2, 43km2, and 95km2, respectively, and in Nias Selatan the areas are 6 km2, 23 km2, and 43 km2, respectively. These fi gures are better than the national averages of 23km2, 115km2, and 292km2, respectively, suggesting adequate access to schools at all levels (Table 4.1).
13 The fi gure includes Nias and Nias Selatan districts. Data for Nias Selatan in Susenas is available only for 2005.
14 According to Unesco Institute for Statistics, “Education Indicators” 2003, a GER exceeding 90 percent for a particular level of education sug-gests that the aggregate number of places for students approaches the number required for universal access of the offi cial age group.

Managing Resources to Build Back and Create a Better Future for Nias
Nias Public Expenditure Analysis 2007
36
CHAPTER 4 Education
Table 4.1 Service area for school for Nias and Nias Selatan, 2005Kilometer2
Nias Nias Selatan North Sumatra National average
Primary school 8.0 6.1 7.7 23.2
Junior secondary school 42.7 26.8 73.2 115.0
Senior secondary school 95.2 43.5 146.6 291.8
Source: World Bank staff estimates based on data from BPS (Podes, 2005) and MoNE.
In both Nias and Nias Selatan the ratio of primary schools per 1,000 primary school aged children is above the national average. Nias and Nias Selatan districts both have six primary schools per 1,000 primary school aged children, while Indonesia has fi ve primary schools per 1,000 primary school aged children. The distribution of schools, however, is unequal among sub-districts in Nias and Nias Selatan. Afulu sub-district in Nias district has a ratio of more than twice that of Bawolatu sub-district, while the sub-district of Amandraya in Nias Selatan district has a ratio four times lower than that of Pulau-pulau Batu sub-district (Figure 4.4).
Figure 4.4 Primary schools per 1,000 primary school-aged children by sub-district in Nias/ Nias Selatan, 2005
0 2 4 6 8 10 12
Baw olato
Idanogaw o
Gido
Namohalu Esiw a
Lotu
Mandrehe
Gunungsitoli
Alasa
Tuhemberua
Lahew a
Hiliduho
Sirombu
Afulu
Nias
0 2 4 6 8 10 12 14
Amandraya
Lolow au
Gomo
Telukdalam
Lahusa
Lolomatua
Hibala
Pulau-pulau Batu
Nias Selatan
Source: World Bank staff estimates based on data from BPS (Podes, 2005 and SPAN, 2005).
Student teacher ratios (STR) in Nias and Nias Selatan districts are above average for Indonesia and North Sumatra, particularly at the primary and junior secondary levels. In 2005, both North Sumatra and Indonesia had student teacher ratios of 19 for the primary level, while Nias and Nias Selatan districts had STRs of 20 and 50, respectively (Table 4.2). The World Development Indicators (WDI) 2005 have calculated the primary level STR for a sample of countries and found that low-income countries on average had STRs of 42, whereas medium- and high-income countries had STRs of 21 and 14, respectively. Based on WDI, the Nias district STR is far below the average for low-income countries, while Nias Selatan district is higher, indicating a need for more teachers in Nias Selatan, or an unequal distribution of teachers in favor of Nias district.
Table 4.2 Student teacher ratios in Nias and Nias Selatan, 2005
Nias Nias Selatan North Sumatra National average
Primary school 20.0 49.8 19.7 19.5
Junior secondary school 15.4 40.3 15.0 13.9
Senior secondary school 14.8 12.8 13.7 12.8
Source: World Bank staff estimates based on data from BPS and MoNE.

37Managing Resources to Build Back and Create a Better Future for Nias
Nias Public Expenditure Analysis 2007 CHAPTER 4 Education
Insuffi cient numbers of teachers, or unequal distribution of teachers across sub-districts is more pronounced in Nias Selatan district. Two sub-districts in Nias Selatan, Gomo and Amandraya, have the highest STRs for both primary and junior secondary levels. Gomo has an STR of 71 for the primary and 68 for the junior secondary level, while Amandraya has an STR of 62 for the primary and 78 for the junior secondary level (Figure 4.5). The shortage of teachers is also a problem in the sub-district of Hibala, which is a separate small island, with an STR of 53 in the primary level. Given the geographical characteristics of Nias Selatan district, with its higher number of small islands and its more remote location, the provision of incentives for teachers to teach in remote and isolated areas should be encouraged. In 2006, almost 20 percent of teachers were non-civil servants and were not covered by the DAU salary formula. Enabling those teachers to become civil servants could become one possible incentive to attract teachers to the island, as well as an incentive for the two district governments themselves to gain more resources from the DAU transfer.
Figure 4.5 STR for primary/junior secondary levels by sub-district in Nias Selatan, 2005
0 10 20 30 40 50 60 70 80
Pulau-pulau batu
Lolowau
Teluk dalam
Lolomatua
Hibala
Lahusa
Amandraya
Gomo
Primary level (SD)
0 20 40 60 80 100
Hibala
Pulau-pulau batu
Lahusa
Teluk dalam
Lolowau
Lolomatua
Gomo
Amandraya
Junior Secondary (SMP)
Source: World Bank staff estimates based on data from BPS Nias and Nias Selatan.
Despite suffi cient numbers of schools and teachers in Nias district, large numbers of classrooms are in very poor condition, particularly at the elementary level. In 2005, based on an assessment of 421 elementary school buildings in Nias district, 1,567 classrooms were totally destroyed, 501 heavily damaged, and 393 had medium levels of damage. This means that 80 percent of all classrooms in Nias district were in bad condition.15 The damage also aff ected equipment, including chairs, desks, and cabinets. In junior secondary schools, almost 50 percent of classrooms were totally destroyed or heavily damaged, while in senior secondary schools 36 percent of classrooms were in a similar condition. The condition of classrooms directly limits the ability of students to study in a conducive environment. The rehabilitation of classrooms is an immediate priority, particularly in order to anticipate the higher enrollment rates expected in the coming years.
Spending on Education
The quality of education at all levels needs to be improved given the low learning outcomes in both districts. Programs could be designed by providing better facilities and equipment, and by enhancing the capacity and quality of teachers. To fund such programs, an additional allocation from the development budget will be required. In 2006, the Nias Selatan district government planned to allocate 20 percent of the development budget towards education.16
Total spending on education in Nias and Nias Selatan from a combination of district government budgets, deconcentration funds, and private out-of-pocket expenditure reached Rp 150 billion in 2005. The two district governments of Nias and Nias Selatan spent the largest share of total education expenditure in 2005, accounting for 89 percent of total sector expenditure at about Rp 133 billion. Out-of-pocket expenditure followed, at Rp 17 billion or
15 Data on the number of classrooms damaged are based on Education Bureau of Nias 2005.
16 See strategic document on general policy for APBD Nias Selatan 2006.

Managing Resources to Build Back and Create a Better Future for Nias
Nias Public Expenditure Analysis 2007
38
CHAPTER 4 Education
11 percent of total education spending, lower than the national fi gure, whereas out-of-pocket accounts for 21 percent of total education expenditure. Education has been largely decentralized, and the central government through deconcentration funds now spends relatively very small sums on education, with less than 1 percent of total sector spending. The deconcentration funds for education declined signifi cantly from Rp 3.9 billion in 2004 to only Rp 502 million in 2005 (Figure 4.6). In 2006, both Nias and Nias Selatan received no deconcentration funds for education.
Figure 4.6 Sources of education expenditure in Nias and Nias Selatan, 2005
APBD
89%
Private HH
expenditure
11%
APBN
0.3%
Source: World Bank staff calculation based on data from MoF/SIKD, BPS (Susenas, 2005).
Unlike the national level, Nias and Nias Selatan allocate a large share of their budgets to education. Education spending in Nias and Nias Selatan districts accounts for an average of 43 and 45 percent of total expenditure, respectively, compared with a national average of 28 percent. The share of education spending to total expenditure declined after 2002, but increased again in 2005. In real terms, total expenditure on education declined by 7 percent from Rp 91.8 billion in 2001 to Rp 85.1 billion in 2004, and increased to Rp 94 billion in 2005 (Figure 4.7). The decline was particularly evident after the division of the island into two districts and could be due to the smaller budget size of Nias Selatan district.
Figure 4.7 Education expenditure and percentage of total expenditure of Nias in aggregate, 2001-05
0
20
40
60
80
100
2001 2002 2003 2004 2005
Rp b
illio
n
0
0.1
0.2
0.3
0.4
0.5
Total education expenditure % total expenditure
Source: World Bank staff calculations based on data from MoF/SIKD (constant 2000 prices).
Although the share of education to total expenditure is high, per capita expenditures on education in Nias and Nias Selatan were below the averages for North Sumatra and Indonesia in 2004. Nias Selatan district had the lowest per capita spending on education among districts in North Sumatra, at Rp 93,888, while Nias district spent Rp 197,397 per capita (Figure 4.8). Nias Selatan district spends three times less than Padang Sidempuan district, which has the highest per capita education spending in North Sumatra. The small per capita education spending in both Nias and Nias Selatan is primarily the result of very small budgets.

39Managing Resources to Build Back and Create a Better Future for Nias
Nias Public Expenditure Analysis 2007 CHAPTER 4 Education
Figure 4.8 Per capita education spending by district in North Sumatra, 2004
0
50
100
150
200
250
300
350
400
Kota Padang Sidempuan
Kab. Tapanuli Utara
Kota Sibolga
Kab. Toba Samosir
Kab. Tanah Karo
Kab. Dairi
Kota Tebing Tinggi
Kota Pematang Siantar
Kab. Simalungun
Kota Binjai
Kab. Tapanuli Tengah
Kab. Tapanuli Selatan
Kota Tanjung Balai
National average
Kab. Nias
Kab. Hum
bang Hasundutan
Kab. Asahan
Kab. Labuhan Batu
Kab. Deli Serdang
Kab. Langkat
Kota Medan
Kab. Nias Selatan
Rp '0
00
North Sum
atra averageSource: World Bank staff calculations based on data from MoF/SIKD (constant 2000 prices).
The vast majority of education spending went towards routine functions, which averaged 85 percent of total education expenditure in 2001-05. The share of development expenditure increased in 2005, particularly in Nias Selatan district. In 2005, Nias Selatan district allocated 41 percent of total education expenditure to development functions. Of the total development expenditure, Nias Selatan district allocated 21 percent to education in 2006 as part of its attempt to meet the policy planning program, while Nias district allocated 15 percent on average in 2001-05 of total development expenditure to education (Table 4.3).
Table 4.3 Routine and development education expenditure for Nias island, 2001-05Rp million at constant 2000 prices
2001 2002 2003 2004 2005
% % % % %
Routine 72,598 77.36 81,603 88.73 85,221 87.78 78,165 89.72 73,215 76.23
Development 19,251 22.64 8,358 11.27 9,860 12.22 6,948 10.28 20,819 23.77
Total 93,851 100.00 91,963 100.00 97,084 100.00 87,117 100.00 96,039 100.00
Source: World Bank staff calculations based on data from MoF/SIKD.
Spending on personnel (payment of teachers’ salaries) accounts for the bulk of routine expenditure, leaving little else for other routine components (Figure 4.9). This even applies to Nias Selatan, which despite being a new district allocates a small portion of its routine expenditure to new offi ce buildings and equipment, and far more on personnel. In 2004, expenses on goods and services accounted for only 12 percent of routine expenditure in Nias Selatan district. In Nias district, the allocation for personnel averaged 96 percent of routine expenditure and only 3 percent was spent on goods and services. Less than 0.5 percent of total routine expenditure was allocated for operations and maintenance in both districts — far from suffi cient if education infrastructure and facilities are to see any improvement.

Managing Resources to Build Back and Create a Better Future for Nias
Nias Public Expenditure Analysis 2007
40
CHAPTER 4 Education
Figure 4.9 Components of education routine expenditure in Nias and Nias Selatan, 2001-05
0%
20%
40%
60%
80%
100%
2001 2002 2003 2004 2005
Personnel Goods/services Operational & maintanance Others
Nias
0%10%20%30%40%50%60%70%80%90%
100%
2004 2005
Personnel Goods/services Operational & maintanance Others
Nias Selatan
Source: World Bank staff calculations based on data from MoF/SIKD (constant 2000 prices).
Development expenditure projects focus on capacity-building for teachers and the rehabilitation and construction of school buildings. Capacity-building for teachers also includes providing support for teachers who choose to upgrade their education level to bachelor degree (S1). Activities for school-building rehabilitation and construction have focused particularly on primary school (SD) buildings. Earmarked DAK grants have given signifi cant support to the education development programs of the two district governments.
Impact of Earthquake and Reconstruction Spending on Education
The earthquake in March 2005 damaged and destroyed more than 700 schools. Most of the school buildings damaged were primary schools. In all, 581 primary schools, 85 junior secondary schools and 31 senior secondary schools were damaged by the earthquake. As of December 2006, 124 permanent schools had been rebuilt or repaired, along with 214 temporary schools. However, the progress in school reconstruction is still far from meeting identifi ed needs. About US$9 million had been allocated by BRR for the education sector in Nias and Nias Selatan by December 2006. Although insuffi cient to cover all the damage to education facilities (estimated at US$23 million), BRR funding has fi nanced the repair of more than 100 schools. Similar to BRR experience with reconstruction progress in Aceh, the education sector has a relatively higher disbursement rate than other sectors, at 64 percent and totaling US$6.8 million.
Recommendations
An increase in the fl ow of funds, particularly from reconstruction, should be used to provide greater access to secondary education. Access to secondary education, especially at the junior secondary level, could be improved by providing scholarships to eligible students. Greater access to secondary education would help to meet the government regulation of nine years of compulsory education and would also give a better rate of return to the people of Nias island than simply allowing their children to complete primary education.
Allocate development expenditures to rebuild destroyed schools and restrain the construction of additional schools until suffi cient teachers and adequate funding to maintain schools is provided. Access to schools is suffi cient, but there remains a lack or unequal distribution of teachers. Unless this under-supply is addressed, adding more schools will not lead to better outcomes.

41Managing Resources to Build Back and Create a Better Future for Nias
Nias Public Expenditure Analysis 2007 CHAPTER 4 Education
Teacher staffi ng policy to ensure there is adequate teacher distribution in districts and sub-districts. A high student teacher ratio suggests that more teachers are needed for primary and junior secondary schools in Nias Selatan district. An incentive mechanism is needed to attract qualifi ed teachers to teach in remote areas. Shifting the status of non-civil servant teachers to civil servant status could be one alternative to attract teachers to the island, as well as an incentive for the two district governments to receive more DAU revenue. An assessment of staffi ng needs could also help in addressing the unequal distribution of teachers among sub-districts in Nias and Nias Selatan.
Additional funding for education from earmarked grants is needed to raise low per capita expenditure on education. Although both districts have allocated higher portions of their budgets to education than the national average, their small budget sizes mean that they still have lower per capita expenditure levels. DAK allocations could help in addressing low per capita spending and bringing education outcomes up to the national average.
Accelerate classroom and school rehabilitation with the timely disbursement of fi nancial resources by the district governments, BRR and other reconstruction players. Delays in district governments’ budget approvals disturb cashfl ow that is targeted towards school rehabilitation. A more rapid disbursement rate by BRR and other players contributing to the education sector would signifi cantly contribute towards improving the learning environment. This would lead to higher outcomes in the years to come.
Improve the budget allocation for operations and maintenance. Suffi cient budget for maintenance is vital given the ongoing rehabilitation and reconstruction program. The share of maintenance from total routine spending is insignifi cant compared with the share of spending on personnel, goods and services.

Managing Resources to Build Back and Create a Better Future for Nias
Nias Public Expenditure Analysis 2007
42
CHAPTER 4 Education

CHAPTER 5Health
Nias Public Expenditure Analysis 2007

Managing Resources to Build Back and Create a Better Future for Nias
Nias Public Expenditure Analysis 2007
44
CHAPTER 5 Health
Health Systems and Outcomes
Despite improvements in recent years, health outcomes on Nias island still lag behind provincial and national averages. Nias island has a much higher infant mortality rate than North Sumatra and Indonesia. The percentage of children below fi ve years of age with poor nutrition is far higher at 51.8 and 45.8 percent for Nias and Nias Selatan districts, respectively, compared with the provincial and national averages of below 29 percent. Life expectancy at birth in Nias district is similar to North Sumatra, but slightly lower in Nias Selatan district (Table 5.1).
Table 5.1 Health indicators in Nias and Nias Selatan
Indicators Nias islandNias
district
Nias Selatan district
North Sumatra
Indonesia
1998 1999 2002 2005
Life expectancy (years) 64.1 66.4 66.8 68.7 67.9 68.7 68.1
Infant mortality child < 5 year (per 1,000 population)
44 40.9 36.1 33.5 32.8
Child age < 5 with poor nutrition (%) 59.0 57.7 51.8 45.8 28.7 28.2
Source: (BPS and Nias, 2006, and BPS and Nias Selatan, 2006), Unicef Nutritional Survey 2005, BPS Sumut, MDG database.
A large number of deliveries are attended by traditional midwives (dukun). In 2005, the number of deliveries assisted by trained medical workers (doctor, midwife or paramedic) was only 48 percent in Nias district and 34 percent in Nias Selatan district. Nias and Nias Selatan districts have the third-lowest and the lowest percentage of deliveries attended by trained medical workers, respectively, far below the provincial and national averages. Prior to the formation of Nias Selatan, in 2001-04 there was almost no improvement in this indicator, which fl uctuated in a range between 37 percent and 41 percent (Figure 5.1).
Figure 5.1 Percentage of deliveries attended by trained medical workers, 2001-05
34%48%
0% 10% 20% 30% 40% 50% 60% 70% 80% 90% 100%
2001
2002
2003
2004
2005
Nias Selatan Nias Province Indonesia
Source: BPS (Susenas, 2001-05).
Immunization coverage is relatively low across Nias island compared with provincial and national coverage. With the exception of polio, all types of immunization show a lower coverage in Nias and Nias Selatan district. Overall immunization coverage (the percentage of children who have been vaccinated by all types of immunization) is only 33 percent in Nias district and even lower in Nias Selatan district, at about 16 percent. Both levels are far below the provincial and national averages (Table 5.2). In comparison with other districts, Nias Selatan registered the lowest coverage, while Nias district registered the fi fth-lowest coverage in North Sumatra.

45Managing Resources to Build Back and Create a Better Future for Nias
Nias Public Expenditure Analysis 2007 CHAPTER 5 Health
Table 5.2 Immunization coverage on Nias island, 2005Percent
Nias Nias Selatan North Sumatra National
BCG 66.6 48.5 74.8 86.9
DPT 68.5 38.1 71.2 84.2
Polio 83.6 78.2 76.9 89.1
Measles 58.1 37.6 59.7 72.2
Hepatitis B 42.4 21.2 58.0 74.4
All immunizations (at least once) 33.3 15.8 49.9 64.3
Source: BPS (Susenas, 2005). Note: BCG (Bacillus of Calmette and Guerin), DPT (combined vaccination against diphtheria, pertussis, whooping cough, tetanus). The category ‘all immunizations’ is the percentage of children who have been vaccinated with all types of vaccines at least once.
The shortage of doctors and health workers has been a key problem of the health system on Nias island, contributing to a lack of health service provision and poor health outcomes. The remoteness of the island and the lack of an appropriate incentive mechanisms have made Nias island unattractive for qualifi ed medical specialists and doctors. Both Nias Selatan and Nias districts have the two lowest ratios of health workers (doctors and midwives) per 10,000 population in North Sumatra. Nias Selatan district has only seven doctors to serve its entire population of almost 290,000, while Nias district has 40 doctors providing healthcare services to more than 440,000 people. The ratios of midwives per 10,000 population are 1.6 in Nias district and 1.7 in Nias Selatan district, almost four times below the provincial average (Figure 5.2).
Figure 5.2 Ratio of doctors and midwives per 10,000 population by district in North Sumatra, 2005
0
3
6
9
12
15
18
Kota
Pad
ang
Side
mpu
an
Kab.
Tob
a Sa
mos
ir
Kab.
Tan
ah K
aro
Kota
Bin
jai
Kab.
Tap
anul
i Uta
ra
Kota
Pem
atan
g Si
anta
r
Kab.
Tap
anul
i Sel
atan
Kab.
Sam
osir
Kab.
Hum
bang
Has
undu
tan
Kota
Med
an
Kota
Teb
ing
Ting
gi
Kab.
Dai
ri
Indo
nesia
Nor
th S
umat
ra
Kab.
Tap
anul
i Ten
gah
Kab.
Sim
alun
gun
Kab.
Man
daili
ng N
atal
Kota
Tan
jung
Bal
ai
Kab.
Ser
dang
Ber
daga
i
Kota
Sib
olga
Kab.
Del
i Ser
dang
Kab.
Lan
gkat
Kab.
Pak
pak
Bhar
at
Kab.
Asa
han
Kab.
Lab
uhan
Bat
u
Kab.
Nia
s
Kab.
Nia
s Sel
atan
Ratio midwife/10,000 population
Ratio doctor/10,000 populationProvinceIndonesia
Source: World Bank staff estimates based on data from BPS (Podes, 2005, BPS and Nias, 2006, and BPS and Nias Selatan, 2006).
The shortage of health personnel on Nias island is exacerbated by the unequal distribution of health workers among sub-districts across the island, creating signifi cant gaps in under-developed areas. The distribution of health personnel among sub-districts is biased towards areas closer to the two district capitals, Gunung Sitoli and Teluk Dalam. Although every sub-district in Nias district has at least one doctor, there are three sub-districts that have only one midwife, and one sub-district, Namohalu Esiwa, that has no midwife at all. The situation is worse in Nias Selatan district, with fi ve out of the seven doctors located in Teluk Dalam, with the result that fi ve sub-districts have no doctor and two sub-districts have no midwife. Poor access to sub-districts and villages on Nias island and the lack of appropriate incentives are the main reasons for the unwillingness of health personnel to be posted to remote areas.
Prior to the earthquake, the availability of public health facilities in Nias district was above the provincial average, while health facilities were insuffi cient to provide basic health services in Nias Selatan district (Figure 5.3). Nias Selatan district had less than two health facilities per 10,000 population before the earthquake. In contrast,

Managing Resources to Build Back and Create a Better Future for Nias
Nias Public Expenditure Analysis 2007
46
CHAPTER 5 Health
Nias district had a higher ratio of health facilities to population than the provincial average. According to district-based BPS (Podes, 2005), before the earthquake Nias district had one hospital, 25 health centers, 88 sub-health centers, six midwife practices, 89 mother and child health centers (Posyandu), 263 village health clinics (Polindes), while Nias Selatan district had one hospital, eight health centers, 40 sub-health centers, 11 midwife practices, 75 Posyandu, 68 Polindes. This mixed situation deteriorated signifi cantly after the earthquake. Based on data from the Dinas Kesehatan, in the wake of the earthquake about 44 percent of health centers and 63 percent of sub-health centers in Nias district were in a severely damaged condition. Meanwhile, in Nias Selatan district 38 percent of health centers and 78 percent of sub-health centers were in a severely damaged condition.
Figure 5.3 Ratio of public health facilities per 10,000 population
0
1
2
3
4
5
6
7
8
9
Kab
. Pak
pak
Bha
rat
Kab
. Tan
ah K
aro
Kab
. Dai
ri
Kab
. Tap
anul
i Ten
gah
Kab
. Tob
a Sa
mos
ir
Kab
. Tap
anul
i Uta
ra
Kota
Pad
ang
Side
mp
uan
Kab
. Sam
osir
Kab
. Sim
alun
gun
Kab
. Nia
s
Kab
. Man
daili
ng N
atal
Kab
. Hum
ban
g H
asun
duta
n
Kab
. Tap
anul
i Sel
atan
Kota
Sib
olga
Kota
Teb
ing
Ting
gi
Kab
. Asa
han
Nor
th S
umat
ra
Kab
. Lan
gkat
Kab
. Ser
dang
Ber
daga
i
Kab
. Lab
uhan
Bat
u
Kab
. Nia
s Se
lata
n
Kota
Pem
atan
g Si
anta
r
Kota
Tan
jung
Bal
ai
Indo
nesi
a
Kota
Bin
jai
Kab
. Del
i Ser
dang
Kota
Med
an
Sub-Public Health CenterPublic Health CenterHospital
Province Indonesia
Source: World Bank staff estimated based on data from BPS (Podes, 2005).
The utilization rate of health services on Nias island is relatively low. The usage rate of health facilities (both public and private) is 23 per 1,000 population in Nias district and 39 per 1,000 population in Nias Selatan district, lower than the provincial and national averages of 60 and 97 per 1,000 population, respectively (Figure 5.4). The majority of people seek medical services from public health facilities, predominantly from community health centers (Puskesmas) and health sub-centers (Pustu), while about a quarter of the population make use of private healthcare facilities. This is in contrast to the use of health facilities seen at the provincial and national levels, where on average 62 percent and 52 percent of the population, respectively, seek medical services from private healthcare facilities.
Figure 5.4 The distribution of usage of health service facilities,17 2005
Private 24%
Public 64%
Traditional 1%
Others 11%
Nias
Public 69%
Private 27%
Traditional 3% Others
1%
Nias Selatan
Source: BPS (Susenas, 2005).
17 Public health facilities include: public hospital, public health center (Puskesmas), public health sub-center (Pustu). Private health facilities include: private hospital, doctor practices, polyclinic, health personnel practices. Traditional health facilities include health services provided by traditional medication and traditional practitioner (dukun). Others include village clinic posts (Polindes) and mother and child health centers (Posy-andu).

47Managing Resources to Build Back and Create a Better Future for Nias
Nias Public Expenditure Analysis 2007 CHAPTER 5 Health
Spending on Health
More than half of total health spending in Nias and Nias Selatan districts is fi nanced from district government budgets. Total expenditure on health in Nias and Nias Selatan districts was Rp 41 billion in 2005 in current terms, coming from a combination of district government budgets and out-of-pocket private spending. The central government provided no funds from the national budget for healthcare in the two districts in 2005, although it had allocated almost Rp 2.5 billion in 2004. Out-of-pocket spending from private households amounted to about Rp 17 billion in 2005, or about 41 percent of total sector spending (Figure 5.5). This share of private out-of-pocket in the two districts is lower than the national average of 55 percent.
Figure 5.5 Sources of health expenditure in Nias and Nias Selatan, 2005
APBD Nias42%
APBD Nias Selatan
17%
Private HH expenditure
41%
Source: World Bank staff calculations based on data from MoF/SIKD, BPS (Susenas, 2005).
Both district governments have allocated a rising share of their budgets to the health sector. In real terms, overall expenditure by the two districts rose from Rp 11 billion in 2001 to more than Rp 17 billion in 2005. The share of health spending to total expenditure increased from 5 percent in 2001 to 8 percent in 2005 (Figure 5.6). On average in 2001-05, Nias and Nias Selatan districts spent about 7 percent and 8 percent, respectively, of their total expenditure on the health sector, similar to the national average of 7 percent.
Figure 5.6 Health expenditure and its share of total expenditure in Nias and Nias Selatan, 2001-05
02468
101214161820
2001 2002 2003 2004 2005
Rp b
illio
n
0%
1%
2%
3%
4%
5%
6%
7%
8%
9%
Total health expenditure % total expenditure
Source: World Bank staff calculations based on data from MoF/SIKD (constant 2000 prices).

Managing Resources to Build Back and Create a Better Future for Nias
Nias Public Expenditure Analysis 2007
48
CHAPTER 5 Health
However, in per capita terms in 2004, spending in both districts was lower than the district average for North Sumatra, as well as the national average. Nias Selatan district has the lowest per capita expenditure among districts in North Sumatra, at only Rp 21,655 in 2004. Meanwhile, in Nias district per capita spending was Rp 37,309 in 2004, still far below the average per capita health spending in North Sumatra and Indonesia, at Rp 55,753 and Rp 51,286, respectively (Figure 5.7). This very low per capita allocation resulted in high private household expenditure on health.
Figure 5.7 Per capita health spending by district in North Sumatra, 2004
020406080
100120140160180200
Kota Sibolga
Kota Tebing Tinggi
Kota Binjai
Kab. Tanah Karo
Kota Pematang Siantar
Kota Padang Sidemp
uan
Kab. D
airi
Kab. Tap
anuli Utara
North Sum
atra average
Kota Tanjung Balai
National average
Kab. Tob
a Samosir
Kota Medan
Kab. Lab
uhan Batu
Kab. N
ias
Kab. Tap
anuli Tengah
Kab. H
umb
ang Hasundutan
Kab. Tap
anuli Selatan
Kab. Langkat
Kab. Sim
alungun
Kab. A
sahan
Kab. D
eli Serdang
Kab. N
ias Selatan
Rp '0
00
Source: World Bank staff calculations based on data from MoF/SIKD.
An increasing majority of health spending has been going towards routine expenditure since 2002, averaging about 65 percent of total health expenditure in 2001-05. Routine expenditure more than doubled from Rp 4.6 billion in 2001 to Rp 10.8 billion in 2005. The share of development expenditure has declined since 2001, from 58 percent of total expenditure in 2001 to only 22 percent in 2004. Unsurprisingly, Nias Selatan district spent a larger share of its health spending on routine functions in order to set up the administration needed to support a newly established district in 2004. However, a greater allocation shifted towards development expenditure since then, rising to 53 percent in 2005. The larger allocation for development expenditure by Nias Selatan district had the eff ect of increasing the overall allocation of both districts for development expenditure (Table 5.3) as a consequence.
Table 5.3 Health expenditure in Nias and Nias Selatan by routine and development, 2001-05Rp million at constant 2000 prices
2001 2002 2003 2004 2005
% % % % %
Routine 4,651 42 9,898 72 11,633 70 13,191 78 10,806 63
Development 6,428 58 3,792 28 5,045 30 3,738 22 6,398 37
Total 11,079 100 13,690 100 16,678 100 16,928 100 17,203 100
Source: World Bank staff calculations based on data from MoF/SIKD.
Nias district allocates a large share of its routine expenditure to cover salaries, while Nias Selatan district allocates more for goods and services. As a newly formed district, Nias Selatan invested heavily on new buildings and equipment in 2004. However, spending on goods and services slowed down in 2005, replaced by increased spending on personnel. Both districts allocated a very small portion of their budgets to operations and maintenance, at only about 3 percent of total routine expenditure (Figure 5.8). A larger allocation for operations and maintenance will be vital in the coming years after the completion of rehabilitation and reconstruction of health facilities and infrastructure.

49Managing Resources to Build Back and Create a Better Future for Nias
Nias Public Expenditure Analysis 2007 CHAPTER 5 Health
Figure 5.8 Components of health routine expenditure in Nias and Nias Selatan, 2001-05
0%
20%
40%
60%
80%
100%
2001 2002 2003 2004 2005
Personnel Goods/services Operational & maintanance Others
Nias
0%
20%
40%
60%
80%
100%
2004 2005
Personnel Goods/services Operational & maintanance Others
Nias Selatan
Source: World Bank staff calculations based on data from MoF/SIKD (constant 2000 prices).
Most development spending in Nias and Nias Selatan in 2005 was directed towards the rehabilitation and reconstruction of Puskesmas and Pustu buildings. Most funding for rehabilitation by district governments has come from DAK grants and the matching grants these require from the district governments’ budgets. Rehabilitation and reconstruction projects are also being conducted by BRR and other donors and NGOs. Apart from health service buildings, development spending has also been allocated to provide health services, such as preventative care and treating patients with tuberculosis and malaria, as well as for medical supplies.
Impact of the Tsunami and Earthquake on Health Facilities
The earthquake caused widespread damage and destruction to an already weak health system on Nias island. The earthquake severely damaged the only two hospitals on the island, and the majority of healthcare facilities, such as Puskesmas, Pustu, and Polindes — the most frequently used health facilities — were badly damaged and inoperable (Table 5.4). Overall, 41 percent of health facilities were badly damaged and 34 percent partially damaged. These dire conditions were exacerbated by the departure of medical workers from the island immediately after the disaster. Although the number of doctors increased slightly in 2005, the total number of medical workers (nurses and midwives) signifi cantly decreased after the earthquake, from 704 in 2004 to 471 in 2005 (Annexes Table B.8.3).
Table 5.4 Impact of earthquake on health facilities in Nias and Nias Selatan, 2005
FacilitiesNias Nias Selatan
Pre-Disaster Heavy DamageMedium Damage
Pre-DisasterHeavy
DamageMedium Damage
Hospital 1 1 0 1 1 0Delivery house 3 2 0 0 0 0Medical clinic 4 1 2 2 2 0Puskesmas 25 11 12 8 1 6Pustu 88 45 38 40 14 19Doctor practice 9 5 2 4 0 1Midwife practice 6 3 1 11 1 0Posyandu 89 34 26 75 11 8Polindes 263 125 100 68 30 23Pharmacy 9 5 4 1 0 0Drug store 7 3 2 8 0 0Total 505 236 187 219 60 58
Source: BPS (Podes, 2005).

Managing Resources to Build Back and Create a Better Future for Nias
Nias Public Expenditure Analysis 2007
50
CHAPTER 5 Health
Serious eff orts have been made to restore and support the provision of healthcare services on the island following the earthquake (BRR, 2006). By the end of 2006, one hospital and 19 health facilities on the island had been rebuilt or repaired. BRR, together with WHO, Unicef, and Mercy Malaysia, is jointly undertaking a US$6 million program to reconstruct and repair health facility buildings, to provide medicine and medical equipment, and to build up a skilled medical workforce. By December 2006, BRR had allocated US$5 million for health projects. However, disbursement has been slow and out of the allocated funds only 35 percent or US$3.7 million has been spent. Donors and NGOs have been working collectively to provide medicine, medical equipment, and other assistance to Gunung Sitoli Hospital. To expand the limited access of healthcare services in remote areas, BRR has provided scholarships for health personnel in both districts. In 2006, scholarships were provided for the education of 16 general practitioners, 14 specialists and nine masters of health, in collaboration with Gadjah Mada University, Yogyakarta.
Recommendations
Increase the budget allocations for the health sector to improve the provision of healthcare on Nias island. The urgent priority is to ensure that existing health facilities are well-staff ed by skilled health workers. In addition, with such limited resources available, allocations should be more closely determined by expected returns in terms of improved health outcomes. The district governments must ensure that they can build on this foundation to bring health outcomes, at the very least, up to provincial standards.
Increase health expenditure on operations and maintenance in order to eff ectively maintain medical equipment and health facilities. The district governments have not paid suffi cient attention to maintenance in the past. Existing facilities need to be properly maintained and this is all the more important now, given BRR’s building and reconstruction program.
Provide appropriate incentive mechanisms to increase the number of doctors and medical workers on Nias island. Special attention should be given to improving the distribution of health personnel to remote and isolated areas and to providing additional qualifi ed midwives in rural areas. The impact of the under-supply of healthcare personnel is obvious: a low rate of deliveries attended by trained medical workers and a signifi cantly higher infant mortality rate compared with provincial and national averages. The district governments should develop a proper incentive mechanism to attract medical workers to serve in remote areas, for example, by providing housing for staff , special compensation and vehicles. In addition, in the longer term the district governments have to improve local capacity by encouraging students on the island to pursue higher education in the medical fi eld through the provision of scholarships. This eff ort has been initiated by BRR, but the district governments need to ensure the sustainability of this program after BRR’s term ends in 2009.
Given the scale of BRR’s expenditure on health on the island, it is essential that the district governments are fully engaged in determining how these resources are spent. Better coordination and joint decision-making now will result in far better outcomes in the future. In particular, the district governments and BRR need to ensure that the investments made by BRR in training health personnel are focused on meeting well-defi ned health outcome targets and the returns on these investments will continue well beyond BRR’s term.

CHAPTER 6 Infrastructure
Nias Public Expenditure Analysis 2007

Managing Resources to Build Back and Create a Better Future for Nias
Nias Public Expenditure Analysis 2007
52
CHAPTER 6 Infrastructure
Infrastructure Conditions on Nias Island
Access to basic infrastructure in the two districts on Nias, such as clean water, sanitation and electricity, consistently lags behind average access in North Sumatra and Indonesia. In most cases, Nias and Nias Selatan are the districts with the lowest access to basic infrastructure in North Sumatra, with Nias Selatan invariable the district with the lowest access.
Nias and Nias Selatan have the third-lowest and lowest access to clean water, respectively, well below the averages for North Sumatra and Indonesia (Figure 6.1). The poor access of most households to basic infrastructure in Nias is both a cause as well as a result of its low development levels. The island’s distance from Sumatra, as well as the remoteness of many of its rural communities (especially in Nias Selatan district), makes access to these basic services more problematic than elsewhere in the province.
Figure 6.1 Percentage of households with access to clean water by district in North Sumatra, 2005
0%10%20%30%40%50%60%70%80%90%
100%
Kab. N
ias Selatan
Kab. Pakp
ak Bharat
Kab. N
ias
Kab. Lab
uhan Batu
Kab. H
umb
ang Hasundutan
Kab. Sam
osir
Kab. Tob
a Samosir
Kab. Tap
anuli Selatan
Kab. Tap
anuli Utara
Kab. D
airi
Kab. M
andailing Natal
Kab. Tap
anuli Tengah
Kab. Serdang Bedagai
Kota Tebing Tinggi
Kab. Langkat
Kota Binjai
Province North Sum
atra
Kab. A
sahan
Kota Padang Sidemp
uan
Indonesia
Kab. D
eli Serdang
Kab. Sim
alungun
Kab. Tanah Karo
Kota Medan
Kota Tanjung Balai
Kota Sibolga
Kota Pematang Siantar
Source: BPS (Susenas, 2005).
Access to clean water on Nias island has worsened signifi cantly since the beginning of the decade. While in 2002 over 40 percent of all households on the island had access to clean water, this fi gure dropped to 15 percent in Nias district and less than 8 percent in Nias Selatan district in 2005, partly as a result of the earthquake, although the worsening trend was already apparent before the earthquake. In addition, the share of households with access to piped or pumped water is very small and decreasing (about 2.5 percent in Nias district and less than 2 percent in Nias Selatan district in 2005). This is partly a result of the earthquake, which caused almost total dislocation of the piped water supply. Other sources of clean water (wells and springs) provide access for a majority of the population, unlike most other districts in the province, where access to piped and pumped water is much higher.
Nias and Nias Selatan have the second-lowest and lowest levels of access to electricity in North Sumatra, respectively (Figure 6.2).18 In 2005, electricity was only available to about one-third and one-fourth of households in Nias and Nias Selatan districts, respectively. In most cases, electricity was provided by the state electricity company (PLN), although in Nias Selatan district about one-third of households with access to electricity used alternatives to PLN, such as generators. However, these alternative sources of electricity are usually more costly than PLN. The reconstruction eff ort that followed the 2005 earthquake has increased demand for electricity on the island and power-cuts have become frequent in the capital cities of Gunung Sitoli and Teluk Dalam.
18 Podes 2000 and 2003 data also showed that Nias had the lowest access to electricity in North Sumatra.

53Managing Resources to Build Back and Create a Better Future for Nias
Nias Public Expenditure Analysis 2007 CHAPTER 6 Infrastructure
Figure 6.2 Percentage of households with electricity by district in North Sumatra, 2005
0%10%20%30%40%50%60%70%80%90%
100%
Kab. N
ias Selatan
Kab. N
ias
Kab. Pakp
ak Bharat
Kab. M
andailing Natal
Kab. D
airi
Kab. Tap
anuli Tengah
Kab. Tap
anuli Selatan
Indonesia average
Kota Padang Sidemp
uan
Kab. Lab
uhan Batu
Sumatra U
tara average
Kab. H
umb
ang Hasundutan
Kab. Sam
osir
Kota Tanjung Balai
Kab. Tob
a Samosir
Kab. Tap
anuli Utara
Kab. Langkat
Kab. D
eli Serdang
Kab. Tanah Karo
Kab. A
sahan
Kab. Sim
alungun
Kab. Serdang Bedagai
Kota Medan
Kota Binjai
Kota Sibolga
Kota Tebing Tinggi
Kota Pematang Siantar
Source: BPS (Susenas, 2005).
The road network is extremely limited in rural areas, while the construction of new roads and the maintenance of existing roads are very expensive and time-consuming. This is due to the lack of machinery available on the island and the need to import most materials. Nias has a total road length of over 2,500km. The road network, despite being clearly insuffi cient to serve the needs of the population, has not been expanded since the beginning of the decade. Only 20 percent of the road network on the island is asphalted. While the majority of roads (63 percent) in Nias Selatan district are made from gravel, 64 percent of roads in Nias district are earth roads, which become unusable during the rainy season. The road network has been deteriorating steadily since the beginning of the decade, and the 2005 earthquake only worsened an already critical situation (Figure 6.1). This abysmal road condition could explain why only about 44 percent villages in on the island — 42 percent and 50 percent for Nias district and Nias Selatan district, respectively — is accessible by 4-wheel drive vehicles.19
Table 6.1 Road condition in Nias and Nias Selatan, 2001-05Percent
2001 2002 2003 2004 2005NiasGood 19 26 11 12 6Moderate 12 22 10 10 5Damage 32 22 8 7 9Badly damaged 38 31 71 71 81Nias SelatanGood 59 60 9Moderate 7 0Damage 27 24 13Badly damaged 14 9 78
Source: BPS.
Irrigation is another area where the island lags behind the rest of North Sumatra and Indonesia as a whole. While 50 percent of rice fi elds in North Sumatra and 60 percent of those in Indonesia are irrigated, only 22 percent of the rice fi elds on Nias island are irrigated. Only one district, Labuhan Batu, and several cities in Sumatra have lower shares of irrigated rice fi elds.
19 Villages that are only accessible by water transportation are excluded.

Managing Resources to Build Back and Create a Better Future for Nias
Nias Public Expenditure Analysis 2007
54
CHAPTER 6 Infrastructure
Infrastructure Spending
In real terms, overall spending on infrastructure in Nias and Nias Selatan declined signifi cantly from Rp 58 billion in 2001 to Rp 25 billion in 2005.20 As a share of total expenditure, infrastructure spending also declined from 29 percent in 2001 to 11 percent in 2005 (Figure 6.3). The low priority given to this important sector in recent years has hindered the development eff ort to open up access to the more isolated villages in Nias and Nias Selatan districts. The decreasing trend needs to be reversed to meet the 2006 district government policy program, which is to improve road and transportation conditions, particularly after the 2005 earthquake.
The central government spent signifi cant amounts on infrastructure in 2006 through deconcentration funds in Nias and Nias Selatan. By May 2006, the central government had disbursed about Rp 19.3 billion to the two districts, with the breakdown of Rp 10.9 billion for Nias district and Rp 8.3 billion for Nias Selatan district. Most of the 2006 budget was allocated for regional development and housing, sectors that were most severely aff ected by the earthquake.
Figure 6.3 Infrastructure expenditure and its share of total expenditure on Nias island, 2001-05
0
10
20
30
40
50
60
70
2001 2002 2003 2004 2005
Rp b
illion
0%
5%
10%
15%
20%
25%
30%
35%
Total infrastructure expenditure % total expenditure
Source: World Bank staff estimates based on data from APBD, SIKD/MoF. Data are in real terms (constant 2000 prices).
Compared with other districts in North Sumatra, Nias and Nias Selatan have some of the lowest per capita levels of spending on infrastructure. Per capita spending on infrastructure in Nias and Nias Selatan was Rp 64,096 and Rp 28,676, respectively, in 2004. Both levels are far below provincial and national averages (Figure 6.4).
20 Infrastructure expenditure includes public works, transportation, settlement and regional development, telecommunication and energy

55Managing Resources to Build Back and Create a Better Future for Nias
Nias Public Expenditure Analysis 2007 CHAPTER 6 Infrastructure
Figure 6.4 Per capita spending on infrastructure by district in North Sumatra, 2004
0
50
100
150
200
250
300
350
400
Kota Sibolga
Kota Tanjung Balai
Kota Tebing Tinggi
Kab. Tapanuli Tengah
Kab. Dairi
Kota Pematang Siantar
North Sum
atra
National
Kota Binjai
Kab. Tanah Karo
Kota Medan
Kota Padang Sidempuan
Kab. Langkat
Kab. Toba Samosir
Kab. Tapanuli Utara
Kab. Hum
bang Hasundutan
Kab. Labuhan Batu
Kab. Nias
Kab. Asahan
Kab. Tapanuli Selatan
Kab. Simalungun
Kab. Nias Selatan
Kab. Deli Serdang
Rp '0
00
Source: World Bank staff estimates based on data from APBD, SIKD/MoF. Data are in real terms (constant 2000 prices).
Infrastructure still accounted for more than 30 percent of development expenditure on Nias island in 2005, although its proportion in development expenditure has declined over the years. Infrastructure accounts for a relatively small share of total expenditure, at 11 percent in 2005, slightly down from 13 percent in 2004. Unlike the education and health sectors, the majority of spending in infrastructure is directed towards development expenditure (Table 6.2). Development expenditure accounted for 93 percent on average in 2001-05, partly due to the large investments required to rebuild poorly maintained infrastructure.
Table 6.2 Infrastructure routine and development expenditure 2001-05
Rp million
2001 2002 2003 2004 2005
% % % % %
Routine 1,983 3 2,636 7 3,246 6 2,819 10 3,078 12
Development 56,080 97 34,161 93 48,843 94 24,429 90 22,052 88
Total 58,064 100 36,797 100 52,089 100 27,248 100 25,130 100
Source: World Bank staff estimates based on data from APBD, SIKD/MoF. Data are in real terms (constant 2000 prices).
Development spending on infrastructure in Nias and Nias Selatan is particularly focused on public works in the transportation, road, water, and irrigation sub-sectors. Public works accounted for, on average, 81.5 percent of infrastructure development spending in 2001-05. However, despite its large share, in real terms public works development spending declined from Rp 37.7 billion in 2001 to Rp 21.4 billion in 2005. Housing and regional development accounted for 17 percent of total infrastructure development spending on average in 2001-05. This allocation has been declining since decentralization and there was no allocation for this sub-sector in 2005. This decline is probably the result of both district governments expecting BRR to carry out the necessary rehabilitation and reconstruction work (Figure 6.5). The two district governments need to reevaluate their lack of focus on housing and regional development, particularly given the insuffi cient housing on the island.

Managing Resources to Build Back and Create a Better Future for Nias
Nias Public Expenditure Analysis 2007
56
CHAPTER 6 Infrastructure
Figure 6.5 Average development spending in sub-sectors, 2001-05
Telecommunication and tourism; 1.86% Regional
development, housing, and
settlement; 16.62%
Energy; 0.01%
Public works (transportation,
water, and irrigation); 81.50%
Source: World Bank staff estimates based on data from APBD, SIKD/MoF. Data are in real terms (constant 2000 prices).
Nias and Nias Selatan have paid very little attention to operations and maintenance spending on infrastructure assets. Spending on personnel accounts for the largest share of routine expenditure in Nias district: 68 percent of total routine infrastructure spending on average in 2001-05 (Figure 6.6). In 2005, 18 percent of routine spending went on goods and services, while operations and maintenance received a share of 10 percent of routine infrastructure spending in Nias district, while in Nias Selatan district the fi gure was only 1 percent. This is lower-than-average spending at the national level, at about 11 percent of total routine spending. Spending on offi cial travel accounted for a large share of infrastructure routine spending in 2005, particularly in Nias Selatan district (17 percent). Spending on offi cial travel needs to be reduced and shifted to operations and maintenance spending in order to maintain and sustain public infrastructure and facilities, particularly after BRR starts transferring assets prior to its exit in 2009.
Figure 6.6 Components of infrastructure routine expenditure in Nias and Nias Selatan, 2001-05
2001 2002 2003 2004 2005
Others
Operational &maintanance
Goods/services
Personnel
Nias
2004 2005
Others
Operational &maintanance
Goods/services
Personnel
Nias Selatan
Source: World Bank staff estimates based on data from APBD, SIKD/MoF. Data are in real terms (constant 2000 prices).

57Managing Resources to Build Back and Create a Better Future for Nias
Nias Public Expenditure Analysis 2007 CHAPTER 6 Infrastructure
Impact of Earthquake and Reconstruction Spending on Infrastructure
The poor condition of most infrastructure, even before the March 2005 earthquake, has slowed down the reconstruction process in Nias and Nias Selatan. The earthquake damaged about 800km of district roads, 200km of provincial roads, and destroyed 12 large and small piers (Table 6.3). The inadequate length and poor state of the road network, together with the lack of access to many villages, present one of the greatest challenges faced by the reconstruction eff ort, not to mention the lack of fuel stations and limited trucking capacity, which have both contributed to supply shortages of construction materials.
Table 6.3 Damage to, and reconstruction progress in, infrastructure
Sectors Damage/Needs Progress by March 2006 Progress by December 2006
Infrastructure - 3 bridges.- 800km district roads damaged- 266km provincial roads damaged-12 large and small ports/jetties destroyed
- Upgrading 130km provincial road and 126km district roads- Preparation 12 ports
- 37 bridges built- 309km road built, 250km under repaired - 3 ports/jetties and 2 airports under development
Source: BRR.
Despite the slow start, as of December 2006 there had been encouraging progress in rebuilding infrastructure on Nias island. In total, 309km of roads and 37 new bridges have been repaired or rebuilt, while three seaports and two airports are under construction. BRR increased allocations to infrastructure in its 2006 budget, to the value of US$38 million or about 31 percent of the total portfolio for 2005-06. Given the importance of good infrastructure to the success of the reconstruction eff ort, both BRR and other players should allocate larger shares of their budgets to this sector. As of December 2006, BRR had disbursed US$24 million, or 63 percent of the budget allocated, to infrastructure.
By December 2006, 5,440 units of housing out of the 13,500 units needed had been built or repaired. In total, US$52 million, or 45 percent of BRR’s total budget, is allocated for housing. However, housing did not receive a separate budget allocation in 2005, as it was aggregated together with other infrastructure sub-sectors, such as road and transportation. BRR had already disbursed about US$23 million, or about 46 percent of its total allocated budget, by December 2006. This means that housing reconstruction is likely to reach a peak in 2007. In addition to accelerating the speed of housing reconstruction, BRR and other players will need to provide housing-related infrastructure such as electricity, water and sanitation.
Recommendations
The two district governments and BRR need to increase their allocations for infrastructure. Nias and Nias Selatan district governments should reverse the trend of declining expenditure on infrastructure, and BRR needs to improve its disbursement rate. Together, BRR and the two district governments should develop a long-term and coherent infrastructure development plan and program. BRR could take the lead in the short term, while the district governments concentrate more on the medium to long term.
The two district governments should invest in improving technical skills of those staff responsible for monitoring and evaluating infrastructure projects. The involvement of donors and NGOs in the reconstruction process and their cooperation with the two district governments should be used as an opportunity to upgrade technical skills through knowledge transfer. In addition, the district governments could negotiate with BRR and other players to allocate some of their funds towards technical capacity-building, particularly on monitoring and evaluating projects. These skills will be particularly useful as BRR phases out and district governments take over project implementation and supervision.

Managing Resources to Build Back and Create a Better Future for Nias
Nias Public Expenditure Analysis 2007
58
CHAPTER 6 Infrastructure
The two district governments should focus on increasing access to electricity. BRR should plan and budget investments in basic electricity infrastructure. Particular attention should be given to additional costs incurred by the island’s isolated nature and its large rural population. District governments need to ensure the sustainability of such a program by allocating an appropriate budget for operations and maintenance required for an adequate electricity network.
The two district governments need to increase budget allocations for operations and maintenance. Maintenance will be vital in ensuring the sustainability of both existing infrastructure and infrastructure currently under construction. This will require better balancing of allocations between routine and development expenditure, as well as between the routine expenditure categories, such as personnel, goods and services, and operations and maintenance. Meanwhile, district governments need to restrain spending on offi cial travel. Current spending levels on offi cial travel should be scrutinized and lowered, with the funds freed up being used to increase spending on operations and maintenance.

CHAPTER 7 District Government Capacity in
Fiscal Management
Nias Public Expenditure Analysis 2007
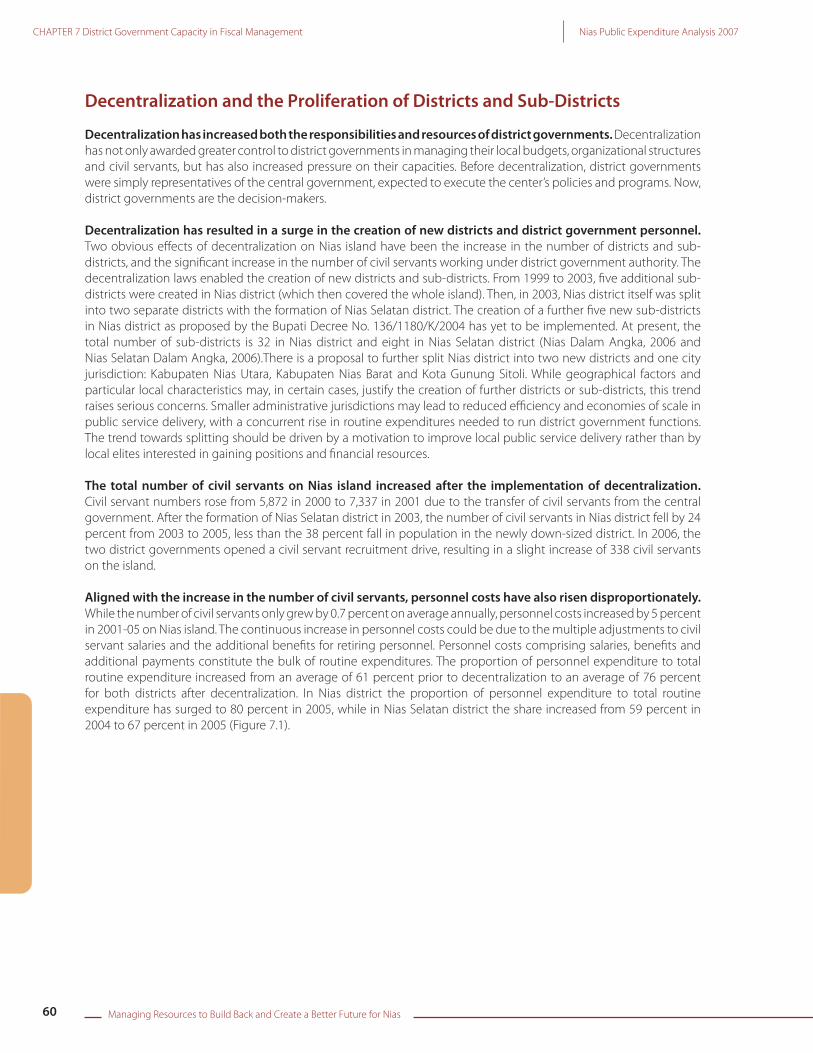
Managing Resources to Build Back and Create a Better Future for Nias
Nias Public Expenditure Analysis 2007
60
CHAPTER 7 District Government Capacity in Fiscal Management
Decentralization and the Proliferation of Districts and Sub-Districts
Decentralization has increased both the responsibilities and resources of district governments. Decentralization has not only awarded greater control to district governments in managing their local budgets, organizational structures and civil servants, but has also increased pressure on their capacities. Before decentralization, district governments were simply representatives of the central government, expected to execute the center’s policies and programs. Now, district governments are the decision-makers.
Decentralization has resulted in a surge in the creation of new districts and district government personnel. Two obvious eff ects of decentralization on Nias island have been the increase in the number of districts and sub-districts, and the signifi cant increase in the number of civil servants working under district government authority. The decentralization laws enabled the creation of new districts and sub-districts. From 1999 to 2003, fi ve additional sub-districts were created in Nias district (which then covered the whole island). Then, in 2003, Nias district itself was split into two separate districts with the formation of Nias Selatan district. The creation of a further fi ve new sub-districts in Nias district as proposed by the Bupati Decree No. 136/1180/K/2004 has yet to be implemented. At present, the total number of sub-districts is 32 in Nias district and eight in Nias Selatan district (Nias Dalam Angka, 2006 and Nias Selatan Dalam Angka, 2006).There is a proposal to further split Nias district into two new districts and one city jurisdiction: Kabupaten Nias Utara, Kabupaten Nias Barat and Kota Gunung Sitoli. While geographical factors and particular local characteristics may, in certain cases, justify the creation of further districts or sub-districts, this trend raises serious concerns. Smaller administrative jurisdictions may lead to reduced effi ciency and economies of scale in public service delivery, with a concurrent rise in routine expenditures needed to run district government functions. The trend towards splitting should be driven by a motivation to improve local public service delivery rather than by local elites interested in gaining positions and fi nancial resources.
The total number of civil servants on Nias island increased after the implementation of decentralization. Civil servant numbers rose from 5,872 in 2000 to 7,337 in 2001 due to the transfer of civil servants from the central government. After the formation of Nias Selatan district in 2003, the number of civil servants in Nias district fell by 24 percent from 2003 to 2005, less than the 38 percent fall in population in the newly down-sized district. In 2006, the two district governments opened a civil servant recruitment drive, resulting in a slight increase of 338 civil servants on the island.
Aligned with the increase in the number of civil servants, personnel costs have also risen disproportionately. While the number of civil servants only grew by 0.7 percent on average annually, personnel costs increased by 5 percent in 2001-05 on Nias island. The continuous increase in personnel costs could be due to the multiple adjustments to civil servant salaries and the additional benefi ts for retiring personnel. Personnel costs comprising salaries, benefi ts and additional payments constitute the bulk of routine expenditures. The proportion of personnel expenditure to total routine expenditure increased from an average of 61 percent prior to decentralization to an average of 76 percent for both districts after decentralization. In Nias district the proportion of personnel expenditure to total routine expenditure has surged to 80 percent in 2005, while in Nias Selatan district the share increased from 59 percent in 2004 to 67 percent in 2005 (Figure 7.1).

61Managing Resources to Build Back and Create a Better Future for Nias
Nias Public Expenditure Analysis 2007 CHAPTER 7 District Government Capacity in Fiscal Management
Figure 7.1 Personnel expenditure and civil servant numbers in Nias and Nias Selatan, 2000-06
0
1,000
2,000
3,000
4,000
5,000
6,000
7,000
8,000
2000 2001 2002 2003 2004 2005 2006
0
20
40
60
80
100
120
140
n
oillib
pR
Number of civil servants Personnel expenditure
Nias Selatan
Nias
Source: World Bank staff estimates based on data from APBD, SIKD/MoF. Data are in real terms (constant 2000 prices) and BKD Province North Sumatra.Note: The data for personnel expenditure in 2006 is projected.
Compared with other districts in North Sumatra, numbers of civil servants in Nias and Nias Selatan are still lower than average. In 2004, the ratio of civil servants to population in Nias district was about 1 to 80, while in Nias Selatan district it was 1 to 176. The average district in North Sumatra has ratio of 1 to 70 people (Figure 7.2).
Figure 7.2 Ratio of population to civil servants by district in North Sumatra, 2004
0
20
40
60
80
100
120
140
160
180
200
Nias Selatan
Medan
Deli Serdang
Asahan
Labuhan Batu
Langkat
Nias
Mandailing N
atal
Tapanuli Selatan
Tanjung Balai
North Sum
atra average
Tapanuli Tengah
Simalungun
Binjai
Toba Samosir
Tebing Tinggi
Dairi
Karo
Pematang Siantar
Sibolga
Padang Sidempuan
Tapanuli Utara
Source: BPS, 2004.

Managing Resources to Build Back and Create a Better Future for Nias
Nias Public Expenditure Analysis 2007
62
CHAPTER 7 District Government Capacity in Fiscal Management
Similar to other districts in North Sumatra, the educational level of attainment of most civil servants on Nias island is only senior high school level. About 70 percent of civil servants on Nias island have completed senior secondary level. This is followed by those who have completed diploma level, at 11 percent, and university graduates, at 8 percent (Figure 7.3). Districts that have the highest percentage of university graduate civil servants in North Sumatra are mostly found in the major urban vicinities, such as Medan, Tebing Tinggi, and Sibolga.
Figure 7.3 Civil servant educational attainment by district/city in North Sumatra, 2004
0%
20%
40%
60%
80%
100%
Nias
Mandailing Natal
Tapanuli Selatan
Tapanuli Tengah
Tapanuli Utara
Toba Samosir
Labuhan Batu
Asahan
Simalungun
Dairi
Karo
Deli Serdang
Langkat
Sibolga
Tanjung Balai
Pematang Siantar
Tebing Tinggi
Medan
Binjai
Padang Sidempuan
Primary School Junior High School Senior High School Diploma Under Graduate Graduate
Source: BPS, 2004.
Financial Management
The budget process starts with the formulation of the districts’ work plan programs in January of the preceding year. The budget draft is submitted to the district parliament in the form of a local draft regulation mutually agreed by the executive and legislative in the fi rst week of October. The provincial authority (the governor) then has to approve the draft before the budget is signed as a regional regulation by the district authority (the district head) (World Bank, 2007a).21
Although the APBD should be approved at the beginning of fi scal year in January, in the recent past this has normally not occurred in Nias and Nias Selatan. In 2006, the budget for Nias district was only ratifi ed in August 2006, while that for Nias Selatan district was only approved in December 2006. There are several factors that contributed to these delays: (i) the March 2005 earthquake delayed 2005 budget approval process and led to the late submission of the 2006 draft budgets to their respective district parliaments; (ii) the election of district heads, who only took offi ce in May 2006, and (iii) a series of disagreements between the district-level executive and legislative branches, based primarily on diff erent political interests and diff ering perceptions of the draft budget contents. All three factors served to slow down the budget ratifi cation process.
The capacity of the district governments in Nias district to manage local public fi nances eff ectively is considered poor, and in Nias Selatan district very poor. The World Bank carried out a Public Finance Management (PFM) survey covering nine strategic areas from 22 May to 2 June 2006, to assess local government capacities. Nias district scored 38 percent overall (poor) and Nias Selatan district’s average score was 14 percent (very poor). The scores are also very low when compared with the average score of district governments in Aceh, at 41 percent (Annexes Table B.8.2).
21 See Law No. 32/2004 .

63Managing Resources to Build Back and Create a Better Future for Nias
Nias Public Expenditure Analysis 2007 CHAPTER 7 District Government Capacity in Fiscal Management
Performance across diff erent PFM strategic areas varies widely, but is still classifi ed as very poor and poor. Nias Selatan district scored very poor in six areas and poor in the other three, while Nias district scored moderate in four areas and poor in the remaining fi ve areas (Figure 7.4).
Figure 7.4 PFM performance in Nias and Nias Selatan
0
20
40
60
80
100Local regulatory framework
Planning and budgeting
Cash management
Procurement
Accounting and reporting
Internal audit
Public debt and investment
Asset management
External audit and oversight
Average Score
Nias Nias Selatan
Source: World Bank, USAID PFM Survey Result, 2006.
Recommendations
Both district governments need to develop their public fi nancial management capacity. In view of its ‘very poor’ level, Nias Selatan district should focus on this issue as a matter of urgency. The local regulatory framework needs to be improved substantially in both districts. Planning and budgeting systems need to be improved, and accounting and reporting practices overhauled. District parliaments should also play a key role in providing checks and balances for district governments. Neither adequate external nor internal auditing systems are in place, resulting in a severe lack of eff ective oversight of district government public fi nancial management.
Both district governments need to design a strategy for developing human resources within government structures. In order to optimize development outcomes a better-qualifi ed more professional civil service is needed, not an over-staff ed and under-trained government bureaucracy. While additional training may be useful, it is more important to ensure that there is an improvement in the civil service selection process so that the right candidates start to fi ll vacant positions.
Proposals to sub-divide Nias and Nias Selatan into more districts, cities and sub-districts should be considered far more carefully given the impact of the formation of Nias Selatan district in 2003. Public fi nancial management outcomes in Nias Selatan district illustrate the risks. The provincial government should scrutinize calls for any further creation of districts on the island. If and when the creation of a new district is approved, both provincial and district governments must ensure that adequate preparation is made and physical infrastructure and civil servants are in place to manage the new administration. Equally, the formation of new sub-districts entails additional government apparatus costs that may not be justifi ed in terms of improvements in service delivery or outcomes.

Managing Resources to Build Back and Create a Better Future for Nias
Nias Public Expenditure Analysis 2007
64
CHAPTER 7 District Government Capacity in Fiscal Management

ANNEXES
Nias Public Expenditure Analysis 2007

Managing Resources to Build Back and Create a Better Future for Nias
Nias Public Expenditure Analysis 2007
66
ANNEXES
An
nex
A: K
ey Is
sues
an
d R
ecom
men
dat
ion
s C
hap
ter
Key
issu
esRe
com
men
dat
ion
sRe
leva
nt i
nst
itut
ion
Reve
nue
New
loca
l tax
/ret
ribut
ion
regu
latio
ns h
ave
little
impa
ct
on a
lread
y sm
all o
wn-
sour
ce re
venu
e (P
AD
). D
istr
ict g
over
nmen
ts s
houl
d fo
cus
on s
timul
atin
g ec
onom
ic a
ctiv
ities
rath
er
than
see
king
to
max
imiz
e sh
ort-
term
ow
n so
urce
rev
enue
. M
ore
care
ful
cons
ider
atio
n an
d pl
anni
ng w
hen
crea
ting
new
loca
l tax
regu
latio
ns n
eeds
to
be
take
n to
ens
ure
each
cha
rge
is e
cono
mic
ally
via
ble
for
the
dist
rict
adm
inis
trat
ion
itsel
f.
Dis
tric
t gov
ernm
ents
.
Nia
s Se
lata
n di
stric
t do
es n
ot re
ceiv
e al
loca
tion
of n
on-
tax
reve
nue-
shar
ing
to w
hich
it is
ent
itled
. D
istr
ict g
over
nmen
ts s
houl
d se
ek c
larifi
cat
ion
from
the
cent
ral g
over
nmen
t an
d pr
ovin
cial
aut
horit
ies
to e
nsur
e th
at e
ach
dist
rict
rece
ives
its
cor
rect
sh
are
of r
even
ue-s
harin
g. T
he c
entr
al g
over
nmen
t al
so n
eeds
to
eval
uate
an
d sc
rutin
ize
dist
ricts
tha
t do
not
rec
eive
the
ir co
rrec
t re
venu
e-sh
arin
g re
venu
e al
loca
tions
.
Dis
tric
t go
vern
men
ts,
cent
ral g
over
nmen
t.
Rela
tivel
y lo
w D
AU
allo
catio
n du
e to
low
civ
il se
rvan
ts
per
capi
ta a
nd fi
sca
l im
bala
nces
bet
wee
n th
e tw
o di
stric
ts h
ave
not b
een
addr
esse
d by
inte
rgov
ernm
enta
l tr
ansf
ers.
Impr
ove
tran
sfer
allo
catio
ns a
mon
g di
stric
ts b
y ta
king
into
acc
ount
pov
erty
an
d ot
her
soci
al in
dica
tors
. The
DA
U a
lloca
tions
for
mul
a sh
ould
be
mor
e se
nsiti
ve t
o po
vert
y an
d fi s
cal g
aps,
as o
ppos
ed t
o be
nefi t
ing
dist
ricts
with
la
rge
civi
l ser
vant
sal
ary
bills
.
Cen
tral
gov
ernm
ent.
Del
ay i
n bu
dget
app
rova
l di
stur
bs t
he p
lann
ing
and
cash
fl ow
of t
he re
late
d fi s
cal y
ear.
Impr
ove
budg
et p
lann
ing
and
acco
untin
g an
d pr
ovid
e sa
nctio
ns to
dis
tric
ts
that
are
sig
nifi c
antly
beh
ind
sche
dule
in th
eir b
udge
t app
rova
l pro
cess
. The
bu
dget
app
rova
l pr
oces
s ne
eds
to b
e st
ream
lined
and
tra
nsfe
rs o
f sh
are
reve
nues
from
cen
tral
gov
ernm
ent m
ust o
ccur
on
a qu
arte
rly b
asis
.
Dis
tric
t go
vern
men
ts,
cent
ral g
over
nmen
t.
Exp
end
itur
e
Rout
ine
expe
nditu
re h
as t
aken
a d
ispr
opor
tiona
tely
sh
are
of t
otal
exp
endi
ture
. Gov
ernm
ent
appa
ratu
s ha
s be
en in
crea
sing
und
er d
evel
opm
ent e
xpen
ditu
re.
Set l
imit
on ro
utin
e sp
endi
ng a
nd re
stra
in s
pend
ing
that
is c
ateg
oriz
ed in
to
“oth
er s
pend
ing”
to a
void
a m
isus
e of
bud
get.
Rout
ine
spen
ding
on
offi c
ial
trav
el s
houl
d al
so b
e re
stra
ined
. A
lloca
tion
of d
evel
opm
ent
expe
nditu
re
on
gove
rnm
ent
appa
ratu
s sh
ould
be
sc
rutin
ized
, pu
blic
se
rvic
es
and
infra
stru
ctur
e sh
ould
be
prio
rity
of d
evel
opm
ent e
xpen
ditu
re.
Dis
tric
t gov
ernm
ents
.
Low
abs
orpt
ion
of b
udge
t bot
h by
dis
tric
t gov
ernm
ents
an
d BR
R.D
istr
ict g
over
nmen
ts h
ave
to e
nsur
e th
at th
eir b
udge
ts a
re w
ell-p
lann
ed a
nd
wel
l-exe
cute
d. Im
prov
e bu
dget
app
rova
l pro
cess
and
dis
tric
t gov
ernm
ents
’ ca
paci
ty. B
RR h
as t
o id
entif
y bo
ttle
neck
s in
the
cha
nnel
ing
of f
unds
. Str
ict
budg
et c
ycle
s m
ay n
ot b
e su
itabl
e fo
r the
reco
nstr
uctio
n eff
ort
.
Dis
tric
t gov
ernm
ents
, BRR
.

67Managing Resources to Build Back and Create a Better Future for Nias
Nias Public Expenditure Analysis 2007 ANNEXES
The
sust
aina
bilit
y of t
he re
cons
truc
tion
and
reha
bilit
atio
n eff
ort
is
w
orry
ing
give
n th
e sm
all
allo
catio
ns
for
mai
nten
ance
.
Impr
ove
allo
catio
ns f
or m
aint
enan
ce a
nd s
et a
n ap
prop
riate
sha
re f
rom
cu
rren
t exp
endi
ture
.D
istr
ict g
over
nmen
ts.
Sign
ifi ca
nt re
gion
al g
ap b
etw
een
Nia
s an
d N
ias
Sela
tan
dist
ricts
on
the
allo
catio
n of
reco
nstr
uctio
n fu
nds.
Re-e
valu
atio
n of
bud
get
plan
ning
and
pro
gram
s to
hav
e a
prop
ortio
nal
bala
nce
betw
een
the
two
dist
ricts
. Bet
ter c
oord
inat
ion
amon
g go
vern
men
ts,
dono
rs, a
nd N
GO
s on
pro
ject
s an
d pr
ogra
m a
lloca
tion
is n
eede
d to
add
ress
th
e fi n
anci
al g
ap.
BRR,
don
ors,
and
NG
Os.
Educ
atio
n
Lite
racy
and
enr
ollm
ent
rate
s ar
e lo
w a
nd w
ell b
elow
th
e na
tiona
l ave
rage
.U
se t
he c
urre
nt m
omen
tum
and
allo
cate
the
mas
sive
fl o
w o
f fu
nd f
rom
re
cons
truc
tion
to
impr
ove
educ
atio
n ou
tcom
es,
i.e.
with
sc
hola
rshi
ps.
Con
tinue
th
e al
loca
tion
of
the
DA
K to
su
ppor
t th
e im
prov
emen
t in
ou
tcom
es.
Dis
tric
t go
vern
men
ts, B
RR,
dono
rs/N
GO
s, ce
ntra
l go
vern
men
t.
Lack
of
teac
hers
and
une
qual
dis
trib
utio
n of
tea
cher
s am
ong
sub-
dist
ricts
in N
ias
and
Nia
s Se
lata
n.A
sses
s te
ache
r st
affi n
g po
licy
to e
nsur
e th
e ad
equa
cy a
nd t
he e
qual
di
strib
utio
n of
tea
cher
s in
bot
h di
stric
ts a
nd s
ub-d
istr
icts
. Pr
ovis
ion
of
ince
ntiv
es f
or q
ualifi
ed
teac
her
to t
each
in r
emot
e ar
ea is
enc
oura
ged,
for
ex
ampl
e by
shi
ftin
g th
e st
atus
of n
on-c
ivil
serv
ant t
each
ers
to c
ivil
serv
ants
.
Dis
tric
t go
vern
men
ts,
cent
ral g
over
nmen
t.
Seve
re d
amag
e in
man
y cl
assr
oom
s in
prim
ary
and
juni
or s
econ
dary
sch
ools
. A
ccel
erat
e an
d im
prov
e di
sbur
sem
ent
for
reha
bilit
atio
n pr
ojec
ts b
y di
stric
t go
vern
men
ts, B
RR, a
nd o
ther
reco
nstr
uctio
n pl
ayer
s. Re
stra
in th
e co
nstr
uctio
n of
add
ition
al s
choo
ls u
ntil
ther
e ar
e su
ffi ci
ent
num
bers
of
teac
hers
and
ad
equa
te fu
ndin
g to
mai
ntai
n cu
rren
t sto
ck o
f sch
ool b
uild
ings
.
Dis
tric
t go
vern
men
ts, B
RR,
dono
rs/N
GO
s.
Hea
lth
Smal
l sha
re o
f exp
endi
ture
on
heal
th.
Incr
ease
bud
get
allo
catio
n on
hea
lth s
ecto
r by
foc
usin
g m
ore
clos
ely
on
qual
ity o
f hea
lth p
erso
nnel
and
the
exp
ecte
d re
turn
s in
ter
ms
of im
prov
ed
heal
th o
utco
mes
.
Dis
tric
t gov
ernm
ents
.
Lack
of
qu
alifi
ed
heal
th
pers
onne
l an
d un
equa
l di
strib
utio
n of
hea
lth p
erso
nnel
.Pr
ovid
e ap
prop
riate
inc
entiv
e m
echa
nism
s to
im
prov
e th
e nu
mbe
r of
do
ctor
s an
d m
edic
al w
orke
rs o
n N
ias
isla
nd,
such
as
prov
idin
g ho
usin
g fo
r st
aff ,
spec
ial
com
pens
atio
n, a
nd t
rans
port
veh
icle
s. In
crea
se c
apac
ity
by p
rovi
ding
sch
olar
ship
s to
med
ical
stu
dent
s fro
m N
ias
and
Nia
s Se
lata
n di
stric
ts.
Dis
tric
t go
vern
men
ts,
prov
inci
al g
over
nmen
t.
Coo
rdin
atio
n be
twee
n di
stric
t gov
ernm
ents
and
BRR
in
dete
rmin
ing
how
reso
urce
s w
ill b
e sp
ent i
s st
ill w
eak.
Im
prov
e co
ordi
natio
n an
d jo
int-
deci
sion
mak
ing
for
bett
er o
utco
mes
in
the
futu
re.
Ensu
re t
hat
the
inve
stm
ents
mad
e by
BRR
in
trai
ning
hea
lth
pers
onne
l are
focu
sed
on m
eetin
g w
ell-d
efi n
ed h
ealth
out
com
e ta
rget
s an
d th
e re
turn
s on
thes
e in
vest
men
ts w
ill b
e re
aped
bey
ond
BRR’
s te
rm.
Dis
tric
t gov
ernm
ents
, BRR
.

Managing Resources to Build Back and Create a Better Future for Nias
Nias Public Expenditure Analysis 2007
68
ANNEXES
Infr
astr
uctu
re
Dec
linin
g sh
are
of e
xpen
ditu
re o
n in
frast
ruct
ure
desp
ite
very
poo
r inf
rast
ruct
ure
cond
ition
s. Re
-eva
luat
e de
velo
pmen
t bu
dget
prio
ritie
s. A
n in
volv
emen
t of
dis
tric
t go
vern
men
ts i
n in
frast
ruct
ure
reco
nstr
uctio
n sh
ould
be
stre
ngth
ened
to
deve
lop
a se
nse
of o
wne
rshi
p of
the
pro
ject
s by
the
dis
tric
t go
vern
men
ts.
Dis
tric
t go
vern
men
t in
volv
emen
t in
the
rec
onst
ruct
ion
will
sup
port
the
ir sk
ills
and
capa
city
in fu
ture
pla
nnin
g.
Dis
tric
t gov
ernm
ents
, BRR
.
Lim
ited
acce
ss o
f el
ectr
icity
for
the
peo
ple
of N
ias
isla
nd.
Acc
eler
ate
the
inst
alla
tion
of b
asic
ele
ctric
ity in
frast
ruct
ure
by B
RR. E
stab
lish
med
ium
-ter
m p
lan
to e
nsur
e th
e su
stai
nabi
lity
of e
lect
ricity
sup
plie
s in
the
fu
ture
.
BRR,
dis
tric
t gov
ernm
ents
.
Una
vaila
bilit
y of
long
-ter
m a
nd c
oher
ent
infra
stru
ctur
e de
velo
pmen
t pla
n.
Dev
elop
a j
oint
sho
rt-t
erm
and
lon
g-te
rm i
nfra
stru
ctur
e de
velo
pmen
t pr
ogra
m. B
RR c
ould
take
the
lead
in th
e sh
ort t
erm
, whi
le d
istr
ict g
over
nmen
ts
shou
ld c
once
ntra
te o
n th
e m
ediu
m a
nd lo
nger
ter
m. D
istr
ict
gove
rnm
ents
co
uld
begi
n th
e m
ediu
m-
and
long
-ter
m p
lann
ing
by m
akin
g a
sim
ulat
ion
and
budg
et c
eilin
g of
cap
ital a
nd r
outin
e sp
endi
ng fo
r ea
ch in
frast
ruct
ure
com
pone
nt b
ased
on
the
reve
nue
proj
ectio
ns.
Dis
tric
t gov
ernm
ents
, BRR
.
Lack
of t
echn
ical
skill
and
capa
city
of d
istr
ict g
over
nmen
ts
in c
arry
ing
proj
ects
mon
itorin
g an
d ev
alua
tion.
Dis
tric
t gov
ernm
ents
shou
ld b
e m
ore
invo
lved
in th
e re
cons
truc
tion
proc
ess
and
use
the
oppo
rtun
ity to
upg
rade
ski
lls a
nd c
apac
ity th
roug
h kn
owle
dge
tran
sfer
. Neg
otia
te w
ith B
RR a
nd o
ther
reco
nstr
uctio
n pl
ayer
s to
allo
cate
par
t of
thei
r rec
onst
ruct
ion
fund
s tow
ards
tech
nica
l cap
acity
-bui
ldin
g, p
artic
ular
ly
on m
onito
ring
and
eval
uatin
g pr
ojec
ts.
Dis
tric
tl go
vern
men
ts, B
RR,
dono
rs/N
GO
s.
Low
allo
catio
n on
ope
ratio
nal
and
mai
nten
ance
will
ex
acer
bate
the
alre
ady
poor
con
ditio
n of
infra
stru
ctur
e.Im
prov
e bu
dget
allo
catio
n on
mai
nten
ance
. Es
tabl
ish
a pr
oper
bal
ance
be
twee
n ro
utin
e an
d de
velo
pmen
t exp
ense
s, as
wel
l as
amon
g th
ose
unde
r ro
utin
e ex
pend
iture
.
Dis
tric
t gov
ernm
ents
Dis
tric
t gov
ern
men
t cap
acit
y
Dis
tric
t go
vern
men
t ca
paci
ty
to
man
age
publ
ic
reso
urce
s is
stil
l ver
y w
eak.
Cap
acity
is u
rgen
tly n
eede
d gi
ven
the
incr
ease
in fl
ow o
f fun
ds fr
om re
cons
truc
tion.
Impr
ove
dist
rict
gove
rnm
ent
fi nan
cial
man
agem
ent
capa
city
. Es
tabl
ish
coop
erat
ion
with
BRR
, don
ors/
NG
Os
to h
ave
a jo
int
fund
ed t
rain
ing
and
othe
r cap
acity
bui
ldin
gs, p
artic
ular
ly re
late
d w
ith P
FM.
Dis
tric
t go
vern
men
t, BR
R,
dono
rs/N
GO
s.
Poss
ibili
ty o
f hav
ing
furt
her p
rolif
erat
ion
of d
istr
icts
put
s pr
essu
re o
n di
stric
t gov
ernm
ents
’ bud
gets
. Sl
ow d
own
the
crea
tion
of n
ew d
istr
icts
/sub
-dis
tric
ts a
nd e
nsur
e th
at
adeq
uate
pre
para
tion
is m
ade
and
that
phy
sica
l inf
rast
ruct
ure
and
hum
an
reso
urce
s ar
e in
pla
ce t
o m
anag
e a
new
adm
inis
trat
ion
befo
re p
erm
issi
on
is g
rant
ed. T
he f
orm
atio
n of
new
sub
-dis
tric
ts e
ntai
ls a
dditi
onal
app
arat
us
cost
s th
at m
ay n
ot b
e fu
lly ju
stifi
ed.
Dis
tric
t gov
ernm
ents
.

69Managing Resources to Build Back and Create a Better Future for Nias
Nias Public Expenditure Analysis 2007 ANNEXES
Annex B: Figures and Tables
Table B.8.1 Nias island’s reconstruction progress
Sectors Damage/Needs Progress by March 2006 Progress by December 2006
Housing • 13,500 unit houses • 1,448 permanent house• 5,440 permanent houses built/
repaired • 350 non-permanent houses/
transitional house
Education • 755 out of 879 schools damaged/destroyed
• 12 new schools built, 98 under construction
• 200 schools tents
• 124 permanent schools built/repaired
• 214 temporary schools
Health • 2 hospitals• 170 health facilities required
repair
• Revitalization of Gunung Sitoli hospital
• 16,000 children immunized against measles
• 1 hospital rebuilt• 19 health facilities repaired
Infrastructure • 3 bridges.• 800km district roads
damaged• 266km provincial roads
damaged• 12 large and small ports/
jetties destroyed
• Upgrading 130km provincial road and 126km district roads
• Preparation 12 ports
• 37 bridges built• 309km road built, 250km under
repaired • 3 ports/jetties and 2 airports
under development
Source: BRR Aceh-Nias.
Figure B.8.1 Per capita PAD by district in North Sumatra, 2004
0 20 40 60 80 100 120 140 160
National average
Kota Medan
Kota Sibolga
Kota Tebing Tinggi
Kota Pematang Siantar
Kota Tanjung Balai
Kab. Toba Samosir
Kota Binjai
Kab. Tapanuli Utara
Kab. Labuhan Batu
Kab. Tanah Karo
Kota Padang Sidempuan
Kab. Tapanuli Tengah
Kab. Asahan
Kab. Deli Serdang
Kab. Mandailing Natal
Kab. Dairi
Kab. Langkat
Kab. Simalungun
Kab. Nias
Kab. Humbang Hasundutan
Kab. Tapanuli Selatan
Kab. Pakpak Bharat
Kab. Nias Selatan
Rp '000
Source: World Bank staff calculations based on data from SIKD/MoF and World Bank Decentralization database. Data are in real terms (constant 2000 prices).

Managing Resources to Build Back and Create a Better Future for Nias
Nias Public Expenditure Analysis 2007
70
ANNEXES
Figure B.8.2 Nias and Nias Selatan’s tax-sharing revenue, 1997-2006
0
4000
8000
12000
16000
20000
19971998
19992000
20012002
20032004
2005
2006_plan
Rp m
illio
n
Nias Nias Selatan
Source: World Bank staff estimates based on data from APBD, SIKD/MoF, BPS-SK. Data are in real terms (constant 2000 prices). Note: *Planned budget
Figure B.8.3 Tax-sharing per capita by district in North Sumatra, 2005
0
50
100
150
200
250
300
350
400
Kab
. Pha
kpak
Bar
at
Nat
iona
l ave
rage
Kota
Sib
olga
Kota
Bin
jai
Kab
. Hum
ban
g H
asun
duta
n
Kota
Teb
ing
Ting
gi
Kota
Pad
ang
Side
mp
uan
Kota
Med
an
Kab
. Tob
a Sa
mos
ir
Nor
th S
umat
ra a
vera
ge
Kab
. Lan
gkat
Kota
Tan
jung
Bal
ai
Kota
Pem
atan
g Si
anta
r
Kab
. Sam
osir
Kab
. Lab
uhan
Bat
u
Kab
. Tap
anul
i Uta
ra
Kab
. Tap
anul
i Sel
atan
Kab
. Tap
anul
i Ten
gah
Kab
. Dai
ri
Kab
. Asa
han
Kab
. Man
daili
ng N
atal
Kab
. Sim
alun
gun
Kab
. Del
i Ser
dang
Kab
. Ser
dang
Ber
daga
i
Kab
. Tan
ah K
aro
Kab
. Nia
s Se
lata
n
Kab
. Nia
s
Rp '0
00
Source: World Bank staff estimates based on data from SIKD/MoF.

71Managing Resources to Build Back and Create a Better Future for Nias
Nias Public Expenditure Analysis 2007 ANNEXES
Figure B.8.4 Non-tax revenue-sharing and its share of total revenue in Nias and Nias Selatan22
0
500
1000
1500
2000
1997 1998 1999 2001 2002 2003 2004 2005
Rp m
illio
n
0
0.2
0.4
0.6
0.8
1
Shar
e of
tota
l rev
enue
(%)
Non-tax revenue sharing Share of total revenue (%)
Source: World Bank Staff calculations based on data from SIKD/MoF and World Bank Decentralization database. Data are in real terms (constant 2000 prices).
Figure B.8.5 Population, area and DAU allocation by district in North Sumatra
-1000
1000
3000
5000
7000
9000
11000
13000
15000
17000
-500 0 500 1000 1500 2000 2500
Population '000
Area
km2
Nias Selatan
Nias
Source: World Bank staff estimates based on data from MoF.
22 The aggregate fi gures are for Nias district only, as Nias Selatan district does not record these in its budget. The forestry activities in Nias Selatan district conducted by PT. Geruti and PT. Teluk Nauli have been halted since 2004. As the result, Nias Selatan receives no revenue from forestry land rent or from royalties. For fi shery and oil and gas revenues from North Sumatra, there is the possibility that these are being captured by Nias district.

Managing Resources to Build Back and Create a Better Future for Nias
Nias Public Expenditure Analysis 2007
72
ANNEXES
Figure B.8.6 Per capita DAU and revenue-sharing (2005) and poverty rate (2004) by district in North Sumatra
31.9
31.3 17.9
0
200
400
600
800
1,000
1,200
-10 0 10 20 30 40 50 60 70 80 90 100 110 120 130 140 150 160
Revenue sharing per capita 2005
DA
U p
er c
apita
200
5 (R
p 0
00)
Nias
Nias Selatan
Simalungun
Source: World Bank staff estimates based on data from APBD, SIKD/MoF, BPS.Note: The size of the bubble represents poverty headcount rates.
Figure B.8.7 Per capita DAU 2006 and Human Development Index, 2005
0
500
1,000
1,500
2,000
2,500
3,000
3,500
4,000
62 64 66 68 70 72 74 76 78
HDI 2005
DA
U p
er c
apit
a 20
06 (R
p '0
00)
NiasNias Selatan
Source: World Bank staff estimates based on data from SIKD/MoF and UNDP Human Development Index report.

73Managing Resources to Build Back and Create a Better Future for Nias
Nias Public Expenditure Analysis 2007 ANNEXES
Figure B.8.8 Per capita DAK allocations by district in North Sumatra, 2006
0 100 200 300 400 500 600 700 800 900
Kota Medan
Kab. Deli Serdang
Kab. Langkat
Kab. Labuhan Batu
Kab. Asahan
Kab. Samosir
Kab. Simalungun
Kab. Tapanuli Selatan
Kab. Mandailing Natal
Kota Padang Sidempuan
Kota Pematang Siantar
Kab. Nias
Kab. Tanah Karo
Kota Binjai
Kab. Tapanuli Tengah
Kota Sibolga
Kota Tanjung Balai
Kota Tebing Tinggi
Kab. Tapanuli Utara
Average North Sumatra
Kab. Dairi
Kab. Nias Selatan
Kab. Toba Samosir
Kab. Humbang Hasundutan
Kab. Serdang Bedagai
Kab. Pakpak Barat
Rp '000
Source: World Bank staff estimates based on data from SIKD/MoF.
Figure B.8.9 Per capita and share of routine expenditure by district in North Sumatra, 2004
% share
0
100
200
300
400
500
600
700
800
Kota
Pad
ang
Side
mpu
an*
Kota
Sib
olga
Kota
Teb
ing
Ting
gi
Kab.
Pak
pak
Bhar
at
Kota
Bin
jai
Kota
Pem
atan
g Si
anta
r*
Kab.
Tan
ah K
aro
Kab.
Dai
ri
Kab.
Tap
anul
i Uta
ra
Kota
Tan
jung
Bal
ai
Kab.
Tob
a Sa
mos
ir
Prov
inci
al a
vera
ge
Kab.
Hum
bang
Nat
iona
l ave
rage
(dis
tric
ts)
Kab.
Tap
anul
i Ten
gah
Kab.
Sim
alun
gun
Kab.
Tap
anul
i Sel
atan
Kab.
Nia
s
Kota
Med
an
Kab.
Lan
gkat
*
Kab.
Asa
han
Kab.
Lab
uhan
Bat
u
Kab.
Del
i Ser
dang
Kab.
Nia
s Sel
atan
Rp '0
00
0102030405060708090100
% s
hare
of t
otal
exp
endi
ture
Source: World Bank staff estimates based on data from SIKD/MoF. Note: * Langkat district uses 2003 data.

Managing Resources to Build Back and Create a Better Future for Nias
Nias Public Expenditure Analysis 2007
74
ANNEXES
Figure B.8.10 Per capita and share of development expenditure by district in North Sumatra, 2004
% share
0
100
200
300
400
500
600
700
800
Kota
Sib
olg
a
Kab
. Pak
pak
Bh
arat
Kota
Tan
jun
g B
alai
Kota
Teb
ing
Tin
gg
i
Kab
. Tap
anu
li Te
ng
ah
Nat
ion
al a
vera
ge
(dis
tric
ts)
Kab
. To
ba
Sam
osi
r
Pro
vin
cial
ave
rag
e
Kab
. Tap
anu
li U
tara
Kota
Pem
atan
g S
ian
tar*
Kab
. Dai
ri
Kota
Bin
jai
Kab
. Tan
ah K
aro
Kota
Pad
ang
Sid
emp
uan
*
Kab
. Lab
uh
an B
atu
Kab
. Hu
mb
ang
Kota
Med
an
Kab
. Lan
gka
t*
Kab
. Tap
anu
li Se
lata
n
Kab
. Nia
s
Kab
. Asa
han
Kab
. Sim
alu
ng
un
Kab
. Nia
s Se
lata
n
Kab
. Del
i Ser
dan
g
Rp '0
00
0
10
20
30
40
50
60
% s
har
e of
tota
l exp
end
itur
e
Source: World Bank staff estimates based on data from SIKD/MoF. Note: * Langkat district uses 2003 data.
Figure B.8.11. District government budget format: old vs new budget format
Old Format New Format
1. Revenue
• Regional Own-Source Revenuew• Balancing Fund
• Other Revenue
2. Financing
3. Expenditure3.1 Apparatus Expenditure• General Administration• Operational and Maintenance• Capital3.2 Public Expenditure• General Administration• Operational and Maintenance• Capital
1. Revenue• Carry-Over From Previous Years• Regional Own-Source Revenuew• Balancing Fund• Regional Borrowing• Other Revenue
2. Expenditure2.1 Routine Expenditure
2.2 Development Expenditure
Source: Papua Public Expenditure Analysis, Pemerintah Daerah Papua, and World Bank 2005.

75Managing Resources to Build Back and Create a Better Future for Nias
Nias Public Expenditure Analysis 2007 ANNEXES
Table B.8.2 Results of the PFM survey in Nias and Nias SelatanPercent
Strategic Area Nias Nias SelatanAverage Aceh’s Local
Governments
1 Local regulatory framework 29 4 37
2 Planning and budgeting 39 34 43
3 Cash management 44 25 35
4 Procurement 54 15 60
5 Accounting and reporting 29 12 38
6 Internal audit 48 28 52
7 Public debt and investment 22 0 28
8 Asset management 54 5 37
9 External audit and oversight 21 0 37
Average Score 38 14 41
Source: PFM Survey Results 2006.
Table B.8.3 Health personnel on Nias island, 2000-05Number of personnel
Heath personnel2000 2001 2002 2003 2004 2005
Total Nias Nias Selatan
General physicians 30 15 15 36 38 47 40 7
Dentist 6 2 2 6 7 3 1 2
Specialist 3 1 1 2 2 n.a n.a n.a
Nurses 442 390 390 293 375 351 221 130
Midwives 171 321 321 102 329 120 70 50
Total 652 729 729 439 751 521 332 189
Source: BPS, (Nias in Figures, various years).

Managing Resources to Build Back and Create a Better Future for Nias
Nias Public Expenditure Analysis 2007
76
ANNEXES
Table B.8.4 The distribution of health personnel in Nias and Nias Selatan, 2005District/ Sub-districts Population # of doctors # of midwives # of nurse # of dentistNias 441,832 40 70 221 1Idanogawo 32,820 2 4 10 0Bawolato 22,728 1 2 13 0Gido 49,593 4 12 21 0Lolofi tu Moi 32,516 2 1 8 0
Sirombu 16,620 2 3 10 0Mandrehe 45,812 4 3 21 0Hiliduho 28,901 5 4 20 0Gunung Sitoli 76,017 5 28 37 0Tuhemberua 41,290 2 6 22 0Lotu 11,643 2 1 10 0Alasa 30,576 4 2 16 0Namohalu Esiwa 13,937 1 0 11 0Lahewa 29,908 3 3 14 1Afulu 9,471 3 1 8 0Nias Selatan 288,233 7 50 130 2Pulau-pulau Batu 18,671 1 9 13 -Hibala 8,771 - - 7 -Teluk Dalam 79,284 5 29 56 2Amandraya 36,182 - 1 5 -Lahusa 32,204 1 3 16 -Gomo 52,686 - 2 14 -Lolowau 33,736 - 6 9 -Lolomatua 26,699 - - 10 -
Source: BPS and Nias, 2006, BPS and Nias Selatan, 2006. Figure B.8.12 BRR sectoral allocations and disbursements, 2005 and 2006
61%
68%
72%
46%
75%
56%
0 20 40 60 80 100 120
Housing and Infrastructure
Health and Education
Institution
Religion, Social&Culture
Economic Development
Secretariat & Finance
US$ million
Budget Disbursement
Source: World Bank staff estimates/BRR.

77Managing Resources to Build Back and Create a Better Future for Nias
Nias Public Expenditure Analysis 2007 ANNEXES
Table B.8.5 Estimated budget allocation and disbursement of reconstruction funds in Aceh and Nias, December 2006
US$ million
DistrictGoI NGO Donors Total
Allocated Disbursed Allocated Disbursed Allocated Disbursed Allocated Disbursed
PROV. NAD 372.0 230.5 51.9 32.1 115.6 22.8 539.6 285.4
KAB. ACEH BARAT 66.9 45.1 175.2 137.1 224.6 93.1 466.7 275.3
KAB. ACEH BARAT DAYA 1.3 0.3 17.2 7.3 22.1 5.0 40.6 12.6
KAB. ACEH BESAR 14.0 10.9 415.1 257.8 531.9 175.1 961.0 443.8
KAB. ACEH JAYA 4.2 2.1 297.6 151.6 381.4 102.9 683.2 256.7
KAB. ACEH SELATAN 1.3 0.4 8.4 5.5 10.8 3.7 20.5 9.6
KAB. ACEH SINGKIL 2.8 1.6 10.8 9.2 13.9 6.3 27.5 17.1
KAB. ACEH TAMIANG 0.9 0.4 5.3 3.8 6.8 2.6 13.0 6.8
KAB. ACEH TENGAH 2.9 0.8 12.4 5.7 15.9 3.9 31.2 10.4
KAB. ACEH TENGGARA 0.9 0.8 5.3 3.6 6.8 2.5 13.0 6.9
KAB. ACEH TIMUR 4.0 2.2 10.2 5.7 13.1 3.9 27.3 11.9
KAB. ACEH UTARA 3.7 2.0 73.6 54.9 94.3 37.3 171.5 94.2
KAB. BENER MERIAH 0.9 0.2 10.3 5.2 13.1 3.5 24.3 8.9
KAB. BIREUN 5.0 4.2 68.6 55.1 87.9 37.4 161.5 96.7
KAB. GAYO LUES 0.9 0.6 5.3 3.6 6.8 2.4 13.1 6.6
KAB. NAGAN RAYA 2.6 1.2 44.3 30.0 56.8 20.4 103.7 51.5
KAB. PIDIE 7.5 3.8 102.2 85.9 130.9 58.3 240.5 148.0
KAB. SIMEULUE 8.0 5.6 89.3 74.0 114.4 50.3 211.7 129.9
KOTA BANDA ACEH 639.0 376.1 26.0 16.1 33.3 10.9 698.2 403.1
KOTA LANGSA 3.6 2.5 0.6 0.4 0.8 0.3 5.1 3.2
KOTA SABANG 1.4 0.3 13.0 8.0 16.6 5.5 31.1 13.8
KOTA LHOKSUMAWE 5.2 3.9 0.0 0.0 0.0 0.0 5.2 3.9
KOTA MEULABOH 38.3 1.5 0.0 0.0 38.3 1.5
TOTAL NAD 1,149.2 695.5 1,480.9 954.1 1,897.8 648.0 4,527.9 2,297.5
PROV. SUMATRA UTARA 32.6 19.2 0.0 0.0 0.0 0.0 32.6 19.2
KAB. NIAS 127.0 75.4 99.2 45.7 127.2 31.1 353.4 152.2
KAB. NIAS SELATAN 4.3 1.5 60.5 14.7 77.6 10.0 142.4 26.2
TOTAL NORTH SUMATRA 163.8 96.0 159.8 60.4 204.8 41.0 528.4 197.5
Total 1,313.1 791.5 1,640.7 1,014.5 2,102.6 689.0 5,056.3 2,495.0Source: BRR, World Bank.

Managing Resources to Build Back and Create a Better Future for Nias
Nias Public Expenditure Analysis 2007
78
ANNEXES
Tab
le B
.8.6
Th
e co
mp
osit
ion
of d
istr
ict g
over
nm
ent r
even
ues
in N
ias
and
Nia
s Se
lata
nRu
piah
mill
ion
1999
2000
2001
2002
2003
2004
2005
2006
pla
nn
ed
Nia
sN
ias
Sela
tan
Tota
lN
ias
Nia
s Se
lata
nTo
tal
Nia
sN
ias
Sela
tan
Tota
lN
ias
Nia
s Se
lata
nTo
tal
Nia
sN
ias
Sela
tan
Tota
lN
ias
Nia
s Se
lata
nTo
tal
Nia
sN
ias
Sela
tan
Tota
lN
ias
pro
ject
ion
Nia
s Se
lata
nTo
tal
Ow
n So
urce
Rev
enue
2,3
19
- 2
,319
1
,556
-
1,5
56
5,1
11
- 5
,111
5
,319
-
5,3
19
8,9
69
- 8
,969
5
,701
7
18
6,4
19
4,3
71
1,0
56
5,4
27
3,5
91
1,6
98
5,2
90
Tax
Reve
nue
Shar
ing
8,4
61
- 8
,461
5
,444
-
5,4
44
13,
472
- 1
3,47
2 1
5,95
0 -
15,
950
13,
733
- 1
3,73
3 9
,690
7
,438
1
7,12
7 1
0,37
3 7
,755
1
8,12
8 6
,064
4
,734
1
0,79
8
Non
-tax
Rev
enue
Sh
arin
g 6
69
- 6
69
147
-
147
7
58
- 7
58
1,1
27
- 1
,127
1
,650
-
1,6
50
917
-
917
2
68
- 2
68
582
-
582
SDO
40,
522
- 4
0,52
2 -
- -
- -
- -
- -
- -
- -
- -
- -
- -
- -
INPR
ES 5
8,98
6 -
58,
986
- -
- -
- -
- -
- -
- -
- -
- -
- -
- -
-
DAU
- -
- 4
5,42
1 -
45,
421
182
,584
-
182
,584
1
80,4
48
- 18
0,44
8 1
89,4
56
- 1
89,4
56
118
,296
5
2,50
0 1
70,7
96
122
,033
5
7,89
1 1
79,9
24
222
,780
1
36,9
44
359
,724
DA
K -
- -
33,
208
- 3
3,20
8 -
- -
616
-
616
1
,292
-
1,2
92
7,0
85
- 7
,085
1
0,51
5 9
,772
2
0,28
7 2
2,78
1 2
2,13
2 4
4,91
3
Oth
ers
152
-
152
-
- -
4,6
71
- 4
,671
2
,473
-
2,4
73
1,0
01
- 1
,001
2
1,78
9 2
,708
2
4,49
7 1
4,50
8 6
,247
2
0,75
5 9
,648
4
,902
1
4,55
0
Tota
l 1
11,1
10
- 11
1,11
0 8
5,77
7 -
85,7
77
206,
597
- 2
06,5
97
205
,932
-
205,
932
216
,101
-
216,
101
163
,477
63
,364
2
26,8
41
162,
069
82,7
21
244
,790
2
65,4
46
170
,410
43
5,85
6
Sour
ce: S
IKD
/MoF
. APB
D N
ias
and
Nia
s Se
lata
n.

79Managing Resources to Build Back and Create a Better Future for Nias
Nias Public Expenditure Analysis 2007 ANNEXES
Tab
le B
.8.7
Th
e co
mp
osit
ion
of d
istr
ict g
over
nm
ent r
even
ues
in N
orth
Sum
atra
, 200
4Ru
piah
per
cap
ita a
nd p
erce
ntag
e sh
are
of re
venu
e
No.
D
istr
icts
PAD
Tax-
shar
ing
Non
tax-
shar
ing
DA
UD
AK
Oth
erTo
tal
%%
%%
%%
1Ka
b. A
saha
n
22,
653
6.0
3
9,06
5 10
.3
1,
080
0.3
2
71,7
67
71.5
1
1,74
5 3.
1
33,
777
8.9
380
,086
2
Kab.
Dai
ri
17,
938
2.6
4
4,81
4 6.
5
8,
532
1.2
5
07,3
85
74.1
3
2,87
5 4.
8
72,
814
10.6
684
,359
3
Kab.
Del
i Ser
dang
2
1,91
3 7.
1
23,
817
7.8
1,09
6 0.
4
230
,388
75
.2 n
.a
n.a
29,
273
9.6
306
,487
4
Kab.
Lab
uhan
Bat
u
29,
448
7.1
5
1,10
2 12
.2
1,
346
0.3
2
87,1
14
68.8
9,64
8 2.
3
38,
715
9.3
417
,372
5
Kab.
Lan
gkat
*
17,
345
3.9
4
9,18
7 11
.1
15,
451
3.5
2
86,3
69
64.9
1
1,93
3 2.
7
60,
993
13.8
441
,278
6
Kab.
Man
daili
ng N
atal
*
19,
127
3.4
3
1,39
4 5.
6
5,
144
0.9
4
43,5
93
79.0
2
6,55
7 4.
7
35,
880
6.4
561
,695
7
Kab.
Nia
s
17,
326
3.5
2
9,44
6 5.
9
2,
786
0.6
3
59,4
92
72.4
2
1,53
0 4.
3
40,
671
8.2
496
,794
8
Kab.
Sim
alun
gun
1
7,34
4 3.
5
47,
825
9.5
1,47
2 0.
3
366
,273
73
.0
15,
764
3.1
5
3,31
0 10
.6
5
01,9
87
9Ka
b. T
anah
Kar
o
29,
305
3.9
6
9,52
4 9.
3
3,
630
0.5
6
15,9
98
82.6
2
7,47
4 3.
7 n
.a
n.a
745
,931
10
Kab.
Tap
anul
i Sel
atan
1
1,29
1 2.
1
49,
449
9.3
2,82
4 0.
5
401
,303
75
.1
17,
501
3.3
5
2,12
8 9.
8
5
34,4
96
11Ka
b. T
apan
uli T
enga
h
24,
483
3.6
6
1,17
6 8.
9
3,
058
0.4
4
84,1
35
70.4
4
3,84
7 6.
4
71,
429
10.4
688
,128
12
Kab.
Tap
anul
i Uta
ra
32,
818
4.3
8
4,39
4 11
.1
6,
365
0.8
5
45,3
25
71.6
3
7,82
3 5.
0
54,
574
7.2
761
,298
13
Kab.
Tob
a Sa
mos
ir
41,
767
5.6
4
2,80
9 5.
7
4,
895
0.7
5
56,0
70
74.2
3
1,30
9 4.
2
72,
286
9.6
749
,135
14
Kota
Bin
jai
3
8,60
4 4.
8
75,
167
9.4
5,32
6 0.
7
568
,593
71
.2
40,
906
5.1
6
9,49
2 8.
7
7
98,0
88
15Ko
ta M
edan
128
,310
24
.0
94,
321
17.6
54
2 0.
1
201
,419
37
.7
3,
233
0.6
106
,916
20
.0
5
34,7
42
16Ko
ta P
emat
ang
Sian
tar*
5
9,78
3 7.
0
56,
624
6.6
2,45
3 0.
3
616
,256
71
.8
39,
214
4.6
8
3,89
1 9.
8
8
58,2
20
17Ko
ta S
ibol
ga
91,
368
6.3
149
,822
10
.3
12,
493
0.9
1,0
67,1
67
73.6
7
3,57
3 5.
1
55,
109
3.8
1
,449
,533
18
Kota
Tan
jung
Bal
ai
59,
235
6.2
7
3,82
1 7.
8
6,
590
0.7
6
95,9
26
73.2
3
6,98
7 3.
9
78,
145
8.2
950
,704
19
Kota
Teb
ing
Ting
gi
72,
197
6.3
100
,422
8.
7
8,
113
0.7
8
59,1
54
74.6
4
7,99
8 4.
2
63,
854
5.5
1
,151
,738
20
Kota
Pad
ang
Side
mpu
an*
2
5,74
9 2.
7
47,
615
4.9
6,30
5 0.
7
723
,584
75
.2
86,
477
9.0
7
2,27
4 7.
5
9
62,0
03
21Ka
b. P
akpa
k Bh
arat
8,27
1 0.
7 3
09,6
99
24.5
n.a
n
.a
7
57,2
10
60.0
116
,754
9.
2
70,
647
5.6
1
,262
,581
22
Kab.
Nia
s Se
lata
n
3,
343
1.1
3
4,64
5 11
.7 n
.a
n.a
244
,546
82
.9 n
.a
n.a
11,
113
3.8
295
,150
23
Kab.
Hum
bang
Has
undu
tan
1
1,59
3 1.
8
79,
513
12.6
1,18
3 0.
2
467
,926
74
.4
26,
226
4.2
4
2,89
7 6.
8
6
29,3
36
A
vera
ge
(dis
tric
ts)
3
4,83
5 5.
1
71,
550
9.9
4,79
4 0.
6
502
,478
71
.6
36,
161
4.4
5
7,73
6
8.
8
7
01,5
48
Min
imum
(dis
tric
ts)
3,34
3 0.
7
23,
817
4.9
54
2 0.
1
201
,419
37
.7
3,
233
0.6
11,
113
3.8
295
,150
Max
imum
(dis
tric
ts)
128
,310
24
.0 3
09,6
99
24.5
1
5,45
1 3.
5 1
,067
,167
82
.9 1
16,7
54
9.2
1
06,9
16
2
0.0
1
,449
,533
So
urce
: SIK
D/M
oF. A
PBD
Nia
s an
d N
ias
Sela
tan.
N
ote:
* Th
is k
abup
aten
/kot
a m
ake
use
of 2
003
data
.

Managing Resources to Build Back and Create a Better Future for Nias
Nias Public Expenditure Analysis 2007
80
ANNEXES
Table B.8.8 Routine and development expenditures by district in North Sumatra, 2004 Rupiah per capita and percentage share of total expenditure
No Districts Routine Development Total
% %
1 Kab. Asahan 285,875 72.6 108,105 27.4 393,980
2 Kab. Dairi 551,366 73.2 202,202 26.8 753,568
3 Kab. Deli Serdang 246,109 89.0 30,315 11.0 276,424
4 Kab. Labuhan Batu 264,011 60.8 169,968 39.2 433,979
5 Kab. Langkat* 289,105 66.8 143,592 33.2 432,697
6 Kab. Mandailing Natal n.a n.a n.a n.a n.a
7 Kab. Nias 357,512 75.0 119,366 25.0 476,878
8 Kab. Simalungun 392,288 81.8 87,475 18.2 479,763
9 Kab. Tanah Karo 569,225 75.0 189,672 25.0 758,896
10 Kab. Tapanuli Selatan 385,733 73.7 137,665 26.3 523,398
11 Kab. Tapanuli Tengah 422,000 57.5 311,568 42.5 733,568
12 Kab. Tapanuli Utara 528,145 70.2 223,836 29.8 751,981
13 Kab. Toba Samosir 487,470 67.7 232,406 32.3 719,876
14 Kota Binjai 586,665 74.5 200,575 25.5 787,240
15 Kota Medan 346,602 69.4 153,107 30.6 499,709
16 Kota Pematang Siantar* 584,286 73.8 207,829 26.2 792,115
17 Kota Sibolga 658,387 47.3 733,753 52.7 1,392,140
18 Kota Tanjung Balai 488,186 52.1 448,388 47.9 936,574
19 Kota Tebing Tinggi 642,218 62.1 392,573 37.9 1,034,791
20 Kota Padang Sidempuan* 676,251 78.9 181,259 21.1 857,510
21 Kab. Pakpak Bharat 624,576 58.1 450,745 41.9 1,075,320
22 Kab. Nias Selatan 177,080 70.0 75,958 30.0 253,037
23 Kab. Humbang Hasundutan 450,972 74.2 156,541 25.8 607,513
Average (districts) 455,185 69.3 225,314 30.7 680,498
Minimum (districts) 177,080 47.3 30,315 11.0 253,037
Maximum (districts) 676,251 89.0 733,753 52.7 1,392,140
Source: SIKD/MoF. APBD Nias and Nias Selatan. Note:* These kabupaten/kota make use of 2003 data.

81Managing Resources to Build Back and Create a Better Future for Nias
Nias Public Expenditure Analysis 2007 ANNEXES
Tab
le B
.8.9
Rou
tin
e ex
pen
dit
ure
by
econ
omic
cla
ssifi
cati
on a
nd
dis
tric
t in
Nor
th S
umat
ra, 2
004
Rupi
ah p
er c
apita
and
per
cent
age
shar
e of
tota
l rou
tine
expe
nditu
re
No
Dis
tric
tsPe
rson
nel
Goo
ds
and
se
rvic
esO
per
atio
nal
an
d
mai
nte
nan
ceO
ffi c
ial t
rave
lO
ther
sSu
bsi
dy
and
fi n
anci
al
assi
stan
ce
Un
exp
ecte
d
Exp
ense
sTo
tal
%
%
%
%
%
%
%
1Ka
b. A
saha
n 2
35,5
51
8
2.4
23,
673
8.3
1
,552
0.
5
2,2
44
0.8
-
- 2
2,65
4 7.
9
202
0.1
285
,875
2Ka
b. D
airi*
374
,346
67.
9 4
4,65
4 8.
1
14,6
32
2.7
12,
494
2.3
75,5
47
13
.7
-
0.0
2
9,69
2 5.
4 5
51,3
66
3Ka
b. D
eli S
erda
ng 2
07,2
25
8
4.2
21,
762
8.8
2
,582
1.
0
1,6
76
0.7
-
- 1
1,44
5 4.
7
1,
420
0.6
246
,109
4Ka
b. L
abuh
an B
atu
221
,432
83.
9
9,6
02
3.6
3
,905
1.
5
2,3
27
0.9
-
- 2
4,11
9 9.
1
2,
625
1.0
264
,011
5Ka
b. L
angk
at*
211
,060
73.
0 4
1,18
0 14
.2
6,4
54
2.2
2
,284
0.
8 9
,233
3.2
4,03
3 1.
4
14,
861
5.1
289
,105
6Ka
b. M
anda
iling
Nat
al n
.a
n.a
n.a
n.a
n.a
n
.a
n.a
n
.a
n.a
n
.a
n.a
n
.a
n.a
n
.a
n.a
7Ka
b. N
ias
292
,307
81.
8 2
0,81
9 5.
8
3,9
42
1.1
10,
720
3.0
-
- 2
6,47
7 7.
4
3,
246
0.9
357
,512
8Ka
b. S
imal
ungu
n 3
54,2
04
9
0.3
16,
716
4.3
1
,411
0.
4
5,2
07
1.3
-
- 1
4,29
6 3.
6
454
0.1
392
,288
9Ka
b. T
anah
Kar
o 4
58,1
71
8
0.5
75,
987
13.3
19
,788
3.
5 1
5,15
1 2.
7
-
-
-
0.0
12
8 0.
0 5
69,2
25
10Ka
b. T
apan
uli S
elat
an 3
00,4
72
7
7.9
32,
904
8.5
7
,692
2.
0 1
3,91
7 3.
6
-
-
22,
579
5.9
8,16
9 2.
1 3
85,7
33
11Ka
b. T
apan
uli T
enga
h 2
98,8
65
7
0.8
57,
342
13.6
10
,059
2.
4
8,1
74
1.9
-
- 4
6,86
7 11
.1
693
0.2
422
,000
12Ka
b. T
apan
uli U
tara
456
,612
86.
5 3
1,09
2 5.
9
6,4
76
1.2
11,
111
2.1
-
- 2
1,85
1 4.
1
1,
003
0.2
528
,145
13Ka
b. T
oba
Sam
osir
393
,614
80.
7 3
4,34
8 7.
0
4,0
86
0.8
13,
801
2.8
-
-
38,
141
7.8
3,48
0 0.
7 4
87,4
70
14Ko
ta B
inja
i 4
41,4
51
7
5.2
80,
590
13.7
31
,162
5.
3 1
4,91
1 2.
5
-
-
1
8,33
6 3.
1
215
0.0
586
,665
15Ko
ta M
edan
223
,244
64.
4 5
3,40
4 15
.4
1,0
89
0.3
4
,926
1.
4
-
-
6
1,33
9 17
.7
2,
601
0.8
346
,602
16Ko
ta P
emat
ang
Sian
tar*
439
,601
75.
2 6
1,20
9 10
.5
12,8
22
2.2
4
,357
0.
727
,309
4.7
31
6 0.
1
38,
672
6.6
584
,286
17Ko
ta S
ibol
ga 5
18,9
96
7
8.8
59,
183
9.0
-
0.
0 1
2,11
4 1.
8
-
-
6
3,31
0 9.
6
4,
784
0.7
658
,387
18Ko
ta T
anju
ng B
alai
353
,191
72.3
5
4,00
1 11
.1
14,2
89
2.9
17,
713
3.6
-
-
44,
558
9.1
4,43
4 0.
9 4
88,1
86
19Ko
ta T
ebin
g Ti
nggi
465
,740
72.
5 9
0,04
1 14
.0
18,1
23
2.8
9
,712
1.
5
-
-
58,
439
9.1
16
2 0.
0 6
42,2
18
20Ko
ta P
adan
g Si
dem
puan
* 4
41,4
11
6
5.3
95,
301
14.1
15
,964
2.
4 1
0,68
2 1.
656
,556
8.4
-
0.0
5
6,33
6 8.
3 6
76,2
51
21Ka
b. P
akpa
k Bh
arat
419
,120
67.
1 8
5,08
4 13
.6
12,5
32
2.0
37,
492
6.0
-
- 6
7,42
8 10
.8
2,
919
0.5
624
,576
22Ka
b. N
ias
Sela
tan
103
,869
58.
7 4
5,90
6 25
.9
1,4
01
0.8
7
,022
4.
011
,050
6.2
-
0.0
7,83
1 4.
4 1
77,0
80
23Ka
b. H
umba
ng H
asun
duta
n 3
58,6
87
7
9.5
25,
536
5.7
5
,429
1.
2
9,7
19
2.2
-
-
49,
379
10.9
2,22
3 0.
5 4
50,9
72
A
vera
ge
(dis
tric
ts)
344,
053
75.9
48,1
9710
.78,
881
1.8
10,3
532.
28,
168
1.6
27,0
716.
18,
461
1.8
455,
185
Min
imum
(dis
tric
ts)
103,
869
58.7
9,60
23.
60
0.0
1,67
60.
70
0.0
00.
012
80.
017
7,08
0
M
axim
um (d
istr
icts
)51
8,99
690
.395
,301
25.9
31,1
625.
337
,492
6.0
75,5
4713
.767
,428
17.7
56,3
368.
367
6,25
1
Sour
ce: S
IKD
/MoF
. APB
D N
ias
and
Nia
s Se
lata
n.
Not
e:*
Thes
e ka
bupa
ten/
kota
mak
e us
e of
200
3 da
ta.

Managing Resources to Build Back and Create a Better Future for Nias
Nias Public Expenditure Analysis 2007
82
ANNEXES
Tab
le B
.8.1
0 D
evel
opm
ent e
xpen
dit
ure
by
sect
or a
nd
dis
tric
t in
Nor
th S
umat
ra, 2
004
Rupi
ah p
er c
apita
and
per
cent
age
shar
e of
tota
l dev
elop
men
t exp
endi
ture
Dis
tric
tsG
over
nm
ent
app
arat
us
Agr
icul
ture
an
d
fore
stry
Min
ing
an
d
ener
gy
Trad
e an
d
bus
ines
s
dev
elop
men
t
Man
pow
erH
ealt
h a
nd
soci
al w
elfa
re
Educ
atio
n a
nd
cult
ure
Envi
ron
men
t
and
sp
atia
l
pla
nn
ing
Reg
ion
al
dev
elop
men
t
and
hou
sin
g
Tran
spor
t,
wat
er, a
nd
irri
gat
ion
Dem
ogra
phy
and
fam
ily
pla
nn
ing
Tele
com
mun
icat
ion
and
tour
ism
%%
%%
%%
%%
%%
%%
1Ka
b. A
saha
n 3
7,20
5 3
4.4
3,0
29
2.8
293
0
.3
1,2
63
1.2
3
52
0.3
3
,553
3
.3
12,
328
11.4
295
0
.3
- -
49,
128
45.
4 6
59
0.6
-
-
2Ka
b. D
airi*
28,
162
11.
7 1
1,00
4 4.
61,
351
0.6
7
,885
3
.3
678
0
.3
19,
280
8.0
3
2,84
7 13
.7 1
,443
0
.6
33,
054
13.
8 9
9,55
3 4
1.5
- -
4,8
95
2.0
3Ka
b. D
eli S
erda
ng 1
0,07
7 3
3.2
1,1
60
3.8
- -
291
1
.0
- -
1,6
60
5.5
6
04
2.0
627
2
.1
2,5
82
8.5
1
2,81
7 4
2.3
408
1
.3
90
0.3
4Ka
b. L
abuh
an B
atu
36,
732
21.
6 5
,827
3.
4 -
- 5
01
0.3
3
61
0.2
1
7,03
6 1
0.0
22,
149
13.0
13,
791
8.1
-
- 7
3,27
9 4
3.1
291
0
.2
- -
5Ka
b. L
angk
at*
24,
733
17.
2 5
,720
4.
01,
337
0.9
4
,372
3
.0
666
0
.5
5,6
72
4.0
1
6,82
6 11
.7 1
,584
1
.1
18,
165
12.
7 6
2,40
3 4
3.5
1,2
50
0.9
8
64
0.6
6Ka
b. M
anda
iling
Nat
al n
.a
n.a
n.
an.
a n
.a
n.a
n
.a
n.a
n
.a
n.a
n
.a
n.a
n
.a
n.a
n
.a
n.a
n
.a
n.a
n
.a
n.a
n
.a
n.a
n
.a
n.a
7Ka
b. N
ias
27,
140
22.7
8,7
69
7.3
- -
1,0
22
0.9
-
- 9
,141
7
.7
14,
171
11.9
- -
- -
56,
621
47.
4 1
,994
1
.7
509
0
.4
8Ka
b. S
imal
ungu
n 2
9,87
3 34
.2 7
,870
9.
0 3
35
0.4
4
92
0.6
-
- 6
,461
7
.4
6,7
73
7.7
111
0
.1
8,6
18
9.9
2
6,24
4 3
0.0
339
0
.4
359
0
.4
9Ka
b. T
anah
Kar
o 4
6,21
4 24
.4 1
9,14
8 10
.1 -
- 7
91
0.4
-
- 8
,796
4
.6
8,9
56
4.7
2,3
53
1.2
-
- 1
01,4
21
53.
5 3
28
0.2
1
,664
0
.9
10Ka
b. T
apan
uli S
elat
an 5
1,47
6 37
.4 1
5,34
7 11
.1 -
- 1
,569
1
.1
708
0
.5
9,3
28
6.8
1
1,36
2 8.
3 3
,386
2
.5
41,
311
30.
0 2
,687
2
.0
490
0
.4
- -
11Ka
b. T
apan
uli T
enga
h 6
8,49
0 22
.0 2
2,73
7 7.
3 8
83
0.3
1
,841
0
.6
521
0
.2
11,
152
3.6
1
9,12
5 6.
1 6
,234
2
.0
- -
180
,175
5
7.8
411
0
.1
- -
12Ka
b. T
apan
uli U
tara
73,
067
32.6
14,
668
6.6
- -
1,2
47
0.6
-
- 2
0,74
0 9
.3
36,
129
16.1
4,8
70
2.2
1
3,35
2 6
.0
58,
277
26.
0 1
,486
0
.7
- -
13Ka
b. T
oba
Sam
osir
75,
871
32.6
12,
786
5.5
- -
4,1
43
1.8
5
,052
2
.2
14,
767
6.4
3
2,22
3 13
.9 4
,847
2
.1
- -
74,
470
32.
0 2
,504
1
.1
5,7
44
2.5
14Ko
ta B
inja
i 6
1,02
4 30
.4 1
,880
0.
9 -
- 2
,567
1
.3
357
0
.2
17,
276
8.6
2
3,07
0 11
.5 3
,713
1
.9
7,1
67
3.6
8
1,95
3 4
0.9
1,3
83
0.7
1
85
0.1
15Ko
ta M
edan
25,
826
16.9
1,1
24
0.7
- -
885
0
.6
63
0.0
9
,741
6
.4
1,5
29
1.0
19,
451
12.
7 6
,092
4
.0
88,
352
57.
7 4
4 0
.0
- -
16Ko
ta P
emat
ang
Sian
tar*
47,
601
22.9
3,1
03
1.5
4,67
3 2
.2
10,
893
5.2
2
00
0.1
1
2,96
0 6
.2
29,
506
14.2
7,4
64
3.6
5
0,76
2 2
4.4
38,
706
18.
6 1
11
0.1
1
,849
0
.9
17Ko
ta S
ibol
ga 1
90,5
77
26.0
3,4
58
0.5
- -
5,5
30
0.8
2
97
0.0
1
06,7
50
14.
5 5
8,92
5 8.
0 4
8,64
8 6
.6
301
,988
4
1.2
10,
995
1.5
2
,916
0
.4
3,6
67
0.5
18Ko
ta T
anju
ng B
alai
85,
139
19.0
11,
968
2.7
- -
2,4
70
0.6
9
39
0.2
6
,303
1
.4
43,
500
9.7
9,8
29
2.2
-
- 2
85,7
25
63.
7 2
,515
0
.6
- -
19Ko
ta T
ebin
g Ti
nggi
59,
611
15.2
8,8
03
2.2
- -
861
0
.2
- -
27,
636
7.0
4
0,48
6 10
.3 -
- 2
53,7
60
64.
6 1
,415
0
.4
- -
- -
20Ko
ta P
adan
g Si
dem
puan
* 4
6,29
4 25
.5 5
,343
2.
9 -
- 2
,728
1
.5
529
0
.3
16,
831
9.3
2
7,00
0 14
.9 9
,481
5
.2
6,9
11
3.8
6
3,43
0 3
5.0
709
0
.4
2,0
01
1.1
21Ka
b. P
akpa
k Bh
arat
450
,745
10
0.0
- 0.
0 -
- -
- -
- -
- -
- -
- -
- -
- -
- -
-
22Ka
b. N
ias
Sela
tan
16,
940
22.3
2,7
17
3.6
- -
3,8
48
5.1
-
- 4
,290
5
.6
10,
643
14.0
1,5
78
2.1
1
,600
2
.1
21,
990
29.
0 9
,720
1
2.8
2,6
32
3.5
23Ka
b. H
umba
ng H
asun
duta
n 5
6,04
2 35
.8 1
0,04
2 6.
4 -
- 1
,256
0
.8
- -
10,
959
7.0
3
,396
2.
2 1
,073
0
.7
- -
73,
300
46.
8 4
73
0.3
-
-
Ave
rag
e (d
istr
icts
)70
,402
29.0
8,02
34.
440
30.
22,
566
1.4
487
0.2
15,4
706.
520
,525
9.4
6,39
92.
633
,880
10.2
66,4
9734
.51,
274
1.0
1,11
20.
6
Min
imum
(dis
tric
ts)
10,0
7711
.70
0.0
00.
00
0.0
00.
00
0.0
00.
00
0.0
00.
00
0.0
00.
00
0.0
Max
imum
(dis
tric
ts)
450,
745
100.
022
,737
11.1
4,67
32.
210
,893
5.2
5,05
22.
210
6,75
014
.558
,925
16.1
48,6
4812
.730
1,98
864
.628
5,72
563
.79,
720
12.8
5,74
43.
5
Sour
ce: S
IKD
/MoF
. APB
D N
ias
and
Nia
s Se
lata
n.
Not
e:*
Thes
e ka
bupa
ten/
kota
mak
e us
e of
200
3 da
ta.

83Managing Resources to Build Back and Create a Better Future for Nias
Nias Public Expenditure Analysis 2007 ANNEXES
Tab
le B
.8.1
1 Ed
ucat
ion
, hea
lth
, an
d in
fras
truc
ture
exp
end
itur
es b
y ro
utin
e, a
nd
dev
elop
men
t an
d b
y d
istr
ict i
n N
orth
Sum
atra
, 200
4 Ru
piah
per
cap
ita, p
erce
ntag
e sh
are
of to
tal s
ecto
r, an
d pe
rcen
tage
shar
e of
sect
or o
f tot
al e
xpen
ditu
re
Dis
tric
ts
Educ
atio
nH
ealt
hIn
fras
truc
ture
Tota
l Exp
Rout
ine
Dev
elop
men
tTo
tal
% E
duc
atio
n
of T
otal
Exp
Rout
ine
Dev
elop
men
tTo
tal
% H
ealt
h o
f To
tal E
xpRo
utin
eD
evel
opm
ent
Tota
l %
In
fras
truc
ture
of
Tot
al E
xp
%%
%%
%%
%%
%
Kab.
Asa
han
166,
940
93.1
12,3
286.
917
9,26
845
.519
,750
84.8
3,55
315
.223
,303
5.9
6,1
83
11.1
49,
421
88.9
55,6
0414
.1 3
93,9
80
Kab.
Dai
ri*28
2,18
790
.629
,237
9.4
311,
423
41.3
51,4
6173
.818
,308
26.2
69,7
699.
3 1
2,96
4 8.
5 1
38,8
53
91.5
151,
817
20.1
753
,568
Kab.
Del
i Ser
dang
158,
577
99.6
604
0.4
159,
182
57.6
21,6
0492
.91,
660
7.1
23,2
648.
4 5
,290
25
.5 1
5,48
9 74
.520
,779
7.5
276
,424
Kab.
Lab
uhan
Bat
u15
5,65
387
.522
,149
12.5
177,
803
41.0
20,4
3954
.517
,036
45.5
37,4
758.
6 3
,624
4.
7 7
3,27
9 95
.376
,904
17.7
433
,979
Kab.
Lan
gkat
*12
5,52
491
.611
,524
8.4
137,
047
31.7
25,8
3583
.35,
184
16.7
31,0
197.
2 7
,915
8.
7 8
2,77
0 91
.390
,685
21.0
432
,697
Kab.
Man
daili
ng N
atal
n.a
n.a
n.a
n.a
n.a
n.a
n.a
n.a
n.a
n.a
n.a
n.a
n.a
n.a
n.a
n.a
n.a
Kab.
Nia
s18
3,22
792
.814
,171
7.2
197,
397
41.4
28,1
6875
.59,
141
24.5
37,3
097.
8 6
,966
10
.9 5
7,13
0 89
.164
,096
13.4
476
,878
Kab.
Sim
alun
gun
262,
783
97.5
6,77
32.
526
9,55
656
.224
,647
79.2
6,46
120
.831
,107
6.5
11,
890
25.1
35,
556
74.9
47,4
469.
9 4
79,7
63
Kab.
Tan
ah K
aro
311,
643
97.2
8,95
62.
832
0,59
942
.272
,169
89.5
8,46
010
.580
,629
10.6
11,
306
9.9
103
,085
90
.111
4,39
115
.1 7
58,8
96
Kab.
Tap
anul
i Sel
atan
208,
838
94.8
11,3
625.
222
0,20
042
.124
,265
72.2
9,32
827
.833
,594
6.4
10,
089
18.7
43,
998
81.3
54,0
8710
.3 5
23,3
98
Kab.
Tap
anul
i Ten
gah
213,
188
91.8
19,1
258.
223
2,31
331
.723
,166
67.5
11,1
5232
.534
,318
4.7
9,4
83
5.0
181
,058
95
.019
0,54
126
.0 7
33,5
68
Kab.
Tap
anul
i Uta
ra31
6,45
489
.836
,129
10.2
352,
583
46.9
42,0
4467
.020
,740
33.0
62,7
848.
3 1
1,81
8 14
.2 7
1,62
9 85
.883
,446
11.1
751
,981
Kab.
Tob
a Sa
mos
ir30
2,23
790
.432
,223
9.6
334,
460
46.5
35,7
1770
.714
,767
29.3
50,4
837.
0 8
,744
9.
8 8
0,21
4 90
.288
,958
12.4
719
,876
Kota
Bin
jai
235,
493
91.1
23,0
708.
925
8,56
332
.872
,202
83.0
14,7
5717
.086
,958
11.0
27,
621
23.6
89,
306
76.4
116,
926
14.9
787
,240
Kota
Med
an13
6,19
398
.91,
492
1.1
137,
685
27.6
38,9
9580
.09,
725
20.0
48,7
209.
7 1
4,66
3 13
.4 9
4,44
4 86
.610
9,10
721
.8 4
99,7
09
Kota
Pem
atan
g Si
anta
r*26
7,03
895
.014
,199
5.0
281,
237
35.5
65,4
5187
.19,
663
12.9
75,1
149.
5 3
9,38
6 29
.1 9
5,99
0 70
.913
5,37
617
.1 7
92,1
15
Kota
Sib
olga
283,
065
82.8
58,9
2517
.234
1,99
124
.665
,098
37.9
106,
750
62.1
171,
848
12.3
19,
595
5.8
316
,650
94
.233
6,24
524
.2 1
,392
,140
Kota
Tan
jung
Bal
ai17
0,01
779
.643
,500
20.4
213,
517
22.8
48,3
0188
.56,
303
11.5
54,6
055.
8 1
8,49
9 6.
1 2
85,7
25
93.9
304,
224
32.5
936
,574
Kota
Teb
ing
Ting
gi25
8,99
086
.540
,486
13.5
299,
476
28.9
62,8
8869
.527
,636
30.5
90,5
248.
7 2
4,51
7 8.
8 2
55,1
76
91.2
279,
693
27.0
1,0
34,7
91
Kota
Pad
ang
Side
mpu
an*
326,
971
93.3
23,4
656.
735
0,43
640
.955
,773
80.1
13,8
3319
.969
,606
8.1
34,
430
32.2
72,
342
67.8
106,
773
12.5
857
,510
Kab.
Pak
pak
Bhar
atn.
an.
an.
an.
an.
an.
an.
an.
an.
an.
an.
an.
an.
an.
an.
an.
a1,
075,
320
Kab.
Nia
s Se
lata
n83
,245
88.7
10,6
4311
.393
,888
37.1
18,2
6684
.33,
399
15.7
21,6
658.
6 2
,454
8.
6 2
6,22
3 91
.428
,676
11.3
253
,037
Kab.
Hum
bang
Has
undu
tan
180,
521
98.2
3,39
61.
818
3,91
730
.323
,012
67.7
10,9
5932
.333
,971
5.6
4,2
03
5.4
73,
300
94.6
77,5
0312
.8 6
07,5
13
Ave
rag
e22
0,41
892
20,1
798
240,
597
38.3
39,9
6476
15,6
5824
55,6
228
13,8
8814
106,
745
8612
0,63
216
.868
0,49
8
Mn
imum
83,2
4580
604
093
,888
22.8
18,2
6638
1,66
07
21,6
655
2,45
45
15,4
8968
20,7
797.
525
3,03
7
Max
imum
326,
971
100
58,9
2520
352,
583
57.6
72,2
0293
6217
1,84
812
39,3
8632
316,
650
9533
6,24
532
.51,
392,
140
Sour
ce: S
IKD
/MoF
. APB
D N
ias
and
Nia
s Se
lata
n.
Not
e:*
Thes
e ka
bupa
ten/
kota
mak
e us
e of
200
3 da
ta.

Managing Resources to Build Back and Create a Better Future for Nias
Nias Public Expenditure Analysis 2007
84
ANNEXES
Annex C: Methodological Note
A. Provincial and District Government Budget (APBD)
The provincial and district government budget (Anggaran Pendapatan dan Belanja Daerah, or APBD) is the yearly budget allocated and/or spent by provincial and district governments. The budget consists of two categories: planned (proposal for parliament approval) and realization (actual spending or accountability report of the head of the region). Data span from 1994 to 2006 from several sources. For 1994–99, data was provided by BPS. For 2000–03, data were derived from MoF’s Regional Financial Information System (Sistem Informasi Keuangan Daerah, or SIKD). Data for 2004 and 2006 were obtained from district governments in Nias and Nias Selatan. A projection is made for some components of Nias 2006 budget numbers.
B. Reconstruction Finance Estimates Needs
Needs
The estimated reconstruction needs were calculated based on data from Post Disaster Damage Assessment on Nias and Simeulu Island, carried out by IOM, 2005. This assessment covers mainly damage to infrastructure and buildings, and does not take into account potential losses in the economic and social sectors. With the help of the IOM damage data, the aggregate sectoral and fi nancial impact has been calculated in applying data international standard ECLAC-methodology that had also been used to estimate the damage and losses of the tsunami.
Reconstruction fi nancing
The fi nancing sources have been categorized into three main sources: GoI, NGOs and donors. The data have been compiled from BRR’s concept note approval mechanism for each NGOs or donor projects, as well as direct confi rmation from donors, NGOs, and BRR for budget allocations and disbursements. Allocated fund referred to the fund that has been assigned into particular project, whereas disbursement is the fund that already transferred from the source of fund to the implementers (e.g. from donors to NGOs).
Geographical allocation
The estimated project allocation data by districts come from the Concept Note Approval mechanism of BRR, which also provided information about the sector and targeted districts for projects. However, in some cases detail information on sector defi nition and project area coverage is limited or assigned into several sectors and covered more than one district (except BRR), thus the estimation for geographical split using the weights of damage and loss assessment was applied.
Double-counting
The fi nancing fi gures for reconstruction are vulnerable to double-counting, whereby funds can be channeled from more than one organization to multiple implementers (e.g., one donor to other donors and NGOs, or one NGO to other NGOs). Eff orts have to be made to avoid this double-counting from occurring. Since the fi gures were captured based on the fi eld project implementers (mostly NGOs), the donors (mostly bilateral) fi gures presented might be underestimated while overestimated the NGOs.
C. PFM Framework: Strategic Areas, Outcomes, and Indicators
The PFM framework was developed by the World Bank and Government of Indonesia’s Ministry of Home Aff airs to assess district governments’ fi nancial management capacity. The framework is divided in nine strategic areas key to eff ective management of public fi nances by district governments: (1) Regulatory Framework, (2) Planning and Budgeting, (3) Cash Management, (4) Procurement, (5) Accounting and Reporting, (6) Internal Audit, (7) Public Debt and Investment, (8) Asset Management, and (9) External Audit and Oversight. Each strategic area is divided into between 1 and 5 outcomes, and lists of indicators are provided for each outcome.

85Managing Resources to Build Back and Create a Better Future for Nias
Nias Public Expenditure Analysis 2007 ANNEXES
The outcomes represent a desired achievement within each strategic area, and indicators are used to assess how district governments are performing in that area. It should be noted that international best practices have not been used to form the basis of the outcomes because, in practice, the gulf between them and the present reality is too great to generate viable results.
Respondents are required to answer “yes” or “no” to each statement represented by each indicator. Affi rmative responses are added for each outcome, and a score is calculated according to the percentage of “yes’” responses. Some strategic areas have more indicators than others; hence, they have more weight in the overall results. For example, planning and budgeting covers 49 indicators, yet debt and public investment covers only 8. Other more heavily weighted strategic indicators include procurement (41 indicators) and cash management (31 indicators).
Source: Pengelolaan Keuangan Publik WB and MoHA 2005.
Survey sites
The PFM framework in Nias island was implemented in both Nias district and Nias Selatan district. Both districts in Nias were heavily aff ected by the March 2005 earthquake. Researchers involved come from well-regarded university with strong backgrounds in accounting and local fi nances. The University of North Sumatra provided researchers for Nias island. The PFM Survey in Nias was funded by LGSP-USAID and World Bank organized.
Methodology
Results were obtained through interviews and FGDs (focus group discussions) with local government representatives in the relevant departments. These include Bappeda, the fi nance department; DPRD, the local revenue department; the local treasury offi ce; public works agency; and local supervision agency. To ensure data accuracy, “yes” responses are required to be supported by either relevant documentation and/or cross-checked with additional respondents.
Interpretation of results
A score is given for each strategic area and survey site, and an overall score is given for each survey site. For comparison and evaluation, strategic area scores can be graded according to the categories shown below.
Overall score (%)80–100 Excellent/fully acceptable60–79 Very good/substantially acceptable40–59 Good/fairly acceptable20–39 Moderate/partially acceptable0–19 Poor/not acceptable

Managing Resources to Build Back and Create a Better Future for Nias
Nias Public Expenditure Analysis 2007
86
ANNEXES
Annex D: The Nias Public Expenditure Analysis (NPEA) Program
Introduction
The local fi scal policy, especially which is related with budget making process, in Nias has been become more complicated and cumbersome because of the increasing challenges associated to the several conditions below:
(i) The implementation of two decentralization law: Law No. 22/1999 on Regional Government and Law No. 25/1999 on the Fiscal Balance between the Central Government and the Regions and the realization of Law No. 9/2002 on the formation of Nias Selatan district. Decentralization policy and the separation of the original Nias district into two districts, Nias and Nias Selatan, have not only granted a greater autonomy and freedom to the district government in managing the budget making process, but also brought up the problem of harmonization the fi scal policies in intergovernmental setting and the doubtful upon local government capacity in managing an effi cient and eff ective budget making process. Although to certain extent the fi scal decentralization might have increase the local fi scal revenue capacity caused by the increasing in district own-source revenue (PAD) or the rising of revenue transfer from central government in the form of the General Allocation Fund (DAU) and the Special Allocation Fund (DAK), the optimal utilization of available revenue as well as creation of district own-sustainable revenue sources and effi cient expenditure allocation mechanism is becoming essential to produce an equitable growth in long term.
(ii) The implementation of one of problematic and complicated reconstruction and redevelopment process in one of backward region in North Sumatra after the earthquake that hit Nias island on 28 March 2005. The tectonic activity measuring 8.7 on the Richter scale brought widespread misery and suff ering to the people on Nias island and has further extended the social and economic problems in this underdeveloped region, which is mainly reliant on agriculture or fi shery, mostly rural, and lack of infrastructure and public services. This tragedy has increased the poverty more than 50 percent in the short term. As a result of the earthquake, the island’s economy was predicted to contract by 20 percent in 2005. Although the central government, as well as donors and private NGOs have made several eff orts and programs for Nias restoration and relief process, the progress has been very slow. Geographical conditions, lack of natural resources, and poor infrastructure and public services delivery, as well as inadequate attention to Nias island, compare with Aceh, have all restricted the capacity of the local economy to develop and to raise its own funds. This is trun has limited the ability to carry out adequate reconstruction programs that off ered quick and positive outcomes. Up until now, above two-third of reparation and relief fund and the reconstruction management have depended on the central government’s reconstruction funds, directed through BRR. In the medium and longer term, however, district governments will be expected to play an increasing role in the reconstruction process and beyond. The hope is that by enlarging the role of district governments this will help to accelerate the reconstruction and redevelopment process on Nias island.
(iii) The capacity of the two district governments to manage fi scal policy effi ciently and the capacity of local people and other stakeholders to monitor the budget making process are very limited. Limited resources, especially related with the human resources as well as low revenue sources, and undeveloped democratic systems have limited the ability of the district governments to manage their budget-making processes in a responsive and transparent manner. Furthermore, the earthquake that has destroyed economic and political institution, both physically and institutionally, has also exaggerated the low fi scal capacity in Nias. Greater involvement by district governments and the people they represent in the post-earthquake reconstruction and redevelopment of the island is urgently needed to achieve a swift and adequate reconstruction outcome in the short term, as well as a sustainable and equitable growth in the long term.
To ensure the most eff ective and transparent utilization of public resources and the accomplishment of Nias island’s long-term development objectives, these recent challenges have raised the importance of participatory budget-making processes that involve both the governments (local and national) and other stakeholders in the reconstruction and redevelopment of Nias. In this respect, it is urgent to have a comprehensive understanding of the budget process, as well as to develop the well-functioning system of local fi scal management that is created and strengthened by the encouragement of local capacity to manage and monitor the fi scal management process.

87Managing Resources to Build Back and Create a Better Future for Nias
Nias Public Expenditure Analysis 2007 ANNEXES
1. Objectives
The Nias Public Expenditure Analysis (NPEA) is intended to achieve two major objectives, each having its sub-components:
(i) To obtain a better understanding of the Nias island’s fi scal policy, budget making process, and its budget structure, including Nias revenues, expenditures, and developing policy recommendations. Special emphasis will also be given to the Nias reconstruction and rehabilitation programs.
• Analyzing Nias districts’ revenues and expenditures, in particular with regard to management of revenues from its own-sources revenue, central government fi scal transfer, and natural resources. The emphasis will be given to the enhancement of the districts capacity to create their own potential own-source revenue and the optimality of its expenditure allocation leading to sustainable fi scal condition.
• Evaluating the eff ect of fi scal decentralization policy and the division of the original Nias district into Nias and Nias Selatan on district government capacity in public service delivery and the geographical distribution of fi scal resources vs. development outcomes;
• Giving a comprehensive investigation on the resources allocation vs. outcomes for the key sectors of public service delivery, such as health, education, and infrastructure, and its impacts on the general economic activities in Nias.
• Assisting the BRR and the two district governments to carry out a participatory public expenditure review that helps Nias island stakeholders understand the sum total of fi nancial commitments made to Nias island reconstruction and how they have been allocated.
• Helping the two district governments to fi nd the strategies for improving its fi scal management on public revenue and expenditure.
• Supplying recommendations that would support the BRR in planning and managing reconstruction funds;
• Providing general recommendations for more effi cient and eff ective resources allocation, and specifi c suggestion for the expenditure allocation of 2007 budget.
(ii) To develop and to leave a better system for the two districts to analyze and monitor district budgets:
• Setting up a network among local government and other Nias stakeholders, including local universities, NGOs, private-sector links, that will conduct the APEA. This network will, not only build up capacity to conduct public expenditure analysis in the future, but also strengthened democratization and civil society involvement in Nias.
• Granting technical assistance/capacity improvement to this network to carry out similar analysis in the future.
• Facilitating the creation of an institutional environment (with civil society, provincial and local governments, BRR, NGOs, international agencies, etc.) that is conducive to dissemination and absorption of this and future public expenditure analysis.
The expected results of NPEA are:
• Achieving a better budget resources allocation leading to an enhanced quantity and quality of local public services provision that is matched to local preferences and needs.
• Attaining a greater civil society involvement in local decision making process in identifi cation of public expenditure priorities and the management of fi scal aff airs that lead to a more transparent and improve local budget management.
• Enhancing local capability to autonomously conduct similar budget analysis in the future.• Encouraging a public debate on the budget process in Nias (through media reports and regular
conferences/seminars).

Managing Resources to Build Back and Create a Better Future for Nias
Nias Public Expenditure Analysis 2007
88
ANNEXES
2. Participatory nature of the NPEA
The fi nal accomplishment of the APEA will depend on its ability to: (i) be support and driven by local government and other Nias stakeholders; (ii) develop the local capacity to conduct public expenditure review. The local support and capacity building will be attained through the following means:
(i) The NPEA initiative is supported by the Governor of North Sumatra province, as well as the district heads (bupati) of Nias and Nias Selatan districts, the Provincial and District (kabupaten/kota) Development Planning Agency (Bappeda), the Rehabilitation and Reconstruction Agency (BRR), members of the parliament, local universities, NGOs, and informal leaders (civil society, community or religious leaders).
(ii) The team that will perform the technical analysis for the NPEA will also involve the experts from local scholars and universities.
(iii) To achieve a greater attention and participation on Nias reconstruction and redevelopment activities, a series of public hearing, technical workshop, and seminar may be not only conducted in Nias but also in Jakarta and Medan. These activities will be attended by the representatives of government offi cers from Central Government (Ministry of Finance (MoF), Ministry of Home Aff airs), the Provincial and District Governments, the Provincial and District (kabupaten/kota) Development Planning Agency (Bappeda), local scholars and universities and international aid agencies (UNDP, USAID, EC and the World Bank).
(iv) Training and participation of the representatives from local universities and research institutes (TARI) in the fi eld work related to NPEA to build their capacity in conducting the survey work.

89Managing Resources to Build Back and Create a Better Future for Nias
Nias Public Expenditure Analysis 2007 ANNEXES
Annex E: Minutes of NPEA Seminar and Focus Group Discussion
Hotel Soliga, 4 September 2006
Participants:
Local government offi cials from Nias and Nias Selatan districts, district legislature members, non-governmental organizations in Nias and Nias Selatan districts, the head of BRR Nias and other BRR representatives, community leaders, local academics, reporters from “Analisa”, “Bar-Bar”, “RRI”, and Nias district Vice-Bupati and Nias district Regional Secretary.
SEMINAR PRESENTATION SESSION
Dr. Suahasil Nazara (Demographic Institute)“NIAS PUBLIC EXPENDITURE ANALYSIS: PRELIMINARY STUDY”
Overall picture of revenue
The implementation of decentralization in Nias island has resulted in both good and bad outcomes in the short run. From 1999 to 2003, both total revenue and intergovernmental transfers increased by more 50 percent. The share of intergovernmental transfers, on average, accounted for around 95 percent of total revenue before decentralization and around 90 percent after decentralization. The small share of own-source revenue to the total revenue has raised concerns over dependency and sustainability of Nias fi scal capacity, although the total amount of money from own-source revenue increased after decentralizationNias and Nias Selatan district, have among the lowest total revenue in North Sumatra. Uncertainty over sources of revenue is also another challenge in Nias districts’ budget-making process.
District own-source revenue
District own-source revenue has slightly increased. After decentralization, local tax contributions decreased to around 25 percent, on average, from 2001 to 2004 and have been largely replaced by local charges. Street lighting tax and the extracting and processing of mining resources type C tax were the main contributors to local tax in 2004. Low district own-sources revenue has also been caused by limited power to impose taxes. The important taxes are still controlled by the central government. PAD sources mostly come from particular sub-districts. In 2004, Kecamatan Lahewa was the highest contributor of PAD in Nias district.
Revenue-sharing
The share of tax sharing of total local government revenue has also increased after decentralization, even after the separation of Nias district. Historically, land and building tax (PBB) has been the major contributor of tax-sharing, while income tax has played a minor role in tax sharing revenue in Nias island due to the large informal sector in the local economy, particularly agriculture and fi shery. The share of non-tax to total revenue has also increased after decentralization. Oil and gas resource revenue and fi shery revenue have dominated the composition of non-tax revenue-sharing in Nias district.
DAU and DAK
The DAU has been the main source of district government revenue after decentralization. However, Nias and Nias Selatan districts are below the provincial average in terms of DAU per capita. Nias Selatan district did not receive any DAK in its budget planned (2004). Nias district received Rp 21,000 per capita.
Overall expenditure
Decentralization has altered the expenditure pattern in Nias district. Routine expenditure has risen dramatically and development spending has only climbed slightly. Due to limited fi scal revenue capacity and large routine needs (especially for local government salaries) only funds are available for development purposes.

Managing Resources to Build Back and Create a Better Future for Nias
Nias Public Expenditure Analysis 2007
90
ANNEXES
Routine and development expenditure
Spending on personnel and good and services are the biggest expenditure items of routine expenditure, before and after decentralization. Personnel expenditure has declined gradually while goods and services expenditures have increased gradually. Expenses for infrastructure, education and culture, as well as health, are still the top three among development expenditures.
The revenue and spending of reconstruction and rehabilitation in Nias (BRR)
The allocation of reconstruction and rehabilitation spending has been more focused on the development and rehabilitation of infrastructure, housing, and health and education facilities. To ensure the continuity of reconstruction and rehabilitation and to fulfi ll the the island’s long-term development objectives, economic empowerment should be enhanced. The sustainability of reconstruction and rehabilitation in Nias depends on the fulfi llment of donors and central government’s pledges to provide the funds for reconstruction and rehabilitation programs.
Education
The share of education expenditure to total expenditure has decreased in recent years. Despite this, some indicators show an improvement in education. The net-enrollment ratio has increased at all educational levels, though the 90 percent level net-enrollment for elementary school is still been below the national average of 97 percent. The literacy rate is the lowest in North Sumatra.
Infrastructure
Infrastructure facilities are very poor. The reconstruction and rehabilitation activities carried by BRR should be able to improve infrastructure. Most roads are still earth and most of them are damaged. Most electricity is used for household needs. It is essential to increase electricity capacity to attract private investors.
Health
The share of health expenditure to total expenditure has decreased in recent years. There has been a slight increase in the number of health facilities. Public health public centers are fairly evenly distributed among sub-districts. Health outcomes remain very low.
Binahati Baeha, SH. (Bupati of Nias district)
We have to agree that the contribution of local revenue sources has been very low. After the implementation of decentralization, we targeted three revenue sources. The fi rst is decentralization funds (DAU and DAK). The second is deconcentration funds, which has been a problem and may be abolished. The third is the fund to assist duties (dana tugas perbantuan). Historically, it has been diffi cult to receive this fund.In the decentralization era, we are encouraged to increase local autonomy. However, it has been diffi cult to attain that objective because decentralization has also transferred government offi cials from central and provincial government. Thus, most spending has been allocated to fi nance government salaries. Around 80 percent of DAU, the biggest revenue in the local budget, has been allocated for government salaries, while PAD has been very low. In addition, the splitting of Nias has also decreased the potential PAD revenue of Nias district and it has resulted in decreasing expenditures in some sectors.The utilization of local natural resources has been suboptimal, and thus its contribution to local revenue has also been low. DAU allocation from central government has not been transparent and is inconsistent. Up until now, there is still no opportunity for local government to raise revenue from borrowing The APBD is always approved late and this has made it diffi cult to raise PAD.

91Managing Resources to Build Back and Create a Better Future for Nias
Nias Public Expenditure Analysis 2007 ANNEXES
Drs. Nehemia Harefa, MM. (Bappeda Nias district)
“SECTORAL ANALYSIS OF GOVERNMENT EXPENDITURES: PAST AND PRESENT”
General Condition
The utilization of government expenditures in the past was dominated by routine expenditure while the proportion of public expenditures has been very low, although it has increased over times.Local revenue sources have been very limited and most revenue has been from intergovernmental transfers. The complexity of development problems in Nias has blocked the district governments’ eff orts to increase their own local revenues.The tsunami and earthquake have deepened the economic and social problems in Nias.
Problems
Local revenue sources are limited.Revenue sources have not matched the expenditure burden; meaning most district government expenditure is allocated to routine expenditures.The allocation of intergovernmental transfers, through revenue sharing, is not fairly distributed considering Nias’s geographical location and status as one of the backward regions.Lack of equipment to mange local fi nances. The rules or laws on regional fi nance often change without suffi cient time for district governments to implement it optimally.
Sectoral Analysis of government expenditure
2002 Budget
Out of Rp 226 billion of total expenditure, 68.85 percent was allocated for routine expenditure and 31.15 percent was allocated for development expenditure.Out of Rp 155 billion of routine expenditure, 75.3 percent was allocated for personnel expenditure and 24.7 percent for non-personnel expenditure.Out of Rp 70 billion of development expenditure, the largest shares were allocated to the transportation sector (35.41 percent), education sector (14.60 percent), and government offi cial and monitoring sector (9.88 percent).
2003 Budget
Out of Rp 272 billion of total expenditure, 66.47 percent was allocated to routine expenditure and 33.53 percent was allocated to development expenditureOut of Rp 181 billion of routine expenditure, 71.64 percent was allocated for personnel expenditure and 28.36 percent for non-personnel expenditure.Out of Rp 91 billion of development expenditure, large of share was allocated to transportation sector (48.6 percent), education sector (13.83 percent), and regional development sector (13.83 percent).From 2002 to 2003, total expenditure increased by 20.27 percent, while routine expenditure increased by 16.1 percent and development expenditure rose by 29.48 percent.
2004 Budget
Out of Rp 207 billion of total expenditure, personnel expenditure (74.27 percent), public expenditure (25.51 percent), and capital expenditure (0.22 percent)Out of Rp 153 billion of personnel expenditure, 91.36 percent was allocated for general administration expenditure while 7.18 percent was allocated for operational and maintenance expenditure and 1.47 percent for capital expenditure.Out of Rp 52 billion of public expenditure, 2.87 percent was allocated for general administration expenditure while 63.76 percent and ware allocated for operational and maintenance expenditure and 9 percent for capital expenditure. Financial assistance and expenditure sharing accounted for 21.72 percent.

Managing Resources to Build Back and Create a Better Future for Nias
Nias Public Expenditure Analysis 2007
92
ANNEXES
2005 Budget
Out of Rp 224 billion of total expenditure, the expenditures consist of personnel expenditure (70.97 percent), public expenditure (28.89 percent), and capital expenditure (0.14 percent)Out of Rp 159 billion of personnel expenditure, 88.75 percent was allocated for general administration expenditure while 7.76 percent was allocated to operational and maintenance expenditure and 3.49 percent for capital expenditure.Out of Rp 64 billion of public expenditure, 3.07 percent was allocated for general administration expenditure, while 48.76 percent was allocated to operational and maintenance expenditure and 29.74 percent for capital expenditure. Financial assistance and expenditure sharing accounted for 15.18 percent.From 2004 to 2005, total expenditure increased by 8.29 percent, while personnel expenditure, public expenditure, and capital expenditure increased by 3.48 percent, 22.64 percent and 30.52 percent, respectively.
Recommendations
Collective eff ort and commitment is needed to decrease the routine expenditure burden and increase development expenditure.The allocation of public expenditure in some sectors should be changed to be based on needs.In order to attain an eff ective, effi cient and transparent utilization of government expenditure, it is important to involve the participation of all stakeholders in the planning, implementation and evaluation process of government expenditure. Develop a local fi scal policy management system based on information technology.

93Managing Resources to Build Back and Create a Better Future for Nias
Nias Public Expenditure Analysis 2007 REFERENCES
References
Badan Pusat Statistik (BPS) Kabupaten Nias (2006). Nias Dalam Angka 2006. Kabupaten Nias, BPS.Badan Pusat Statistik (BPS) Kabupaten Nias Selatan (2006). Nias Selatan Dalam Angka 2006. Kabupaten Nias, BPS.Badan Pusat Statistik (BPS) Provinsi Sumatra Utara (2004). Sumatra Utara Dalam Angka 2004. Kabupaten Nias, BPS.Badan Pusat Statistik (BPS) (2005). SPAN: Sensus Penduduk Nias dan Nias Selatan 2005. BPS. Badan Pusat Statistik, Bappenas, UNDP (2001). Indonesia Human Development Report. “Towards a new consensus:
Democracy and Human Development in Indonesia.” Jakarta. Indonesia.Badan Pusat Statistik, Bappenas, UNDP (2004). Indonesia Human Development Report. “The Economics of Democracy:
Financing Human Development in Indonesia.” Jakarta. Indonesia.Badan Rehabilitasi dan Rekonstruksi (BRR) NAD-Nias and The World Bank (2005a). “Rebuilding a stronger Nias: Turning
Challenges into Opportunities”. Jakarta, Indonesia.Badan Rehabilitasi dan Rekonstruksi (BRR) NAD-Nias and The World Bank (2005b). “Rebuilding a Better Aceh and Nias:
Stocktaking of the Reconstruction Eff ort.” Jakarta, Indonesia.Badan Rehabilitasi dan Rekonstruksi (BRR) and Partners (2006). “Aceh and Nias: Two Years after the Tsunami.” Jakarta,
Indonesia.Dinas Kesehatan Propinsi Sumatra Utara (2006). Profi l Kesehatan Sumatra Utara. Medan.,Indonesia.Dinas Pendidikan Kabupaten Nias (2005). Laporan Profi l Pendidikan Kabupaten Nias. Nias, Indonesia.Fitrani, Fitria, Bert Hofman and Kai Kaiser (2005). “Unity in Diversity?: The Creation of New Local Governments in a
Decentralizing Indonesia”. Bulletin of Indonesian Economic Studies, Vol.41, No.1, 2005: 57-79, Routledge, Australian National University,Australia.
Hofman, B., Kadjatmiko, Kaiser, K., Suharnoko, B. (2006). „Evaluating Fiscal Equalization in Indonesia“ by Bert Hofman, Kadjatmiko, Kai Kaiser, and Bambang Suharnoko Sjahrir. WB Policy Working Paper WPS 3911. World Bank.
Lewis, Blane (2003). “Property Tax in Indonesia: Measuring and Explaining Administrative (Under-) Performance.” Research Triangle Institute. North Carolina, USA.
Lewis, Blane and Jasmin Chakeri (2004c). “Development Spending in the Regions”. World Bank Jakarta (unpublished document).
Pemerintah Daerah Papua and the World Bank (2005). “Papua Public Expenditure Analysis: Regional Finance and Service Delivery in Indonesia’s Most Remote Region”. Indonesia.
Pemerintah Daerah Kabupaten Nias Selatan (2006). Konsep Naskah Kebijakan Umum APBD TA 2006. Nias Selatan. Indonesia.
Pemerintah Indonesia (2000). Keputusan Menteri Keuangan N0. 556 tahun 2000 tentang Tatacara Penyaluran Dana Alokasi Umum dan Alokasi Khusus.
_________ (2002). Keputusan Menteri Dalam Negeri nomor 29 tahun 2002 tentang Pedoman Pengurusan, Pertanggungjawaban dan Pengawasan Keuangan dan Belanja Daerah, Pelaksanaan Tata Usaha Keuangan Daerah dan Penyusunan Perhitungan Anggaran Pendapatan dan Belanja Daerah.
_________ (2000). Peraturan Pemerintah Republik Indonesia nomor 129 tahun 2000 tentang Persyaratan Pembentukan dan Kriteria Pemekaran, Penghapusan, dan Penggabungan Daerah.
_________ (2001). Peraturan Pemerintah Republik Indonesia No. 39 tahun 2001 tentang Penyelenggaraan Dekonsentrasi.
_________ (2001). Peraturan Pemerintah Republik Indonesia No. 65 tahun 2001 tentang Pajak Daerah._________ (2001). Peraturan Pemerintah Republik Indonesia No. 66 tahun 2001 tentang Retribusi Daerah._________ (2005a). Peraturan Pemerintah Republik Indonesia No. 55 tahun 2005 tentang Dana Perimbangan._________ (2005b). Peraturan Pemerintah Republik Indonesia No. 56 tahun 2005 tentang Sistem Informasi Keuangan
Daerah._________ (2005c). Peraturan Pemerintah Republik Indonesia No. 58 tahun 2005 tentang Pengelolaan Keuangan
Daerah.
_________ (1997). Undang-Undang Republik Indonesia nomor 18 tahun 1997 tentang Pajak Daerah dan Retribusi Daerah.
_________ (1999a). Undang-Undang Republik Indonesia nomor 22 tahun 1999 tentang Pemerintahan Daerah.
_________ (1999b). Undang-Undang Republik Indonesia nomor 25 tahun 1999 tentang Perimbangan Keuangan Antara Pusat dan Daerah.
_________ (2000). Undang-Undang Republik Indonesia No. 34 tahun 2000 tentang Pajak dan Retribusi Daerah.

Managing Resources to Build Back and Create a Better Future for Nias
Nias Public Expenditure Analysis 2007
94
REFERENCES
_________ (2001). Undang-undang Republik Indonesia nomor 19 tahun 2001 tentang Penghapusan, dan Penggabungan Daerah.
_________ (2004). Undang-Undang No. 32 tahun 2004 tentang Pemerintahan Daerah._________ (2004). Undang-Undang No. 33 tahun 2004 tentang Perimbangan Keuangan antara Pemerintah Pusat dan
Pemerintahan Daerah.Sidik, M. (2002). “Perimbangan Keuangan Pusat dan Daerah Sebagai Pelaksanaan Desentralisasi Fiskal”. Seminar Setahun
Implementasi Kebijaksanaan Otonomi Daerah di Indonesia, Yogyakarta 2002.World Bank (2002). “Decentralizing Indonesia”. World Bank Regional Public Expenditure Review Overview Report. World
Bank East Asia and Pacifi c Region, Poverty Reduction and Economic Management Unit.World Bank (2006a). “Making Services Work for the Poor in Indonesia: Focusing on Achieving Results on the Ground”.
East Asia and Pacifi c Region. Jakarta, Indonesia.World Bank (2006b). “Aceh Public Expenditure Analysis: Spending for Reconstruction and Poverty Reduction”.
IndonesiaWorld Bank (2007a). Indonesia Public Expenditure Review. “Spending on Development: Making the Most of Indonesia’s
New Opportunities”. Jakarta, Indonesia.World Bank (2007b). Pengelolaan Keuangan Publik di Aceh. “Mengukur Kinerja Pemerintah Daerah di Aceh”. Jakarta,
IndonesiaWorld Bank and Ministry of Home Aff airs (2005). Indonesia: Local Government Financial Management. A Measurement
Framework. Jakarta, Indonesia.Unesco (2003). “Education Indicators”. Institute for Statistics. Paris.

95Managing Resources to Build Back and Create a Better Future for Nias
Nias Public Expenditure Analysis 2007 REFERENCES