Public Attitudes toward Women as Public Leaders Public Attitudes toward Women as Public Leaders...
33
1 Public Attitudes toward Women as Public Leaders Jackie Filla Department of History, Political Science, and International Studies Chatham University Christopher W. Larimer Department of Political Science University of Northern Iowa August 21, 2011 Corresponding author: Jackie Filla, Ph.D. Assistant Professor Department of History, Political Science, and International Studies Chatham University Woodland Road Pittsburgh, PA 15232-2826 Email: [email protected] *Paper prepared for presentation at the Annual Meeting of the American Political Science Association, Seattle, WA, August 31 – September 4, 2011. Financial support for this project was provided by the Political Science Program of the National Science Foundation (SES 1015406). This research was reviewed and approved by the Institutional Review Boards (IRB) at Chatham University (Pittsburgh, PA) and the University of Northern Iowa (Cedar Falls, IA). Please do not cite without the authors‘ permission. This research was funded by the Pennsylvania Center for Women and Politics at Chatham University in Pittsburgh, PA.
Transcript of Public Attitudes toward Women as Public Leaders Public Attitudes toward Women as Public Leaders...

1
Public Attitudes toward Women as Public Leaders
Jackie Filla
Department of History, Political Science, and International Studies
Chatham University
Christopher W. Larimer
Department of Political Science
University of Northern Iowa
August 21, 2011
Corresponding author:
Jackie Filla, Ph.D.
Assistant Professor
Department of History, Political Science, and International Studies
Chatham University
Woodland Road
Pittsburgh, PA 15232-2826
Email: [email protected]
*Paper prepared for presentation at the Annual Meeting of the American Political Science
Association, Seattle, WA, August 31 – September 4, 2011. Financial support for this project was
provided by the Political Science Program of the National Science Foundation (SES 1015406).
This research was reviewed and approved by the Institutional Review Boards (IRB) at Chatham
University (Pittsburgh, PA) and the University of Northern Iowa (Cedar Falls, IA). Please do not
cite without the authors‘ permission.
This research was funded by the Pennsylvania Center for Women and Politics at Chatham University in
Pittsburgh, PA.

2
Abstract:
There is a tremendous gap in representation between men and women in elected and appointed positions.
The purpose of our paper is to analyze how the public perceives women's roles in government. We ask
how do attitudes toward women impact the adoption of women‘s interest legislation? This research seeks
to enhance our understanding of the public's role in the lack of women in state level positions by asking
questions concerning gender roles in society/government, gender roles in decision-making and how
involved government should be in ensuring female representation on local boards/commissions and city
councils. There is currently very little research concerning attitudes toward women serving in appointed
advisory and decision-making boards; the bulk of the research focuses on women and representation. To
study these relationships we conducted a survey of voters‘ attitudes toward women in government in
Pennsylvania and Iowa. We find significant differences in support for gender equality in governing and
positive attributes in the qualifications and abilities of females in decision-making among male and
female respondents. We also find that respondents in Iowa, which has adopted women‘s interest
legislation, are more supportive of women‘s ability to govern but less supported of a need for government
intervention to ensure women are represented compared to respondents in Pennsylvania, which has no
women‘ interest legislation.
3
Introduction
The underrepresentation of women in elected and other political decision-making positions in the
U.S. has been widely studied by political scientists, psychologists and economists. A renewed interest in
the impact of gender on elections was brought about by the Hillary Clinton and Sarah Palin campaigns in
2008. However, in 2010, according to the Center for American Women and Politics, ―The number of
women in Congress has dropped to 16 percent, and the number of women in state legislatures declined by
nearly 80 seats, the sharpest drop since CAWP began tracking numbers nearly four decades ago‖ (2011).
It is widely accepted that public opinion on gender stereotypes concerning policy positioning and
leadership traits impacts the ability of women to successfully seek public office (Dolan 2010), but there is
little research on how attitudes toward women impact perceptions of a woman‘s ability to serve in a
decision-making or advisory board.
Gender stereotypes are also pervasive in the appointment process for decision-making boards.
Attitudes about how men and women intrinsically differ on policy positions and leadership roles often
relegate female appointees to community service oriented boards, while men serve on business-minded,
economic resource allocation boards. As a result of gender based selection criteria, women also tend to
be underrepresented in state and community level decision-making and advisory boards. While much
attention has been paid to how gender dynamics impact decision-making on appointed boards (Hannagan
and Larimer 2011; Kathlene 1994; Kennedy 2003), little attention has been focused on how public
perceptions of gender stereotypes drive gender biased appointment schemes.
Currently, some states have introduced women‘s interest legislation mandating gender balance for
appointed positions at the state-level and, in one case, within municipalities to remedy the problem of
female underrepresentation. In this paper, we ask: How does the adoption of women‘s interest legislation
affect attitudes toward women severing in government or making decisions about public affairs? We also
speculate on how public opinion on gendered leadership traits and government‘s role in ensuring gender
equality impacts the decision to adopt mandates for gender balance. To answer our question, we surveyed
residents in two states with very different approaches to ensure gender equity. Surveys were sent to

4
randomly selected voters in Iowa, a state that has adopted legislation mandating gender balance at the
state and municipal level, and Pennsylvania, a state that has not adopted such gender mandates. The
purpose of selecting these two states was to test if there are meaningful differences in the opinion and
political culture of state residents that can be attributed to the presence of such legislation.
This study seeks to extend our understanding of the relationship between public opinion and the
adoption of legislation to promote increased women‘s representation in the states in two key ways. First,
we compare public opinion concerning women in government in states with similarly professionalized
state legislatures and similarly poor records on women‘s representation in federal and statewide elected
positions. This allows us to examine attitudes toward the role government should play in promoting
gender equality in settings where competition and outcomes are similarly structured. Second, we examine
gender stereotypes about leadership in settings that have and have not adopted gender balance legislation,
allowing us to account for how the adoption of such legislation might impact political culture. This
research also expands our understanding of how gender stereotypes impact women‘s representation in
decision-making positions beyond elected office.
Our study proceeds as follows. First, we discuss existing literature on how gender stereotypes
impact female representation in elected and appointed political positions. Second, we discuss our
comparative survey and our theoretical framework. Third, we present preliminary findings from survey
respondents in Iowa and Pennsylvania. Finally, we conclude by discussing the implications for gender
representation and the adoption of women‘s interest legislation in a given state based on our findings.
Gender Stereotypes and Women’s Representation
The lack of women‘s representation in elected positions is often considered a paradox, given that
research has shown that female candidates possess the skills and resources needed to win campaigns.
Female candidates are as qualified as their male counterparts (Fulton et al. 2006; Lawless and Fox 2005)
and generally have the ability to fundraise in the same capacity (Burrell 2008). Research has also shown
that female candidates are often more dependent than male candidates on general and partisan recruitment
5
efforts when deciding to run for office (Burrell 2008; Sanbonmatsu 2006; Sanbonmatsu et al. 2009;
(Moncrief, Squire, and Jewell 2001), that there are fewer females willing to run for public office than
there are males (Lawless and Fox 2005), and that institutions play a role in women‘s success at the ballot
box (Lawless and Pearson 2008). Overall, the scholarly record has consistently shown that women do not
suffer from simple gender bias at the polls because male and female candidates tend to win elections at
similar rates (eg. Darcy and Schramm 1977; Burrell 1994; Darcy, Welch and Clark 1994; Seltzer,
Newman, and Leighton 1997; Dolan 2004).
This does not however mean that gender stereotypes do not have important effects on individual
attitudes toward governing and how qualified females are to serve in decision-making positions. Gender
stereotypes may ultimately impact an individual‘s evaluations of candidates and their desire to see gender
equality in decision-making. Welch and Sigelman (1982) contend that, ―public attitudes not only
determine how many female candidates win a general election, but also directly and indirectly how many
are considered and nominated for office‖ (p. 312). Gender stereotypes have been known to directly
impact voting behavior by allowing voters to attribute certain leadership traits, that are both negative and
positive, to candidates based on their gender (Sanbonmatsu 2002; Dolan 2004; Lawless 2004;
Sanbonmatsu and Dolan 2009). In general, experiments and surveys have demonstrated that the public
tends to attribute compassion, family values and liberalism to female candidates (Burrell 1994); and
strength and intelligence to male candidates (Lawless 2004).
Gender stereotypes have also been known to impact the public‘s perception about the policy
strengths of a candidate. A great deal of scholarship has been devoted to the impact of gender differences
on decision-making (e.g., Shapiroand Mahajan 1986; Welch and Hibbing 1992; Brown et al. 1993;
Burrell 1994; Bratton and Haynie 1999; Howell and Day 2000;). In general, women are seen as being
better suited to make decisions on issues related to education, social welfare and families; whereas men
are better suited to make decisions on crime, defense and foreign affairs (Alexander and Anderson 1993;
Burell 1994; Koch 1999; Dolan 2010). Scholars have also pointed to patterns of gender difference in
decision-making among elected officials that may serve as the basis for such stereotypes. Smith (1984)

6
found that women more routinely opposed the use of violence as a policy option than men, and Shapiro
and Mahajan (1986) found that women had greater levels of support for social welfare spending than their
male counterparts. Overall, voters make decisions in elections based on these actual or perceived
differences between males and females when it comes to particular areas of decision-making (Dolan
2010).
Gender is also thought to impact the decision-making process. Scholars contend that male and
female officials have uniquely different behavioral patterns when approaching group decision-making
(Kathlene 1994; Kennedy 2003; Hannagan and Larimer 2010). Research finds that female leadership
styles are more democratic, cooperative and more likely to produce outcomes close to the median group
preference. Male leadership styles, by contrast, favor a more autocratic approach, seeking competitive
individual gains from group decision-making (Eagly and Johnson 1990; Rosenthal 2000; Hannagan and
Larimer 2010). Stereotypes concerning position taking and decision-making style also impact the types
of governing boards men and women are appointed to serve on. Traditionally male dominated boards are
generally related to economic policy, while traditionally female dominated boards are generally related to
recreational policy. The end result of gender stereotypes concerning leadership style and issue
competency is gender imbalance across appointed decision-making and advisory boards at the state and
municipal levels.1
While gender politics scholars have focused on improving women‘s representation in elected
positions (Sanbonmatsu, Carroll, Walsh 2009), some state legislatures have undertaken efforts to enact
women‘s interest legislation to promote increased female representation on appointed boards. Such laws
require that an equal number of men and women serve on decision-making and advisory boards that are
appointed by state and/or municipal officials. The adoption of women‘s interest legislation requiring
gender balance in appointments is not only an important step in advancing women‘s voices in resource
allocation decisions, but prior research has shown that women who begin their political careers in
appointed positions win future elected position at the same rate as men (Darcy, Welch and Clark 1994;
1 For evidence of this imbalance in Iowa, see Hannagan and Larimer (2011).

7
Gertzog 1995). Currently, it is unclear whether the existence of various institutional efforts to encourage
increased women‘s representation is driven by a governmental recognition that gender balance is
important to public decision-making, or public opinion based on positive and negative gender stereotypes.
Previous studies on gender stereotypes have identified important links between pubic opinion and
the underrepresentation of women at all levels of government. The public opinion and gender literature
finds that there are important perceived differences between males and females that may impact
individual level vote decisions. In general, men and women are perceived as having different approaches
to leadership style and are also perceived to vary on issue competency. However, these studies tend to
focus on how perceived gender differences impact elected politics and fail to address how such
stereotypes impact appointed decision-making positions. The adoption of women‘s interest legislation
requiring gender balance would suggest that gender is an important component to governing or advisory
board decision-making. There is currently very little research concerning attitudes toward women serving
in appointed advisory and decision-making boards; this study seeks to fill this gap by analyzing how the
adoption of gender balance legislation (or lack thereof) affects public opinion on gender roles in
government. To study this relationship we conducted a survey of voters‘ attitudes toward women in
government in Pennsylvania and Iowa.
Background: Iowa and Pennsylvania
Iowa and Pennsylvania provide an ideal comparative setting for assessing how public opinion
may impact decision-making in governing advisory boards. Iowa and Pennsylvania share the fact that
they have large and highly professionalized state legislatures. The literature on women‘s representation
has shown us that professionalized legislatures generally yield fewer female representatives, as men tend
to be attracted to state legislative jobs that are full time and high paying, making the field more
competitive (Squire 1992; Arceneaux 2001; Hill 1981; Hogan 2001). According to the Center for
American Women and Politics, Iowa ranks 32nd
in the nation in women‘s representation at the state level,
with 21.3% of the Iowa state legislature being female. Pennsylvania ranks 42nd
, with 17.4% of the

8
Pennsylvania state legislature being female (CAWP 2011). Both states also share the history of having
never elected a female governor. Over the last three respective gubernatorial elections neither state had a
female candidate in the primary or general election. The two states are also similarly poor in women‘s
representation at the national level; currently, in Iowa no women serve in Congress (and never have), and
only one woman in Pennsylvania serves in Congress.
Iowa and Pennsylvania are similar in their poor representation of women at the national and state
level, but they differ in their recognition and willingness to address gaps in women‘s representation
within the state. In 1986, Iowa enacted legislation requiring, ―all appointive boards, commissions,
committees and councils of the state…shall be gender balanced‖(Iowa Code §69.16A). More recently,
Iowa became the first state to apply this at the local level by passing HF243 on May 26, 2009, which
requires localities must make a ―good faith effort‖ to achieve gender balance by the effective policy
implementation date of January 1, 2012. The state of Pennsylvania, by contrast, has taken a more cultural
approach to promoting women‘s participation in state and local politics. In 1974, the Governor created the
Pennsylvania Commission for Women, whose goal is ―to identify and advance the diverse needs and
interests of Pennsylvania women and girls‖; the centerpiece of this program is the Pennsylvania
Conference for Women aimed at teaching leadership and providing networking opportunities for
Pennsylvania women. There is no statewide effort to promote gender balance in appointed positions nor
are municipalities required to seek gender balance in local appointed boards. At the state and municipal
level, gender diversity in appointed positions is encouraged, but not required.
Thus, the two states present interesting cases for comparison given their similarities in poor
women‘s representation and their diverse approaches to promote the increased inclusion of women in
state politics. Iowa has focused on tangible results by requiring gender balance in appointments, while
Pennsylvania has focused more on cultural shifts and the symbolic inclusion of women in state politics.
These differences in policy or lack of policy reflect key attitudinal differences concerning gender and
decision-making; political, work and family cultures; partisan leadership and mobilization efforts; and
institutional biases and decision-making held by state residents and elected officials. Our study seeks to

9
understand how public opinion is impacted by the two states‘ approaches to women‘s representation. We
are interested in assessing how differences in public attitudes toward gender roles in government and the
proper role of government in ensuring gender equality in representation are affected by patterns of
adopting women‘s interest legislation within the state.
Theory and Hypotheses
Taking our cue from Dolan (2010), we theorize that the adoption of women‘s interest legislation
will be determined by public attitudes toward women in politics. These attitudes will be based on gender
stereotypes concerning male and female approaches to leadership style, strength and weaknesses
attributed to male and female decision makers and gender driven position taking. In general, more
positive public evaluations of female competency and qualifications in leadership and issue position
taking will lead to an increased public desire to see more women appointed to public decision-making
boards. More negative public evaluations of females‘ ability and qualifications to lead and reach
satisfactory decisions on important policy matters will contribute to a public interest in maintaining the
status quo of a male dominated decision-making process on appointed boards. Public attitudes will also
impact how much government will intervene in ensuring gender equality in decision-making based on the
public‘s belief that government should play a role in requiring some sense of gender balance in
governing. These assertions about the importance of public opinion concerning gender stereotypes lead us
to make the following three hypotheses concerning women‘s representation in state appointed positions.
Hypothesis 1: Women will be more likely than men to favor gender equality in appointed, elected,
and policy-making government positions; as well as, governmental intervention to ensure gender
equality.
Women will be more likely to subscribe to positive stereotypes concerning their ability to lead
and reach decisions in public settings, while men are more likely to subscribe to negative stereotypes
concerning the inability of women to be strong leaders and reach good decisions on difficult public policy

10
issues. Men may also be more likely to embrace the status quo in political appointments, which is largely
based on traditional gender roles, where males dominate resource allocation policy and women are
involved in more community service efforts. Given that women will be more supportive of increased
female representation, they are also more likely to support government intervention to achieve this goal.
Hypothesis 2: Residents of Iowa will have more positive evaluations of the qualifications and
importance of women serving in government positions than residents of Pennsylvania.
Iowans are less likely to subscribe to negative stereotypes concerning deficiencies in a woman‘s
ability to lead because the state has made women‘s equality in appointed positions a high public priority.
The early adoption of women‘s interest legislation in Iowa signals a political culture that is more
supportive of females holding decision-making positions in government, which will lead to higher
evaluations of a woman‘s qualifications and decision-making capacity to hold leadership positions.
Pennsylvania, by contrast has no such legislation to ensure any level of gender balance within the state‘s
institutions. This could reflect more negative stereotypes concerning women‘s ability to govern held by
Pennsylvanians. Lacking women‘s interest legislation, Pennsylvania residents are also lacking an
important governmental cue that gender equality should be valued in the governing process.
Hypothesis 3: Residents in Iowa will be less likely to express a need for government intervention
to ensure gender equality than residents of Pennsylvania.
Iowa already has gender balance requirements for appointed positions in place at the state level
and has recently required gender balance for municipal level appointments. Given the existence of
legislation ensuring women‘s presence on decision-making boards, Iowans will not see further need for
government intervention in ensuring gender equality. Pennsylvania has no legislation in place to ensure
women‘s representation in state or municipal decision-making boards. Thus, we should expect to see
Pennsylvanians, particularly women, reporting greater support for increased government involvement in
ensuring gender equality because the state currently lacks an institutional foundation for such efforts.

11
Sample
Mail surveys were sent to 750 randomly selected registered voters in the state of Iowa and 750
randomly selected registered voters in the state of Pennsylvania. In each state, the sample was drawn
from the official state voter file. All surveys were mailed the second week of June, 2011. The survey
was designed to examine public attitudes toward women in decision-making bodies and the levels at
which the public supports government mandated gender balance in appointed decision-making bodies.
Recent studies have also used original survey data generated from random state and national samples to
study various impacts of gender stereotypes on women‘s representation (Sanbonmatsu 2002; Lawless
2004; Dolan 2010). This project also seeks to assess how attitudes toward women impact the adoption of
legislation aimed at increasing women‘s‘ presence in government. Our study is unique in that it attempts
to link pubic opinion on issues of gender to the adoption of efforts to increase the presence of women in
appointed decision-making and advisory positions. We chose the states of Iowa and Pennsylvania because
they have similar records on women‘s representation but differ in the adoption of women‘s interest
legislation concerning gender equity.
Prior to random assignment, we removed registered voters who were not registered as Democrat,
Republican, or Independent, voters residing in households with more than three registered voters, voters
over 85 years of age, and voters who did not vote in either 2008 or 2010. Voters were then sorted by a
household identifier and assigned a random number. This list of voters was then randomly sorted and the
first person within each household was selected for inclusion in the study. This ensures that one voter per
household was selected for inclusion in the sample, and that the process of selecting each voter within
each household was random. These voters were then randomly sorted such that the first N were assigned
to receive a survey, and the rest to control (no survey). In Iowa, the voter files are arranged by
congressional district. As such, this randomization process was replicated within each district, the
purpose of which was to select an even number of voters per district, in theory giving us a geographically
balanced sample. For the state of Iowa, this meant randomly selecting 150 registered voters per district.
In Pennsylvania, the voter files were arranged by county. The sample was stratified by county population

12
and twelve counties were randomly selected. The counties surveyed included: Adams, Armstrong,
Crawford, Dauphin, Delaware, Lawrence, Perry Schuylkill, Snyder, Warren, Westmoreland and
Wyoming. Residents were labeled as ―active‖ or ―inactive‖ in the Pennsylvania voter file. The inactive
residents were excluded and a randomly selected respondent pool of approximately 65 voters from each
county was selected following the section process outlined in the Iowa procedure. Each region of
Pennsylvania was represented in the survey by at least one county and 74% of survey questionnaires were
sent to counties with fewer than 200,000 residents.
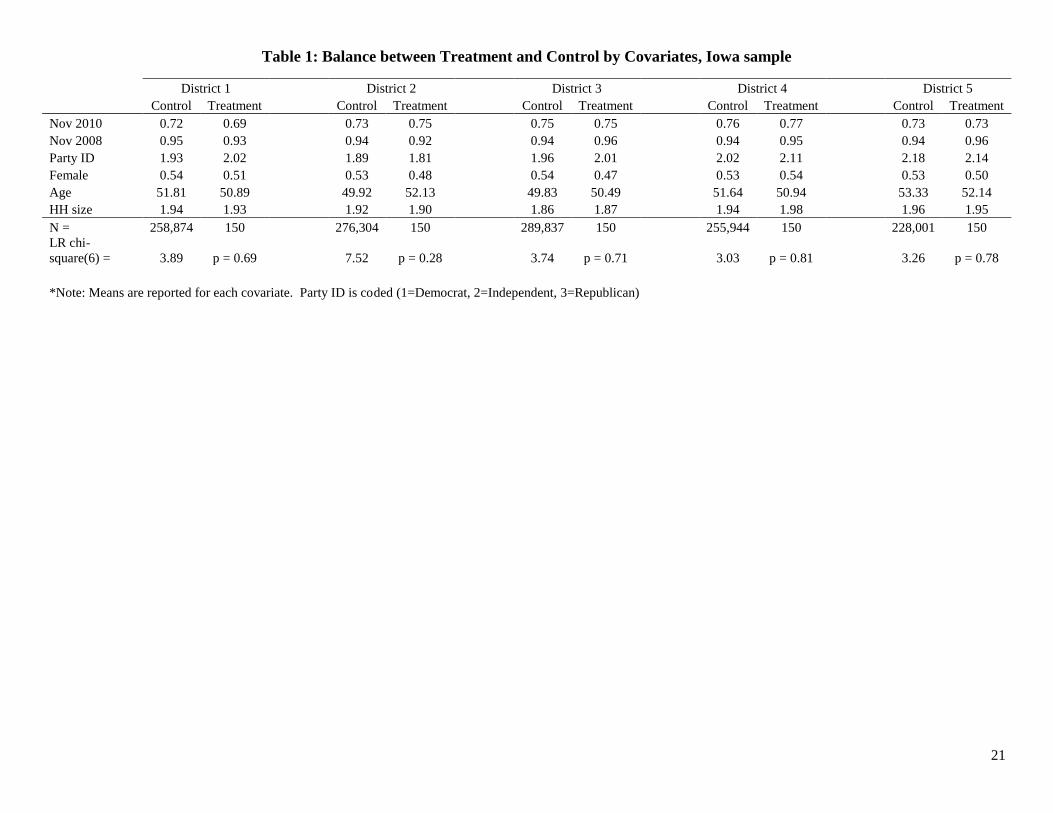
In Table 1 we show sample statistics for the treatment (survey) and control (no survey) groups by
the available covariates for the state of Iowa. The table includes covariates for voting in the November
2010 election, voting in the November 2008 election, political party identification, gender, age, and
household size. Because the randomization took place within congressional districts, the sample statistics
are separated as such. For the state of Iowa, across all congressional districts, there are no significant
differences between those assigned to receive the survey and those assigned to receive no survey at the
.10 level of significance. Table 1 also includes the results from a multinomial logit model for each district
predicting assignment to the treatment group as a function of the covariates listed in the table. The
likelihood ratio test for each district is nonsignificant indicating the groups are balanced across the
observable covariates.
[Insert Table 1 here]
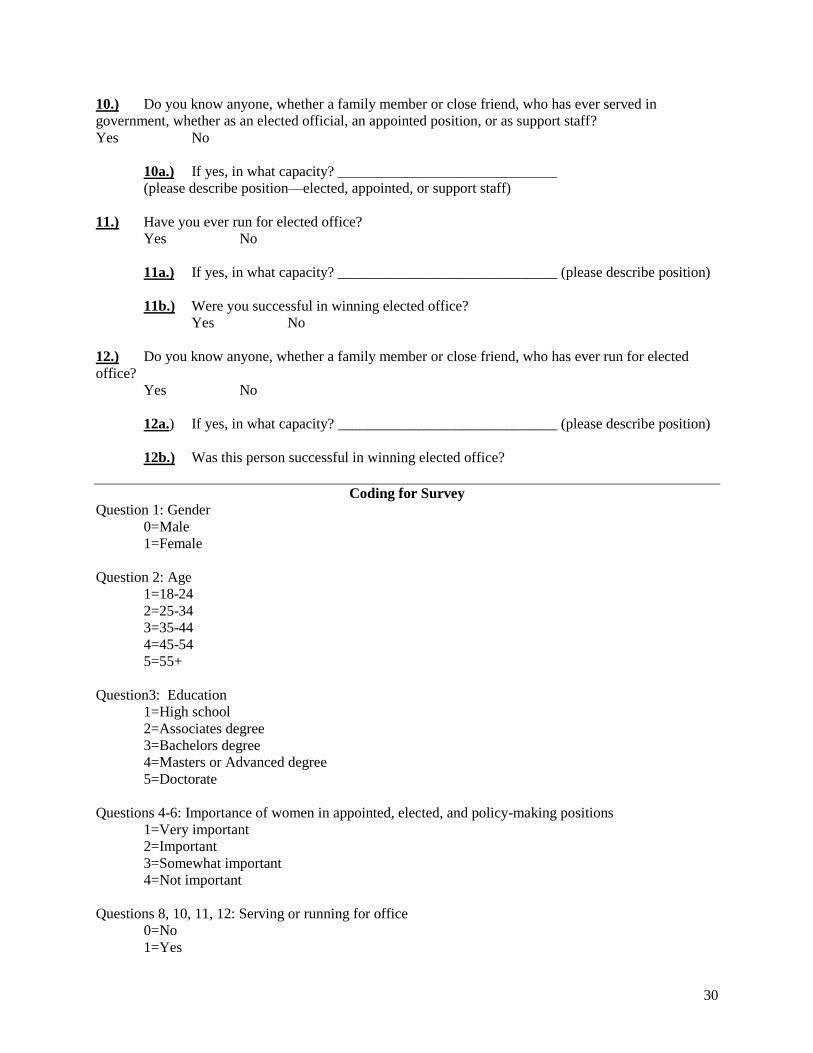
Survey
The purpose of our survey was to test for differences between two states with two very different
approaches to ensuring gender equity in government. The survey, included in full in the Appendix,
attempts to measure respondents‘ attitudes toward women in various positions in government (appointed,
elected, and policymaking positions). The survey also includes response items measuring general beliefs
about whether government should be actively promoting gender equity, items about how men and women
make decisions and whether men and women are equally suited for making public decisions, as well as a

13
final set of items measuring general attitudes toward government. These measures will serve as our key
dependent variables of interest. The survey also includes general demographic information on age,
gender, and education level, as well as several items measuring whether respondents have served in
government or have family members that have served in government, and whether the respondents have
actively sought public office or have family members who have done so. Respondents who have served
in government or know others who have served may be more open to government action on the issue of
gender equity, thus we attempt to control for any differences.
Our hypotheses, as noted earlier, are that we should expect to see differences between male and
female respondents, with female respondents being more in favor of gender equity and an active role for
government in ensuring gender equity, and that we will see differences between respondents from Iowa
and Pennsylvania. Because Iowa has a rich history of promoting gender equity, we believe respondents
from Iowa will be more open to women serving in government or public policymaking positions, but will
be less likely to see a need for more government activity in this area. By contrast, respondents from
Pennsylvania may be less accustomed to women serving in government and therefore less likely to
consider women serving in government positions, but more likely to see a need for active government
involvement in this area.
Results
Table 2 shows the response rates for Iowa (by district) and Pennsylvania (by county). In Iowa,
234 surveys were returned for a response rate of 31.2 percent. Across congressional districts, the
response rate varied from 27 percent to just over 34 percent. The return rate on undeliverable surveys
was approximately 3 percent, or 22 surveys. In Pennsylvania, 100 surveys were returned for a total
response rate of 13.3%. (31 surveys or 3.65% were returned as undeliverable). Response rates across the
counties surveyed varied from 1 percent to 26 percent.
In Table 3 we present sample characteristics for the survey respondents by state. On the available
demographics, respondents from both states were quite similar. There were no statistically significant

14
differences on respondent age, education level, partisan identification (taken from state voter files),
government service (or knowing others in government service), and running for office (or knowing others
who have run for office). Respondents from the Pennsylvania survey however were more female (71.1
percent), on average, than respondents from the Iowa survey (52.6 percent). In subsequent analyses we
control for gender, and the other key demographics, as predictors of attitudes toward women in
government.
[Insert Table 2 here]
[Insert Table 3 here]
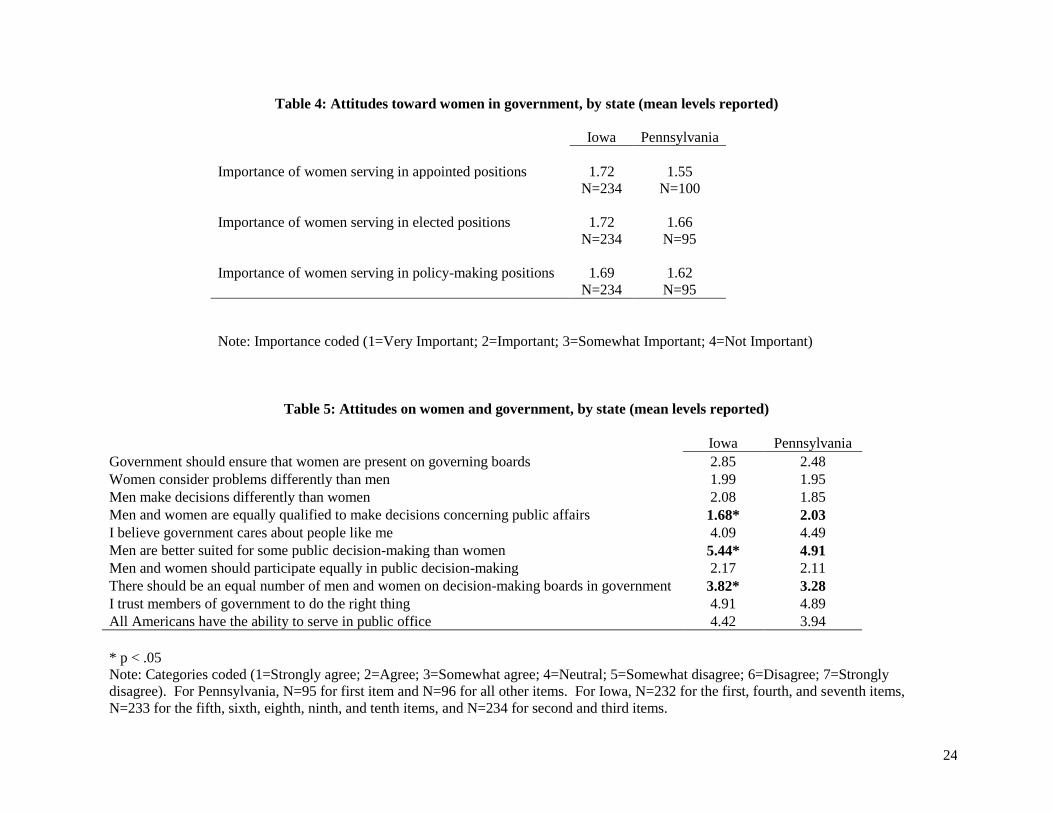
Table 4 presents responses to the three items on the importance of women serving in government
(specifically, appointed, elected, and policymaking positions). Respondents in both states view the issue
of women serving in government in some capacity as an important issue, with little variation between
states on the three statements. Although Iowa respondents rate the issue as slightly less important, the
difference is not statistically significant.
[Insert Table 4 here]
Table 5 compares responses to ten items measuring beliefs about the government‘s role in
ensuring gender equity, beliefs about the differences between the way men and women make decisions,
and more general attitudes toward government. Although there are differences on this latter category
between respondents in Iowa and Pennsylvania, they do not reach the conventional .05 level of
significance. Turning to the seven items measuring differences in beliefs about men and women, and
government‘s role in ensuring gender equity, we do see three significant differences.
First, to the two items measuring the role of the government in ensuring gender equity. In terms
of government doing more to ensure women are equally represented on governing boards, Iowa
respondents have, on average, lower levels of agreement, a difference that approaches conventional levels
of statistical significance (p < .10). On ensuring there are an equal number of men and women on
decision-making boards in government, respondents in Iowa have significantly lower levels of
agreeableness relative to respondents in Pennsylvania (p < .05), thus supporting our third hypothesis

15
noted above. Both items speak directly to established and recently passed legislation in the state of Iowa.
As noted earlier, Iowa was one of the first states to require gender balance on state boards and
commission in 1987, and in 2009, Iowa became the only state to pass such requirements for local boards
and commissions. The lower level of agreeableness for Iowa respondents may reflect citizens‘ general
satisfaction with Iowa government has been doing in this regard, and that there is little need for further
action.
To the two items measuring men‘s and women‘s ability and suitability for serving in government,
Iowa respondents express significantly more favorability toward women‘s ability and qualification for
working in the public sector. Iowa respondents have significantly higher levels of agreement on the issue
of men and women being equally qualified for to make decisions on public affairs (p < .05), and have
significantly lower levels of agreement in response to the item that men are ―better suited‖ for some
public decision-making than women (p < .05). This supports our second hypothesis that Iowa residents
will have more positive gender stereotypes about women‘s governing abilities due to the entrenched
nature of gender equity in the state. We next turn to differences within each state by gender, but return to
the above noted differences later in our linear analysis.
[Insert Table 5 here]
In Table 6 we replicate the results from Table 4, separated by state. As expected (Hypothesis 1),
there are significant differences between males and females in both Iowa and Pennsylvania regarding
attitudes toward women serving in government. Women in both states view women serving in appointed,
elected, and policy-making domains as significantly more important than men. These differences are
particularly noteworthy in the state of Iowa, where differences are highly significant at p < .001.
Comparing male respondents in Iowa to male respondents in Pennsylvania revealed no significant
differences, as did a similar comparison among females.
[Insert Table 6 here]
Table 7 shows the differences between male and female respondents in each state to the ten items
presented in Table 4. While male and female respondents in both states differ in their attitudes about the

16
beliefs of women and government‘s role in ensuring gender equity, there are noteworthy distinctions
between the two states. In seven out of the ten response items, respondents are asked to record their
agreeableness on a statement directly comparing men and women. In Iowa, there are highly significant
differences between male and female respondents on all seven items (p < .01). Female respondents
expressed a significantly higher degree of agreeableness that men and women consider problems and
make decisions differently, that government should do more to ensure gender balance, that men and
women are equally qualified serve on boards, equally qualified to make decisions, and should participate
equally in public decision-making. Female respondents expressed significantly lower levels of agreement
on the question of men being better suited for some public decisions than women. On the other three
items measuring attitudes toward government generally, there are no significant differences between male
and female respondents.
[Insert Table 7 here]
Turning to respondents in Pennsylvania, however, we see a slightly different story. While there
are significant differences between male and female respondents, these differences are not as sharp and
only occur on four out of the seven gender items. In part this is due to the smaller sample of respondents
in Pennsylvania (on item 2 and item 6 the difference is substantially similar to the difference for Iowa
respondents but not statistically significant). However, it is worth noting that there is no statistical
difference, and very little substantive difference, between male and female respondents to the item on
whether men make decisions differently than women.
If the differences shown in Table 7 were to remain with a larger sample, it would suggest
questions about women serving in government are more polarizing for men and women in Iowa than in
Pennsylvania. The sharp contrast between males and females in Iowa on beliefs about men and women as
government decision makers may be due to the active role the government in that state has played in
pushing for gender equity in government. By making gender equity in government a salient policy issue,
the government in Iowa may have raised awareness of possible disparities between men and women
serving government, resulting in women being more attuned to its importance relative to men.
17
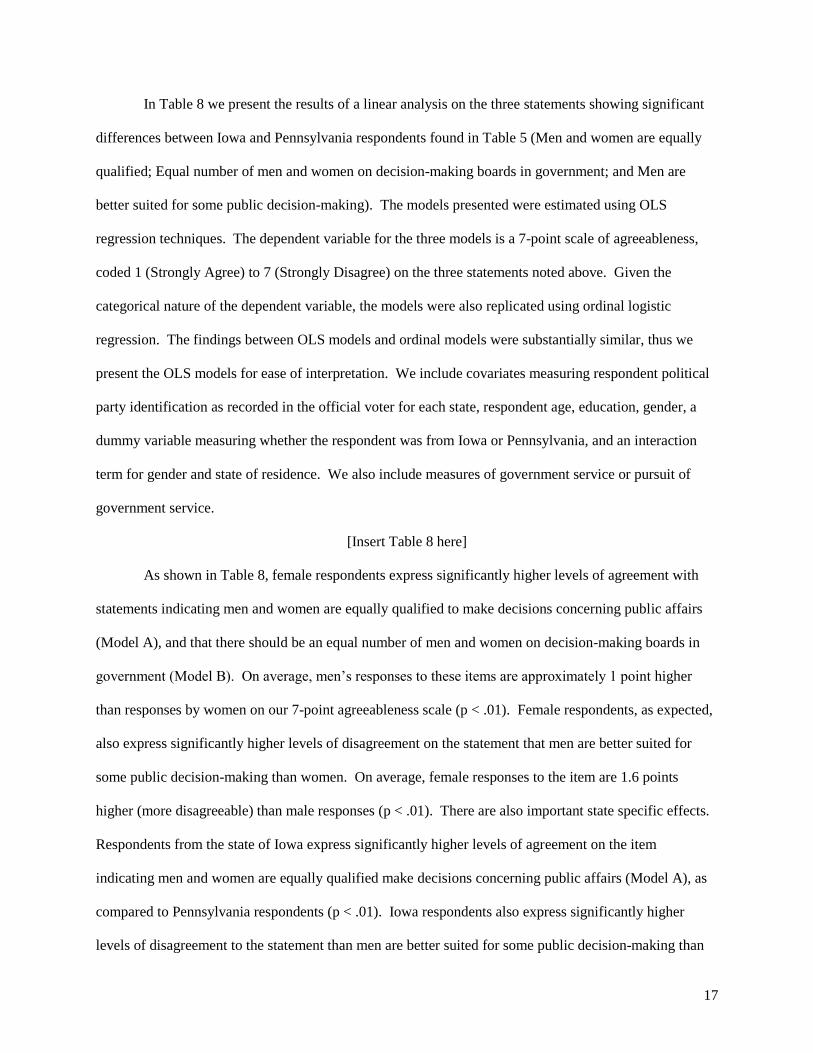
In Table 8 we present the results of a linear analysis on the three statements showing significant
differences between Iowa and Pennsylvania respondents found in Table 5 (Men and women are equally
qualified; Equal number of men and women on decision-making boards in government; and Men are
better suited for some public decision-making). The models presented were estimated using OLS
regression techniques. The dependent variable for the three models is a 7-point scale of agreeableness,
coded 1 (Strongly Agree) to 7 (Strongly Disagree) on the three statements noted above. Given the
categorical nature of the dependent variable, the models were also replicated using ordinal logistic
regression. The findings between OLS models and ordinal models were substantially similar, thus we
present the OLS models for ease of interpretation. We include covariates measuring respondent political
party identification as recorded in the official voter for each state, respondent age, education, gender, a
dummy variable measuring whether the respondent was from Iowa or Pennsylvania, and an interaction
term for gender and state of residence. We also include measures of government service or pursuit of
government service.
[Insert Table 8 here]
As shown in Table 8, female respondents express significantly higher levels of agreement with
statements indicating men and women are equally qualified to make decisions concerning public affairs
(Model A), and that there should be an equal number of men and women on decision-making boards in
government (Model B). On average, men‘s responses to these items are approximately 1 point higher
than responses by women on our 7-point agreeableness scale (p < .01). Female respondents, as expected,
also express significantly higher levels of disagreement on the statement that men are better suited for
some public decision-making than women. On average, female responses to the item are 1.6 points
higher (more disagreeable) than male responses (p < .01). There are also important state specific effects.
Respondents from the state of Iowa express significantly higher levels of agreement on the item
indicating men and women are equally qualified make decisions concerning public affairs (Model A), as
compared to Pennsylvania respondents (p < .01). Iowa respondents also express significantly higher
levels of disagreement to the statement than men are better suited for some public decision-making than

18
women (Model C), responding on average 1.3 points higher (more disagreement) than Pennsylvania
residents (p < .01). We argue this reflective of the active role the government has played in ensuring
gender equity in government, and provides further support for Hypotheses 2 and 3.
Given the significantly higher level of agreement expressed by male respondents in Pennsylvania
to the statement that ―men are better suited for some public decision-making than women‖ (see Table 5),
we also tested for an interaction between respondent gender and respondent state of residence. As shown
in Table 8, this interaction in the linear model was negative and significant, indicating male respondents
from Pennsylvania express significantly higher levels of agreement than their counterparts in Iowa.
Further analysis indicated a main effect for state, F(1,317) = 13.62, p < .01, η2 = .043, a main effect for
gender F(1,317) = 19.31, p < .01, η2 = .060, as well as a significant effect for the interaction between state
residence and gender, F(1,317) = 5.59, p < .05, η2 = .018.
2
There are also important differences regarding education and age of respondents. In Model A,
respondents with more education express significantly higher levels of agreement with the statement that
men and women are equally qualified to make decisions concerning public affairs (p < .05). This
relationship for education, however, is reversed in Model B. More educated respondents thus seem to
believe that while men and women are equally qualified, they do not believe there should necessarily be
an equal number of men and women on decision-making boards in government. We also see that,
perhaps contrary to popular perception, older respondents tend to express significantly higher levels of
agreement with the statement that men and women are equally qualified (Model A; p < .05), and more
disagreement with the statement that men are better suited for some public decision-making than women
(Model B; p < .01).
Finally, although not shown, we also conducted linear analysis of the three items measuring
attitudes on the importance of women serving in government in appointed, elected, or policymaking
positions (see Table 4). Using the same set of covariates as presented in Table 8, OLS and ordinal
2 We also conducted two and three-way interactions models with respondent gender and respondent political party,
and respondent gender, respondent state, and respondent political party. There was no main effect for political party
or the interactions with respondent gender, respondent state, or with both respondent gender and respondent state.

19
logistic regression models for the three statements indicate, as expected, that women view the notion of
women serving in appointed, elected, and policymaking positions as more important than men. This
relationship was consistent and significant across all three models (p < .01), with women‘s ratings
approximately four-tenths of point lower (more important) than men. Age was also a significant
predictor, though less reliably (significance test ranged from p < .05 to p < .10), with older respondents
viewing the issue as more important. We also found a significant relationship with political party
identification. Because this variable is coded as 1=Democrat, 2=No Party, 3=Republican, interpretation
of the results is more difficult. However, we found a consistently significant and positive relationship
between political party and respondents‘ views on the importance of women serving in appointed, elected,
or policymaking positions (p < .01 in all three models). In other words, as political party identification
moves away from Democrat, the issue of women serving in government is viewed as less important.
Conclusion
This study contributes to our understanding of how attitudes toward women impact support for
gender equality in governing positions, but more specifically appointed positions. Based on the results
from our survey, we find support for all three of our main hypotheses. In general, as expected, female
respondents reported higher levels of support for positive evaluations of the ability and desirability of
women serving in government positions than male respondents across both states. Female respondents
also reported higher levels of disagreement with the stereotype that men are ―better suited‖ for public
decision-making than male respondents across both states. Interestingly, in Iowa, female respondents had
considerably more agreement on positive attributes associated with women in government and
considerably more disagreement that men are ―better suited‖ to make decisions than male respondents.
Such differences were not as severe in Pennsylvania.
We also found support for our hypotheses that Iowa and Pennsylvania will have differences in
opinion concerning the role of women in government and the government‘s responsibility in ensuring
gender equality. We found higher levels of positive evaluations of the two genders being equal in ability

20
and qualifications in Iowa, a state requiring gender balance, than in Pennsylvania, a state that lacks gender
balance legislation. We also found slightly more support for increased government involvement to ensure
gender equality in Pennsylvania and less support for increased government intervention to ensure gender
equality on governing boards in Iowa, where gender balance is already required. These findings provide
support for our contention that states that adopt women‘s interest legislation contribute positively toward
public attitudes on gender representation compared to states that do not adopt such legislation. We intend
to expand this project by completing two more waves of surveys in each state, for a total of 4,500 mail
surveys (2,250 in each state). Admittedly, this research would also benefit from a measure of elite
position taking on the necessity of gender equality in appointed positions and the fitness and
qualifications of men and women to make public policy decisions. In sum, this study represents our
initial findings in a larger project concerned with understanding how public attitudes are affected by the
adoption of women‘s interest legislation in the states.
21
Table 1: Balance between Treatment and Control by Covariates, Iowa sample
District 1 District 2 District 3 District 4 District 5
Control Treatment Control Treatment Control Treatment Control Treatment Control Treatment
Nov 2010 0.72 0.69 0.73 0.75 0.75 0.75 0.76 0.77 0.73 0.73
Nov 2008 0.95 0.93 0.94 0.92 0.94 0.96 0.94 0.95 0.94 0.96
Party ID 1.93 2.02 1.89 1.81 1.96 2.01 2.02 2.11 2.18 2.14
Female 0.54 0.51 0.53 0.48 0.54 0.47 0.53 0.54 0.53 0.50
Age 51.81 50.89 49.92 52.13 49.83 50.49 51.64 50.94 53.33 52.14
HH size 1.94 1.93 1.92 1.90 1.86 1.87 1.94 1.98 1.96 1.95
N = 258,874 150 276,304 150 289,837 150 255,944 150 228,001 150
LR chi-
square(6) = 3.89 p = 0.69 7.52 p = 0.28 3.74 p = 0.71 3.03 p = 0.81 3.26 p = 0.78
*Note: Means are reported for each covariate. Party ID is coded (1=Democrat, 2=Independent, 3=Republican)

22
Table 2: Response Rate by District
IOWA sample PENNSYLVANIA sample
Return by district Percent by district
CD 1 41 27.33
CD 2 52 34.67
CD 3 45 30
CD 4 50 33.33
CD 5 44 29.33
Total 232 31.2*
Return rate
Surveys returned
undeliverable 23 3.07
*Note: This percentage includes the additional of two surveys in
which the ID was scratched out thus removing the ability to identify
the district from which it was sent.
*Note: This percentage includes the additional of three surveys in which the ID
was scratched out thus removing the ability to identify the district from which it
was sent.
County
Surveys
Sent
Surveys
Received Response Rate
Adams 65 7 10.77
Armstrong 60 7 11.67
Crawford 60 16 26.67
Dauphin 65 13 20
Delaware 65 1 1.54
Lawrence 65 12 18.46
Perry 60 6 10
Schuylkill 65 9 13.85
Snyder 60 6 10
Warren 60 10 16.67
Westmoreland 65 4 6.13
Wyoming 60 6 10
No County Specified 3
TOTAL 100 13.33*
Return rate
Surveys returned
Undeliverable 31 4.13

23
Table 3: Sample characteristics of respondents, by state (mean levels reported)
Iowa Pennsylvania
Gender (1=Female; 0=Male) 0.53* 0.71
Age 4.13 4.08
Political party identification 2.03 2.16
Highest grade level completed 2.19 2.33
Served in government 0.13 0.16
Family member served in government 0.49 0.44
Run for office 0.07 0.09
Family member run for office 0.50 0.44
* p < .05
Note: Political Party coded (1=Democrat; 2=No Party; 3=Republican)
24
Table 4: Attitudes toward women in government, by state (mean levels reported)
Iowa Pennsylvania
Importance of women serving in appointed positions 1.72 1.55
N=234 N=100
Importance of women serving in elected positions 1.72 1.66
N=234 N=95
Importance of women serving in policy-making positions 1.69 1.62
N=234 N=95
Note: Importance coded (1=Very Important; 2=Important; 3=Somewhat Important; 4=Not Important)
Table 5: Attitudes on women and government, by state (mean levels reported)
Iowa Pennsylvania
Government should ensure that women are present on governing boards 2.85 2.48
Women consider problems differently than men 1.99 1.95
Men make decisions differently than women 2.08 1.85
Men and women are equally qualified to make decisions concerning public affairs 1.68* 2.03
I believe government cares about people like me 4.09 4.49
Men are better suited for some public decision-making than women 5.44* 4.91
Men and women should participate equally in public decision-making 2.17 2.11
There should be an equal number of men and women on decision-making boards in government 3.82* 3.28
I trust members of government to do the right thing 4.91 4.89
All Americans have the ability to serve in public office 4.42 3.94
* p < .05
Note: Categories coded (1=Strongly agree; 2=Agree; 3=Somewhat agree; 4=Neutral; 5=Somewhat disagree; 6=Disagree; 7=Strongly
disagree). For Pennsylvania, N=95 for first item and N=96 for all other items. For Iowa, N=232 for the first, fourth, and seventh items,
N=233 for the fifth, sixth, eighth, ninth, and tenth items, and N=234 for second and third items.

25
Table 6: Attitudes toward women in government (mean levels reported)
IOWA Male Female
Importance of women serving in appointed positions 1.95** 1.50
N=111 N=123
Importance of women serving in elected positions 1.99** 1.48
N=111 N=123
Importance of women serving in policy-making
positions 2.02** 1.39
N=111 N=123
PENNSYLVANIA
Male Female
Importance of women serving in appointed positions 1.83* 1.44
N=29 N=71
Importance of women serving in elected positions 1.93* 1.55
N=29 N=66
Importance of women serving in policy-making
positions 1.93* 1.48
N=29 N=66
** p < .01; * p < .05
Note: Importance coded (1=Very Important; 2=Important; 3=Somewhat Important; 4=Not
Important)

26
Table 7: Attitudes on women and government, (mean levels reported)
IOWA sample
Male Female
Government should ensure that women are present on governing boards 3.30** 2.45
Women consider problems differently than men 2.22** 1.78
Men make decisions differently than women 2.24* 1.93
Men and women are equally qualified to make decisions concerning public affairs 1.87** 1.50
I believe government cares about people like me 4.23 3.98
Men are better suited for some public decision-making than women 5.14** 5.70
Men and women should participate equally in public decision-making 2.52** 1.86
There should be an equal number of men and women on decision-making boards in
government 4.33** 3.34
I trust members of government to do the right thing 5.12 4.73
All Americans have the ability to serve in public office 4.37 4.47
N 111 122 ** p < .01; * p < .05
Note: Categories coded (1=Strongly agree; 2=Agree; 3=Somewhat agree; 4=Neutral; 5=Somewhat disagree; 6=Disagree; 7=Strongly disagree). N for Females
is 121 for the first response item, and 123 for the second and third response items.
PENNSYLVANIA sample
Male Female
Government should ensure that women are present on governing boards 3.25* 2.16
Women consider problems differently than men 2.24 1.82
Men make decisions differently than women 1.97 1.81
Men and women are equally qualified to make decisions concerning public affairs 2.66* 1.76
I believe government cares about people like me 5.10* 4.22
Men are better suited for some public decision-making than women 3.72** 5.42
Men and women should participate equally in public decision-making 2.48 1.96
There should be an equal number of men and women on decision-making boards in
government 3.97* 2.99
I trust members of government to do the right thing 5.17 4.76
All Americans have the ability to serve in public office 4.48* 3.70
N 29 67 ** p < .01; * p < .05
Note: Categories coded (1=Strongly agree; 2=Agree; 3=Somewhat agree; 4=Neutral; 5=Somewhat disagree; 6=Disagree; 7=Strongly disagree). N for
Males is 28 for first response item.

27
Table 8: Linear analysis of attitudes about women’s ability to make public decisions
Model A Model B Model C
Men and women are equally
qualified
Equal number of men and women on decision-
making boards in government
Men are better suited for some public
decision-making
Female -0.818 (0.273)** -1.041 (0.381)** 1.620 (0.369)**
Iowa resident -0.700 (0.258)** 0.416 (0.359) 1.282 (0.347)**
Female*Iowa 0.427 (0.321) 0.031 (0.448) -1.026 (0.434)*
Political Party -0.008 (0.078) 0.236 (0.108)* -0.171 (0.105)
Age -0.130 (0.062)* -0.009 (0.086) 0.260 (0.083)**
Education -0.174 (0.063)** 0.358 (0.087)** 0.065 (0.084)
Served in government -0.200 (0.232) 0.011 (0.323) 0.424 (0.313)
Family member in government 0.191 (0.188) -0.118 (0.260) -0.178 (0.252)
Run for office 0.568 (0.302) -0.118 (0.421) -0.464 (0.407)
Family member run for office -0.220 (0.188) 0.500 (0.260) 0.132 (0.252)
F = 3.781** 6.62** 4.753**
N = 312 313 313
** p < .01; * p < .05
Note: Dependent variables are coded (1=Strongly agree; 2=Agree; 3=Somewhat agree; 4=Neutral; 5=Somewhat disagree; 6=Disagree; 7=Strongly disagree).

28
APPENDIX: SURVEY (IOWA sample)
Hello, #________
This, very brief, survey is intended to gather information about public attitudes toward various aspects of
government. We are gathering opinions on members of the Iowa community for the political science
department at the University of Northern Iowa.
This is a non-partisan and purely academic survey. This research is neither affiliated with nor funded by
any political party, interest group or lobby firm. Your responses will be recorded anomalously; please do
not write your name on any portions of the survey. When you have completed the survey please put it in
the pre-paid return envelope and stick it in the mail. If you have any questions about the survey, please
contact me at (319) 273-6047 or by e-mail at [email protected]. If I am not available when you
call, please leave a message and I will call back. If you have questions about your rights as a participant in
this research project, please contact the University of Northern Iowa Institutional Review Board (IRB)
Human Protections Administrator at (319) 273-6148 or by e-mail at [email protected]. Thank you for your
help. We appreciate your cooperation.
Please circle your response to the following questions:
1.) I am a
Male
Female
2.) I am between the ages of
18-24
25-34
35-44
45-54
55+
3.) The highest educational degree I have earned is
High school diploma
Associates Degree
Bachelors Degree
Masters or Advanced Degree
Doctorate
4.) How important do you think it is that women serve in appointed positions?
Very Important
Important
Somewhat Important
Not Important

29
5.) How important do you think it is that women serve in elected positions?
Very Important
Important
Somewhat Important
Not Important
6.) How important do you think it is that women serve in policy-making positions?
Very Important
Important
Somewhat Important
Not Important
7.) Please rate your responses to the following statements using the scale below:
1. Strongly Agree
2. Agree
3. Somewhat Agree
4. Neutral
5. Somewhat Disagree
6. Disagree
7. Strongly Disagree
Government should ensure that women are present on governing boards. ________
Women consider problems differently than men. ________
Men make decisions differently than women. ________
Men and women are equally qualified to make decisions concerning public affairs. ________
I believe government cares about people like me. ________
Men are better suited for some public decision-making than women. ________
Men and women should participate equally in public decision-making. ________
There should be an equal number of men and women on decision-making boards in government. _______
I trust members of government to do the right thing. ________
All Americans have the ability to serve in public office. ________
8.) Have you ever served in government, whether as an elected official, an appointed position, or as
support staff?
Yes No
8a.) If yes, in what capacity? ______________________________
(please describe position—elected, appointed, or support staff)
9.) If you served in government, what was your experience like? On a scale of 1-7, with 1 being
very positive and 7 being very negative, how would rate your experience?
______________________________
30
10.) Do you know anyone, whether a family member or close friend, who has ever served in
government, whether as an elected official, an appointed position, or as support staff?
Yes No
10a.) If yes, in what capacity? ______________________________
(please describe position—elected, appointed, or support staff)
11.) Have you ever run for elected office?
Yes No
11a.) If yes, in what capacity? ______________________________ (please describe position)
11b.) Were you successful in winning elected office?
Yes No
12.) Do you know anyone, whether a family member or close friend, who has ever run for elected
office?
Yes No
12a.) If yes, in what capacity? ______________________________ (please describe position)
12b.) Was this person successful in winning elected office?
Coding for Survey
Question 1: Gender
0=Male
1=Female
Question 2: Age
1=18-24
2=25-34
3=35-44
4=45-54
5=55+
Question3: Education
1=High school
2=Associates degree
3=Bachelors degree
4=Masters or Advanced degree
5=Doctorate
Questions 4-6: Importance of women in appointed, elected, and policy-making positions
1=Very important
2=Important
3=Somewhat important
4=Not important
Questions 8, 10, 11, 12: Serving or running for office
0=No
1=Yes

31
References
Alexander, D., & Andersen, K. (1993). Gender as a factor in the attribution of leadership
traits. Political Research Quarterly, 46, 527–545.
Arceneaux, K. (2001). The ‗Gender Gap‘ in State Legislative Representation: New Data to
Tackle and Old Question. Political Research Quarterly, 54, 143-160.
Bratton, K. A., & Haynie, K. L. (1999). Agenda Setting and Legislative Success in State
Legislatures: The Effects of Gender and Race. Journal of Politics, 61(3), 658.
Brown-Kruse, J. & Hummels, D. (1993). Gender effects in laboratory public goods
contributions: Do individuals put their money where their mouth is? Journal of Economic
Behavior & Organization, 48, 255-268.
Burrell, B. (1994). A woman’s place is in the House. Ann Arbor: University of Michigan Press.
Burrell, B. (2008). Political parties, fund-raising, and sex. In B. Reingold (Ed.), Legislative
women: Getting elected, getting ahead. Boulder, CO: Lynne Rienner.
CAWP (Center for American Women and Politics). (2011). Women in State Legislatures
20011. Fact sheet. National Information Bank on Women in Public Office. Eagleton Institute of
Politics. Rutgers, NJ: Rutgers University.
Darcy, R. S. & Schramm, S. S. (1977). When women run Against Men. Public Opinion
Quarterly, 41: 1-12.
Darcy, R. S. Welch & J. Clarke. (1994.) Women, Elections, and Representation. Lincoln:
University of Nebraska Press.
Dolan, K. (2004). Voting For Women: How The Public Evaluates Women Candidates
(Dilemmas in American Politics). New York: Westview Press.
Dolan, K. (2010). The Impact of Gender Stereotyped Evaluations on Support for Women
Candidates. Political Behavior, 32(1), 69-88.
Eagly, A., & Johnson, B. (1990). Gender and leadership style: A meta-analysis. Psychological
Bulletin, 108(2), 233–256.
Fulton, S., Maestas, C., Maisel, L. S. & Stone, W. (2006). The sense of a woman: Gender,
ambition, and the decision to run for congress. Political Research Quarterly, 59, 235–248.
Gertzog, I. N. (1995). Congressional Women: Their Recruitment, Integration, and Behavior,
Westport, CT: Greenwood Publishing Group.
Hannagan, R. & Larimer, C. (2010). Does Gender Composition Affect Group Decision
Outcomes? Evidence from a Laboratory Experiment. Political Behavior, 32(1), 51-67.
Hannagan, R. & Larimer, C. (2011). Assessing Gender Dynamics in Local Government. Paper presented
at the New Research on Gender in Political Psychology conference, Rutgers

32
University, Newark, NJ, March 4-5.
Hill, D. B. (1981). ―Political Culture and Female Political Representation.‖ The Journal of
Politics, 43, 159-168.
Hogan, R. E. (2001). The Influences of State and District Conditions on the Representation
of Women in U.S. State Legislatures. American Politics Research, 29, 4-24.
Howell, S. E. & Day, C. L. (2000). Complexities of the gender gap. The Journal of Politics, 62,
858–874.
Kathlene, L. (1994). Power and influence in state legislative policymaking: The interaction
of gender and position in. American Political Science Review, 88(3), 560.
Kennedy, C. (2003). Gender Differences in Committee Decision-Making: Process and
Outputs in an Experimental Setting. Women & Politics, 25(3), 27-45.
Koch, J. (1999). Candidate gender and assessments of senate candidates. Social Science
Quarterly, 80, 84–96.
Lawless, J. (2004). Women, war, and winning elections: Gender stereotyping in the post-
September 11th era. Political Research Quarterly, 57, 479–490.
Lawless, J. & Fox, R. (2005). It takes a candidate: Why women don’t run for office. New York:
Cambridge University Press.
Lawless, J. & Pearson, K. (2008). The primary reason for women‘s underrepresentation?
Reevaluating the conventional wisdom. Journal of Politics, 70, 67–82.
Moncrief, G.F., Squire, P. & Jewell M.E. (2001). Who Runs for the Legislature? Prentice Hall,
Upper Saddle River, N.J.
Rosenthal, C. S. (2000). Gender styles in state legislative committees: Raising their voices in
resolving conflict. Women & Politics, 21, 21–45.
Sanbonmatsu, K. (2002). Gender stereotypes and vote choice. American Journal of Political
Science, 46, 20–34.
Sanbonmatsu, K. (2003). Candidate Recruitment and Women’s Election to the State
Legislatures. Eagleton Institute of Politics. Rutgers, NJ: Rutgers University.
Sanbonmatsu, K. (2006). Where women run: Gender and party in the American states. Ann
Arbor: University of Michigan Press.
Sanbonmatsu, K. & Dolan, K. (2009). Do gender stereotypes transcend party? Political
Research Quarterly, 62, 485-494.
Sanbonmatsu, K., Carroll, S. J. & Walsh, D. (2009). Poised to Run: Women’s Pathways to the
State Legislatures. Eagleton Institute of Politics. Rutgers, NJ: Rutgers University.
Seltzer, R. A., Newman, J. & Leighton, M. V. (1997). Sex as a Political Variable: Women as
33
Candidates and Voters in U.S. Elections. Boulder, CO: Lynne Reinner.
Shapiro, R., & Mahajan, H. (1986). Gender differences in policy preferences: A summary of
trends from the 1960s to the 1980s. Public Opinion Quarterly, 50, 42–61.
Smith, T. W. (1984). The Polls: Gender and Attitudes Toward Violence. Public Opinion
Quarterly, 48: 384-396.
Squire, P. (1992). ―Legislative Professionalization and Membership Diversity in State
Legislatures.‖ Legislative Studies Quarterly 17(1), Feb, 69-79.
Welch, S., & Hibbing, J. R. (1992). Financial conditions, gender, and voting in American
National Elections. The Journal of Politics, 54, 197–213.
Welch, S., & Sigelman, L. (1982). Changes in Public Attitudes Toward Women in Politics.
Social Science Quarterly (University of Texas Press), 63(2), 312-322.