PT Erajaya Swasembada Tbk. IJ... · 5 August PT Erajaya Swasembada Tbk. | 3 2018 Samsung still...
13
PT Erajaya Swasembada Tbk. Extending the Benefits of Digital Age 3 August 2018 We initiate our coverage on PT Erajaya Swasembada Tbk (ERAA) with BUY recommendation and FY19 target price at IDR 4,000. Our TP reflects 26% upside potential which implies FY19F 15.4x PE. Successful flagship product launchings and citizens’ rising love towards Xiaomi pushed ERAA’s earnings to a higher level in 1H18. We believe ERAA should be able to explore tons of advantages in the evolving digital ecosystem through its plenty smartphone releases, ever growing demand on Xiaomi smartphones and its upcoming smart-living products. Supported by wider store penetration both in big and smaller cities and the prior mentioned key catalysts, we expect ERAA to maintain its exceptional performance. Downside risks to our call are: 1) Low enthusiasm on new product launchings, 2) Threat from black market, 3) Weakening purchasing power, and 4) Reducing incentives from banks due to tightening liquidity. Significant improvement on profitability. 1H18 has provided higher benchmark for ERAA’s financial performance expectation. The success of Iphone X, along with other flagship products launched during the period, as well as Xiaomi which turned booming altogether boosted ERAA’s sales. In FY18F, we forecast ERAA’s EPS to grow by 114% at IDR 234, and ROE to double up to 17.9% (vs 9.5% in FY17). Xiaomi’s buzz and expanding capacity. Through its consistency on offering value for money products, completed with attractive specifications, Xiaomi turns to be the brand-new gadget darling worldwide. With vast majority of customers in the mid-to-low end segment, Xiaomi’s market share has gradually increased, reaching up to 18% in 1H18 according to Statcounter. Xiaomi has started to transform perception towards Chinese phone-makers into a better one, which used to receive weak sentiment from users. In order to cope with flooding demand on Xiaomi phones, the phone assembly factory’s capacity (owned by PT Sat Nusapersada Tbk) is going to be expanded to shorten assembly days for Xiaomi products which currently stands at 10 days. This is expected to enable the company to meet the market needs and therefore drives sales higher. More stores are coming. Second and third tier cities are no doubt lucrative market for Erajaya to penetrate given the domination of traditional gadget retailers in those areas. With 250 new stores in the pipeline, ERAA is going to enlarge its market share and further push top- line. As much as IDR 300bn of capex is allocated mostly for Erafone (multi- store format) store openings and a couple of Mi-Stores and Samsung Experience Store. Paulina Equity Analyst +62 21 392 5550 ext. 610 [email protected] BUY (TP: IDR 4,000) Highlights (IDR Bn) 2016 2017 2018F 2019F 2020F Net Revenue 20,547 24,230 31,339 36,720 42,254 % growth 2.7% 17.9% 29.3% 17.2% 15.1% Gross Profit 1,792 2,159 3,025 3,463 3,986 Net Profit 263 339 735 818 964 % growth 16.5% 28.9% 116.5% 11.3% 17.8% Gross Margin (%) 8.7% 8.9% 9.7% 9.4% 9.4% Net Margin (%) 1.3% 1.4% 2.4% 2.2% 2.3% Return on Equity (%) 8.0% 9.5% 17.9% 16.9% 17.3% Return on Assets (%) 3.5% 4.2% 7.3% 6.8% 7.2% EPS 82 109 233 259 304 Stock Information Sector Retail Bloomberg Ticker ERAA IJ Market Cap. (IDR tn) 10.18 Share Out./Float (mn) 3.19 Current Price 3,170 FY19F Target Price 4,000 Upside (%) 26.1% Share Price Performance 52W High (07/30/17) 3,280 52W Low (01/04/18) 690 52W Beta 0.4 YTD Change (%) 2,455 Relative Valuations Trailing P/E 14.6 Forward P/E 12.2 P/BV 2.4 EV/EBITDA 15.2
Transcript of PT Erajaya Swasembada Tbk. IJ... · 5 August PT Erajaya Swasembada Tbk. | 3 2018 Samsung still...

PT Erajaya Swasembada Tbk.
Extending the Benefits of Digital Age
3 August 2018
We initiate our coverage on PT Erajaya Swasembada Tbk (ERAA)
with BUY recommendation and FY19 target price at IDR 4,000. Our
TP reflects 26% upside potential which implies FY19F 15.4x PE. Successful
flagship product launchings and citizens’ rising love towards Xiaomi pushed
ERAA’s earnings to a higher level in 1H18. We believe ERAA should be able
to explore tons of advantages in the evolving digital ecosystem through its
plenty smartphone releases, ever growing demand on Xiaomi smartphones
and its upcoming smart-living products. Supported by wider store
penetration both in big and smaller cities and the prior mentioned key
catalysts, we expect ERAA to maintain its exceptional performance.
Downside risks to our call are: 1) Low enthusiasm on new product
launchings, 2) Threat from black market, 3) Weakening purchasing power,
and 4) Reducing incentives from banks due to tightening liquidity.
Significant improvement on profitability. 1H18 has provided higher
benchmark for ERAA’s financial performance expectation. The success of
Iphone X, along with other flagship products launched during the period,
as well as Xiaomi which turned booming altogether boosted ERAA’s sales.
In FY18F, we forecast ERAA’s EPS to grow by 114% at IDR 234, and ROE
to double up to 17.9% (vs 9.5% in FY17).
Xiaomi’s buzz and expanding capacity. Through its consistency on
offering value for money products, completed with attractive specifications,
Xiaomi turns to be the brand-new gadget darling worldwide. With vast
majority of customers in the mid-to-low end segment, Xiaomi’s market
share has gradually increased, reaching up to 18% in 1H18 according to
Statcounter. Xiaomi has started to transform perception towards Chinese
phone-makers into a better one, which used to receive weak sentiment
from users. In order to cope with flooding demand on Xiaomi phones, the
phone assembly factory’s capacity (owned by PT Sat Nusapersada Tbk) is
going to be expanded to shorten assembly days for Xiaomi products which
currently stands at 10 days. This is expected to enable the company to
meet the market needs and therefore drives sales higher.
More stores are coming. Second and third tier cities are no doubt
lucrative market for Erajaya to penetrate given the domination of
traditional gadget retailers in those areas. With 250 new stores in the
pipeline, ERAA is going to enlarge its market share and further push top-
line. As much as IDR 300bn of capex is allocated mostly for Erafone (multi-
store format) store openings and a couple of Mi-Stores and Samsung
Experience Store.
Paulina Equity Analyst +62 21 392 5550 ext. 610 [email protected]
BUY (TP: IDR 4,000)
Highlights (IDR Bn) 2016 2017 2018F 2019F 2020F
Net Revenue 20,547 24,230 31,339 36,720 42,254
% growth 2.7% 17.9% 29.3% 17.2% 15.1%
Gross Profit 1,792 2,159 3,025 3,463 3,986
Net Profit 263 339 735 818 964
% growth 16.5% 28.9% 116.5% 11.3% 17.8%
Gross Margin (%) 8.7% 8.9% 9.7% 9.4% 9.4%
Net Margin (%) 1.3% 1.4% 2.4% 2.2% 2.3%
Return on Equity (%) 8.0% 9.5% 17.9% 16.9% 17.3%
Return on Assets (%) 3.5% 4.2% 7.3% 6.8% 7.2%
EPS 82 109 233 259 304
Stock Information
Sector Retail
Bloomberg Ticker ERAA IJ
Market Cap. (IDR tn) 10.18
Share Out./Float (mn) 3.19
Current Price 3,170
FY19F Target Price 4,000
Upside (%) 26.1%
Share Price Performance
52W High (07/30/17) 3,280
52W Low (01/04/18) 690
52W Beta 0.4
YTD Change (%) 2,455
Relative Valuations
Trailing P/E 14.6
Forward P/E 12.2
P/BV 2.4
EV/EBITDA 15.2

2 PT Erajaya Swasembada Tbk. | 3 August 2018
Erajaya at a Glance
Largest modern gadget retailer. Firstly established in 1996, Erajaya
currently holds 35% of market share and stands as the leading retailer of
mobile communication device, IoT products, gadgets, accessories, as well
as value added services in the region. It owns 787 retail outlets, 84
distribution centers and collaborates with approximately 53k third party
outlets and service points spread nationwide. The company distributes
renowned phone brands such as Samsung, Apple (exclusive right),
Motorola, Nokia, Sony and rising star Xiaomi (exclusive right), along with
other Chinese brands such as Oppo, Huawei, Vivo, and etc. Erajaya also
engages in voucher distribution which contributes to a small percentage of
company's revenue.
Various store format. Erafone is a multi-brand store format which
dominates outlets operated under Erajaya. Besides, ERAA also manages
several mono-brand stores: Samsung Experience Store, iBox, Mi-Store. In
2016, the company introduced its new retail outlet, Urban Republic, which
presents gadget lifestyle product including accessories. To diversify its
distribution channel, Erajaya developed Erafone.com, an e-commerce
based gadget distributor. In addition to domestic market, Erajaya expands
its wing to neighborhood countries: Singapore and Malaysia by mostly
operating Switch (Apple reseller), Samsung and Mi-Stores.
The more the merrier. Management observes that people’s appetite to
shop for gadgets usually peaks during three momentums: 1) Holiday, 2)
New product launch, and 3) Event/exhibition. Therefore, the company
frequently conducts several events such as Erajaya expo, Erafone fair,
Gadget Invasion Week, Technopolis, usually taking place at shopping malls
in order to snap attention for both gadget geeks or those using phone for
daily needs.
Erajaya Map of Operations
Source: Company data, Sinarmas Investment Research
Erajaya Distribution Business
Source: Company data, Sinarmas Investment Research
Mobile Operator
Products & ContentsLifestyle Accessories
Alcatel Motorola Indosat Ooredoo Accessories
Apple Nokia Telkomsel Internet of Things (IoT)
Asus Oppo XL Axiata
Blackberry Samsung
Huawei Sony
Lenovo Smartfren
LG Xiaomi
Luna Oppo
Mobile Communication User
ERAA Number of stores
Source: Company data, Sinarmas Investment Research
457489
556
700
775
98 80 89 76 84
0
100
200
300
400
500
600
700
800
900
FY2013 FY2014 FY2015 FY2016 FY2017
Retail Stores Distribution Centers

3 PT Erajaya Swasembada Tbk. | 3 August 2018
iBoxing Week
Source: Company data, Sinarmas Investment Research
Galaxy S9/S9+ Launch
Source: Company data, Sinarmas Investment Research
Erafone Expo
Source: Company data, Sinarmas Investment Research
Mi Store Grand Opening
Source: Company data, Sinarmas Investment Research
4 PT Erajaya Swasembada Tbk. | 3 August 2018
Industry Overview
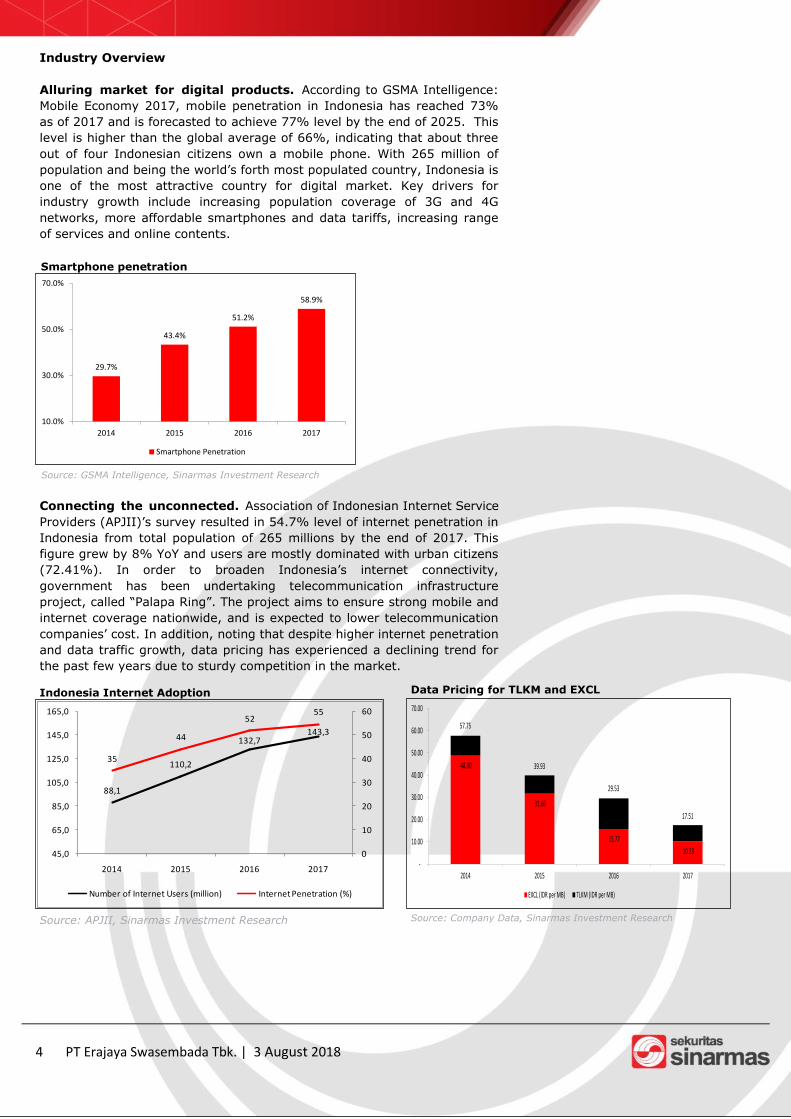
Alluring market for digital products. According to GSMA Intelligence:
Mobile Economy 2017, mobile penetration in Indonesia has reached 73%
as of 2017 and is forecasted to achieve 77% level by the end of 2025. This
level is higher than the global average of 66%, indicating that about three
out of four Indonesian citizens own a mobile phone. With 265 million of
population and being the world’s forth most populated country, Indonesia is
one of the most attractive country for digital market. Key drivers for
industry growth include increasing population coverage of 3G and 4G
networks, more affordable smartphones and data tariffs, increasing range
of services and online contents.
Connecting the unconnected. Association of Indonesian Internet Service
Providers (APJII)’s survey resulted in 54.7% level of internet penetration in
Indonesia from total population of 265 millions by the end of 2017. This
figure grew by 8% YoY and users are mostly dominated with urban citizens
(72.41%). In order to broaden Indonesia’s internet connectivity,
government has been undertaking telecommunication infrastructure
project, called “Palapa Ring”. The project aims to ensure strong mobile and
internet coverage nationwide, and is expected to lower telecommunication
companies’ cost. In addition, noting that despite higher internet penetration
and data traffic growth, data pricing has experienced a declining trend for
the past few years due to sturdy competition in the market.
Indonesia Internet Adoption
Source: APJII, Sinarmas Investment Research
88,1
110,2
132,7143,3
35
44
5255
0
10
20
30
40
50
60
45,0
65,0
85,0
105,0
125,0
145,0
165,0
2014 2015 2016 2017
Number of Internet Users (million) Internet Penetration (%)
29.7%
43.4%
51.2%
58.9%
10.0%
30.0%
50.0%
70.0%
2014 2015 2016 2017
Smartphone Penetration
Smartphone penetration
Source: GSMA Intelligence, Sinarmas Investment Research
48.80
31.66
15.77
10.23
57.75
39.93
29.53
17.51
-
10.00
20.00
30.00
40.00
50.00
60.00
70.00
2014 2015 2016 2017
EXCL (IDR per MB) TLKM (IDR per MB)
Data Pricing for TLKM and EXCL
Source: Company Data, Sinarmas Investment Research

5 PT Erajaya Swasembada Tbk. | 3 August 2018
Samsung still reigns, while Chinese brands stealing market share.
Statcounter data released showed that as per 1H18, Samsung lingers at
the top of the industry, with market share in Indonesia stood at 27.3%,
declined from 30.4% level in the same period last year. Xiaomi and Oppo,
on the other hand, have gradually gained their share within the
smartphone industry. Xiaomi currently possesses 18.5% of share (vs 11%
in 1H17), while Oppo owns 13.4% of market share (vs 10.5% in 1H17).
This we believe is due to appealing specifications offered at affordable
prices carried by the Chinese phones.
Protecting domestic industry and fighting black market products. To
defend Indonesian cell phone manufacturers from abundant import strikes,
and to encourage economic growth, Indonesia government has applied
Level of Domestic Components (TKDN) regulation for 4G phones since
2015. The rule requires 4G phone manufacturer to show that 30% of
components were assembled in Indonesia. This includes hardware
components, as well as software and labor. In addition to that, by the goal
of diminishing illegal products circulation, Ministry of Industry has further
developed Device Identification, Registration, and Blocking System (DIRBS)
to detect phones through verifying the products validity of the International
Mobile Equipment Identity (IMEI) database.
Mobile Vendor Market Share Indonesia
Source: Statcounter, Sinarmas Investment Research
30%29%
30%
27%
11%
15% 16%
18%
11% 12% 12%13%
7%6% 5% 5%
4% 4% 3%
0%
5%
10%
15%
20%
25%
30%
35%
6M17 FY17 3M18 6M18
Samsung
Xiaomi
Oppo
Asus
Apple

6 PT Erajaya Swasembada Tbk. | 3 August 2018
Investment Thesis
Strong 1H18 readings and keys behind it. ERAA’s share price has
rallied after the release of its 1Q18 result which surpassed market
expectation. Net sales jumped by 60.3% YoY, while bottom-line recorded
an almost three-fold increase. Margins were also seen expanding, both in
gross and net margin level. Those figures were claimed to be supported by
carryover from two flagships launched in the end of 2017 (Iphone X and
Samsung S9) and rising hype of Xiaomi new products launched (Xiaomi
Redmi 5 series) within the period. Iphone X was a hit and awarded as one
of the best-selling high-end phone last year by Kantar Worldpanel. This
time, Erajaya successfully shortened the gap between global launching and
domestic one for Apple smartphones which used to be more than six
months long into a month period only. Should this maintained by the
company, we believe ERAA should be able to better catch next Apple series
launching momentum, which will to translate into solid forthcoming
performance. ERAA reached another milestone by carrying on the
remarkable performance up to second quarter, where revenue rose by 6%
on a QoQ basis and net profit increased by 12% QoQ. During the quarter,
various mid-end smartphones from Asus, Oppo, Samsung and Xiaomi were
launched and most of them were well-received by the market.
We see six catalysts which will keep up ERAA attractiveness after
the notable results:
The Xiaomi play. Amidst intense competition within middle-to-low
smartphone market, Xiaomi managed to place as one of the most-wanted
gadget in town by promoting its value for money products. Xiaomi products
have been tapping into Indonesia for few years, but the brand really gained
massive attention starting from last year. The boom is triggered by
Xiaomi’s growing product variants, sold in very competitive pricing, offering
reliable quality, serving broad target market, and capturing diverse needs.
Various surveys noted that the brand has been gradually gaining market
share in the cell phone industry. At this moment, Xiaomi officially
collaborates with two giant online shopping platforms in Indonesia (Lazada
and Shopee) to distribute its products. We observe the majority of flash
sale events conducted by the marketplaces successfully resulted in sold
out. To add, long queue of people were seen lining-up to get the first hand
on Xiaomi’s brand new products launched at Mi-stores in several locations.
These portray immense demand either in domestic market towards this
Chinese gadget-maker brand.
Road to 1000 stores. ERAA prepares IDR 300bn of capex and aims to
open 250 new stores until the end of 2018. The company targets to expand
Redmi 5A Prime Flash Sale at Shopee
Source: Droidlime, Sinarmas Investment Research
Redmi 5 Series Flash Sale at Lazada
Source: Droidlime, Sinarmas Investment Research

7 PT Erajaya Swasembada Tbk. | 3 August 2018
its presence in second and third tier cities and seeks to grab market share
from mom and pop stores who mostly dominate those areas. The progress
has reached 90 new stores as of 1H18. Majority of new stores are going to
be ERAA’s multi-brand format: Erafone, with several Mi-stores and
Samsung Experience Store to complement the expansion. Erajaya chose to
finance the robust expansion through private placement which took place in
the 1Q18 period, raising IDR 305bn entirely allocated for capex.
Management also took a new IDR 1.5tn short-term loan facility to support
the plan.
Contending with e-commerce influence. Not only stepping up its brick
and mortar business, but ERAA also seeks to develop its omni-channel
retailing through activating O2O (Online to Offline) services. Through this
initiative, customers would be able to purchase products online and have it
sent to the designated place, and vice versa. The synergy between offline
and online is believed to make it easier for customers to shop as well as to
acquire more engagement from millennial generation. Erajaya also supplies
smartphones sold in official e-commerce platform and specially partners
with Lazada and Shopee for Xiaomi distribution.
Enlarging assembly plant capacity. As exclusive partner of Xiaomi in
Indonesia, ERAA only imports the brand’s spare parts from China. It then
takes the materials to a plant operated by PT Sat Nusapersada Tbk.
(PTSN) for assembling Xiaomi products to comply with TKDN. In order to
cope with flooding demand on Xiaomi phones, the phone assembly factory’s
capacity is going to be expanded to shorten assembly days for Xiaomi
products which currently stands at 10 days. This is expected to enable the
company to meet the market needs, thus helping to draw sales higher.
Partnership with ride-sharing and telco providers. Ride-sharing has
gained extensive popularity in Indonesia these past few years, ERAA thus
reached out online service companies (Grab and Gojek) to provide their
drivers with smartphones. In addition, the company also engages with big
telco players (Telkomsel and XL Axiata) to present bundling program with
assorted attractive promotion within every new product purchase.
Customers are offered free smartphone by purchasing a certain data
package for a one-year period. These deals should help support ERAA’s
sales in addition to its internal marketing activities.
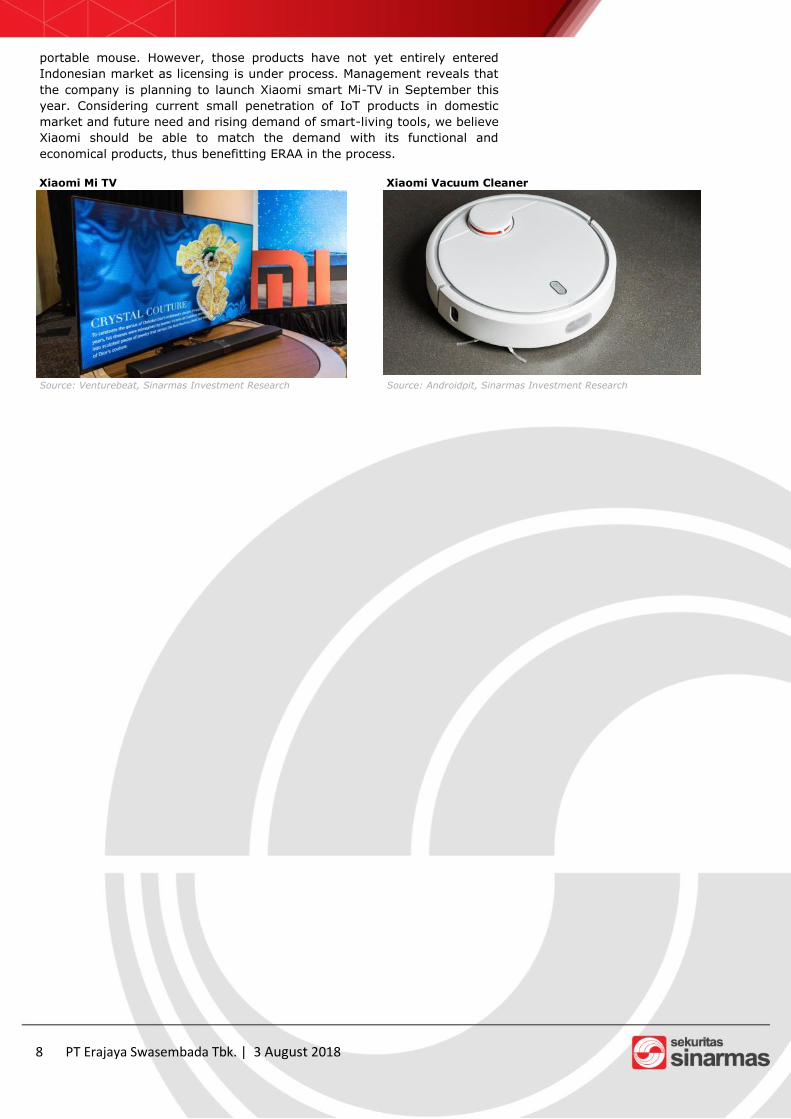
Entering smart-living era. With Internet of Things (IoT) receiving
tremendous interest and developing rapidly, Xiaomi taps into the market
with a number of smart home kit. Varying from home utilities such as
purifier, TV, home camera, robot vacuum, smart scale, rice cooker, bag, to
electronic devices such as watch, Bluetooth speaker, power bank, and
Erafone collaboration program with Grab
Source: Droidlime, Sinarmas Investment Research
Erafone collaboration program with XL Prioritas
Source: Erafone, Sinarmas Investment Research
8 PT Erajaya Swasembada Tbk. | 3 August 2018
portable mouse. However, those products have not yet entirely entered
Indonesian market as licensing is under process. Management reveals that
the company is planning to launch Xiaomi smart Mi-TV in September this
year. Considering current small penetration of IoT products in domestic
market and future need and rising demand of smart-living tools, we believe
Xiaomi should be able to match the demand with its functional and
economical products, thus benefitting ERAA in the process.
Xiaomi Mi TV
Source: Venturebeat, Sinarmas Investment Research
Xiaomi Vacuum Cleaner
Source: Androidpit, Sinarmas Investment Research

9 PT Erajaya Swasembada Tbk. | 3 August 2018
Financial Outlook
1H18 performance review. ERAA’s revenue growth is very much related
to the successful new products launched during the period. In 1Q18, ERAA
recorded IDR 8.3tn revenue (+60.3% YoY), reaching 26.5% of our
estimate. Gross margin was at 10% (vs 9.3% in 1Q17), while net margin
was at 2.5% (vs 1.2% in 1Q17). Bottom-line arrived at IDR 205bn (+236%
YoY), fulfilling 30.7% of our forecast. Cellular phones and tablets contribute
to around 80% of company’s revenue. During five years backwards, ERAA
mobile handsets’ ASP has increased by 7.83% CAGR, while volume growth
fluctuate. By the end of 2019, we forecast ERAA to achieve IDR 36.7tn of
sales (+17.2% YoY) and IDR 770bn of net income (+15.2%). Continuing
the impressive outcome in 2nd quarter alone, top-line came at IDR 8.8tn
(+6% QoQ; +50% YoY) and bottom-line was booked at IDR 230bn (+12%
QoQ; +252% YoY). Gross margin was at 9.8%, while +40bps margin
improvement was seen at EBIT level (4.4% in 2Q18 vs 4% in 1Q18).
Future revenue drivers. This year around, we forecast a solid growth for
Erajaya’s top-line driven by: 1) Rising demand on flagships product, 2)
Frequent popular product launchings from mid-end smartphones, and 3)
Robust store expansion. Going forward, we regard the entry of IoT
products and wider usage of IoT applications in daily life, various innovative
handset releases, and extensive store penetration in second-third tier cities
to be the tailwinds for sales to come.
Inventories hike to comply with TKDN. Inventories were seen
increasing significantly in 2017 and the trend continued to 1Q18, as
contributed by spike in spareparts which turned to be IDR 1.4tn in 1Q18
(vs IDR 291bn in 1Q17). In order to comply with TKDN, ERAA partners with
PT Sat Nusapersada Tbk. since 2017 to assemble Xiaomi smartphones
released in Indonesia which requires ERAA to import parts to be
assembled. We believe that the pick-up in inventory numbers indicates
ERAA to anticipate favorable years ahead, as the company prepares to step
-up production.
ERAA Revenue, Gross Margin, Net Margin
Source: Sinarmas Investment Research
ERAA Inventories figure
Source: Sinarmas Investment Research
ERAA revenue contribution
Source: Sinarmas Investment Research
Cellular phones and tablet
Electronic vouchers
Starter packs
Computer and other electronic devices
Accessories
Others
0%
2%
4%
6%
8%
10%
12%
0
5.000
10.000
15.000
20.000
25.000
30.000
35.000
40.000
45.000
FY2016 FY2017 2018F 2019F 2020F
Revenue (IDR bn) Gross Margin Net Margin
0
1.000
2.000
3.000
4.000
5.000
6.000
2018F FY2016 1H18
Inventories Spareparts

10 PT Erajaya Swasembada Tbk. | 3 August 2018
Capital financing for expansion. For the purpose of expansion, ERAA
has received IDR 305bn additional capital after conducting rights issue of
290mn new shares. Company also earned lending facility worth IDr 1.5tn
from BCA. This is needed to support company’s working capital and
expansion purpose. Amidst rising interest rate environment, we believe
ERAA still has the solvency supported by its favorable earnings growth.
ASP and volume growth. ERAA’s average selling price has been moving
at 7% CAGR over the past three years, whereas volume growth fluctuated.
Serving very broad range customers profile, ERAA has been steadily raising
product prices in the last few years. Industry-wise, GSMA estimated
blended ASP for smartphones tends to be in a downtrend as phones
become more affordable. Therefore, we forecast ASP growth to be lower at
5% in the next couple of years and volume hike to be the main driver for
revenue numbers. We believe sales volume would grow supported by
ample room for smartphone adoption development (given current 60%
level), flooding variants of mid-end products, higher affordability for
smartphone, and wider Erajaya coverage in large and small cities.
Valued at 20% discount to retail players. We initiate coverage on PT
Erajaya Swasembada Tbk (ERAA) with BUY recommendation with target
price of IDR 4,000. Currently trading at FY19F 14.6x PE, our multiples
target is set at 15.4x PE. We think ERAA deserves to be priced at 20%
below average multiples of retail players within our coverage (ACES, LPPF,
MAPI, RALS). Our target is justified on the back of 1) Significant raise on
profitability, 2) Xiaomi popularity and the increasing capacity of Xiaomi
assembly plants, and 3) Robust store openings.
ERAA Interest Coverage
Source: Sinarmas Investment Research
ERAA Inventory Days, Payable Days, Cash Conversion Cycle
Source: Sinarmas Investment Research
0,27 0,47 0,49 0,42 0,38
3,45
4,20
5,54 5,75 6,37
-
1,00
2,00
3,00
4,00
5,00
6,00
7,00
FY2016 FY2017 2018F 2019F 2020F
Debt to Equity Ratio Interest Coverage
0
5
10
15
20
25
30
35
40
45
50
FY2016 FY2017 2018F 2019F 2020F
Inventory Days Payable Days Cash Conversion Cycle
ERAA ASP and Sales Volume
Source: Sinarmas Investment Research
ERAA Profitability
Source: Sinarmas Investment Research
8%10%
18%17% 17%
3%4%
7% 7% 7%
0%
2%
4%
6%
8%
10%
12%
14%
16%
18%
20%
FY2016 FY2017 2018F 2019F 2020F
ROE ROA
0,0
0,2
0,4
0,6
0,8
1,0
1,2
1,4
1,6
1,8
2,0
0,0
5,0
10,0
15,0
20,0
25,0
FY2016 FY2017 2018F 2019F 2020F
Sales Volume (mn pcs) Average Selling Price (IDR mn)

11 PT Erajaya Swasembada Tbk. | 3 August 2018
Balance Sheet (IDR Bn) 2016 2017 2018F 2019F 2020F
Cash and Cash Equivalent 615 366 1,052 897 1,029
Trade Receivables 1,442 1,571 2,335 2,736 3,148
Inventories 2,203 3,388 3,932 4,607 5,301
Other Current Assets 909 1,359 1,328 1,556 1,790
Total Current Assets 5,168 6,685 8,646 9,795 11,268
Fixed Assets 457 486 685 698 642
Other Non Current Assets 1,799 1,703 1,949 2,139 2,334
Total Assets 7,425 8,874 11,279 12,632 14,244
Trade Payables 2,614 2,619 3,775 4,423 5,089
ST Bank Loans 801 1,747 2,207 2,124 2,162
Other Current Liabilities 520 682 663 777 894
Total Current Liabilities 3,935 5,049 6,645 7,323 8,145
Other Non Current Liabilities 80 119 114 133 153
Total Liabilities 4,015 5,167 6,759 7,456 8,298
Share & APIC 1,884 1,884 2,189 2,189 2,189
Retained Earnings 1,463 1,744 2,333 2,987 3,758
Non Controlling Interest 61 79 79 79 79
Other Components of Equity 2 -1 -1 -1 -1
Total Equity 3,409 3,707 4,521 5,175 5,946
Total Equity & Liabilities 7,425 8,874 11,279 12,632 14,244
Income Statement (IDR Bn) 2016 2017 2018F 2019F 2020F
Revenue 20,547 24,230 31,339 36,720 42,254
Cost of Revenue 18,755 22,071 28,314 33,257 38,268
Gross Profit 1,792 2,159 3,025 3,463 3,986
% growth 19.0% 20.5% 40.1% 14.5% 15.1%
Operating Expenses 1,309 1,636 1,952 2,287 2,632
Opex to Sales (%) 6.4% 6.8% 6.2% 6.2% 6.2%
EBITDA 594 673 1,263 1,398 1,610
% growth 13.1% 13.4% 87.7% 10.7% 15.2%
EBT 383 480 1,004 1,116 1,313
% growth 19.6% 25.2% 109.3% 11.2% 17.6%
Tax -122 -133 -261 -290 -341
Non Controlling Interest -2 8 8 8 8
Net Profit for the Year 263 339 735 818 964
% growth 16.5% 28.9% 116.5% 11.3% 17.8%
12 PT Erajaya Swasembada Tbk. | 3 August 2018
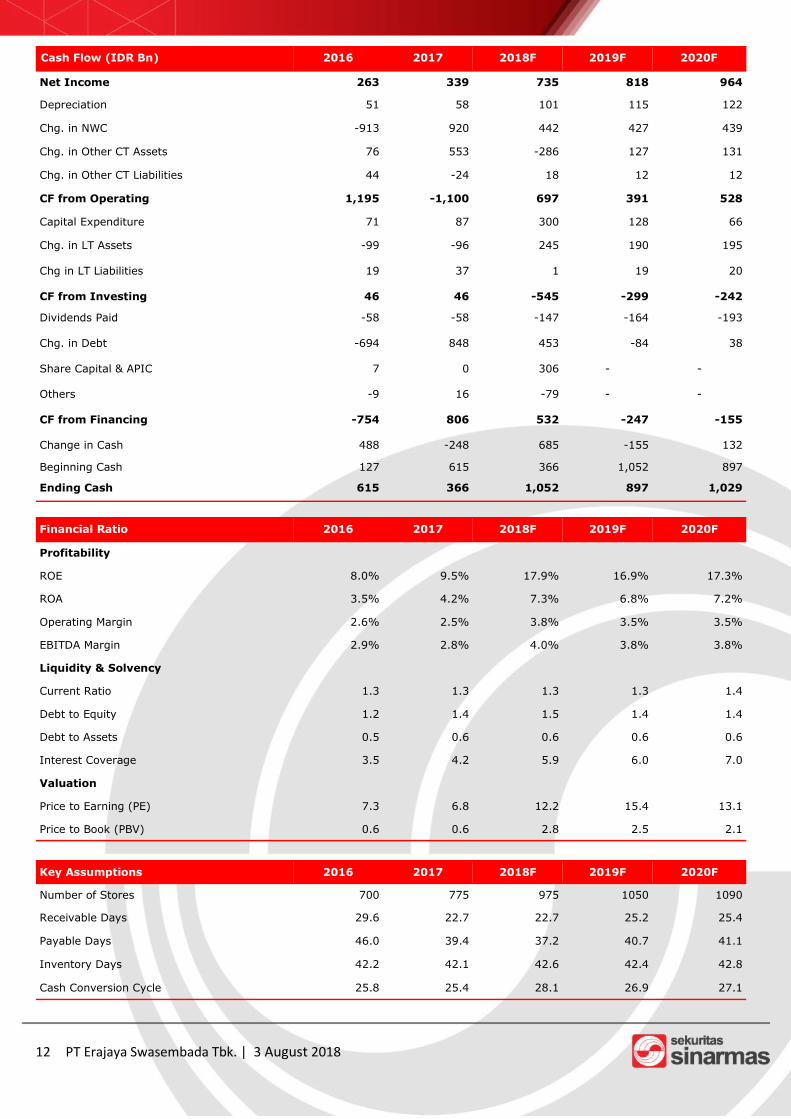
Cash Flow (IDR Bn) 2016 2017 2018F 2019F 2020F
Net Income 263 339 735 818 964
Depreciation 51 58 101 115 122
Chg. in NWC -913 920 442 427 439
Chg. in Other CT Assets 76 553 -286 127 131
Chg. in Other CT Liabilities 44 -24 18 12 12
CF from Operating 1,195 -1,100 697 391 528
Capital Expenditure 71 87 300 128 66
Chg. in LT Assets -99 -96 245 190 195
Chg in LT Liabilities 19 37 1 19 20
CF from Investing 46 46 -545 -299 -242
Dividends Paid -58 -58 -147 -164 -193
Chg. in Debt -694 848 453 -84 38
Share Capital & APIC 7 0 306 - -
Others -9 16 -79 - -
CF from Financing -754 806 532 -247 -155
Change in Cash 488 -248 685 -155 132
Beginning Cash 127 615 366 1,052 897
Ending Cash 615 366 1,052 897 1,029
Financial Ratio 2016 2017 2018F 2019F 2020F
Profitability
ROE 8.0% 9.5% 17.9% 16.9% 17.3%
ROA 3.5% 4.2% 7.3% 6.8% 7.2%
Operating Margin 2.6% 2.5% 3.8% 3.5% 3.5%
EBITDA Margin 2.9% 2.8% 4.0% 3.8% 3.8%
Liquidity & Solvency
Current Ratio 1.3 1.3 1.3 1.3 1.4
Debt to Equity 1.2 1.4 1.5 1.4 1.4
Debt to Assets 0.5 0.6 0.6 0.6 0.6
Interest Coverage 3.5 4.2 5.9 6.0 7.0
Valuation
Price to Earning (PE) 7.3 6.8 12.2 15.4 13.1
Price to Book (PBV) 0.6 0.6 2.8 2.5 2.1
Key Assumptions 2016 2017 2018F 2019F 2020F
Number of Stores 700 775 975 1050 1090
Receivable Days 29.6 22.7 22.7 25.2 25.4
Payable Days 46.0 39.4 37.2 40.7 41.1
Inventory Days 42.2 42.1 42.6 42.4 42.8
Cash Conversion Cycle 25.8 25.4 28.1 26.9 27.1

13 PT Erajaya Swasembada Tbk. | 3 August 2018
SINARMAS SEKURITAS INVESTMENT RATINGS GUIDE
BUY: Share price may rise by more than 15% over the next 12 months. ADD: Share price may range between 10% to 15% over the next 12 months.
NEUTRAL: Share price may range between –10% to +10% over the next 12 months. REDUCE: Share price may range between –10% to –15% over the next 12 months. SELL: Share price may fall by more than 15% over the next 12 months. DISCLAIMER
This report has been prepared by PT Sinarmas Sekuritas, an affiliate of Sinarmas Group. This material is: (i) created based on information that we consider reliable, but we do not represent that it is accu-
rate or complete, and it should not be relied upon as such; (ii) for your private information, and we are not solicit-ing any action based upon it; (iii) not to be construed as an offer to sell or a solicitation of an offer to buy any secu-
rity. Opinions expressed are current opinions as of original publication date appearing on this material and the infor-mation, including the opinions contained herein, is subjected to change without notice. The analysis contained here-in is based on numerous assumptions. Different assumptions could result in materially different results. The analyst(s) responsible for the preparation of this publication may interact with trading desk personnel, sales personnel and other constituencies for the purpose of gathering, integrating and interpreting market information. Research will
initiate, update and cease coverage solely at the discretion of Sinarmas Research department. If and as applicable, Sinarmas Sekuritas’ investment banking relationships, investment banking and non-investment banking compensa-tion and securities ownership, if any, are specified in disclaimers and related disclosures in this report. In addition,
other members of Sinarmas Group may from time to time perform investment banking or other services (including acting as advisor, manager or lender) for, or solicit investment banking or other business from companies under our research coverage. Further, the Sinarmas Group, and/or its officers, directors and employees, including persons, without limitation, involved in the preparation or issuance of this material may, to the extent permitted by law and/
or regulation, have long or short positions in, and buy or sell, the securities (including ownership by Sinarmas Group), or derivatives (including options) thereof, of companies under our coverage, or related securities or deriva-tives. In addition, the Sinarmas Group, including Sinarmas Sekuritas, may act as market maker and principal, will-ing to buy and sell certain of the securities of companies under our coverage. Further, the Sinarmas Group may buy and sell certain of the securities of companies under our coverage, as agent for its clients.
Investors should consider this report as only a single factor in making their investment decision and, as such, the report should not be viewed as identifying or suggesting all risks, direct or indirect, that may be associated with any
investment decision. Recipients should not regard this report as substitute for exercise of their own judgment. Past performance is not necessarily a guide to future performance. The value of any investments may go down as well as up and you may not get back the full amount invested. Sinarmas Sekuritas specifically prohibits the redistribution of this material in whole or in part without the written
permission of Sinarmas Sekuritas and Sinarmas Sekuritas accepts no liability whatsoever for the actions of third parties in this respect. If publication has been distributed by electronic transmission, such as e-mail, then such transmission cannot be guaranteed to be secure or error-free as information could be intercepted, corrupted, lost, destroyed, arrive late or incomplete, or contain viruses. The sender therefore does not accept liability for any errors or omissions in the contents of this publication, which may arise as a result of electronic transmission. If verification is required, please request a hard-copy version.
Additional information is available upon request. Images may depict objects or elements which are protected by third party copyright, trademarks and other intellec-tual properties.
©Sinarmas Sekuritas(2018). All rights reserved.