PT Bank Mandiri (Persero) Tbk Q3 2007 Results Presentation
84
0 PT Bank Mandiri (Persero) Tbk Q3 2007 Results Presentation
Transcript of PT Bank Mandiri (Persero) Tbk Q3 2007 Results Presentation
0
PT Bank Mandiri (Persero) Tbk
Q3 2007 Results Presentation

81
Jan 1 2007IPOfrom:
+30.67%+349.64%JCI
+21.55%+422.22%BMRI
Share Information
No. of Investors
No. of shares %
DOMESTIC1. Government of RI 1 14,000,000,000 67.47%2. Retail 12,078 470,040,597 2.27%3. Employees 9,285 155,297,145 0.75%4. Coops/Foundations 19 17,041,000 0.08%5. Pension Funds 176 188,684,000 0.91%6. Assurance/Banks 49 198,675,000 0.96%7. Institutions 248 510,869,447 2.46%8. Mutual Funds 106 594,555,000 2.87%Total 21,962 16,135,162,189 77.76%INTERNATIONAL1. Retail 82 4,620,500 0.02%2. Institutional 478 4,609,769,053 22.22%Total 560 4,614,389,553 22.24%
Description
TOTAL
as of 30 September 2007
22,522 20,749,551,742 100.00%
0
500
1,000
1,500
2,000
2,500
3,000
3,500
4,000
10-Jul-03
5-Sep-03
3-Nov-03
12-Jan-04
11-Mar-04
12-May-04
12-Jul-04
7-Sep-04
4-Nov-04
10-Jan-05
10-Mar-05
11-May-05
7-Jul-05
5-Sep-05
31-Oct-05
4-Jan-06
3-Mar-06
4-May-06
3-Jul-06
31-Aug
-06
2-Nov-06
2-Jan-07
27-Feb-07
26-Ap
r-07
26-Jun-07
22-Aug
-07
BMRI
JCI

1
Bank Mandiri Presentation Contents
Results Overview Page #Q3 Financial Highlights 2Quarterly Loan Growth & LDR 3 - 4Quarterly Funding Mix & Deposit Costs 5Quarterly Net Interest Margins 6Quarterly Fees & Commissions 7Quarterly Overhead Expenses & Detail 8Quarterly NPL Movement & Asset Quality 9 – 10Provisioning & Collateral 11New NPL Formation 12Top NPL Debtor Developments 13NPL Resolution Program 14Operating Profit, Core Earnings, PAT 15 – 16
Operating Performance HighlightsSBU Overview 18 – 21Corporate Banking 22 – 24Treasury & International Banking 25 - 26Commercial Banking 27 – 30Micro & Retail Banking 31 – 34Consumer Finance 35 – 382007 Goals 39
Supporting Materials 40 – 80

2
Key Financial Highlights*
Organization Structure
(75.0%)3.4%13.6%Net NPL Ratio
23.3%58.2%47.2%Low Cost Funds Ratio
Change9-Mo. 20079-Mo. 2006
165.6%3,153 tnRp1,187 bnEarnings After Tax
(4.3%)44.8%46.8%Efficiency Ratio
19.6%5.5%4.6%NIM
11.9%Rp121.7 tnRp108.8 tnLoans
Bank Mandiri’s Nine Month 2007 Performance continued to demonstrate marked improvements in a number of key indicators:
*Unaudited consolidated numbers Including non-recurring interest income: (1) 5.7%; (2) 43.1%
(1)
(2)
3
4.7%
11.9%
QoQ Growth (%)YoY Growth (%)
43.048.3
65.475.994.499.5
104.0
106.9106.9105.1107.8108.8117.7
114.3116.3121.7
57.6%
42.5%
57.3% 55.9% 57.9%
Q4 '00
Q4 '01
Q4 '02
Q4 '03
Q4 '04
Q1 '05
Q2 '05
Q3 '05
Q4 '05
Q1 '06
Q2 '06
Q3 '06
Q4 '06
Q1 '07
Q2 '07
Q3 '07
Loans (Rp tn)LDR (%)
37.735.1 35.7
32.9 32.6
8.510.8 11.5 11.8
45.242.3 44.0 44.7 53.6
50.5 51.1
40.2
32.534.5
22.2
9.78.6 9.0
2.01.2 2.21.9 2.1
12.6 12.7 13.9
1.5
Q4 '02
Q4 '03
Q4 '04
Q1 '05
Q2 '05
Q3 '05
Q4 '05
Q1 '06
Q2 '06
Q3 '06
Q4 '06
Q1 '07
Q2 '07
Q3 '07
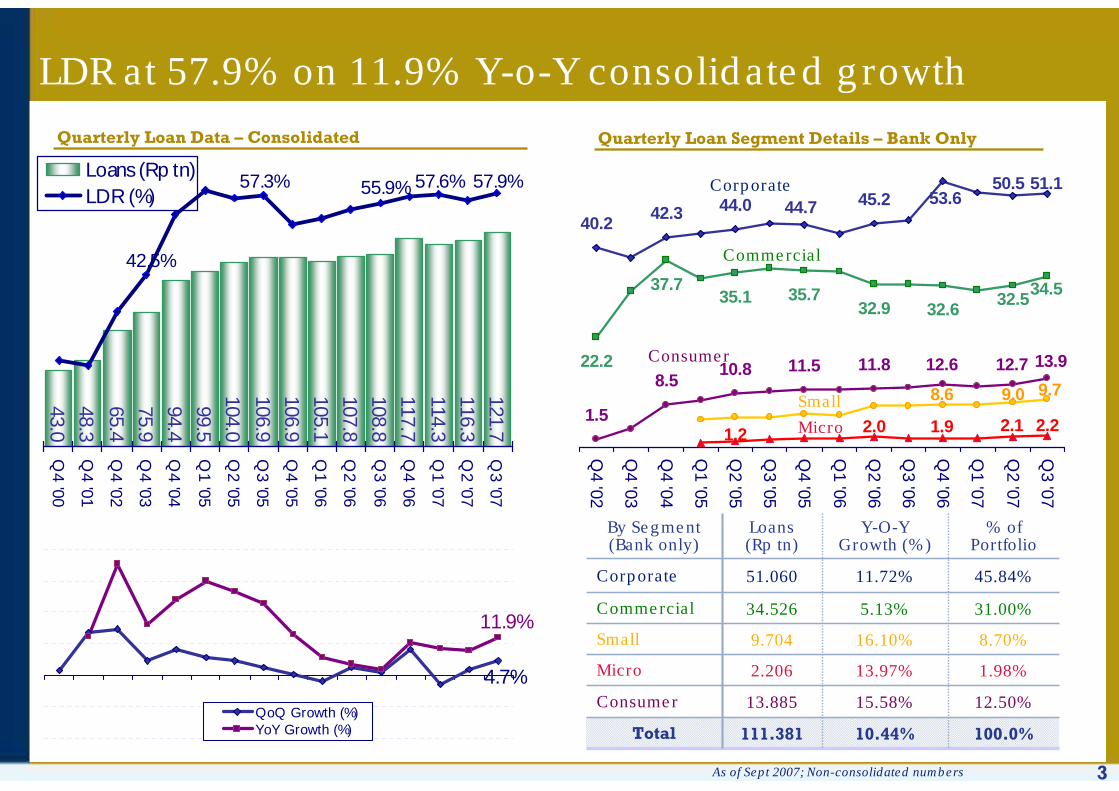
LDR at 57.9% on 11.9% Y-o-Y consolidated growth
Quarterly Loan Data – Consolidated
1.98%13.97%2.206Micro
8.70%16.10%9.704Small
12.50%15.58%13.885Consumer
100.0%10.44%111.381Total
31.00%5.13%34.526Commercial
45.84%11.72%51.060Corporate
% of Portfolio
Loans(Rp tn)
By Segment (Bank only)
Y-O-Y Growth (%)
Quarterly Loan Segment Details – Bank Only
Corporate
Commercial
Consumer
As of Sept 2007; Non-consolidated numbers
Small
Micro
4
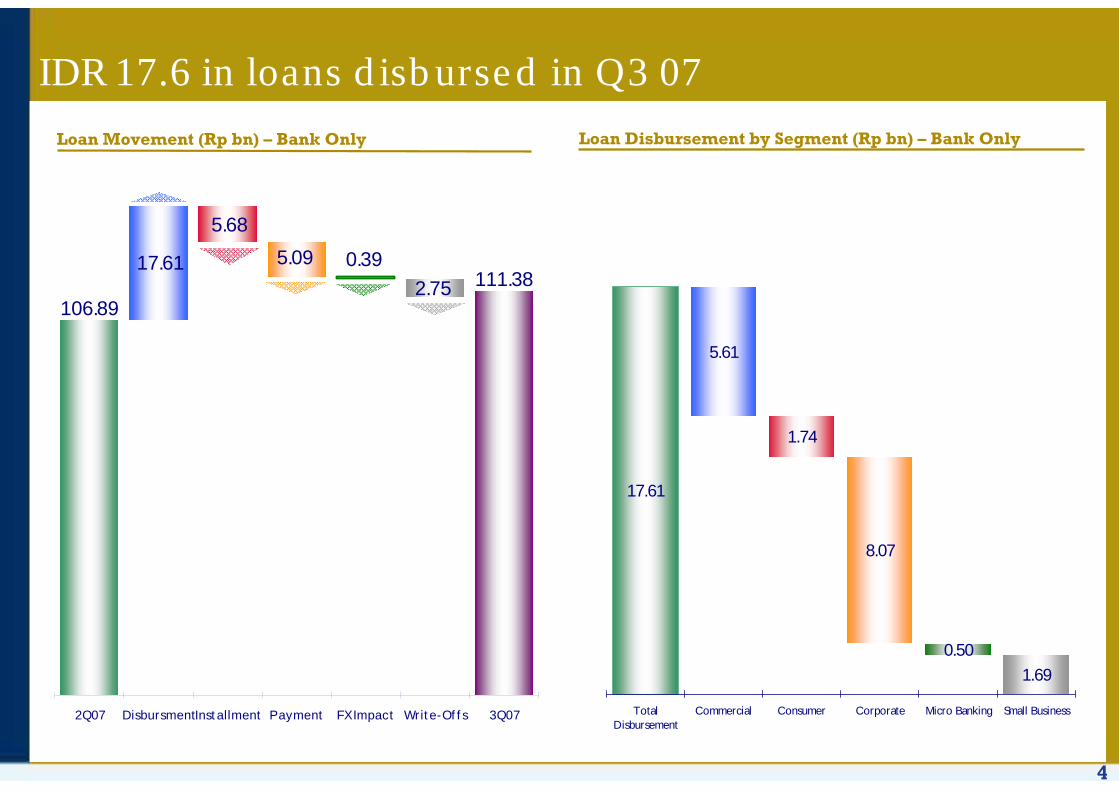
IDR 17.6 in loans disbursed in Q3 07
106.89
111.382.75
0.395.09
5.68
17.61
2Q07 DisbursmentInst allment Payment FX Impact Writ e-Of f s 3Q07
Loan Movement (Rp bn) – Bank Only Loan Disbursement by Segment (Rp bn) – Bank Only
1.69
0.50
8.07
1.74
5.61
17.61
TotalDisbursement
Commercial Consumer Corporate Micro Banking Small Business
5
18.022.129.640.652.049.547.844.245.241.844.746.657.657.262.565.7
31.131.2
24.828.8
28.027.530.828.330.130.2
28.029.5
33.631.0
33.135.4
5.8
4.6
6.2
7.6
9.1
11.9
11.9
12.3 11.6
14.9
12.3
12.6
11.6
13.2
97.187.8
106.9100.780.566.5
72.379.8
93.2 90.889.185.7
80.5
16.521.5
23.420.6
17.311.6
11.113.316.3
15.7 15.915.113.4
12.6 13.912.113.7
14.314.1
14.4
15.9
19.5
65.0
72.970.069.1
0
20
40
60
80
100
120
140
160
180
200
Q4 '99
Q4 '00
Q4 '01
Q4 '02
Q4 '03
Q4 '04
Q1 '05
Q2 '05
Q3 '05
Q4 '05
Q1 '06
Q2 '06
Q3 '06
Q4 '06
Q1 '07
Q2 '07
Q3 '07
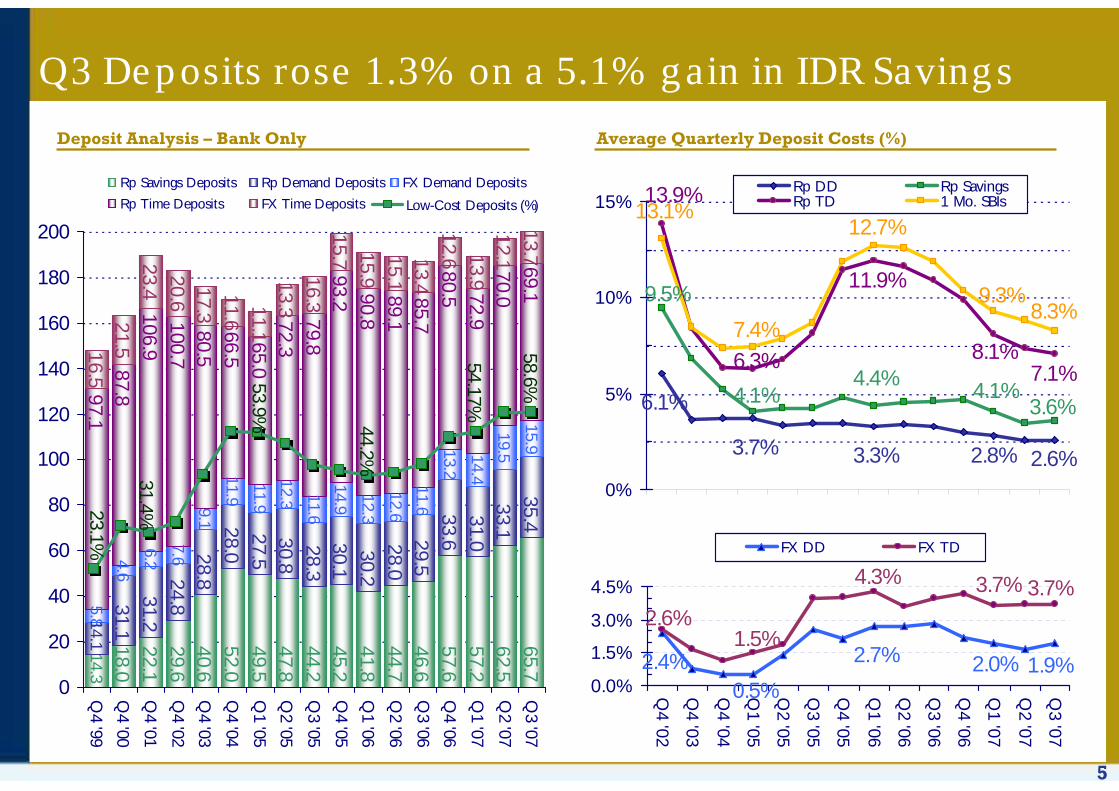
Rp Savings Deposits Rp Demand Deposits FX Demand Deposits
Rp Time Deposits FX Time Deposits
Q3 Deposits rose 1.3% on a 5.1% gain in IDR Savings
Deposit Analysis – Bank Only
6.1%
2.6%3.3%3.7% 2.8%
9.5%
4.1%4.4%4.1% 3.6%
13.9%
8.1%6.3%
11.9%
7.1%
13.1%
9.3%
12.7%
7.4%8.3%
0%
5%
10%
15%Rp DD Rp SavingsRp TD 1 Mo. SBIs
Average Quarterly Deposit Costs (%)
2.4% 2.7% 1.9%2.0%0.5%
3.7%2.6%
1.5%
4.3% 3.7%
0.0%
1.5%
3.0%
4.5%
Q4 '02
Q4 '03
Q4 '04
Q1 '05
Q2 '05
Q3 '05
Q4 '05
Q1 '06
Q2 '06
Q3 '06
Q4 '06
Q1 '07
Q2 '07
Q3 '07
FX DD FX TD
31.4%23.1%
53.9% 44.2%
54.17%
58.6%
Low-Cost Deposits (%)
6*Excluding the impact of non-recurring interest income
2.4%
3.9%
2.8%
3.7%
4.3%
4.3%
3.6%
3.8%
3.6%
4.2%
4.1%
4.6%
4.9%
5.5%
4.9%
4.9%
Q4 '00
Q4 '01
Q4 '02
Q4 '03
Q4 '04
Q1 '05
Q2 '05
Q3 '05
Q4 '05
Q1 '06
Q2 '06
Q3 '06
Q4 '06
Q1 '07
Q2 '07
Q3 '07
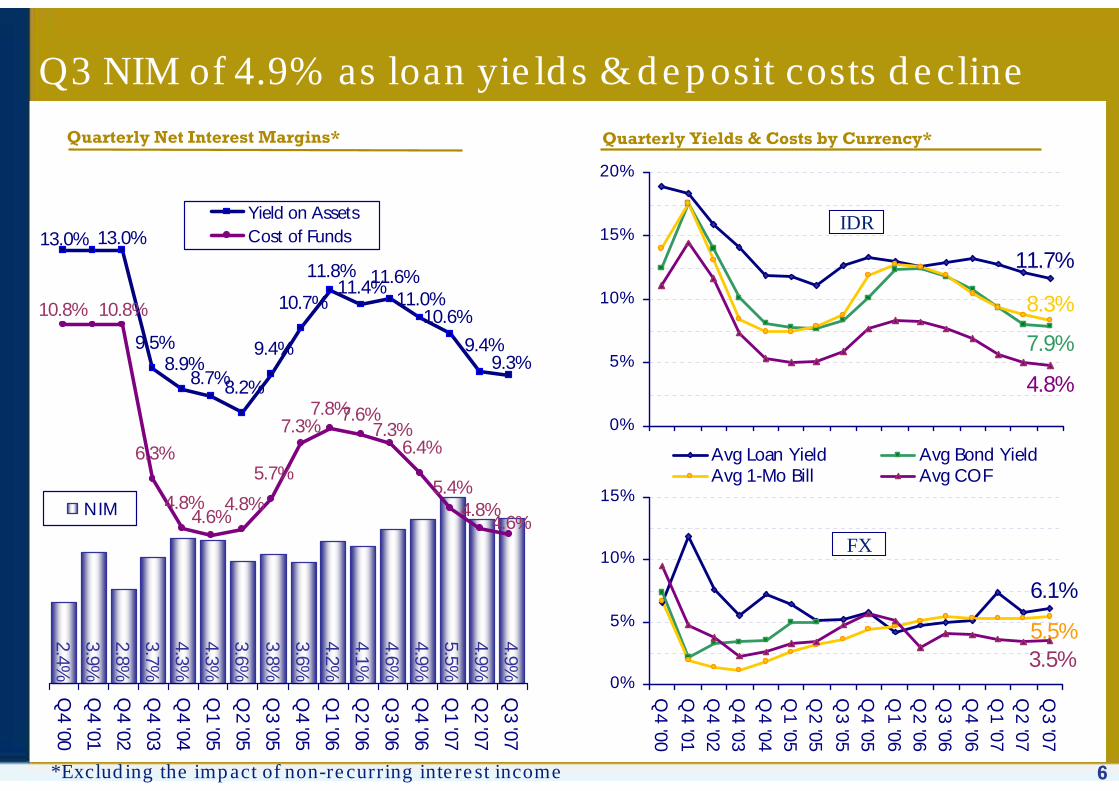
NIM
6.1%
5.5%3.5%
0%
5%
10%
15%
Q4 '00
Q4 '01
Q4 '02
Q4 '03
Q4 '04
Q1 '05
Q2 '05
Q3 '05
Q4 '05
Q1 '06
Q2 '06
Q3 '06
Q4 '06
Q1 '07
Q2 '07
Q3 '07
Avg Loan Yield Avg Bond YieldAvg 1-Mo Bill Avg COF
11.7%
7.9%
8.3%
4.8%
0%
5%
10%
15%
20%
9.5%8.9%
8.2%
9.4%
10.7%
6.3%
4.8% 4.8%
5.7%6.4%
9.3%9.4%
11.8% 11.6%
10.6%11.0%
8.7%
11.4%
13.0%13.0%
4.6%4.8%
5.4%
4.6%
7.8%7.3% 7.3%
7.6%
10.8% 10.8%
Yield on AssetsCost of Funds
Q3 NIM of 4.9% as loan yields & deposit costs decline
Quarterly Net Interest Margins* Quarterly Yields & Costs by Currency*
IDR
FX

7
Details of Q3 2006 & 2007
145.6
134.1
163.6
133.5
139.2
149.6
143.3
164.8
167.7
205.1109.1 81.4 65.5
91.275.4
106.8 116.8110.9
13.7 70.341.2
4.319.8
10.9
76.9 56.4 64.764.2
93.8
97.0
61.348.8
75.4 65.2
113.5
54.9
58.2 66.6
122.256.0
123.6
25.1 26.132.4 38.0
38.6
37.5
39.9 39.9
41.3
44.4
43.3
48.7
21.8 17.8 28.7 20.9
20.4
26.5
27.5 31.6
38.6
45.6
58.8
141.3
136.7
163.6
102.3 97.1129.5
88.9
67.6
Q4 '04
Q1 '05
Q2 '05
Q3 '05
Q4 '05
Q1 '06
Q2 '06
Q3 '06
Q4 '06
Q1 '07
Q2 '07
Q3 '07
Admin. Fees for Deposits & Loans OthersFee from Subsidiaries Opening L/C & Bank GuaranteesTransfer, Coll., Clearing & Bank Ref. Credit Cards
12.4%12.8%12.8%12.1%
17.7%
10.9%
14.5% 14.8%
17.6%15.8%
12.0%13.3%
% of Operating Income*
Non-loan Related Fees & Commissions up 48.8% Y-o-Y
Non-loan related fees & commissions
*Non-Loan related fees & commissions/(Total Operating Income - Non-recurring interest income)
*Others include Custodian & Trustee fees, Syndication, Mutual Funds, Payment Points, etc.
48.8%670.869450.787Total
113.9%67.58331.595Credit Cards
22.3%48.73239.85Transfers,
Collections..
33.4%88.86766.619L/C &
Guarantees
72.1%96.98756.345Subsidiaries
53.3%163.647106.775Others*
37.1%205.053149.603Admin. Fees
Y-o-Y
(%)
Q32007
Q32006
Non-Loan Related Fees &
Commissions(Rp billion)
8
336753775749
1,034678793767842637788810
1,016710748960
957649
723604
677
1,241 695744
869795929
1,056327
709
667
377
Q4 '00
Q4 '01
Q4 '02
Q4 '03
Q4 '04
Q1 '05
Q2 '05
Q3 '05
Q4 '05
Q1 '06
Q2 '06
Q3 '06
Q4 '06
Q1 '07
Q2 '07
Q3 '07
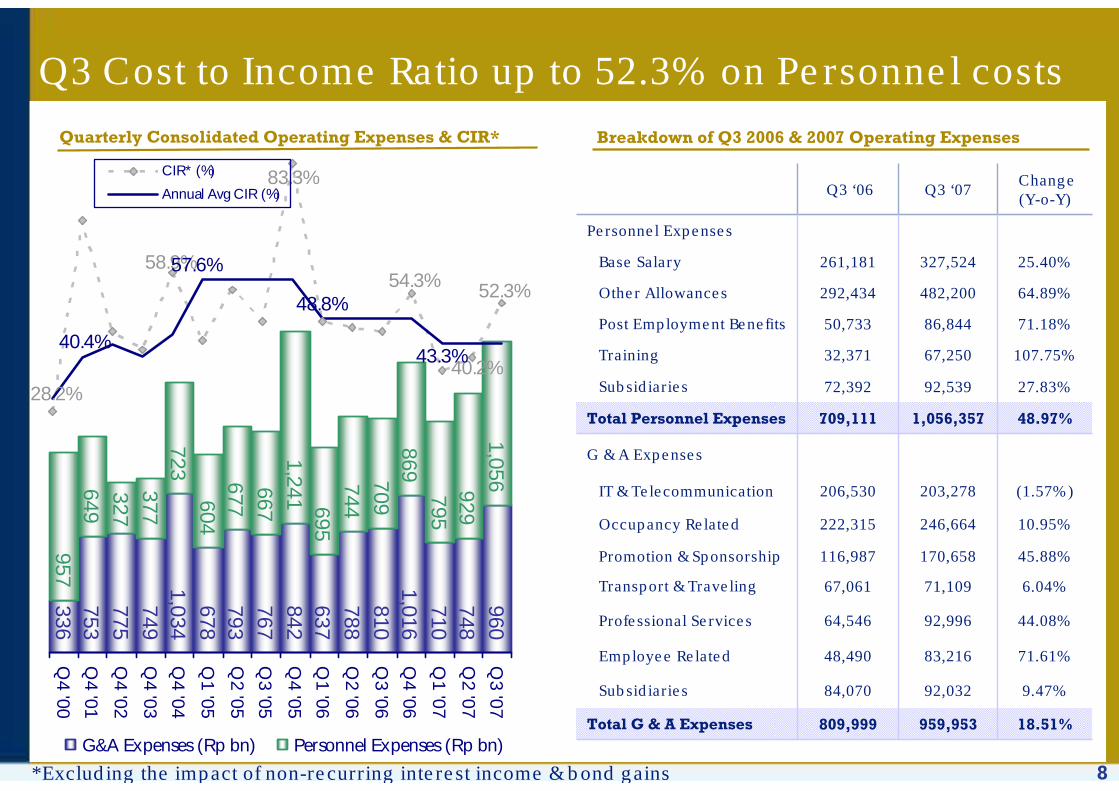
G&A Expenses (Rp bn) Personnel Expenses (Rp bn)
Q3 Cost to Income Ratio up to 52.3% on Personnel costs
52.3%54.3%
83.3%
58.9%
40.2%28.2%
43.3%40.4%
57.6%
48.8%
CIR* (%)
Annual Avg CIR (%)
71.18%86,84450,733Post Employment Benefits
25.40%327,524261,181Base Salary
18.51%959,953809,999Total G & A Expenses
9.47%92,03284,070Subsidiaries
71.61%83,21648,490Employee Related
44.08%92,99664,546Professional Services
6.04%71,10967,061Transport & Traveling
116,987
222,315
206,530
709,111
72,392
32,371
292,434
Q3 ‘06
45.88%170,658Promotion & Sponsorship
10.95%246,664Occupancy Related
G & A Expenses
48.97%1,056,357Total Personnel Expenses
27.83%92,539Subsidiaries
64.89%482,200Other Allowances
Personnel Expenses
Change (Y-o-Y)
Q3 ‘07
(1.57%)203,278IT & Telecommunication
67,250 107.75%Training
Breakdown of Q3 2006 & 2007 Operating ExpensesQuarterly Consolidated Operating Expenses & CIR*
*Excluding the impact of non-recurring interest income & bond gains
9
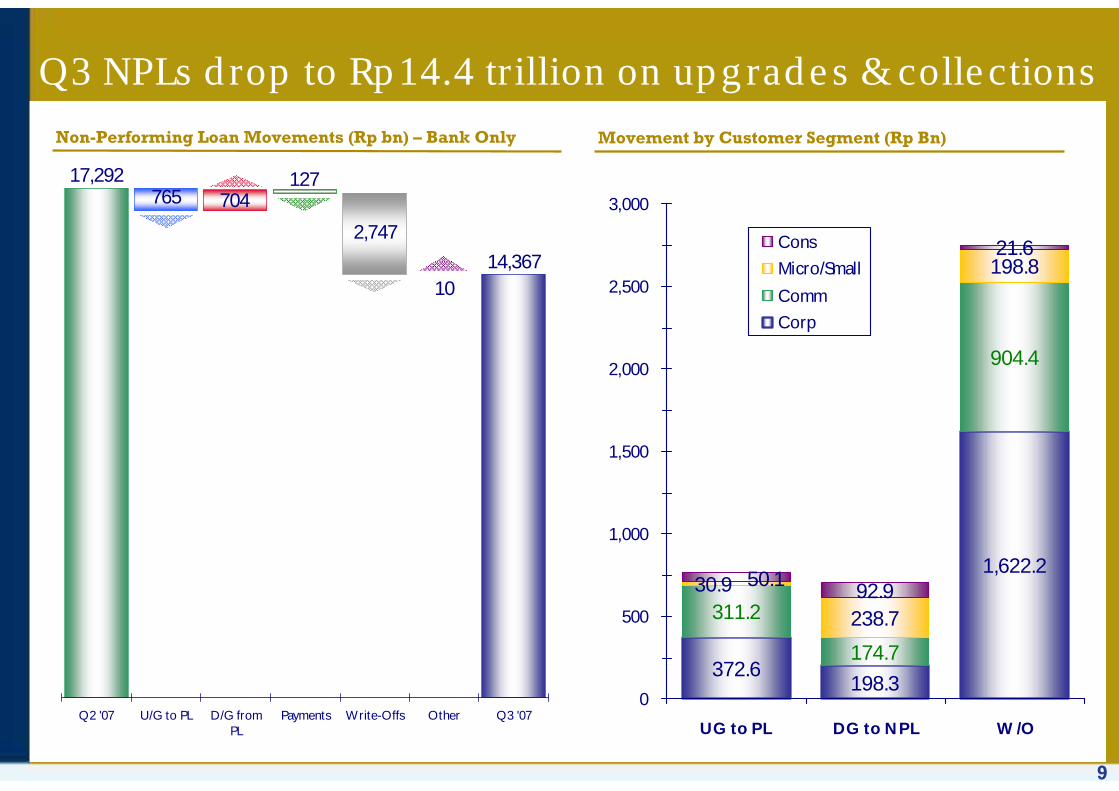
Non-Performing Loan Movements (Rp bn) – Bank Only
Q3 NPLs drop to Rp14.4 trillion on upgrades & collections
Movement by Customer Segment (Rp Bn)
1,622.2
311.2
174.7
904.4
238.792.9
198.3372.6
198.8
30.9
21.6
50.1
0
500
1,000
1,500
2,000
2,500
3,000
UG to PL DG to NPL W/O
Cons
Micro/Small
Comm
Corp
76517,292
704127
2,747
1014,367
Q2 '07 U/G to PL D/G fromPL
Payments Write-Offs Other Q3 '07

10
NPL Movement - Consolidated
19.8%9.7%
8.6%
7.1%17.8%
23.4%
25.3%26.2%
70.9%
12.4%
15.5%
24.9%
24.6%
7.3%
24.6%
16.3%16.3%
3.9%
10.3%
15.0%
5.9%4.7%
3.4%
87.8%
190.4%
42.8%
70.0%86.7%49.1%
161.1%
151.1%
Q4 '99
Q4 '00
Q4 '01
Q4 '02
Q4 '03
Q4 '04
Q1 '05
Q2 '05
Q3 '05
Q4 '05
Q1 '06
Q2 '06
Q3 '06
Q4 '06
Q1 '07
Q2 '07
Q3 '07
Gross NPL Ratio Net NPL RatioProv/NPL Prov/NPL incl. Coll.
Net NPLs at 3.4% with provisioning coverage of 87.8%
Category 2 Loans – Bank Only
4,033
15,350
12,655
16,202
10,983
8,334
12,352
14,394
16,423
12,912
12,086
12,175
10,991
16,966
16,750
15,854
15,586
0
2,000
4,000
6,000
8,000
10,000
12,000
14,000
16,000
18,000
20,000
Q4 '99
Q4 '00
Q4 '01
Q4 '02
Q4 '03
Q4 '04
Q1 '05
Q2 '05
Q3 '05
Q4 '05
Q1 '06
Q2 '06
Q3 '06
Q4 '06
Q1 '07
Q2 '07
Q3 '07
2 - Special Mention Loans (Rp Bn)
14.0%12.2%
14.8%15.9%
24.8%
0%
10%
20%
30%
40%
50%
Cat 2 %
11
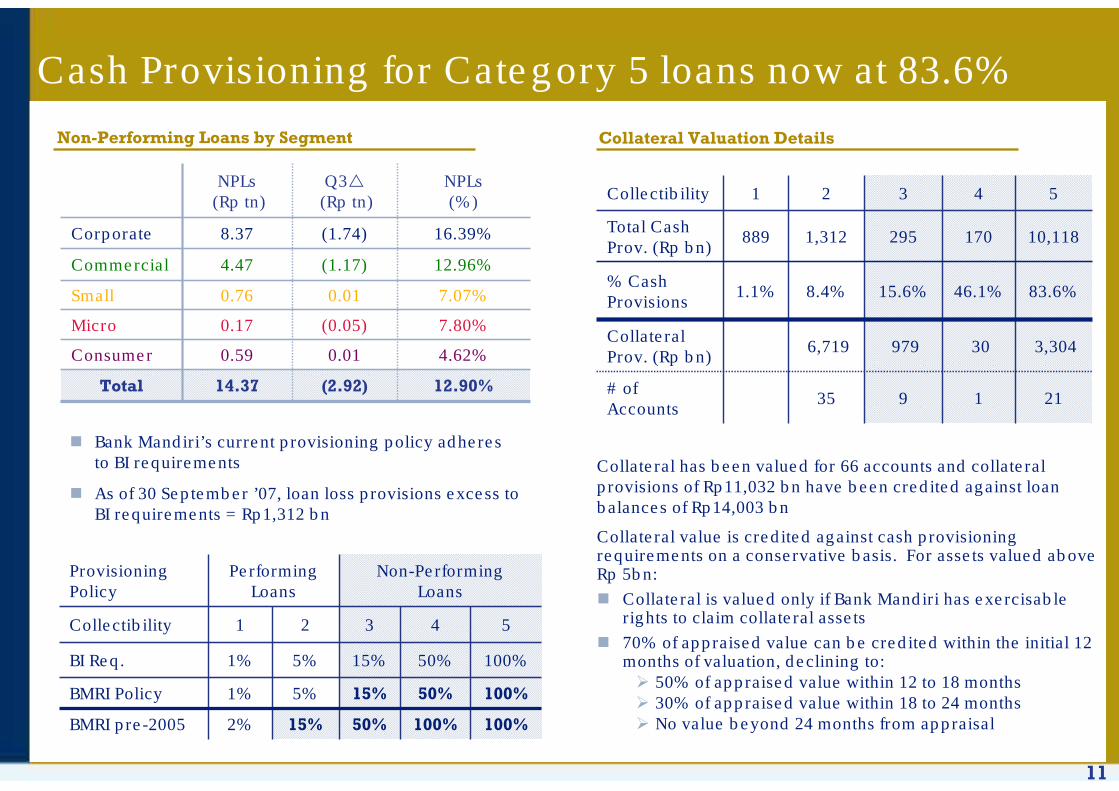
Cash Provisioning for Category 5 loans now at 83.6%
7.80%(0.05)0.17 Micro
7.07%0.010.76 Small
14.37
0.59
4.47
8.37
NPLs(Rp tn)
4.62%0.01 Consumer
16.39%(1.74) Corporate
NPLs(%)
Q3(Rp tn)
12.96%(1.17)Commercial
(2.92)Total 12.90%
100%50%15%5%1%BMRI Policy
100%
54321Collectibility
Non-PerformingLoans
PerformingLoans
50%
15%
15%
5%
100%2%BMRI pre-2005
100%50%1%BI Req.
Provisioning Policy
Collateral Valuation DetailsNon-Performing Loans by Segment
Bank Mandiri’s current provisioning policy adheres to BI requirements
As of 30 September ’07, loan loss provisions excess to BI requirements = Rp1,312 bn
Collateral has been valued for 66 accounts and collateral provisions of Rp11,032 bn have been credited against loan balances of Rp14,003 bn
Collateral value is credited against cash provisioning requirements on a conservative basis. For assets valued above Rp 5bn:
Collateral is valued only if Bank Mandiri has exercisable rights to claim collateral assets
70% of appraised value can be credited within the initial 12 months of valuation, declining to:
50% of appraised value within 12 to 18 months30% of appraised value within 18 to 24 monthsNo value beyond 24 months from appraisal
10,118 170 295 1,312 889 Total Cash Prov. (Rp bn)
54321Collectibility
21
83.6%46.1%15.6%8.4%1.1%% Cash Provisions
9
979
35
6,719
1# of Accounts
3,30430Collateral Prov. (Rp bn)
12
0.23
0.28
1.07
0.18
0.55
Q3 2007
0.29
0.34
1.56
0.60
0.49
Q2 2007
1.51
1.63
2.27
1.63
0.59
Q1 2006
1.08
0.73
3.14
1.27
-
Q2 2006
Q3 2007 Details
59,850.5
10,303.9
6,763.7
17,307.5
25,475.3
Q3 ‘07 Balance (Rp bn)
Q4 2006
Q1 2007
UG toPL%
DG to
NPL%
Q3 2006
Loan Background
0.42
0.78
1.87
0.11
-
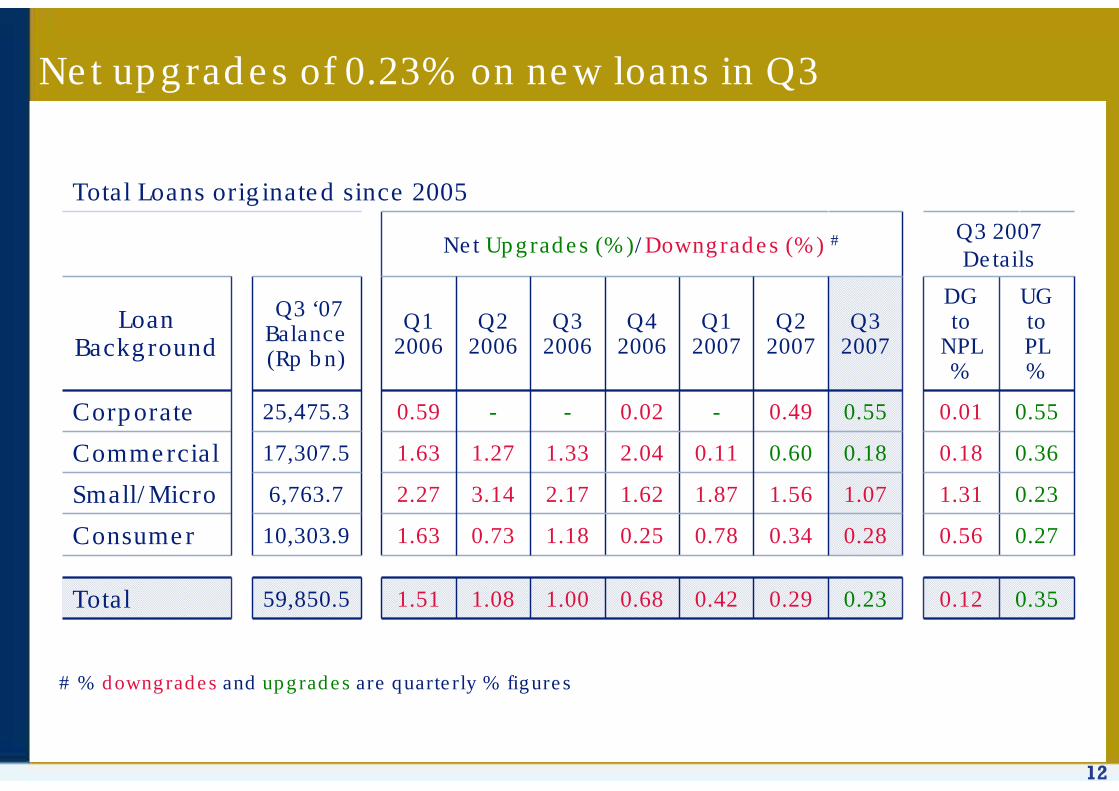
Total Loans originated since 2005
Net Upgrades (%)/Downgrades (%) #
0.68
0.25
1.62
2.04
0.02
1.00
1.18
2.17
1.33
-
0.35
0.27
0.23
0.36
0.55
0.12
0.56
1.31
0.18
0.01
Total
Consumer
Small/Micro
Commercial
Corporate
Net upgrades of 0.23% on new loans in Q3
# % downgrades and upgrades are quarterly % figures
13
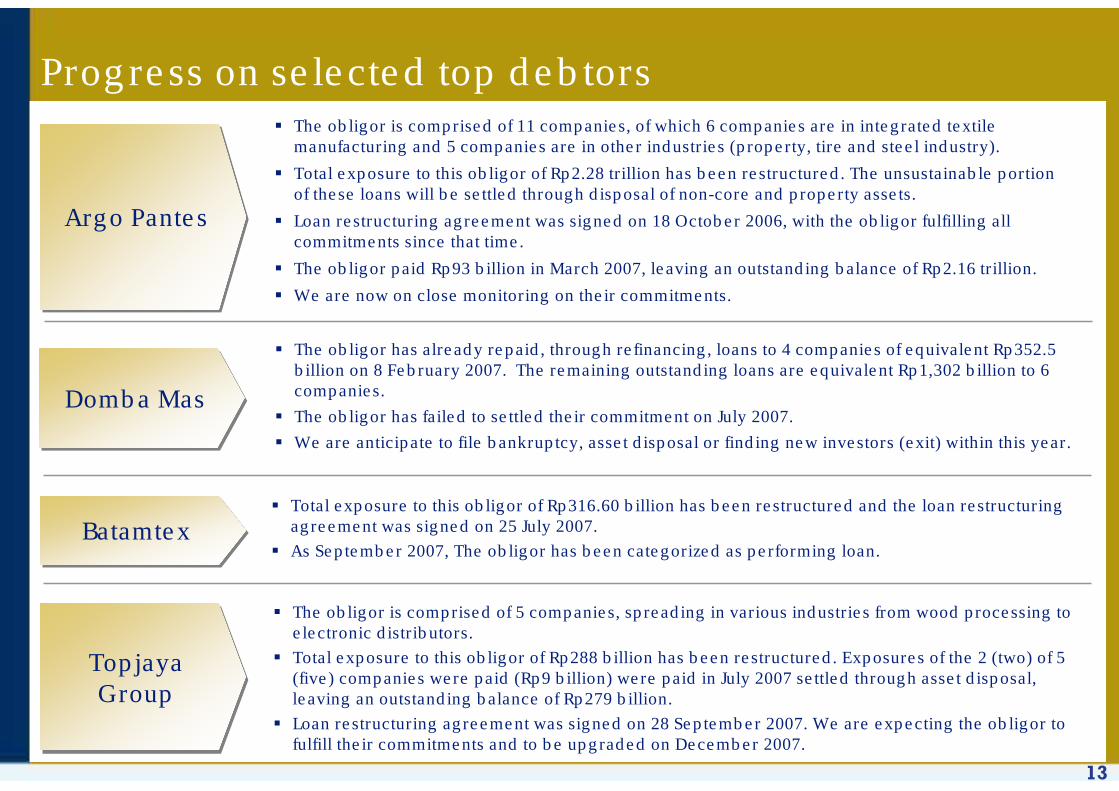
Progress on selected top debtors
Argo PantesArgo Pantes
The obligor is comprised of 11 companies, of which 6 companies are in integrated textile manufacturing and 5 companies are in other industries (property, tire and steel industry).
Total exposure to this obligor of Rp2.28 trillion has been restructured. The unsustainable portion of these loans will be settled through disposal of non-core and property assets.
Loan restructuring agreement was signed on 18 October 2006, with the obligor fulfilling all commitments since that time.
The obligor paid Rp93 billion in March 2007, leaving an outstanding balance of Rp2.16 trillion.
We are now on close monitoring on their commitments.
Domba MasDomba Mas
The obligor has already repaid, through refinancing, loans to 4 companies of equivalent Rp352.5 billion on 8 February 2007. The remaining outstanding loans are equivalent Rp1,302 billion to 6 companies.
The obligor has failed to settled their commitment on July 2007.
We are anticipate to file bankruptcy, asset disposal or finding new investors (exit) within this year.
BatamtexBatamtexTotal exposure to this obligor of Rp316.60 billion has been restructured and the loan restructuring agreement was signed on 25 July 2007.
As September 2007, The obligor has been categorized as performing loan.
TopjayaGroup
TopjayaGroup
The obligor is comprised of 5 companies, spreading in various industries from wood processing to electronic distributors.
Total exposure to this obligor of Rp288 billion has been restructured. Exposures of the 2 (two) of 5 (five) companies were paid (Rp9 billion) were paid in July 2007 settled through asset disposal, leaving an outstanding balance of Rp279 billion.
Loan restructuring agreement was signed on 28 September 2007. We are expecting the obligor to fulfill their commitments and to be upgraded on December 2007.
14
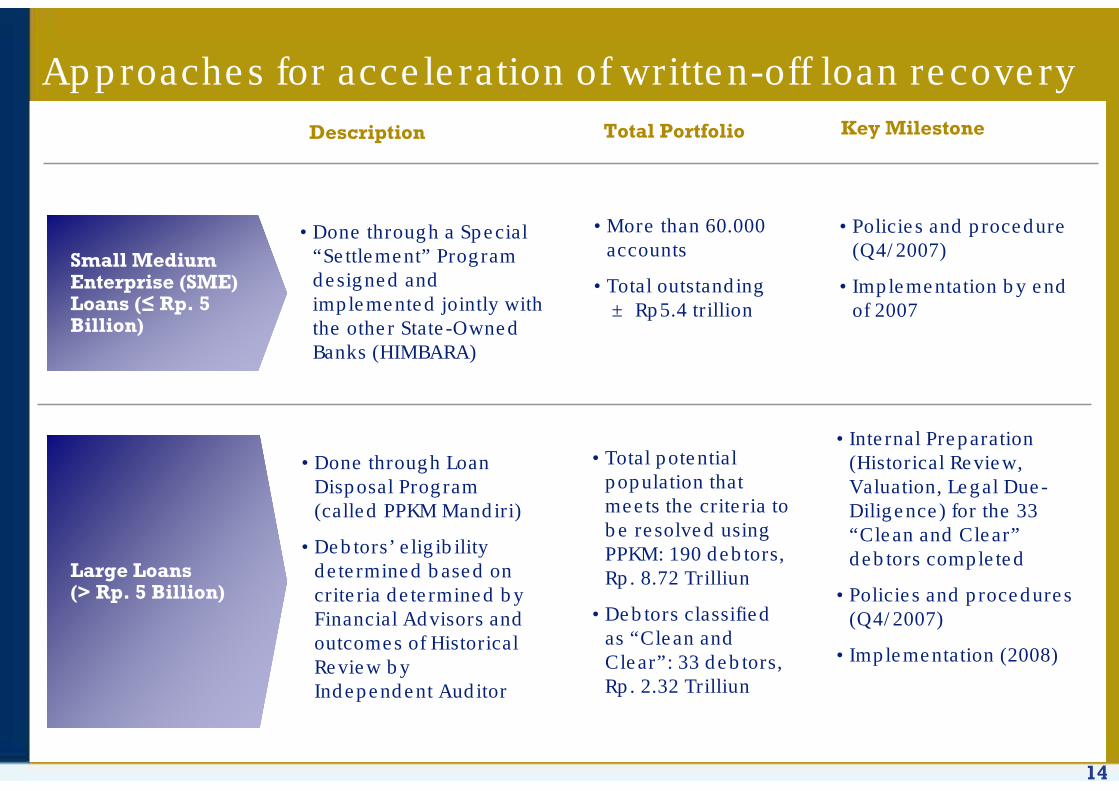
Approaches for acceleration of written-off loan recovery
Small Medium Enterprise (SME) Loans (≤ Rp. 5 Billion)
Large Loans(> Rp. 5 Billion)
Description Total Portfolio Key Milestone
• Done through a Special “Settlement” Program designed and implemented jointly with the other State-Owned Banks (HIMBARA)
• More than 60.000 accounts
• Total outstanding ± Rp5.4 trillion
• Policies and procedure (Q4/2007)
• Implementation by end of 2007
• Done through Loan Disposal Program (called PPKM Mandiri)
• Debtors’ eligibility determined based on criteria determined by Financial Advisors and outcomes of Historical Review by Independent Auditor
• Total potential population that meets the criteria to be resolved using PPKM: 190 debtors, Rp. 8.72 Trilliun
• Debtors classified as “Clean and Clear”: 33 debtors, Rp. 2.32 Trilliun
• Internal Preparation (Historical Review, Valuation, Legal Due-Diligence) for the 33 “Clean and Clear”debtors completed
• Policies and procedures (Q4/2007)
• Implementation (2008)

15
2,383
9,684 5,199
6,393
Net InterestIncome
Fee-BasedIncome
OverheadExpenses &
Others
Pre-provisionOperating Profit
9-Month ‘07 operating profit up 38.0% from 9-Month ‘06
9-Month 2007
Notes :1. Fee based income excluding gain on sale & increasing value GB & securities 2. Overhead expenses + others excluding provisions
9-Month 2006
Rp billion
Up38.0%
1,883
7,477
4,383
4,977
Net InterestIncome
Fee-BasedIncome
OverheadExpenses &
Others
Pre-provisionOperating Profit
Rp billion
Excluding Non-recurring Q1
Interest Income
6,868

16
3,357
4,145
3,514
4,787
5,492
1,357
260
114
402 380241
2,021
2,072
1,651
4,232
5,6294,335
475
1,454
74
202
166
247
0
1,000
2,000
3,000
4,000
5,000
6,000
7,000
8,000
2000 2001 2002 2003 2004 2005 2006 9-Mo.'07
Gain on Sale/Value of Securities FX Gain Non-Recurring Interest Core Earnings
Pre
-Pro
visi
on O
per
ati
ng
Pro
fit
IDR bn
Nine-month core earnings up 33.0% to Rp5,629 billion
472 308 519 510290
602690
97 305
967
610 372
(410)
645799
819
775
(623)
1,027
1,168
1,549
1,744
1,113
1,329
1,300
1,0141,017
1,528
1,408
829
1,234
2000 2001 2002 2003 2004 2005 2006 2007
Q1 PAT Q2 PAT Q3 PAT Q4 PAT
8.1%
21.5%23.6%
10.0%
14.9%
22.8%
26.2%
2.5%
RoE - After Tax(Annualized)
Core Earnings Profit After Tax & ROE
17
Operating Performance
Highlights

18
Recap: Leveraging leadership in cash generating businesses to build emerging and future growth engines
Commercial Banking
Building Future Growth Engine
Leveraging on Our Cash Generator
Strengthen Emerging Business
11
33
Corporate & Treasury Consumer Finance & Micro/Retail Banking
22
Optimizing Synergies
Across Business Unit
Optimizing Synergies
Across Business Unit
Rp2,292 bnRp3,117 bn
Rp1,536 bnContribution Margin (Net Profit Before Tax)
19
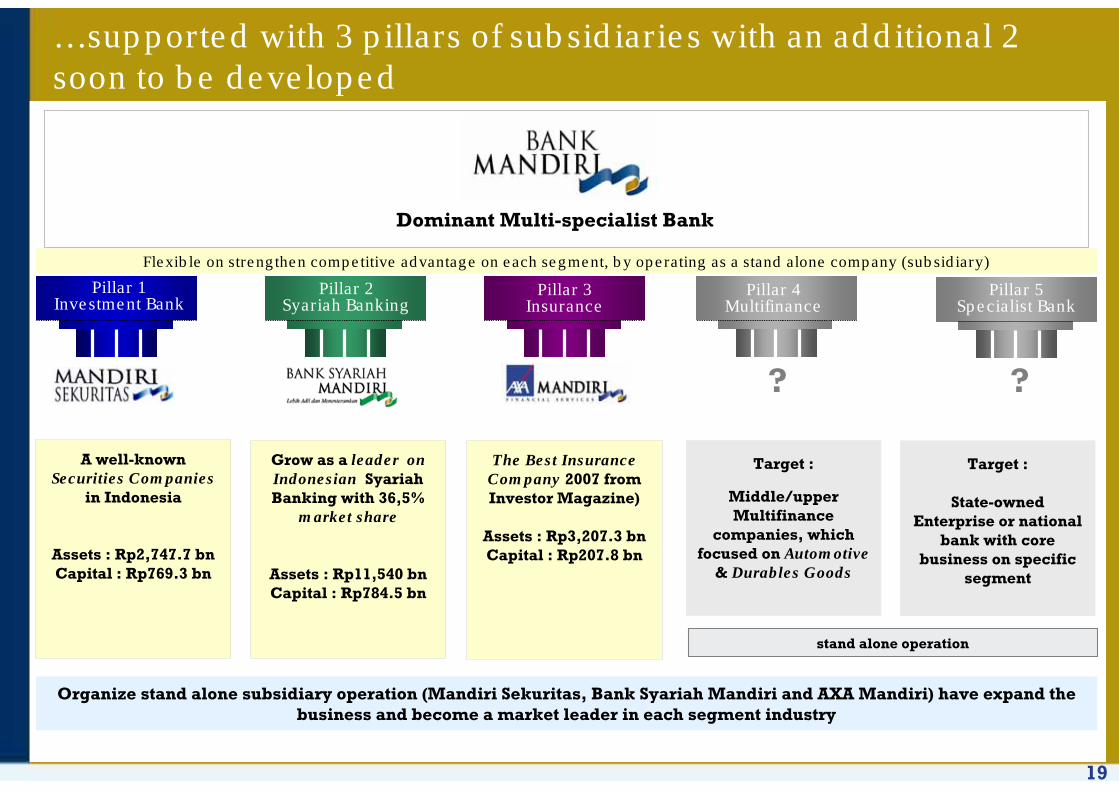
…supported with 3 pillars of subsidiaries with an additional 2 soon to be developed
Organize stand alone subsidiary operation (Mandiri Sekuritas, Bank Syariah Mandiri and AXA Mandiri) have expand the business and become a market leader in each segment industry
Dominant Multi-specialist Bank
A well-known Securities Companies
in Indonesia
Assets : Rp2,747.7 bnCapital : Rp769.3 bn
Target :
Middle/upper Multifinance
companies, which focused on Automotive
& Durables Goods
Grow as a leader on Indonesian Syariah Banking with 36,5%
market share
Assets : Rp11,540 bnCapital : Rp784.5 bn
The Best Insurance Company 2007 from Investor Magazine)
Assets : Rp3,207.3 bnCapital : Rp207.8 bn
Target :
State-owned Enterprise or national
bank with core business on specific
segment
stand alone operation
Flexible on strengthen competitive advantage on each segment, by operating as a stand alone company (subsidiary)
Pillar 1Investment Bank
Pillar 2Syariah Banking
Pillar 3Insurance
Pillar 4Multifinance
Pillar 5Specialist Bank
? ?
20
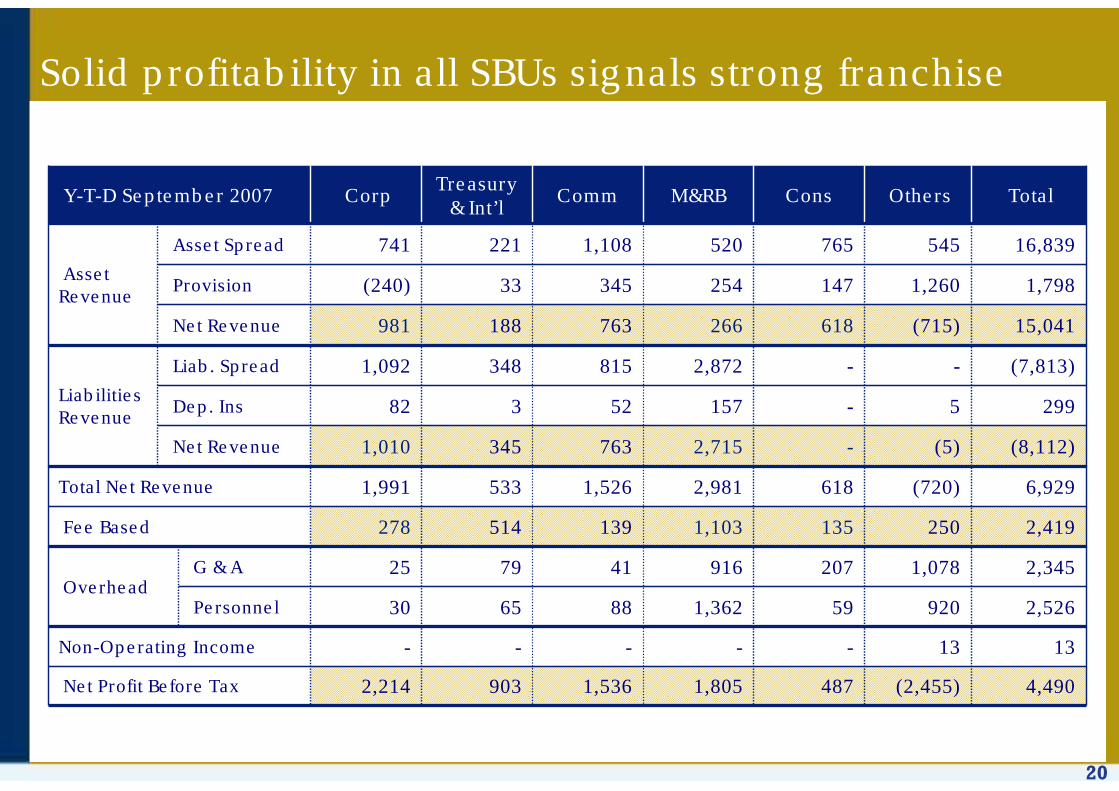
Solid profitability in all SBUs signals strong franchise
1313-----Non-Operating Income
903
65
79
514
533
345
3
348
188
33
221
Treasury & Int’l
Total Others ConsM&RBCommCorpY-T-D September 2007
4,490(2,455)4871,8051,5362,214Net Profit Before Tax
2,3451,0782079164125G & A Overhead
2,526920591,3628830Personnel
2,4192501351,103139278Fee Based
(8,112)(5)-2,7157631,010Net Revenue
6,929(720)6182,9811,5261,991Total Net Revenue
(7,813)--2,8728151,092Liab. Spread
Liabilities Revenue 2995-1575282Dep. Ins
15,041(715)618266763981Net Revenue
1,7981,260147254345(240)Provision
16,8395457655201,108741Asset Spread
Asset Revenue

21
533
1,991
1,526
2,981
618 720
6,929
Corporate Treasury &Int'l
Commercial Micro & Retail ConsumerFinance
Others, Incl.SAM
Profit BeforeTax
Rp billion
SBU YTD 3Q ‘07 Revenues
Future businesses together generated largest revenues
903
2,214
1,536
1,805
487
2,455
4,490
Corporate Treasury &Int'l
Commercial Micro &Retail
ConsumerFinance
Others, Incl.SAM
Profit BeforeTax
SBU YTD 3Q ‘07 Earning Before Tax
22
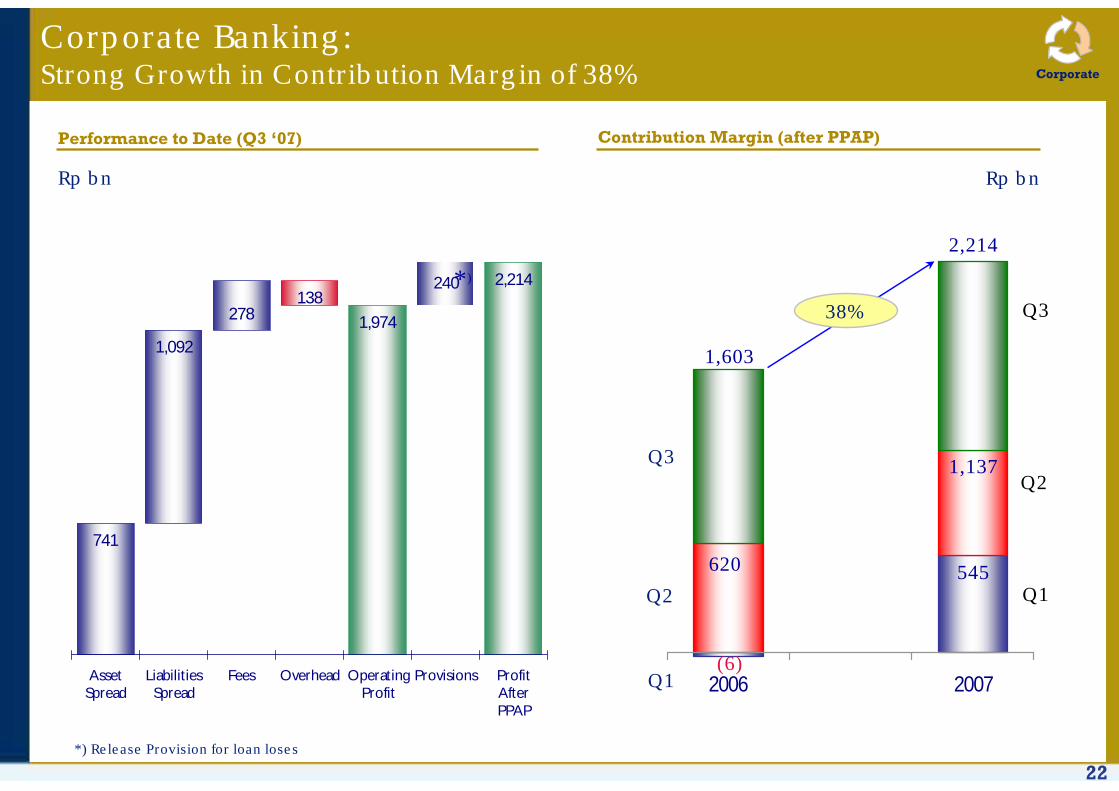
1,092
741
278138
1,974
240 2,214
AssetSpread
LiabilitiesSpread
Fees Overhead OperatingProfit
Provisions ProfitAfterPPAP
Corporate Banking:Strong Growth in Contribution Margin of 38%
Performance to Date (Q3 ‘07) Contribution Margin (after PPAP)
2006 2007
38%
Rp bn Rp bn
620
1,603
1,137
2,214
(6)
545Q2
Q3
Q1
Q2
Q3
Q1
*)
*) Release Provision for loan loses
Corporate
23
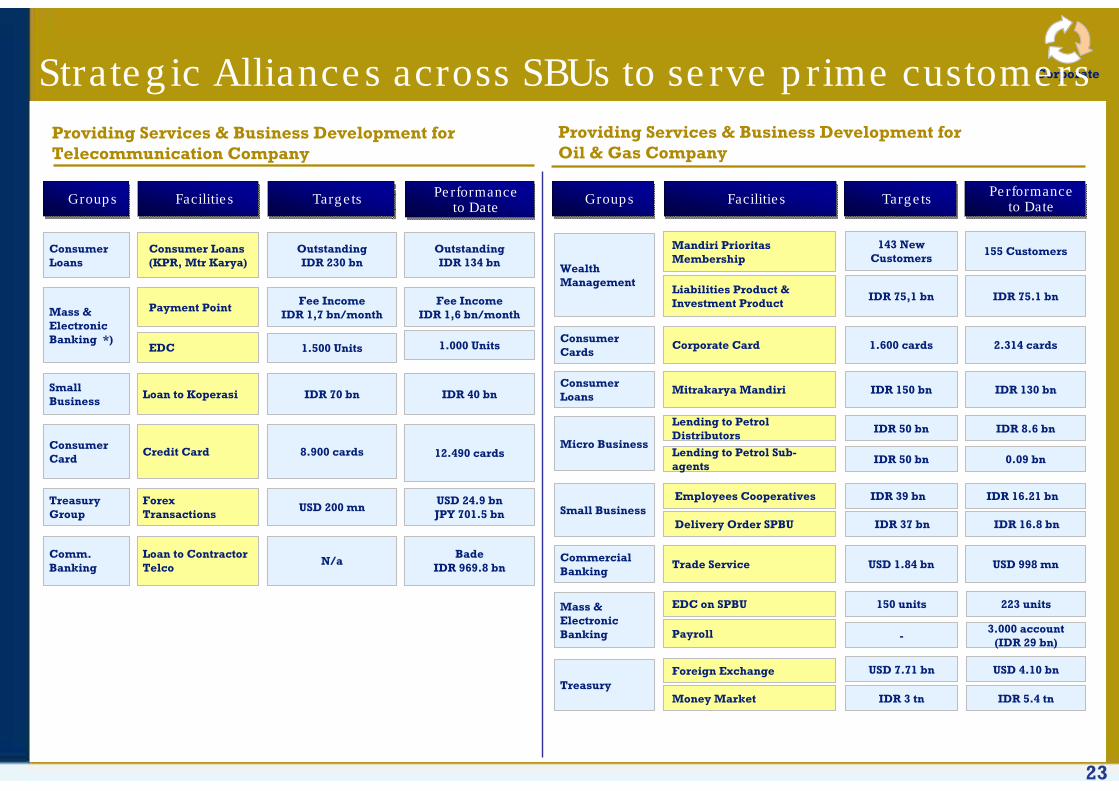
CorporateStrategic Alliances across SBUs to serve prime customers
GroupsGroups FacilitiesFacilities TargetsTargets
Small Business
Consumer Loans
Mass & Electronic Banking *)
Consumer Loans (KPR, Mtr Karya)
Outstanding IDR 230 bn
Payment PointFee Income
IDR 1,7 bn/month
EDC 1.500 Units
Consumer Card
Credit Card
Treasury Group
ForexTransactions
Loan to Koperasi IDR 70 bn
8.900 cards
USD 200 mn
Providing Services & Business Development for Telecommunication Company
Micro Business
Consumer Loans
Consumer Cards
Wealth Management
Small Business
Commercial Banking
Mass & Electronic Banking
GroupsGroups FacilitiesFacilities
Mandiri Prioritas Membership
Corporate Card
Mitrakarya Mandiri
TargetsTargets
IDR 150 bn
1.600 cards
143 New Customers
Liabilities Product & Investment Product
IDR 75,1 bn
Lending to Petrol Distributors
Lending to Petrol Sub-agents
IDR 50 bn
IDR 50 bn
Employees Cooperatives
Delivery Order SPBU
IDR 39 bn
IDR 37 bn
Trade Service USD 1.84 bn
EDC on SPBU 150 units
Providing Services & Business Development forOil & Gas Company
TreasuryForeign Exchange USD 7.71 bn
Money Market IDR 3 tn
OutstandingIDR 134 bn
Fee IncomeIDR 1,6 bn/month
1.000 Units
IDR 40 bn
12.490 cards
USD 24.9 bnJPY 701.5 bn
Performance to Date
Performance to Date
Performance to Date
Performance to Date
IDR 130 bn
2.314 cards
155 Customers
IDR 75.1 bn
IDR 8.6 bn
0.09 bn
IDR 16.21 bn
IDR 16.8 bn
USD 998 mn
223 units
USD 4.10 bn
IDR 5.4 tn
Comm. Banking
Loan to ContractorTelco
N/aBade
IDR 969.8 bn
Payroll -3.000 account
(IDR 29 bn)
24
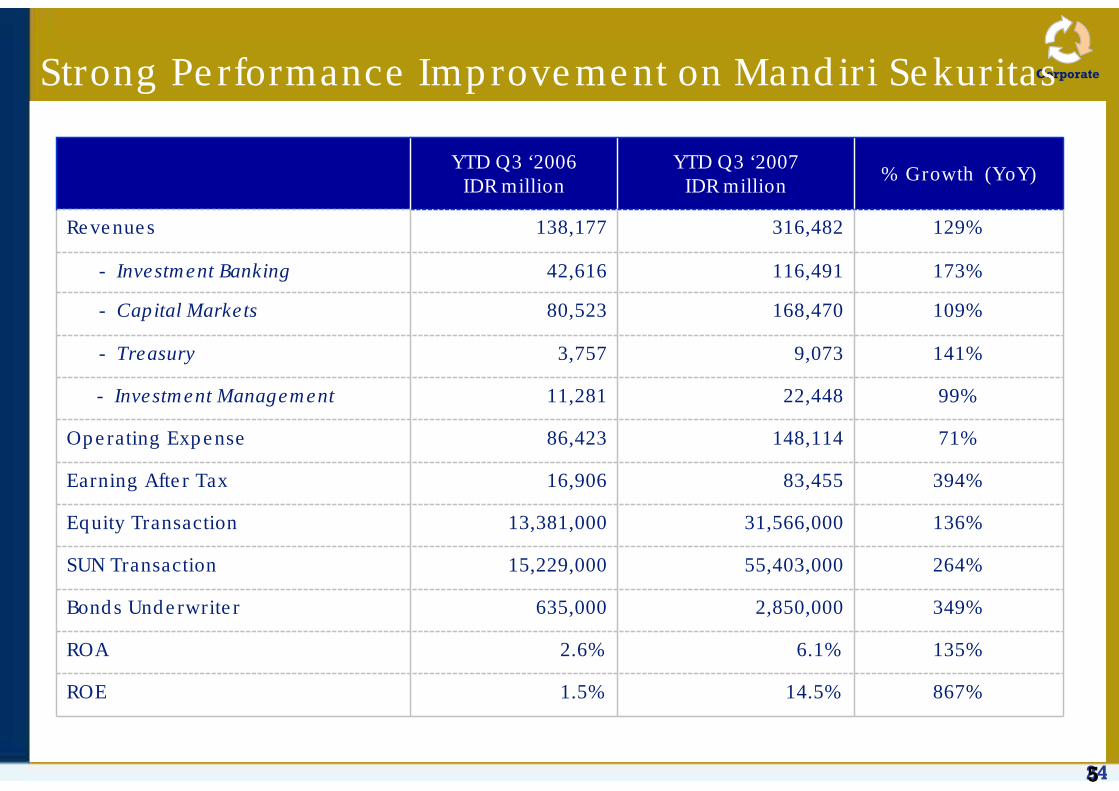
CorporateStrong Performance Improvement on Mandiri Sekuritas
867%14.5%1.5%ROE
135%6.1%2.6%ROA
349%2,850,000635,000Bonds Underwriter
264%55,403,00015,229,000SUN Transaction
136%31,566,00013,381,000Equity Transaction
394%83,45516,906Earning After Tax
71%148,11486,423Operating Expense
99%22,44811,281- Investment Management
141%9,0733,757- Treasury
109%168,47080,523- Capital Markets
173%116,49142,616- Investment Banking
129%316,482138,177Revenues
% Growth (YoY)YTD Q3 ‘2007
IDR millionYTD Q3 ‘2006
IDR million
5

25
Performance to Date (Q3 ‘07)
Rp bn
Treasury & International Banking:Significant fee income generator for the bank
(%)
221
348
514
936
33
903
144
AssetsSpread
LiabilitiesSpread
Fee Based Overhead OperatingProfit
Provision ProfitBefore
Tax
Custody Fees; 5.1%
Subsidiaries; 10.1%
Forex36.0%
Fixed Income*;
27.4%
Transfer Fees; 5.4%
Others; 16.0%
*Earning on Securities Sales & changes in value
Breakdown of Treasury & International Fee-Based Income (%)
Treasury
26
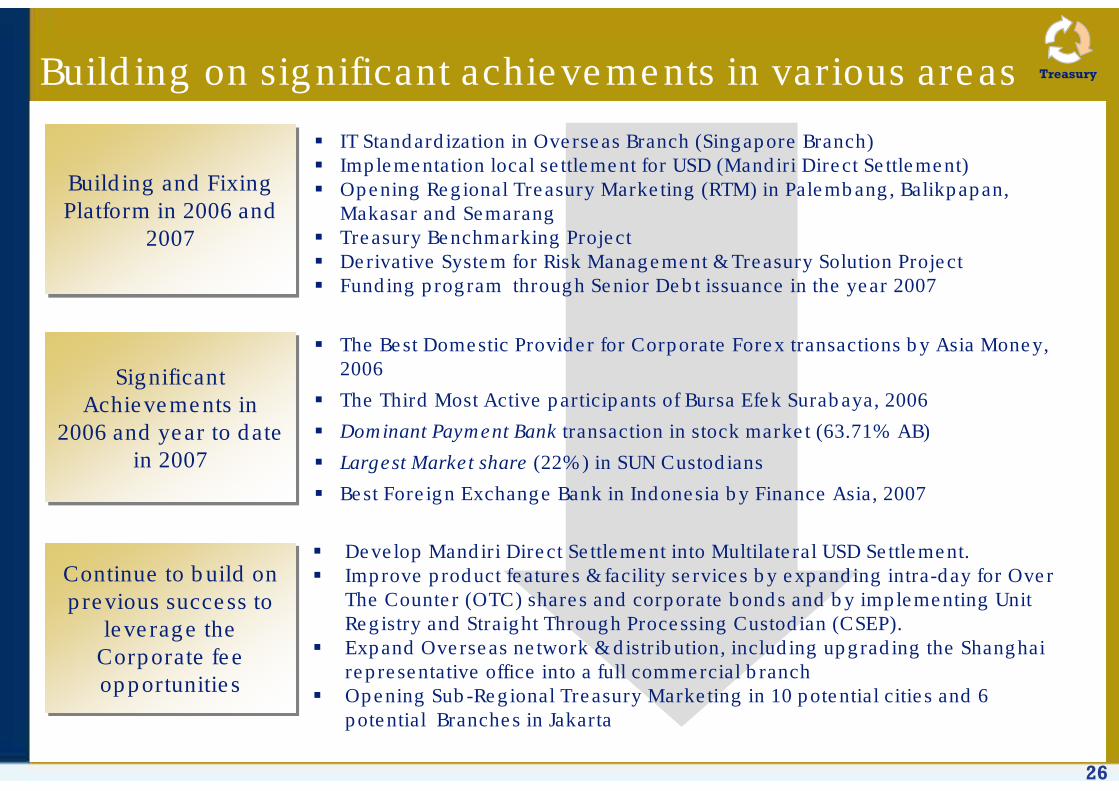
Building on significant achievements in various areas
IT Standardization in Overseas Branch (Singapore Branch) Implementation local settlement for USD (Mandiri Direct Settlement)Opening Regional Treasury Marketing (RTM) in Palembang, Balikpapan, Makasar and Semarang Treasury Benchmarking Project Derivative System for Risk Management & Treasury Solution ProjectFunding program through Senior Debt issuance in the year 2007
Building and Fixing Platform in 2006 and
2007
Building and Fixing Platform in 2006 and
2007
Significant Achievements in
2006 and year to date in 2007
Significant Achievements in
2006 and year to date in 2007
Continue to build on previous success to
leverage the Corporate fee opportunities
Continue to build on previous success to
leverage the Corporate fee opportunities
Develop Mandiri Direct Settlement into Multilateral USD Settlement.Improve product features & facility services by expanding intra-day for Over The Counter (OTC) shares and corporate bonds and by implementing Unit Registry and Straight Through Processing Custodian (CSEP).Expand Overseas network & distribution, including upgrading the Shanghai representative office into a full commercial branchOpening Sub-Regional Treasury Marketing in 10 potential cities and 6 potential Branches in Jakarta
The Best Domestic Provider for Corporate Forex transactions by Asia Money, 2006
The Third Most Active participants of Bursa Efek Surabaya, 2006
Dominant Payment Bank transaction in stock market (63.71% AB)
Largest Market share (22%) in SUN Custodians
Best Foreign Exchange Bank in Indonesia by Finance Asia, 2007
Treasury
27
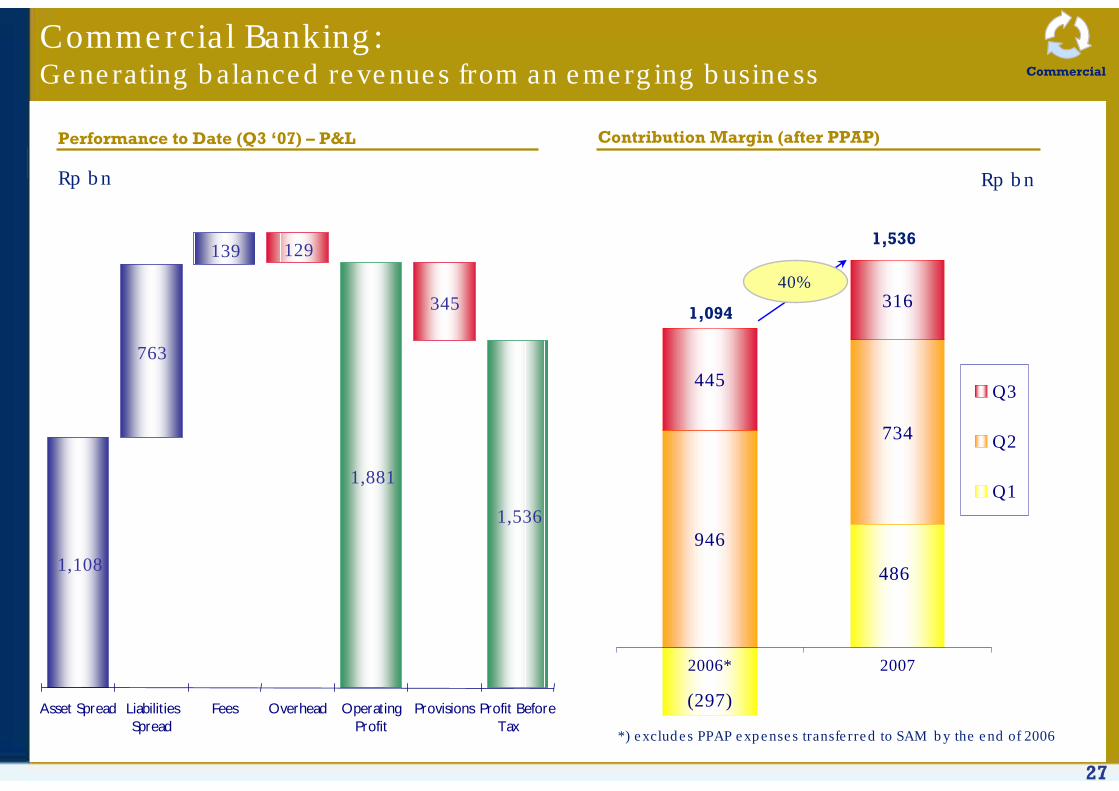
946
734
445
316
486
(297)
2006* 2007
Q3
Q2
Q1
Performance to Date (Q3 ‘07) – P&L Contribution Margin (after PPAP)
Commercial Banking:Generating balanced revenues from an emerging business
Rp bn
1,108
763
139 129
1,881
345
1,536
Asset Spread LiabilitiesSpread
Fees Overhead OperatingProfit
Provisions Profit BeforeTax
*) excludes PPAP expenses transferred to SAM by the end of 2006
40%
Rp bn
1,094
1,536
Commercial
28
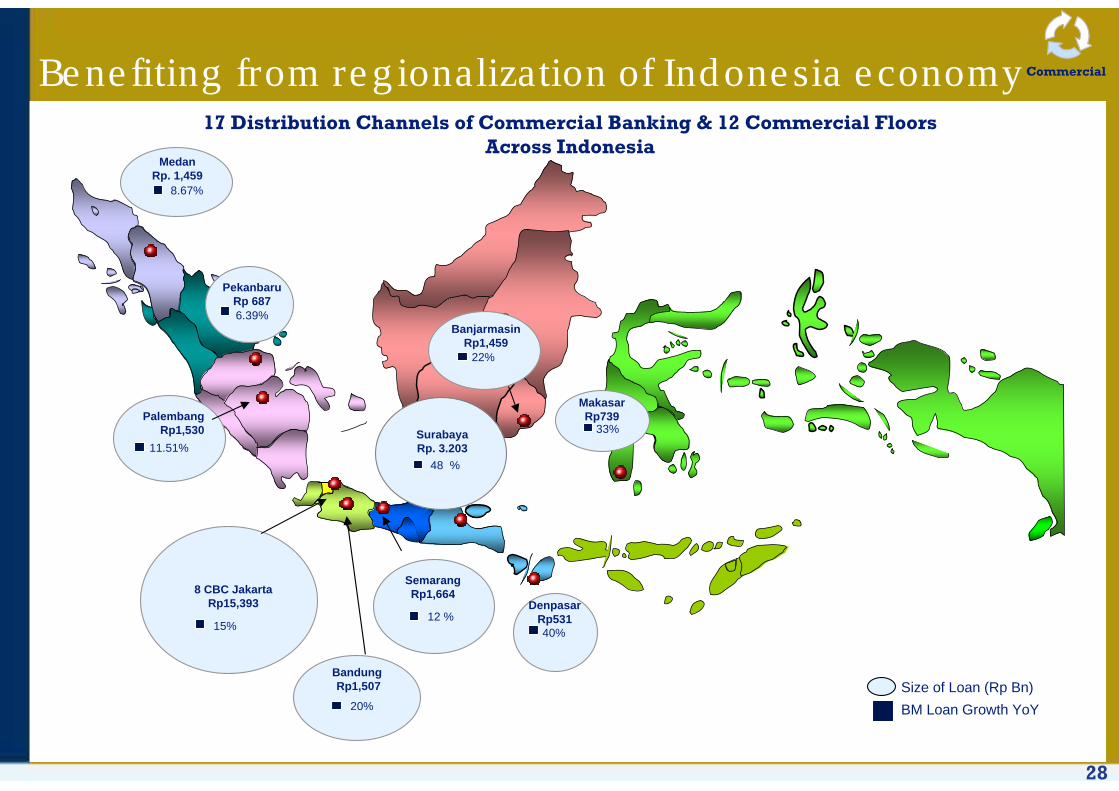
Benefiting from regionalization of Indonesia economy
MedanRp. 1,459
8.67%
PekanbaruRp 6876.39%
Palembang Rp1,530
11.51%
8 CBC JakartaRp15,393
15%
Bandung Rp1,507
20%
SemarangRp1,664
12 %
SurabayaRp. 3.203
48 %
DenpasarRp53140%
BanjarmasinRp1,459
22%
MakasarRp739
33%
BM Loan Growth YoYSize of Loan (Rp Bn)
17 Distribution Channels of Commercial Banking & 12 Commercial FloorsAcross Indonesia
Commercial
29
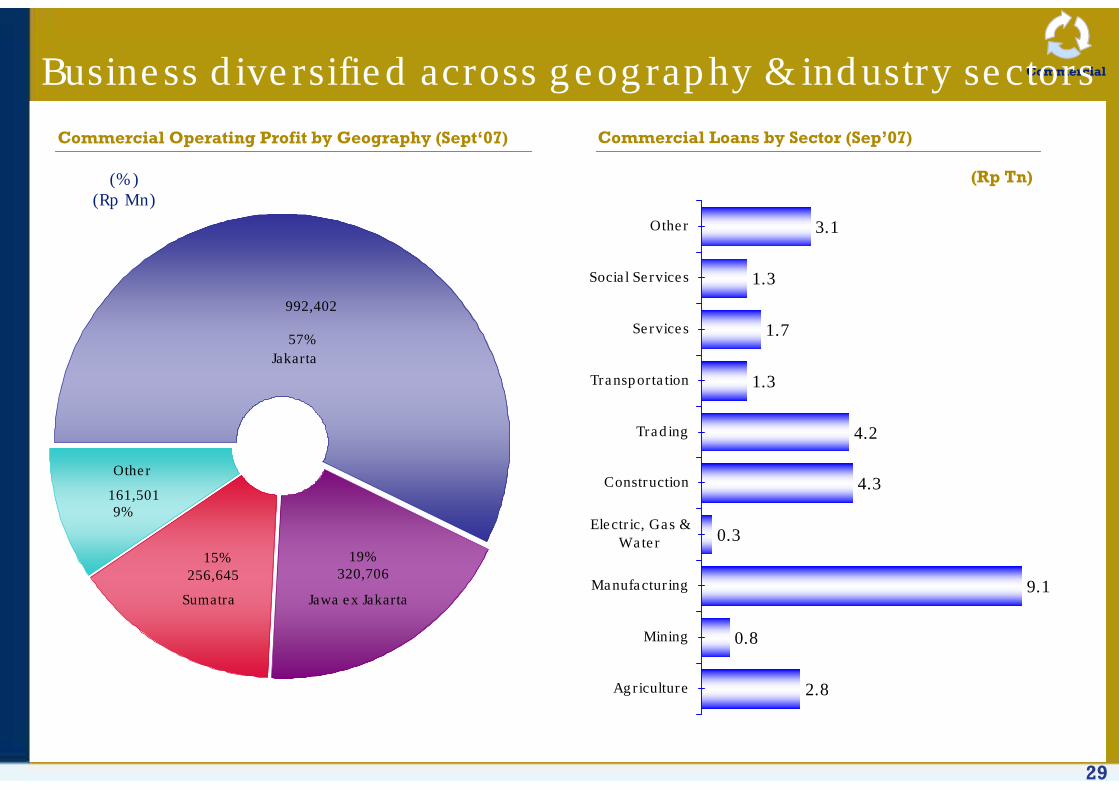
CommercialBusiness diversified across geography & industry sectors
Commercial Operating Profit by Geography (Sept‘07) Commercial Loans by Sector (Sep’07)
(Rp Tn)
2.8
0.8
9.1
0.3
4.3
4.2
1.3
1.7
1.3
3.1
Agriculture
Mining
Manufacturing
Electric, Gas &Water
Construction
Trading
Transportation
Services
Social Services
Other
(%)(Rp Mn)
161,501
256,645
992,402
320,706
Jakarta
Other
Sumatra Jawa ex Jakarta
57%
19%15%
9%

30
Trade Finance Volume Trend(IDR Mn)
Trade Finance and Cash Management Growth
Cash Management Usage Trend (Number of User)
Significant Growth Low Cost FundingTrend Checking Account
(IDR Bn)
17,994
12,680
Q3/06 Q3/07
24,27130,361
21,006
30,1245,113
8,344
3,973
5,089
Q3/06 Q3/07
SKBDN Issued
SKBDN Received
Import
Export
2,048
673
Q3' 06 Q3 '07
42%
204%
Significant Non-Credit Achievement
54,363
73,918
36%
Commercial

31
Micro & Retail Banking:Solid growth in profitability driven by improving liabilities spread
Performance to Date (Q3 ‘07) Contribution Margin (after PPAP)
Rp bn Rp bn
* Includes Deposit Insurance
74%
1,805
2542,059
2,435
1,103
520
2,872
AssetSpread
LiabilitiesSpread
Fees Overhead* OperatingProfit
Provisions ProfitBefore Tax
440573
293
740305
491
2006 2007
1.038
1.804
Q2
Q3
Q1
Q2
Q3
Q1
Micro Retail

32
Building a strong savings deposit franchise
18.0
22.1
29.6
40.5
52.0
49.5
47.8
44.2
45.2
41.8
44.7
46.6
57.6
57.2
65.762.5
11.0%
29.2%
22.7%
30.6% 32.9%
16.0%17.5%
11.6%
17.2%17.6%
Q4 '00
Q4 '01
Q4 '02
Q4 '03
Q4 '04
Q1 '05
Q2 '05
Q3 '05
Q4 '05
Q1 '06
Q2 '06
Q3 '06
Q4 '06
Q1 '07
Q2 '07
Q3 '07
Savings Deposits (Rp tn)As % of Total DepositsNational Share of Savings Deposits (%)
Savings Deposit Growth
Micro Retail
Transaction channel growth
492.1
521.8
554.9
576.6
607.5
627.6
665.7
710.2
677.0
706.3
759.6
816.2
Avg ATM Daily Vol (000) Withdrawal/Inquiry Transfer Payment Other
5,056
6,988
7,364
8,233
10,142
11,435
12,140
11,813
14,487679
1,0161,0101,0231,083
1,0861,0531,175
1,4721,7221,4851,833
106
3,808
3,230
3,0721,069
2,057
27
Q4 '00
Q4 '01
Q4 '02
Q4 '03
Q4 '04
Q1 '05
Q2 '05
Q3 '05
Q4 '05
Q1 '06
Q2 '06
Q3 '06
Q4 '06
Q1 '07
Q2 '07
Q3 '07
Quarterly Call Center Trans. (000)Quarterly SMS Trans. (000)

33
297
657
297
Q3 2006 Growth Q3 2007
7,047
8,805
1758
Q3 2006 Growth Q3 2007
1,0541,232
178
Q3 2006 Growth Q3 2007
Focus on growing high yield small & micro loans
Micro Credits(Rp Bn)
Cooperative Credits(Rp Bn)
LoanYields 13.4% 26.3%
25%
17%
14.2%
121%
Small Credits(Rp Bn)
Micro Retail

35
487
147
634
266
765
135
Asset Spread Fees Overhead OperatingProfit
Provisions Profit BeforeTax
Performance to Date* (Q3 ‘07) Contribution Margin (after PPAP)
90
173
164
143 150
100
2006 2007
Rp bn Rp bn
Consumer Finance:Significant growth in spread and fee income
* Excluding BSM
46%
Q1
Q2
Q3
333
487
Q1
Q2
Q3
ConsumerFinance
36
328
1,921
1,918
1,932
1,938
1,906
1,996
2,165
2,285
2,427
2,789815494
816
727
653688
1,522
1,996
2,591
4,501
3,663
3,610
3,574
3,452
3,250
2,885
3,050
3,865
283
2,852
3,567
3,390
3,404
3,522
3,666
3,867
3,979
4,033
4,131
4,223
4,217
1,930
2,644
1,802
1,270
1,206
1,257
1,6781,426
1,358
1,293
1,231
1,241
1,279
1,367
1,354
888
792
876
959
1,544
1,039
1,017
1,102
0
2,000
4,000
6,000
8,000
10,000
12,000
14,000
Q4 '03
Q4 '04
Q1 '05
Q2 '05
Q3 '05
Q4 '05
Q1 '06
Q2 '06
Q3 '06
Q4 '06
Q1 '07
Q2 '07
Q3 '07
OtherCash Collateral LoansCredit CardsPayroll LoansHome Equity LoansMortgages
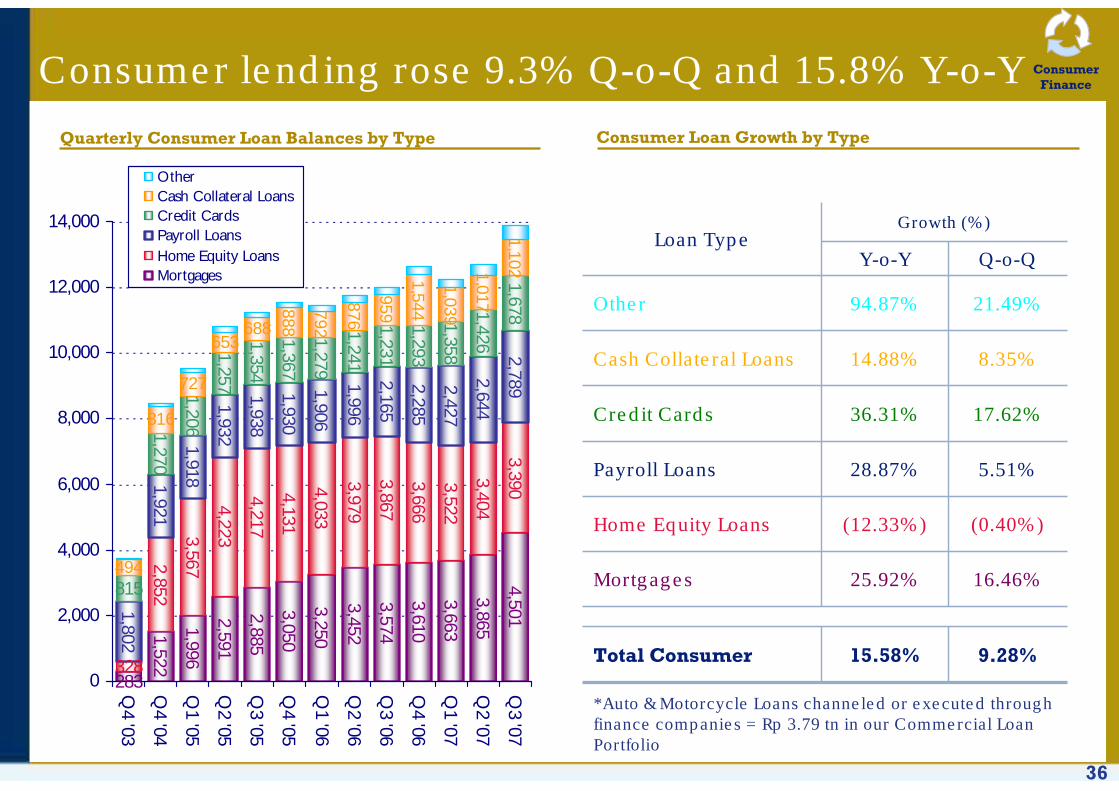
Consumer lending rose 9.3% Q-o-Q and 15.8% Y-o-Y
8.35%14.88%Cash Collateral Loans
17.62%36.31%Credit Cards
5.51%28.87%Payroll Loans
(0.40%)(12.33%)Home Equity Loans
16.46%25.92%Mortgages
Growth (%)
Q-o-QY-o-Y
15.58%
94.87% 21.49%Other
Total Consumer
Loan Type
9.28%
*Auto & Motorcycle Loans channeled or executed through finance companies = Rp 3.79 tn in our Commercial Loan Portfolio
Quarterly Consumer Loan Balances by Type Consumer Loan Growth by Type
ConsumerFinance
37
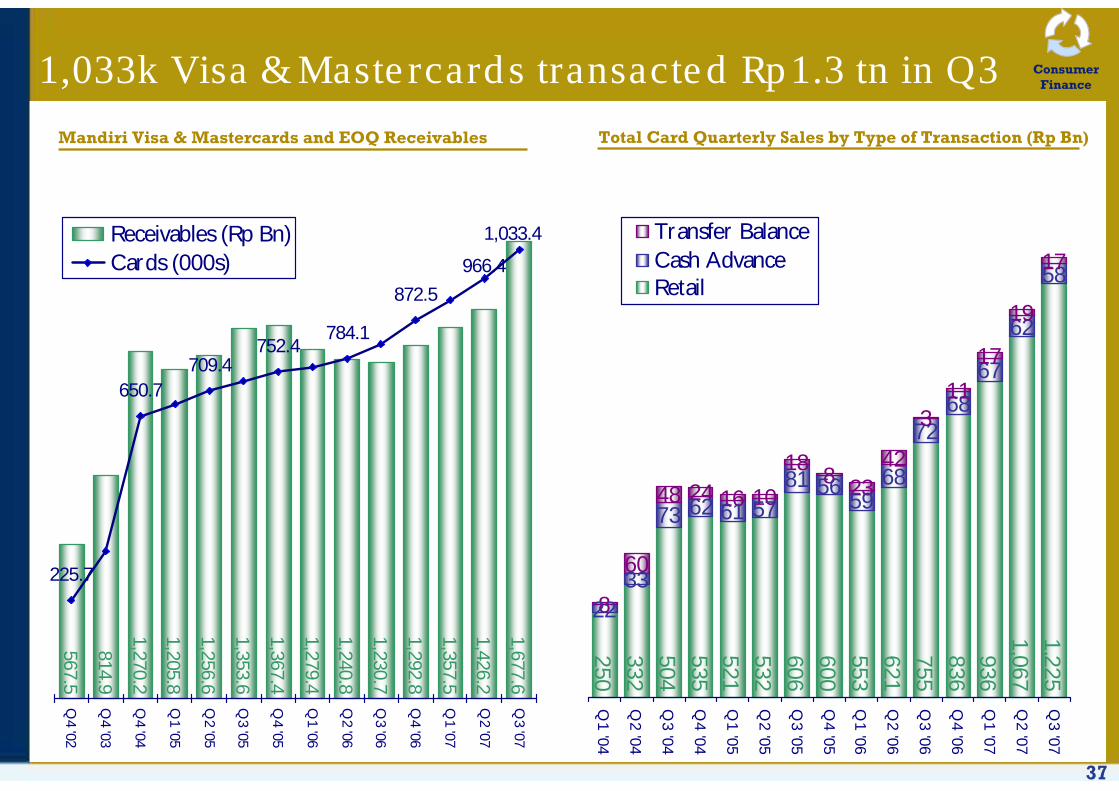
1,033k Visa & Mastercards transacted Rp1.3 tn in Q3
Mandiri Visa & Mastercards and EOQ Receivables
1,426.2
1,677.6
1,357.5
1,292.8
1,230.7
1,279.4
1,367.4
1,205.8
567.5
814.9
1,270.2
1,256.6
1,353.6
1,240.8
966.4
784.1
225.7
650.7709.4
752.4
872.5
1,033.4
Q4 '02
Q4 '03
Q4 '04
Q1 '05
Q2 '05
Q3 '05
Q4 '05
Q1 '06
Q2 '06
Q3 '06
Q4 '06
Q1 '07
Q2 '07
Q3 '07
Receivables (Rp Bn)Cards (000s)
250332504535521532606600553621755836936
1,0671,225
68
7268
67
62
58
8
60
48 24 16 10
18 8 2342
311
17
19
17
59576173
3322
6281 56
Q1 '04
Q2 '04
Q3 '04
Q4 '04
Q1 '05
Q2 '05
Q3 '05
Q4 '05
Q1 '06
Q2 '06
Q3 '06
Q4 '06
Q1 '07
Q2 '07
Q3 '07
Transfer BalanceCash AdvanceRetail
Total Card Quarterly Sales by Type of Transaction (Rp Bn)
ConsumerFinance
38
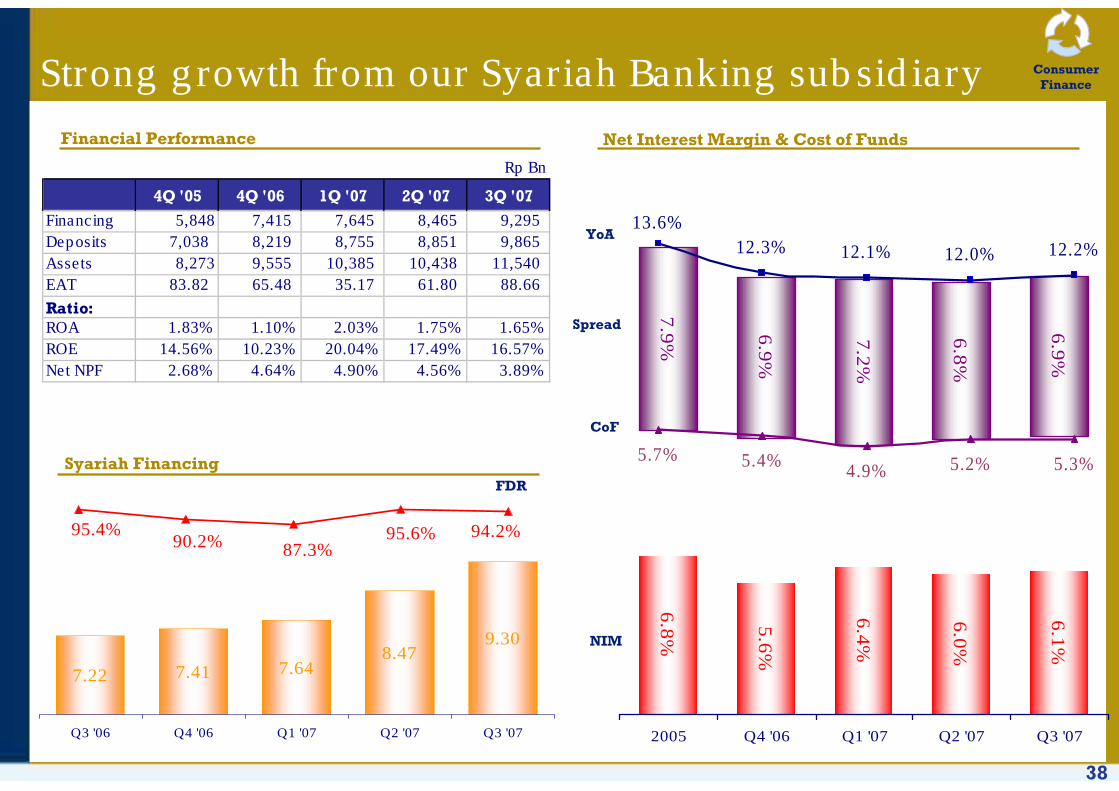
6.8%
5.6%
6.4%
6.0%
6.1%
7.9% 6.9%
7.2%
6.8%
6.9%
2005 Q4 '06 Q1 '07 Q2 '07 Q3 '07
13.6%12.3% 12.1% 12.0% 12.2%
5.7% 5.4% 4.9% 5.2% 5.3%
Strong growth from our Syariah Banking subsidiary
7.41 7.648.47
9.30
7.22
Q3 '06 Q4 '06 Q1 '07 Q2 '07 Q3 '07
94.2%95.6%87.3%90.2%
95.4%
Syariah FinancingFDR
Net Interest Margin & Cost of Funds
YoA
Spread
CoF
NIM
Financial Performance
Rp Bn
4Q '05 4Q '06 1Q '07 2Q '07 3Q '07
Financing 5,848 7,415 7,645 8,465 9,295 Deposits 7,038 8,219 8,755 8,851 9,865 Assets 8,273 9,555 10,385 10,438 11,540 EAT 83.82 65.48 35.17 61.80 88.66
Ratio:ROA 1.83% 1.10% 2.03% 1.75% 1.65%ROE 14.56% 10.23% 20.04% 17.49% 16.57%Net NPF 2.68% 4.64% 4.90% 4.56% 3.89%
ConsumerFinance
39
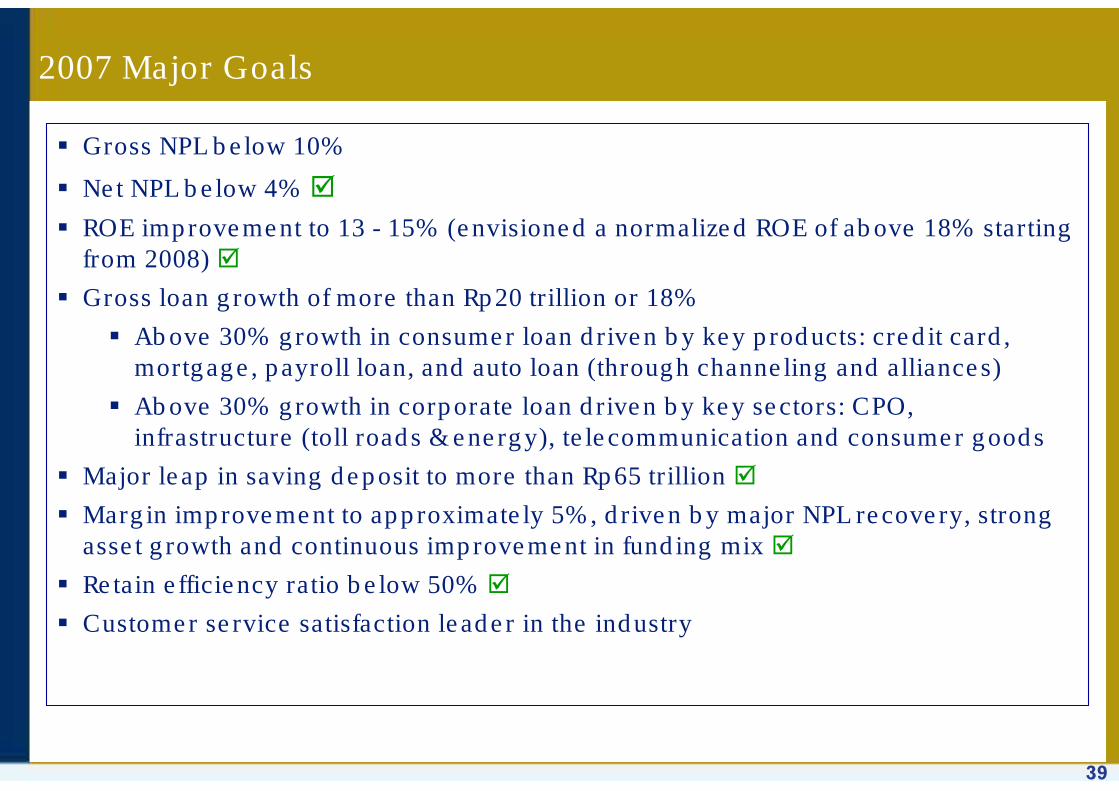
2007 Major Goals
Gross NPL below 10%
Net NPL below 4%
ROE improvement to 13 - 15% (envisioned a normalized ROE of above 18% starting from 2008)
Gross loan growth of more than Rp20 trillion or 18%
Above 30% growth in consumer loan driven by key products: credit card, mortgage, payroll loan, and auto loan (through channeling and alliances)
Above 30% growth in corporate loan driven by key sectors: CPO, infrastructure (toll roads & energy), telecommunication and consumer goods
Major leap in saving deposit to more than Rp65 trillion
Margin improvement to approximately 5%, driven by major NPL recovery, strong asset growth and continuous improvement in funding mix
Retain efficiency ratio below 50%
Customer service satisfaction leader in the industry

40
Supporting Materials

41
23.00%25.30%25.40%Total CAR(2)
1,201
58.0
24.80%
19.70%
49.50%
24.60%
55.90%
4.60%
46.80%
6.60%
0.90%
24,381
194,473
253,713
91,534
108,796
Q3 ‘06
12.74%
12.07%
14.98%
8.03%
7.88%
(0.18%)
11.90%
YoY Change (%)
1,354
152.0
22.40%
18.79%
87.80%
12.40%
57.90%
5.70%
43.10%
15.50%
2.30%
28,033
210,096
273,714
90,791
121,738
Q3 ‘07
26,341 Total Equity
57.20%LDR
24.63%Total CAR incl. Market Risk
19.63%Tier 1 CAR(2)
73.67%Provisions / NPLs
48.77%Cost to Income(1)
9.95%RoE – after tax (p.a.)
1.09%RoA - before tax (p.a.)
1,297 Book Value/Share (Rp)
119 EPS (Rp)
16.60%Gross NPL / Total Loans
4.70%NIM (p.a.)
205,708 Customer Deposits
267,517 Total Assets
90,648 Government Bonds
117,671 Gross Loans
FY 2006IDR billion / %
Key Quarterly Balance Sheet Items & Financial Ratios
(1) (G&A and employee expenses) / (Net Interest Income + Other Operating Income), excluding bond gains(2) Bank only – Not including Market Risk

42
Summary P&L Information – 9-Months ‘06 vs. ‘07
21.7%0.1%202 0.1%166 Gain from Increase in Value & Sale of Bonds
(50.0%)0.0%13 0.0%26 Non Operating Income
20.2%(0.3%)(523)(0.2%)(435)Other Operating Expenses**
154.5%2.3%4,578 0.9%1,799 Net Income Before Tax
8.2%(1.2%)(2,419)(1.2%)(2,235)G & A Expenses
29.4%(1.4%)(2,780)(1.1%)(2,148)Personnel Expenses
(32.5%)(1.0%)(1,982)(1.5%)(2,938)Provisions, Net
165.6%1.6%3,153 0.6%1,187 Net Income After Tax
157.5%2.3%4,565 0.9%1,773 Profit from Operations
26.6%1.2%2,383 1.0%1,883 Other Operating Income
29.5%4.8%9,684 3.9%7,477 Net Interest Income
(32.9%)(4.1%)(8,290)(6.4%)(12,350)Interest Expense
(9.3%)9.0%17,974 10.3%19,827 Interest Income
(%)% of Av.Assets
Rp (Billions)% of
Av.Assets*Rp (Billions)
YoY Change9-Months 20079-Months 2006
* % of Average Assets on an annualized basis** primarily premiums paid under the blanket guarantee scheme
43
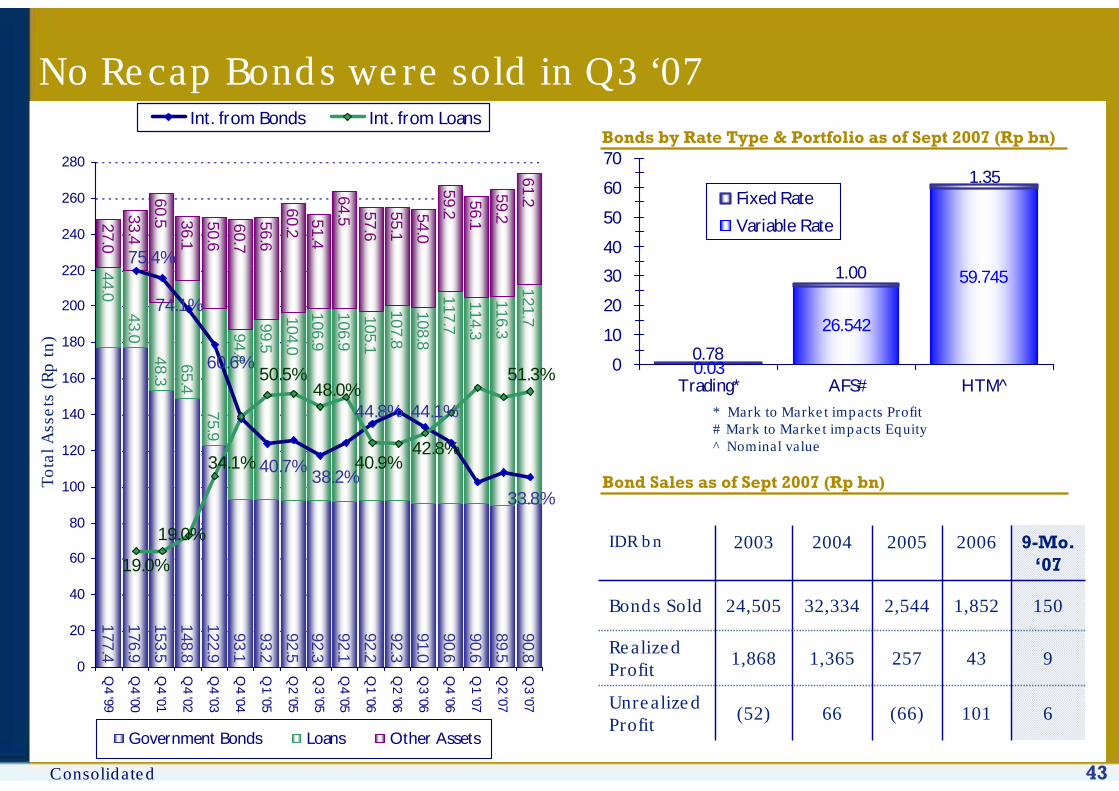
No Recap Bonds were sold in Q3 ‘07
Bond Sales as of Sept 2007 (Rp bn)
101
43
1,852
2006
(66)
257
2,544
2005
6
9
150
9-Mo. ‘07
66
1,365
32,334
2004
1,868Realized Profit
Unrealized Profit
Bonds Sold
IDR bn
(52)
24,505
2003
* Mark to Market impacts Profit# Mark to Market impacts Equity^ Nominal value
26.542
59.745
0.03
1.35
0.78
1.00
0
10
20
30
40
50
60
70
Trading* AFS# HTM^
Fixed Rate
Variable Rate
Bonds by Rate Type & Portfolio as of Sept 2007 (Rp bn)
177.4
176.9
153.5
148.8
122.9
93.1
93.2
92.560.2
51.4
64.5 57.6
55.1
54.0
59.2
56.1
59.2
61.2
92.3
92.1
92.2
92.3
91.0
90.8
89.5
90.6
90.6
44.0
43.0
65.4
75.9
94.4
99.5
104.0
106.9
106.9
105.1
107.8
48.3
114.3
117.7
108.8
116.3
121.7
56.6
60.7
50.6
36.1
60.533.4
27.0
0
20
40
60
80
100
120
140
160
180
200
220
240
260
280
Q4 '99
Q4 '00
Q4 '01
Q4 '02
Q4 '03
Q4 '04
Q1 '05
Q2 '05
Q3 '05
Q4 '05
Q1 '06
Q2 '06
Q3 '06
Q4 '06
Q1 '07
Q2 '07
Q3 '07
Government Bonds Loans Other Assets
44.1%44.8%
38.2%40.7%
60.6%
74.1%
75.4%
33.8%
42.8%
19.0%
19.0%
34.1%
50.5%48.0%
40.9%
51.3%
Int. from Bonds Int. from Loans
To
tal A
sse
ts (
Rp
tn)
Consolidated

44
42.6
58.1
72.5
91.9
108.9
114.1
115.9
117.5
115.9
110.7
110.7
110.4
112.2
107.9
113.1
121.5
25.5
27.5
30.4
27.5
27.8
27.4
27.9
27.8
28.1
28.4
29.3
28.4
27.9
17.0
15.4
13.3Q
4 '00
Q4 '01
Q4 '02
Q4 '03
Q4 '04
Q1 '05
Q2 '05
Q3 '05
Q4 '05
Q1 '06
Q2 '06
Q3 '06
Q4 '06
Q1 '07
Q2 '07
Q3 '07
RWA (Rp tn) Total Capital (Rp tn)
31.3%
23.4%
26.6%27.1%
23.0%
25.3% 25.2% 25.1%
CARBI Min Req
CAR fell to 23.0% on a 7.4% gain in risk-weighted assets
45
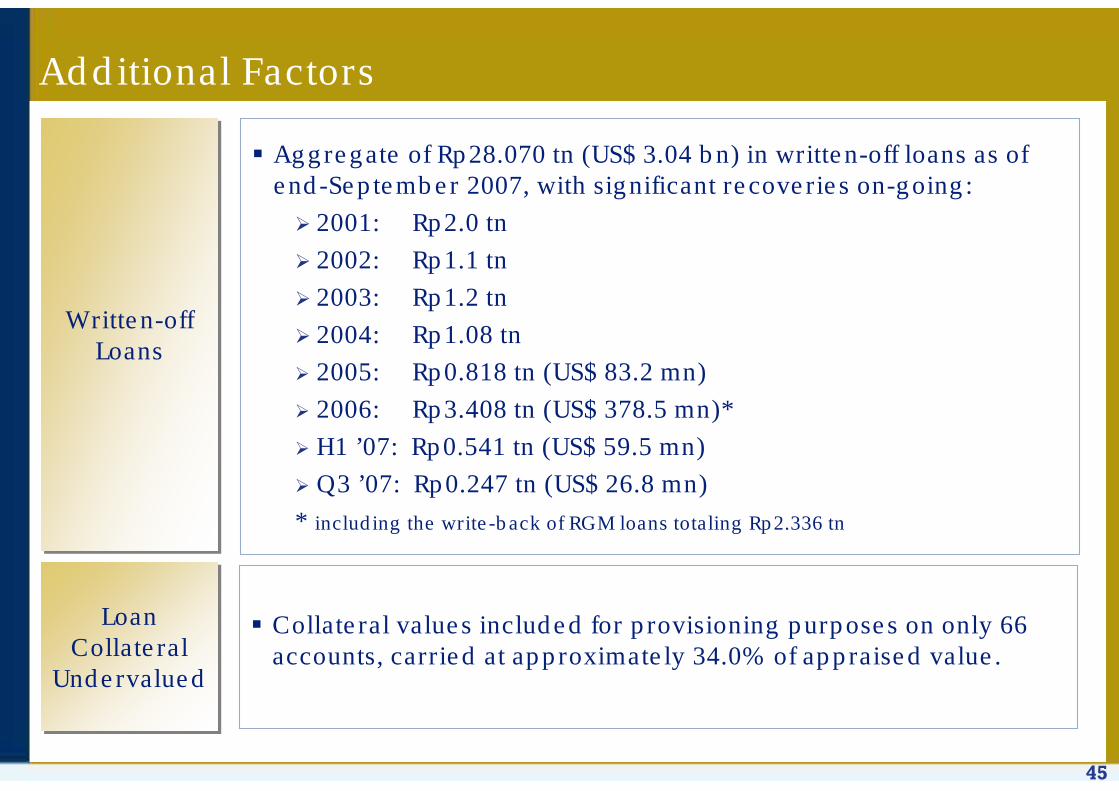
Additional Factors
Written-off Loans
Written-off Loans
Aggregate of Rp28.070 tn (US$ 3.04 bn) in written-off loans as of end-September 2007, with significant recoveries on-going:
2001: Rp2.0 tn
2002: Rp1.1 tn
2003: Rp1.2 tn
2004: Rp1.08 tn
2005: Rp0.818 tn (US$ 83.2 mn)
2006: Rp3.408 tn (US$ 378.5 mn)*
H1 ’07: Rp0.541 tn (US$ 59.5 mn)
Q3 ’07: Rp0.247 tn (US$ 26.8 mn)
* including the write-back of RGM loans totaling Rp2.336 tn
Loan Collateral
Undervalued
Loan Collateral
Undervalued
Collateral values included for provisioning purposes on only 66 accounts, carried at approximately 34.0% of appraised value.
46
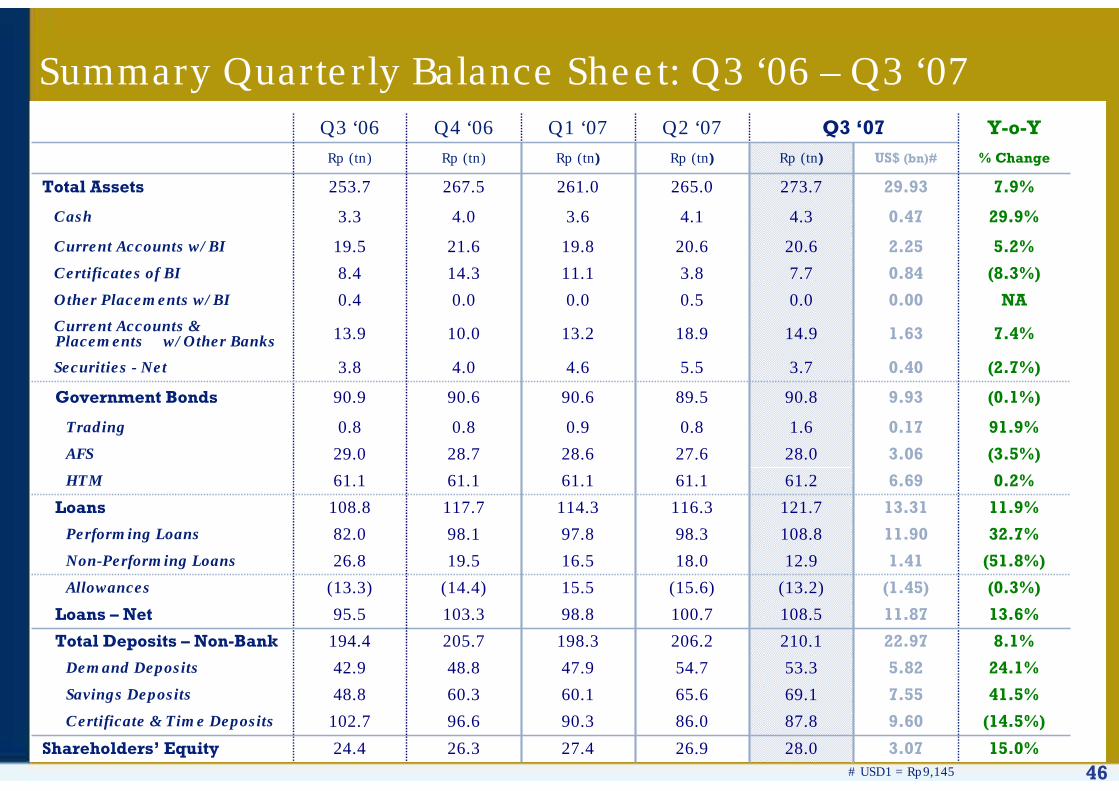
Summary Quarterly Balance Sheet: Q3 ‘06 – Q3 ‘07
27.4
90.3
60.1
47.9
198.3
98.8
15.5
16.5
97.8
114.3
61.1
28.6
0.9
90.6
4.6
13.2
0.0
11.1
19.8
3.6
261.0
Rp (tn)
Q1 ‘07
26.3
96.6
60.3
48.8
205.7
103.3
(14.4)
19.5
98.1
117.7
61.1
28.7
0.8
90.6
4.0
10.0
0.0
14.3
21.6
4.0
267.5
Rp (tn)
Q4 ‘06
(8.3%)0.847.73.88.4 Certificates of BI
5.2%2.2520.620.619.5 Current Accounts w/BI
29.9%0.474.34.13.3 Cash
26.9
86.0
65.6
54.7
206.2
100.7
(15.6)
18.0
98.3
116.3
61.1
27.6
0.8
89.5
5.5
18.9
0.5
265.0
Rp (tn)
Q2 ‘07
28.0
87.8
69.1
53.3
210.1
108.5
(13.2)
12.9
108.8
121.7
61.2
28.0
1.6
90.8
3.7
14.9
0.0
273.7
Rp (tn)
Q3 ‘07
15.0%3.0724.4 Shareholders’ Equity
(14.5%)9.60102.7 Certificate & Time Deposits
41.5%7.5548.8 Savings Deposits
24.1%5.8242.9 Demand Deposits
8.1%22.97194.4 Total Deposits – Non-Bank
(51.8%)1.4126.8 Non-Performing Loans
11.9%13.31108.8 Loans
(0.3%)(1.45)(13.3)Allowances
0.2%6.6961.1 HTM
(3.5%)3.0629.0 AFS
(0.1%)9.9390.9 Government Bonds
13.6%11.8795.5 Loans – Net
32.7%11.9082.0 Performing Loans
91.9%0.170.8 Trading
(2.7%)0.403.8 Securities - Net
7.4%1.6313.9 Current Accounts & Placements w/Other Banks
NA0.000.4 Other Placements w/BI
7.9%29.93253.7 Total Assets
% ChangeUS$ (bn)#Rp (tn)
Y-o-YQ3 ‘06
# USD1 = Rp9,145

47
Summary P&L Information – Q3 2007
0.6%
1.0%
0.0%
0.9%
(0.2%)
(1.3%)
(1.1%)
(1.7%)
0.1%
1.1%
4.1%
(6.2%)
10.3%
% of Av.Assets
*
372
621
24
597
(151)
(810)
(709)
(1,112)
70
682
2,627
(3,934)
6,561
Rp (Billions)
Q3 2006
(115.6%)(0.05%)(33)0.3%211 Gain from Increase in Value & Sale of Bonds
N/A0.0%(2)0.0%6 Non Operating Income
(1.7%)(0.3%)(178)(0.3%)(181)Other Operating Expenses**
(6.6%)2.2%1,497 2.4%1,602 Net Income Before Tax
28.5%(1.4%)(961)(1.1%)(748)G & A Expenses
13.7%(1.6%)(1,056)(1.4%)(929)Personnel Expenses
(72.5%)(0.2%)(126)(0.7%)(458)Provisions, Net
(9.1%)1.5%1,013 1.7%1,114 Net Income After Tax
(6.1%)2.2%1,499 2.4%1,596 Profit from Operations
6.6%1.3%861 1.2%808 Other Operating Income
3.4%4.4%2,992 4.4%2,893 Net Interest Income
(1.3%)(3.9%)(2,647)(4.1%)(2,681)Interest Expense
1.2%8.4%5,639 8.5%5,574 Interest Income
(%)% of Av.Assets
Rp (Billions)
% of Av.Assets
*Rp (Billions)
Q-o-Q Change
Q3 2007Q2 2007
* % of Average Assets on an annualized basis** primarily premiums paid under the blanket guarantee scheme

48
Trading AFS HTM MtM Trading AFS HTMFixed Rate
FR0002 15-Jun-09 14.00% 68 - - 109.099 74 - - FR0010 15-Mar-10 13.15% - - 1,350,000 100.000 - - 1,350,000 FR0014 15-Nov-10 15.58% - 2,947 - 118.798 - 3,501 - FR0015 15-Feb-11 13.14% 30,000 - - 113.610 34,083 - - FR0016 15-Aug-11 13.45% - 30,000 - 115.114 - 34,534 - FR0017 15-Jan-12 13.15% 10,000 - - 115.013 11,501 - - FR0019 15-Jun-13 14.25% 20,000 231,028 - 122.813 24,563 283,732 - FR0020 15-Dec-13 14.28% 553,538 548,491 - 124.225 687,633 681,363 -
613,606 812,466 1,350,000 757,854 1,003,131 1,350,000 Variable Rate
VR0013 25-Jan-08 8.10% - 738,384 - 100.173 - 739,661 - VR0017 25-Jun-11 7.83% 30,000 298,270 - 100.224 30,067 298,938 - VR0019 25-Dec-14 7.83% - 5,050,000 1,114,300 99.949 - 5,047,425 1,114,300 VR0020 25-Apr-15 8.10% - 4,100,000 391,029 99.942 - 4,097,622 391,029 VR0021 25-Nov-15 7.83% - 2,400,000 690 99.891 - 2,397,384 690 VR0022 25-Mar-16 7.83% - 692,844 6,796,813 99.899 - 692,144 6,796,813 VR0023 25-Oct-16 8.10% - 659,738 4,086,068 99.842 - 658,696 4,086,068 VR0024 25-Feb-17 7.83% - - 8,210,550 100.000 - - 8,210,550 VR0025 25-Sep-17 7.83% - - 5,210,550 100.000 - - 5,210,550 VR0026 25-Jan-18 8.10% - - 3,475,267 100.000 - - 3,475,267 VR0027 25-Jul-18 8.10% - - 3,475,267 100.000 - - 3,475,267 VR0028 25-Aug-18 7.83% - 1,696,428 3,475,267 99.841 - 1,693,731 3,475,267 VR0029 25-Aug-19 7.83% - 5,344,421 3,475,267 99.791 - 5,333,251 3,475,267 VR0030 25-Dec-19 7.83% - - 8,016,765 100.000 - - 8,016,765 VR0031 25-Jul-20 8.10% - 5,597,343 12,016,765 99.742 - 5,582,902 12,016,765
30,000 26,577,428 59,744,598 30,067 26,541,754 59,744,598 643,606 27,389,894 61,094,598 787,921 27,544,885 61,094,598
0.72% 30.73% 68.55% 0.88% 30.80% 68.32%89,128,098 89,427,403 Total Fair Value
Interest Rate (%)
Series
Total Nominal Value
Sub-TotalGrand Total
Maturity Date
Nominal Fair Value
Recap Bond Portfolio Details, 30 Sept 2007 – Bank Only
(Stated in Rp Millions)

49
Bank Mandiri Credit Ratings
4Support Rating
DIndividual Rating
StableShort Term Outlook
BShort Term Local Currency Debt
idnAA
BB-
B+
B
BB-
Positive
Fitch
Ba3Subordinated Debt
NPBShort Term Foreign Currency Debt
idAA-BB-Long Term Local Currency Debt
Bank Mandiri Ratings
StableLong Term Local Currency Outlook
B2Long Term Bank Deposits
WRBB-Long Term Foreign Currency Debt
PositiveStableLong Term Foreign Currency Outlook
BNational Rating
D-Bank Financial Strength
PefindoMoody’sS&P
50
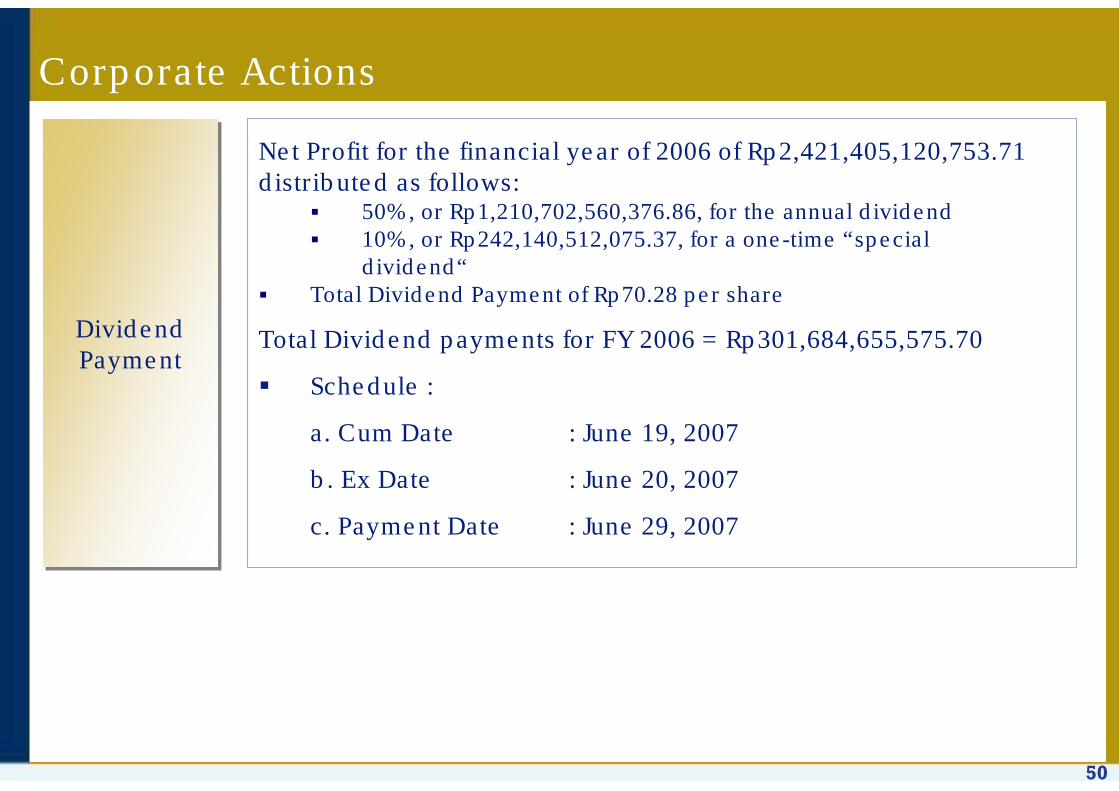
Corporate Actions
DividendPaymentDividendPayment
Net Profit for the financial year of 2006 of Rp2,421,405,120,753.71distributed as follows:
50%, or Rp1,210,702,560,376.86, for the annual dividend10%, or Rp242,140,512,075.37, for a one-time “special dividend“
Total Dividend Payment of Rp70.28 per share
Total Dividend payments for FY 2006 = Rp301,684,655,575.70
Schedule :
a. Cum Date : June 19, 2007
b. Ex Date : June 20, 2007
c. Payment Date : June 29, 2007
51
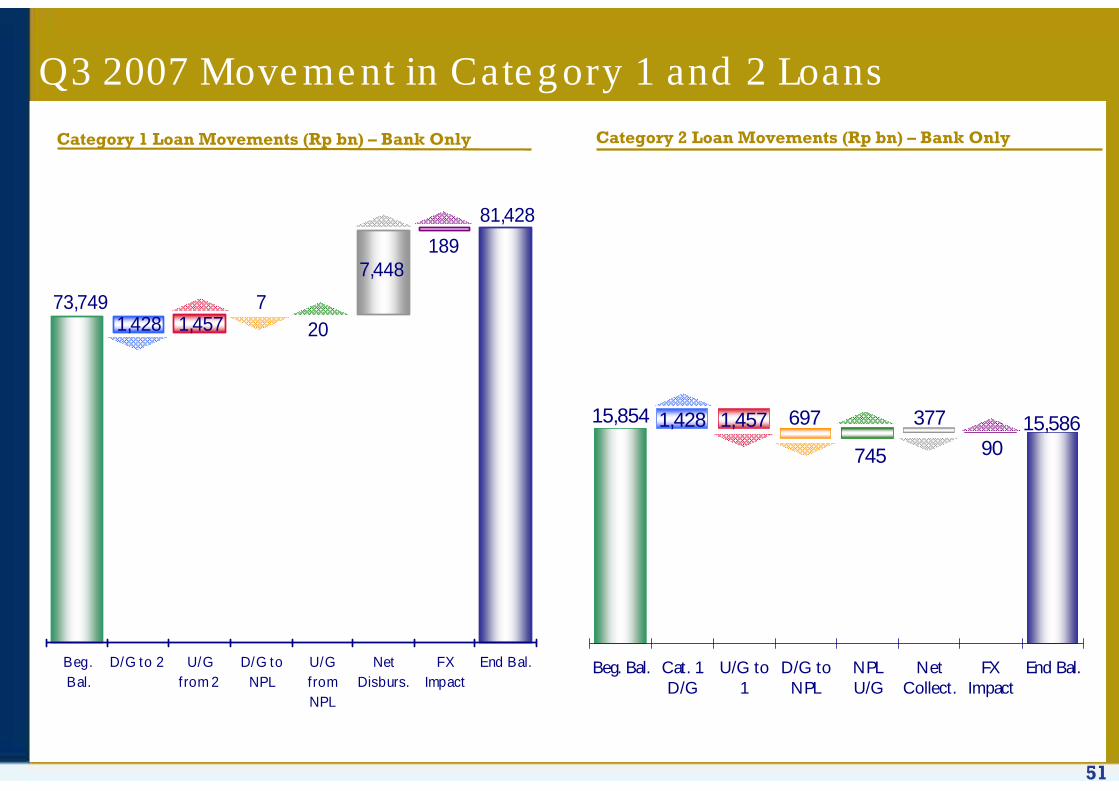
Q3 2007 Movement in Category 1 and 2 Loans
73,749
1897,448
207
1,4571,428
81,428
Beg.Bal.
D/G to 2 U/Gfrom 2
D/G toNPL
U/GfromNPL
NetDisburs.
FXImpact
End Bal.
Category 1 Loan Movements (Rp bn) – Bank Only Category 2 Loan Movements (Rp bn) – Bank Only
90
377
745
6971,4571,42815,854 15,586
Beg. Bal. Cat. 1D/G
U/G to1
D/G toNPL
NPLU/G
NetCollect.
FXImpact
End Bal.
52
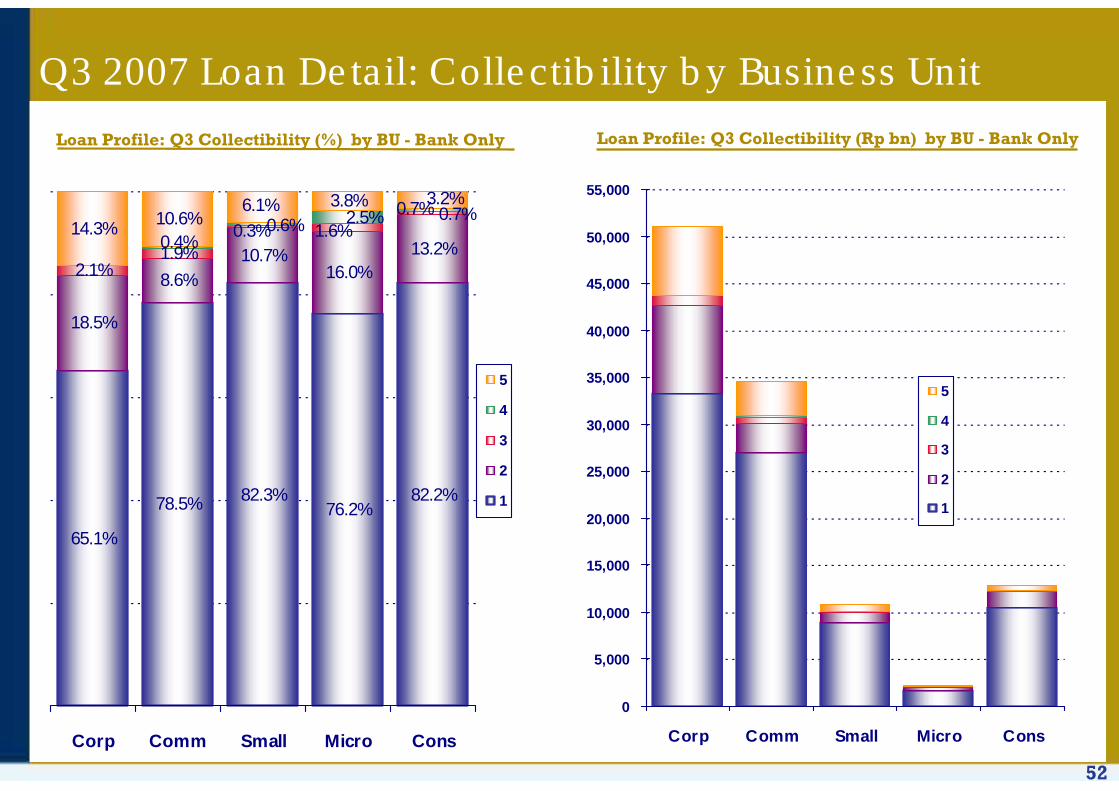
Q3 2007 Loan Detail: Collectibility by Business Unit
Loan Profile: Q3 Collectibility (%) by BU - Bank Only
65.1%
78.5% 82.3%76.2%
18.5%
8.6%10.7%
16.0%13.2%
2.1%1.9%
14.3% 10.6%3.8%
82.2%
0.3%0.7%
1.6%0.4%
0.6%0.7%2.5%
6.1% 3.2%
Corp Comm Small Micro Cons
5
4
3
2
1
0
5,000
10,000
15,000
20,000
25,000
30,000
35,000
40,000
45,000
50,000
55,000
Corp Comm Small Micro Cons
5
4
3
2
1
Loan Profile: Q3 Collectibility (Rp bn) by BU - Bank Only

53
NPL Loan Detail*: Quarterly by Interest Days Past Due
Quarterly D/G to NPL & Interest DPD - Bank Only
1,108
11,161
6,901
1,177
4,106
1,558
1,304
1,031
1,644
235
561
783
0
2,000
4,000
6,000
8,000
10,000
12,000
Q4'04
Q1'05
Q2'05
Q3'05
Q4'05
Q1'06
Q2'06
Q3'06
Q4'06
Q1'07
Q2'07
Q3'07
Rp Value
Quarterly NPL Stock & Interest DPD - Bank Only
Rp tn
6,334
17,456
24,962
24,193
26,248
26,424
25,665
25,414 17,960
13,603
16,500
17,180
0
5,000
10,000
15,000
20,000
25,000
30,000
Q4'04
Q1'05
Q2'05
Q3'05
Q4'05
Q1'06
Q2'06
Q3'06
Q4'06
Q1'07
Q2'07
Q3'07
Rp Value
* Excluding Micro & Consumer Loans Only
0%
10%
20%
30%
40%
50%
60%
70% Current (%)
<30 Days OD (%)
0%
10%
20%
30%
40%
50%
60%
70% Current (%)
<30 Days OD (%)

54
29,542
23,987
21,045
19,427
20,914
22,608
22,326
25,123
27,4232000A
ddD
educt2001A
ddD
educt2002A
ddD
educt2003A
ddD
educt2004A
ddD
educt2005A
ddD
educt2006A
ddD
eductH
1 '07A
ddD
eductQ
3 '07
Others#Write-OffsRepaymentsRestructuringBalance
Rp1,135 bn in loans were restructured in Q3 ’07
IDR bn
#Others includes partial payments, FX impacts, and fluctuation in Working Capital facilities
Loans by Restructuring Type in Q3 2007
LT loans w/convert.
option7%
Maturity extension
w/other restr'g*12%
Maturity extension w/reduced
rates23%
Maturity extension
58%
*Other Restructuring includes reduction of interest rates, rescheduling of unpaid interest & extension of repayment period for unpaid interest
Restructured Loan Movement 2000 - Q3 2007
570
1,135
Q3 ‘07
2,398
5,573
‘06
1,500
389
H1 ‘07
813
391
‘04
1,118NPL Collections
718Loans Restructured
‘05(Rp billions)

55
Mfg-Chem9.1%
Mfg-F&B9.3%
Oth11.6%
Trading-Ret4.7% Trans
5.1% Mfg-Text5.2%
Bus Serv5.3%
Mining5.4%
Agri11.5%
Mfg-Oth11.0%
Trading-Oth7.9%
Mfg-P&P6.4%
Constr7.7%
Agri
Mfg-Oth
Mfg-F&B
Mfg-Chem
Trading-Oth
Constr
Mfg-P&P
Mining
Bus Serv
Mfg-Text
Trans
Trading-Ret
Oth
Loan Portfolio Sector Analysis, Q3 2007
(1) Non-consolidated numbers* Each sector < 4%

56
0.6% were still current on interest payments while 1.6% were less than 30 days overdue
35.3% were Corporate borrowers and 31.1% came from our Commercial portfolio
52.7% were loans previously restructured
Largest downgrades by sector:
Non-Metal Manufacturing
Plantations
Business Services
88.9% were IDR loans
57.0% were Working Capital loans
96.5% were more than 90 days overdue in interest payments
Corp
Comm
Small
3
4
5
Mfg-NonM
Agri
Bus Serv
Constr
Trading-Ret
Trading-Oth
Mfg-Oth
Oth<5%
IDR
USD
WC
Program
Invest
Export
Other
Current< 30 Days61-90 Days
90+ Days
0%
10%
20%
30%
40%
50%
60%
70%
80%
90%
100%
GAS Collectibility Sector Currency Purpose Int. Aging
Q3 2007 Loan Detail*: Downgrades to NPL
* Excluding Micro & Consumer Loans Only
Corporate, Commercial & Small Business loans downgraded to NPL in Q3 totaled Rp783 billion (0.50% of total loans). Of these loans:
Loan Profile: Q3 Downgrades to NPL (Rp561 bn) - Bank Only
57
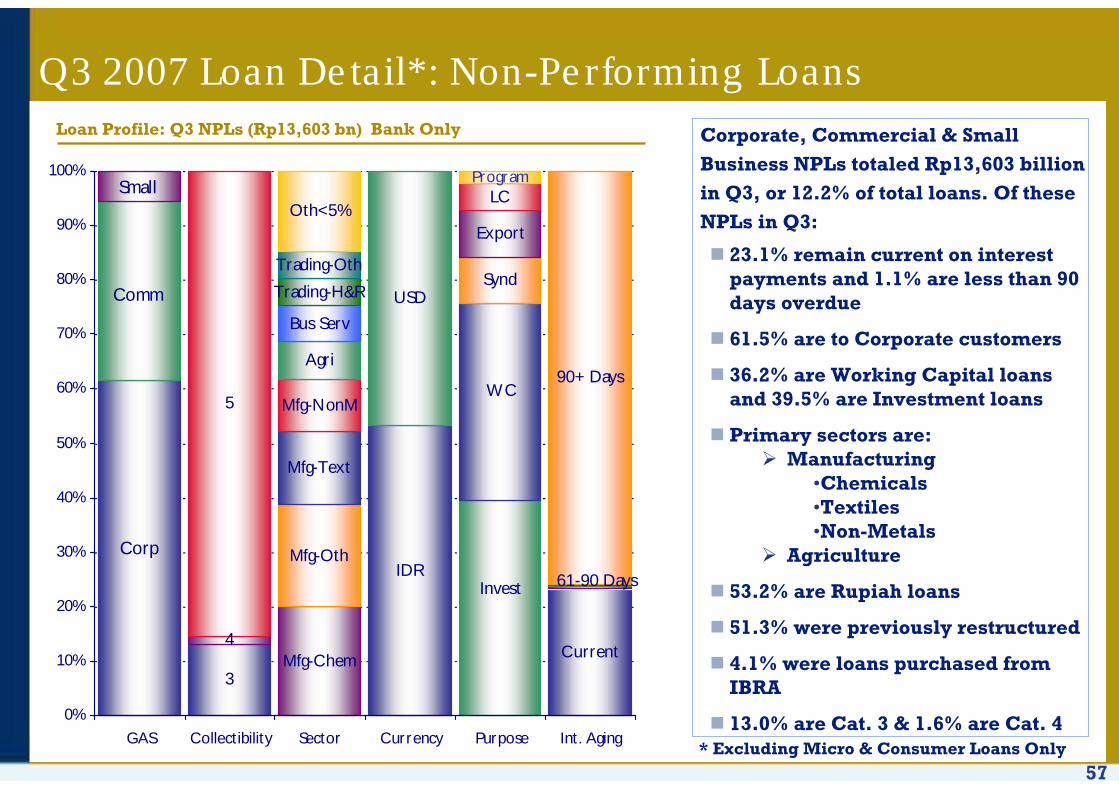
Q3 2007 Loan Detail*: Non-Performing LoansLoan Profile: Q3 NPLs (Rp13,603 bn) Bank Only
23.1% remain current on interest payments and 1.1% are less than 90 days overdue
61.5% are to Corporate customers
36.2% are Working Capital loans and 39.5% are Investment loans
Primary sectors are:Manufacturing
•Chemicals•Textiles•Non-Metals
Agriculture
53.2% are Rupiah loans
51.3% were previously restructured
4.1% were loans purchased from IBRA
13.0% are Cat. 3 & 1.6% are Cat. 4
Corporate, Commercial & Small Business NPLs totaled Rp13,603 billion in Q3, or 12.2% of total loans. Of these NPLs in Q3:
Corp
Comm
Small
3
4
5
Mfg-Chem
Mfg-Oth
Mfg-Text
Mfg-NonM
Agri
Bus Serv
Trading-H&R
Trading-Oth
Oth<5%
IDR
USD
Invest
WC
Synd
Export
LCProgram
Current
61-90 Days
90+ Days
0%
10%
20%
30%
40%
50%
60%
70%
80%
90%
100%
GAS Collectibility Sector Currency Purpose Int. Aging* Excluding Micro & Consumer Loans Only

58
Corp
Comm
Small
Current
1 Day
< 30
31-60
61+
Constr
Trading-Ret
Mfg-Oth
Trading-Oth
Mfg-F&B
Trading-Distr
Mining
Oth<5%
IDR
USDOther
WC
Invest
SyndOther
<2000
2000-2004
>2004
0%
10%
20%
30%
40%
50%
60%
70%
80%
90%
100%
GAS Int. Aging Sector Currency Purpose Origin Year
Q3 2007 Loan Detail*: New Downgrades to Category 2Loan Profile: Q3 Downgrades to Cat. 2 loans (Rp848 bn) - Bank Only
62.6% are for Commercial & 35.3% are to Small Business customers
47.0% are current & 1.1% are 1 day overdue
Primary sectors downgraded are:ConstructionRetail TradingF&B Manufacturing Distribution
92.7% are Rupiah loans
82.3% are Working Capital loans
4.9% are Restructured loans
Rp848 billion (0.8% of total loans) in Corporate, Commercial & Small Business loans were downgraded to Category 2 in Q3. Of the Special Mention Loans downgraded in Q3:
* Excluding Micro & Consumer Loans Only
59
Corp
Comm
Small
Current
1 Day
< 30
31-6061+
Mfg-P&P
Mfg-Text
Mfg-Oth
Constr
Trading
Mfg-Chem
Agri
Oth<5%
USD
IDR
Invest
WC
Synd
Other
<2000
2000-2004
>2004
New Bal.UG to PL
PL DG
PL NC
0%
10%
20%
30%
40%
50%
60%
70%
80%
90%
100%
GAS Days Aging Sector Currency Purpose OriginYear
Move.
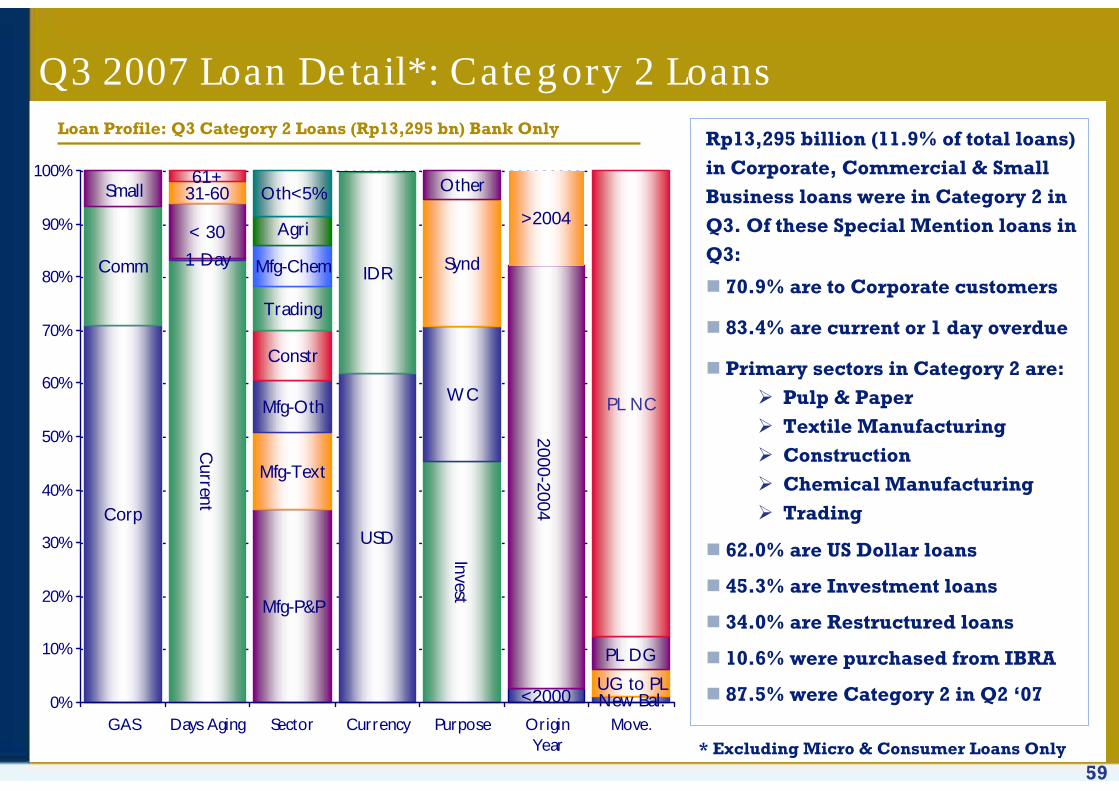
Q3 2007 Loan Detail*: Category 2 LoansLoan Profile: Q3 Category 2 Loans (Rp13,295 bn) Bank Only
70.9% are to Corporate customers
83.4% are current or 1 day overdue
Primary sectors in Category 2 are:Pulp & PaperTextile ManufacturingConstructionChemical Manufacturing Trading
62.0% are US Dollar loans
45.3% are Investment loans
34.0% are Restructured loans
10.6% were purchased from IBRA
87.5% were Category 2 in Q2 ‘07
Rp13,295 billion (11.9% of total loans) in Corporate, Commercial & Small Business loans were in Category 2 in Q3. Of these Special Mention loans in Q3:
* Excluding Micro & Consumer Loans Only

60
52.8% were to Corporate borrowers
70.3% originated between 2000 and 2004
3.9% were loans with no previous restructuring history
Largest upgrades by sector:
Textile Manufacturing
Hotels & Restaurants
Construction
54.0% were USD loans
45.2% were Investment loans
98.6% of upgrades to PL were NPLs moving to Category 2
Corp
Comm
Small
<2000
2000-2004
>2004
Mfg-Text
Trading-H&R
Constr-Oth
Simple Housing
Mfg-F&B
Oth<5%
USD
IDR
Invest
WC
Export
Other
1
2
0%
10%
20%
30%
40%
50%
60%
70%
80%
90%
100%
GAS Origin Year Sector Currency Purpose Collect.
Q3 2007 Loan Detail*: Upgrades to PL
* Excluding Micro & Consumer Loans Only
Corporate, Commercial & Small Business loans upgraded to PL in Q3 totaled Rp705 billion (0.6% of total loans). Of these loans:
Loan Profile: Q3 Upgrades to PL (Rp705 bn) - Bank Only

61
Corp
Comm
Small
<2000
2000-2004
>2004
Mfg-Oth
Agri
Mfg-F&B
Constr
Trading-Oth
Mfg-Chem
Mfg-P&P
Mining
Trans
Trading-Ret
Oth<5%
IDR
USD
WC
Invest.
Synd
Other
1
2
0%
10%
20%
30%
40%
50%
60%
70%
80%
90%
100%
GAS Origin Year Sector Currency Purpose Collect.
Q3 2006 Loan Detail*: Performing LoansLoan Profile: Q3 Performing Loans (Rp81,685 bn) Bank Only
52.3% are to Corporate customers & 36.8% are to Commercial customers52.4% originated since 200581.2% have no restructuring history 18.8% are Restructured loans2.1% were purchased from IBRAPrimary sectors are:
F&B ManufacturingAgricultureConstructionChemical Manufacturing
64.5% are Rupiah loans47.6% are Working Capital loans86.4% saw no change in collectibility0.9% were upgraded from NPL
Rp81,685 billion (73.3% of total loans) in Corporate, Commercial & Small Business loans were performing in Q3. Of these performing loans in Q3:
* Excluding Micro & Consumer Loans Only

62
1
2
3
4
5
Current
90+
Mfg-Oth
Mfg-P&P
Mfg-Text
Mfg-Chem
Constr
Agri
Trading
Mfg-NonM
Oth<5%
IDR
USD
Invest
WC
Synd
Export
Program
Corp
Comm
Small
NPL DG
NPL NC
DG to NPLUG to PL
PL NC
PL UG
0%
10%
20%
30%
40%
50%
60%
70%
80%
90%
100%
Collect. NPL Aging Sector Currency Purpose GAS Movement
Q3 2007 Loan Detail*: Restructured LoansLoan Profile: Q3 Restructured Loans (Rp22,326 bn) Bank Only
68.8% are performing82.06.7% of loans in Category 2 are current in interest paymentsOf the 31.2% which are in NPL, 26.5% are current in interest paymentsPrimary sectors are:
Manufacturing•Chemicals•Textiles•Pulp & Paper
Construction52.9% are Rupiah loans38.1% are Investment loans71.4% are to Corporate customers4.1% deteriorated in collectibility7.0% showed improved collectibility
Of the remaining Rp22,326 billion in restructured Corporate, Commercial & Small Business loans in Q3, or 20.0% of total loans:
* Excluding Micro & Consumer Loans Only

63
1
2
3
5
Current
90+
Mfg-P&P
Trading
Constr
Mfg-Oth
Mfg-NonM
Oth<5%
USD
IDR
Invest
WC
Program
Corp
Comm
Small
NPL NC
NPL UGDG to NPL
PL NC
0%
10%
20%
30%
40%
50%
60%
70%
80%
90%
100%
Collect. NPL Aging Sector Currency Purpose GAS Movement
Q3 2007 Loan Detail*: IBRA LoansLoan Profile: Q3 IBRA Loans (Rp2,287 bn) Bank Only
75.6% are performing97.4% of loans in Category 2 are current in interest paymentsPrimary sectors are:
P&P ManufacturingConstructionTrading
85.5% are US Dollar loans90.0% are Investment loans, with another 7.9% Working Capital loans83.2% are to Corporate customers
2.2% improved in collectibility during the quarter
Rp2,287 billion in loans purchased from IBRA remain on the books as of Q3, accounting for 2.0% of total loans:
* Excluding Micro & Consumer Loans Only
64
1
2
3
5
Current
<3031-60
Mfg-F&B
Mfg-Oth
Agri
Mfg-P&P
Mfg-Chem
Mining
Mfg-Text
Trans
Oth<5%
USD
IDR
WC
Invest
Synd
Export
Other
<2000
2000-2004
>2004
New Bal.
NPL NC
PL NC
PL UG
0%
10%
20%
30%
40%
50%
60%
70%
80%
90%
100%
Collect. Cat. 2Aging
Sector Currency Purpose Origin Year Movement
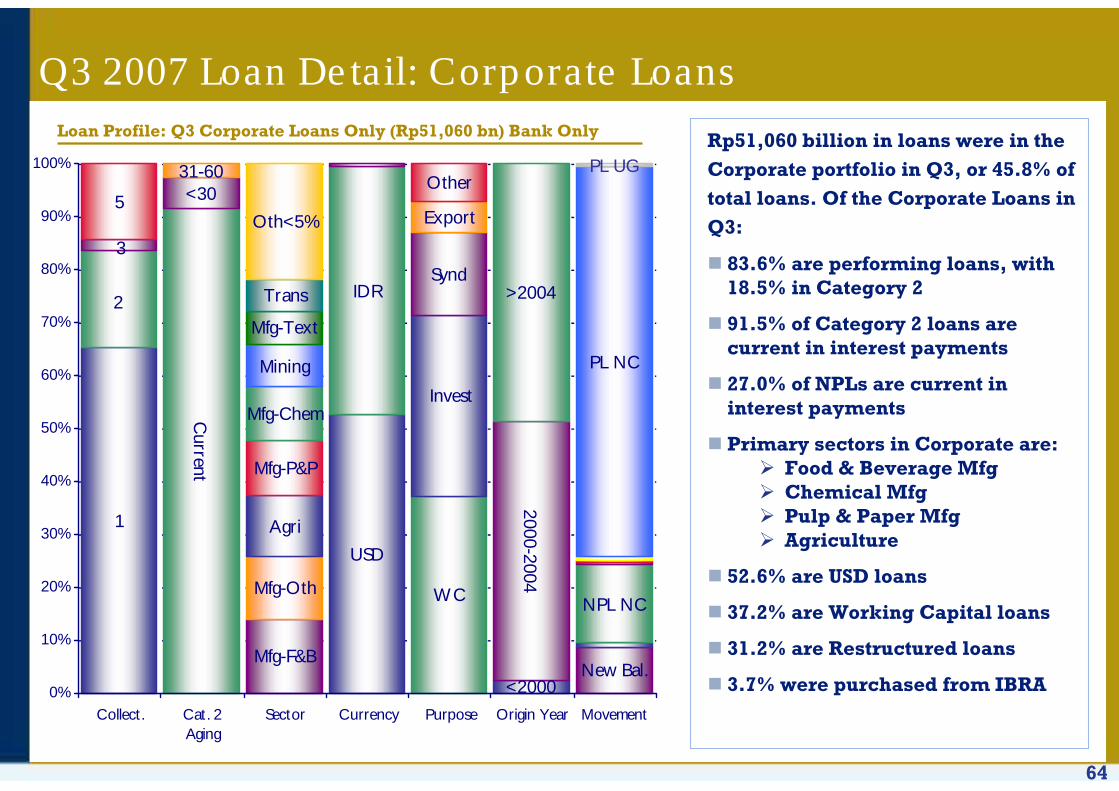
83.6% are performing loans, with 18.5% in Category 2
91.5% of Category 2 loans are current in interest payments
27.0% of NPLs are current in interest payments
Primary sectors in Corporate are:Food & Beverage MfgChemical MfgPulp & Paper MfgAgriculture
52.6% are USD loans
37.2% are Working Capital loans
31.2% are Restructured loans
3.7% were purchased from IBRA
Q3 2007 Loan Detail: Corporate LoansLoan Profile: Q3 Corporate Loans Only (Rp51,060 bn) Bank Only Rp51,060 billion in loans were in the
Corporate portfolio in Q3, or 45.8% of total loans. Of the Corporate Loans in Q3:
65
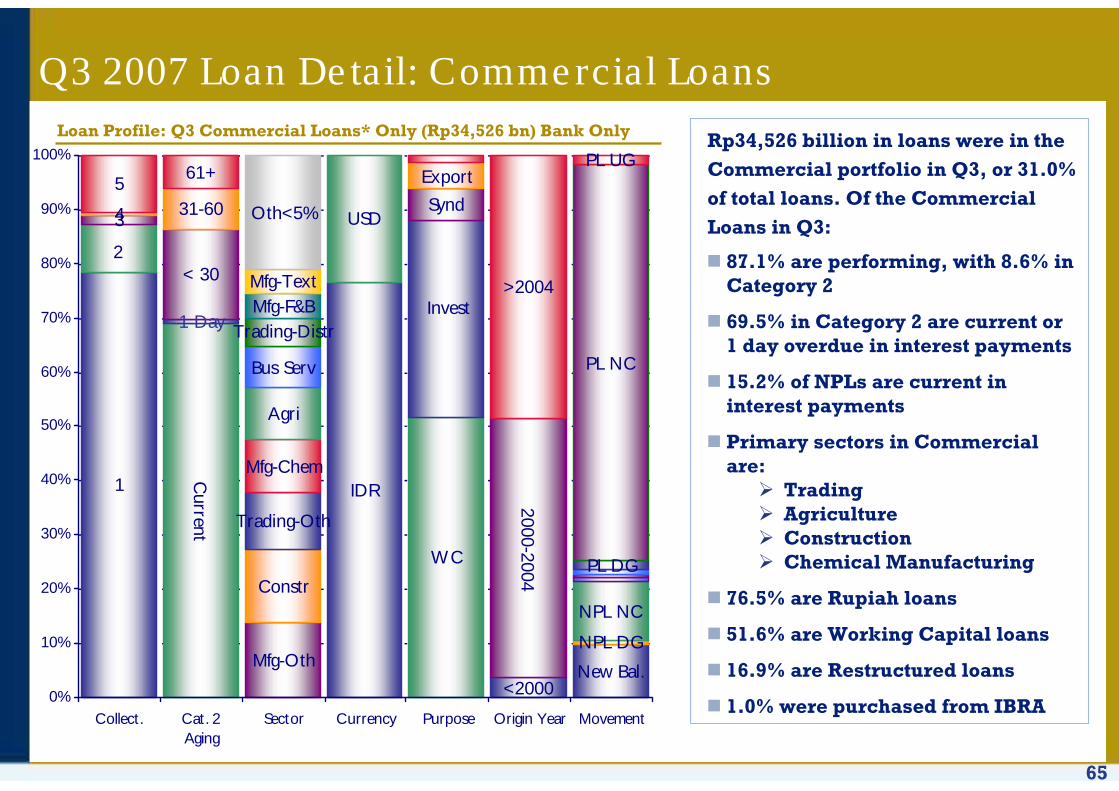
87.1% are performing, with 8.6% in Category 2
69.5% in Category 2 are current or 1 day overdue in interest payments
15.2% of NPLs are current in interest payments
Primary sectors in Commercial are:
TradingAgriculture Construction Chemical Manufacturing
76.5% are Rupiah loans
51.6% are Working Capital loans
16.9% are Restructured loans
1.0% were purchased from IBRA
1
2
34
5
Current
1 Day
< 30
31-60
61+
Mfg-Oth
Constr
Trading-Oth
Mfg-Chem
Agri
Bus Serv
Trading-DistrMfg-F&BMfg-Text
Oth<5%
IDR
USD
WC
Invest
Synd
Export
<2000
2000-2004
>2004
New Bal.
NPL DG
NPL NC
PL DG
PL NC
PL UG
0%
10%
20%
30%
40%
50%
60%
70%
80%
90%
100%
Collect. Cat. 2Aging
Sector Currency Purpose Origin Year Movement
Q3 2007 Loan Detail: Commercial LoansLoan Profile: Q3 Commercial Loans* Only (Rp34,526 bn) Bank Only Rp34,526 billion in loans were in the
Commercial portfolio in Q3, or 31.0% of total loans. Of the Commercial Loans in Q3:

66
92.5% are performing, with 9.2% in Category 2
45.1% in Category 2 are current or 1 day overdue in interest payments
26.4% of NPLs are current in interest payments
Primary sectors in Commercial are:
Retail TradingPlantations Manufacturing Distribution
99.3% are Rupiah loans
72.3% are Working Capital loans
5.5% are Restructured loans
1
23
45
Current
1 Day
< 30
31-60
61+
Trading-R
et
Agri
Mfg
Trading-Distr
Constr
Bus Serv
Trading-Oth
Oth<5%
IDR
USD
WC
Invest
ProgramOther
<2000
2000-2004
>2004
New Bal.
NPL NC
PL DG
PL NC
PL UG
0%
10%
20%
30%
40%
50%
60%
70%
80%
90%
100%
Collect. Cat. 2Aging
Sector Currency Purpose Origin Year Movement
Q3 2007 Loan Detail: Small Business Loans*Loan Profile: Q3 Small Business Loans* Only (Rp9,704 bn) Bank Only Rp9,704 billion in loans were in the
Small Business portfolio in Q3, or 8.7% of total loans. Of the Small Business Loans* in Q3:
* Excluding Micro Loans

67
1
2
3
5
Current
1 Day
< 30
31-60
61+
Mfg-Oth
Agri
Constr
Trading-Oth
Mfg-F&B
Bus Serv
Trading-Ret
Trans
Mfg-Chem
Oth<5%
Corp
Comm
Small
WC
Invest
ExportProgramOther
<2000
2000-2004
>2004
New Bal.
NPL NC
PL NC
PL UG
0%
10%
20%
30%
40%
50%
60%
70%
80%
90%
100%
Collect Cat 2 Aging Sector Business Purpose Origin Year Move
Q3 2007 Loan Detail*: Rupiah LoansLoan Profile: Q3 Loans (Rp59,906 bn) Bank Only
87.9% are performing loans with 8.4% in Category 2
72.6% of Category 2 loans are current in interest payments
24.7% of NPLs are current in interest payments
Primary sectors in Corporate are:PlantationsConstructionTradingFood & Beverage Mfg
44.1% are Commercial loans
64.5% are Working Capital loans
19.7% are Restructured loans
0.6% were purchased from IBRA
Rp59,906 billion in loans were Rupiah denominated in Q3, or 53.8% of total loans. Of the Rupiah Loans in Q3:
* Excluding Micro & Consumer Loans Only
68
1
2
34
5
Current
< 30
31-60
Mfg-Chem
Mfg-P&P
Mining
Mfg-Oth
Mfg-F&B
Mfg-Text
Agri
Elect/Gas/Water
Oth<5%
Corp
Comm
Invest
Synd
WC
Export
LCOther
<2000
2000-2004
>2004
New Bal.
NPL NC
PL NC
PL UG
0%
10%
20%
30%
40%
50%
60%
70%
80%
90%
100%
Collect Cat 2 Aging Sector Business Purpose Origin Year Move
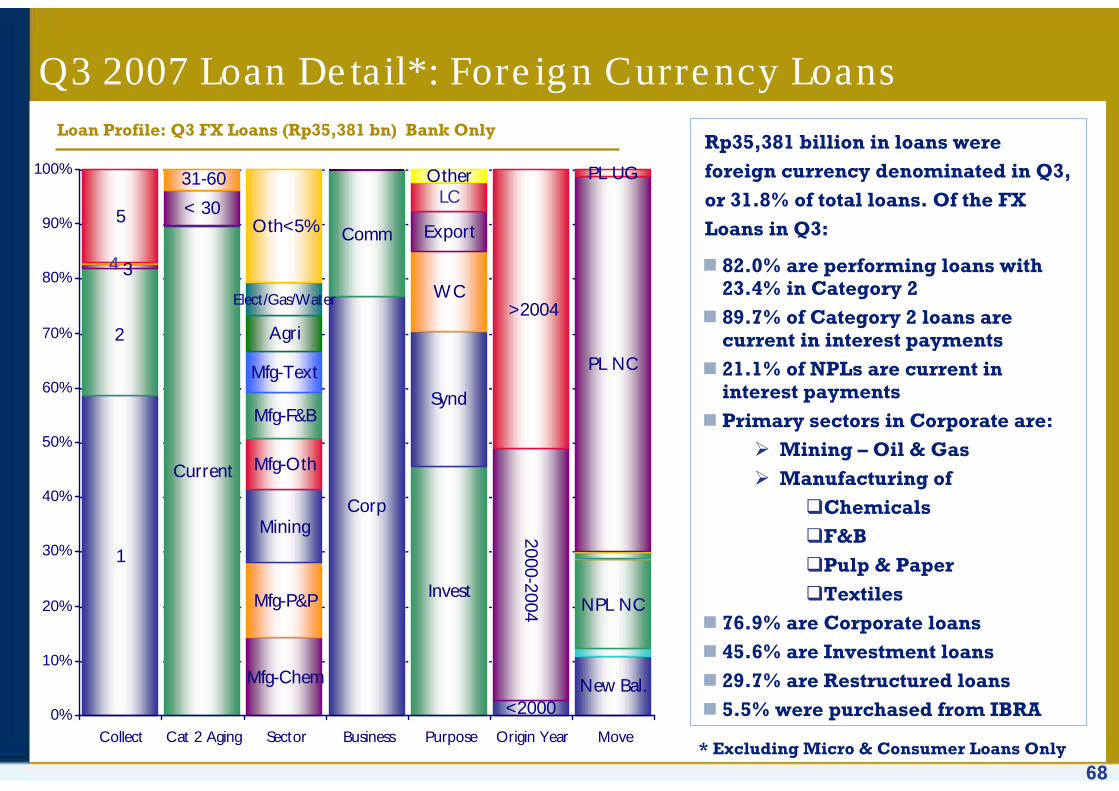
Q3 2007 Loan Detail*: Foreign Currency LoansLoan Profile: Q3 FX Loans (Rp35,381 bn) Bank Only
82.0% are performing loans with 23.4% in Category 289.7% of Category 2 loans are current in interest payments21.1% of NPLs are current in interest paymentsPrimary sectors in Corporate are:
Mining – Oil & GasManufacturing of
ChemicalsF&BPulp & PaperTextiles
76.9% are Corporate loans45.6% are Investment loans29.7% are Restructured loans 5.5% were purchased from IBRA
Rp35,381 billion in loans were foreign currency denominated in Q3, or 31.8% of total loans. Of the FX Loans in Q3:
* Excluding Micro & Consumer Loans Only
69
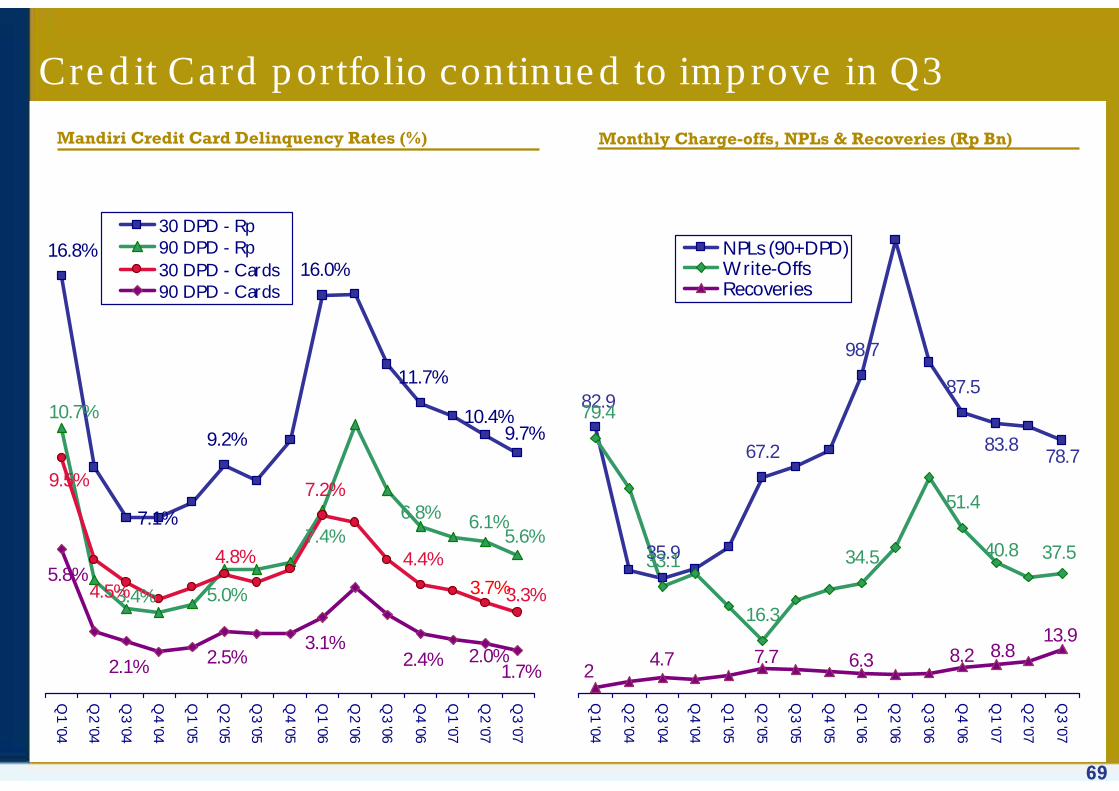
Credit Card portfolio continued to improve in Q3
Mandiri Credit Card Delinquency Rates (%)
82.9
35.9
67.2
98.7
87.579.4
33.1
16.3
34.5
51.4
78.783.8
37.540.8
24.7 7.7 6.3 8.2 8.8
13.9
Q1 '04
Q2 '04
Q3 '04
Q4 '04
Q1 '05
Q2 '05
Q3 '05
Q4 '05
Q1 '06
Q2 '06
Q3 '06
Q4 '06
Q1 '07
Q2 '07
Q3 '07
NPLs (90+DPD)Write-OffsRecoveries
Monthly Charge-offs, NPLs & Recoveries (Rp Bn)
16.8%
9.2%
16.0%
11.7%
7.2%
4.4%
9.7%
7.1%
10.4%
5.6%6.1%6.8%
10.7%
3.4% 5.0%
7.4%
3.3%
4.8%
3.7%
9.5%
4.5%
1.7%
3.1%
5.8%
2.1% 2.5% 2.4% 2.0%
Q1 '04
Q2 '04
Q3 '04
Q4 '04
Q1 '05
Q2 '05
Q3 '05
Q4 '05
Q1 '06
Q2 '06
Q3 '06
Q4 '06
Q1 '07
Q2 '07
Q3 '07
30 DPD - Rp90 DPD - Rp30 DPD - Cards90 DPD - Cards

70
Regulations on Asset Classification: PBI No. 7/2/PBI/2005
Classificationby Aging of
Interest Payments#
Classificationby Aging of
Interest Payments#
BI Collectibility takes
precedence#
BI Collectibility takes
precedence#
One Debtor, One Project
Concept*
One Debtor, One Project
Concept*
Completeness of Financial Report*
Completeness of Financial Report*
DetailedClassification
Guidance#
DetailedClassification
Guidance#
Business OutlookBusiness growth potentialMarket condition & debtor position in the marketManagement qualityGroup supportEnvironmental factors
Financial ConditionProfitabilityCapital structureCash flow Sensitivity to market risk
Payment AbilityOn time paymentAvailability of debtor’s financial informationCompleteness of credit documentationCompliance toward credit agreementNature of payment sourceAppropriateness of funds usage
In instances where there is disagreement in the determination of earning asset collectibility between the bank, its external auditors and BI, the bank must adopt BI’s determination
The Bank must classify all of its earning assets to a single debtor at the level of the lowest quality assetFor debtors with exposures to more than one bank, all banks must adopt the lowest classification applied by any one bank to the debtor.All earning assets related to a particular project must be classified at the same level
Banks must require debtors to submit current financial statementsFailure to submit financial statements must result in an automatic downgrade of collectibility by one level, or to a maximum classification of sub-standard
No change to BI Prov. Req.CurrentPreviouslyClassification by Payment History
100%181+ days271+ daysCategory 5 - Loss
50%121 – 180 days181 – 270 daysCategory 4 - Doubtful
15%91 – 120 days91 – 180 daysCategory 3 – Sub-Standard
5%1 – 90 days1 – 90 daysCategory 2 – Special Mention
1%CurrentCurrentCategory 1 - Current
# Implemented in Q1 2005 * Implemented in Q2 2005

71
Accounting for Interest, Provisions and Collateral
Recognition of Interest IncomeRecognition of
Interest Income
Booking of Payments from
Borrowers
Booking of Payments from
Borrowers
Valuation of Collateral & Provisioning
Valuation of Collateral & Provisioning
ProvisioningProvisioning
IBRA LoansRestructured LoansRegular LoansClassification
Cash BasisCash BasisCash BasisCat. 5 - Loss
Cash BasisCash BasisCash BasisCat. 4 - Doubtful
Cash BasisCash BasisCash BasisCat. 3 – Sub-Standard
Cash BasisCash BasisAccrual BasisCat. 2 – Special Mention
Cash BasisAccrual BasisAccrual BasisCat. 1 - Current
IBRA Loans(w/o new agreement)Restructured LoansRegular LoansClassification
PrincipalPrincipalPrincipalCat. 5 - Loss
PrincipalPrincipalPrincipalCat. 4 - Doubtful
PrincipalInterestInterestCat. 3 – Sub-Standard
PrincipalInterestInterestCat. 2 – Special Mention
PrincipalInterestInterestCat. 1 - Current
IBRA LoansRestructured LoansRegular LoansClassification
100%Cat. 5 - Loss
50%Cat. 4 - Doubtful
15%Cat. 3 – Sub-Standard
5%Cat. 2 – Special Mention
As per BI regulations, except:− Difference between principal
and purchased value book as − Provisions, or− Deferred income if a new
agreement has been made
As per BI regulations, except:− Not reversed by upgrading − Reversed by principal repayment − Beginning provisions determined
at 31 Dec. 2004− Based on net book value after
restructuring loss
1%Cat. 1 - Current
All LoansCollateralClassification
Cat. 5 - Loss
Cat. 4 - Doubtful
Cat. 3 – Sub-Standard
−Can be credited against cash provisions for Cat. 2-5
Cat. 2 – Special Mention
Collateral valuation for provisioning is determined by the aging of the most recent independent appraisal (for assets over Rp 5bn):−70% of appraised value within the initial 12 months−50% of appraised value within 12 to 18 months−30% of appraised value within 18 to 24 months−No value after 24 months from appraisal
Not valuedCat. 1 - Current
72
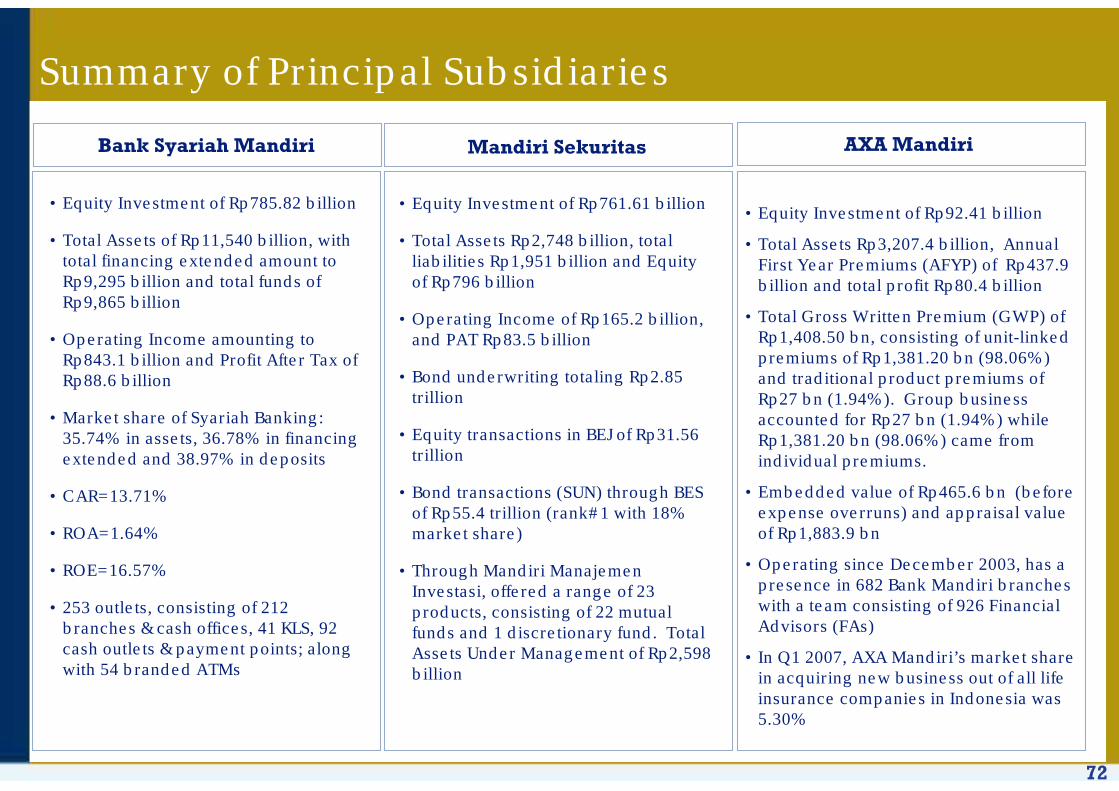
Summary of Principal Subsidiaries
• Equity Investment of Rp761.61 billion
• Total Assets Rp2,748 billion, total liabilities Rp1,951 billion and Equity of Rp796 billion
• Operating Income of Rp165.2 billion, and PAT Rp83.5 billion
• Bond underwriting totaling Rp2.85 trillion
• Equity transactions in BEJ of Rp31.56 trillion
• Bond transactions (SUN) through BES of Rp55.4 trillion (rank#1 with 18% market share)
• Through Mandiri ManajemenInvestasi, offered a range of 23 products, consisting of 22 mutual funds and 1 discretionary fund. Total Assets Under Management of Rp2,598 billion
Bank Syariah Mandiri Mandiri Sekuritas AXA Mandiri
• Equity Investment of Rp92.41 billion
• Total Assets Rp3,207.4 billion, Annual First Year Premiums (AFYP) of Rp437.9 billion and total profit Rp80.4 billion
• Total Gross Written Premium (GWP) of Rp1,408.50 bn, consisting of unit-linked premiums of Rp1,381.20 bn (98.06%) and traditional product premiums of Rp27 bn (1.94%). Group business accounted for Rp27 bn (1.94%) while Rp1,381.20 bn (98.06%) came from individual premiums.
• Embedded value of Rp465.6 bn (before expense overruns) and appraisal value of Rp1,883.9 bn
• Operating since December 2003, has a presence in 682 Bank Mandiri branches with a team consisting of 926 Financial Advisors (FAs)
• In Q1 2007, AXA Mandiri’s market share in acquiring new business out of all life insurance companies in Indonesia was 5.30%
• Equity Investment of Rp785.82 billion
• Total Assets of Rp11,540 billion, with total financing extended amount to Rp9,295 billion and total funds of Rp9,865 billion
• Operating Income amounting to Rp843.1 billion and Profit After Tax of Rp88.6 billion
• Market share of Syariah Banking: 35.74% in assets, 36.78% in financing extended and 38.97% in deposits
• CAR=13.71%
• ROA=1.64%
• ROE=16.57%
• 253 outlets, consisting of 212 branches & cash offices, 41 KLS, 92 cash outlets & payment points; along with 54 branded ATMs
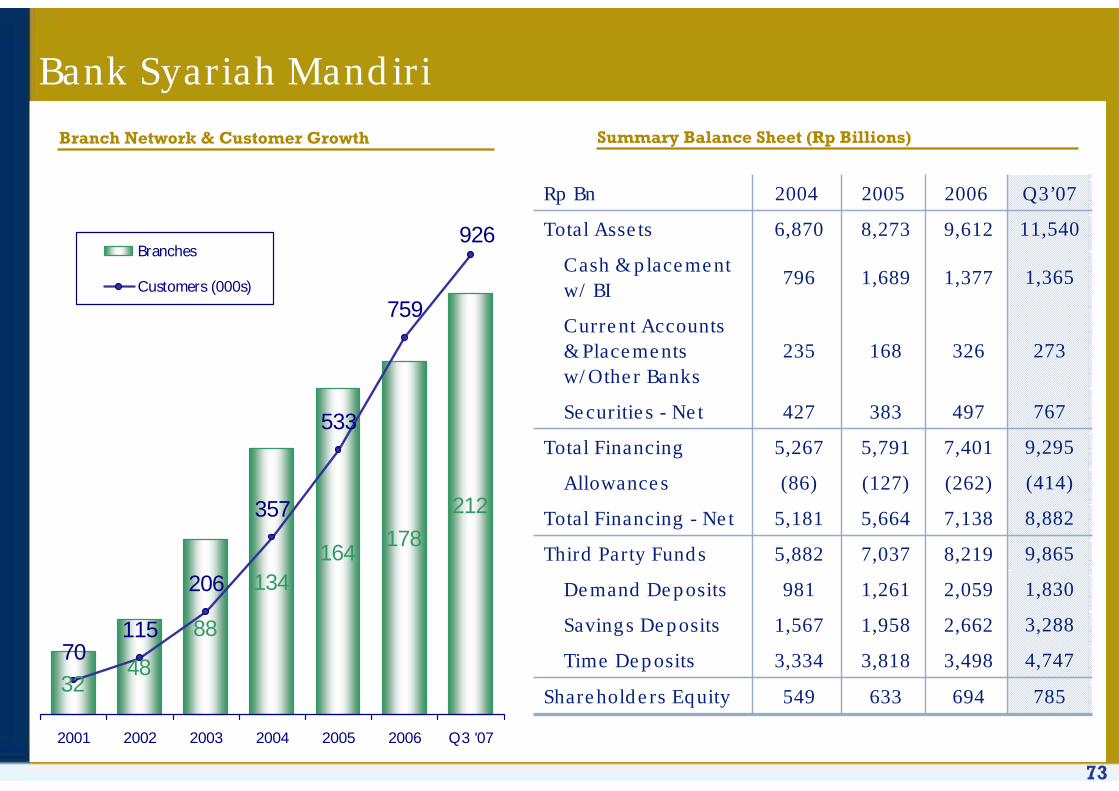
73
Branch Network & Customer Growth
Bank Syariah Mandiri
3248
88
134164
178
212
206
759
926
533
357
11570
2001 2002 2003 2004 2005 2006 Q3 '07
Branches
Customers (000s)
Summary Balance Sheet (Rp Billions)
694
3,498
2,662
2,059
8,219
7,138
(262)
7,401
497
326
1,377
9,612
2006
549
3,334
1,567
981
5,882
5,181
(86)
5,267
427
235
796
6,870
2004
9,2955,791 Total Financing
767383 Securities - Net
273168 Current Accounts & Placements w/Other Banks
1,3651,689 Cash & placement w/ BI
11,5408,273 Total Assets
Q3’072005Rp Bn
8,8825,664 Total Financing - Net
9,8657,037 Third Party Funds
1,8301,261 Demand Deposits
3,2881,958 Savings Deposits
4,7473,818 Time Deposits
633
(127) (414)Allowances
Shareholders Equity 785
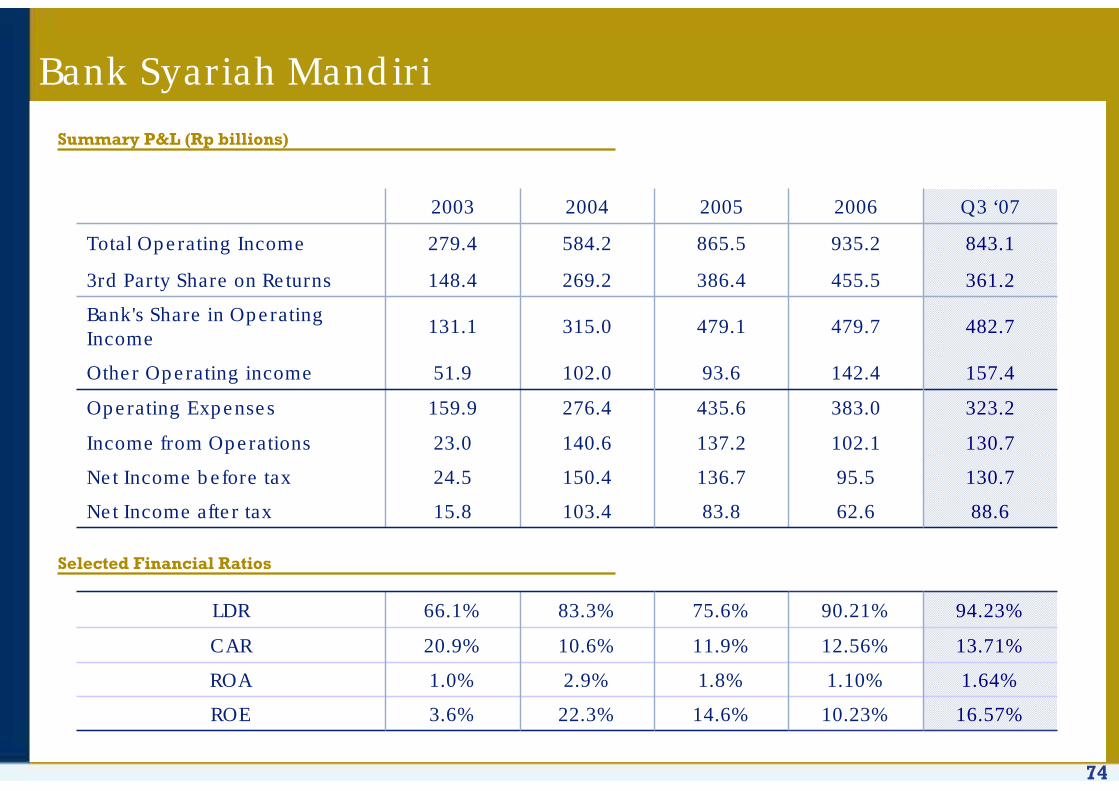
74
Bank Syariah Mandiri
Summary P&L (Rp billions)
10.23%
1.10%
12.56%
90.21%
62.6
95.5
102.1
383.0
142.4
479.7
455.5
935.2
2006
16.57%
1.64%
13.71%
94.23%
88.6
130.7
130.7
323.2
157.4
482.7
361.2
843.1
Q3 ‘07
22.3%
2.9%
10.6%
83.3%
103.4
150.4
140.6
276.4
102.0
315.0
269.2
584.2
2004
11.9%20.9%CAR
75.6%66.1%LDR
83.815.8Net Income after tax
136.724.5Net Income before tax
137.223.0Income from Operations
3.6%
1.0%
159.9
51.9
131.1
148.4
279.4
2003
479.1Bank's Share in Operating Income
386.43rd Party Share on Returns
865.5Total Operating Income
2005
435.6Operating Expenses
1.8%ROA
14.6%
93.6Other Operating income
ROE
Selected Financial Ratios
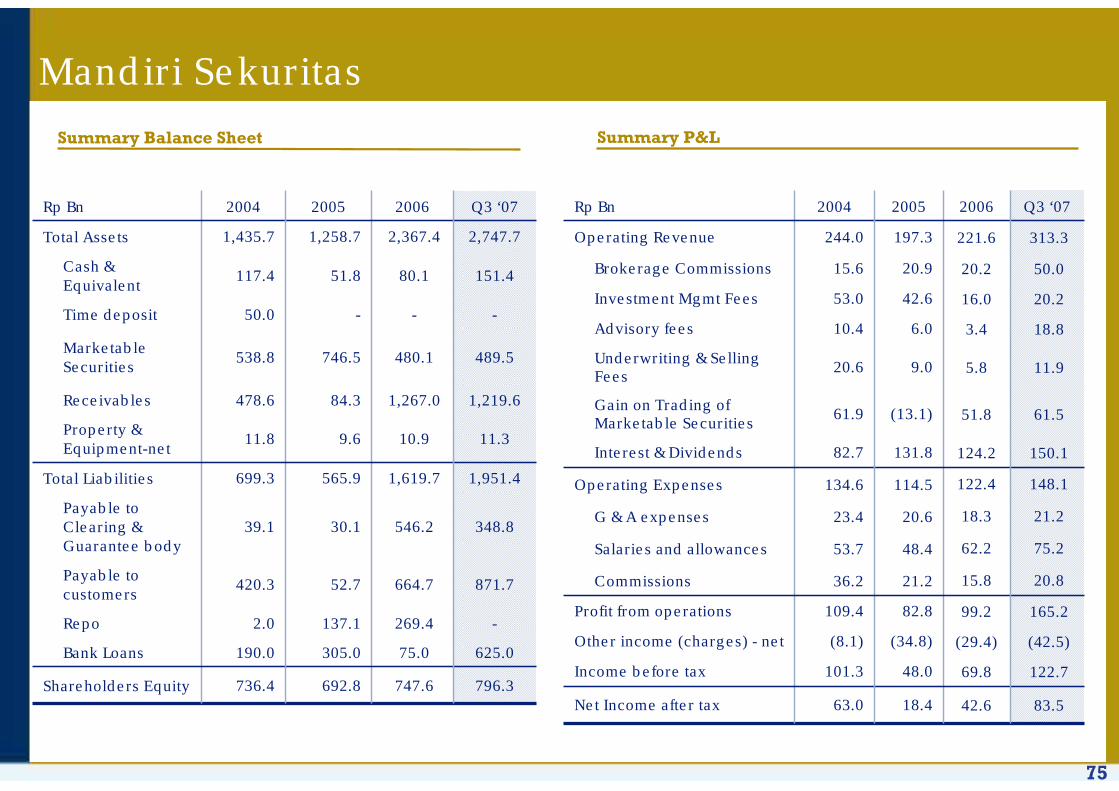
75
Mandiri Sekuritas
Summary P&L
42.6
69.8
(29.4)
99.2
15.8
62.2
18.3
122.4
124.2
51.8
5.8
3.4
16.0
20.2
221.6
2006
165.2 82.8109.4Profit from operations
20.8 21.236.2Commissions
75.2 48.453.7Salaries and allowances
63.0
101.3
(8.1)
23.4
134.6
82.7
61.9
20.6
10.4
53.0
15.6
244.0
2004
11.9 9.0Underwriting & Selling Fees
18.8 6.0Advisory fees
20.2 42.6Investment Mgmt Fees
50.0 20.9Brokerage Commissions
313.3 197.3Operating Revenue
Q3 ‘072005Rp Bn
150.1 131.8Interest & Dividends
148.1 114.5Operating Expenses
21.2 20.6G & A expenses
(42.5)(34.8)Other income (charges) - net
122.7 48.0Income before tax
18.4
(13.1) 61.5 Gain on Trading of Marketable Securities
Net Income after tax 83.5 747.6
75.0
269.4
664.7
546.2
1,619.7
10.9
1,267.0
480.1
-
80.1
2,367.4
2006
736.4
190.0
2.0
420.3
39.1
699.3
11.8
478.6
538.8
50.0
117.4
1,435.7
2004
1,219.6 84.3Receivables
489.5 746.5Marketable Securities
--Time deposit
151.4 51.8Cash & Equivalent
2,747.7 1,258.7Total Assets
Q3 ‘072005Rp Bn
1,951.4 565.9Total Liabilities
348.8 30.1Payable to Clearing & Guarantee body
871.7 52.7Payable to customers
-137.1Repo
625.0 305.0Bank Loans
692.8
9.6 11.3 Property & Equipment-net
Shareholders Equity 796.3
Summary Balance Sheet

76
21,062
21,565
19,606
18,016
17,204
17,735
18,397
19,693
21,192
1999
2000
2001
2002
2003
2004
2005
2006
Q3 '07
Staffing and Distribution Network Growth
934
658
635
730
909
546
687
789
924
1999
2000
2001
2002
2003
2004
2005
2006
Q3 '07
6,265
6,267
6,025
3,160
4,000
4,716
5,537
1999
2000
2001
2002
2003
2004
2005
2006
Q3 '07
2,800
2,802
513
533
1,184
2,022
2,470
2,560
1,559
1999
2000
2001
2002
2003
2004
2005
2006
Q3 '07
Employees
Domestic Branch Network
ATM Network
ATM-Link Network
24090500New ATMs 2490520500211-0.67.67.0% 2.43.73.1-4.5-8.1
1512059New Branch 10435289-112

77
Loan growth, quality and provisioning relative to peersBank Only, As of June 2007
193%
193%
150%
113%
63%
56%
48%
125%
78%
88%
Lippo
BCA
BRI
Panin
Danam
on
Mandiri
Permata
Niaga
BNI
BII
Ratio of Provisions to NPL(%)
106,895
98,779
78,448
64,069
44,427
34,203
24,773
23,242
14,963
23,529
Mandiri
BRI
BNI
BCA
Danam
on
Niaga
Permata
Panin
BII
Lippo
Total Loans(Rp bn)
24.9%
3.0%
-2.3%
4.0%
4.1%
7.9%
8.6%
9.4%
17.7%
23.0%
Lippo
Panin
BNI
BRI
BII
Danam
on
Permata
BCA
Niaga
Mandiri
Loan Growth (YTD)(%)
0.0%
0.4%
0.6%
1.4%
2.5%
3.2%
3.5%
3.9%
5.4%
1.5%
Panin
BCA
Lippo
BRI
Danam
on
Permata
Niaga
BII
Mandiri
BNI
NPL Ratio (Net)(%)
93.1%
85.2%
83.1%
75.5%
72.7%
63.9%
55.3%
53.6%
50.7%
40.1%
Panin
Niaga
Permata
Danam
on
BRI
BII
BNI
Mandiri
Lippo
BCA
Loan to Deposit Ratio(%)
1.4%
1.7%
3.1%
4.2%
4.4%
4.8%
5.5%
6.1%
9.0%
16.2%
BCA
Lippo
Danam
on
Niaga
BII
Panin
BRI
Permata
BNI
Mandiri
NPL Ratio (Gross)(%)
Average

78
Asset and liability mix relative to peersBank Only, As of June 2007
6.9%
6.5%
6.1%
5.5%
5.4%
5.4%
4.9%
4.6%
4.6%
4.3%
Danam
on
Niaga
BII
Panin
Permata
BNI
Mandiri
BRI
Lippo
BCA
86.8%
73.5%
63.8%
63.6%
58.6%
47.8%
47.8%
42.0%
52.3%
55.5%
Niaga
Permata
BRI
Panin
Danam
on
BII
BNI
Lippo
Mandiri
BCA
71.2%
68.9%
63.8%
58.4%
56.6%
49.9%
48.3%
42.8%
35.7%
28.4%
BCA
Lippo
BRI
Mandiri
BNI
Panin
Permata
BII
Niaga
Danam
on
252,342
42,671
37,060
39,026
43,776
48,569
85,542
168,124
175,355
183,405
Mandiri
BCA
BNI
BRI
Danam
on
BII
Niaga
Permata
Panin
Lippo
Loans to Total Earning Assets(%)
Cost of Funds (p.a.)(%)
Total Assets(Rp bn)
Low Cost Deposit Ratio(%)
15.4%
14.9%
12.7%
12.0%
11.6%
11.1%
11.0%
10.9%
10.3%
10.2%
BRI
Danam
on
Niaga
Panin
Permata
BII
Lippo
BCA
Mandiri
BNI
Yield on Assets (p.a.)(%)
Average
197,173
159,684
141,801
135,810
58,638
35,820
35,652
29,832
29,540
25,256
Mandiri
BCA
BNI
BRI
Danam
on
BII
Niaga
Permata
Lippo
Panin
Total Deposits(Rp tn)
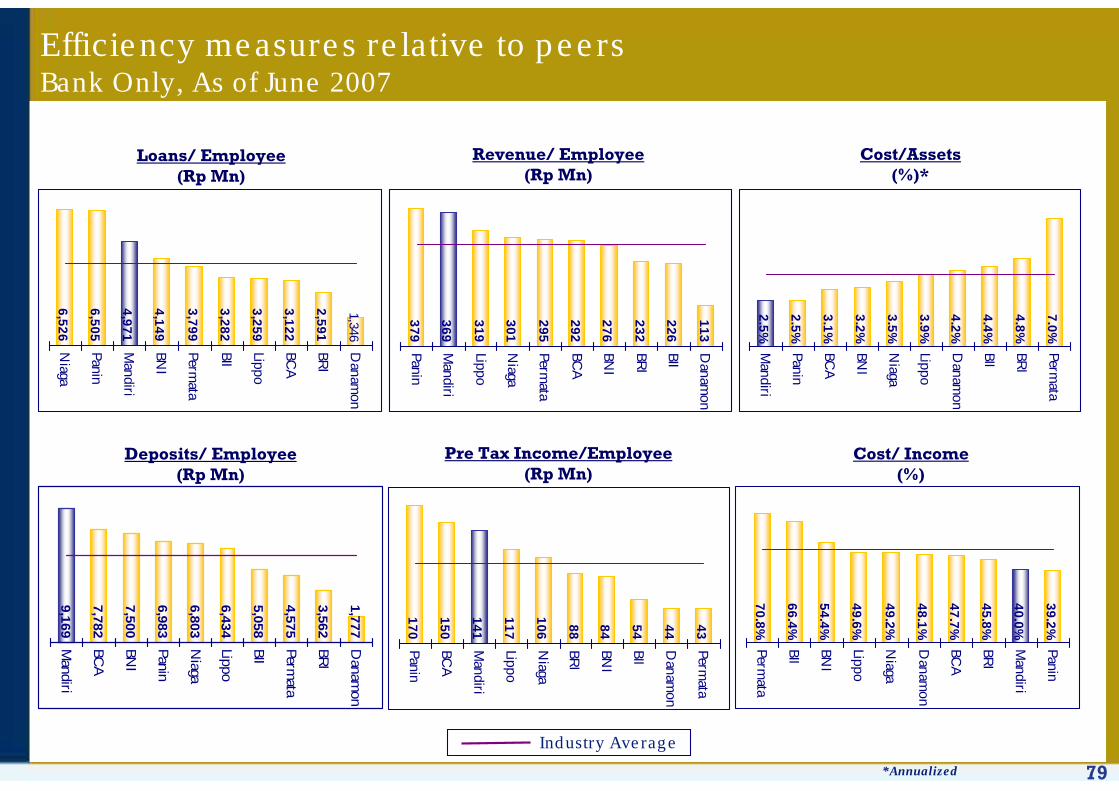
79
Efficiency measures relative to peersBank Only, As of June 2007
70.8%
66.4%
54.4%
49.6%
49.2%
48.1%
47.7%
45.8%
40.0%
39.2%
Permata
BII
BNI
Lippo
Niaga
Danam
on
BCA
BRI
Mandiri
Panin
379
369
319
301
295
232
226
113
276
292
Panin
Mandiri
Lippo
Niaga
Permata
BCA
BNI
BRI
BII
Danam
on
9,169
7,782
7,500
6,983
6,803
6,434
5,058
4,575
3,562
1,777
Mandiri
BCA
BNI
Panin
Niaga
Lippo
BII
Permata
BRI
Danam
on
6,526
2,591
1,346
3,122
3,259
3,282
3,799
4,149
4,971
6,505
Niaga
Panin
Mandiri
BNI
Permata
BII
Lippo
BCA
BRI
Danam
on
Revenue/ Employee(Rp Mn)
Cost/ Income(%)
Loans/ Employee(Rp Mn)
Deposits/ Employee(Rp Mn)
170
150
141
117 88 84 54 44
106 43
Panin
BCA
Mandiri
Lippo
Niaga
BRI
BNI
BII
Danam
on
Permata
Pre Tax Income/Employee(Rp Mn)
3.1%
3.2%
3.5%
3.9%
4.2%
4.4%
4.8%
7.0%
2.5%
2.5%M
andiri
Panin
BCA
BNI
Niaga
Lippo
Danam
on
BII
BRI
Permata
Cost/Assets(%)*
Industry Average
*Annualized
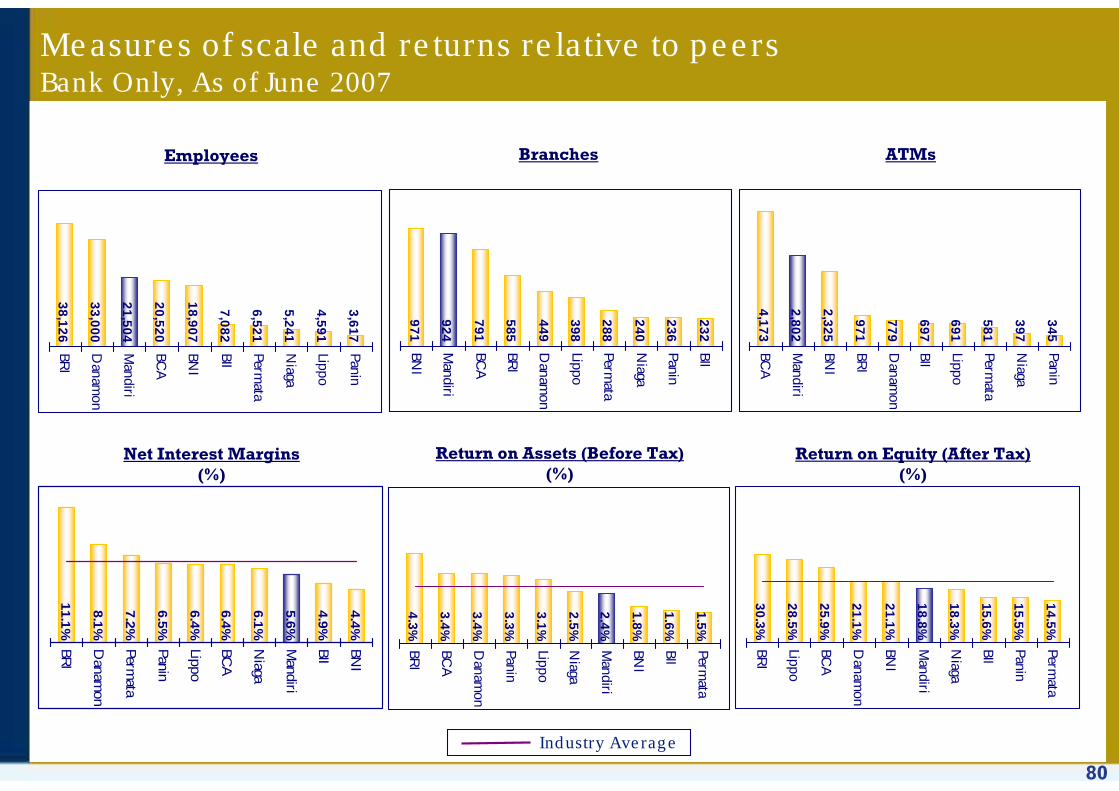
80
Measures of scale and returns relative to peersBank Only, As of June 2007
30.3%
28.5%
25.9%
21.1%
21.1%
18.8%
18.3%
15.6%
15.5%
14.5%
BRI
Lippo
BCA
Danam
on
BNI
Mandiri
Niaga
BII
Panin
Permata
971
924
791
585
449
240
236
232
398
288
BNI
Mandiri
BCA
BRI
Danam
on
Lippo
Permata
Niaga
Panin
BII
11.1%
8.1%
7.2%
6.5%
6.4%
6.4%
6.1%
5.6%
4.9%
4.4%
BRI
Danam
on
Permata
Panin
Lippo
BCA
Niaga
Mandiri
BII
BNI
38,126
4,591
3,617
5,241
6,521
7,082
18,907
20,520
21,504
33,000
BRI
Danam
on
Mandiri
BCA
BNI
BII
Permata
Niaga
Lippo
Panin
Branches
Return on Equity (After Tax)(%)
Employees
Net Interest Margins(%)
4.3%
3.4%
3.4%
3.3%
3.1%
2.5%
2.4%
1.8%
1.6%
1.5%
BRI
BCA
Danam
on
Panin
Lippo
Niaga
Mandiri
BNI
BII
Permata
Return on Assets (Before Tax)(%)
4,173
2,802
2,325
971
779
697
691
581
397
345
BCA
Mandiri
BNI
BRI
Danam
on
BII
Lippo
Permata
Niaga
Panin
ATMs
Industry Average
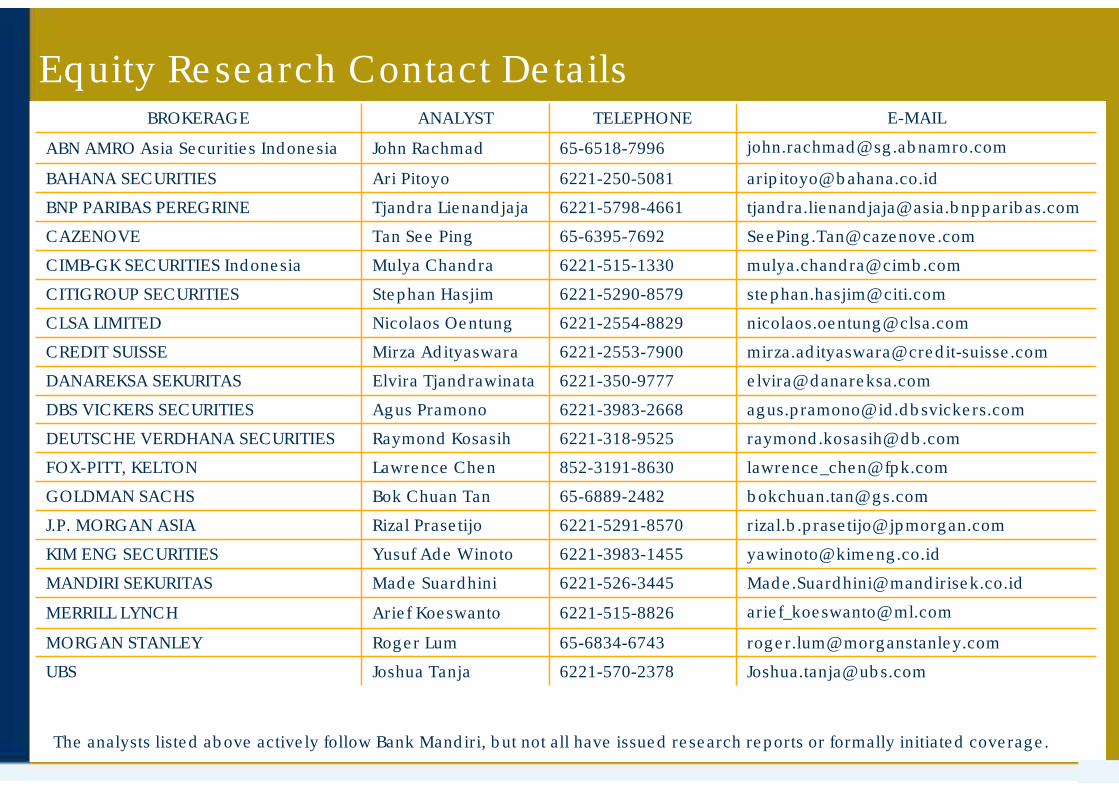
82
[email protected] LumMORGAN STANLEY
[email protected] ChandraCIMB-GK SECURITIES Indonesia
[email protected] See PingCAZENOVE
[email protected] TjandrawinataDANAREKSA SEKURITAS
[email protected] HasjimCITIGROUP SECURITIES
[email protected] LienandjajaBNP PARIBAS PEREGRINE
[email protected] KosasihDEUTSCHE VERDHANA SECURITIES
[email protected] TanjaUBS
[email protected] RachmadABN AMRO Asia Securities Indonesia
[email protected] Ade WinotoKIM ENG SECURITIES
6221-515-8826
6221-526-3445
6221-5291-8570
65-6889-2482
852-3191-8630
6221-3983-2668
6221-2553-7900
6221-2554-8829
6221-250-5081
TELEPHONE
Arief Koeswanto
Made Suardhini
Rizal Prasetijo
Bok Chuan Tan
Lawrence Chen
Agus Pramono
Mirza Adityaswara
Nicolaos Oentung
Ari Pitoyo
ANALYST
[email protected], KELTON
[email protected] SUISSE
DBS VICKERS SECURITIES
MANDIRI SEKURITAS
J.P. MORGAN ASIA
GOLDMAN SACHS
MERRILL LYNCH
CLSA LIMITED
BAHANA SECURITIES
BROKERAGE
The analysts listed above actively follow Bank Mandiri, but not all have issued research reports or formally initiated coverage.
Equity Research Contact Details

83
For Additional Information:
Please refer to our website at www.bankmandiri.co.id
Or Contact:
Mansyur NasutionCorporate Secretary Tel: (6221) 524 5299 Fax: (6221) 5296 4024
Jonathan ZaxHead of Investor RelationsTel: (6221) 3002-3171Fax: (6221) 5290 4249E-mail: [email protected]
PT Bank Mandiri (Persero) TbkPlaza MandiriJl. Jend. Gatot Subroto Kav. 36-38Jakarta 12190Main Tel: 526-5045