PSU Employees Acceptance of e-Procurement based on Revised ...
6
PSU Employees Acceptance of e-Procurement based on Revised Technology Acceptance Model $QVKDGK $ 0DKHVK6 'HSDUWPHQW RI 0HFKDQLFDO (QJLQHHULQJ College of Engineering Trivandrum, India DQVKDGK#KRWPDLOFRP PDKHVKBPDQRPDQM#UHGLIIPDLOFRP Abstract— Supplier management is one of the key issues of supply chain management because the cost of raw materials and component parts constitute the main cost of a product and most of the firms spend considerable amount of their sales revenues on purchasing. The Internet has greatly facilitated the globalization of the competitive business arena especially in the era of B2B e- commerce. One element of B2B e-commerce is electronic procurement (e-procurement), which is the focus of this study. Business organizations face a more complex and competitive environment than ever before in the internet era. The buyers and suppliers need to become more integrated and information systems will become the platform for integrated supply chain management. So automation of a firm’s procurement process, e- procurement, is becoming increasingly recognized for its ability to improve business operations. Government of India (GoI) has set up an e-Procurement marketplace, linking government departments, agencies and local bodies with their vendors. e - Procurement is a Mission Mode Project (MMP) under National e-Governance Plan (NeGP).Finance ministry of India issued a memorandum on March 2012 to implement comprehensive end to end e-Procurement system in all Government departments. As a result, e-procurement system was fully implemented in all the Kerala PSU’s in collaboration with NIC and IT mission on June 2012.The paper here focuses on the analysis of factors influencing employees acceptance of e-procurement in the Kerala PSU’s under the department of industries & commerce. A research survey is conducted among the employees in the purchase departments of various Kerala PSU’s and results are tested based on revised Technology Acceptance Model(TAM) using SPSS V17 and WarpPLS V3 software’s. The major variables influencing employee’s adoption of e-procurement is found out and the relationship between various factors influencing the adoption are determined. Keywords: e- Procurement, TAM, PLS I. INTRODUCTION Throughout history, invention and adaptation of new technologies increase the productivity of the business firms, which will ultimately lead to high economic growth and high living standards. In industries technological advancement over the past decade has mainly focused on the plant design and manufacturing process improvement. But in recent years total scenario of business has been changed by the technological advancement in the field of telecommunication network and information technology. Online procurement (e-procurement) is a technological solution to facilitate corporate buying using the Internet and other Information and Communication Technologies (ICT).In other words, e-procurement is the electronic (B2B or B2C or B2G) sale and purchase of goods and services [4]. E-procurement is a B2B purchasing practice that utilizes e- commerce to identify potential sources of supply, purchase goods and services, transfer payment, and interact with suppliers [7]. e-procurement has provided a unique opportunity for managers to boost the competitiveness and profitability of the businesses by expediting purchase order processes, simplifying purchase payment, expanding supplier bases, reducing paperwork’s, and eliminating order errors[13]. According to Subramaniam and Shaw [5], large organizations spend 14–30% of their revenue on procurement of non-production goods and services, such as office equipment, supplies, computers, travel, and entertainment. Organizations are uncertain of realizing the benefits of e- procurement for themselves at the ground level, and therefore the research needs to expand to overcome this [5]. Today, organizations are investing a lot in their IT infrastructure and reengineering their business processes by digitizing firms. If organizational employees are not optimum utilizing its IT infrastructure, the productivity gain reduces enormously. So, there is need to find the determinants which influence employee’s adoption and uses of e-procurement systems [16]. Realizing the importance of e-procurement and its scope in organizational competitiveness, this paper presents the results of an empirical study that was conducted to determine the relationship between various factors influencing employee’s adoption of e-procurement in Kerala PSU’s. The research study here assesses the individual determinants that influence the use of e-procurement system in Kerala public sector. The study can provide managers with the valuable information’s to undertake necessary programs to achieve greater acceptance and usage of e-procurement system. The results obtained and subsequent analyses are reported below. International Journal of Scientific & Engineering Research, Volume 5, Issue 7, July-2014 ISSN 2229-5518 630 IJSER © 2015 http://www.ijser.org IJSER
Transcript of PSU Employees Acceptance of e-Procurement based on Revised ...
PSU Employees Acceptance of e-Procurement based on Revised Technology Acceptance Model
College of Engineering Trivandrum, India
Abstract— Supplier management is one of the key issues of supply chain management because the cost of raw materials and component parts constitute the main cost of a product and most of the firms spend considerable amount of their sales revenues on purchasing. The Internet has greatly facilitated the globalization of the competitive business arena especially in the era of B2B e-commerce. One element of B2B e-commerce is electronic procurement (e-procurement), which is the focus of this study. Business organizations face a more complex and competitive environment than ever before in the internet era. The buyers and suppliers need to become more integrated and information systems will become the platform for integrated supply chain management. So automation of a firm’s procurement process, e-procurement, is becoming increasingly recognized for its ability to improve business operations. Government of India (GoI) has set up an e-Procurement marketplace, linking government departments, agencies and local bodies with their vendors. e -Procurement is a Mission Mode Project (MMP) under National e-Governance Plan (NeGP).Finance ministry of India issued a memorandum on March 2012 to implement comprehensive end to end e-Procurement system in all Government departments. As a result, e-procurement system was fully implemented in all the Kerala PSU’s in collaboration with NIC and IT mission on June 2012.The paper here focuses on the analysis of factors influencing employees acceptance of e-procurement in the Kerala PSU’s under the department of industries & commerce. A research survey is conducted among the employees in the purchase departments of various Kerala PSU’s and results are tested based on revised Technology Acceptance Model(TAM) using SPSS V17 and WarpPLS V3 software’s. The major variables influencing employee’s adoption of e-procurement is found out and the relationship between various factors influencing the adoption are determined.
Keywords: e- Procurement, TAM, PLS
I. INTRODUCTION
Throughout history, invention and adaptation of new technologies increase the productivity of the business firms,which will ultimately lead to high economic growth and high living standards. In industries technological advancement over the past decade has mainly focused on the plant design and manufacturing process improvement. But in recent years total
scenario of business has been changed by the technological advancement in the field of telecommunication network and information technology. Online procurement (e-procurement) is a technological solution to facilitate corporate buying using the Internet and other Information and Communication Technologies (ICT).In other words, e-procurement is the electronic (B2B or B2C or B2G) sale and purchase of goods and services [4].
E-procurement is a B2B purchasing practice that utilizes e-commerce to identify potential sources of supply, purchase goods and services, transfer payment, and interact with suppliers [7]. e-procurement has provided a unique opportunity for managers to boost the competitiveness and profitability of the businesses by expediting purchase order processes, simplifying purchase payment, expanding supplier bases, reducing paperwork’s, and eliminating order errors[13].
According to Subramaniam and Shaw [5], large organizations spend 14–30% of their revenue on procurement of non-production goods and services, such as office equipment, supplies, computers, travel, and entertainment. Organizations are uncertain of realizing the benefits of e- procurement for themselves at the ground level, and therefore the research needs to expand to overcome this [5]. Today, organizations are investing a lot in their IT infrastructure and reengineering their business processes by digitizing firms. If organizational employees are not optimum utilizing its IT infrastructure, the productivity gain reduces enormously. So, there is need to find the determinants which influence employee’s adoption and uses of e-procurement systems [16].
Realizing the importance of e-procurement and its scope in organizational competitiveness, this paper presents the results of an empirical study that was conducted to determine the relationship between various factors influencing employee’sadoption of e-procurement in Kerala PSU’s. The research study here assesses the individual determinants that influence the use of e-procurement system in Kerala public sector. The study can provide managers with the valuable information’s toundertake necessary programs to achieve greater acceptance and usage of e-procurement system. The results obtained and subsequent analyses are reported below.
International Journal of Scientific & Engineering Research, Volume 5, Issue 7, July-2014 ISSN 2229-5518 630
IJSER © 2015 http://www.ijser.org
IJSER
II. LITERATURE REVIEW
A. Electronic Procurement e-procurement / supplier exchange / supplier relationship
management is not new; there have been a number of attempts to automate the procurement process for buyers by using electronic procurement systems, workflow systems, and EDI[5]. As there is no universal definition for e-procurement, we have chosen some from the literature. The various definitions of e-procurement from literature are as follows: e-procurement is defined as a comprehensive process in which organizations use IT systems to establish agreements for the acquisition of products or services (contracting) or purchase products or services in exchange for payment (purchasing)[14].e-procurement can be defined as the process of electronically purchasing the goods and services needed for an organization’s operation[15]. An e-procurement technology is defined as any technology designed to facilitate the acquisition of goods by a commercial or a government organization over the Internet[2].e-procurement refers to the use of integrated information technology systems for procurement functions, including sourcing, negotiation, ordering, receipt and post-purchase review [1].The Aberdeen Group(2001) defines e-procurement as, ‘‘the creation ofprivate web-based procurement markets that automate communications, transactions, and collaboration between supply chain partners"[6]
B. Technology Acceptance Models Several models have been developed in the past decades
to investigate variables that influence individuals’ technology acceptance. These include TRA (Theory Of Reasoned Action), TPB (Theory Of Planned Behavior), TAM (Technology Acceptance Model) and UTAUT (Unified Theory Of Acceptance And Use Of Technology). Among these models, one of the most widely accepted is the technology acceptance model (TAM) proposed by Davis and his colleagues (Davis, 1989; Davis et al., 1989). According to Davis (1993) user acceptance is often the pivotal factor determine the success or failure of an information system.TAM has been used in the field of Information Systems since its development .The Technology Acceptance Model (TAM) introduced by Davis (1989) is an adaptation of the Theory of Reasoned Action (TRA) specifically tailored for modeling user acceptance of IS. The aim of TAM is “to provide an explanation of thedeterminants of computer acceptance that is general, capable of explaining user behavior across a broad range of end-user computing technologies and user populations, while at the same time being both parsimonious and theoretically justified” (Davis et al. 1989; p 985). It states that beliefs influence attitudes; which lead to intentions and to behaviors. TAM proposes two specific belief constructs, that is, perceived usefulness (the extent to which a technological innovation is expected to improve the potential adopter’s performance) and perceived ease of use (the degree to which the potential adopter expects a technological innovation to be free of effort
in use) as critical antecedents to an individual’s technology adoption process (Davis, 1989; Davis et al., 1989). Both perceived usefulness and perceived ease of use are specific perceptions and are anchored to specific beliefs users hold about the system. In addition, it was found that TAM was a much simpler; easier to use and more powerful model of the determinant of user acceptance of computer technology than other models (Igbaria et al., 1997).
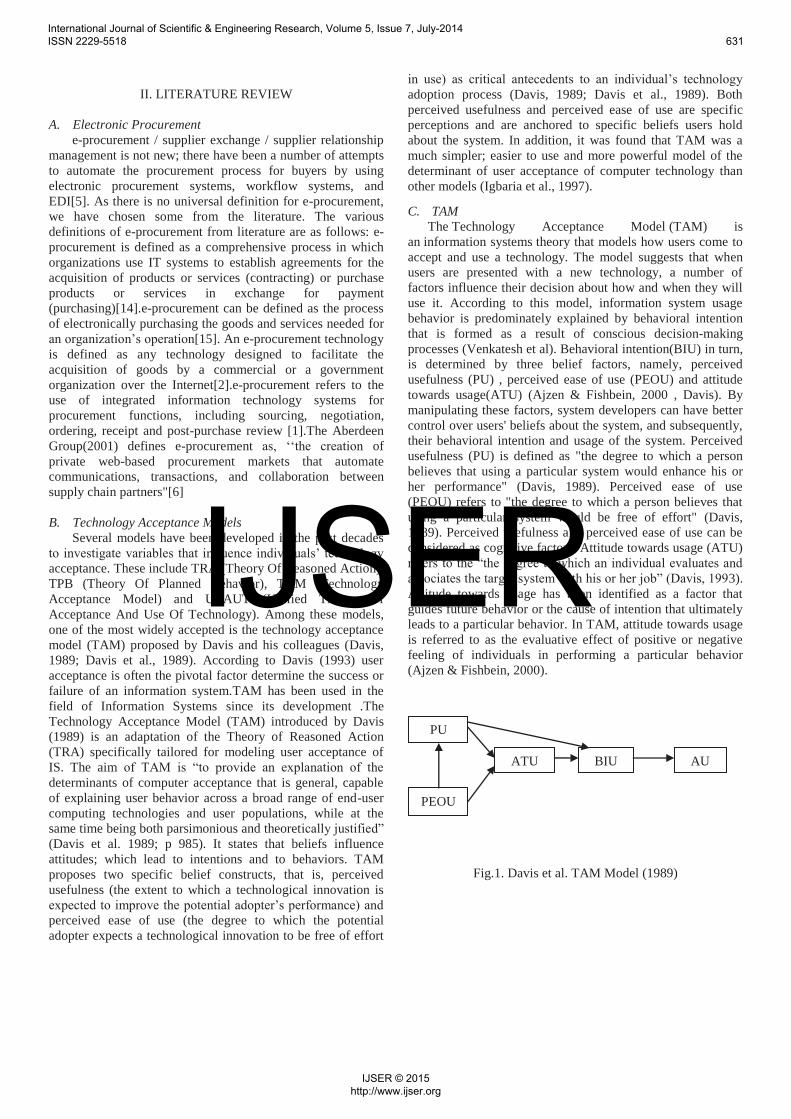
C. TAM The Technology Acceptance Model (TAM) is
an information systems theory that models how users come to accept and use a technology. The model suggests that when users are presented with a new technology, a number of factors influence their decision about how and when they will use it. According to this model, information system usage behavior is predominately explained by behavioral intention that is formed as a result of conscious decision-making processes (Venkatesh et al). Behavioral intention(BIU) in turn, is determined by three belief factors, namely, perceived usefulness (PU) , perceived ease of use (PEOU) and attitude towards usage(ATU) (Ajzen & Fishbein, 2000 , Davis). By manipulating these factors, system developers can have better control over users' beliefs about the system, and subsequently, their behavioral intention and usage of the system. Perceived usefulness (PU) is defined as "the degree to which a person believes that using a particular system would enhance his or her performance" (Davis, 1989). Perceived ease of use (PEOU) refers to "the degree to which a person believes that using a particular system would be free of effort" (Davis, 1989). Perceived usefulness and perceived ease of use can be considered as cognitive factors. Attitude towards usage (ATU) refers to the “the degree to which an individual evaluates and associates the target system with his or her job” (Davis, 1993). Attitude towards usage has been identified as a factor that guides future behavior or the cause of intention that ultimately leads to a particular behavior. In TAM, attitude towards usage is referred to as the evaluative effect of positive or negative feeling of individuals in performing a particular behavior (Ajzen & Fishbein, 2000).
Fig.1. Davis et al. TAM Model (1989)
PU
PEOU
ATU BIU AU
International Journal of Scientific & Engineering Research, Volume 5, Issue 7, July-2014 ISSN 2229-5518 631
IJSER © 2015 http://www.ijser.org
IJSER
III. RESEARCH METHODOLOGY
The research on analyzing the factors influencing employee’s adoption of e-procurement and examining the relationship between various factors can be carried out in seven stages:
STAGE1: Analysis of Secondary Literature Survey for selecting a suitable model for measuring user acceptance STAGE2: Identification of the factors and variables influencing user acceptance STAGE3: Expert Review to refine the factors and variables influencing employees acceptance STAGE4: Hypothesis development, Questionnaire Preparation and Pilot Survey STAGE5: Data Collection from PSU’sSTAGE6: Data Analysis using SPSS/MS Excel STAGE7: Data Interpretation based on descriptive statistics (SPSS) and Model Testing using PLS regression (WarpPLS)
A. Identification of factors and variables through the secondary data analysis of TAM model (Stage 1&2)
The factors which influence the employees adoption of e- procurement system may include perceived usefulness,perceived ease of use, attitude of use, behavioral intention to use and the actual use of system (discussed earlier). Davis developed measurement scales for perceived usefulness and perceived ease of use, based on psychology psychometric scales .These scales require individual’s response to various questions given in certain context. Davis proposed six questions as a tool for measuring Perceived Usefulness. These questions include items related to productivity, job performances, effectiveness and usefulness. Number of authors such as Keil, Szajna, Agarwal, Chau, Gefen and others added extra items which are related with the quality of new technologies, control of work, speed of the tasks performed and critical job aspects support in order to measure Perceived Usefulness (Legris et al., 2003). Responses obtained from these questions can be analyzed and used as a degree which indicates a person’s internal belief within considered context (Chuttur, 2009). Most frequently used items for measuring Perceived ease of use are related with the ease of operating level, rigidness and flexibility of system and effort needed to learn and use the system (Legris et al., 2003). Measures of attitude toward using the Internet were derived primarily from the Agarwal and Karashanna study (2000) where they looked at fun and enjoyment interacting with the technology. When predicting behavioral intention to use, it is important to consider both perceived usefulness and perceived ease of use (Bandura).Swansons research similarly to Bandura's, emphasized the importance of both determinants for perceived behavior. Instead of the term perceived usefulness, he used information quality and associated cost of access in his work, which are similar to perceived ease of use. One of the main findings of TAM was that perceived usefulness and perceived ease of use have a direct influence on behavioral intention
(Chuttur, 2009). Also, each of the two main constructs has an individual influence on Behavioral intention to use the system. Within their exploratory study, Schultz and Slevin (1975) realized that perceived usefulness is positively statistically correlated with the predicted use of system. Later, Robey (1979) confirmed the work of Schultz and Slevin. Behavioral intention to use directly effects the Actual system use, and that is also one of the reasons why this factor is presented within TAM, and not TRA (Teo et al., 2008). Determinants of Behavioral intention to use have a direct impact when predicting Actual system use (Tao, 2009; Hu et al., 2003). Generally, Actual use of a certain system can be obstructed by additional variables like time or money (Porter et al., 2006). It is important to realise the distinction between these two constructs. Arning and Ziefle (2007) explained distinction between attitude acceptance and behavioral acceptance. Attitude acceptance includes affective and cognitive component, while behavioral-acceptance refers to the actualsystem use. According to this, actual system use can only be partly described by behavioral intention to use, and the connection between these two constructs should not be ignored [17].
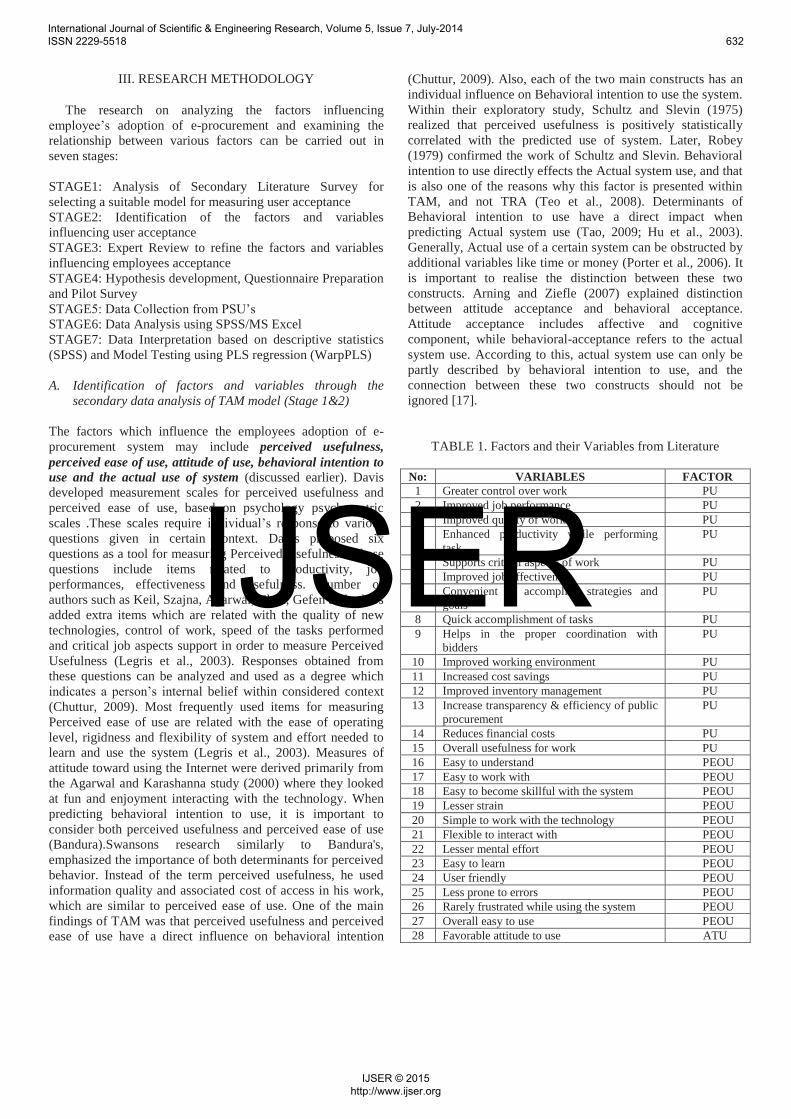
TABLE 1. Factors and their Variables from Literature
No: VARIABLES FACTOR1 Greater control over work PU2 Improved job performance PU3 Improved quality of work PU4 Enhanced productivity while performing
taskPU
5 Supports critical aspects of work PU6 Improved job effectiveness PU7 Convenient to accomplish strategies and
goalsPU
8 Quick accomplishment of tasks PU9 Helps in the proper coordination with
biddersPU
10 Improved working environment PU11 Increased cost savings PU12 Improved inventory management PU13 Increase transparency & efficiency of public
procurementPU
14 Reduces financial costs PU15 Overall usefulness for work PU16 Easy to understand PEOU17 Easy to work with PEOU18 Easy to become skillful with the system PEOU19 Lesser strain PEOU20 Simple to work with the technology PEOU21 Flexible to interact with PEOU22 Lesser mental effort PEOU23 Easy to learn PEOU24 User friendly PEOU25 Less prone to errors PEOU26 Rarely frustrated while using the system PEOU27 Overall easy to use PEOU28 Favorable attitude to use ATU
International Journal of Scientific & Engineering Research, Volume 5, Issue 7, July-2014 ISSN 2229-5518 632
IJSER © 2015 http://www.ijser.org
IJSER
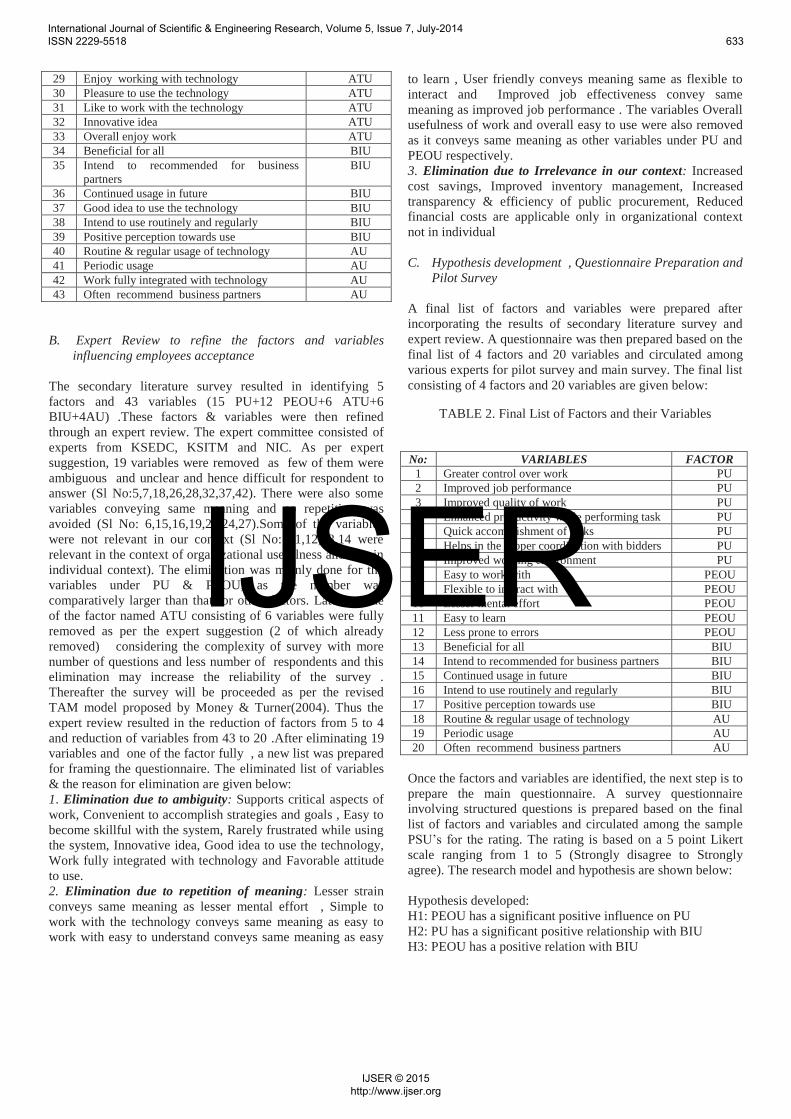
29 Enjoy working with technology ATU30 Pleasure to use the technology ATU31 Like to work with the technology ATU32 Innovative idea ATU33 Overall enjoy work ATU34 Beneficial for all BIU35 Intend to recommended for business
partnersBIU
36 Continued usage in future BIU37 Good idea to use the technology BIU38 Intend to use routinely and regularly BIU39 Positive perception towards use BIU40 Routine & regular usage of technology AU41 Periodic usage AU42 Work fully integrated with technology AU43 Often recommend business partners AU
B. Expert Review to refine the factors and variables influencing employees acceptance
The secondary literature survey resulted in identifying 5 factors and 43 variables (15 PU+12 PEOU+6 ATU+6 BIU+4AU) .These factors & variables were then refined through an expert review. The expert committee consisted of experts from KSEDC, KSITM and NIC. As per expert suggestion, 19 variables were removed as few of them were ambiguous and unclear and hence difficult for respondent to answer (Sl No:5,7,18,26,28,32,37,42). There were also some variables conveying same meaning and so repetition was avoided (Sl No: 6,15,16,19,20,24,27).Some of the variables were not relevant in our context (Sl No: 11,12,13,14 were relevant in the context of organizational usefulness and not in individual context). The elimination was mainly done for the variables under PU & PEOU, as the number was comparatively larger than that for other factors. Later on one of the factor named ATU consisting of 6 variables were fully removed as per the expert suggestion (2 of which already removed) considering the complexity of survey with more number of questions and less number of respondents and this elimination may increase the reliability of the survey . Thereafter the survey will be proceeded as per the revised TAM model proposed by Money & Turner(2004). Thus the expert review resulted in the reduction of factors from 5 to 4 and reduction of variables from 43 to 20 .After eliminating 19 variables and one of the factor fully , a new list was prepared for framing the questionnaire. The eliminated list of variables & the reason for elimination are given below: 1. Elimination due to ambiguity: Supports critical aspects ofwork, Convenient to accomplish strategies and goals , Easy to become skillful with the system, Rarely frustrated while using the system, Innovative idea, Good idea to use the technology, Work fully integrated with technology and Favorable attitude to use. 2. Elimination due to repetition of meaning: Lesser strainconveys same meaning as lesser mental effort , Simple to work with the technology conveys same meaning as easy to work with easy to understand conveys same meaning as easy
to learn , User friendly conveys meaning same as flexible to interact and Improved job effectiveness convey same meaning as improved job performance . The variables Overall usefulness of work and overall easy to use were also removed as it conveys same meaning as other variables under PU and PEOU respectively. 3. Elimination due to Irrelevance in our context: Increasedcost savings, Improved inventory management, Increased transparency & efficiency of public procurement, Reduced financial costs are applicable only in organizational context not in individual
C. Hypothesis development , Questionnaire Preparation and Pilot Survey
A final list of factors and variables were prepared after incorporating the results of secondary literature survey and expert review. A questionnaire was then prepared based on the final list of 4 factors and 20 variables and circulated among various experts for pilot survey and main survey. The final list consisting of 4 factors and 20 variables are given below:
TABLE 2. Final List of Factors and their Variables
No: VARIABLES FACTOR1 Greater control over work PU2 Improved job performance PU3 Improved quality of work PU4 Enhanced productivity while performing task PU5 Quick accomplishment of tasks PU6 Helps in the proper coordination with bidders PU7 Improved working environment PU8 Easy to work with PEOU9 Flexible to interact with PEOU
10 Lesser mental effort PEOU11 Easy to learn PEOU12 Less prone to errors PEOU13 Beneficial for all BIU14 Intend to recommended for business partners BIU15 Continued usage in future BIU16 Intend to use routinely and regularly BIU17 Positive perception towards use BIU18 Routine & regular usage of technology AU19 Periodic usage AU20 Often recommend business partners AU
Once the factors and variables are identified, the next step is to prepare the main questionnaire. A survey questionnaire involving structured questions is prepared based on the final list of factors and variables and circulated among the sample PSU’s for the rating. The rating is based on a 5 point Likert scale ranging from 1 to 5 (Strongly disagree to Strongly agree). The research model and hypothesis are shown below:
Hypothesis developed: H1: PEOU has a significant positive influence on PU H2: PU has a significant positive relationship with BIU H3: PEOU has a positive relation with BIU
International Journal of Scientific & Engineering Research, Volume 5, Issue 7, July-2014 ISSN 2229-5518 633
IJSER © 2015 http://www.ijser.org
IJSER
H4: BIU is positively related to actual use of e P
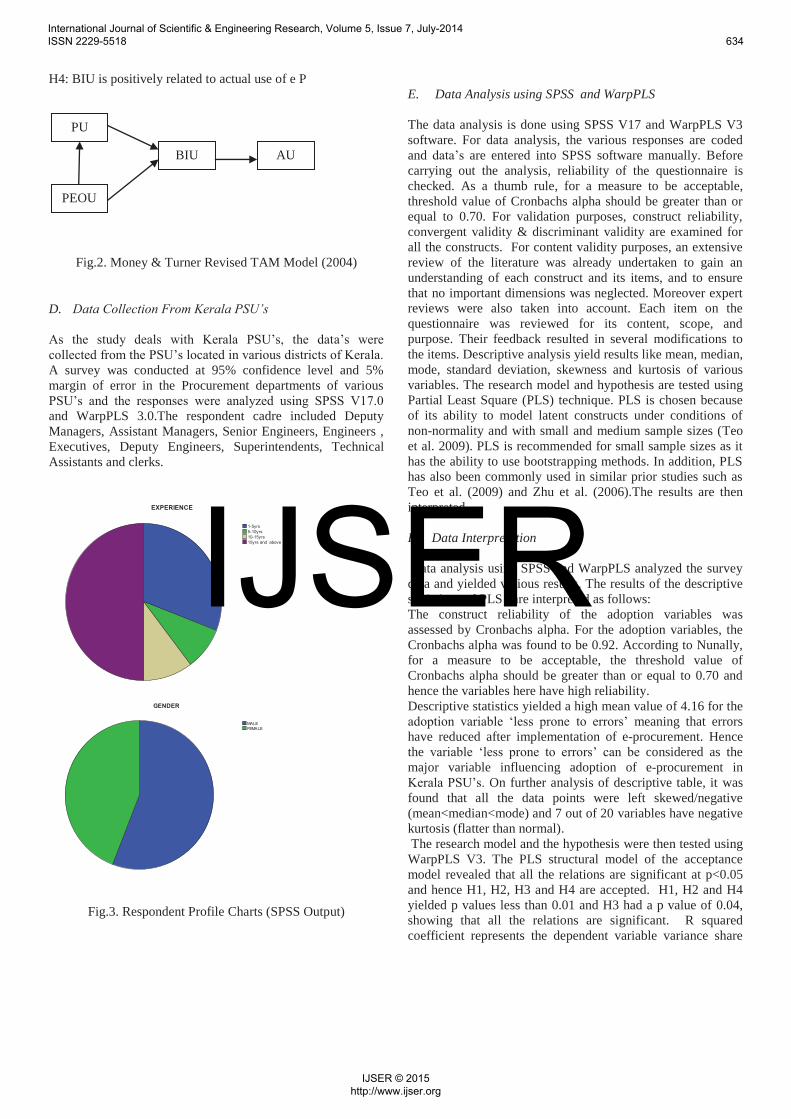
Fig.2. Money & Turner Revised TAM Model (2004)
D. Data Collection From Kerala PSU’s
As the study deals with Kerala PSU’s, the data’s were collected from the PSU’s located in various districts of Kerala. A survey was conducted at 95% confidence level and 5% margin of error in the Procurement departments of various PSU’s and the responses were analyzed using SPSS V17.0 and WarpPLS 3.0.The respondent cadre included Deputy Managers, Assistant Managers, Senior Engineers, Engineers , Executives, Deputy Engineers, Superintendents, Technical Assistants and clerks.
Fig.3. Respondent Profile Charts (SPSS Output)
E. Data Analysis using SPSS and WarpPLS
The data analysis is done using SPSS V17 and WarpPLS V3 software. For data analysis, the various responses are coded and data’s are entered into SPSS software manually. Before carrying out the analysis, reliability of the questionnaire is checked. As a thumb rule, for a measure to be acceptable, threshold value of Cronbachs alpha should be greater than or equal to 0.70. For validation purposes, construct reliability, convergent validity & discriminant validity are examined for all the constructs. For content validity purposes, an extensive review of the literature was already undertaken to gain an understanding of each construct and its items, and to ensure that no important dimensions was neglected. Moreover expert reviews were also taken into account. Each item on the questionnaire was reviewed for its content, scope, and purpose. Their feedback resulted in several modifications to the items. Descriptive analysis yield results like mean, median, mode, standard deviation, skewness and kurtosis of various variables. The research model and hypothesis are tested using Partial Least Square (PLS) technique. PLS is chosen because of its ability to model latent constructs under conditions of non-normality and with small and medium sample sizes (Teo et al. 2009). PLS is recommended for small sample sizes as it has the ability to use bootstrapping methods. In addition, PLS has also been commonly used in similar prior studies such as Teo et al. (2009) and Zhu et al. (2006).The results are then interpreted.
F. Data Interpretation
Data analysis using SPSS and WarpPLS analyzed the survey data and yielded various results. The results of the descriptive statistics and PLS are interpreted as follows: The construct reliability of the adoption variables wasassessed by Cronbachs alpha. For the adoption variables, the Cronbachs alpha was found to be 0.92. According to Nunally, for a measure to be acceptable, the threshold value of Cronbachs alpha should be greater than or equal to 0.70 and hence the variables here have high reliability. Descriptive statistics yielded a high mean value of 4.16 for the adoption variable ‘less prone to errors’ meaning that errors have reduced after implementation of e-procurement. Hence the variable ‘less prone to errors’ can be considered as the major variable influencing adoption of e-procurement in Kerala PSU’s. On further analysis of descriptive table, it was found that all the data points were left skewed/negative (mean<median<mode) and 7 out of 20 variables have negative kurtosis (flatter than normal). The research model and the hypothesis were then tested using WarpPLS V3. The PLS structural model of the acceptance model revealed that all the relations are significant at p<0.05 and hence H1, H2, H3 and H4 are accepted. H1, H2 and H4 yielded p values less than 0.01 and H3 had a p value of 0.04, showing that all the relations are significant. R squared coefficient represents the dependent variable variance share
PU
PEOU
BIU AU
International Journal of Scientific & Engineering Research, Volume 5, Issue 7, July-2014 ISSN 2229-5518 634
IJSER © 2015 http://www.ijser.org
IJSER
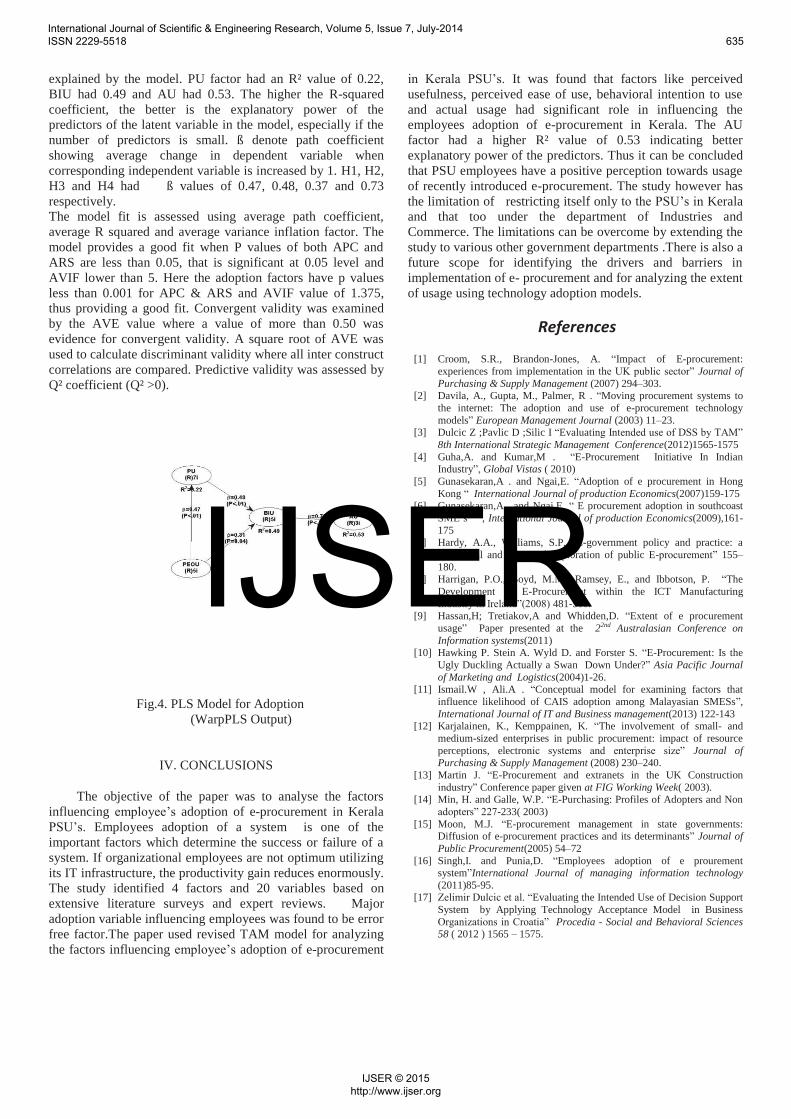
explained by the model. PU factor had an R² value of 0.22, BIU had 0.49 and AU had 0.53. The higher the R-squared coefficient, the better is the explanatory power of the predictors of the latent variable in the model, especially if the number of predictors is small. ß denote path coefficient showing average change in dependent variable when corresponding independent variable is increased by 1. H1, H2, H3 and H4 had ß values of 0.47, 0.48, 0.37 and 0.73 respectively. The model fit is assessed using average path coefficient, average R squared and average variance inflation factor. The model provides a good fit when P values of both APC and ARS are less than 0.05, that is significant at 0.05 level and AVIF lower than 5. Here the adoption factors have p values less than 0.001 for APC & ARS and AVIF value of 1.375,thus providing a good fit. Convergent validity was examined by the AVE value where a value of more than 0.50 was evidence for convergent validity. A square root of AVE was used to calculate discriminant validity where all inter construct correlations are compared. Predictive validity was assessed by Q² coefficient (Q² >0).
Fig.4. PLS Model for Adoption (WarpPLS Output)
IV. CONCLUSIONS
The objective of the paper was to analyse the factors influencing employee’s adoption of e-procurement in Kerala PSU’s. Employees adoption of a system is one of the important factors which determine the success or failure of a system. If organizational employees are not optimum utilizing its IT infrastructure, the productivity gain reduces enormously. The study identified 4 factors and 20 variables based on extensive literature surveys and expert reviews. Major adoption variable influencing employees was found to be error free factor.The paper used revised TAM model for analyzing the factors influencing employee’s adoption of e-procurement
in Kerala PSU’s. It was found that factors like perceived usefulness, perceived ease of use, behavioral intention to use and actual usage had significant role in influencing the employees adoption of e-procurement in Kerala. The AU factor had a higher R² value of 0.53 indicating better explanatory power of the predictors. Thus it can be concluded that PSU employees have a positive perception towards usage of recently introduced e-procurement. The study however has the limitation of restricting itself only to the PSU’s in Kerala and that too under the department of Industries and Commerce. The limitations can be overcome by extending the study to various other government departments .There is also a future scope for identifying the drivers and barriers in implementation of e- procurement and for analyzing the extent of usage using technology adoption models.
References
[1] Croom, S.R., Brandon-Jones, A. “Impact of E-procurement: experiences from implementation in the UK public sector” Journal of Purchasing & Supply Management (2007) 294–303.
[2] Davila, A., Gupta, M., Palmer, R . “Moving procurement systems to the internet: The adoption and use of e-procurement technology models” European Management Journal (2003) 11–23.
[3] Dulcic Z ;Pavlic D ;Silic I “Evaluating Intended use of DSS by TAM” 8th International Strategic Management Conference(2012)1565-1575
[4] Guha,A. and Kumar,M . “E-Procurement Initiative In Indian Industry”, Global Vistas ( 2010)
[5] Gunasekaran,A . and Ngai,E. “Adoption of e procurement in Hong Kong “ International Journal of production Economics(2007)159-175
[6] Gunasekaran,A . and Ngai,E. “ E procurement adoption in southcoast SME’s” , International Journal of production Economics(2009),161-175
[7] Hardy, A.A., Williams, S.P. “E-government policy and practice: a theoretical and empirical exploration of public E-procurement” 155–180.
[8] Harrigan, P.O., Boyd, M.M., Ramsey, E., and Ibbotson, P. “The Development of E-Procurement within the ICT Manufacturing Industry in Ireland”(2008) 481-500.
[9] Hassan,H; Tretiakov,A and Whidden,D. “Extent of e procurement usage” Paper presented at the 22nd Australasian Conference on Information systems(2011)
[10] Hawking P. Stein A. Wyld D. and Forster S. “E-Procurement: Is the Ugly Duckling Actually a Swan Down Under?” Asia Pacific Journal of Marketing and Logistics(2004)1-26.
[11] Ismail.W , Ali.A . “Conceptual model for examining factors that influence likelihood of CAIS adoption among Malayasian SMESs”,International Journal of IT and Business management(2013) 122-143
[12] Karjalainen, K., Kemppainen, K. “The involvement of small- and medium-sized enterprises in public procurement: impact of resource perceptions, electronic systems and enterprise size” Journal of Purchasing & Supply Management (2008) 230–240.
[13] Martin J. “E-Procurement and extranets in the UK Construction industry” Conference paper given at FIG Working Week( 2003).
[14] Min, H. and Galle, W.P. “E-Purchasing: Profiles of Adopters and Non adopters” 227-233( 2003)
[15] Moon, M.J. “E-procurement management in state governments: Diffusion of e-procurement practices and its determinants” Journal of Public Procurement(2005) 54–72
[16] Singh,I. and Punia,D. “Employees adoption of e prourement system”International Journal of managing information technology (2011)85-95.
[17] Zelimir Dulcic et al. “Evaluating the Intended Use of Decision Support System by Applying Technology Acceptance Model in Business Organizations in Croatia” Procedia - Social and Behavioral Sciences 58 ( 2012 ) 1565 – 1575.
International Journal of Scientific & Engineering Research, Volume 5, Issue 7, July-2014 ISSN 2229-5518 635
IJSER © 2015 http://www.ijser.org
IJSER