PSR PAGE 181 TO 234 - Shodhganga : a reservoir of...
54
181 CHAPTER -5 ANALYSIS & INTERPRETATION ANGANWADI WORKERS INTRODUCTION This Chapter presents, analyzes and interprets the data collected from a sample of 60 Anganwadi Workers in Kolhapur District - the study area. This chapter is divided into 5 sections. Section I deals with Personal Information, Section II relates to Family Information, Workplace Information is explained in Section III, Information about Mother and Child Welfare Services Delivered through the Anganwadis is given in Section IV and information about their Personal, Social and Workplace-related Problems is given in Section V. In the following pages, this information is being presented in simple Tables. Wherever appropriate and necessary, further sub-Tables have been incorporated in the main Tables to maintain a smooth flow of analysis.
Transcript of PSR PAGE 181 TO 234 - Shodhganga : a reservoir of...

181
CHAPTER -5
ANALYSIS & INTERPRETATION
ANGANWADI WORKERS
INTRODUCTION
This Chapter presents, analyzes and interprets the data collected from a
sample of 60 Anganwadi Workers in Kolhapur District - the study area.
This chapter is divided into 5 sections.
Section I deals with Personal Information, Section II relates to Family
Information, Workplace Information is explained in Section III,
Information about Mother and Child Welfare Services Delivered through
the Anganwadis is given in Section IV and information about their
Personal, Social and Workplace-related Problems is given in
Section V.
In the following pages, this information is being presented in simple
Tables. Wherever appropriate and necessary, further sub-Tables have
been incorporated in the main Tables to maintain a smooth flow of
analysis.

182
SECTION – I
PERSONAL INFORMATION OF ANGANWADI WORKERS
The following 7 Tables (5.1 to 5.7) present the personal information of
the respondent Anganwadi workers.
TABLE 5.1
CLASSIFICATION OF RESPONDENTS ACCORDING
TO AGE GROUPS
Sr.No. Age groups Frequency Percentage
1 18-25 years 5 8.33
2 26-35 years 20 33.33
3 36-45 years 20 33.33
4 Above 46 years 15 25.00
Total 60 100.0
Age is an important factor to be considered in determining the efficiency
of the population in the study the age has been classified into different
groups in 18-25, 26-35, 36-45 as middle age and above 45 as old age.
Table No. 5.1 shows that the two largest groups of 20 (33.33%) each
respondents belong to the age groups of 26-35 years and 36-45 years,
followed by only 15 (25%) respondents belonging to the age group of
above 46 years. Only 5 (8.33%) respondents constitute in the age group
of 18-25 years.
It is thus evident that majority of the respondents are concentrated in the
early and late adulthood stage. Hence these Anganwadi workers are
young and in the most productive age groups. It is apparent that the
respondents are hale and healthy and perform their work.

183
TABLE 5.2
MARITAL STATUS OF THE RESPONDENTS
Sr. No. Marital Status Frequency Percentage
1 Single 4 6.67
2 Married 49 81.67
3 Separated - -
4 Divorcee 2 3.33
5 Widowed 5 8.33
Total 60 100.0
The above Table 5.2 shows the respondents according to their marital
status and shows that a great majority, 49 (81.67%) are married, when 5
(8.33%) respondents are widowed, 4 (6.67%) respondents are single and
2 (3.33%) respondents are divorcees. There are no separated cases in the
sample.
It may thus be inferred that about four-fifths of the respondents are
married women showing a stable normal life. Little more than 10% are
divorcees and widowed. In Indian culture marriage is a life bond and the
respondents seem to be leading a health married life in spite of their
employment. Traditionally women are confined to their houses and are
expected to fulfill the family needs. It is obvious that employment of
women is accepted in the family and in no way it has distracted the
family and marital relations.

184
TABLE 5.3
CLASSIFICATION OF RESPONDENTS ACCORDING TO
EDUCATIONAL LEVELS
Sr. No. Educational Levels Frequency Percentage
1 10th Standard Passed
3 5.00
2 12th Standard Passed
27 45.00
3 Upto Degree 20 33.33
4 Graduate 4 6.67
5 Craft Training Course
6 10.00
Total 60 100.0
The above Table 5.3 discloses the educational status of the respondents
and shows that the 45% respondents are 12th standard passed, followed by
20 (33.33%) respondents who have degree, 6 (10%) respondents have
completed craft training course, 4 (6.67%) are graduates, while only 3
(5%) respondents are 10th standard passed.
The data depicts that respondents’ qualification ranges from 10th to
graduate. Most of them are educated and qualified.

185
TABLE 5.4
CLASSIFICATION OF RESPONDENTS ACCORDING TO
RELIGIONS
Sr. No. Religions Frequency Percentage
1 Hindu 55 91.67
2 Jain 3 5.00
3 Muslim 1 1.66
4 Neo-Buddhist 1 1.67
Total 60 100.0
The above Table 5.4 discloses the respondents according to their religions
and shows that a majority 55 (91.67) respondents are Hindus, followed by
3 (5%) respondents Jains, and 1 (1.67%) each respondents Muslim,
Lingayat and Neo-Buddhist, respectively.
It be interpreted that large majority of Anganwadi workers belong to the
Hindu community. Since Hindus are the dominant community, it is
obvious that majority are Hindus. However, presence of all religions
except Christians is observed in the data.

186
TABLE 5.5
CLASSIFICATION OF RESPONDENTS
ACCORDING TO CASTES
Sr. No. Castes Frequency Percentage
1 Upper Castes 40 66.67
2 Scheduled Castes
13 21.67
3 Nomadic Tribes
7 11.66
Total 60 100.0
The above Table 5.5 discloses caste distribution and shows that 40
(66.67%) respondents belong to the advanced castes amongst Hindus, 13
(21.67%) respondents belong to the Scheduled Castes, while 7 (11.66%)
respondents belong to Nomadic Castes. There are no respondents
belonging to Scheduled or Denotified Tribes.
It may thus be inferred that the advanced castes from amongst Hindus
dominate the Anganwadi workers’ employment scenario in the study
area, while other communities also have made their presence felt.

187
TABLE 5.6
CLASSIFICATION OF RESPONDENTS ACCORDING
TO MOTHER TONGUE
Sr. No. Mother tongue Frequency Percentage
1 Marathi 58 96.66
2 Kannada 1 1.67
3 Urdu 1 1.67
Total 60 100.0
The above Table 5.6 classifies the respondents according to their mother
tongues and shows that an overwhelming majority of 58 (96.66%)
respondents have Marathi as their mother tongue, while 1 (1.67%) each
respondent have Kannada and Urdu, respectively, as their mother
tongues.
Since these Anganwadi workers hail from the Marathi-speaking rural
areas of Kolhapur district, hence it is natural that Marathi is the dominant
language spoken among respondents and other groups constitute together
only a meager 3.34 percentage. Hence it is apparent that local people
dominate in Anganwadis. Since local language is a must to cater the
people other language speaking respondents perhaps are considered for
the job.

188
TABLE 5.7
CLASSIFICATION OF RESPONDENTS ACCORDING TO
ANGANWADI WORK EXPERIENCE
Sr. No. Work Experience Frequency Percentage
1 Upto 5 years 7 11.67
2 6 to 10 years 27 45.00
3 11 to 15 years 14 23.33
4 Above 16 years 12 20.00
Total 60 100.0
The above Table 5.7 classifies the respondents according to their
Anganwadi work experience and shows that the largest group of 27
(45%) respondents have 6-10 years experience, followed by 14 (23.33%)
respondents have work experience between 11-15 years, 12 (20%)
respondents have work experience of more than 16 years, while only 7
(11.67%) respondents have experience only for 5 years.
It may thus be inferred that a majority of the Anganwadi workers have
reasonably a long experience of Anganwadi work and at least one-fifth of
them are real veterans.
Personal Profile of Anganwadi Workers
From these seven Tables, it may be inferred that the representative
Anganwadi worker in the study area belongs to 25-45 year group, Hindu,
Marathi-speaking married women with attendant family responsibilities.
She has reasonably a long experience of Anganwadi work. With these
attributes, it is clear that she has woven her family and social life around
her worklife as an Anganwadi worker.

189
SECTION – II
FAMILY INFORMATION
FAMILY INFORMATION OF ANGANWADI WORKERS
The following 9 Tables (5.8 to 5.16) present the family information of the
respondents.
TABLE 5.8
CLASSIFICATION OF RESPONDENTS ACCORDING TO FAMILY TYPE
Sr. No. Family Type Frequency Percentage
1 Nuclear 29 48.33
2 Joint 31 51.67
Total 60 100.0
Family is a primary unit in all societies. It provides the environment in
which the young grow up, it is o vital concern for all who teach or in any
way seek to inculcate standards of opinion and behaviour. Measurements
of families have charted fundamental changes in family life, the structure
and breakdown of the family. Family information gives a clear picture
about the present status of the family.
The present section covers information regarding type of family, family
size, occupation of the head of the family, number of earning members,
elderly dependents, minor school-going children, monthly family income
and treatment received by respondents in the family.
The above Table 5.8 shows the distribution of respondents according to
their family type and shows that 29 (48.33%) respondents belong to
nuclear-type family, while more than one half of the respondents belong

190
to joint family. Nearly an equal share of nuclear type families in the
sample in this typical rural agrarian area is rather deceptive, because with
the partition of ancestral family lands, many families have separated their
kitchens but continue to live under the same roof and still retain the
family bonds. Women usually enter into employment for economic
freedom to supplement family income. This is more evident usually in
nuclear families where the income is generated to supplement the family
income. Perhaps this is true for the data.
Nevertheless, it may be observed that the urban feature of a nuclear
family is making significant inroads in the rural areas.

191
TABLE 5.9
CLASSIFICATION OF RESPONDENTS ACCORDING
TO FAMILY SIZE
Sr. No. Family Size Frequency Percentage
1 Upto 4 Members 29 48.34
2 5 to 7 Members 20 33.33
3 8 to 10 Members 11 18.33
Total 60 100.0
The above Table 5.9 classifies the respondents according to their family
size and shows that 29 (48.34%) respondents’ nuclear-type families (ref.
Table 5.8) have only upto 4 members, while out of the remaining 20
(33.33%) respondents’ families have 5-7 members and 11 (18.33%)
respondents’ families have 8-10 members.
Family size is an indicator of the capable income of the family when
there is large family there is a need for a helping hand in enhancing
income is important.

192
TABLE 5.10
CLASSIFICATION OF RESPONDENTS ACCORDING TO
FAMILY HEAD'S OCCUPATION
Sr. No. Occupation Frequency Percentage
1 Paid Service 27 45.00
2 Traditional Family Occupation
13 21.67
3 Self-employed (Petty trade)
7 11.67
4 Agriculture 5 8.33
5 Seasonal Farm Work
5 8.33
6 Daily Wage Labourer
3 5.00
Total 60 100.0
The above Table 5.10 classifies occupation of the head of the family and
shows that 27 (45%) respondents’ family head is in paid employment,
thereby ensuring regular family income; another 13 (21.67%)
respondents’ family head is engaged in traditional family occupations
(tailoring, laundry work, iron smithy, bamboo work, etc.), 7 (11.67%) is
self-employed (mostly petty shops), 5 (8.33%) whole-time engaged in
their own agricultural lands, while another 5 (8.33%) respondents’ family
head gets only seasonal farm work, and lastly, 3 (5%) is daily wage
labourer.
The data reveals that though relatively a high percentage of the head of
the families are in paid jobs, the employment status perhaps not highly
lucrative. Hence the respondents have entered into employment.
193
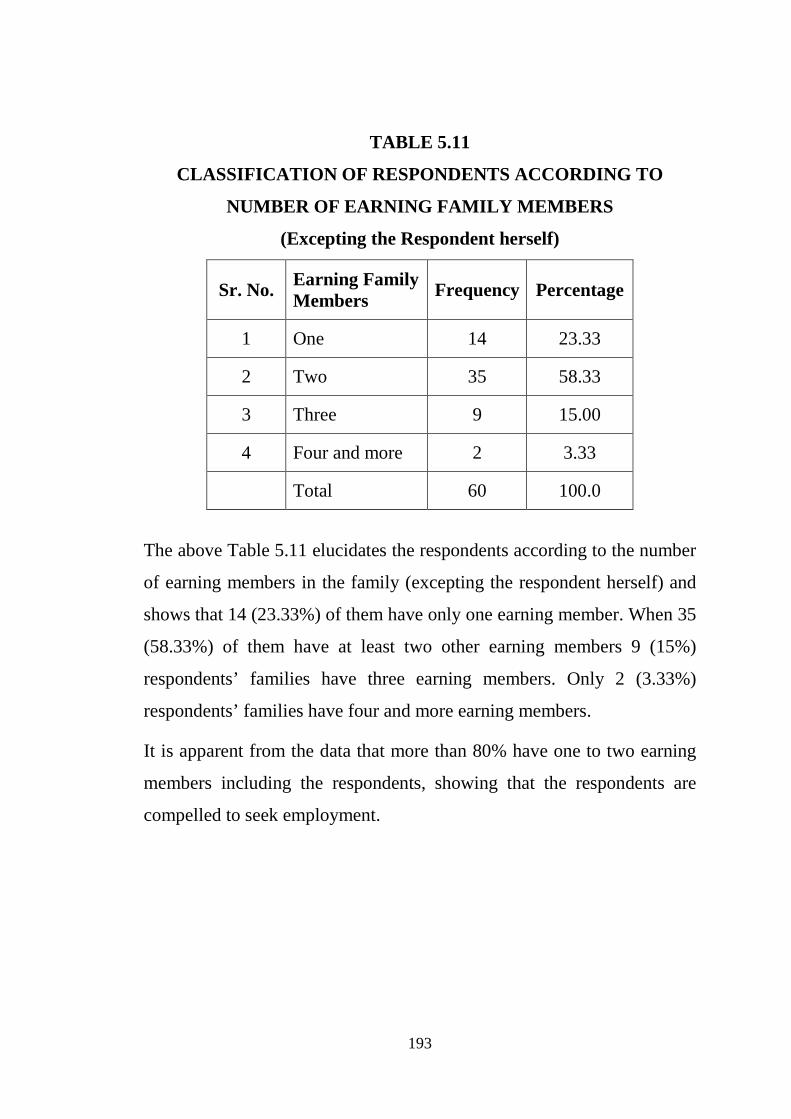
TABLE 5.11
CLASSIFICATION OF RESPONDENTS ACCORDING TO
NUMBER OF EARNING FAMILY MEMBERS
(Excepting the Respondent herself)
Sr. No. Earning Family Members Frequency Percentage
1 One 14 23.33
2 Two 35 58.33
3 Three 9 15.00
4 Four and more 2 3.33
Total 60 100.0
The above Table 5.11 elucidates the respondents according to the number
of earning members in the family (excepting the respondent herself) and
shows that 14 (23.33%) of them have only one earning member. When 35
(58.33%) of them have at least two other earning members 9 (15%)
respondents’ families have three earning members. Only 2 (3.33%)
respondents’ families have four and more earning members.
It is apparent from the data that more than 80% have one to two earning
members including the respondents, showing that the respondents are
compelled to seek employment.

194
TABLE 5.12
CLASSIFICATION OF RESPONDENTS ACCORDING TO
ELDERLY DEPENDENTS
Sr. No. Number of Elderly Dependents
Frequency Percentage
1 None 35 58.33
2 One 17 28.33
3 Two 7 11.67
4 Three & more 1 1.67
Total 60 100.0
The above Table 5.12 shows the elderly dependents in the family and
shows that 35 (58.33%) respondents’ families have no elderly
dependents. On the other hand, 17 (28.22%) respondents’ families have at
least one elderly dependent, 7 (11.67%) respondents’ families have two
dependents and only, 1 (1.67%) respondent family has three and more
such dependents in the family.

195
TABLE 5.13
CLASSIFICATION OF RESPONDENTS ACCORDING TO
SCHOOL-GOING MINOR CHILDREN
Sr. No. Number of School-going Minor Children
Frequency Percentage
1 None 26 43.33
2 One 4 6.67
3 Two 16 26.67
4 Three & more 14 23.33
Total 60 100.0
The above Table 5.13 depicts school-going minor children in the family
when 26 (43.33%) respondents’ families do not have school-going minor
children, 4 (6.67%) respondents’ families have one, 16 (26.67%)
respondents’ families have two, and 14 (23.33%) respondents families
have three or more school-going children.
Overall, it may thus be inferred that slightly more than one half of the
respondents’ families have school-going minor children, it indicates an
enhanced awareness of the formal education among the respondents’
families. Further for education it is necessary to have additional income
and perhaps the respondents work to enhance family income.

196
TABLE 5.14
CLASSIFICATION OF RESPONDENTS ACCORDING TO
MONTHLY FAMILY INCOME
Sr. No. Monthly Family Income Frequency Percentage
1 Upto Rs.2,500/- 6 10.00
2 Rs.2,501-3,500/- 2 3.33
3 Rs.3,501-5,000/- 15 25.00
4 Above Rs.5,000/-
37 61.67
Total 60 100.0
The above Table 5.14 reveals the monthly family income of the family. A
small 6 (10%) respondents have a monthly family income of Rs.2,500/-
while another 2 (3.33%) respondents’ monthly family income is between
Rs.2,501 and 3,500/-. while 15 (25%) respondents’ monthly family
income is between Rs.3,501 and 5,000/- and 37 (61.67%) respondents’
monthly family income is above Rs.5,000/-. Obviously, the monthly
family income of the joint families with multiple earning members is
comparatively higher.
It may thus be observed that overall, the sampled respondents’ families
are not particularly well-off financially and hence probably the
respondent has to work as an Anganwadi worker to supplement the
family income.

197
TABLE 5.15
CLASSIFICATION OF RESPONDENTS ACCORDING TO
TREATMENT RECEIVED IN THE FAMILY
Sr. No. Treatment received Frequency Percentage
1 Respectful 55 91.67
2 Cordial 5 8.33
3 Indifferent - -
4 Hateful - -
5 Cruel - -
Total 60 100.0
The above Table 5.15 discloses the respondents according to the
treatment received by them in the family and shows that an
overwhelming majority of 55 (91.67%) of the respondents receive
respectful treatment in the family, while the remaining 5 (8.33%)
respondents have cordial relation. None of the respondents are seen
receiving indifferent, hateful or cruel treatment in the family.
The data shows that the respectful and cordial treatment is being received
by the Anganwadi workers is probably the result of their being an earning
member in the family. Further it shows that their employment is accepted
by other family members and they have a status in the family and are able
to manage without any conflict.

198
TABLE 5.16
CLASSIFICATION OF RESPONDENTS ACCORDING TO AN IN-
HOUSE CASE OF AN ALCOHOLIC
Sr. No. Response Frequency Percentage
1 Yes 5 8.33
2 No 55 91.67
Total 60 100.0
The above Table 5.16 displays in-house case of an alcoholic (as distinct
from an occasional tippler) and shows that an overwhelming majority of
55 (91.67%) respondents’ households, there is no alcoholic case, but
among 5 (8.33%) respondents’ households, there is at least one case of
hard alcoholics. A cross-check revealed that all these five households are
joint family-type and belong to the above Rs.5,000 income group.
It may thus be inferred that the majority of the Anganwadi workers’
households are free from the disgrace of alcoholism, which is rather
important from the viewpoint of the family income.
From these nine Tables, it may be inferred that the representative
Anganwadi worker in the study area lives either in a nuclear or joint-type
family, has upto 4 members in the nuclear family and upto 7 members in
the joint family, headed by a householder in paid service or other gainful
activities, she also has at least 2 other earning family members besides
herself, has between one to three school-going minor children, her family
has a monthly income between Rs.3,501 and above Rs.5,000/-, she
receives respectful treatment in the family and does not have an in-house
case of alcoholism.

199
SECTION – III
EMPLOYMENT ASPECTS OF ANGANWADI WORKERS
The following 12 Tables (5.17 to 5.26) present the workplace-related
information of the respondent Anganwadi workers.
TABLE 5.17
CLASSIFICATION OF RESPONDENTS ACCORDING TO
DISTANCE BETWEEN HOME AND ANGANWADI
Sr. No. Distance in kms. Frequency Percentage
1 Upto 2 kms. 53 88.33
2 2 to 5 kms. 4 6.67
3 5 to 7 kms. 3 5.00
Total 60 100.0
The above Table 5.17 shows the distance between home and the
Anganwadi and shows that 53 (88.33%) respondents have to travel a
distance of only upto 2 kms. for reaching the Anganwadi, another 4
(6.67%) respondents have to cover a distance between 2 and 5 kms.,
while the remaining 3 (5%) respondents have to travel between 5 to 7
kms. for the purpose.
It may thus be inferred that majority of the Anganwadi workers have to
cover only a distance of around 2 kms to reach their workplace, showing
that the workplace is within the vicinity of their residence. Long traveling
perhaps can affect the work

200
TABLE 5.18
CLASSIFICATION OF RESPONDENTS ACCORDING TO
MEANS USED FOR REACHING ANGANWADI
Sr. No. Mode of travelling Frequency Percentage
1 Walking 53 88.33
2 ST Bus 5 8.33
3 2-wheeler Moped 1 1.67
4. Bicycle 1 1.67
Total 60 100.0
The above Table 5.18 reveals the respondents according to the mode of
traveling to the workplace and shows that 53 (88.33%) a good majority of
the respondents reach their workplace by merely walking. When 5
(8.33%) respondents travel by State Transport (ST) bus, only 1 (1.67%)
each respondents use either a moped or a bicycle.
It may thus be inferred that walking is the most preferred option among
the Anganwadi workers for reaching the workplace as most of the
respondents have to cover only a distance of 2 kms.

201
TABLE 5.19
CLASSIFICATION OF RESPONDENTS ACCORDING TO TYPE
OF ANGANWADI BUILDING
Sr. No. Description Frequency Percentage
1 RCC with cement slab roof
13 21.67
2 Stone / Brick walls and tiled roof
35 58.33
3 Brick walls and cement/tin sheet roof
12 20.00
Total 60 100.0
The above Table 5.19 shows the type of Anganwadi building in which
they work. When 21.67% of them work in pucca RCC building with
cement slab roof, 58.33% have building with stone / bricks and tiled roofs
while 20% are working in building which is of brick / cement walls and
tin sheet roof.
The observation shows that still Anganwadis are run in semi pucca
building, lacking good infrastructure.

202
TABLE 5.20
CLASSIFICATION OF RESPONDENTS ACCORDING TO
DESCRIPTION OF ANGANWADI BUILDING
a) Spatial sufficiency:
Sr. No. Response Frequency Percentage 1 Yes 57 95.00 2 No 3 5.00 Total 60 100.0
b) Lighting and ventilation: Sr. No. Response Frequency Percentage
1 Yes 57 95.00 2 No 3 5.00 Total 60 100.0
c. Accessed by good roads: Sr. No. Response Frequency Percentage
1 Yes 57 95.00 2 No 3 5.00 Total 60 100.0
d. Supply of amenities: Sr. No. Response Frequency Percentage
1. Yes 19 31.67 2. No 41 68.33 Total 60 100.0
The above Table 5.20 classifies the respondents according to the
description of their respective Anganwadi buildings and shows that:
For 57(91%) respondents Spatial Sufficiency is sufficient in their
Anganwadis, while the remaining 3 (5%) feel they are constrained by
cramped space;
Lighting and Ventilation: it is sufficient for 57(95%) respondents while
only a meagre 3 (5%) feel it as insufficient.
An overwhelming majority i.e., 57(95%) respondents reported that the
Access Road is good in their Anganwadis, while remaining 3 (5%) feel

203
there is no proper access roads.
Regarding Supply of Amenities, only 19 (31.67%) respondents reported
that their Anganwadis have sufficient amenities (toilet block and kitchen
sink, storage racks and shelves, water and electricity, etc.), while a good
proportion 41 (68.33%) often feel these amenities are inadequate.
It may thus be inferred that while majority of the Anganwadi workers
have a favourable opinion about the space, good lighting, ventilation and
good access roads, majority of them opined that basic amenities are
inadequate.
TABLE 5.21
CLASSIFICATION OF RESPONDENTS ACCORDING TO
SATISFACTION WITH ANGANWADI ATMOSPHERE
Sr. No. Satisfaction level Frequency Percentage
1 Highly satisfied 53 88.33
2 Mildly satisfied 7 11.67
Total 60 100.0
From the above Table 5.21 it can be seen that more than one half i.e., 53
(88.33%) of the respondents are highly satisfied with the atmosphere at
their respective Anganwadis, while the remaining 7 (11.67%) respondents
are only mildly satisfied with it.
It may thus be observed that a majority of the Anganwadi workers are
highly satisfied with their workplace atmosphere.

204
TABLE 5.22
CLASSIFICATION OF RESPONDENTS ACCORDING TO COOPERATION RECEIVED FROM
a. Anganwadi neighbours: Sr. No. Response Frequency Percentage
1 Yes 60 100.0
2 No - -
Total 60 100.0
b. Local community leaders: Sr. No. Response Frequency Percentage
1 Yes 59 98.33
2 No 1 1.67
Total 60 100.0
c. Zilla Parishad officials: Sr. No. Response Frequency Percentage
1 Yes 60 100.0
2 No - -
Total 60 100.0
d. Other Government officials: Sr. No. Response Frequency Percentage
1 Yes 59 98.33
2 No 1 1.67
Total 60 100.0
The above Table 5.22 reveals the respondents according to the
cooperation received by them from others in the smooth conduct of the
Anganwadi and shows that all the 60 (100%) respondents receive
cooperation from the Anganwadi neighbours and Zilla Parishad officials;
while 59 (98.33%) respondents receive cooperation from the local
community leaders as well as government officials.
It is apparent that Anganwadis are functioning according to the
expectation of the locals as it is important for its smooth functioning.

205
TABLE 5.23
CLASSIFICATION OF RESPONDENTS ACCORDING TO
TREATMENT RECEIVED FROM VARIOUS AGENCIES
a. Zilla Parishad Officials:
Sr. No. Response Frequency Percentage
1 Respectful 56 93.33
2 Cordial 4 6.67
3 Indifferent - -
4 Insulting - -
Total 60 100.0
b. Other Government Officials:
Sr. No. Response Frequency Percentage
1 Respectful 54 90.00
2 Cordial 3 5.00
3 Indifferent 2 3.33
4 Insulting 1 1.67
Total 60 100.0
c. Anganwadi Visitors:
Sr. No. Response Frequency Percentage
1 Respectful 56 93.33
2 Cordial 4 6.67
3 Indifferent - -
4 Insulting - -
Total 60 100.0
The above Table 5.23 depicts the respondents according to the treatment
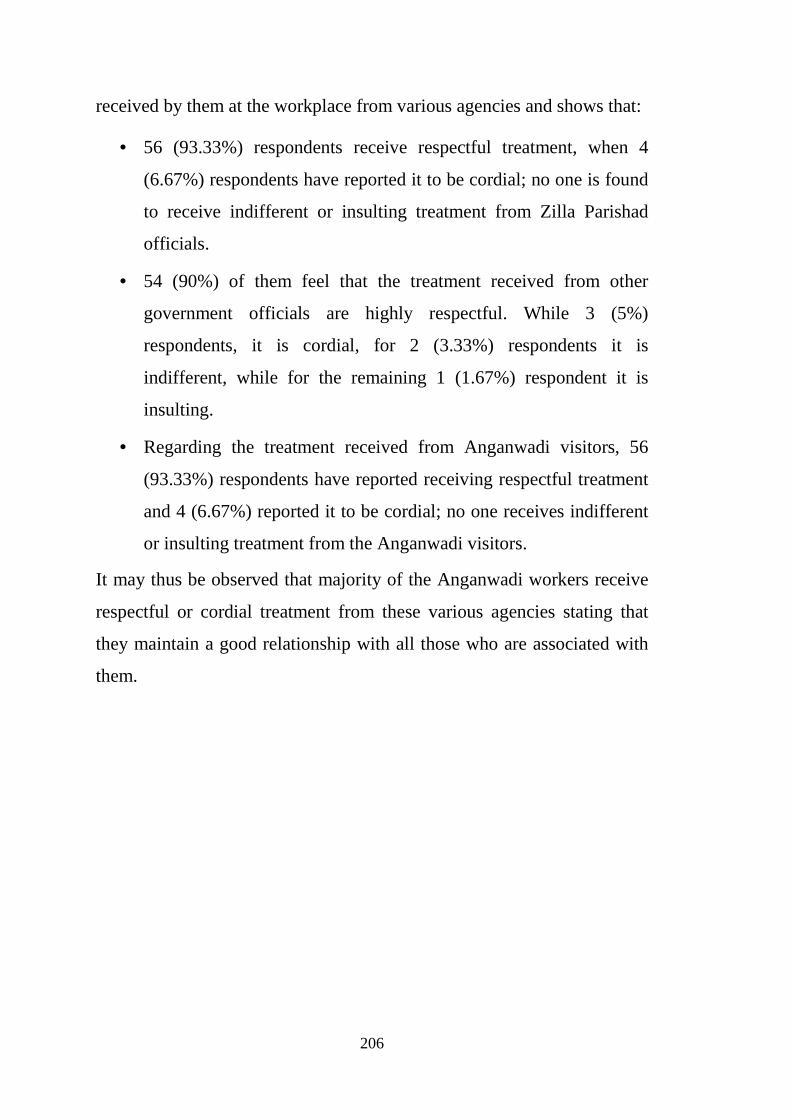
206
received by them at the workplace from various agencies and shows that:
• 56 (93.33%) respondents receive respectful treatment, when 4
(6.67%) respondents have reported it to be cordial; no one is found
to receive indifferent or insulting treatment from Zilla Parishad
officials.
• 54 (90%) of them feel that the treatment received from other
government officials are highly respectful. While 3 (5%)
respondents, it is cordial, for 2 (3.33%) respondents it is
indifferent, while for the remaining 1 (1.67%) respondent it is
insulting.
• Regarding the treatment received from Anganwadi visitors, 56
(93.33%) respondents have reported receiving respectful treatment
and 4 (6.67%) reported it to be cordial; no one receives indifferent
or insulting treatment from the Anganwadi visitors.
It may thus be observed that majority of the Anganwadi workers receive
respectful or cordial treatment from these various agencies stating that
they maintain a good relationship with all those who are associated with
them.

207
TABLE 5.24
CLASSIFICATION OF RESPONDENTS ACCORDING TO
SATISFACTION WITH HONORARIUM RECEIVED
Sr. No. Satisfaction level Frequency Percentage
1 Highly Satisfied 10 16.67
2 Mildly Satisfied 35 58.33
3 Neither Satisfied nor Dissatisfied
8 13.33
4 Mildly Dissatisfied
7 11.67
5 Highly Dissatisfied
- -
Total 60 100.0
The above Table 5.24 reveals the respondents satisfaction with the
monthly honorarium they receive and shows that only 10 (16.67%)
respondents are highly satisfied with their honorarium, while 35 (58.33%)
respondents are only mildly satisfied with it, 8 (13.33%) respondents are
neither satisfied nor dissatisfied with it, 7 (11.67%) are mildly dissatisfied
with it. None of the respondent is highly dissatisfied with the honorarium.
It may thus be inferred that more than one half of the respondents are
only mildly satisfied with their honorarium, while another one-fourth
respondents are either neutral or mildly dissatisfied with it. Hence it can
be inferred that the honorarium is not upto their expectations.

208
TABLE 5.25
CLASSIFICATION OF RESPONDENTS ACCORDING TO
FEELING AT THE END OF WORKDAY
Sr. No. Feeling Frequency Percentage
1 Satisfied 40 66.67
2 Frustrated 12 20.00
3 Indifferent 8 13.33
Total 60 100.0
The above Table 5.25 discloses the respondents feelings at the end of the
workday and shows that a good proportion i.e., 40 (66.67%) respondents
have a feeling of satisfaction of a fulfilled workday, but another 12 (20%)
respondents feel frustrated at the end of the workday, while the remaining
8 (13.33%) have a feeling of indifference at the end of the workday.
It may thus be concluded that about two-thirds of the Anganwadi workers
end their workday with a sense of satisfaction towards their work. It
seems that they are solely involved in the work and they enjoy the work
they are doing.

209
TABLE 5.26
CLASSIFICATION OF RESPONDENTS ACCORDING TO
FEELING TOWARDS WORK
Sr. No. Feeling Frequency Percentage
1 Committed 55 91.67
2 Indifferent 4 6.67
3 Hostile 1 1.67
Total 60 100.0
The above Table 5.26 displays respondents feeling towards their work
and shows that an overwhelming majority of 55 (91.67%) have a feeling
of commitment towards their work, when 4 (6.67%) respondents are
indifferent towards their work remaining 1 (1.67%) respondent is clearly
hostile towards her work.
It may thus be seen that majority of the Anganwadi workers have a
feeling of commitment towards their work. It is an indication that they are
loyal to their work perhaps due to a favourable work environment.
Workplace Profile of Anganwadi Workers
It may be observed from the above 12 Tables that the representative
Anganwadi worker reaches her assigned Anganwadi by walking for two
kilometres; her Anganwadi building is housed either in an RCC building
with cement slab roof or stone/brick walled building with tiled roof or
brick walls with cement/tin sheet roof; the building has sufficient inside
space, good lighting and ventilation, is accessed by good roads, but there
is marked lack of amenities; they receive good cooperation from
Anganwadi neighbours, local community leaders, Zilla Parishad officials
and other government officials; she also receives respectful to cordial
treatment from these persons; she is highly to mildly satisfied about the

210
honorarium she receives for her Anganwadi work; generally has a feeling
of satisfaction at the end of her workday and also has sense of
commitment towards her Anganwadi work.
Work-Related Information of Anganwadi Workers
The following 13 Tables (5.27 to 5.39) present the work-related
information of the respondent Anganwadi workers.
TABLE 5.27
CLASSIFICATION OF RESPONDENTS ACCORDING TO MAIN
REASON BEHIND CHOOSING ANGANWADI WORK
Sr. No. Main Reason Frequency Percentage
1 Liking for community work
35 58.33
2 Economic necessity 16 26.67
3 Affection for children 5 8.33
4 Relief from domestic chores
2 3.33
5 Interest in women’s welfare
1 1.67
6 Seeking job satisfaction 1 1.67
Total 60 100.0
The above Table 5.27 shows the respondents according to their main
reason behind choosing Anganwadi work and shows that 35 (58.33%)
respondents chose the Anganwadi work for their liking for community
work, 16 (26.67%) out of economic necessity, 5 (8.33%) respondents
were attracted towards it because of their affection for children, 2
(3.33%) respondents sought it for seeking relief from their domestic

211
chores and 1 (1.67%) respondent each were attracted towards it for their
interest in women’s welfare and for seeking job satisfaction, respectively.
It may thus be inferred that liking for community work and economic
necessity are the two primary reasons behind the sampled Anganwadi
workers seeking this particular social service work.
TABLE 5.28
CLASSIFICATION OF RESPONDENTS ACCORDING TO
SOURCE OF INFORMATION ABOUT ANGANWADI JOB
Sr. No. Source Frequency Percentage
1 Another Anganwadi worker
14 23.33
2 Friends and relatives
14 23.33
3 Social Activists 13 21.67
4 Press advertisement
12 20.00
5 Government Employment Exchange
7 11.67
Total 60 100.0
The above Table 5.28 shows the respondents’ sources of information
about the availability of Anganwadi job and shows that 14 (23.33%) each
respondents were informed about it by another Anganwadi worker or by
the friends and relatives, 13 (21.67%) were informed about it by local
social activists, 12 (20%) came to know about it from the press
advertisements and only 7 (11.67%) were informed about it by the
Government employment exchange.

212
It may thus be inferred that the sampled Anganwadi workers obtained the
information about the availability of the Anganwadi job through different
sources.
TABLE 5.29 CLASSIFICATION OF RESPONDENTS ACCORDING
TO SELECTION PROCEDURE
Sr. No. Procedure Frequency Percentage
1 Formal interview 39 65.00
2 Knowledge / Aptitude test
13 21.67
3 Informal discussions
2 3.33
Total 60 100.0
The above Table 5.29 reveals the selection procedure and shows that 39
(65%) respondents were selected through a formal interview and 13
(21.67%) respondents were selected through knowledge/aptitude test, and
the remaining 2 (3.33%) respondents were selected through informal
discussions.
It may thus be inferred that formal interviews and knowledge/aptitude
tests are the laid down procedures for selecting Anganwadi workers. It
shows that the selection is done scientifically.

213
TABLE 5.30
CLASSIFICATION OF RESPONDENTS ACCORDING TO
JOB TRAINING AFTER JOINING
Sr. No. Training Received Frequency Percentage
1 Induction training only
12 20.00
2 Refresher training
38 63.33
3 Special training 16 26.67
4 Advance training
12 20.00
From the above Table 5.30 it can be seen that 12 (20%) respondents have
received only the induction training, 38 (63.33%) respondents had
undergone refresher training, 16 (26.67%) were deputed for special
training and 12 (20%) respondents were selected for advance training. A
cross-check revealed that the selection for special training and advance
training largely depended on the educational qualifications and length of
service of the respondents.
It may thus be inferred that training of the Anganwadi workers is a
regular exercise in the mother and child welfare delivery system.

214
TABLE 5.31
CLASSIFICATION OF RESPONDENTS ACCORDING TO
OPINION ABOUT TRAINING RECEIVED
Sr. No. Opinion Frequency Percentage
1 Comprehensive 33 55.00
2 Adequate 15 25.00
3 Inadequate 9 15.00
4 Meagre 3 5.00
Total 60 100.0
Table 5.31 classifies the respondents according to their opinion about the
training they have received and shows that in the opinion of 33 (55%)
respondents, the training was comprehensive, 15 (25%) respondents felt
that it was adequate, 9 (15%) respondents felt that it was inadequate and 3
(5%) respondents clearly expressed that it was meagre.
It may thus be inferred that although the Anganwadi workers regularly
undergo job-related training, it is also necessary to keep it up-to-date and
in keeping with the changing needs of the Anganwadi beneficiaries.

215
TABLE 5.32
CLASSIFICATION OF RESPONDENTS ACCORDING TO
MEMBERSHIP IN ANGANWADI UNION
Sr. No. Response Frequency Percentage
1 Yes 52 86.67
2 No 8 13.33
Total 60 100.0
The above Table 5.32 shows the respondents according to their trade
union membership and shows that 52 (86.67%) respondents are members
of an Anganwadi workers’ union, while the remaining 8 (13.33%)
respondents are not.
It may thus be inferred that unionization phenomenon is quite strong
among the Anganwadi workers. Perhaps they are aware of the need to
organize together to achieve their rights.

216
TABLE 5.33
CLASSIFICATION OF RESPONDENTS ACCORDING TO
LENGTH OF UNION MEMBERSHIP
Sr. No. Membership Length(N=52) (100.0)
Frequency Percentage
1 Upto 2 years 11 21.15
2 2 to 5 years 15 28.85
3 5 to 7 years 5 9.60
4 Above 7 years 21 40.40
Total 52 100.0
The above Table 5.33 reveals that 11 (21.15%) respondents are union
members for upto 2 years only, 15 (28.85%) respondents are union
members for 2 to 5 years, 5 (9.60%) respondents for 5 to 7 years and 21
(40.40%) respondents are union members for more than 7 years. A cross-
check revealed that the younger age respondents are more inclined
towards sooner union membership.
It may thus be inferred that the recent entrants into the Anganwadi work
have a stronger unionization spirit than their middle-age sisters.

217
TABLE 5.34
CLASSIFICATION OF RESPONDENTS ACCORDING TO MAIN
REASON BEHIND JOINING THE UNION
Sr. No. Main Reason (N=52) (100.0) Frequency Percentage
1 Self-will 37 71.10
2 Job protection under Union power
7 13.50
3 Safeguard against injustice
7 13.50
4 Reaction to injustice 1 1.90
Total 52 100.0
The above Table 5.34 shows the main reasons behind joining the Union
and shows that 37 (71.10%) respondents had joined the union out of self-
will, while 7 (13.50%) each had joined the union for job protection under
union power and as a safeguard against any likely injustice, respectively,
while the remaining 1 (1.90%) respondent had joined the union as a
reaction to an injustice inflicted on her. Interestingly, no one had joined
the union under peer pressure.
It may thus be inferred that self-will is the primary driving force for
unionization among the Anganwadi workers. It shows they are very much
aware of the need for union.

218
TABLE 5.35
CLASSIFICATION OF RESPONDENTS ACCORDING TO
REPORTING OF JOB-RELATED GRIEVANCES
Sr. No. Response Frequency Percentage
1. Yes 32 53.33
2. No 28 46.67
Total 60 100.0
From the above Table 5.35 that 32 (53.33%) respondents had taken one
or the other job-related grievance to their superiors, while the remaining
28 (46.67%) respondents had not.
It may thus be inferred that reporting job-related grievance to the
superiors is open to the workers and are welcomed by the superiors.

219
TABLE 5.36
CLASSIFICATION OF RESPONDENTS ACCORDING TO
NATURE OF GRIEVANCE REPORTED
Sr. No. Nature of Grievance
Reported (N=32) (100.00)
Frequency Percentage
1 Withheld honorarium 12 37.50
2 Unfair workload 10 31.25
3 Unauthorized deductions
4 11.75
4 Victimization for Union activities
4 11.75
5 Persistent harassment at workplace
2 6.25
Total 32 100.00
The above Table 5.36 shows that 12 (37.50%) respondents had the
grievance regarding honorarium, 10 (31.25%) respondents were
aggrieved by unfair workload, 4 (11.75%) each respondents had
grievance regarding unauthorized deductions from the remuneration and
victimization for union activities, respectively, and 2 (6.25%) respondents
had complaint concerning harassment at the workplace.
It may thus be inferred that withheld honorarium and unfair workload are
the two major grievances of the Anganwadi workers. It seems that
honorarium related complaints dominate the other grievances indicating
that the distribution has the practice of withholding honorarium for
various reasons.

220
TABLE 5.37
CLASSIFICATION OF RESPONDENTS ACCORDING TO
SETTLEMENT OF GRIEVANCE
Sr. No. Settlement
Authority (N=32) (100.00)
Frequency Percentage
1 Taluka
Mukhyasevika 26 81.25
2 District C.D.P.O. 6 18.75
Total 32 100.00
The above Table 5.37 shows the settlement of grievances. A majority i.e.,
26 (81.25%) respondents had taken their grievance to the Taluka
Mukhyasevika for settling, while 6 (18.75%) respondents had to take
their grievance upto the District Child Development Project Officer
(CDPO) for settlement.
It may thus be inferred that among the Anganwadi workers, the Taluka
Mukhyasevika is the most favoured authority for grievance settlement.

221
TABLE 5.38
CLASSIFICATION OF RESPONDENTS ACCORDING TO
DURATION OF GRIEVANCE SETTLEMENT
Sr. No. Grievance
Settlement Time (N=32) (100.00)
Frequency Percentage
1 On-the-spot 16 50.00
2 1 week 12 37.75
3 2 weeks 3 9.40
7 Still pending 1 3.15
Total 32 100.00
It can be observed from the above Table 5.38 that one half of the
respondents got settled the grievance on-the-spot, for 12 (37.75%)
respondents it took one week, for 3 (9.40%) respondents it was settled
within a fortnight, while in the case 1 (3.15%) respondent, it is still
pending with the CDPO.
It may thus be inferred that the settlement of the job-related grievances of
the Anganwadi workers are handled expeditiously by their superiors.

222
TABLE 5.39
CLASSIFICATION OF RESPONDENTS ACCORDING TO
UNION'S HELP IN GRIEVANCE SETTLEMENT
Sr. No. Response (N=32) (100.00) Frequency Percentage
1 Yes 20 62.50
2 No 12 37.50
Total 32 100.0
According to the above Table No. 5.39 62.50% got the help of union in
grievance settlement, 12 (37.50%) respondents presented their grievances
by themselves without union help.
It may thus be inferred that the Anganwadi workers’ union is indeed
helpful in resolving their members’ job-related grievances. The union is
active and is providing timely help to its members.
Work-related Profile of Anganwadi Workers
It may be observed from the above 13 Tables that the representative
Anganwadi worker had chosen the Anganwadi work mainly either for her
liking for community work or out of family’s economic necessity; she
had come to know about the availability of this work through diverse
sources such as another Anganwadi worker, friends and relatives, social
activists, press advertisement or government employment exchange; she
was selected on the basis of her performance in a formal interview; since
joining, she has gone through refresher or special or advance training
programmes and feels that her training was comprehensive; out of self-
will, she has become a member of the Anganwadi workers’ trade union
for varying lengths of period from upto 2 years to above 7 years; she has

223
probably taken up a job-related grievance of withheld remuneration or
unfair workload with her superiors that was settled at the Taluka level by
the Mukhyasevika, in which her union had also helped her.

224
SECTION – IV
5.7 ICDS DELIVERY THROUGH ANGANWADIS
The following 5 Tables (5.40 to 5.44) present the information about the
delivery of the services by the respondent Anganwadi workers in the
setting of their respective Anganwadis.
TABLE 5.40
PARTICIPATION IN COMMUNITY SURVEY UNDER
ICDS SCHEME
Sr. No. Response Frequency Percentage
1. Yes 60 100.0
2. No - -
Total 60 100.0
The above Table 5.43 shows the respondents according to their
participation in the community surveys being conducted under the ICDS
scheme and shows that all the 60 (100%)) respondents indeed had
participated in the survey.

225
TABLE 5.41
RESPONSE OF THE COMMUNITY TO THE SURVEY
SR. NO. RESPONSE FREQUENCY PERCENTAGE
1 Very good 36 60.00
2 Good 22 36.67
3 Fair 2 3.33
4 Poor - -
Total 60 100.0
As far as the above Table 5.44 is concerned it can be seen that 36 (60%)
respondents responded as very good, regarding the response of the
community, 22 (36.67%) felt that it was good, while the remaining 2
(3.33%) respondents perceived it to be only fair. However none of them
perceived it as poor.

226
TABLE 5.42 PERCEIVED INTENSITY OF THE COMMUNITY NEED FOR
ANGANWADI SERVICES
a. Supplementary Nutrition: Sr. No. Response Frequency Percentage
1 Acute 27 45.00 2 Substantial 25 41.67 3 Slight 5 8.33 4 None 3 5.00 Total 60 100.0
b. Immunization: Sr. No. Response Frequency Percentage
1 Acute 30 50.00 2 Substantial 22 36.67 3 Slight 5 8.33 4 None 3 5.00 Total 60 100.0
c. Health Checkup: Sr. No. Response Frequency Percentage
1 Acute 33 55.00 2 Substantial 16 26.67 3 Slight 8 13.33 4 None 3 5.00 Total 60 100.0
d. Health Referral: Sr. No. Response Frequency Percentage
1 Acute 25 41.67 2 Substantial 26 43.33 3 Slight 5 8.33 4 None 4 6.67 Total 60 100.0
e. Pre-School Non-formal Education: Sr. No. Response Frequency Percentage
1 Acute 30 50.00 2 Substantial 24 40.00 3 Slight 3 5.00 4 None 3 5.00 Total 60 100.0
f. Health & Nutrition Education: Sr. No. Response Frequency Percentage
1 Acute 26 43.33 2 Substantial 28 46.67 3 Slight 3 5.00 4 None 3 5.00 Total 60 100.0
The above Table 5.45 classifies the respondents according to their

227
individual perceptions, based on the ICDS survey data and personal
observations, of the need of ICDS services in their respective
communities and shows that :
- As regards need for Supplementary Nutrition, 27 (45%)
respondents perceived it to be acute, 25 (41.67%) respondents as
substantial, 5 (8.33%) respondents as slight and 3 (5%) respondents
as none;
- As regards need for Immunization, 30 (50%) respondents
perceived it to be acute, 22 (36.67%) respondents as substantial, 5
(8.33%) respondents as slight and 3 (5%) respondents as none;
- As regards need for Health Checkup, 33 (55%) respondents
perceived it to be acute, 16 (26.67%) respondents as substantial, 8
(13.33%) respondents as slight and 3 (5%) respondents as none;
- As regards need for Health Referral, 25 (41.67%) respondents
perceived it to be acute, 26 (43.33%) respondents as substantial, 5
(8.33%) respondents as slight and 4 (6.67%) respondents as none;
- As regards need for Pre-school Non-formal Education, 30 (50%)
respondents perceived it to be acute, 24 (40%) respondents as
substantial, 3 (5%) respondents as slight and 3 (5%) respondents as
none;
- As regards need for Health and Nutrition Education, 26 (43.33%)
respondents perceived it to be acute, 28 (46.67%) respondents as
substantial, 3 (5%) respondents as slight and 3 (5%) respondents as
none.
It may thus be inferred that majority of the Anganwadi workers have
perceived the need for these six services as acute or substantial. Only in
few cases, the perception of these needs is slight to none.

228
TABLE 5.43
PERSONAL PREFERENCE FOR BENEFICIARIES
TO WORK WITH
Sr. No. Preferences Frequency Percentage
1 Children below 6 years 8 13.33
2 Expectant Mothers - -
3 Nursing Mothers - -
4. 15-44 year old women -
4 All Beneficiaries 52 86.67
Total 60 100.0
The above Table 5.47 classifies the respondents according to their
personal preferences for the beneficiaries that would like to work with
and shows that 8 (13.33%) respondents would preferably like to work
with the children below 6 years, while the remaining 52 (86.67%)
respondents would like to work with all types of Anganwadi
beneficiaries, that is, children below 6 years, expectant mothers, nursing
mothers and 15-44 year old women.
It may thus be inferred that an overwhelming majority of the Anganwadi
workers are really community service oriented.

229
TABLE 5.44
WILLINGNESS TO LEAVE ANGANWADI WORK
FOR SAME PAY AND HOURS
Sr. No. Response Frequency Percentage
1. Yes 19 31.67
2. No 41 68.33
Total 60 100.0
The above Table 5.48 shows willingness of the respondents to leave
Anganwadi work for the same pay and working hours and shows that 19
(31.67%) respondents are willing to do so, but the remaining 41 (68.33%)
respondents are unwilling to leave their Anganwadi work.
It may thus be inferred that despite their avowed commitment to the
Anganwadi work, about one-third respondents are willing to leave their
work if they can secure the same pay and working hours. The reason
behind this inclination probably lies in their personal, family, social and
work-related problems elaborated earlier. However, a good majority seem
to have commitment to the organization.
On the whole, it may be observed that the representative Anganwadi
worker fulfills her role in ensuring effective delivery of ICDS services
through her Anganwadi.

230
SECTION - V
PERSONAL, FAMILY, SOCIAL AND WORK-RELATED
PROBLEMS
The following 3 Tables (5.45 to 5.47) present the information about the
respondent Anganwadi workers’ personal, family, social and work-
related problems.
TABLE 5.45
CLASSIFICATION OF RESPONDENTS ACCORDING TO
PERSONAL AND FAMILY PROBLEMS FACED
Sr. No. Personal and Family
Problems Frequency Percentage
1 Mental strain 50 83.33
2 Physical fatigue 44 73.33
3 Neglect of family obligations 38 63.33
4 Inability to take short breaks for the family
26 47.67
5 Difficulties in hosting/attending family functions
24 40.00
6 Routine things becoming complicated
16 24.67
7 Neglect of children’s education
14 23.33
8 Strained intra-family relations 12 20.00
9 Neglect of family’s health problems
10 16.67
10 Disinterest in family affairs 8 13.33
The above Table 5.40 displays the personal and family problems of
respondents and shows that one half of the respondents experience mental
strain, 44 (73.33%) respondents also face physical fatigue, 38 (63.33%)

231
respondents feel that they neglect their family obligations, 26 (47.67%)
are unable to take short breaks for the family, 24 (40%) face difficulties
in hosting/attending family functions while for 16 (24.67%) respondents
routine personal and family things unnecessarily become complicated,
when 14 (23.33%) feel that they are neglecting their children’s education;
12 (20%) are undergoing strained intra-family relations; 10 (16.67%)
respondents feel that they neglect the family’s health problems, while 8
(13.33%) respondents have become disinterested in family affairs.
It may thus be observed that while the mental strain and physical fatigue
have emerged as the major personal problems for these Anganwadi
workers, their family problems also have quite significant dimensions,
particularly the neglect of family obligations, children’s education and
family’s health problems. It is apparent that though the respondents are
employed they have to play dual role as a home-maker and employee and
are facing role conflict which is manifested in their home activities more
they are unable to execute their household activities properly.

232
TABLE 5.46
CLASSIFICATION OF RESPONDENTS ACCORDING TO
SOCIAL PROBLEMS FACED
Sr. No. Social Problems Frequency Percentage
1 Inability to attend social functions
48 80.00
2 Inability to go on social outings
44 73.33
3 Disinterest in social activities
20 33.33
4 Disinterest in social functions
12 20.00
5 Reduced social contact
6 10.00
From the above Table 5.41 it can be observed the social problems being
faced by them and shows that 48 (80%) are unable to attend social
functions, 44 (73.33%) are unable to go on social outings, 20 (33%) are
disinterested in social activities, 12 (20%) are disinterested in social
functions, while there is a reduction in the social contacts of 6 (10%)
respondents.
It may thus be inferred that the root cause of these social problems of the
Anganwadi workers perhaps could be due to work-related strain mental
strain and physical fatigue. Hence they are unable to spare time for other
social activities other than their household activity.
233
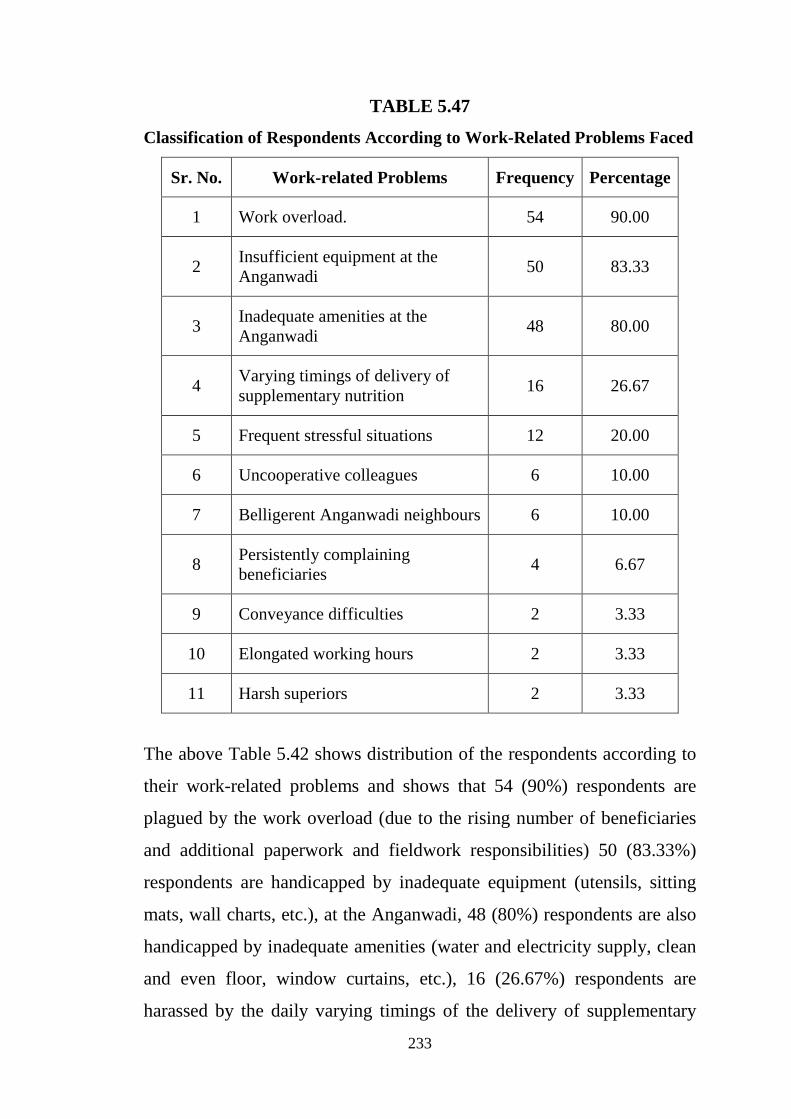
TABLE 5.47
Classification of Respondents According to Work-Related Problems Faced
Sr. No. Work-related Problems Frequency Percentage
1 Work overload. 54 90.00
2 Insufficient equipment at the Anganwadi
50 83.33
3 Inadequate amenities at the Anganwadi
48 80.00
4 Varying timings of delivery of supplementary nutrition
16 26.67
5 Frequent stressful situations 12 20.00
6 Uncooperative colleagues 6 10.00
7 Belligerent Anganwadi neighbours 6 10.00
8 Persistently complaining beneficiaries
4 6.67
9 Conveyance difficulties 2 3.33
10 Elongated working hours 2 3.33
11 Harsh superiors 2 3.33
The above Table 5.42 shows distribution of the respondents according to
their work-related problems and shows that 54 (90%) respondents are
plagued by the work overload (due to the rising number of beneficiaries
and additional paperwork and fieldwork responsibilities) 50 (83.33%)
respondents are handicapped by inadequate equipment (utensils, sitting
mats, wall charts, etc.), at the Anganwadi, 48 (80%) respondents are also
handicapped by inadequate amenities (water and electricity supply, clean
and even floor, window curtains, etc.), 16 (26.67%) respondents are
harassed by the daily varying timings of the delivery of supplementary

234
nutrition from the caterers, 12 (20%) respondents frequently face stressful
situations (special attention to ailing children and mothers), 6 (10%) each
respondents have to put up with uncooperative colleagues (mostly the
Anganwadi helper) and belligerent Anganwadi neighbours, respectively,
4 (6.67%) respondents have to face persistently complaining beneficiaries
(child guardians, expectant and nursing mothers), 2 (3.33%) each
respondents encounter conveyance difficulties and by the elongated
working hours due to work overload, and by having to put up with harsh
superiors, respectively.
It may thus be observed that problems indeed galore for a lonesome
Anganwadi worker delivering multiple mother and child welfare services.
Since the work involves high responsibility and has multiple functions, it
is cumbersome for the women to perform satisfactorily.
Problem-wise Profile of Anganwadi Workers
While the mental strain and physical fatigue have emerged as the major
personal problems for these Anganwadi workers, their family problems
also have quite significant dimensions, particularly the neglect of family
obligations, children’s education and family’s health problems. The root
cause of the social problems of the Anganwadi workers is their work-
related mental strain and physical fatigue, which are being reflected in
their social problems. The work-related problems indeed galore for a
lonesome Anganwadi worker delivering multiple mother and child
welfare services at her ill-equipped Anganwadi located in an
inconvenient place.