The Prudential Regulation Authority’s approach to banking ...
Prudential Liquidity Regulation in Developing Countries: A Case Study of Rwanda
Sarah Sanya, Wayne Mitchell and Angelique Kantengwa
WP/12/20

© 2012 International Monetary Fund WP/12/20
IMF Working Paper
AFR
Prudential regulations on liquidity risk in developing countries: A case study of Rwanda
Prepared by Sarah Sanya, Wayne Mitchell and Angelique Kantengwa 1
Authorized for distribution by Peter Allum
January 2012
Abstract
This paper analyses the prudential liquidity management framework, in particular the quantitative indicators employed by the central bank of Rwanda in response to the domestic liquidity crisis in 2008/09. It emphasises that the quantitative methods used in the monitoring and assessment of systemic liquidity risk are inadequate because they did not signal the liquidity crises ex-post. There are quick gains to be made from augumenting the liquidity risk indicators with more dynamic liquidity stress tests so that compliance will be achieved through lengthening the maturities of both assets and liabilities on the balance sheet as opposed to simply holding more liquid assets. The paper recommends that policy emphasis shift toward reforms that strengthen systemic liquidity risk assesment, monetary policy implementation as well as improve the efficiency of Rwanda’s financial system.
JEL Classification Numbers: Keywords: Liquidity risk , Rwanda, regulation, supervsion, stress
testing
Author’s E-Mail Address: [email protected]; [email protected] ; [email protected]
1 The authors are grateful to the National Bank of Rwanda for the dataset used in this paper. We would like also like to thank Marco Pani and Martine Guerguil for their guidance and suggestions. We would like to acknowledge the valuable research assistance provided by Shiv Dixit and Alphonse Ndikubwimana.
This Working Paper should not be reported as representing the views of the IMF. The views expressed in this Working Paper are those of the author(s) and do not necessarily represent those of the IMF or IMF policy. Working Papers describe research in progress by the author(s) and are published to elicit comments and to further debate.

2
I. INTRODUCTION
Background
The recent global financial crisis has highlighted the importance of appropriate monitoring frameworks to reduce and control liquidity risk.2 Banks require access to borrowed funds to carry out their operations and an inability to acquire such funding could lead to their insolvency, as shown by the unprecedented demise of well-known financial institutions. In response, many central banks including the National Bank of Rwanda (NBR), following the advice of the Basel Committee on Banking Supervision, reviewed and expanded their liquidity risk management framework to reduce the frequency and severity of bank-specific liquidity problems that have potential systemic consequences.
Rwanda’s economic performance over the last decade was impressive. Prudent macroeconomic policies contributed to economic stability, high real growth, and improvements in the business climate. The external position strengthened as donor flows and foreign direct investment (FDI) offset the trade deficit allowing a buildup of international reserves to comfortable levels. Notwithstanding this performance, the bank-dominated financial system remains underdeveloped with weak competition among banks and a shallow interbank market.3 This environment, as well as the significant and continuous capital account inflows, weakened incentives for liquidity management in banks and contributed to high structural excess liquidity. 4
In the second half of 2008, Rwanda experienced a liquidity crisis that highlighted the limitations of its liquidity regulation and led to the redesign of the regulatory framework. Using data from 2006 to 2009, we test the robustness of this new prudential regulatory framework to retroactively assess whether it would have helped in predicting the liquidity crisis. Specifically, we assess existing quantitative methods (the maturity gap analysis, and the ratio of liquid assets to total deposits) used by the NBR to detect liquidity pressures in the financial system by looking at the behavior of these indicators in the lead up to the 2008/09 crisis. 5 Additionally, we utilize liquidity stress tests (not currently used by the NBR) to assess the vulnerability of the banking system to potential liquidity shocks and to determine 2 Liquidity is the ability of a bank to fund increases in assets and meet obligations as they come due, without incurring unacceptable losses.
3 Three of the eight commercial banks own about 70 percent of total assets in the banking system.
4 In this study, we define excess liquidity as commercial banks’ holding liquid financial assets and reserve deposits over and beyond what it needs for transaction purposes. Where financial markets are sufficiently deep banks can tap into short-term liquidity easily and do not need to hold high precautionary or involuntary balances 5 Non-uniformity in liquidity regulations and limited access to market sensitive and restricted data relegates this type of research to central banks and policy institutions in individual countries.

3
the size of possible liquidity buffers. Our test results indicate that several weaknesses still exist with the NBR’s preferred indicators which failed to signal the liquidity crises in 2008/09. We believe the tests could be applied successfully to determine the adequacy of the prudential liquidity regulation of banking systems in developing and emerging economies with characteristics similar to that of Rwanda.
The paper highlights the need for better quantitative indicators to monitor liquidity risk. It also discusses the usefulness of regular and comprehensive liquidity stress tests in assessing the vulnerability of the banking system to liquidity shocks and in determining the size of possible liquidity buffers in line with best practice (Matz and Ney 2007, BIS 2008, and ECB 2008). It recommends that the NBR direct policies toward strengthening prudential regulations, bank supervision and its capacity for liquidity forecasting. The paper further recommends that the NBR continue its efforts to improve the efficiency of Rwanda’s financial system. The rest of the paper is organized as follows. Section II provides an overview of the causes and effects of the liquidity crises that occurred in late 2008 and early 2009. Section III provides an overview of the regulatory framework and provides the context for assessing the effectiveness of quantitative tools as well as liquidity stress to monitor liquidity risk. The empirical finding supports the recommendations in section IV for strengthening the regulatory and supervisory framework of the NBR in liquidity risk management. Section V of the paper provides a conclusion.
II. CAUSE AND EFFECTS OF THE 2008 DOMESTIC LIQUIDITY CRISIS IN RWANDA
In late 2008, a number of factors caused a reversal in Rwanda’s liquidity situation and plunged the banking system into a liquidity crisis that lasted for a few months.
The longstanding liquidity surplus on banks’ balance sheet combined with high economic growth and inflation in the first half of 2008, fueled credit expansion. The sharp increase in credit growth also occurred within the context of the NBR’s increased capital requirements from RwF 5 billion to RwF 15 billion.6 Compliance with this new regulation—mainly
6 Saxegaard (2006) differentiates between precautionary excess liquidity and involuntary excess liquidity. Precautionary excess liquidity is less likely to be “footloose” and inflationary compared to involuntary excess liquidity. Furthermore, there is an expectation that monetary policy can still be effective in situations where banks hold excess reserves for precautionary purposes. We do not distinguish between types of excess liquidity in this paper, rather we concur with the view that both types of excess liquidity represent deadweight losses and that banks should be able to tap into short-term liquidity relatively easily in sufficiently deep financial markets. Consequently, a policy recommendation for reforms aimed at financial market development is relevant, irrespective of the nature of excess reserves.

4
through mergers, and acquisitions by foreign banks—increased competition and led to more aggressive lending by banks as they attempted to gain market share.
Concurrently, low real interest rates encouraged some wholesale depositors to seek better returns from the banking system leading to the significant reduction in systemic liquidity. The high credit growth in 2008 (Table 1), combined with lower deposit growth, led to a short-term liquidity problem and some banks under stress accessed the NBR’s lender-of last-resort facilities. Concerned that the problem might persist, the NBR intervened by reducing the reserve requirement from 8 percent to 5 percent in February 2009 and introduced two lending facilities to increase liquidity. The liquidity situation began improving in the third quarter of 2009.
The liquidity crisis and the fast deteriorating external environment significantly impacted the real economy. Private sector credit growth collapsed from over 70 percent in 2008 to 6 percent in 2009. This was a contributing factor to the decline in real GDP growth from 11.2 percent in 2008 to 4.2 percent in 2009.
5
Table 1: Snapshot of Rwanda Banking System
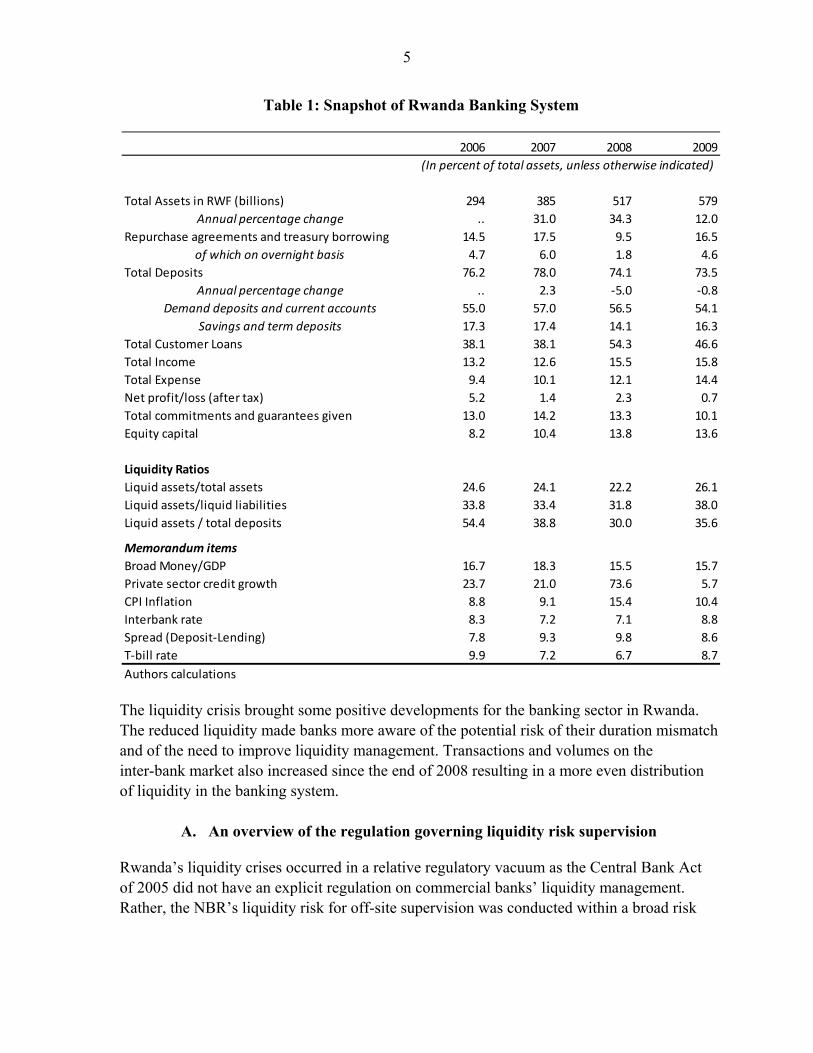
The liquidity crisis brought some positive developments for the banking sector in Rwanda. The reduced liquidity made banks more aware of the potential risk of their duration mismatch and of the need to improve liquidity management. Transactions and volumes on the inter-bank market also increased since the end of 2008 resulting in a more even distribution of liquidity in the banking system.
A. An overview of the regulation governing liquidity risk supervision
Rwanda’s liquidity crises occurred in a relative regulatory vacuum as the Central Bank Act of 2005 did not have an explicit regulation on commercial banks’ liquidity management. Rather, the NBR’s liquidity risk for off-site supervision was conducted within a broad risk
2006 2007 2008 2009
(In percent of total assets, unless otherwise indicated)
Total Assets in RWF (billions) 294 385 517 579
Annual percentage change .. 31.0 34.3 12.0
Repurchase agreements and treasury borrowing 14.5 17.5 9.5 16.5
of which on overnight basis 4.7 6.0 1.8 4.6
Total Deposits 76.2 78.0 74.1 73.5
Annual percentage change .. 2.3 -5.0 -0.8
Demand deposits and current accounts 55.0 57.0 56.5 54.1
Savings and term deposits 17.3 17.4 14.1 16.3
Total Customer Loans 38.1 38.1 54.3 46.6
Total Income 13.2 12.6 15.5 15.8
Total Expense 9.4 10.1 12.1 14.4
Net profit/loss (after tax) 5.2 1.4 2.3 0.7
Total commitments and guarantees given 13.0 14.2 13.3 10.1
Equity capital 8.2 10.4 13.8 13.6
Liquidity Ratios
Liquid assets/total assets 24.6 24.1 22.2 26.1
Liquid assets/liquid liabilities 33.8 33.4 31.8 38.0
Liquid assets / total deposits 54.4 38.8 30.0 35.6
Memorandum items
Broad Money/GDP 16.7 18.3 15.5 15.7
Private sector credit growth 23.7 21.0 73.6 5.7
CPI Inflation 8.8 9.1 15.4 10.4
Interbank rate 8.3 7.2 7.1 8.8
Spread (Deposit-Lending) 7.8 9.3 9.8 8.6
T-bill rate 9.9 7.2 6.7 8.7
Authors calculations

6
assessment framework called the CAMELS rating system.7 Under this system, banks were obliged to comply with one indicator of liquidity - the liquid assets to liquid liabilities ratio–which had a threshold of 80 percent. Over the 4-year period (Table 1) our estimates show banks would have encountered difficulties in respecting the liquidity requirement since the ratio remained below the threshold minimum.8
The recent crisis illustrated how quickly and severely liquidity problems can materialize as sources of funding evaporate and highlighted the need for a liquidity risk management framework. In October 2009 the NBR introduced a new regulation—Regulation No 10/2009 —on commercial banks’ liquidity management, which amends and sets out the parameters for liquidity regulation and supervision. In summary, the regulation: 1. Requires banks to establish a strong liquidity management policy inclusive of but not
limited to information management systems, central liquidity control, diversification of funding sources and contingency plans.
2. Requires the board of directors of each bank to form an Asset and Liability Management Committee which will establish broad guidelines on the tolerance for risk and to manage the overall liquidity of the bank.
3. Mandates that banks maintain liquid assets of at least 20% of total deposits on a weekly average basis and requires banks to provide data on the contractual and anticipated maturity of assets and liabilities monthly.
4. Requires banks to submit a monthly maturity gap report showing whether liabilities that fall due in seven specific time horizons are covered by inflows from assets.9
5. Specifies remedial measures, penalties and administrative sanctions that the NBR can impose for failure of compliance with the regulation.
The new regulation is consistent with similar regulations adopted by some central banks of the East African Community countries10 between 2005 and 2008.
7 The acronym "CAMELS" refers to the six components of a bank's condition that are assessed by supervisory agencies: Capital adequacy, Asset quality, Management, Earnings, Liquidity, and Sensitivity to market risk. Ratings are assigned for each component in addition to the overall rating of a bank's financial condition. The ratings are assigned on a scale from 1 to 5. Banks with ratings of 1 or 2 are considered to present few, if any, supervisory concerns, while banks with ratings of 3, 4, or 5 present moderate to extreme degrees of supervisory concern.
8 With the benefit of hindsight, our estimate modifies the NBR’s list of liquid assets and liabilities to reflect our judgment of the “true” liquidity of these balance sheet items. 9 The central bank of Rwanda requires banks to submit maturity gap analysis on a monthly basis but covering 7 specific time horizons namely: up to month, 1-3 months, 3 to 6 months, 6 to 12 months, 1-2 yrs, 2-5 years and over 5 years.
10 These are Kenya, Tanzania, and Uganda. The central bank of Burundi has a different regulation.

7
III. ANALYZING LIQUIDITY RISK EXPOSURE OF COMMERCIAL BANKS IN RWANDA
In this section, we estimate the liquidity risk exposure of commercial banks during 2006-09 employing three widely used measures of liquidity exposure in banks: maturity gap analysis, liquidity ratios, and liquidity stress tests. 11 Using monthly data from January 2006 to December 2009 we seek to answer the following questions. Did a particular indicator provide an “early warning” of the liquidity event of 2008-09? If so, how “early” was the warning flagged or determined? We also test whether other indicators would be more effective in signaling systemic liquidity shortages with the objective of suggesting ways to augment the liquidity regulation framework.
A. Assessment of the NBR’s Balance Sheet Maturity Gap Analysis
The maturity gap analysis (MGA) is a simple but useful test of liquidity risk that quantifies potential imbalances of cash flow forecasts from assets and liabilities over several time horizons, under both normal conditions and a range of stress scenarios (EU 2008). A notable limitation of the MGA, however, is that it underestimates outflows from sources of rollover funding and other operating expenses that do not have a contractual maturity date. Assessing Liquidity Risk with Maturity Gap Analysis In broad terms the procedure for assessing liquidity risk in an MGA is as follows:
1. Assume that banks’ assets and liabilities including customers’ deposit and loan decisions correspond to contractual terms and are therefore grouped according to their maturity profile.12
2. Estimate net cash flows or gaps for each time horizon under normal operating conditions. The net cash flow projections thus developed provide a basis for evaluating the adequacy of the bank’s liquidity resources to address projected liquidity needs. Evaluate the cumulative gap (sum of the net gaps in each time horizon), which can either be positive, negative or zero. A positive gap implies that banks can cover outflows by liquidating unencumbered assets. A negative gap indicates that the liquidation of banks’ assets will be insufficient to cover outflows
11 Deposit concentration varies by bank. Over the 2006 -2009 period the average share of deposits by the 5 largest depositors in banks was about 30 percent. Some banks had deposit concentrations as high as 55 percent (prior to the establishment of the single treasury accounts at the NBR) and concentration ratios have slowly declined over the period. The ratio of current liabilities to total liabilities averages 72 percent, over the period 2006 to 2009.
12 Not showing on the gap profile are equity capital on the liability side and other assets that are not at the disposal of the treasurers for daily liquidity management.
8
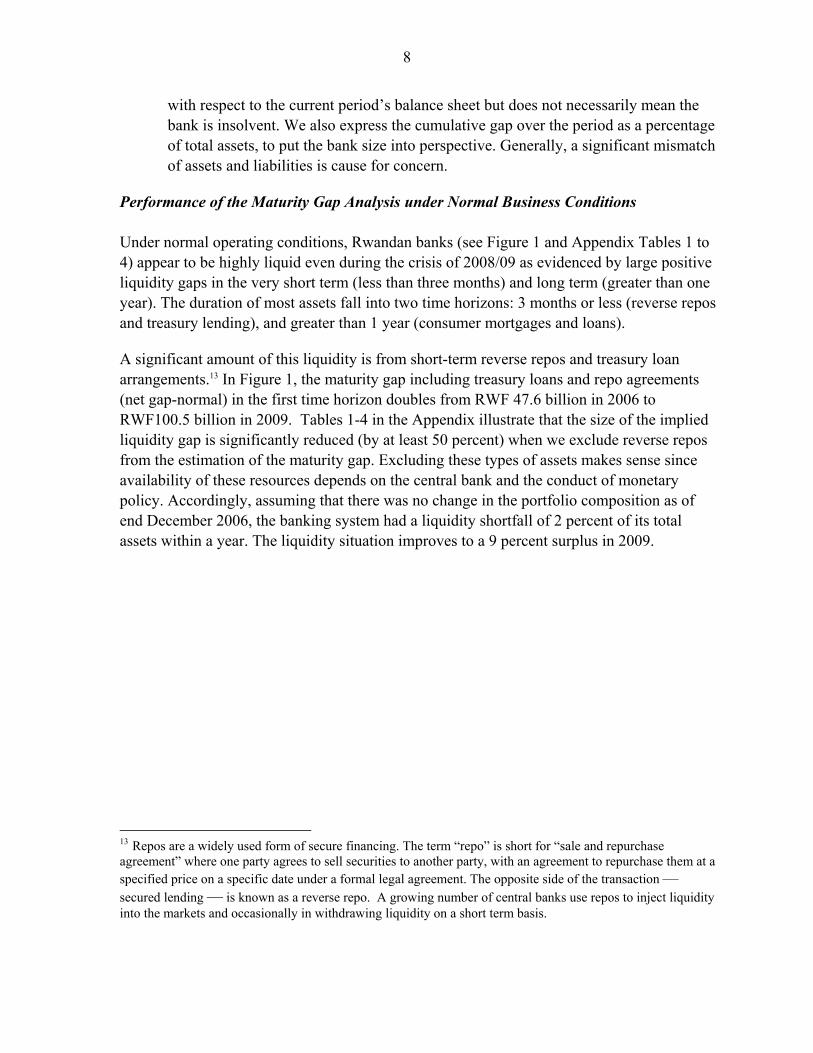
with respect to the current period’s balance sheet but does not necessarily mean the bank is insolvent. We also express the cumulative gap over the period as a percentage of total assets, to put the bank size into perspective. Generally, a significant mismatch of assets and liabilities is cause for concern.
Performance of the Maturity Gap Analysis under Normal Business Conditions Under normal operating conditions, Rwandan banks (see Figure 1 and Appendix Tables 1 to 4) appear to be highly liquid even during the crisis of 2008/09 as evidenced by large positive liquidity gaps in the very short term (less than three months) and long term (greater than one year). The duration of most assets fall into two time horizons: 3 months or less (reverse repos and treasury lending), and greater than 1 year (consumer mortgages and loans).
A significant amount of this liquidity is from short-term reverse repos and treasury loan arrangements.13 In Figure 1, the maturity gap including treasury loans and repo agreements (net gap-normal) in the first time horizon doubles from RWF 47.6 billion in 2006 to RWF100.5 billion in 2009. Tables 1-4 in the Appendix illustrate that the size of the implied liquidity gap is significantly reduced (by at least 50 percent) when we exclude reverse repos from the estimation of the maturity gap. Excluding these types of assets makes sense since availability of these resources depends on the central bank and the conduct of monetary policy. Accordingly, assuming that there was no change in the portfolio composition as of end December 2006, the banking system had a liquidity shortfall of 2 percent of its total assets within a year. The liquidity situation improves to a 9 percent surplus in 2009.
13 Repos are a widely used form of secure financing. The term “repo” is short for “sale and repurchase agreement” where one party agrees to sell securities to another party, with an agreement to repurchase them at a specified price on a specific date under a formal legal agreement. The opposite side of the transaction — secured lending — is known as a reverse repo. A growing number of central banks use repos to inject liquidity into the markets and occasionally in withdrawing liquidity on a short term basis.

9
-0.16
-0.06
0.04
0.14
0.24
0.34
0.44
0.54
-40
-20
0
20
40
60
80
100
Less than 1 month
1 to 3 months
3 to 6 months
6 to 12 months
1 to 2 years 2 to 5 years More than 5 years
Maturity Gap Analysis (2007)
Net gap- normal Net gap without reverse reposNet gap-stress Cumulative gap ratio without reverse repos (right scale)Cumulative Gap to asset ratio -Stress (right scale)
Billio
ns
of R
WF
-0.16
-0.06
0.04
0.14
0.24
0.34
0.44
0.54
-40
-20
0
20
40
60
80
100
Less than 1 month
1 to 3 months
3 to 6 months
6 to 12 months
1 to 2 years 2 to 5 years More than 5 years
Maturity Gap Analysis (2008)
Net gap- normal Net gap without reverse reposNet gap-stress Cumulative gap ratio without reverse repos (right scale)Cumulative Gap to asset ratio -Stress (right scale)
Billio
ns
of R
WF
-0.16
-0.06
0.04
0.14
0.24
0.34
0.44
0.54
-40
-20
0
20
40
60
80
100
120
Less than 1 month
1 to 3 months
3 to 6 months
6 to 12 months
1 to 2 years 2 to 5 years More than 5 years
Maturity Gap Analysis (2009)
Net gap- normal Net gap without reverse reposNet gap-stress Cumulative gap ratio without reverse repos (right scale)Cumulative Gap to asset ratio -Stress (right scale)
Billio
ns
of R
WF
-0.20
-0.10
0.00
0.10
0.20
0.30
0.40
0.50
0.60
-30
-20
-10
0
10
20
30
40
50
60
Less than 1 month
1 to 3 months
3 to 6 months
6 to 12 months
1 to 2 years 2 to 5 years More than 5 years
Maturity Gap Analysis (2006)
Net gap- normal Net gap without reverse reposNet gap-stress Cumulative gap ratio without reverse repos (right scale)Cumulative Gap to asset ratio -Stress (right scale)
Billio
ns
of R
WF
Figure 1: Rwanda – Maturity Gap Analysis

10
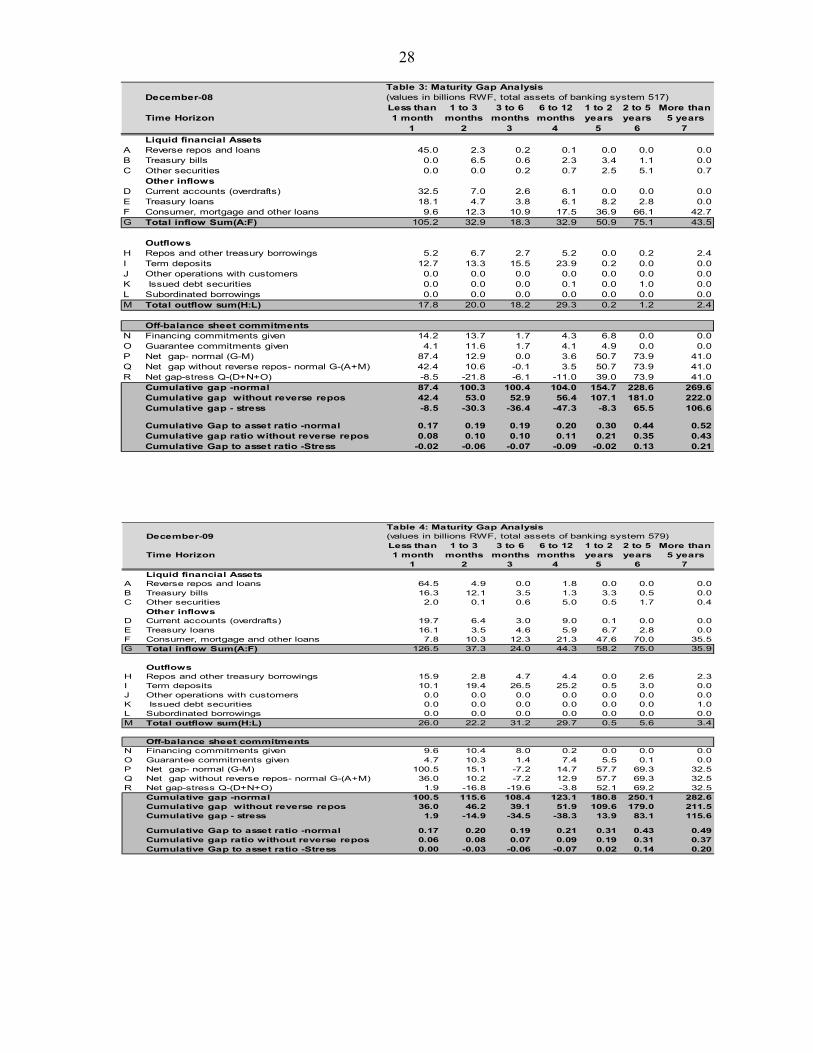
Performance of the Maturity Gap Analysis under Simulated Stress We model liquidity stress events under a no policy intervention scenario by assuming that some contingent liabilities from banks’ off-balance sheet activities will materialize and payment delinquencies will reduce the inflows from customer overdraft accounts. Consequently, the maturity gap under stress adjusts downwards by the full amount of customer overdraft accounts and the financing and guarantee commitments given by the bank. Under this severe stress scenario, the liquidity gap becomes negative after one month and remains so throughout the 12-month horizon for all years except 2008 when it is negative for all periods up to a year. Banks would have been unable to cover their outflows even under the liberal assumption that they could liquidate the assets on their balance sheet at book value.14 At the end of 2008 (Table 2), a minimum liquidity injection of about 47.3 billion RwF (9 percent of total assets in the banking system) would be needed to close the liquidity shortfall in the banking system that arose in the previous twelve months. Table 2
To preserve anonymity, we do not show the ratios for the two banks that entered the banking system during the sample period although they were included in the aggregation for the banking system.
14 The stress scenario is designed to be equal for all banks. Although in practice this is rarely the case as bank specific conditions will determine how a bank’s balance sheet will respond to specific shocks. Therefore, in assessing liquidity risk exposures, banks should analyze a wide range of scenarios that are both bank specific and systemic in nature.
Rwanda: Cumulative Gap to asset ratio across banks (up to 1yr)
Banking System AA AB AC AD AE AF
2006 Normal 0.13 0.31 -0.14 0.17 -0.19 -0.13 0.15
Stress -0.10 0.23 -0.21 0.06 -0.59 -0.20 0.05
2007 Normal 0.18 0.28 0.04 0.26 -0.13 0.23 -0.03
Stress -0.13 0.15 -0.15 0.18 -0.43 0.28 -0.03
2008 Normal 0.20 0.16 0.11 0.20 0.03 0.13 0.26
Stress -0.09 -0.07 -0.22 0.06 -0.61 0.02 -0.03
2009 Normal 0.21 0.27 0.13 0.33 -0.15 0.23 0.04
Stress -0.07 0.12 -0.07 0.23 -0.46 0.06 -0.38

11
The maturity gap across banks The MGA also indicates that the distribution of liquidity was uneven across banks (Table 3). Bank AA was a net supplier of liquidity to the banking system under the normal business scenario whereas bank AD was a net withdrawer of liquidity from the banking system. Bank AC remained liquid in both normal and stress scenarios and its liquidity position strengthened over time whereas bank AF’s liquidity position weakened over time particularly under stress conditions. Why is the maturity gap analysis unable to signal the 2008 liquidity crisis? The maturity gap is unable to signal liquidity pressures in the banking system because it lacks detailed coverage of the flow of funds from both sides of the bank’s balance sheet especially for contractual liabilities. Under a simulated stress scenario the estimated liquidity gap of RwF 51 billion (about 10 percent of total assets) at the height of the liquidity crisis at the end of 2008, is not significantly different from other years. In the near term, the following recommendations can improve the signaling capacity of this indicator:
The reporting format used by the NBR needs more detailed coverage of both contractual liabilities and time horizons. This information will reduce the problem of underestimating flows from deposit liabilities and facilitate the quick detection of liquidity pressures in the near term. The current reporting format (Tables 1 to 4) specified by the NBR uses seven time horizons: ≤ 1 month, 1 to 3 months, 3 to 6 months, 6 to 12 months, 1 to 2 years, 2 to 5 years and > five years. We recommend further disaggregating the first time horizon into: ≤ 1 week, 1 to 2 weeks, and 2 to 4 weeks. This will reflect the concern that banks have about liquidity risk in the very short term compared to a longer term horizon during which they have time to change their portfolio composition and access other sources of liquidity.
A related issue is the need for coverage of contingent liabilities in the MGA. The NBR does not mandate the inclusion of contingent liabilities in the liquidity risk metrics because they are difficult to evaluate. However, there is a strong case for including liquidity risk exposure from off-balance sheet activities in the MGA and other liquidity risk metrics since this is a growing feature of the banking system in Rwanda.
Banks should be required to report simulated stress scenarios of the MGA. The NBR does not currently mandate this, or specify the parameters for the stress events. At the minimum, all banks should be required to simulate a scenario in which acess to repos — the main source of liquidity on banks balance sheet — is curtailed. In addition, the

12
impact of other bank-specific or systemic risks on the maturity gap profile of the banks should be evaluated.
B. Assessment of the NBR’s Liquidity Risk Monitoring Ratio
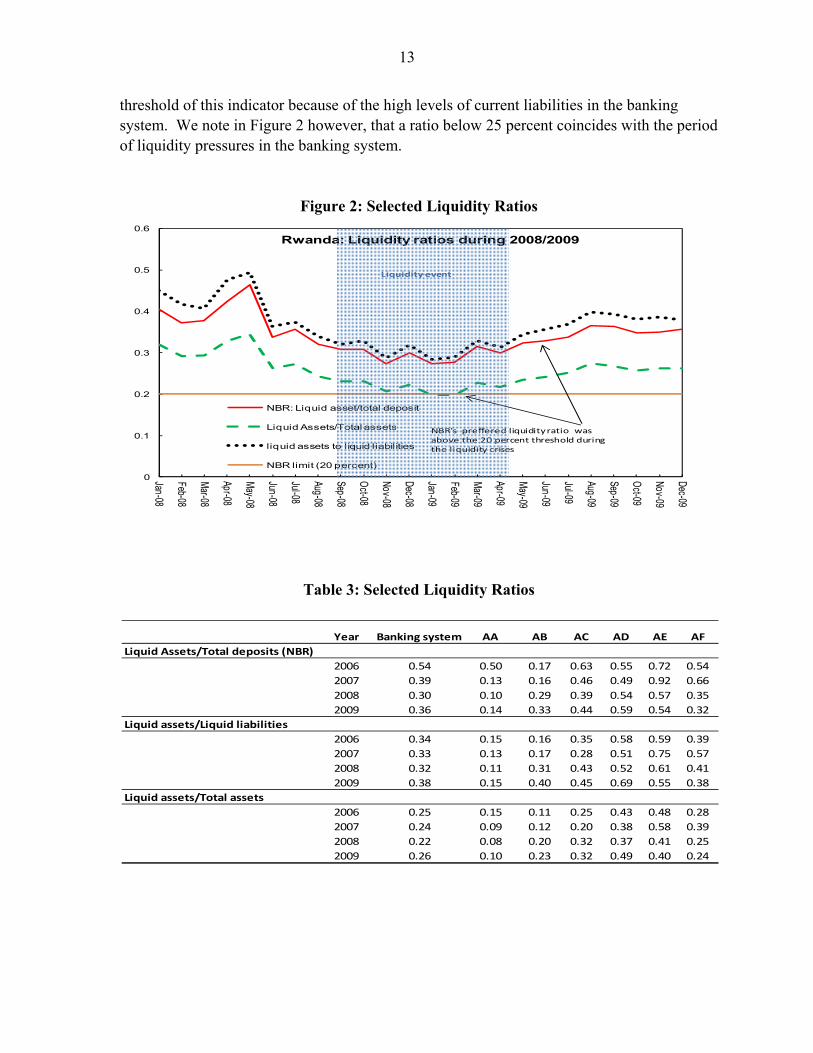
The NBR’s preferred prudential liquidity ratio is the ratio of liquid assets to total deposits. In this section, we first briefly describe this ratio as well as two others that are more commonly used — the liquid-asset to liquid-liability ratio and the liquid-asset to total-asset ratio. We then assess the signaling capacity of these ratios in the lead up to the 2008 crisis. Description of liquidity risk ratios The ratio of liquid assets to total deposits: This ratio uses deposit liabilities as a benchmark by which the adequacy of a bank’s stock of liquid assets is measured. Simply put, the ratio assesses the extent to which banks are holding sufficient liquidity to satisfy deposit withdrawals.15 Typically, a requirement to hold liquid assets benchmarked against some longer term illiquid deposits may appear to be too stringent and lead to further disintermediation by unnecessarily increasing the amount of liquidity banks hold. In Rwanda however, there may be some justification for using this ratio since deposits are mainly short term in nature, and concentrated among a few large depositors. The ratio of liquid assets to liquid liabilities (quick ratio): This ratio measures the ability of a bank to pay its short-term obligations when they become due. Higher ratios—generally ratios closer to or greater than 1—are more desirable. The short duration of assets and liabilities in the Rwandan banking system makes the monitoring of this ratio particularly important. Figure 2, shows that this ratio for the banking system as a whole peaked at 50 percent in May 2008 and thereafter remained below 40 percent. This reflects inadequate liquidity to cover the unusual proportion of short term liabilities to total liabilities (the ratio of current liabilities to total liabilities averages 72 percent, over the period 2006 to 2009). The ratio of liquid assets to total assets: This ratio is indicative of immediate liquidity available from a bank’s asset base. We cannot give specific guidance on the optimal
15 The NBR defines liquid assets as (a) notes and coins which are legal tender in Rwanda and any other currency freely negotiable and transferable in international exchange markets; (b) balances held at the Central Bank for cash reserves and clearing purposes; (c) money at call and balances at banks in Rwanda, other than the NBR, net of balances owed to those banks; (d) Rwanda treasury bills maturing within a year; (e) marketable government securities that are held by a bank for trading purposes; (f) uncommitted balances at banks outside Rwanda denominated in freely negotiable and transferable currencies that can be withdrawn on demand and money at call outside Rwanda after deducting the balances owed to such banks. Balances held at banks outside of Rwanda will only be considered eligible for inclusion in liquid assets, to the extent that they are held in currencies that are freely convertible; (g) Commercial bills and promissory notes which are eligible for discount by commercial banks or the NBR.
13
threshold of this indicator because of the high levels of current liabilities in the banking system. We note in Figure 2 however, that a ratio below 25 percent coincides with the period of liquidity pressures in the banking system.
Figure 2: Selected Liquidity Ratios
Table 3: Selected Liquidity Ratios
Year Banking system AA AB AC AD AE AF
Liquid Assets/Total deposits (NBR)
2006 0.54 0.50 0.17 0.63 0.55 0.72 0.54
2007 0.39 0.13 0.16 0.46 0.49 0.92 0.66
2008 0.30 0.10 0.29 0.39 0.54 0.57 0.35
2009 0.36 0.14 0.33 0.44 0.59 0.54 0.32
Liquid assets/Liquid liabilities
2006 0.34 0.15 0.16 0.35 0.58 0.59 0.39
2007 0.33 0.13 0.17 0.28 0.51 0.75 0.57
2008 0.32 0.11 0.31 0.43 0.52 0.61 0.41
2009 0.38 0.15 0.40 0.45 0.69 0.55 0.38
Liquid assets/Total assets
2006 0.25 0.15 0.11 0.25 0.43 0.48 0.28
2007 0.24 0.09 0.12 0.20 0.38 0.58 0.39
2008 0.22 0.08 0.20 0.32 0.37 0.41 0.25
2009 0.26 0.10 0.23 0.32 0.49 0.40 0.24
0
0.1
0.2
0.3
0.4
0.5
0.6
Jan-08
Feb-08
Mar-08
Apr-08
May-08
Jun-08
Jul-08
Aug-08
Sep-08
Oct-08
Nov-08
Dec-08
Jan-09
Feb-09
Mar-09
Apr-09
May-09
Jun-09
Jul-09
Aug-09
Sep-09
Oct-09
Nov-09
Dec-09
Rwanda: Liquidity ratios during 2008/2009
NBR: Liquid asset/total deposit
Liquid Assets/Total assets
liquid assets to liquid liabilities
NBR limit (20 percent)
NBR's preffered liquidity ratio was above the 20 percent threshold during the liquidity crises
Liquidity event
14
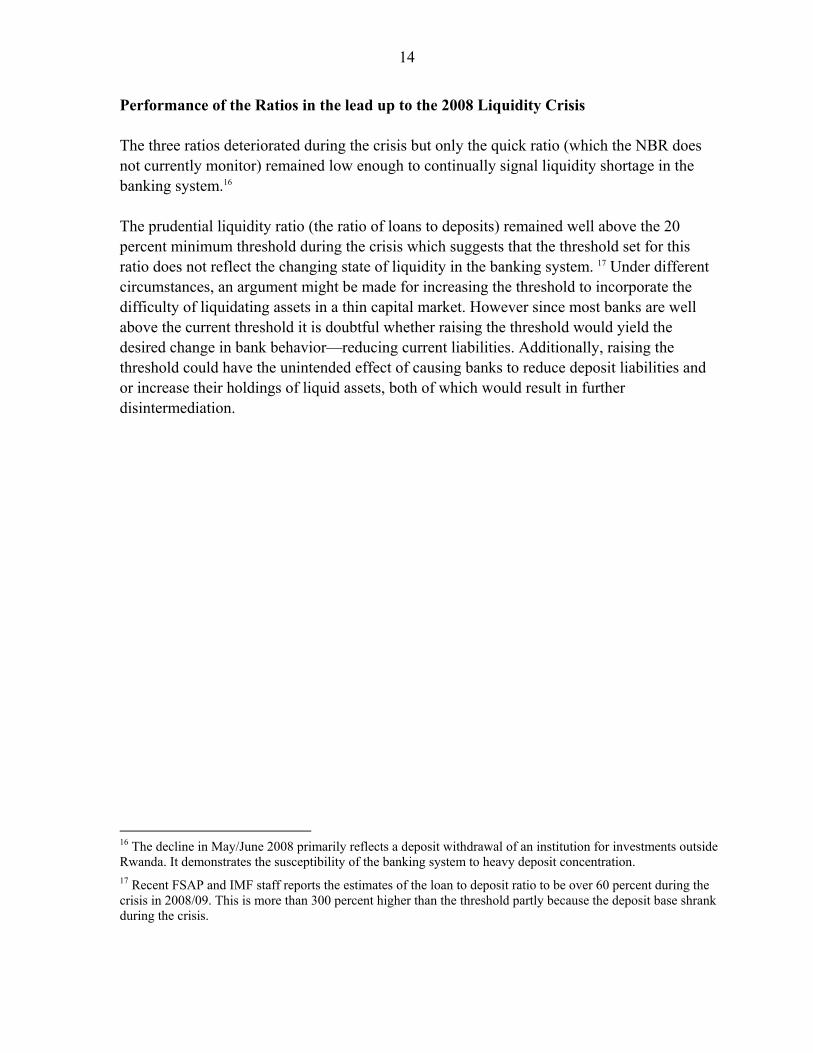
Performance of the Ratios in the lead up to the 2008 Liquidity Crisis The three ratios deteriorated during the crisis but only the quick ratio (which the NBR does not currently monitor) remained low enough to continually signal liquidity shortage in the banking system.16 The prudential liquidity ratio (the ratio of loans to deposits) remained well above the 20 percent minimum threshold during the crisis which suggests that the threshold set for this ratio does not reflect the changing state of liquidity in the banking system. 17 Under different circumstances, an argument might be made for increasing the threshold to incorporate the difficulty of liquidating assets in a thin capital market. However since most banks are well above the current threshold it is doubtful whether raising the threshold would yield the desired change in bank behavior—reducing current liabilities. Additionally, raising the threshold could have the unintended effect of causing banks to reduce deposit liabilities and or increase their holdings of liquid assets, both of which would result in further disintermediation.
16 The decline in May/June 2008 primarily reflects a deposit withdrawal of an institution for investments outside Rwanda. It demonstrates the susceptibility of the banking system to heavy deposit concentration. 17 Recent FSAP and IMF staff reports the estimates of the loan to deposit ratio to be over 60 percent during the crisis in 2008/09. This is more than 300 percent higher than the threshold partly because the deposit base shrank during the crisis.
15
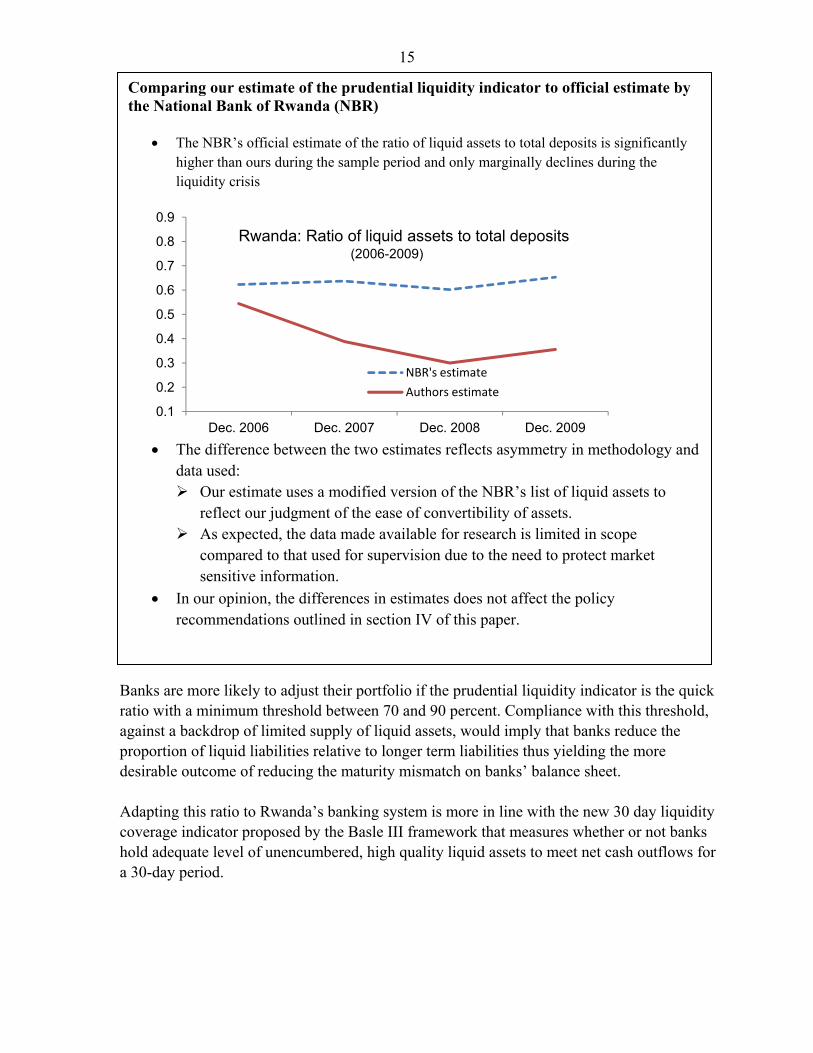
Banks are more likely to adjust their portfolio if the prudential liquidity indicator is the quick ratio with a minimum threshold between 70 and 90 percent. Compliance with this threshold, against a backdrop of limited supply of liquid assets, would imply that banks reduce the proportion of liquid liabilities relative to longer term liabilities thus yielding the more desirable outcome of reducing the maturity mismatch on banks’ balance sheet. Adapting this ratio to Rwanda’s banking system is more in line with the new 30 day liquidity coverage indicator proposed by the Basle III framework that measures whether or not banks hold adequate level of unencumbered, high quality liquid assets to meet net cash outflows for a 30-day period.
Comparing our estimate of the prudential liquidity indicator to official estimate by the National Bank of Rwanda (NBR)
The NBR’s official estimate of the ratio of liquid assets to total deposits is significantly higher than ours during the sample period and only marginally declines during the liquidity crisis
The difference between the two estimates reflects asymmetry in methodology and
data used: Our estimate uses a modified version of the NBR’s list of liquid assets to
reflect our judgment of the ease of convertibility of assets. As expected, the data made available for research is limited in scope
compared to that used for supervision due to the need to protect market sensitive information.
In our opinion, the differences in estimates does not affect the policy recommendations outlined in section IV of this paper.
0.1
0.2
0.3
0.4
0.5
0.6
0.7
0.8
0.9
Dec. 2006 Dec. 2007 Dec. 2008 Dec. 2009
NBR's estimate
Authors estimate
Rwanda: Ratio of liquid assets to total deposits (2006-2009)

16
More formally:
30
1
In line with best practice, the NBR should encourage commercial banks to employ and report a range of liquidity indicators to quantify liquidity risk because no single metric can provide a sufficiently comprehensive assessment of liquidity risk (Neu and Matz, 2007 and BIS, 2008). The NBR should however balance the reporting burden on commercial banks against the benefits gained from these liquidity measures. Consequently, it should recommend the use of core indicators that provide additional insight on the liquidity condition of individual banks.
C. Liquidity stress tests
Well designed liquidity stress tests provide central banks with reliable information about potential impact of a liquidity shock and to decide on an effective policy response. Establishing a common framework with objective parameters is a valuable way to approximate externalities and systemic effects of individual banks’ liquidity problems. The use of common stress parameters in the framework addresses the issues of reliability, comparability and comprehensiveness although banks should be encouraged to supplement this with bank-specific stress events. Two critical questions are at the core of a liquidity risk assessment (a) what is the scale of the liquidity problem at a bank that requests liquidity assistance; and (b) what are the potential systemic implications of the liquidity stress (ECB 2008). Liquidity stress tests contain such information. They enable banks to assess the possible impact of exceptional but plausible stress scenarios on their liquidity position and allow them to determine the size of liquidity buffers required to shore up against potential liquidity shocks.18 We employ the Excel-based liquidity stress tests developed by Čihák (2007) to illustrate how the NBR could assess the scale of liquidity problems at individual banks and the systemic implications for the banking system under a common but simple framework. We use individual bank data for the periods ending December 2006 to 2009. The liquidity stress tests applied show the daily impact on each bank in terms of the number of days it would be able to survive without borrowing from the central bank or other banks on an uncollateralized basis.19
18 The assumption is that banks cannot fully hedge liquidity risks by accumulating liquid reserves. Therefore, the results from the stress tests help banks identify how to minimize the impact of a liquidity shock. 19 The standard tests use a time horizon of 5 days – a business week - and assume that the central bank is able to resolve the crisis including closing banks during the weekend. The short time horizon also reflects shorter
(continued…)

17
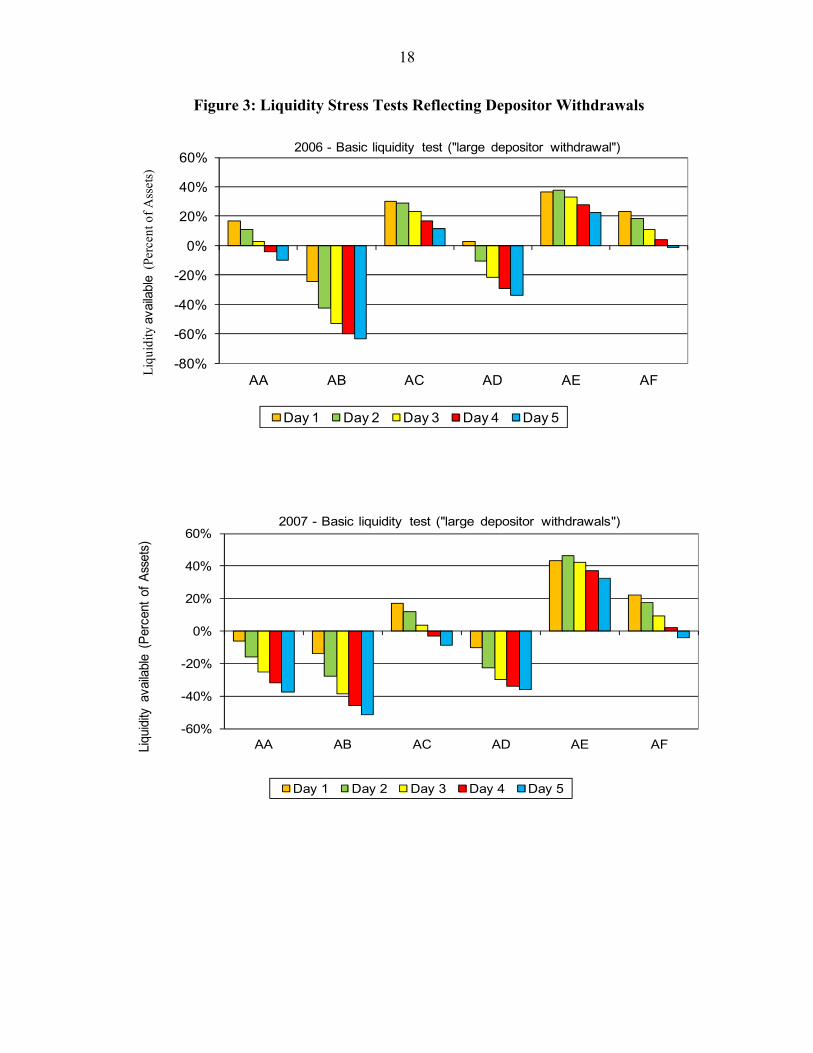
The first of these stress tests simulates:
A partial deposit loss—in amounts equivalent to the size of deposits held by each bank’s three largest depositors20 in a given year, and
Daily asset liquidation of 80% that would provide a sufficient liquidity buffer for at least one day in all banks during the period.
The results (Figure 3) illustrate the increasing vulnerability to deposit concentration at the bank level prior to the 2008 crises. Banks would consistently need to borrow from the banking system in each year as bank-wide net inflows become increasingly negative throughout the period peaking at RwF 94.5 billion (19 percent of assets) in 2008 - perhaps because of heavy deposit concentration relative to assets. We also note that the liquidity situation was still tenuous at the end of 2009—RwF 87.6 billion (15 percent of assets) in 2009.
clearing and settlement cycles and increased use of real-time gross settlement (RTGS) systems, internet banking and internationalization of business. 20 Rwanda does not have a deposit insurance scheme.
18
Figure 3: Liquidity Stress Tests Reflecting Depositor Withdrawals
-80%
-60%
-40%
-20%
0%
20%
40%
60%
AA AB AC AD AE AF
Day 1 Day 2 Day 3 Day 4 Day 5
Liq
uidi
ty a
vaila
ble
(Per
cent
of
Ass
ets)
2006 - Basic liquidity test ("large depositor withdrawal")
-60%
-40%
-20%
0%
20%
40%
60%
AA AB AC AD AE AF
Day 1 Day 2 Day 3 Day 4 Day 5
Liqu
idity
ava
ilabl
e (P
erce
nt o
f A
sset
s)
2007 - Basic liquidity test ("large depositor withdrawals")
19
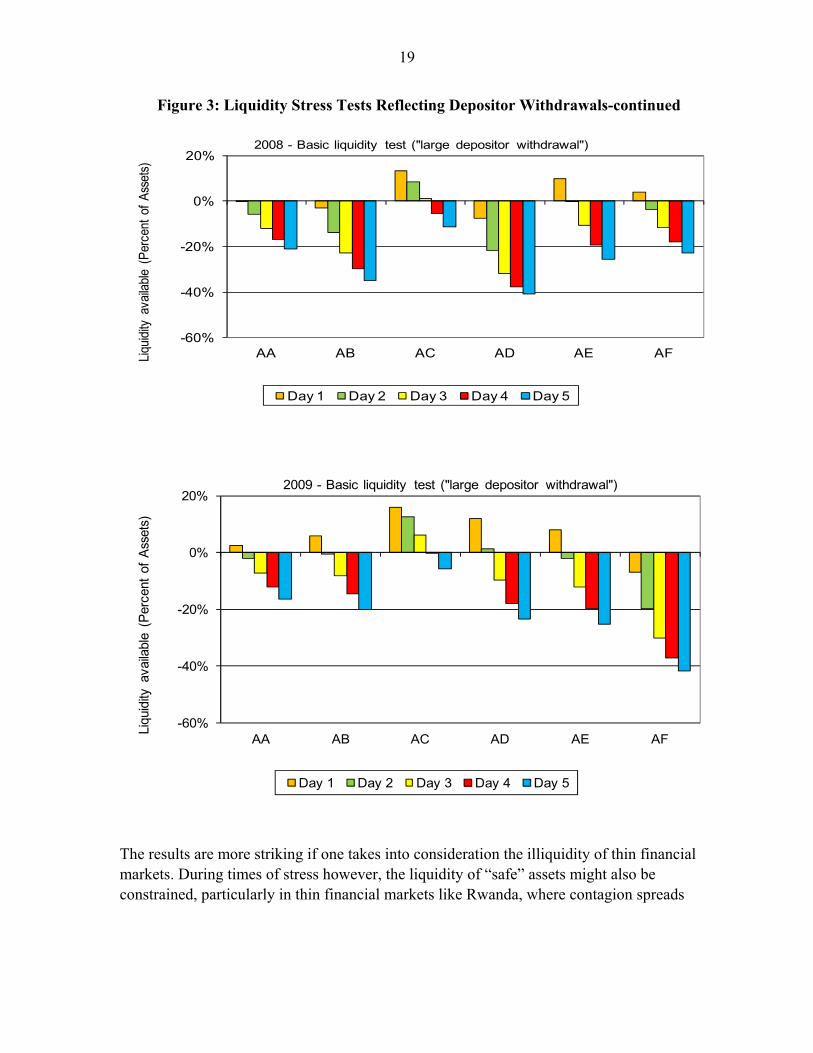
Figure 3: Liquidity Stress Tests Reflecting Depositor Withdrawals-continued
The results are more striking if one takes into consideration the illiquidity of thin financial markets. During times of stress however, the liquidity of “safe” assets might also be constrained, particularly in thin financial markets like Rwanda, where contagion spreads
-60%
-40%
-20%
0%
20%
AA AB AC AD AE AF
Day 1 Day 2 Day 3 Day 4 Day 5
Liqu
idity
ava
ilabl
e (P
erce
nt o
f A
sset
s)2008 - Basic liquidity test ("large depositor withdrawal")
-60%
-40%
-20%
0%
20%
AA AB AC AD AE AF
Day 1 Day 2 Day 3 Day 4 Day 5
Liqu
idity
ava
ilabl
e (P
erce
nt o
f A
sset
s)
2009 - Basic liquidity test ("large depositor withdrawal")

20
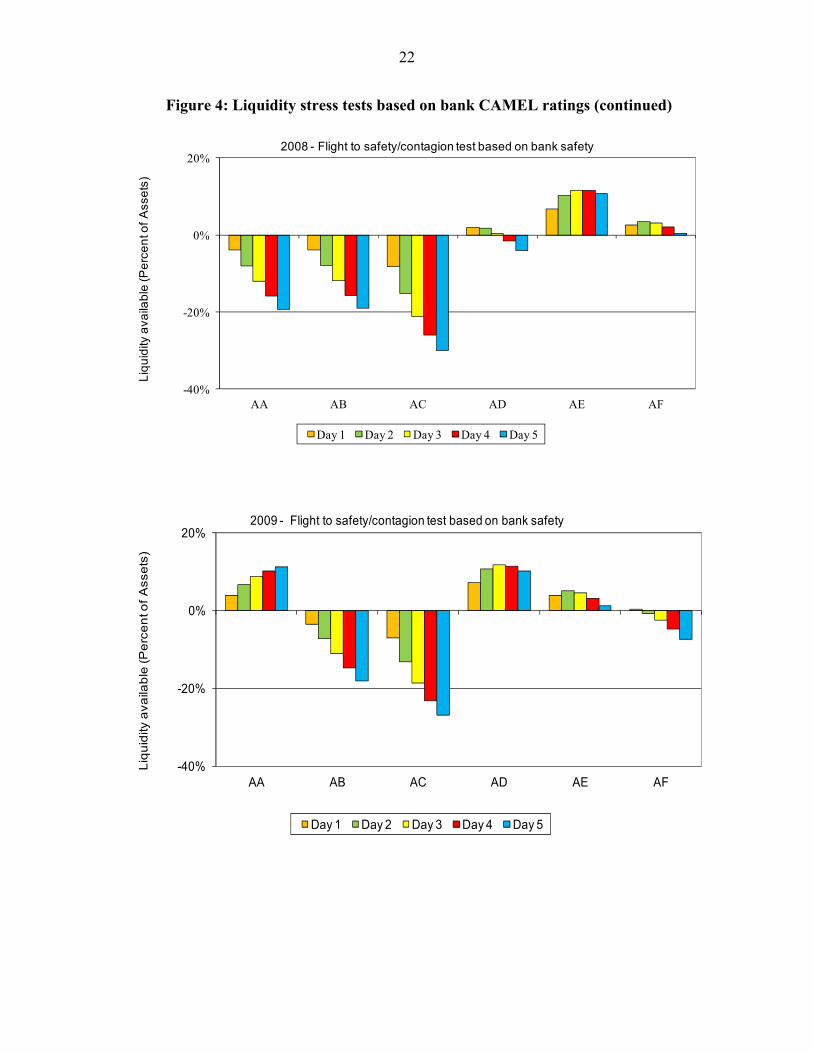
faster making assets increasingly illiquid. Alternatively, the availability of unencumbered liquid assets21 might be lower than reflected on balance sheets. In such cases increased haircuts on assets or fire sales quickly exhaust the stock of liquid assets available for liquidity support. Liquidity shortfalls in scenarios where available liquidity is substantially below the 80 percent assumed above are perhaps more realistic but would magnify the impact of severe deposit outflows. A second stress test simulates public reactions to changes in their perception of bank safety.22 For this we use the performance ratings of banks compiled by the NBR for its CAMELS system over the four-year period. The higher the rating, the greater the public’s perception of risk for a given bank, and the greater the deposit withdrawal. The availability of liquid assets is assumed to be 30 percent–compared to the 80 percent used in the “basic liquidity test” scenario above – to reflect increasing uncertainty about banks’ ability to liquidate their assets and an increasing need for recourse to the rest of the banking system. Figure 4 shows a strong correlation between the perceptions of bank performance and liquidity needs. Vulnerabilities are evident from 2007, ahead of the crises, where liquidity needs peaked at RwF 53.4 billion (14 percent of assets) but with the level of distress worsening in nominal terms in 2008. By the end of 2009, the liquidity situation improved (liquidity needs were equivalent to 2 percent of assets) although two banks would have still been in significant distress. Stress tests on liquidity positions can be extended to cover a number of scenarios or a combined scenario beyond these included above, for example, unscheduled draws on committed but unused credit and liquidity facilities and the need to fund balance sheet growth arising from non-contractual obligations honored in the interest of mitigating reputational risk, which could reflect an idiosyncratic and market-wide shock (BIS 2009). However, the simple tests performed demonstrate the importance and need for Rwandan banks to have well-defined contingency funding plans (CFP) as part of a liquidity management strategy that describes procedures for managing and addressing cash flow shortfalls.
21 There are cases in sub-Saharan African countries where banks have pledged holdings of government treasury bills to secure deposits from corporate entities.
22 Čihák (2007) indicates that the perception of bank safety could also reflect a bank’s asset size or structure of ownership. The public may have the perception that large banks have sufficient resources or have access to resources to honor their deposit liabilities or would be bailed out if failure would be detrimental to the financial system, i.e. “too big to fail”. State-owned banks may also be perceived to be safer than privately-owned banks because of an explicit or implicit government guarantee.

21
Figure 4: Liquidity stress tests based on bank CAMELS ratings
-20%
0%
20%
40%
AA AB AC AD AE AF
Day 1 Day 2 Day 3 Day 4 Day 5
Liq
uid
ity
av
aila
ble
(Per
cent
of
Ass
ets)
2006 - Flight to safety/contagion test based on bank safety
-60%
-40%
-20%
0%
20%
AA AB AC AD AE AF
Day 1 Day 2 Day 3 Day 4 Day 5
Liq
uid
ity a
vaila
ble
(Pe
rce
nt o
f A
sse
ts)
2007 - Flight to safety/contagion test based on bank safety
22
Figure 4: Liquidity stress tests based on bank CAMEL ratings (continued)
-40%
-20%
0%
20%
AA AB AC AD AE AF
Day 1 Day 2 Day 3 Day 4 Day 5
Liq
uid
ity a
vaila
ble
(Pe
rce
nt o
f A
sse
ts)
2008 - Flight to safety/contagion test based on bank safety
-40%
-20%
0%
20%
AA AB AC AD AE AF
Day 1 Day 2 Day 3 Day 4 Day 5
Liq
uid
ity a
va
ilab
le (P
erc
en
t of
Asse
ts)
2009 - Flight to safety/contagion test based on bank safety
23
IV. SUMMARY OF FINDINGS AND POLICIES TO STRENGTHEN LIQUIDITY RISK
MANAGEMENT IN RWANDA
This section details some recommendations to strengthen the NBR’s current systemic liquidity management framework. In the near term, the priority is to strengthen the signaling effect of the quantitative indicators as well as incorporate some easy-to-understand qualitative indicators. In the medium term, implementing certain economic and financial sector reforms will be necessary for adequate liquidity risk oversight in the system.
A. Improving the signaling effect of quantitative indicators
The NBR should design quantitative indicators with the aim of ensuring that compliance with prudential requirements is achieved through lengthening the duration of assets and liabilities as opposed to simply holding more liquid assets. Our suggestions are as follows: 23 The MGA reporting format used by the NBR needs:(a) more detailed coverage of contractual liabilities, to reduce the problem of underestimating flows from deposit liabilities and facilitate the quick detection of liquidity pressures in the near term and time horizons, (b) further disaggregation of the first time horizon ( ≤ 1 month) to provide more information and allow the monitoring of short-term liquidity resilience, and (c) to include the liquidity risk exposure from off-balance sheet activities and contingent liabilities as these are an increasing feature of the banking system in Rwanda and likely to be a future source of risk.
The NBR should monitor the ratio of liquid assets to liquid liabilities. As a metric it would have the desired effect of making banks adjust their liability portfolio so that the maturity mismatch on their balance sheet is reduced. Further, adapting this ratio to Rwanda’s banking system is more in line with the new 30 day liquidity coverage indicator proposed by the Basle III framework that measures whether or not banks hold adequate levels of unencumbered, high-quality liquid assets to meet net cash outflows for a 30-day period. Liquidity stress tests should also become a part of quantitative indicators monitored by the NBR. We show that stress tests are useful in demonstrating the impact of low probability but high severity events on the banking system. To maintain a reasonable level of comparability, banks should run scenarios covering all time horizons that are relevant to their maturity
23 Deposit concentration and high short term liabilities complicate liquidity risk management in Rwanda. A withdrawal by the three largest depositors would be disastrous in most banks as evidenced during the crisis although this is not an extremity in itself if there was greater deposit diversification. In the same vein, requiring banks to hold liquidity buffers to cover these high severity events will sharply curtail intermediation by forcing banks to hold a significant amount of liquid assets.
24
profile. In addition, banks should run separate stress tests based on idiosyncratic and market risks as well as scenarios that integrate both risks.24
B. Incorporating qualitative indicators of liquidity risk
In line with best practices, the NBR should require banks to develop a well-defined contingency funding plan (CFP) consistent with banks’ risk monitoring and management capabilities25. The contingency funding plan should contain clear policies and procedures that will enable the bank’s management to make timely and well-informed decisions, quickly execute contingency measures, and communicate effectively both internally and externally with the NBR. It would also be helpful for banks to gradually diversify their funding sources so that the withdrawal of a single counterparty or type of counterparty does not destabilize their operations. Related to this, is the need for banks to implement policies geared towards deposit retention and extending the term structure of its deposit liabilities.
C. Strengthening systemic liquidity management
In the medium term, policy emphasis should focus on two key areas of reform, namely (a) the effective implementation of monetary policy to facilitate short-term liquidity needs and, (b) financial sector development to enable banks to quickly mobilize liquidity during a shortfall. Reforming monetary policy implementation In the case of Rwanda, the repo arrangement cannot adequately serve as both an instrument of monetary policy as well as a facility to inject longer term liquidity into cash strapped institutions. This is because the majority of repos go in one direction — the reverse-repurchase arrangements where banks lend excess liquidity to the central bank — and do not adequately address banks concerns about the duration gap of their balance sheet. In turn this undermines banks incentives to manage liquidity and extend credit. The NBR can address the issue by substituting repo arrangements (not intended for short term liquidity management) with a scheme of more effective liquidity absorbing tools such as 3 or 6 month T-bills and central bank bills.
24 Capacity constraints are a key reason why banks may not stress test their liquidity risk management framework. 25 Outlined in Matz 2007 and EU 2008.
25
Establishing a facility that provides collateralized credit to banks on demand can offer flexibility to manage liquidity.26 For example, the NBR could adopt a remunerated Lombard deposit facility, similar to the European Central Bank (ECB), in which banks can always deposit excess reserves at end of day. The existence of this deposit facility implies that there is in fact no a priori rationale for banks to hold short-term excess reserves since it pays to deposit all excess reserves (after all intra-bank payments of the day have been processed) at the deposit facility. The Lombard deposit rate set will typically be lower than the interbank rate to ensure that banks first seek to place reserves in the financial system (Alexander et al- 1996, Bindseil et al-2006 and Chailloux and Hakura -2009)
Other reforms On the fiscal side, policies to increase the absorption capacity of the economy such as better cash management by fiscal institutions will help reduce the buildup of liquidity. On the financial sector side, well functioning networks such as payment systems and credit reference bureaus will enable banks to safely extend credit whilst deep and liquid financial markets will reduce the need for banks to hoard liquidity since they will be able to access or place excess reserves.
V. CONCLUSION
In 2008/09 endogenous factors sparked a domestic liquidity crisis in Rwanda. In response, the NBR redesigned its prudential regulations on liquidity risk management. This paper assesses the new NBR’s liquidity management framework through end-2009 with particular emphasis on the quantitative indicators—liquidity ratios and maturity gap analysis specified for regulatory purposes. The objective is to identify if these indicators can be used ex ante to detect liquidity pressure in the banking system during the liquidity crisis in 2008/09. We find both quantitative indicators currently used by the NBR to be insufficient signals of liquidity pressures in the system. Although, the NBR’s preferred liquidity ratio–the ratio of liquid assets to total deposits-declines in the lead up to the crisis, the threshold set for this indicator is too low. We find that other commonly used indicators such as the quick ratio and the ratio of liquid assets to total
26 Lombard credit facility is the granting of credit by the central bank to commercial banks against pledged securities that are readily sellable. In general, the interest rate for this transaction is set above the “interbank rate” charged among banks for the same type of credit in order not to undermine the Central bank’s role as the lender of last resort. The Federal Reserve Bank of the USA and the ECB uses the Lombard credit facility.
26
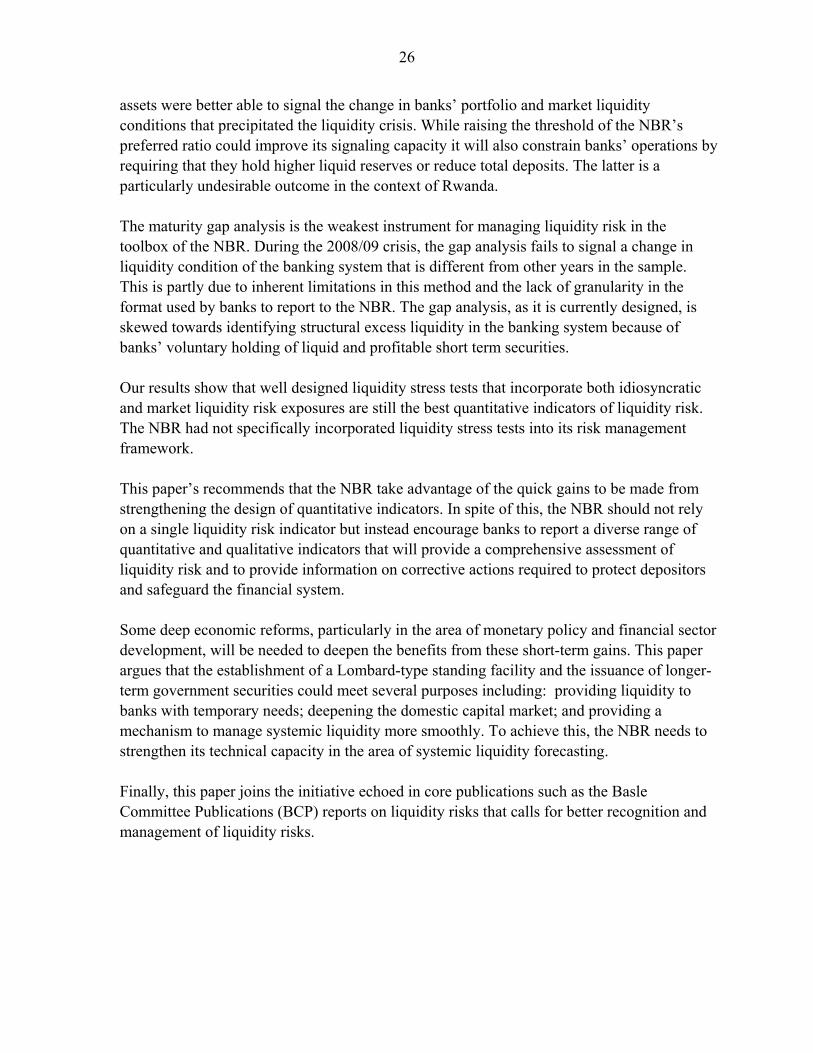
assets were better able to signal the change in banks’ portfolio and market liquidity conditions that precipitated the liquidity crisis. While raising the threshold of the NBR’s preferred ratio could improve its signaling capacity it will also constrain banks’ operations by requiring that they hold higher liquid reserves or reduce total deposits. The latter is a particularly undesirable outcome in the context of Rwanda. The maturity gap analysis is the weakest instrument for managing liquidity risk in the toolbox of the NBR. During the 2008/09 crisis, the gap analysis fails to signal a change in liquidity condition of the banking system that is different from other years in the sample. This is partly due to inherent limitations in this method and the lack of granularity in the format used by banks to report to the NBR. The gap analysis, as it is currently designed, is skewed towards identifying structural excess liquidity in the banking system because of banks’ voluntary holding of liquid and profitable short term securities. Our results show that well designed liquidity stress tests that incorporate both idiosyncratic and market liquidity risk exposures are still the best quantitative indicators of liquidity risk. The NBR had not specifically incorporated liquidity stress tests into its risk management framework. This paper’s recommends that the NBR take advantage of the quick gains to be made from strengthening the design of quantitative indicators. In spite of this, the NBR should not rely on a single liquidity risk indicator but instead encourage banks to report a diverse range of quantitative and qualitative indicators that will provide a comprehensive assessment of liquidity risk and to provide information on corrective actions required to protect depositors and safeguard the financial system. Some deep economic reforms, particularly in the area of monetary policy and financial sector development, will be needed to deepen the benefits from these short-term gains. This paper argues that the establishment of a Lombard-type standing facility and the issuance of longer-term government securities could meet several purposes including: providing liquidity to banks with temporary needs; deepening the domestic capital market; and providing a mechanism to manage systemic liquidity more smoothly. To achieve this, the NBR needs to strengthen its technical capacity in the area of systemic liquidity forecasting. Finally, this paper joins the initiative echoed in core publications such as the Basle Committee Publications (BCP) reports on liquidity risks that calls for better recognition and management of liquidity risks.

27
Table 2: Maturity Gap AnalysisDecember-07 (values in billions RWF, total assets of banking system 385)
Time HorizonLess than 1 month
1 to 3 months
3 to 6 months
6 to 12 months
1 to 2 years
2 to 5 years
More than 5 years
1 2 3 4 5 6 7
Liquid financial AssetsA Reverse repos and loans 46.4 2.6 0.1 0.1 0.0 0.0 0.0B Treasury bills 22.0 19.8 0.8 2.2 1.4 2.1 0.9C Other securities 0.0 0.0 0.0 0.0 0.0 0.0 0.0
Other inflowsD Current accounts (overdrafts) 17.8 1.2 0.5 0.5 0.8 1.0 0.0E Treasury loans 9.9 0.9 0.9 0.8 0.7 0.8 0.0F Consumer, mortgage and other loans 3.3 5.9 1.4 4.1 12.5 39.2 21.9G Total inflow Sum(A:F) 99.3 30.5 3.6 7.8 15.4 43.0 22.8
OutflowsH Repos and other treasury borrowings 2.6 2.3 2.8 3.8 0.8 0.2 1.2I Term deposits 11.2 16.1 16.7 16.6 1.1 0.0 0.0J Other operations with customers 0.0 0.0 0.0 0.0 0.0 0.0 0.0K Issued debt securities 0.0 0.0 0.0 0.1 0.0 0.0 0.0L Subordinated borrowings 0.0 0.0 0.0 0.0 0.0 0.0 0.0M Total outflow sum(H:L) 13.8 18.4 19.5 20.5 1.9 0.2 1.2
Off-balance sheet commitmentsN Financing commitments given 13.6 9.4 2.4 0.0 0.0 0.0 0.0O Guarantee commitments given 3.2 11.4 2.2 8.7 1.2 0.0 0.0P Net gap- normal (G-M) 85.5 12.0 -15.9 -12.7 13.5 42.8 21.5Q Net gap without reverse repos- normal G-(A+M) 39.1 9.4 -16.0 -12.9 13.5 42.8 21.5R Net gap-stress Q-(D+N+O) 4.5 -12.6 -21.1 -22.0 11.5 41.8 21.5
Cumulative gap -normal 85.5 97.6 81.6 68.9 82.5 125.2 146.8Cumulative gap without reverse repos 39.1 48.6 32.5 19.7 33.2 76.0 97.5Cumulative gap - stress 4.5 -8.2 -29.2 -51.2 -39.7 2.1 23.6
Cumulative gap to asset ratio -normal 0.22 0.25 0.21 0.18 0.21 0.33 0.38Cumulative gap ratio without reverse repos 0.10 0.13 0.08 0.05 0.09 0.20 0.25Cumulative gap to asset ratio -stress 0.01 -0.02 -0.08 -0.13 -0.10 0.01 0.06
Table 1: Maturity Gap AnalysisDecember-06 (values in billions RWF, total assets of banking system 294)
Time HorizonLess than 1 month
1 to 3 months
3 to 6 months
6 to 12 months
1 to 2 years
2 to 5 years
More than 5 years
1 2 3 4 5 6 7
Liquid financial AssetsA Reverse repos and loans 32.2 2.5 0.0 0.0 0.0 0.0 0.0B Treasury bills 7.1 14.7 8.1 1.1 2.1 4.0 2.5C Other securities 0.0 0.0 0.0 0.0 0.0 0.0 0.0
Other inflowsD Current accounts (overdrafts) 0.4 0.5 0.0 0.0 0.0 0.0 0.0E Treasury loans 11.2 1.1 0.6 1.5 0.5 1.5 0.0F Consumer, mortgage and other loans 3.0 1.9 1.6 2.8 10.7 27.8 16.5G Total inflow Sum(A:F) 53.8 20.6 10.3 5.4 13.3 33.2 19.0
OutflowsH Repos and other treasury borrowing 3.8 4.8 7.3 1.3 0.0 1.2 0.0I Term deposits 2.3 13.0 16.1 13.0 0.0 1.0 0.0J Other operations with customers 0.0 0.0 0.0 0.0 0.0 0.0 0.0K Issued debt securities 0.0 0.0 0.0 0.1 0.0 0.0 0.0L Subordinated borrowings 0.0 0.0 0.0 0.0 0.0 0.0 0.0M Total outflow sum(H:L) 6.2 17.8 23.4 14.4 0.0 2.3 0.0
Off- balance sheet commitmentsN Financing commitments given 9.8 6.5 2.4 0.0 0.0 0.0 0.0O Guarantee commitments given 1.6 8.9 3.0 2.9 0.6 0.0 0.0P Net gap- normal (G-M) 47.6 2.8 -13.1 -9.0 13.3 30.9 19.0Q Net gap without reverse repos- normal G-(A+M) 15.4 0.3 -13.1 -9.0 13.3 30.9 19.0R Net gap-stress Q-(D+N+O) 3.6 -15.5 -18.5 -11.9 12.7 30.9 19.0
Cumulative gap -normal 47.6 50.4 37.4 28.4 41.7 72.6 91.6Cumulative gap without reverse repos 15.4 15.7 2.7 -6.3 7.0 37.9 56.9Cumulative gap - stress 3.6 -11.9 -30.4 -42.3 -29.6 1.3 20.3
Cumulative gap to asset ratio -normal 0.16 0.17 0.13 0.10 0.14 0.25 0.31Cumulative gap ratio without reverse repos 0.05 0.05 0.01 -0.02 0.02 0.13 0.19Cumulative gap to asset ratio -stress 0.01 -0.04 -0.10 -0.14 -0.10 0.00 0.07
Appendix 1: Maturity Gap Analysis
28
Table 3: Maturity Gap AnalysisDecember-08 (values in billions RWF, total assets of banking system 517)
Time HorizonLess than 1 month
1 to 3 months
3 to 6 months
6 to 12 months
1 to 2 years
2 to 5 years
More than 5 years
1 2 3 4 5 6 7
Liquid financial AssetsA Reverse repos and loans 45.0 2.3 0.2 0.1 0.0 0.0 0.0B Treasury bills 0.0 6.5 0.6 2.3 3.4 1.1 0.0C Other securities 0.0 0.0 0.2 0.7 2.5 5.1 0.7
Other inflowsD Current accounts (overdrafts) 32.5 7.0 2.6 6.1 0.0 0.0 0.0E Treasury loans 18.1 4.7 3.8 6.1 8.2 2.8 0.0F Consumer, mortgage and other loans 9.6 12.3 10.9 17.5 36.9 66.1 42.7G Total inflow Sum(A:F) 105.2 32.9 18.3 32.9 50.9 75.1 43.5
OutflowsH Repos and other treasury borrowings 5.2 6.7 2.7 5.2 0.0 0.2 2.4I Term deposits 12.7 13.3 15.5 23.9 0.2 0.0 0.0J Other operations with customers 0.0 0.0 0.0 0.0 0.0 0.0 0.0K Issued debt securities 0.0 0.0 0.0 0.1 0.0 1.0 0.0L Subordinated borrowings 0.0 0.0 0.0 0.0 0.0 0.0 0.0M Total outflow sum(H:L) 17.8 20.0 18.2 29.3 0.2 1.2 2.4
Off-balance sheet commitmentsN Financing commitments given 14.2 13.7 1.7 4.3 6.8 0.0 0.0O Guarantee commitments given 4.1 11.6 1.7 4.1 4.9 0.0 0.0P Net gap- normal (G-M) 87.4 12.9 0.0 3.6 50.7 73.9 41.0Q Net gap without reverse repos- normal G-(A+M) 42.4 10.6 -0.1 3.5 50.7 73.9 41.0R Net gap-stress Q-(D+N+O) -8.5 -21.8 -6.1 -11.0 39.0 73.9 41.0
Cumulative gap -normal 87.4 100.3 100.4 104.0 154.7 228.6 269.6Cumulative gap without reverse repos 42.4 53.0 52.9 56.4 107.1 181.0 222.0Cumulative gap - stress -8.5 -30.3 -36.4 -47.3 -8.3 65.5 106.6
Cumulative Gap to asset ratio -normal 0.17 0.19 0.19 0.20 0.30 0.44 0.52Cumulative gap ratio without reverse repos 0.08 0.10 0.10 0.11 0.21 0.35 0.43Cumulative Gap to asset ratio -Stress -0.02 -0.06 -0.07 -0.09 -0.02 0.13 0.21
Table 4: Maturity Gap AnalysisDecember-09 (values in billions RWF, total assets of banking system 579)
Time HorizonLess than 1 month
1 to 3 months
3 to 6 months
6 to 12 months
1 to 2 years
2 to 5 years
More than 5 years
1 2 3 4 5 6 7
Liquid financial AssetsA Reverse repos and loans 64.5 4.9 0.0 1.8 0.0 0.0 0.0B Treasury bills 16.3 12.1 3.5 1.3 3.3 0.5 0.0C Other securities 2.0 0.1 0.6 5.0 0.5 1.7 0.4
Other inflowsD Current accounts (overdrafts) 19.7 6.4 3.0 9.0 0.1 0.0 0.0E Treasury loans 16.1 3.5 4.6 5.9 6.7 2.8 0.0F Consumer, mortgage and other loans 7.8 10.3 12.3 21.3 47.6 70.0 35.5G Total inflow Sum(A:F) 126.5 37.3 24.0 44.3 58.2 75.0 35.9
OutflowsH Repos and other treasury borrowings 15.9 2.8 4.7 4.4 0.0 2.6 2.3I Term deposits 10.1 19.4 26.5 25.2 0.5 3.0 0.0J Other operations with customers 0.0 0.0 0.0 0.0 0.0 0.0 0.0K Issued debt securities 0.0 0.0 0.0 0.0 0.0 0.0 1.0L Subordinated borrowings 0.0 0.0 0.0 0.0 0.0 0.0 0.0M Total outflow sum(H:L) 26.0 22.2 31.2 29.7 0.5 5.6 3.4
Off-balance sheet commitmentsN Financing commitments given 9.6 10.4 8.0 0.2 0.0 0.0 0.0O Guarantee commitments given 4.7 10.3 1.4 7.4 5.5 0.1 0.0P Net gap- normal (G-M) 100.5 15.1 -7.2 14.7 57.7 69.3 32.5Q Net gap without reverse repos- normal G-(A+M) 36.0 10.2 -7.2 12.9 57.7 69.3 32.5R Net gap-stress Q-(D+N+O) 1.9 -16.8 -19.6 -3.8 52.1 69.2 32.5
Cumulative gap -normal 100.5 115.6 108.4 123.1 180.8 250.1 282.6Cumulative gap without reverse repos 36.0 46.2 39.1 51.9 109.6 179.0 211.5Cumulative gap - stress 1.9 -14.9 -34.5 -38.3 13.9 83.1 115.6
Cumulative Gap to asset ratio -normal 0.17 0.20 0.19 0.21 0.31 0.43 0.49Cumulative gap ratio without reverse repos 0.06 0.08 0.07 0.09 0.19 0.31 0.37Cumulative Gap to asset ratio -Stress 0.00 -0.03 -0.06 -0.07 0.02 0.14 0.20

29
References Alexander, W. E., Balino, T.J.T., and Enoch, C., (1996), Adopting Indirect Instruments of Monetary Policy, Finance and Development, 33 (1), pp 14-17 Bindseil, U., Camba-Mendez, G., Hirsch, A., Weller, B., (2006), Excess reserves and the implementation of monetary policy of the ECB, Journal of Policy Modeling, 28, pp 491–510 Bank for International Settlements (2008), Principles for sound liquidity risk management and supervision, Basle Committee on Banking Supervision, Basle Switzerland Bank for International Settlements (2009), International framework for liquidity risk measurement, standards, and monitoring, Consultative Document, Basle Committee on Banking Supervision Chailloux, A., and Hakura, D., (2009) Systemic Liquidity Management in the U.A.E.: Issues and Options, IMF Working Papers 09/261, Washington DC, International Monetary Fund Čihák, M., (2007), Introduction to Applied Stress Testing, IMF Working Papers, 07/59, Washington DC, International Monetary Fund European Central Bank (2008), EU Banks’ Liquidity Stress Testing and Contingency Funding Plans, European Central Bank, Frankfurt, Germany Matz, L., and Neu, P., (2007), Liquidity Risk Measurement and Management: A Practitioner's Guide to Global Best Practice, Singapore, John Wiley & Sons Matz, L. (2007). Monitoring and controlling liquidity risk. in: Matz, L. and Neu, P. Liquidity Risk Measurement and Management: A Practitioner's Guide to Global Best Practice. Singapore: John Wiley & sons. 67-99
Saxegaard, M., (2006), Excess Liquidity and Effectiveness of Monetary Policy: Evidence from Sub-Saharan Africa, IMF Working Papers, 06/115, Washington DC, International Monetary Fund