Prroojjeecctteedd CCoossttss aanndd RReettuurrnnss …
55
P P r r o o j j e e c c t t e e d d C C o o s s t t s s a a n n d d R R e e t t u u r r n n s s C C r r o o p p E E n n t t e e r r p p r r i i s s e e B B u u d d g g e e t t s s f f o o r r R R i i c c e e P P r r o o d d u u c c t t i i o o n n i i n n L L o o u u i i s s i i a a n n a a , , 2 2 0 0 2 2 0 0 Michael A. Deliberto and Brian M. Hilbun Farm Management Research & Extension Department of Agricultural Economics & Agribusiness Louisiana State University Agricultural Center Agricultural Economics Information Report Series No. 346 - January 2020
Transcript of Prroojjeecctteedd CCoossttss aanndd RReettuurrnnss …

PPrroojjeecctteedd CCoossttss aanndd RReettuurrnnss CCrroopp EEnntteerrpprriissee BBuuddggeettss
ffoorr RRiiccee PPrroodduuccttiioonn iinn LLoouuiissiiaannaa,, 22002200
Michael A. Deliberto and Brian M. Hilbun
Farm Management Research & Extension Department of Agricultural Economics & Agribusiness
Louisiana State University Agricultural Center Agricultural Economics Information Report Series No. 346 - January 2020

i
January 2020 Agricultural Economics Information Report Series No. 346
PPRROOJJEECCTTEEDD CCOOSSTTSS AANNDD RREETTUURRNNSS CCRROOPP EENNTTEERRPPRRIISSEE BBUUDDGGEETTSS
FFOORR RRIICCEE PPRROODDUUCCTTIIOONN IINN LLOOUUIISSIIAANNAA,, 22002200
by
Michael A. Deliberto and Brian M. Hilbun
Department of Agricultural Economics & Agribusiness Louisiana State University Agricultural Center
www.lsuagcenter.com

i
TABLE OF CONTENTS Page Introduction …………………………....……………………………………………………. 1 Procedure …………………………………………………………………………………… 1 Expected Crop Yields and Market Prices …….…………………………….……… 2 Direct Production Costs …….…..….……………………………………….……… 2 Farm Machinery Costs ….…….……………....……………………………………. 2 Overhead Costs …….…………….………………………………………………… 3 Land and Management Charges …….…………….…………….………………… 3 Acknowledgements……………….……………………………………….………………… 3 Internet Access ……………………………………………………………………………… 3 RICE ENTERPRISE BUDGETS: Table (1) Rice - Conventional Variety, Water Planted, Conventional Tillage,
Southwest Louisiana, 2020 Estimated Direct and Fixed Costs per Acre …………….......…….….…… 4 Estimated Costs for Field Operations ………….……….......…….….…… 5 Estimated Net Returns above Specified Costs – Owner Operator ….….… 6 Estimated Net Returns above Specified Costs – Tenant Operator ……..… 7
(2) Rice - Clearfield Variety, Water Planted, Conventional Tillage, Southwest Louisiana, 2020
Estimated Direct and Fixed Costs per Acre …………….......…….….…… 8 Estimated Costs for Field Operations ………….……….......…….….…… 9 Estimated Net Returns above Specified Costs – Owner Operator ….….… 10 Estimated Net Returns above Specified Costs – Tenant Operator ……..… 11
(3) Rice - Conventional Variety, Drill Planted, Conventional Tillage,
Southwest Louisiana, 2020 Estimated Direct and Fixed Costs per Acre …………….......…….….…… 12 Estimated Costs for Field Operations ………….……….......…….….…… 13 Estimated Net Returns above Specified Costs – Owner Operator ….….… 14 Estimated Net Returns above Specified Costs – Tenant Operator ……..… 15
(4) Rice - Clearfield Variety, Drill Planted, Conventional Tillage,
Southwest Louisiana, 2020 Estimated Direct and Fixed Costs per Acre …………….......…….….…… 16 Estimated Costs for Field Operations ………….……….......…….….…… 17 Estimated Net Returns above Specified Costs – Owner Operator ….….… 18 Estimated Net Returns above Specified Costs – Tenant Operator ……..… 19

ii
Page (5) Rice - Clearfield Hybrid Variety, Drill Planted, Conventional Tillage,
Southwest Louisiana, 2020 Estimated Direct and Fixed Costs per Acre …………….......…….….…… 20 Estimated Costs for Field Operations ………….……….......…….….…… 21 Estimated Net Returns above Specified Costs – Owner Operator ….….… 22 Estimated Net Returns above Specified Costs – Tenant Operator ……..… 23
(6) Rice - Ratoon Crop, Southwest Louisiana, 2020
Estimated Direct and Fixed Costs per Acre …………….......…….….…… 24 Estimated Costs for Field Operations ………….……….......…….….…… 25 Estimated Net Returns above Specified Costs – Owner Operator ….….… 26 Estimated Net Returns above Specified Costs – Tenant Operator ……..… 27
(7) Rice - Conventional Variety, Drill Planted, Conventional Tillage, Northeast Louisiana, 2020
Estimated Direct and Fixed Costs per Acre …………….......…….….…… 28 Estimated Costs for Field Operations ………….……….......…….….…… 29 Estimated Net Returns above Specified Costs – Owner Operator ….….… 30 Estimated Net Returns above Specified Costs – Tenant Operator ……..… 31
(8) Rice - Clearfield Variety, Drill Planted, Conventional Tillage,
Northeast Louisiana, 2020 Estimated Direct and Fixed Costs per Acre …………….......…….….…… 32 Estimated Costs for Field Operations ………….……….......…….….…… 33 Estimated Net Returns above Specified Costs – Owner Operator ….….… 34 Estimated Net Returns above Specified Costs – Tenant Operator ……..… 35
Appendices …………………………………………………………………..….………….. 36 Appendix Tables 1 Rice Irrigation System 1 Costs, Water Planted, Southwest Louisiana, 2020 …….. 36 2 Rice Irrigation System 2 Costs, Drill Planted, Southwest Louisiana, 2020 ...…….. 36 3 Rice Irrigation System 3 Costs, Ratoon Crop, Southwest Louisiana, 2020 …..….. 36 4 Rice Irrigation System 5 Costs, Drill Planted, Northeast Louisiana, 2020 ……….. 36 5 Operating Inputs, Estimated Prices, Louisiana, 2020 …………...……………..….. 37 6 Tractors, Performance Rates and Costs, Louisiana, 2020 ………………………….... 44 7 Self-propelled Machines, Performance Rates and Costs, Louisiana, 2020 ……….... 45 8 Implements, Performance Rates and Costs, Louisiana, 2020 ………………..…….. 46

1
PROJECTED COSTS AND RETURNS CROP ENTERPRISE BUDGETS FOR RICE PRODUCTION IN LOUISIANA, 2020
by
Michael A. Deliberto and Brian M. Hilbun1
1 Assistant Professor and Research Associate Department of Agricultural Economics and Agribusiness, LSU Agricultural Center, Baton Rouge, LA.
Introduction
This publication presents estimates of projected costs and returns for rice production in Louisiana for the 2020 crop year. Crop producers are annually faced with critical management decisions that impact the employment of production inputs for various crop enterprises and the combination of crops that will be assembled into a cropping system. The need for reliable information is crucial if sound production decisions are to be made. Planning information plays a pivotal role in the development of annual crop production plans by producers and is important in supporting their efforts to secure the necessary resources to carry out their plans. In addition, information regarding production alternatives and costs and returns for major crop enterprises is needed by extension personnel, researchers, lending institutions, and others involved in agriculture or agribusiness. The purpose of this report is to provide planning information regarding crop production costs and market returns for the 2020 crop year.
Crop enterprise budgets in this report are presented in two budget formats. The first budget format (table A) is a summary of costs and returns for the crop enterprise. The second budget format (table B) provides a table listing the sequence of production operations, indicating the equipment and implements used, month of operation, labor required, machine time required, and materials used. Labor costs, material costs, custom costs, and direct and fixed costs for tractors and equipment are also included for each operation. All costs are
summed giving the total cost per operation or practice.
Procedure
The general procedure used in this study was to project machinery and other input price data and apply these data to the production practice data for crop enterprises produced in Louisiana. Input prices were obtained from surveys of farm suppliers, machinery dealers, and aerial applicators to provide a basis for estimating 2020 planning budgets. Machinery and other input cost data are presented in the Appendix.
The budgets included in this report are categorized by per acre total direct expenses and per acre total fixed expenses for a production season. Within these two broad categories, the various inputs are itemized with their respective costs. Although a particular enterprise budget is presented on a per acre basis, some individual cost items are specified on an hourly or price per unit basis. Direct expenses include such cost items as seed, fertilizer, chemicals, fuel, labor, repairs, and irrigation. Fixed expenses include such items as depreciation and interest on investment which are generally incurred during the production period.
Due to the detailed nature of the cost
computations, a computerized budget generator procedure was utilized. The Mississippi State Budget Generator Program, developed at Mississippi State University, is utilized by the LSU Agricultural Center in developing these crop enterprise costs and returns budgets. The budget generator provides a standard format for crop and livestock budgets and this

2
computational procedure is widely accepted for estimating projected commodity costs and returns information for upcoming crop year planning purposes. Expected Crop Yields and Market Prices Projected crop enterprise budgets in this report include a calculation of expected market returns for the crop. Expected crop yields and market prices are selected at the beginning of the crop year. Projected crop yields are determined based on recent production history for expected yield given normal weather conditions. Projected market prices are specified as expected marketing year average prices for the commodity, based on harvest time futures price quotes as well as other market information at the beginning of the crop year. No estimate of income from farm program particitation or crop insurance is included in this budgets due to the wide variety of farm program and crop insurance choices available to producers. Direct Production Costs
Direct or variable production costs were estimated by utilizing updated crop production input price data. Input price data for various crop production inputs were updated by obtaining prices from farm input suppliers in the fall and winter prior to the crop year. Herbicide, fertilizer, and insecticide expenditures for each enterprise budget are based upon the types of chemicals producers generally reported using for that situation. Suggested prices for selected farm inputs and aerial application rates are presented in the appendix.
Hired labor was charged at $11.33 per hour for all classes of labor except for harvest machinery and laser leveling operator labor. This wage rate include a basic wage rate plus additional costs for social security, Medicare, and workman’s compensation. Operator labor was charged at $15.30 per hour, which includes a basic wage rate plus additional costs for social security, Medicare, and workman’s compensation. The higher wage rate was charged for these classes of operators because of
the relatively higher skills required to run these types of machinery and the general consensus that these operators are generally twelve month (salaried) employees i.e. foremen. Farm labor may not be generally available on an hourly basis; however, an hourly charge represents a practical method for charging labor to the respective crop enterprises on a per acre basis.
Interest on operating capital (short term) was charged at a nominal rate of 5.25% per year. Operating capital was assumed to be borrowed in a manner consistent with timely acquisition of inputs. Fuel prices for diesel was $2.44 per gallon. Variable costs for tractors, self-propelled machinery, and irrigation machinery include the cost of fuel, lubrication, and repair.
The intermediate term interest rate was charged at an historical real rate of 6.25%. The reasoning behind the difference in short and intermediate term rates is that longer term nominal rates are highly variable and closely follow the trend set by the rate of inflation. Intermediate term interest rates above the real rate of interest can overstate true interest costs because they overlook the value gained by an asset due solely to inflation. Farm Machinery Costs
Machinery cost data were obtained from a sample of machinery dealers. New machinery prices were used to reflect the economic cost of acquiring and maintaining capital assets in current dollar values. Purchase prices for selected power and machinery items included in this report are presented in the appendix. Other data included in the appendix indicate hours of annual use and years of life for each selected machinery item. Fuel consumption, accumulated repair costs, and other machinery performance data are based on ASAE standards. Machinery fixed costs are calculated using the capital recovery method which includes estimates of both annual depreciation and interest on investment.

3
Overhead Costs
Overhead costs reflect significant expenses associated with the operation of the entire farm business, but are not necessarily attributable to a specific crop enterprise. Examples of farm overhead costs include tax services, record keeping, utilities, farmstead maintenance, and insurance and property taxes where applicable. General farm overhead costs can vary greatly from farm to farm based on many factors including farm size, land tenure and crop production technology utilized. As the primary purpose of this report is to estimate production costs associated with a specific commodity, no charges for general farm overhead are included. Land and Management Charges The estimated production expenses included in this report include only direct and fixed expenses associated with the production of the specific crop enterprise. Labor charges included in the enterprise budgets only include charges for field labor. No charges for management are included. In addition, no charges for land are included in the enterprise cost tables. Following each set of enterprise cost tables, two sets of net return tables are included. One set, representing owner operators, includes estimates of net returns above direct and total specified costs, which would represent returns to land, management and general farm overhead. Another set, representing tenant operators, includes estimates net returns above direct and total specified costs with a crop share taken out of revenue, representing net returns to management and general farm overhead.
Acknowledgments
Several individuals were instrumental in
making this report possible. The authors are particularly indebted to Louisiana crop producers and LSU Agricultural Center Extension Service agents and Experiment Station scientists for their cooperation and assistance in providing specific production practice information, as well as farm suppliers and agribusiness firms for supplying input price information. This work is supported in part by the U.S.D.A. National Institute of Food and Agriculture, Hatch Project 1014068.
Internet Access
This publication, along with projected costs and returns reports for other major agricultural crop commodities produced in Louisiana, as well as other farm management publications, are available on the Internet on the LSU AgCenter web page under the “Extension and Outreach” section of the Department of Agricultural Economics and Agribusiness web page. These projected costs and returns reports are also available on the LSU Ag Center crop commodities web pages. The web address for the LSU AgCenter is: www.lsuagcenter.com

4
Table 1.A Estimated costs per acre, Rice, Conventional Variety, Water Planted, Conventional Tillage, Southwest Louisiana, 2020. _______________________________________________________________________ ITEM UNIT PRICE QUANTITY AMOUNT YOUR FARM _______________________________________________________________________ dollars dollars DIRECT EXPENSES CUSTOM SPRAY LARice GPS Charge-SW acre 0.35 9.0000 3.15 _________ App by Air ( 5 gal) appl 6.50 5.0000 32.50 _________ GIN/DRY LARice Dry cwt 0.90 77.7000 69.93 _________ FERTILIZERS LA Nitrogen lb 0.41 130.0000 53.30 _________ LA Phosphate lb 0.38 40.0000 15.20 _________ LA Potash lb 0.27 60.0000 16.20 _________ FUNGICIDES Quadris oz 1.25 10.0000 12.50 _________ HERBICIDES Facet 75DF lb 50.00 0.5000 25.00 _________ Londax 60DF oz 18.08 1.0000 18.08 _________ 2,4-D Amine 4 pt 1.85 2.5000 4.63 _________ INSECTICIDES Karate Z oz 3.40 4.0000 13.60 _________ IRRIGATION SUPPLIES Rice Gates each 3.65 1.0000 3.65 _________ SEED/PLANTS Rice Seed Conv. lb 0.30 120.0000 36.00 _________ Seed Tmt oz 0.30 21.6000 6.48 _________ SERVICE FEE Digital Ag Fee acre 8.50 1.0000 8.50 _________ CUSTOM FERT/LIME App Fert by Air cwt 7.00 3.8000 26.60 _________ CUSTOM PLANT LARice Air Plant SW cwt 5.60 1.2000 6.72 _________ CUSTOM HARVEST/HAUL LARice Haul cwt 0.30 70.0000 21.00 _________ LA OPERATOR LABOR Self-Propelled hour 15.30 0.3303 5.05 _________ LA Hired Labor Tractors hour 11.33 0.8574 9.72 _________ LA Irrigation Labor Irrigation System 1 hour 11.33 0.2153 2.45 _________ DIESEL FUEL Tractors gal 2.44 10.5417 25.73 _________ Self-Propelled gal 2.44 2.5825 6.30 _________ Irrigation System 1 gal 2.44 32.8389 80.13 _________ REPAIR & MAINTENANCE Implements acre 3.81 1.0000 3.81 _________ Tractors acre 5.97 1.0000 5.97 _________ Self-Propelled acre 14.53 1.0000 14.53 _________ Irrigation System 1 acre 3.75 1.0000 3.75 _________ INTEREST ON OP. CAP. acre 11.03 1.0000 11.03 _________ --------- TOTAL DIRECT EXPENSES 541.51 _________ FIXED EXPENSES Implements acre 9.22 1.0000 9.22 _________ Tractors acre 40.39 1.0000 40.39 _________ Self-Propelled acre 23.62 1.0000 23.62 _________ Irrigation System 1 acre 38.46 1.0000 38.46 _________ --------- TOTAL FIXED EXPENSES 111.69 _________ --------- TOTAL SPECIFIED EXPENSES 653.20 _________ _______________________________________________________________________

5
Table 1.B Estimated resource use and costs for field operations, per acre, Rice, Conventional Variety, Water Plant, Conventional Tillage, (In Rotation), Southwest Louisiana, 2020. _______________________________________________________________________________________________________________________________________________ POWER UNIT COST EQUIPMENT COST ALLOC LABOR OPERATING/DURABLE INPUT OPERATION/ SIZE/ POWER UNIT PERF TIMES -------------- -------------- ------------- ----------------------- TOTAL OPERATING INPUT UNIT SIZE RATE OVER MTH DIRECT FIXED DIRECT FIXED HOURS COST AMOUNT PRICE COST COST _______________________________________________________________________________________________________________________________________________ ------------dollars----------- dollars ---------dollars--------- Disk Harrow 32' 4WD 225 0.061 2.00 Nov 4.03 3.84 2.03 4.67 0.12 1.39 15.96 LARice Levee Plow 8 ft 4WD 300 0.050 2.00 Nov 4.70 6.34 0.15 0.40 0.10 1.13 12.72 Blade-Scraper 10' MFWD 150 1.176 0.09 Nov 2.45 3.03 0.18 0.16 0.10 1.20 7.02 Ditcher MFWD 150 0.020 1.00 Nov 0.47 0.57 0.05 0.07 0.02 0.23 1.39 Field Cultivate 32' 4WD 300 0.046 1.00 Feb 2.19 2.96 0.50 2.30 0.04 0.53 8.48 App Fert by Air cwt 1.00 Feb 1.5000 7.00 10.50 10.50 LA Nitrogen lb 70.0000 0.41 28.70 28.70 LARice GPS Charge-SW acre 1.0000 0.35 0.35 0.35 App Fert by Air cwt 1.00 Feb 1.0000 7.00 7.00 7.00 LA Phosphate lb 40.0000 0.38 15.20 15.20 LA Potash lb 60.0000 0.27 16.20 16.20 LARice GPS Charge-SW acre 1.0000 0.35 0.35 0.35 Ditcher MFWD 150 0.020 1.00 Feb 0.47 0.57 0.05 0.07 0.02 0.23 1.39 Blade-Scraper 10' MFWD 150 1.176 0.09 Feb 2.45 3.03 0.18 0.16 0.10 1.20 7.02 Rice Gates each 1.00 Feb 1.0000 3.65 3.65 3.65 LARice Backhoe-Rrmnt 2 ft MFWD 150 0.500 0.05 Feb 0.58 0.72 0.13 0.19 0.02 0.28 1.90 LARice Water Level 24 ft 4WD 300 0.149 2.00 Feb 14.09 19.00 0.46 1.05 0.29 3.40 38.00 LARice Air Plant SW cwt 1.00 Apr 1.2000 5.60 6.72 6.72 Rice Seed Conv. lb 120.0000 0.30 36.00 36.00 LARice GPS Charge-SW acre 1.0000 0.35 0.35 0.35 Seed Tmt oz 21.6000 0.30 6.48 6.48 App by Air ( 5 gal) appl 1.00 Apr 1.0000 6.50 6.50 6.50 Karate Z oz 2.0000 3.40 6.80 6.80 LARice GPS Charge-SW acre 1.0000 0.35 0.35 0.35 App by Air ( 5 gal) appl 1.00 Apr 1.0000 6.50 6.50 6.50 Facet 75DF lb 0.5000 50.00 25.00 25.00 Londax 60DF oz 1.0000 18.08 18.08 18.08 LARice GPS Charge-SW acre 1.0000 0.35 0.35 0.35 App by Air ( 5 gal) appl 1.00 Jun 1.0000 6.50 6.50 6.50 2,4-D Amine 4 pt 2.5000 1.85 4.63 4.63 LARice GPS Charge-SW acre 1.0000 0.35 0.35 0.35 App Fert by Air cwt 1.00 Jun 1.3000 7.00 9.10 9.10 LA Nitrogen lb 60.0000 0.41 24.60 24.60 LARice GPS Charge-SW acre 1.0000 0.35 0.35 0.35 App by Air ( 5 gal) appl 1.00 Jun 1.0000 6.50 6.50 6.50 Quadris oz 10.0000 1.25 12.50 12.50 LARice GPS Charge-SW acre 1.0000 0.35 0.35 0.35 App by Air ( 5 gal) appl 1.00 Jul 1.0000 6.50 6.50 6.50 Karate Z oz 2.0000 3.40 6.80 6.80 LARice GPS Charge-SW acre 1.0000 0.35 0.35 0.35 LA Rice Combine 25 ft 0.300 1.00 Aug 20.83 23.62 0.33 5.05 49.50 Rice Grain Cart 500 Bu MFWD 150 0.057 0.20 Aug 0.27 0.33 0.08 0.15 0.01 0.13 0.96 LARice Haul cwt 1.00 Aug 70.0000 0.30 21.00 21.00 LARice Dry cwt 1.00 Aug 77.7000 0.90 69.93 69.93 Digital Ag Fee acre 1.00 Aug 1.0000 8.50 8.50 8.50 Irrigation System 1 acre Mar 83.88 38.46 0.21 2.45 1.0000 124.79 ------- ------- ------- ------- ------ ------- ------- -------- TOTALS 52.53 64.01 87.69 47.68 1.40 17.22 373.04 642.17 INTEREST ON OPERATING CAPITAL 11.03 UNALLOCATED LABOR 0.00 TOTAL SPECIFIED COST 653.20 _______________________________________________________________________________________________________________________________________________

6
Table 1.C1 Estimated Net Returns above Direct Costs for an Owner Operator Rice, Conventional Variety, Water Planted, Conventional Tillage, Southwest Louisiana, 2020.
Percent
80% 85% 90% 95% 100% 105% 110% 115% 120%
Yield
Rice Market Price ($/cwt)
Percent (cwt.) $9.60 $10.20 $10.80 $11.40 $12.00 $12.60 $13.20 $13.80 $14.40
--------------------------------- ($/acre) ----------------------------------
80% 56.0 14 43 72 101 130 159 188 217 246
85% 59.5 47 78 110 141 172 203 234 265 296
90% 63.0 81 114 147 181 214 247 280 314 347
95% 66.5 115 150 185 221 256 291 327 362 397
100% 70.0 148 186 223 260 298 335 373 410 448
105% 73.5 182 221 261 300 340 379 419 458 498
110% 77.0 215 257 299 340 382 423 465 507 548
115% 80.5 249 293 336 380 424 468 511 555 599
120% 84.0 283 328 374 420 466 512 558 603 649 Net returns above direct costs for an owner operator is calculated here as market revenue less direct production costs. Direct costs include charges for variable production costs for items such as seed, fertilizer, chemicals, fuel, labor, repair and custom application expenses.
Table 1.C2 Estimated Net Returns above Total Specified Costs for an Owner Operator Rice, Conventional Variety, Water Planted, Conventional Tillage, Southwest Louisiana, 2020.
Percent
80% 85% 90% 95% 100% 105% 110% 115% 120%
Yield
Rice Market Price ($/cwt)
Percent (cwt.) $9.60 $10.20 $10.80 $11.40 $12.00 $12.60 $13.20 $13.80 $14.40
--------------------------------- ($/acre) ----------------------------------
80% 56.0 -98 -69 -40 -11 18 47 76 105 134
85% 59.5 -64 -33 -2 29 60 91 122 154 185
90% 63.0 -31 3 36 69 102 135 169 202 235
95% 66.5 3 38 74 109 144 179 215 250 285
100% 70.0 36 74 111 149 186 224 261 298 336
105% 73.5 70 110 149 189 228 268 307 347 386
110% 77.0 104 145 187 229 270 312 353 395 437
115% 80.5 137 181 225 268 312 356 400 443 487
120% 84.0 171 217 263 308 354 400 446 492 537 Net returns above total specified costs for an owner operator is calculated here as market revenue less total specified costs. Specified costs include charges for direct costs and fixed machinery costs but excludes charges for land, general farm overhead and management expenses.

7
Table 1.D1 Estimated Net Returns above Direct Costs for a Tenant Operator Rice, Conventional Variety, Water Planted, Conventional Tillage, Southwest Louisiana, 2020.
Percent
80% 85% 90% 95% 100% 105% 110% 115% 120%
Yield
Rice Market Price ($/cwt)
Percent (cwt.) $9.60 $10.20 $10.80 $11.40 $12.00 $12.60 $13.20 $13.80 $14.40
--------------------------------- ($/acre) ----------------------------------
80% 56.0 -45 -25 -5 16 36 56 76 97 117
85% 59.5 -22 0 22 43 65 87 109 131 152
90% 63.0 2 25 48 71 95 118 141 164 188
95% 66.5 25 50 75 99 124 149 174 198 223
100% 70.0 49 75 101 127 153 180 206 232 258
105% 73.5 72 100 128 155 183 211 238 266 294
110% 77.0 96 125 154 183 212 241 271 300 329
115% 80.5 119 150 180 211 242 272 303 333 364
120% 84.0 143 175 207 239 271 303 335 367 399 Net returns above direct costs for a tenant operator is calculated here as the grower’s share of market revenue less direct production costs paid by the grower. Direct costs include charges for variable production costs for items such as seed, fertilizer, chemicals, fuel, labor, repair and custom application expenses. The land rental arrangement charge represented here is a 30% crop share with the landlord paying variable and fixed irrigation pumping costs.
Table 1.D2 Estimated Net Returns above Total Specified Costs for a Tenant Operator Rice, Conventional Variety, Water Planted, Conventional Tillage, Southwest Louisiana, 2020.
Percent
80% 85% 90% 95% 100% 105% 110% 115% 120%
Yield
Rice Market Price ($/cwt)
Percent (cwt.) $9.60 $10.20 $10.80 $11.40 $12.00 $12.60 $13.20 $13.80 $14.40
--------------------------------- ($/acre) ----------------------------------
80% 56.0 -119 -98 -78 -58 -37 -17 3 24 44
85% 59.5 -95 -73 -52 -30 -8 14 36 57 79
90% 63.0 -72 -48 -25 -2 21 45 68 91 114
95% 66.5 -48 -23 1 26 51 76 100 125 150
100% 70.0 -25 2 28 54 80 106 133 159 185
105% 73.5 -1 27 54 82 110 137 165 193 220
110% 77.0 22 52 81 110 139 168 197 226 256
115% 80.5 46 77 107 138 168 199 230 260 291
120% 84.0 70 102 134 166 198 230 262 294 326 Net returns above total specified costs for a tenant operator is calculated here as the grower’s share of market revenue less total specified costs paid by the grower. Specified costs include charges for direct costs and fixed machinery costs but exclude charges for general farm overhead and management expenses. The land rental arrangement charge represented here is a 30% crop share with the landlord paying variable and fixed irrigation pumping costs.

8
Table 2.A Estimated costs per acre, Rice, Clearfield Variety, Water Planted, Conventional Tillage, Southwest Louisiana, 2020. _______________________________________________________________________ ITEM UNIT PRICE QUANTITY AMOUNT YOUR FARM _______________________________________________________________________ dollars dollars DIRECT EXPENSES CUSTOM SPRAY LARice GPS Charge-SW acre 0.35 9.0000 3.15 _________ App by Air ( 5 gal) appl 6.50 5.0000 32.50 _________ GIN/DRY LARice Dry cwt 0.90 77.7000 69.93 _________ FERTILIZERS LA Nitrogen lb 0.41 130.0000 53.30 _________ LA Phosphate lb 0.38 40.0000 15.20 _________ LA Potash lb 0.27 60.0000 16.20 _________ FUNGICIDES Quadris oz 1.25 10.0000 12.50 _________ HERBICIDES Newpath 2SL oz 3.73 8.0000 29.84 _________ Aim 2EC oz 5.00 1.6000 8.00 _________ INSECTICIDES Karate Z oz 3.40 4.0000 13.60 _________ IRRIGATION SUPPLIES Rice Gates each 3.65 1.0000 3.65 _________ SEED/PLANTS Rice Clearfield 161 lb 1.13 100.0000 113.00 _________ Seed Tmt oz 0.30 18.0000 5.40 _________ SERVICE FEE Digital Ag Fee acre 8.50 1.0000 8.50 _________ CUSTOM FERT/LIME App Fert by Air cwt 7.00 3.8000 26.60 _________ CUSTOM PLANT LARice Air Plant SW cwt 5.60 1.0000 5.60 _________ CUSTOM HARVEST/HAUL LARice Haul cwt 0.30 70.0000 21.00 _________ LA OPERATOR LABOR Self-Propelled hour 15.30 0.3303 5.05 _________ LA Hired Labor Tractors hour 11.33 0.8574 9.72 _________ LA Irrigation Labor Irrigation System 1 hour 11.33 0.2153 2.45 _________ DIESEL FUEL Tractors gal 2.44 11.0156 26.89 _________ Self-Propelled gal 2.44 2.5825 6.30 _________ Irrigation System 1 gal 2.44 32.8389 80.13 _________ REPAIR & MAINTENANCE Implements acre 3.81 1.0000 3.81 _________ Tractors acre 6.55 1.0000 6.55 _________ Self-Propelled acre 14.53 1.0000 14.53 _________ Irrigation System 1 acre 3.75 1.0000 3.75 _________ INTEREST ON OP. CAP. acre 12.36 1.0000 12.36 _________ --------- TOTAL DIRECT EXPENSES 609.51 _________ FIXED EXPENSES Implements acre 9.22 1.0000 9.22 _________ Tractors acre 44.33 1.0000 44.33 _________ Self-Propelled acre 23.62 1.0000 23.62 _________ Irrigation System 1 acre 38.46 1.0000 38.46 _________ --------- TOTAL FIXED EXPENSES 115.63 _________ --------- TOTAL SPECIFIED EXPENSES 725.14 _________ _______________________________________________________________________
9
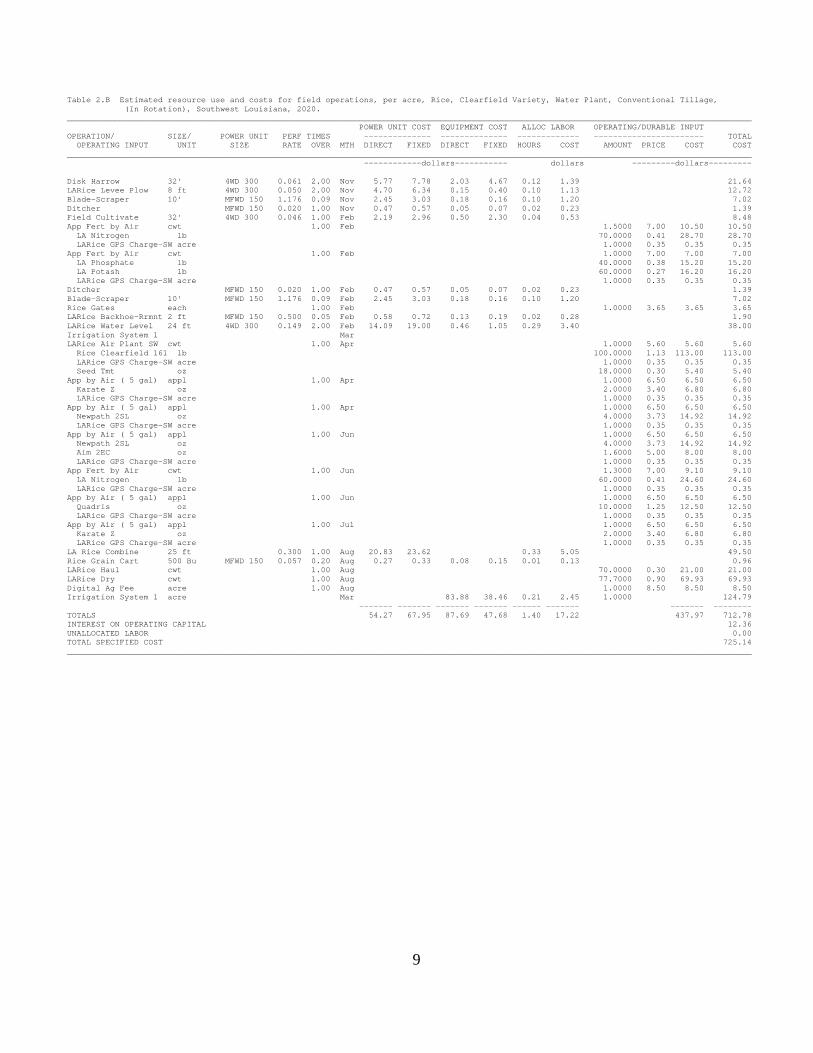
Table 2.B Estimated resource use and costs for field operations, per acre, Rice, Clearfield Variety, Water Plant, Conventional Tillage, (In Rotation), Southwest Louisiana, 2020. _______________________________________________________________________________________________________________________________________________ POWER UNIT COST EQUIPMENT COST ALLOC LABOR OPERATING/DURABLE INPUT OPERATION/ SIZE/ POWER UNIT PERF TIMES -------------- -------------- ------------- ----------------------- TOTAL OPERATING INPUT UNIT SIZE RATE OVER MTH DIRECT FIXED DIRECT FIXED HOURS COST AMOUNT PRICE COST COST _______________________________________________________________________________________________________________________________________________ ------------dollars----------- dollars ---------dollars--------- Disk Harrow 32' 4WD 300 0.061 2.00 Nov 5.77 7.78 2.03 4.67 0.12 1.39 21.64 LARice Levee Plow 8 ft 4WD 300 0.050 2.00 Nov 4.70 6.34 0.15 0.40 0.10 1.13 12.72 Blade-Scraper 10' MFWD 150 1.176 0.09 Nov 2.45 3.03 0.18 0.16 0.10 1.20 7.02 Ditcher MFWD 150 0.020 1.00 Nov 0.47 0.57 0.05 0.07 0.02 0.23 1.39 Field Cultivate 32' 4WD 300 0.046 1.00 Feb 2.19 2.96 0.50 2.30 0.04 0.53 8.48 App Fert by Air cwt 1.00 Feb 1.5000 7.00 10.50 10.50 LA Nitrogen lb 70.0000 0.41 28.70 28.70 LARice GPS Charge-SW acre 1.0000 0.35 0.35 0.35 App Fert by Air cwt 1.00 Feb 1.0000 7.00 7.00 7.00 LA Phosphate lb 40.0000 0.38 15.20 15.20 LA Potash lb 60.0000 0.27 16.20 16.20 LARice GPS Charge-SW acre 1.0000 0.35 0.35 0.35 Ditcher MFWD 150 0.020 1.00 Feb 0.47 0.57 0.05 0.07 0.02 0.23 1.39 Blade-Scraper 10' MFWD 150 1.176 0.09 Feb 2.45 3.03 0.18 0.16 0.10 1.20 7.02 Rice Gates each 1.00 Feb 1.0000 3.65 3.65 3.65 LARice Backhoe-Rrmnt 2 ft MFWD 150 0.500 0.05 Feb 0.58 0.72 0.13 0.19 0.02 0.28 1.90 LARice Water Level 24 ft 4WD 300 0.149 2.00 Feb 14.09 19.00 0.46 1.05 0.29 3.40 38.00 Irrigation System 1 Mar LARice Air Plant SW cwt 1.00 Apr 1.0000 5.60 5.60 5.60 Rice Clearfield 161 lb 100.0000 1.13 113.00 113.00 LARice GPS Charge-SW acre 1.0000 0.35 0.35 0.35 Seed Tmt oz 18.0000 0.30 5.40 5.40 App by Air ( 5 gal) appl 1.00 Apr 1.0000 6.50 6.50 6.50 Karate Z oz 2.0000 3.40 6.80 6.80 LARice GPS Charge-SW acre 1.0000 0.35 0.35 0.35 App by Air ( 5 gal) appl 1.00 Apr 1.0000 6.50 6.50 6.50 Newpath 2SL oz 4.0000 3.73 14.92 14.92 LARice GPS Charge-SW acre 1.0000 0.35 0.35 0.35 App by Air ( 5 gal) appl 1.00 Jun 1.0000 6.50 6.50 6.50 Newpath 2SL oz 4.0000 3.73 14.92 14.92 Aim 2EC oz 1.6000 5.00 8.00 8.00 LARice GPS Charge-SW acre 1.0000 0.35 0.35 0.35 App Fert by Air cwt 1.00 Jun 1.3000 7.00 9.10 9.10 LA Nitrogen lb 60.0000 0.41 24.60 24.60 LARice GPS Charge-SW acre 1.0000 0.35 0.35 0.35 App by Air ( 5 gal) appl 1.00 Jun 1.0000 6.50 6.50 6.50 Quadris oz 10.0000 1.25 12.50 12.50 LARice GPS Charge-SW acre 1.0000 0.35 0.35 0.35 App by Air ( 5 gal) appl 1.00 Jul 1.0000 6.50 6.50 6.50 Karate Z oz 2.0000 3.40 6.80 6.80 LARice GPS Charge-SW acre 1.0000 0.35 0.35 0.35 LA Rice Combine 25 ft 0.300 1.00 Aug 20.83 23.62 0.33 5.05 49.50 Rice Grain Cart 500 Bu MFWD 150 0.057 0.20 Aug 0.27 0.33 0.08 0.15 0.01 0.13 0.96 LARice Haul cwt 1.00 Aug 70.0000 0.30 21.00 21.00 LARice Dry cwt 1.00 Aug 77.7000 0.90 69.93 69.93 Digital Ag Fee acre 1.00 Aug 1.0000 8.50 8.50 8.50 Irrigation System 1 acre Mar 83.88 38.46 0.21 2.45 1.0000 124.79 ------- ------- ------- ------- ------ ------- ------- -------- TOTALS 54.27 67.95 87.69 47.68 1.40 17.22 437.97 712.78 INTEREST ON OPERATING CAPITAL 12.36 UNALLOCATED LABOR 0.00 TOTAL SPECIFIED COST 725.14 _______________________________________________________________________________________________________________________________________________

10
Table 2.C1 Estimated Net Returns above Direct Costs for an Owner Operator Rice, Clearfield Variety, Water Planted, Conventional Tillage, Southwest Louisiana, 2020.
Percent
80% 85% 90% 95% 100% 105% 110% 115% 120%
Yield
Rice Market Price ($/cwt)
Percent (cwt.) $9.60 $10.20 $10.80 $11.40 $12.00 $12.60 $13.20 $13.80 $14.40
--------------------------------- ($/acre) ----------------------------------
80% 56.0 -54 -25 4 33 62 91 120 149 178
85% 59.5 -21 10 42 73 104 135 166 197 228
90% 63.0 13 46 79 113 146 179 212 246 279
95% 66.5 47 82 117 153 188 223 259 294 329
100% 70.0 80 118 155 192 230 267 305 342 380
105% 73.5 114 153 193 232 272 311 351 390 430
110% 77.0 147 189 231 272 314 355 397 439 480
115% 80.5 181 225 268 312 356 400 443 487 531
120% 84.0 215 260 306 352 398 444 490 535 581 Net returns above direct costs for an owner operator is calculated here as market revenue less direct production costs. Direct costs include charges for variable production costs for items such as seed, fertilizer, chemicals, fuel, labor, repair and custom application expenses.
Table 2.C2 Estimated Net Returns above Total Specified Costs for an Owner Operator Rice, Clearfield Variety, Water Planted, Conventional Tillage, Southwest Louisiana, 2020.
Percent
80% 85% 90% 95% 100% 105% 110% 115% 120%
Yield
Rice Market Price ($/cwt)
Percent (cwt.) $9.60 $10.20 $10.80 $11.40 $12.00 $12.60 $13.20 $13.80 $14.40
--------------------------------- ($/acre) ----------------------------------
80% 56.0 -170 -141 -112 -83 -54 -25 4 33 62
85% 59.5 -136 -105 -74 -43 -12 19 50 82 113
90% 63.0 -103 -69 -36 -3 30 63 97 130 163
95% 66.5 -69 -34 2 37 72 108 143 178 214
100% 70.0 -35 2 39 77 114 152 189 226 264
105% 73.5 -2 38 77 117 156 196 235 275 314
110% 77.0 32 73 115 157 198 240 281 323 365
115% 80.5 65 109 153 197 240 284 328 371 415
120% 84.0 99 145 191 236 282 328 374 420 466 Net returns above total specified costs for an owner operator is calculated here as market revenue less total specified costs. Specified costs include charges for direct costs and fixed machinery costs but excludes charges for land, general farm overhead and management expenses.

11
Table 2.D1 Estimated Net Returns above Direct Costs for a Tenant Operator Rice, Clearfield Variety, Water Planted, Conventional Tillage, Southwest Louisiana, 2020.
Percent
80% 85% 90% 95% 100% 105% 110% 115% 120%
Yield
Rice Market Price ($/cwt)
Percent (cwt.) $9.60 $10.20 $10.80 $11.40 $12.00 $12.60 $13.20 $13.80 $14.40
--------------------------------- ($/acre) ----------------------------------
80% 56.0 -113 -93 -73 -52 -32 -12 8 29 49
85% 59.5 -90 -68 -46 -25 -3 19 41 63 84
90% 63.0 -66 -43 -20 3 27 50 73 96 120
95% 66.5 -43 -18 7 31 56 81 106 130 155
100% 70.0 -19 7 33 59 85 112 138 164 190
105% 73.5 4 32 60 87 115 143 170 198 226
110% 77.0 28 57 86 115 144 173 203 232 261
115% 80.5 51 82 112 143 174 204 235 265 296
120% 84.0 75 107 139 171 203 235 267 299 331 Net returns above direct costs for a tenant operator is calculated here as the grower’s share of market revenue less direct production costs paid by the grower. Direct costs include charges for variable production costs for items such as seed, fertilizer, chemicals, fuel, labor, repair and custom application expenses. The land rental arrangement charge represented here is a 30% crop share with the landlord paying variable and fixed irrigation pumping costs.
Table 2.D2 Estimated Net Returns above Total Specified Costs for a Tenant Operator Rice, Clearfield Variety, Water Planted, Conventional Tillage, Southwest Louisiana, 2020.
Percent
80% 85% 90% 95% 100% 105% 110% 115% 120%
Yield
Rice Market Price ($/cwt)
Percent (cwt.) $9.60 $10.20 $10.80 $11.40 $12.00 $12.60 $13.20 $13.80 $14.40
--------------------------------- ($/acre) ----------------------------------
80% 56.0 -191 -170 -150 -130 -109 -89 -69 -48 -28
85% 59.5 -167 -145 -123 -102 -80 -58 -36 -15 7
90% 63.0 -144 -120 -97 -74 -51 -27 -4 19 43
95% 66.5 -120 -95 -71 -46 -21 4 28 53 78
100% 70.0 -96 -70 -44 -18 8 34 61 87 113
105% 73.5 -73 -45 -18 10 38 65 93 121 148
110% 77.0 -49 -20 9 38 67 96 125 154 184
115% 80.5 -26 5 35 66 96 127 158 188 219
120% 84.0 -2 30 62 94 126 158 190 222 254 Net returns above total specified costs for a tenant operator is calculated here as the grower’s share of market revenue less total specified costs paid by the grower. Specified costs include charges for direct costs and fixed machinery costs but exclude charges for general farm overhead and management expenses. The land rental arrangement charge represented here is a 30% crop share with the landlord paying variable and fixed irrigation pumping costs.

12
Table 3.A Estimated costs per acre, Rice, Conventional Variety, Drill Planted, Conventional Tillage, Southwest Louisiana, 2020. _______________________________________________________________________ ITEM UNIT PRICE QUANTITY AMOUNT YOUR FARM _______________________________________________________________________ dollars dollars DIRECT EXPENSES CUSTOM SPRAY LARice GPS Charge-SW acre 0.35 7.0000 2.45 _________ App by Air ( 5 gal) appl 6.50 4.0000 26.00 _________ GIN/DRY LARice Dry cwt 0.90 77.7000 69.93 _________ FERTILIZERS LA Nitrogen lb 0.41 130.0000 53.30 _________ LA Phosphate lb 0.38 40.0000 15.20 _________ LA Potash lb 0.27 60.0000 16.20 _________ FUNGICIDES Quadris oz 1.25 10.0000 12.50 _________ HERBICIDES Command 3ME pt 16.09 0.8000 12.87 _________ Permit 75DF oz 14.50 1.0000 14.50 _________ INSECTICIDES Karate Z oz 3.40 4.0000 13.60 _________ IRRIGATION SUPPLIES Rice Gates each 3.65 1.0000 3.65 _________ SEED/PLANTS Rice Seed Conv. lb 0.30 90.0000 27.00 _________ Seed Tmt oz 0.30 16.2000 4.86 _________ SERVICE FEE Digital Ag Fee acre 8.50 1.0000 8.50 _________ CUSTOM FERT/LIME App Fert by Air cwt 7.00 3.8000 26.60 _________ CUSTOM HARVEST/HAUL LARice Haul cwt 0.30 70.0000 21.00 _________ HAND LABOR Implements hour 9.06 0.0942 0.85 _________ LA OPERATOR LABOR Self-Propelled hour 15.30 0.3303 5.05 _________ LA Hired Labor Tractors hour 11.33 0.7118 8.07 _________ LA Irrigation Labor Irrigation System 2 hour 11.33 0.2074 2.36 _________ DIESEL FUEL Tractors gal 2.44 7.5765 18.50 _________ Self-Propelled gal 2.44 2.5825 6.30 _________ Irrigation System 2 gal 2.44 35.4660 86.56 _________ REPAIR & MAINTENANCE Implements acre 4.87 1.0000 4.87 _________ Tractors acre 4.43 1.0000 4.43 _________ Self-Propelled acre 14.53 1.0000 14.53 _________ Irrigation System 2 acre 3.61 1.0000 3.61 _________ INTEREST ON OP. CAP. acre 9.90 1.0000 9.90 _________ --------- TOTAL DIRECT EXPENSES 493.19 _________ FIXED EXPENSES Implements acre 11.24 1.0000 11.24 _________ Tractors acre 29.75 1.0000 29.75 _________ Self-Propelled acre 23.62 1.0000 23.62 _________ Irrigation System 2 acre 38.46 1.0000 38.46 _________ --------- TOTAL FIXED EXPENSES 103.07 _________ --------- TOTAL SPECIFIED EXPENSES 596.26 _________ _______________________________________________________________________

13
Table 3.B Estimated resource use and costs for field operations, per acre, Rice, Conventional Variety, Drill Plant, Conventional Tillage, (In Rotation), Southwest Louisiana, 2020. _______________________________________________________________________________________________________________________________________________ POWER UNIT COST EQUIPMENT COST ALLOC LABOR OPERATING/DURABLE INPUT OPERATION/ SIZE/ POWER UNIT PERF TIMES -------------- -------------- ------------- ----------------------- TOTAL OPERATING INPUT UNIT SIZE RATE OVER MTH DIRECT FIXED DIRECT FIXED HOURS COST AMOUNT PRICE COST COST _______________________________________________________________________________________________________________________________________________ ------------dollars----------- dollars ---------dollars--------- Disk Harrow 32' 4WD 300 0.061 2.00 Nov 5.77 7.78 2.03 4.67 0.12 1.39 21.64 LARice Levee Plow 8 ft 4WD 300 0.050 2.00 Nov 4.70 6.34 0.15 0.40 0.10 1.13 12.72 Blade-Scraper 10' MFWD 150 1.176 0.09 Nov 2.45 3.03 0.18 0.16 0.10 1.20 7.02 Ditcher MFWD 150 0.020 1.00 Nov 0.47 0.57 0.05 0.07 0.02 0.23 1.39 Field Cultivate 32' 4WD 300 0.046 1.00 Feb 2.19 2.96 0.50 2.30 0.04 0.53 8.48 App Fert by Air cwt 1.00 Feb 1.5000 7.00 10.50 10.50 LA Nitrogen lb 70.0000 0.41 28.70 28.70 LARice GPS Charge-SW acre 1.0000 0.35 0.35 0.35 App Fert by Air cwt 1.00 Feb 1.0000 7.00 7.00 7.00 LA Phosphate lb 40.0000 0.38 15.20 15.20 LA Potash lb 60.0000 0.27 16.20 16.20 LARice GPS Charge-SW acre 1.0000 0.35 0.35 0.35 Grain Drill 20' MFWD 150 0.094 1.00 Apr 2.19 2.70 1.39 2.91 0.18 1.92 11.11 Rice Seed Conv. lb 90.0000 0.30 27.00 27.00 Seed Tmt oz 16.2000 0.30 4.86 4.86 Ditcher MFWD 150 0.020 1.00 Apr 0.47 0.57 0.05 0.07 0.02 0.23 1.39 Blade-Scraper 10' MFWD 150 1.176 0.09 Apr 2.45 3.03 0.18 0.16 0.10 1.20 7.02 Rice Gates each 1.00 Apr 1.0000 3.65 3.65 3.65 LARice Backhoe-Rrmnt 2 ft MFWD 150 0.500 0.05 Apr 0.58 0.72 0.13 0.19 0.02 0.28 1.90 LA Boom Sprayer 30 ft MFWD 150 0.059 1.00 Apr 1.39 1.72 0.13 0.16 0.05 0.68 4.08 Command 3ME pt 0.8000 16.09 12.87 12.87 App by Air ( 5 gal) appl 1.00 Apr 1.0000 6.50 6.50 6.50 Karate Z oz 2.0000 3.40 6.80 6.80 LARice GPS Charge-SW acre 1.0000 0.35 0.35 0.35 App by Air ( 5 gal) appl 1.00 Jun 1.0000 6.50 6.50 6.50 Permit 75DF oz 1.0000 14.50 14.50 14.50 LARice GPS Charge-SW acre 1.0000 0.35 0.35 0.35 App Fert by Air cwt 1.00 Jun 1.3000 7.00 9.10 9.10 LA Nitrogen lb 60.0000 0.41 24.60 24.60 LARice GPS Charge-SW acre 1.0000 0.35 0.35 0.35 App by Air ( 5 gal) appl 1.00 Jun 1.0000 6.50 6.50 6.50 Quadris oz 10.0000 1.25 12.50 12.50 LARice GPS Charge-SW acre 1.0000 0.35 0.35 0.35 App by Air ( 5 gal) appl 1.00 Jul 1.0000 6.50 6.50 6.50 Karate Z oz 2.0000 3.40 6.80 6.80 LARice GPS Charge-SW acre 1.0000 0.35 0.35 0.35 LA Rice Combine 25 ft 0.300 1.00 Aug 20.83 23.62 0.33 5.05 49.50 Rice Grain Cart 500 Bu MFWD 150 0.057 0.20 Aug 0.27 0.33 0.08 0.15 0.01 0.13 0.96 LARice Haul cwt 1.00 Aug 70.0000 0.30 21.00 21.00 LARice Dry cwt 1.00 Aug 77.7000 0.90 69.93 69.93 Digital Ag Fee acre 1.00 Aug 1.0000 8.50 8.50 8.50 Irrigation System 2 acre Mar 90.17 38.46 0.20 2.36 1.0000 130.99 ------- ------- ------- ------- ------ ------- ------- -------- TOTALS 43.76 53.37 95.04 49.70 1.34 16.33 328.16 586.36 INTEREST ON OPERATING CAPITAL 9.90 UNALLOCATED LABOR 0.00 TOTAL SPECIFIED COST 596.26 _______________________________________________________________________________________________________________________________________________

14
Table 3.C1 Estimated Net Returns above Direct Costs for an Owner Operator Rice, Conventional Variety, Drill Planted, Conventional Tillage, Southwest Louisiana, 2020.
Percent
80% 85% 90% 95% 100% 105% 110% 115% 120%
Yield
Rice Market Price ($/cwt)
Percent (cwt.) $9.60 $10.20 $10.80 $11.40 $12.00 $12.60 $13.20 $13.80 $14.40
--------------------------------- ($/acre) ----------------------------------
80% 56.0 62 91 120 149 178 207 236 265 294
85% 59.5 96 127 158 189 220 251 282 314 345
90% 63.0 129 163 196 229 262 295 329 362 395
95% 66.5 163 198 234 269 304 340 375 410 445
100% 70.0 196 234 271 309 346 384 421 458 496
105% 73.5 230 270 309 349 388 428 467 507 546
110% 77.0 264 305 347 389 430 472 513 555 597
115% 80.5 297 341 385 428 472 516 560 603 647
120% 84.0 331 377 423 468 514 560 606 652 697 Net returns above direct costs for an owner operator is calculated here as market revenue less direct production costs. Direct costs include charges for variable production costs for items such as seed, fertilizer, chemicals, fuel, labor, repair and custom application expenses.
Table 3.C2 Estimated Net Returns above Total Specified Costs for an Owner Operator Rice, Conventional Variety, Drill Planted, Conventional Tillage, Southwest Louisiana, 2020.
Percent
80% 85% 90% 95% 100% 105% 110% 115% 120%
Yield
Rice Market Price ($/cwt)
Percent (cwt.) $9.60 $10.20 $10.80 $11.40 $12.00 $12.60 $13.20 $13.80 $14.40
--------------------------------- ($/acre) ----------------------------------
80% 56.0 -41 -12 17 46 75 104 133 162 191
85% 59.5 -7 24 55 86 117 148 179 210 242
90% 63.0 26 59 93 126 159 192 226 259 292
95% 66.5 60 95 130 166 201 236 272 307 342
100% 70.0 93 131 168 206 243 281 318 355 393
105% 73.5 127 167 206 246 285 325 364 404 443
110% 77.0 161 202 244 285 327 369 410 452 494
115% 80.5 194 238 282 325 369 413 457 500 544
120% 84.0 228 274 319 365 411 457 503 549 594 Net returns above total specified costs for an owner operator is calculated here as market revenue less total specified costs. Specified costs include charges for direct costs and fixed machinery costs but excludes charges for land, general farm overhead and management expenses.
15
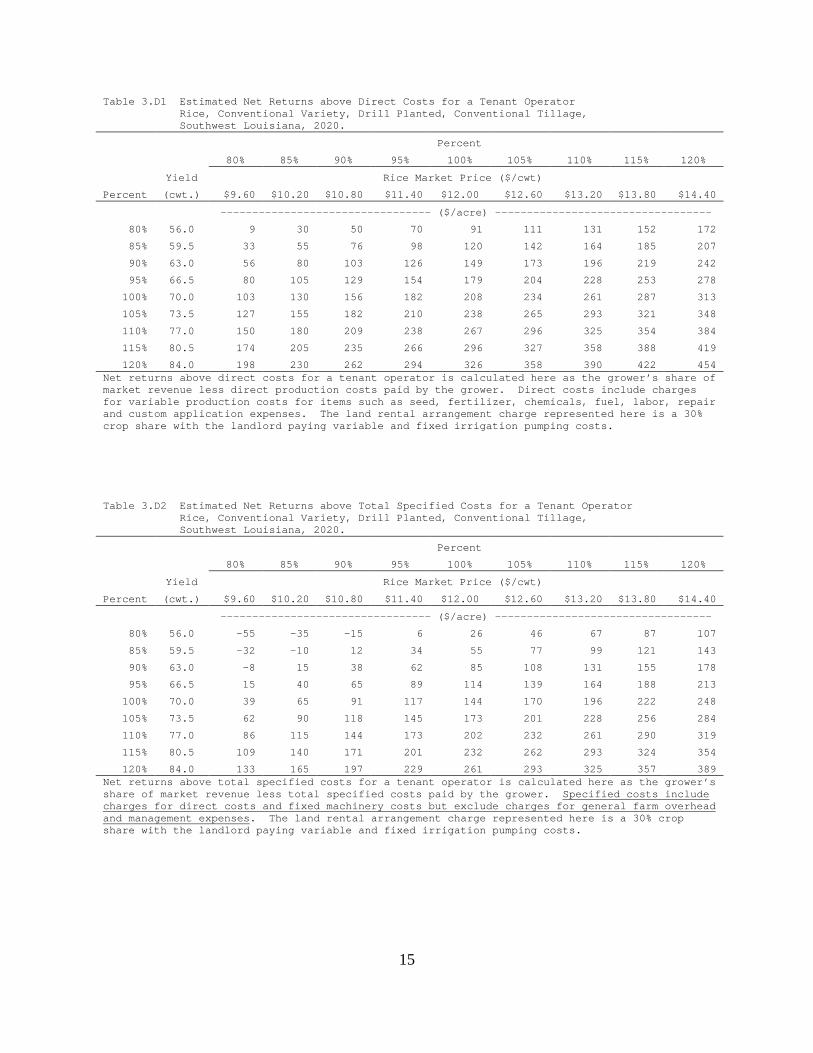
Table 3.D1 Estimated Net Returns above Direct Costs for a Tenant Operator Rice, Conventional Variety, Drill Planted, Conventional Tillage, Southwest Louisiana, 2020.
Percent
80% 85% 90% 95% 100% 105% 110% 115% 120%
Yield
Rice Market Price ($/cwt)
Percent (cwt.) $9.60 $10.20 $10.80 $11.40 $12.00 $12.60 $13.20 $13.80 $14.40
--------------------------------- ($/acre) ----------------------------------
80% 56.0 9 30 50 70 91 111 131 152 172
85% 59.5 33 55 76 98 120 142 164 185 207
90% 63.0 56 80 103 126 149 173 196 219 242
95% 66.5 80 105 129 154 179 204 228 253 278
100% 70.0 103 130 156 182 208 234 261 287 313
105% 73.5 127 155 182 210 238 265 293 321 348
110% 77.0 150 180 209 238 267 296 325 354 384
115% 80.5 174 205 235 266 296 327 358 388 419
120% 84.0 198 230 262 294 326 358 390 422 454 Net returns above direct costs for a tenant operator is calculated here as the grower’s share of market revenue less direct production costs paid by the grower. Direct costs include charges for variable production costs for items such as seed, fertilizer, chemicals, fuel, labor, repair and custom application expenses. The land rental arrangement charge represented here is a 30% crop share with the landlord paying variable and fixed irrigation pumping costs.
Table 3.D2 Estimated Net Returns above Total Specified Costs for a Tenant Operator Rice, Conventional Variety, Drill Planted, Conventional Tillage, Southwest Louisiana, 2020.
Percent
80% 85% 90% 95% 100% 105% 110% 115% 120%
Yield
Rice Market Price ($/cwt)
Percent (cwt.) $9.60 $10.20 $10.80 $11.40 $12.00 $12.60 $13.20 $13.80 $14.40
--------------------------------- ($/acre) ----------------------------------
80% 56.0 -55 -35 -15 6 26 46 67 87 107
85% 59.5 -32 -10 12 34 55 77 99 121 143
90% 63.0 -8 15 38 62 85 108 131 155 178
95% 66.5 15 40 65 89 114 139 164 188 213
100% 70.0 39 65 91 117 144 170 196 222 248
105% 73.5 62 90 118 145 173 201 228 256 284
110% 77.0 86 115 144 173 202 232 261 290 319
115% 80.5 109 140 171 201 232 262 293 324 354
120% 84.0 133 165 197 229 261 293 325 357 389 Net returns above total specified costs for a tenant operator is calculated here as the grower’s share of market revenue less total specified costs paid by the grower. Specified costs include charges for direct costs and fixed machinery costs but exclude charges for general farm overhead and management expenses. The land rental arrangement charge represented here is a 30% crop share with the landlord paying variable and fixed irrigation pumping costs.

16
Table 4.A Estimated costs per acre, Rice, Clearfield Variety, Drill Planted, Conventional Tillage, Southwest Louisiana, 2020. _______________________________________________________________________ ITEM UNIT PRICE QUANTITY AMOUNT YOUR FARM _______________________________________________________________________ dollars dollars DIRECT EXPENSES CUSTOM SPRAY LARice GPS Charge-SW acre 0.35 8.0000 2.80 _________ App by Air ( 5 gal) appl 6.50 5.0000 32.50 _________ GIN/DRY LARice Dry cwt 0.90 77.7000 69.93 _________ FERTILIZERS LA Nitrogen lb 0.41 130.0000 53.30 _________ LA Phosphate lb 0.38 40.0000 15.20 _________ LA Potash lb 0.27 60.0000 16.20 _________ FUNGICIDES Quadris oz 1.25 10.0000 12.50 _________ HERBICIDES Newpath 2SL oz 3.73 8.0000 29.84 _________ Aim 2EC oz 5.00 1.6000 8.00 _________ INSECTICIDES Karate Z oz 3.40 4.0000 13.60 _________ IRRIGATION SUPPLIES Rice Gates each 3.65 1.0000 3.65 _________ SEED/PLANTS Rice Clearfield 161 lb 1.13 75.0000 84.75 _________ Seed Tmt oz 0.30 13.5000 4.05 _________ SERVICE FEE Digital Ag Fee acre 8.50 1.0000 8.50 _________ CUSTOM FERT/LIME App Fert by Air cwt 7.00 3.8000 26.60 _________ CUSTOM HARVEST/HAUL LARice Haul cwt 0.30 70.0000 21.00 _________ HAND LABOR Implements hour 9.06 0.0942 0.85 _________ LA OPERATOR LABOR Self-Propelled hour 15.30 0.3303 5.05 _________ LA Hired Labor Tractors hour 11.33 0.6518 7.39 _________ LA Irrigation Labor Irrigation System 2 hour 11.33 0.2074 2.36 _________ DIESEL FUEL Tractors gal 2.44 7.2104 17.60 _________ Self-Propelled gal 2.44 2.5825 6.30 _________ Irrigation System 2 gal 2.44 35.4660 86.56 _________ REPAIR & MAINTENANCE Implements acre 4.74 1.0000 4.74 _________ Tractors acre 4.22 1.0000 4.22 _________ Self-Propelled acre 14.53 1.0000 14.53 _________ Irrigation System 2 acre 3.61 1.0000 3.61 _________ INTEREST ON OP. CAP. acre 11.42 1.0000 11.42 _________ --------- TOTAL DIRECT EXPENSES 567.05 _________ FIXED EXPENSES Implements acre 11.08 1.0000 11.08 _________ Tractors acre 28.44 1.0000 28.44 _________ Self-Propelled acre 23.62 1.0000 23.62 _________ Irrigation System 2 acre 38.46 1.0000 38.46 _________ --------- TOTAL FIXED EXPENSES 101.60 _________ --------- TOTAL SPECIFIED EXPENSES 668.65 _________ _______________________________________________________________________

17
Table 4.B Estimated resource use and costs for field operations, per acre, Rice, Clearfield Variety, Drill Plant, Conventional Tillage, (In Rotation), Southwest Louisiana, 2020. _______________________________________________________________________________________________________________________________________________ POWER UNIT COST EQUIPMENT COST ALLOC LABOR OPERATING/DURABLE INPUT OPERATION/ SIZE/ POWER UNIT PERF TIMES -------------- -------------- ------------- ----------------------- TOTAL OPERATING INPUT UNIT SIZE RATE OVER MTH DIRECT FIXED DIRECT FIXED HOURS COST AMOUNT PRICE COST COST _______________________________________________________________________________________________________________________________________________ ------------dollars----------- dollars ---------dollars--------- Disk Harrow 32' 4WD 300 0.061 2.00 Nov 5.77 7.78 2.03 4.67 0.12 1.39 21.64 LARice Levee Plow 8 ft 4WD 300 0.050 2.00 Nov 4.70 6.34 0.15 0.40 0.10 1.13 12.72 Blade-Scraper 10' MFWD 150 1.176 0.09 Nov 2.45 3.03 0.18 0.16 0.10 1.20 7.02 Ditcher MFWD 150 0.020 1.00 Nov 0.47 0.57 0.05 0.07 0.02 0.23 1.39 Field Cultivate 32' 4WD 300 0.046 1.00 Feb 2.19 2.96 0.50 2.30 0.04 0.53 8.48 App Fert by Air cwt 1.00 Feb 1.5000 7.00 10.50 10.50 LA Nitrogen lb 70.0000 0.41 28.70 28.70 LARice GPS Charge-SW acre 1.0000 0.35 0.35 0.35 App Fert by Air cwt 1.00 Feb 1.0000 7.00 7.00 7.00 LA Phosphate lb 40.0000 0.38 15.20 15.20 LA Potash lb 60.0000 0.27 16.20 16.20 LARice GPS Charge-SW acre 1.0000 0.35 0.35 0.35 Irrigation System 2 Mar Grain Drill 20' MFWD 170 0.094 1.00 Apr 2.47 3.11 1.39 2.91 0.18 1.92 11.80 Rice Clearfield 161 lb 75.0000 1.13 84.75 84.75 Seed Tmt oz 13.5000 0.30 4.05 4.05 Ditcher MFWD 150 0.020 1.00 Apr 0.47 0.57 0.05 0.07 0.02 0.23 1.39 Blade-Scraper 10' MFWD 150 1.176 0.09 Apr 2.45 3.03 0.18 0.16 0.10 1.20 7.02 Rice Gates each 1.00 Apr 1.0000 3.65 3.65 3.65 LARice Backhoe-Rrmnt 2 ft MFWD 150 0.500 0.05 Apr 0.58 0.72 0.13 0.19 0.02 0.28 1.90 App by Air ( 5 gal) appl 1.00 Apr 1.0000 6.50 6.50 6.50 Newpath 2SL oz 4.0000 3.73 14.92 14.92 LARice GPS Charge-SW acre 1.0000 0.35 0.35 0.35 App by Air ( 5 gal) appl 1.00 Apr 1.0000 6.50 6.50 6.50 Karate Z oz 2.0000 3.40 6.80 6.80 LARice GPS Charge-SW acre 1.0000 0.35 0.35 0.35 App by Air ( 5 gal) appl 1.00 Jun 1.0000 6.50 6.50 6.50 Newpath 2SL oz 4.0000 3.73 14.92 14.92 Aim 2EC oz 1.6000 5.00 8.00 8.00 LARice GPS Charge-SW acre 1.0000 0.35 0.35 0.35 App Fert by Air cwt 1.00 Jun 1.3000 7.00 9.10 9.10 LA Nitrogen lb 60.0000 0.41 24.60 24.60 LARice GPS Charge-SW acre 1.0000 0.35 0.35 0.35 App by Air ( 5 gal) appl 1.00 Jun 1.0000 6.50 6.50 6.50 Quadris oz 10.0000 1.25 12.50 12.50 LARice GPS Charge-SW acre 1.0000 0.35 0.35 0.35 App by Air ( 5 gal) appl 1.00 Jul 1.0000 6.50 6.50 6.50 Karate Z oz 2.0000 3.40 6.80 6.80 LARice GPS Charge-SW acre 1.0000 0.35 0.35 0.35 LA Rice Combine 25 ft 0.300 1.00 Aug 20.83 23.62 0.33 5.05 49.50 Rice Grain Cart 500 Bu MFWD 150 0.057 0.20 Aug 0.27 0.33 0.08 0.15 0.01 0.13 0.96 LARice Haul cwt 1.00 Aug 70.0000 0.30 21.00 21.00 LARice Dry cwt 1.00 Aug 77.7000 0.90 69.93 69.93 Digital Ag Fee acre 1.00 Aug 1.0000 8.50 8.50 8.50 Irrigation System 2 acre Mar 90.17 38.46 0.20 2.36 1.0000 130.99 ------- ------- ------- ------- ------ ------- ------- -------- TOTALS 42.65 52.06 94.91 49.54 1.28 15.65 402.42 657.23 INTEREST ON OPERATING CAPITAL 11.42 UNALLOCATED LABOR 0.00 TOTAL SPECIFIED COST 668.65 _______________________________________________________________________________________________________________________________________________

18
Table 4.C1 Estimated Net Returns above Direct Costs for an Owner Operator Rice, Clearfield Variety, Drill Planted, Conventional Tillage, Southwest Louisiana, 2020.
Percent
80% 85% 90% 95% 100% 105% 110% 115% 120%
Yield
Rice Market Price ($/cwt)
Percent (cwt.) $9.60 $10.20 $10.80 $11.40 $12.00 $12.60 $13.20 $13.80 $14.40
--------------------------------- ($/acre) ----------------------------------
80% 56.0 -12 17 46 75 104 133 162 191 220
85% 59.5 22 53 84 115 146 177 209 240 271
90% 63.0 55 89 122 155 188 222 255 288 321
95% 66.5 89 124 160 195 230 266 301 336 372
100% 70.0 123 160 197 235 272 310 347 385 422
105% 73.5 156 196 235 275 314 354 393 433 472
110% 77.0 190 231 273 315 356 398 440 481 523
115% 80.5 223 267 311 355 398 442 486 529 573
120% 84.0 257 303 349 394 440 486 532 578 624 Net returns above direct costs for an owner operator is calculated here as market revenue less direct production costs. Direct costs include charges for variable production costs for items such as seed, fertilizer, chemicals, fuel, labor, repair and custom application expenses.
Table 4.C2 Estimated Net Returns above Total Specified Costs for an Owner Operator Rice, Clearfield Variety, Drill Planted, Conventional Tillage, Southwest Louisiana, 2020.
Percent
80% 85% 90% 95% 100% 105% 110% 115% 120%
Yield
Rice Market Price ($/cwt)
Percent (cwt.) $9.60 $10.20 $10.80 $11.40 $12.00 $12.60 $13.20 $13.80 $14.40
--------------------------------- ($/acre) ----------------------------------
80% 56.0 -113 -84 -55 -26 3 32 61 90 119
85% 59.5 -80 -49 -18 14 45 76 107 138 169
90% 63.0 -46 -13 20 53 87 120 153 186 220
95% 66.5 -13 23 58 93 129 164 199 235 270
100% 70.0 21 58 96 133 171 208 246 283 320
105% 73.5 55 94 134 173 213 252 292 331 371
110% 77.0 88 130 171 213 255 296 338 380 421
115% 80.5 122 166 209 253 297 340 384 428 472
120% 84.0 155 201 247 293 339 385 430 476 522 Net returns above total specified costs for an owner operator is calculated here as market revenue less total specified costs. Specified costs include charges for direct costs and fixed machinery costs but excludes charges for land, general farm overhead and management expenses.

19
Table 4.D1 Estimated Net Returns above Direct Costs for a Tenant Operator Rice, Clearfield Variety, Drill Planted, Conventional Tillage, Southwest Louisiana, 2020.
Percent
80% 85% 90% 95% 100% 105% 110% 115% 120%
Yield
Rice Market Price ($/cwt)
Percent (cwt.) $9.60 $10.20 $10.80 $11.40 $12.00 $12.60 $13.20 $13.80 $14.40
--------------------------------- ($/acre) ----------------------------------
80% 56.0 -65 -44 -24 -4 17 37 57 78 98
85% 59.5 -41 -19 3 24 46 68 90 112 133
90% 63.0 -17 6 29 52 76 99 122 145 169
95% 66.5 6 31 55 80 105 130 154 179 204
100% 70.0 30 56 82 108 134 161 187 213 239
105% 73.5 53 81 108 136 164 191 219 247 274
110% 77.0 77 106 135 164 193 222 251 281 310
115% 80.5 100 131 161 192 223 253 284 314 345
120% 84.0 124 156 188 220 252 284 316 348 380 Net returns above direct costs for a tenant operator is calculated here as the grower’s share of market revenue less direct production costs paid by the grower. Direct costs include charges for variable production costs for items such as seed, fertilizer, chemicals, fuel, labor, repair and custom application expenses. The land rental arrangement charge represented here is a 30% crop share with the landlord paying variable and fixed irrigation pumping costs.
Table 4.D2 Estimated Net Returns above Total Specified Costs for a Tenant Operator Rice, Clearfield Variety, Drill Planted, Conventional Tillage, Southwest Louisiana, 2020.
Percent
80% 85% 90% 95% 100% 105% 110% 115% 120%
Yield
Rice Market Price ($/cwt)
Percent (cwt.) $9.60 $10.20 $10.80 $11.40 $12.00 $12.60 $13.20 $13.80 $14.40
--------------------------------- ($/acre) ----------------------------------
80% 56.0 -128 -107 -87 -67 -46 -26 -6 15 35
85% 59.5 -104 -82 -61 -39 -17 5 27 48 70
90% 63.0 -81 -57 -34 -11 12 36 59 82 105
95% 66.5 -57 -32 -8 17 42 67 91 116 141
100% 70.0 -34 -7 19 45 71 97 124 150 176
105% 73.5 -10 18 45 73 101 128 156 184 211
110% 77.0 13 43 72 101 130 159 188 217 247
115% 80.5 37 68 98 129 159 190 221 251 282
120% 84.0 61 93 125 157 189 221 253 285 317 Net returns above total specified costs for a tenant operator is calculated here as the grower’s share of market revenue less total specified costs paid by the grower. Specified costs include charges for direct costs and fixed machinery costs but exclude charges for general farm overhead and management expenses. The land rental arrangement charge represented here is a 30% crop share with the landlord paying variable and fixed irrigation pumping costs.
20
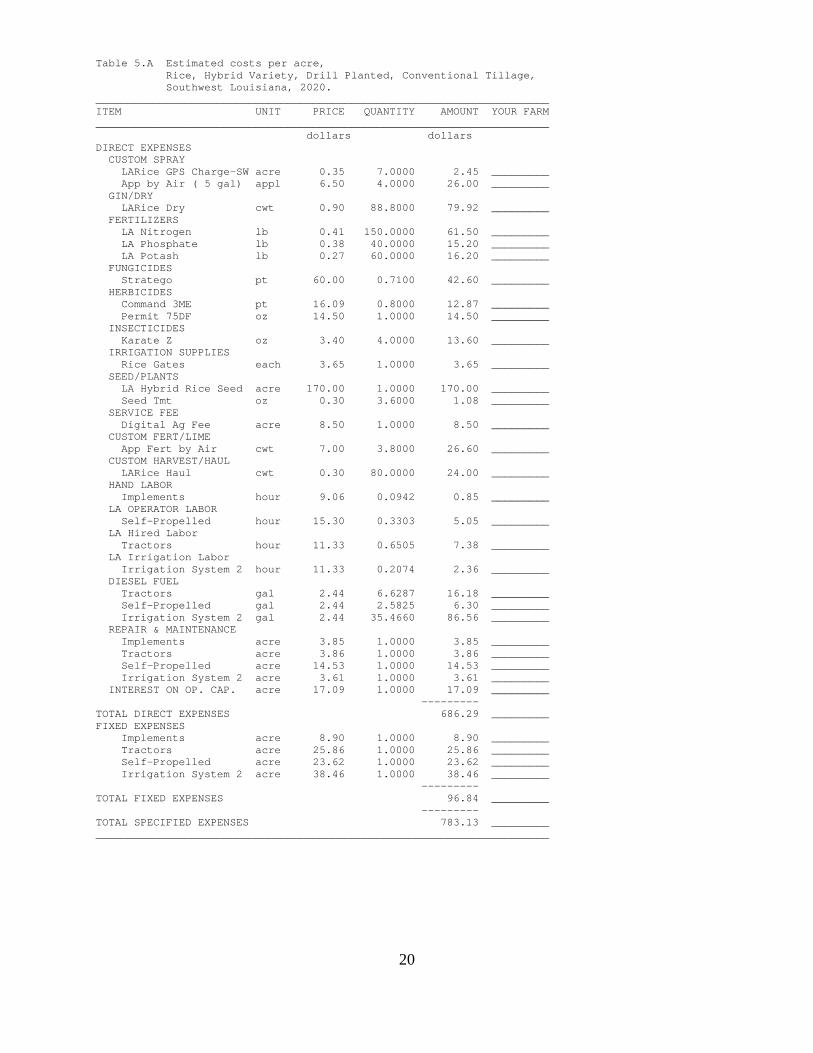
Table 5.A Estimated costs per acre, Rice, Hybrid Variety, Drill Planted, Conventional Tillage, Southwest Louisiana, 2020. _______________________________________________________________________ ITEM UNIT PRICE QUANTITY AMOUNT YOUR FARM _______________________________________________________________________ dollars dollars DIRECT EXPENSES CUSTOM SPRAY LARice GPS Charge-SW acre 0.35 7.0000 2.45 _________ App by Air ( 5 gal) appl 6.50 4.0000 26.00 _________ GIN/DRY LARice Dry cwt 0.90 88.8000 79.92 _________ FERTILIZERS LA Nitrogen lb 0.41 150.0000 61.50 _________ LA Phosphate lb 0.38 40.0000 15.20 _________ LA Potash lb 0.27 60.0000 16.20 _________ FUNGICIDES Stratego pt 60.00 0.7100 42.60 _________ HERBICIDES Command 3ME pt 16.09 0.8000 12.87 _________ Permit 75DF oz 14.50 1.0000 14.50 _________ INSECTICIDES Karate Z oz 3.40 4.0000 13.60 _________ IRRIGATION SUPPLIES Rice Gates each 3.65 1.0000 3.65 _________ SEED/PLANTS LA Hybrid Rice Seed acre 170.00 1.0000 170.00 _________ Seed Tmt oz 0.30 3.6000 1.08 _________ SERVICE FEE Digital Ag Fee acre 8.50 1.0000 8.50 _________ CUSTOM FERT/LIME App Fert by Air cwt 7.00 3.8000 26.60 _________ CUSTOM HARVEST/HAUL LARice Haul cwt 0.30 80.0000 24.00 _________ HAND LABOR Implements hour 9.06 0.0942 0.85 _________ LA OPERATOR LABOR Self-Propelled hour 15.30 0.3303 5.05 _________ LA Hired Labor Tractors hour 11.33 0.6505 7.38 _________ LA Irrigation Labor Irrigation System 2 hour 11.33 0.2074 2.36 _________ DIESEL FUEL Tractors gal 2.44 6.6287 16.18 _________ Self-Propelled gal 2.44 2.5825 6.30 _________ Irrigation System 2 gal 2.44 35.4660 86.56 _________ REPAIR & MAINTENANCE Implements acre 3.85 1.0000 3.85 _________ Tractors acre 3.86 1.0000 3.86 _________ Self-Propelled acre 14.53 1.0000 14.53 _________ Irrigation System 2 acre 3.61 1.0000 3.61 _________ INTEREST ON OP. CAP. acre 17.09 1.0000 17.09 _________ --------- TOTAL DIRECT EXPENSES 686.29 _________ FIXED EXPENSES Implements acre 8.90 1.0000 8.90 _________ Tractors acre 25.86 1.0000 25.86 _________ Self-Propelled acre 23.62 1.0000 23.62 _________ Irrigation System 2 acre 38.46 1.0000 38.46 _________ --------- TOTAL FIXED EXPENSES 96.84 _________ --------- TOTAL SPECIFIED EXPENSES 783.13 _________ _______________________________________________________________________

21
Table 5.B Estimated resource use and costs for field operations, per acre, Rice, Hybrid Variety, Drill Planted, (In Rotation), Southwest Louisiana, 2020. _______________________________________________________________________________________________________________________________________________ POWER UNIT COST EQUIPMENT COST ALLOC LABOR OPERATING/DURABLE INPUT OPERATION/ SIZE/ POWER UNIT PERF TIMES -------------- -------------- ------------- ----------------------- TOTAL OPERATING INPUT UNIT SIZE RATE OVER MTH DIRECT FIXED DIRECT FIXED HOURS COST AMOUNT PRICE COST COST _______________________________________________________________________________________________________________________________________________ ------------dollars----------- dollars ---------dollars--------- Disk Harrow 32' 4WD 300 0.061 1.00 Nov 2.88 3.89 1.01 2.33 0.06 0.70 10.81 LA Hybrid Rice Seed acre 1.0000 170.00 170.00 170.00 Seed Tmt oz 3.6000 0.30 1.08 1.08 LARice Levee Plow 8 ft 4WD 300 0.050 2.00 Nov 4.70 6.34 0.15 0.40 0.10 1.13 12.72 Blade-Scraper 10' MFWD 150 1.176 0.09 Nov 2.45 3.03 0.18 0.16 0.10 1.20 7.02 Ditcher MFWD 150 0.020 1.00 Nov 0.47 0.57 0.05 0.07 0.02 0.23 1.39 Field Cultivate 32' 4WD 300 0.046 1.00 Feb 2.19 2.96 0.50 2.30 0.04 0.53 8.48 App Fert by Air cwt 1.00 Feb 1.5000 7.00 10.50 10.50 LA Nitrogen lb 75.0000 0.41 30.75 30.75 LARice GPS Charge-SW acre 1.0000 0.35 0.35 0.35 App Fert by Air cwt 1.00 Feb 1.0000 7.00 7.00 7.00 LA Phosphate lb 40.0000 0.38 15.20 15.20 LA Potash lb 60.0000 0.27 16.20 16.20 LARice GPS Charge-SW acre 1.0000 0.35 0.35 0.35 Grain Drill 20' MFWD 150 0.094 1.00 Apr 2.19 2.70 1.39 2.91 0.18 1.92 11.11 Ditcher MFWD 150 0.020 1.00 Apr 0.47 0.57 0.05 0.07 0.02 0.23 1.39 Blade-Scraper 10' MFWD 150 1.176 0.09 Apr 2.45 3.03 0.18 0.16 0.10 1.20 7.02 Rice Gates each 1.00 Apr 1.0000 3.65 3.65 3.65 LARice Backhoe-Rrmnt 2 ft MFWD 150 0.500 0.05 Apr 0.58 0.72 0.13 0.19 0.02 0.28 1.90 LA Boom Sprayer 30 ft MFWD 150 0.059 1.00 Apr 1.39 1.72 0.13 0.16 0.05 0.68 4.08 Command 3ME pt 0.8000 16.09 12.87 12.87 App by Air ( 5 gal) appl 1.00 Apr 1.0000 6.50 6.50 6.50 Karate Z oz 2.0000 3.40 6.80 6.80 LARice GPS Charge-SW acre 1.0000 0.35 0.35 0.35 App by Air ( 5 gal) appl 1.00 Jun 1.0000 6.50 6.50 6.50 Permit 75DF oz 1.0000 14.50 14.50 14.50 LARice GPS Charge-SW acre 1.0000 0.35 0.35 0.35 App Fert by Air cwt 1.00 Jun 1.3000 7.00 9.10 9.10 LA Nitrogen lb 75.0000 0.41 30.75 30.75 LARice GPS Charge-SW acre 1.0000 0.35 0.35 0.35 App by Air ( 5 gal) appl 1.00 Jun 1.0000 6.50 6.50 6.50 Stratego pt 0.7100 60.00 42.60 42.60 LARice GPS Charge-SW acre 1.0000 0.35 0.35 0.35 App by Air ( 5 gal) appl 1.00 Jul 1.0000 6.50 6.50 6.50 Karate Z oz 2.0000 3.40 6.80 6.80 LARice GPS Charge-SW acre 1.0000 0.35 0.35 0.35 LA Rice Combine 25 ft 0.300 1.00 Aug 20.83 23.62 0.33 5.05 49.50 Rice Grain Cart 500 Bu MFWD 150 0.057 0.20 Aug 0.27 0.33 0.08 0.15 0.01 0.13 0.96 LARice Haul cwt 1.00 Aug 80.0000 0.30 24.00 24.00 LARice Dry cwt 1.00 Aug 88.8000 0.90 79.92 79.92 Digital Ag Fee acre 1.00 Aug 1.0000 8.50 8.50 8.50 Irrigation System 2 acre Mar 90.17 38.46 0.20 2.36 1.0000 130.99 ------- ------- ------- ------- ------ ------- ------- -------- TOTALS 40.87 49.48 94.02 47.36 1.28 15.64 518.67 766.04 INTEREST ON OPERATING CAPITAL 17.09 UNALLOCATED LABOR 0.00 TOTAL SPECIFIED COST 783.13 _________________________________________________________________________________________________________________________________________________

22
Table 5.C1 Estimated Net Returns above Direct Costs for an Owner Operator Rice, Hybrid Variety, Drill Planted, Conventional Tillage, Southwest Louisiana, 2020.
Percent
80% 85% 90% 95% 100% 105% 110% 115% 120%
Yield
Rice Market Price ($/cwt)
Percent (cwt.) $9.60 $10.20 $10.80 $11.40 $12.00 $12.60 $13.20 $13.80 $14.40
--------------------------------- ($/acre) ----------------------------------
80% 64.0 -52 -19 15 48 81 114 147 180 214
85% 68.0 -13 22 58 93 129 165 200 236 271
90% 72.0 25 63 101 139 177 215 253 291 329
95% 76.0 64 104 144 185 225 265 306 346 386
100% 80.0 102 145 187 230 273 316 359 401 444
105% 84.0 140 185 231 276 321 366 411 456 502
110% 88.0 179 226 274 321 369 417 464 512 559
115% 92.0 217 267 317 367 417 467 517 567 617
120% 96.0 256 308 360 413 465 517 570 622 674 Net returns above direct costs for an owner operator is calculated here as market revenue less direct production costs. Direct costs include charges for variable production costs for items such as seed, fertilizer, chemicals, fuel, labor, repair and custom application expenses.
Table 5.C2 Estimated Net Returns above Total Specified Costs for an Owner Operator Rice, Hybrid Variety, Drill Planted, Conventional Tillage, Southwest Louisiana, 2020.
Percent
80% 85% 90% 95% 100% 105% 110% 115% 120%
Yield
Rice Market Price ($/cwt)
Percent (cwt.) $9.60 $10.20 $10.80 $11.40 $12.00 $12.60 $13.20 $13.80 $14.40
--------------------------------- ($/acre) ----------------------------------
80% 64.0 -149 -115 -82 -49 -16 17 50 84 117
85% 68.0 -110 -75 -39 -3 32 68 103 139 174
90% 72.0 -72 -34 4 42 80 118 156 194 232
95% 76.0 -33 7 47 88 128 169 209 249 290
100% 80.0 5 48 91 133 176 219 262 304 347
105% 84.0 43 89 134 179 224 269 314 360 405
110% 88.0 82 129 177 225 272 320 367 415 462
115% 92.0 120 170 220 270 320 370 420 470 520
120% 96.0 159 211 263 316 368 421 473 525 578 Net returns above total specified costs for an owner operator is calculated here as market revenue less total specified costs. Specified costs include charges for direct costs and fixed machinery costs but excludes charges for land, general farm overhead and management expenses.

23
Table 5.D1 Estimated Net Returns above Direct Costs for a Tenant Operator Rice, Hybrid Variety, Drill Planted, Conventional Tillage, Southwest Louisiana, 2020.
Percent
80% 85% 90% 95% 100% 105% 110% 115% 120%
Yield
Rice Market Price ($/cwt)
Percent (cwt.) $9.60 $10.20 $10.80 $11.40 $12.00 $12.60 $13.20 $13.80 $14.40
--------------------------------- ($/acre) ----------------------------------
80% 64.0 -124 -101 -78 -55 -31 -8 15 38 61
85% 68.0 -97 -73 -48 -23 2 27 52 77 102
90% 72.0 -71 -44 -17 9 36 62 89 115 142
95% 76.0 -44 -15 13 41 69 98 126 154 182
100% 80.0 -17 13 43 73 103 133 163 193 223
105% 84.0 10 42 73 105 137 168 200 231 263
110% 88.0 37 70 104 137 170 203 237 270 303
115% 92.0 64 99 134 169 204 239 274 309 344
120% 96.0 91 127 164 201 237 274 311 347 384 Net returns above direct costs for a tenant operator is calculated here as the grower’s share of market revenue less direct production costs paid by the grower. Direct costs include charges for variable production costs for items such as seed, fertilizer, chemicals, fuel, labor, repair and custom application expenses. The land rental arrangement charge represented here is a 30% crop share with the landlord paying variable and fixed irrigation pumping costs.
Table 5.D2 Estimated Net Returns above Total Specified Costs for a Tenant Operator Rice, Hybrid Variety, Drill Planted, Conventional Tillage, Southwest Louisiana, 2020.
Percent
80% 85% 90% 95% 100% 105% 110% 115% 120%
Yield
Rice Market Price ($/cwt)
Percent (cwt.) $9.60 $10.20 $10.80 $11.40 $12.00 $12.60 $13.20 $13.80 $14.40
--------------------------------- ($/acre) ----------------------------------
80% 64.0 -183 -159 -136 -113 -90 -67 -43 -20 3
85% 68.0 -156 -131 -106 -81 -56 -31 -6 18 43
90% 72.0 -129 -102 -76 -49 -23 4 31 57 84
95% 76.0 -102 -74 -46 -17 11 39 67 96 124
100% 80.0 -75 -45 -15 15 45 74 104 134 164
105% 84.0 -48 -17 15 47 78 110 141 173 205
110% 88.0 -21 12 45 78 112 145 178 212 245
115% 92.0 5 40 75 110 145 180 215 250 285
120% 96.0 32 69 106 142 179 216 252 289 326 Net returns above total specified costs for a tenant operator is calculated here as the grower’s share of market revenue less total specified costs paid by the grower. Specified costs include charges for direct costs and fixed machinery costs but exclude charges for general farm overhead and management expenses. The land rental arrangement charge represented here is a 30% crop share with the landlord paying variable and fixed irrigation pumping costs.
24
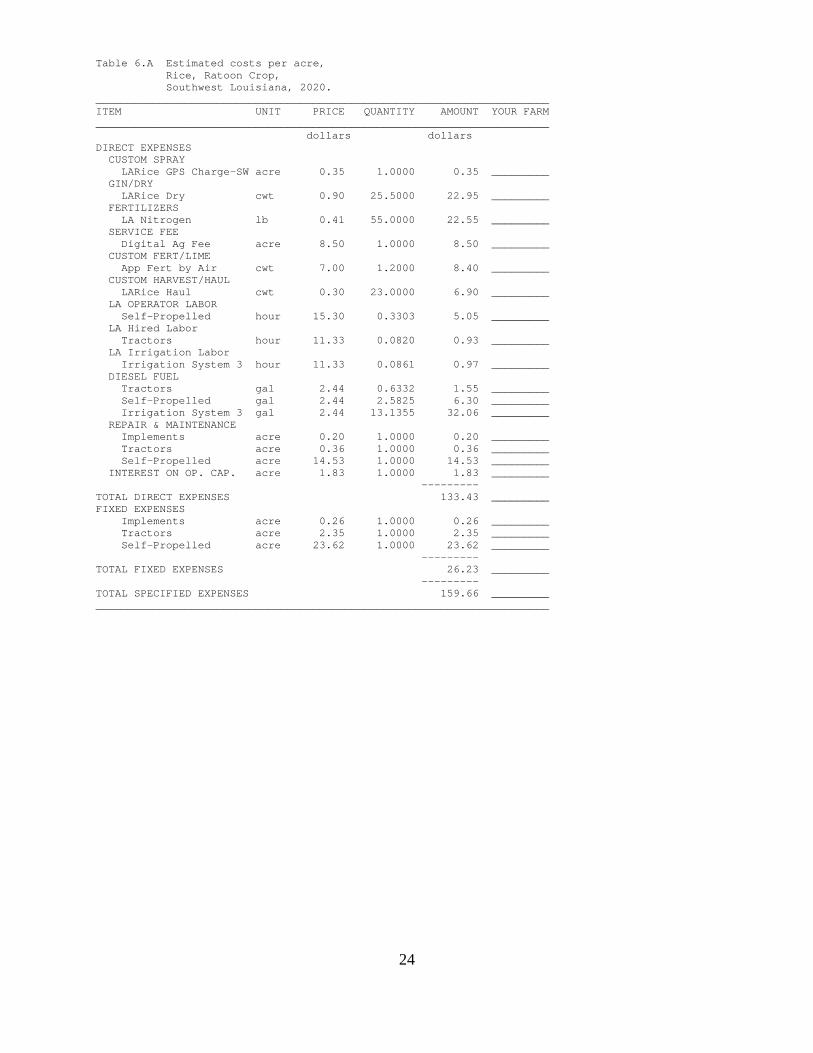
Table 6.A Estimated costs per acre, Rice, Ratoon Crop, Southwest Louisiana, 2020. _______________________________________________________________________ ITEM UNIT PRICE QUANTITY AMOUNT YOUR FARM _______________________________________________________________________ dollars dollars DIRECT EXPENSES CUSTOM SPRAY LARice GPS Charge-SW acre 0.35 1.0000 0.35 _________ GIN/DRY LARice Dry cwt 0.90 25.5000 22.95 _________ FERTILIZERS LA Nitrogen lb 0.41 55.0000 22.55 _________ SERVICE FEE Digital Ag Fee acre 8.50 1.0000 8.50 _________ CUSTOM FERT/LIME App Fert by Air cwt 7.00 1.2000 8.40 _________ CUSTOM HARVEST/HAUL LARice Haul cwt 0.30 23.0000 6.90 _________ LA OPERATOR LABOR Self-Propelled hour 15.30 0.3303 5.05 _________ LA Hired Labor Tractors hour 11.33 0.0820 0.93 _________ LA Irrigation Labor Irrigation System 3 hour 11.33 0.0861 0.97 _________ DIESEL FUEL Tractors gal 2.44 0.6332 1.55 _________ Self-Propelled gal 2.44 2.5825 6.30 _________ Irrigation System 3 gal 2.44 13.1355 32.06 _________ REPAIR & MAINTENANCE Implements acre 0.20 1.0000 0.20 _________ Tractors acre 0.36 1.0000 0.36 _________ Self-Propelled acre 14.53 1.0000 14.53 _________ INTEREST ON OP. CAP. acre 1.83 1.0000 1.83 _________ --------- TOTAL DIRECT EXPENSES 133.43 _________ FIXED EXPENSES Implements acre 0.26 1.0000 0.26 _________ Tractors acre 2.35 1.0000 2.35 _________ Self-Propelled acre 23.62 1.0000 23.62 _________ --------- TOTAL FIXED EXPENSES 26.23 _________ --------- TOTAL SPECIFIED EXPENSES 159.66 _________ _______________________________________________________________________

25
Table 6.B Estimated resource use and costs for field operations, per acre, Rice, Ratoon Crop, Southwest Louisiana, 2020. _______________________________________________________________________________________________________________________________________________ POWER UNIT COST EQUIPMENT COST ALLOC LABOR OPERATING/DURABLE INPUT OPERATION/ SIZE/ POWER UNIT PERF TIMES -------------- -------------- ------------- ----------------------- TOTAL OPERATING INPUT UNIT SIZE RATE OVER MTH DIRECT FIXED DIRECT FIXED HOURS COST AMOUNT PRICE COST COST _______________________________________________________________________________________________________________________________________________ ------------dollars----------- dollars ---------dollars--------- Blade-Scraper 10' MFWD 150 1.176 0.06 Aug 1.64 2.02 0.12 0.11 0.07 0.80 4.69 Irrigation System 3 Aug App Fert by Air cwt 1.00 Aug 1.2000 7.00 8.40 8.40 LA Nitrogen lb 55.0000 0.41 22.55 22.55 LARice GPS Charge-SW acre 1.0000 0.35 0.35 0.35 LA Rice Combine-2 25 ft 0.300 1.00 Oct 20.83 23.62 0.33 5.05 49.50 Rice Grain Cart 500 Bu MFWD 150 0.057 0.20 Oct 0.27 0.33 0.08 0.15 0.01 0.13 0.96 LARice Haul cwt 1.00 Oct 23.0000 0.30 6.90 6.90 Digital Ag Fee acre 1.00 Oct 1.0000 8.50 8.50 8.50 LARice Dry cwt 1.00 Nov 25.5000 0.90 22.95 22.95 Irrigation System 3 acre Aug 32.06 0.08 0.97 1.0000 33.03 ------- ------- ------- ------- ------ ------- ------- -------- TOTALS 22.74 25.97 32.26 0.26 0.49 6.95 69.65 157.83 INTEREST ON OPERATING CAPITAL 1.83 UNALLOCATED LABOR 0.00 TOTAL SPECIFIED COST 159.66 _______________________________________________________________________________________________________________________________________________

26
Table 6.C1 Estimated Net Returns above Direct Costs for an Owner Operator Rice, Ratoon Crop, Southwest Louisiana, 2020.
Percent
80% 85% 90% 95% 100% 105% 110% 115% 120%
Yield
Rice Market Price ($/cwt)
Percent (cwt.) $9.60 $10.20 $10.80 $11.40 $12.00 $12.60 $13.20 $13.80 $14.40
--------------------------------- ($/acre) ----------------------------------
80% 18.4 49 59 68 78 87 97 106 116 125
85% 19.6 60 70 80 91 101 111 121 132 142
90% 20.7 71 82 93 104 115 126 137 147 158
95% 21.9 82 94 105 117 129 140 152 163 175
100% 23.0 93 105 118 130 142 155 167 179 192
105% 24.2 104 117 130 143 156 169 182 195 208
110% 25.3 115 129 143 156 170 184 197 211 225
115% 26.5 126 141 155 169 184 198 212 227 241
120% 27.6 137 152 167 182 198 213 228 243 258 Net returns above direct costs for an owner operator is calculated here as market revenue less direct production costs. Direct costs include charges for variable production costs for items such as seed, fertilizer, chemicals, fuel, labor, repair and custom application expenses.
Table 6.C2 Estimated Net Returns above Total Specified Costs for an Owner Operator Rice, Ratoon Crop, Southwest Louisiana, 2020.
Percent
80% 85% 90% 95% 100% 105% 110% 115% 120%
Yield
Rice Market Price ($/cwt)
Percent (cwt.) $9.60 $10.20 $10.80 $11.40 $12.00 $12.60 $13.20 $13.80 $14.40
--------------------------------- ($/acre) ----------------------------------
80% 18.4 23 32 42 51 61 70 80 90 99
85% 19.6 34 44 54 64 75 85 95 105 116
90% 20.7 45 56 67 78 89 99 110 121 132
95% 21.9 56 67 79 91 102 114 126 137 149
100% 23.0 67 79 92 104 116 128 141 153 165
105% 24.2 78 91 104 117 130 143 156 169 182
110% 25.3 89 103 116 130 144 157 171 185 198
115% 26.5 100 114 129 143 158 172 186 201 215
120% 27.6 111 126 141 156 171 186 201 216 232 Net returns above total specified costs for an owner operator is calculated here as market revenue less total specified costs. Specified costs include charges for direct costs and fixed machinery costs but excludes charges for land, general farm overhead and management expenses.

27
Table 6.D1 Estimated Net Returns above Direct Costs for a Tenant Operator Rice, Ratoon Crop, Southwest Louisiana, 2020.
Percent
80% 85% 90% 95% 100% 105% 110% 115% 120%
Yield
Rice Market Price ($/cwt)
Percent (cwt.) $9.60 $10.20 $10.80 $11.40 $12.00 $12.60 $13.20 $13.80 $14.40
--------------------------------- ($/acre) ----------------------------------
80% 18.4 35 42 49 55 62 69 75 82 89
85% 19.6 43 50 57 64 72 79 86 93 100
90% 20.7 51 58 66 74 81 89 97 104 112
95% 21.9 58 67 75 83 91 99 107 115 123
100% 23.0 66 75 83 92 101 109 118 126 135
105% 24.2 74 83 92 101 110 119 128 138 147
110% 25.3 82 91 101 110 120 130 139 149 158
115% 26.5 89 99 109 120 130 140 150 160 170
120% 27.6 97 108 118 129 139 150 160 171 181 Net returns above direct costs for a tenant operator is calculated here as the grower’s share of market revenue less direct production costs paid by the grower. Direct costs include charges for variable production costs for items such as seed, fertilizer, chemicals, fuel, labor, repair and custom application expenses. The land rental arrangement charge represented here is a 30% crop share with the landlord paying variable and fixed irrigation pumping costs.
Table 6.D2 Estimated Net Returns above Total Specified Costs for a Tenant Operator Rice, Ratoon Crop, Southwest Louisiana, 2020.
Percent
80% 85% 90% 95% 100% 105% 110% 115% 120%
Yield
Rice Market Price ($/cwt)
Percent (cwt.) $9.60 $10.20 $10.80 $11.40 $12.00 $12.60 $13.20 $13.80 $14.40
--------------------------------- ($/acre) ----------------------------------
80% 18.4 9 16 22 29 36 42 49 56 62
85% 19.6 17 24 31 38 45 53 60 67 74
90% 20.7 25 32 40 47 55 63 70 78 86
95% 21.9 32 40 48 57 65 73 81 89 97
100% 23.0 40 49 57 66 74 83 92 100 109
105% 24.2 48 57 66 75 84 93 102 111 120
110% 25.3 55 65 75 84 94 103 113 122 132
115% 26.5 63 73 83 93 103 113 123 134 144
120% 27.6 71 81 92 102 113 124 134 145 155 Net returns above total specified costs for a tenant operator is calculated here as the grower’s share of market revenue less total specified costs paid by the grower. Specified costs include charges for direct costs and fixed machinery costs but exclude charges for general farm overhead and management expenses. The land rental arrangement charge represented here is a 30% crop share with the landlord paying variable and fixed irrigation pumping costs.

28
Table 7.A Estimated costs per acre, Rice, Conventional Variety, Drill Planted, Conventional Tillage, Northeast Louisiana, 2020. _______________________________________________________________________ ITEM UNIT PRICE QUANTITY AMOUNT YOUR FARM _______________________________________________________________________ dollars dollars DIRECT EXPENSES CUSTOM SPRAY LARice GPS Charge_NE acre 0.25 7.0000 1.75 _________ App by Air ( 5 gal) appl 6.50 4.0000 26.00 _________ GIN/DRY LARice Dry cwt 0.90 78.0000 70.20 _________ FERTILIZERS LA Nitrogen lb 0.41 170.0000 69.70 _________ FUNGICIDES Quadris oz 1.25 10.0000 12.50 _________ HERBICIDES Command 3ME pt 16.09 0.8000 12.87 _________ Permit 75DF oz 14.50 1.0000 14.50 _________ INSECTICIDES Karate Z oz 3.40 4.0000 13.60 _________ IRRIGATION SUPPLIES Rice Gates each 3.65 1.0000 3.65 _________ SEED/PLANTS Rice Seed Conv. lb 0.30 90.0000 27.00 _________ SERVICE FEE Digital Ag Fee acre 8.50 1.0000 8.50 _________ CUSTOM FERT/LIME App Fert by Air cwt 7.00 3.7000 25.90 _________ CUSTOM HARVEST/HAUL LARice Haul cwt 0.30 71.0000 21.30 _________ HAND LABOR Implements hour 9.06 0.0942 0.85 _________ LA OPERATOR LABOR Self-Propelled hour 15.30 0.3303 5.05 _________ LA Hired Labor Tractors hour 11.33 0.8249 9.36 _________ LA Irrigation Labor Irrigation System 5 hour 11.33 0.4361 4.95 _________ DIESEL FUEL Tractors gal 2.44 7.9039 19.29 _________ Self-Propelled gal 2.44 2.5825 6.30 _________ Irrigation System 5 gal 2.44 28.5331 69.63 _________ REPAIR & MAINTENANCE Implements acre 6.03 1.0000 6.03 _________ Tractors acre 4.66 1.0000 4.66 _________ Self-Propelled acre 14.53 1.0000 14.53 _________ Irrigation System 5 acre 2.17 1.0000 2.17 _________ INTEREST ON OP. CAP. acre 7.51 1.0000 7.51 _________ --------- TOTAL DIRECT EXPENSES 457.80 _________ FIXED EXPENSES Implements acre 14.10 1.0000 14.10 _________ Tractors acre 31.31 1.0000 31.31 _________ Self-Propelled acre 23.62 1.0000 23.62 _________ Irrigation System 5 acre 14.73 1.0000 14.73 _________ --------- TOTAL FIXED EXPENSES 83.76 _________ --------- TOTAL SPECIFIED EXPENSES 541.56 _________ _______________________________________________________________________

29
Table 7.B Estimated resource use and costs for field operations, per acre, Rice, Conventional Variety, Drill Plant, Conventional Tillage, (In Rotation), Northeast Louisiana, 2020. _______________________________________________________________________________________________________________________________________________ POWER UNIT COST EQUIPMENT COST ALLOC LABOR OPERATING/DURABLE INPUT OPERATION/ SIZE/ POWER UNIT PERF TIMES -------------- -------------- ------------- ----------------------- TOTAL OPERATING INPUT UNIT SIZE RATE OVER MTH DIRECT FIXED DIRECT FIXED HOURS COST AMOUNT PRICE COST COST _______________________________________________________________________________________________________________________________________________ ------------dollars----------- dollars ---------dollars--------- Disk Harrow 32' 4WD 300 0.061 1.00 Nov 2.88 3.89 1.01 2.33 0.06 0.70 10.81 Ditcher MFWD 150 0.020 2.00 Nov 0.93 1.14 0.10 0.14 0.04 0.45 2.76 Disk Harrow 28' MFWD 190 0.070 2.00 Mar 4.18 5.64 2.10 4.82 0.14 1.59 18.33 Irrigation System 5 Mar Ditcher MFWD 150 0.020 1.00 Mar 0.47 0.57 0.05 0.07 0.02 0.23 1.39 Field Cultivate 32' 4WD 300 0.046 1.00 Mar 2.19 2.96 0.50 2.30 0.04 0.53 8.48 LARice Levee Plow 8 ft MFWD 190 0.050 4.00 Mar 5.95 8.04 0.31 0.80 0.20 2.27 17.37 App Fert by Air cwt 1.00 Apr 0.4000 7.00 2.80 2.80 LA Nitrogen lb 20.0000 0.41 8.20 8.20 LARice GPS Charge_NE acre 1.0000 0.25 0.25 0.25 Grain Drill 20' MFWD 150 0.094 1.00 Apr 2.19 2.70 1.39 2.91 0.18 1.92 11.11 Rice Seed Conv. lb 90.0000 0.30 27.00 27.00 Ditcher MFWD 150 0.020 1.00 Apr 0.47 0.57 0.05 0.07 0.02 0.23 1.39 Blade-Scraper 10' MFWD 150 1.176 0.09 Apr 2.45 3.03 0.18 0.16 0.10 1.20 7.02 Rice Gates each 1.00 Apr 1.0000 3.65 3.65 3.65 LARice Backhoe-Rrmnt 2 ft MFWD 150 0.500 0.05 Apr 0.58 0.72 0.13 0.19 0.02 0.28 1.90 LA Boom Sprayer 30 ft MFWD 150 0.059 1.00 Apr 1.39 1.72 0.13 0.16 0.05 0.68 4.08 Command 3ME pt 0.8000 16.09 12.87 12.87 App by Air ( 5 gal) appl 1.00 Apr 1.0000 6.50 6.50 6.50 Karate Z oz 2.0000 3.40 6.80 6.80 LARice GPS Charge_NE acre 1.0000 0.25 0.25 0.25 App by Air ( 5 gal) appl 1.00 May 1.0000 6.50 6.50 6.50 Permit 75DF oz 1.0000 14.50 14.50 14.50 LARice GPS Charge_NE acre 1.0000 0.25 0.25 0.25 App Fert by Air cwt 1.00 May 2.0000 7.00 14.00 14.00 LA Nitrogen lb 90.0000 0.41 36.90 36.90 LARice GPS Charge_NE acre 1.0000 0.25 0.25 0.25 App Fert by Air cwt 1.00 Jun 1.3000 7.00 9.10 9.10 LA Nitrogen lb 60.0000 0.41 24.60 24.60 LARice GPS Charge_NE acre 1.0000 0.25 0.25 0.25 App by Air ( 5 gal) appl 1.00 Jun 1.0000 6.50 6.50 6.50 Quadris oz 10.0000 1.25 12.50 12.50 LARice GPS Charge_NE acre 1.0000 0.25 0.25 0.25 App by Air ( 5 gal) appl 1.00 Jul 1.0000 6.50 6.50 6.50 Karate Z oz 2.0000 3.40 6.80 6.80 LARice GPS Charge_NE acre 1.0000 0.25 0.25 0.25 LA Rice Combine 25 ft 0.300 1.00 Aug 20.83 23.62 0.33 5.05 49.50 Rice Grain Cart 500 Bu MFWD 150 0.057 0.20 Aug 0.27 0.33 0.08 0.15 0.01 0.13 0.96 LARice Haul cwt 1.00 Aug 71.0000 0.30 21.30 21.30 LARice Dry cwt 1.00 Aug 78.0000 0.90 70.20 70.20 Digital Ag Fee acre 1.00 Aug 1.0000 8.50 8.50 8.50 Irrigation System 5 acre Mar 71.80 14.73 0.43 4.95 1.0000 91.48 ------- ------- ------- ------- ------ ------- ------- -------- TOTALS 44.78 54.93 77.83 28.83 1.68 20.21 307.47 534.05 INTEREST ON OPERATING CAPITAL 7.51 UNALLOCATED LABOR 0.00 TOTAL SPECIFIED COST 541.56 _______________________________________________________________________________________________________________________________________________

30
Table 7.C1 Estimated Net Returns above Direct Costs for an Owner Operator Rice, Conventional Variety, Drill Planted, Conventional Tillage, Northeast Louisiana, 2020.
Percent
80% 85% 90% 95% 100% 105% 110% 115% 120%
Yield
Rice Market Price ($/cwt)
Percent (cwt.) $9.60 $10.20 $10.80 $11.40 $12.00 $12.60 $13.20 $13.80 $14.40
--------------------------------- ($/acre) ----------------------------------
80% 59.2 128 159 189 220 251 282 313 344 375
85% 62.9 163 196 229 263 296 329 362 395 428
90% 66.6 199 234 269 305 340 375 411 446 481
95% 70.3 234 272 309 347 384 422 460 497 535
100% 74.0 270 310 349 389 429 469 508 548 588
105% 77.7 305 347 389 431 473 515 557 599 641
110% 81.4 341 385 429 473 518 562 606 650 694
115% 85.1 376 423 469 516 562 608 655 701 748
120% 88.8 412 461 509 558 606 655 704 752 801 Net returns above direct costs for an owner operator is calculated here as market revenue less direct production costs. Direct costs include charges for variable production costs for items such as seed, fertilizer, chemicals, fuel, labor, repair and custom application expenses.
Table 7.C2 Estimated Net Returns above Total Specified Costs for an Owner Operator Rice, Conventional Variety, Drill Planted, Conventional Tillage, Northeast Louisiana, 2020.
Percent
80% 85% 90% 95% 100% 105% 110% 115% 120%
Yield
Rice Market Price ($/cwt)
Percent (cwt.) $9.60 $10.20 $10.80 $11.40 $12.00 $12.60 $13.20 $13.80 $14.40
--------------------------------- ($/acre) ----------------------------------
80% 59.2 44 75 106 137 167 198 229 260 291
85% 62.9 79 113 146 179 212 245 278 311 344
90% 66.6 115 150 186 221 256 292 327 362 398
95% 70.3 151 188 226 263 301 338 376 413 451
100% 74.0 186 226 266 305 345 385 425 464 504
105% 77.7 222 264 306 347 389 431 473 515 557
110% 81.4 257 301 345 390 434 478 522 566 611
115% 85.1 293 339 385 432 478 525 571 618 664
120% 88.8 328 377 425 474 523 571 620 669 717 Net returns above total specified costs for an owner operator is calculated here as market revenue less total specified costs. Specified costs include charges for direct costs and fixed machinery costs but excludes charges for land, general farm overhead and management expenses.

31
Table 7.D1 Estimated Net Returns above Direct Costs for a Tenant Operator Rice, Conventional Variety, Drill Planted, Conventional Tillage, Northeast Louisiana, 2020.
Percent
80% 85% 90% 95% 100% 105% 110% 115% 120%
Yield
Rice Market Price ($/cwt)
Percent (cwt.) $9.60 $10.20 $10.80 $11.40 $12.00 $12.60 $13.20 $13.80 $14.40
--------------------------------- ($/acre) ----------------------------------
80% 59.2 49 71 92 114 136 157 179 200 222
85% 62.9 74 97 120 144 167 190 213 236 259
90% 66.6 99 124 148 173 198 222 247 272 297
95% 70.3 124 150 176 203 229 255 281 308 334
100% 74.0 149 176 204 232 260 288 316 343 371
105% 77.7 173 203 232 262 291 320 350 379 409
110% 81.4 198 229 260 291 322 353 384 415 446
115% 85.1 223 256 288 321 353 386 418 451 483
120% 88.8 248 282 316 350 384 418 452 486 520 Net returns above direct costs for a tenant operator is calculated here as the grower’s share of market revenue less direct production costs paid by the grower. Direct costs include charges for variable production costs for items such as seed, fertilizer, chemicals, fuel, labor, repair and custom application expenses. The land rental arrangement charge represented here is a 30% crop share with the landlord paying variable and fixed irrigation pumping costs.
Table 7.D2 Estimated Net Returns above Total Specified Costs for a Tenant Operator Rice, Conventional Variety, Drill Planted, Conventional Tillage, Northeast Louisiana, 2020.
Percent
80% 85% 90% 95% 100% 105% 110% 115% 120%
Yield
Rice Market Price ($/cwt)
Percent (cwt.) $9.60 $10.20 $10.80 $11.40 $12.00 $12.60 $13.20 $13.80 $14.40
--------------------------------- ($/acre) ----------------------------------
80% 59.2 -20 2 23 45 67 88 110 131 153
85% 62.9 5 28 51 74 98 121 144 167 190
90% 66.6 30 55 79 104 129 153 178 203 228
95% 70.3 55 81 107 134 160 186 212 239 265
100% 74.0 80 107 135 163 191 219 247 274 302
105% 77.7 104 134 163 193 222 251 281 310 340
110% 81.4 129 160 191 222 253 284 315 346 377
115% 85.1 154 187 219 252 284 317 349 382 414
120% 88.8 179 213 247 281 315 349 383 417 451 Net returns above total specified costs for a tenant operator is calculated here as the grower’s share of market revenue less total specified costs paid by the grower. Specified costs include charges for direct costs and fixed machinery costs but exclude charges for general farm overhead and management expenses. The land rental arrangement charge represented here is a 30% crop share with the landlord paying variable and fixed irrigation pumping costs.

32
Table 8.A Estimated costs per acre, Rice, Clearfield Variety, Drill Planted, Conventional Tillage, Northest Louisiana, 2020. _______________________________________________________________________ ITEM UNIT PRICE QUANTITY AMOUNT YOUR FARM _______________________________________________________________________ dollars dollars DIRECT EXPENSES CUSTOM SPRAY LARice GPS Charge_NE acre 0.25 8.0000 2.00 _________ App by Air ( 5 gal) appl 6.50 5.0000 32.50 _________ GIN/DRY LARice Dry cwt 0.90 82.1000 73.89 _________ FERTILIZERS LA Nitrogen lb 0.41 170.0000 69.70 _________ FUNGICIDES Quadris oz 1.25 10.0000 12.50 _________ HERBICIDES Newpath 2SL oz 3.73 8.0000 29.84 _________ Aim 2EC oz 5.00 1.6000 8.00 _________ INSECTICIDES Karate Z oz 3.40 4.0000 13.60 _________ IRRIGATION SUPPLIES Rice Gates each 3.65 1.0000 3.65 _________ SEED/PLANTS Rice Clearfield 161 lb 1.13 75.0000 84.75 _________ SERVICE FEE Digital Ag Fee acre 8.50 1.0000 8.50 _________ CUSTOM FERT/LIME App Fert by Air cwt 7.00 3.7000 25.90 _________ CUSTOM HARVEST/HAUL LARice Haul cwt 0.30 74.0000 22.20 _________ HAND LABOR Implements hour 9.06 0.0942 0.85 _________ LA OPERATOR LABOR Self-Propelled hour 15.30 0.3303 5.05 _________ LA Hired Labor Tractors hour 11.33 0.7537 8.55 _________ LA Irrigation Labor Irrigation System 5 hour 11.33 0.4361 4.95 _________ DIESEL FUEL Tractors gal 2.44 6.7604 16.50 _________ Self-Propelled gal 2.44 2.5825 6.30 _________ Irrigation System 5 gal 2.44 28.5331 69.63 _________ REPAIR & MAINTENANCE Implements acre 5.89 1.0000 5.89 _________ Tractors acre 4.00 1.0000 4.00 _________ Self-Propelled acre 14.53 1.0000 14.53 _________ Irrigation System 5 acre 2.17 1.0000 2.17 _________ INTEREST ON OP. CAP. acre 9.01 1.0000 9.01 _________ --------- TOTAL DIRECT EXPENSES 534.46 _________ FIXED EXPENSES Implements acre 13.95 1.0000 13.95 _________ Tractors acre 26.87 1.0000 26.87 _________ Self-Propelled acre 23.62 1.0000 23.62 _________ Irrigation System 5 acre 14.73 1.0000 14.73 _________ --------- TOTAL FIXED EXPENSES 79.17 _________ --------- TOTAL SPECIFIED EXPENSES 613.63 _________ _______________________________________________________________________

33
Table 8.B Estimated resource use and costs for field operations, per acre, Rice, Clearfield Variety, Drill Plant, Conventional Tillage, (In Rotation), Northeast Louisiana, 2020. _______________________________________________________________________________________________________________________________________________ POWER UNIT COST EQUIPMENT COST ALLOC LABOR OPERATING/DURABLE INPUT OPERATION/ SIZE/ POWER UNIT PERF TIMES -------------- -------------- ------------- ----------------------- TOTAL OPERATING INPUT UNIT SIZE RATE OVER MTH DIRECT FIXED DIRECT FIXED HOURS COST AMOUNT PRICE COST COST _______________________________________________________________________________________________________________________________________________ ------------dollars----------- dollars ---------dollars--------- Disk Harrow 28' MFWD 190 0.070 1.00 Nov 2.08 2.82 1.05 2.41 0.07 0.79 9.15 Ditcher MFWD 150 0.020 1.00 Nov 0.47 0.57 0.05 0.07 0.02 0.23 1.39 Disk Harrow 28' MFWD 190 0.070 2.00 Mar 4.18 5.64 2.10 4.82 0.14 1.59 18.33 Irrigation System 5 Mar Ditcher MFWD 150 0.020 1.00 Mar 0.47 0.57 0.05 0.07 0.02 0.23 1.39 Field Cultivate 32' MFWD 190 0.046 1.00 Mar 1.39 1.88 0.50 2.30 0.04 0.53 6.60 LARice Levee Plow 8 ft MFWD 190 0.050 4.00 Mar 5.95 8.04 0.31 0.80 0.20 2.27 17.37 App Fert by Air cwt 1.00 Apr 0.4000 7.00 2.80 2.80 LA Nitrogen lb 20.0000 0.41 8.20 8.20 LARice GPS Charge_NE acre 1.0000 0.25 0.25 0.25 Grain Drill 20' MFWD 150 0.094 1.00 Apr 2.19 2.70 1.39 2.91 0.18 1.92 11.11 Rice Clearfield 161 lb 75.0000 1.13 84.75 84.75 Blade-Scraper 10' MFWD 150 1.176 0.09 Apr 2.45 3.03 0.18 0.16 0.10 1.20 7.02 Ditcher MFWD 150 0.020 1.00 Apr 0.47 0.57 0.05 0.07 0.02 0.23 1.39 Rice Gates each 1.00 Apr 1.0000 3.65 3.65 3.65 LARice Backhoe-Rrmnt 2 ft MFWD 150 0.500 0.05 Apr 0.58 0.72 0.13 0.19 0.02 0.28 1.90 App by Air ( 5 gal) appl 1.00 Apr 1.0000 6.50 6.50 6.50 Newpath 2SL oz 4.0000 3.73 14.92 14.92 LARice GPS Charge_NE acre 1.0000 0.25 0.25 0.25 App by Air ( 5 gal) appl 1.00 Apr 1.0000 6.50 6.50 6.50 Karate Z oz 2.0000 3.40 6.80 6.80 LARice GPS Charge_NE acre 1.0000 0.25 0.25 0.25 App by Air ( 5 gal) appl 1.00 May 1.0000 6.50 6.50 6.50 Newpath 2SL oz 4.0000 3.73 14.92 14.92 Aim 2EC oz 1.6000 5.00 8.00 8.00 LARice GPS Charge_NE acre 1.0000 0.25 0.25 0.25 App Fert by Air cwt 1.00 May 2.0000 7.00 14.00 14.00 LA Nitrogen lb 90.0000 0.41 36.90 36.90 LARice GPS Charge_NE acre 1.0000 0.25 0.25 0.25 App Fert by Air cwt 1.00 Jun 1.3000 7.00 9.10 9.10 LA Nitrogen lb 60.0000 0.41 24.60 24.60 LARice GPS Charge_NE acre 1.0000 0.25 0.25 0.25 App by Air ( 5 gal) appl 1.00 Jun 1.0000 6.50 6.50 6.50 Quadris oz 10.0000 1.25 12.50 12.50 LARice GPS Charge_NE acre 1.0000 0.25 0.25 0.25 App by Air ( 5 gal) appl 1.00 Jul 1.0000 6.50 6.50 6.50 Karate Z oz 2.0000 3.40 6.80 6.80 LARice GPS Charge_NE acre 1.0000 0.25 0.25 0.25 LA Rice Combine 25 ft 0.300 1.00 Aug 20.83 23.62 0.33 5.05 49.50 Rice Grain Cart 500 Bu MFWD 150 0.057 0.20 Aug 0.27 0.33 0.08 0.15 0.01 0.13 0.96 LARice Haul cwt 1.00 Aug 74.0000 0.30 22.20 22.20 LARice Dry cwt 1.00 Aug 82.1000 0.90 73.89 73.89 Digital Ag Fee acre 1.00 Aug 1.0000 8.50 8.50 8.50 Irrigation System 5 acre Mar 71.80 14.73 0.43 4.95 1.0000 91.48 ------- ------- ------- ------- ------ ------- ------- -------- TOTALS 41.33 50.49 77.69 28.68 1.61 19.40 387.03 604.62 INTEREST ON OPERATING CAPITAL 9.01 UNALLOCATED LABOR 0.00 TOTAL SPECIFIED COST 613.63 _______________________________________________________________________________________________________________________________________________

34
Table 8.C1 Estimated Net Returns above Direct Costs for an Owner Operator Rice, Clearfield Variety, Drill Planted, Conventional Tillage, Northeast Louisiana, 2020.
Percent
80% 85% 90% 95% 100% 105% 110% 115% 120%
Yield
Rice Market Price ($/cwt)
Percent (cwt.) $9.60 $10.20 $10.80 $11.40 $12.00 $12.60 $13.20 $13.80 $14.40
--------------------------------- ($/acre) ----------------------------------
80% 59.2 53 83 114 145 175 206 237 267 298
85% 62.9 88 121 154 187 220 253 285 318 351
90% 66.6 124 159 194 229 264 299 334 369 405
95% 70.3 159 196 234 271 308 346 383 420 458
100% 74.0 195 234 274 313 353 392 432 472 511
105% 77.7 230 272 314 355 397 439 481 523 564
110% 81.4 266 310 354 398 442 486 530 574 618
115% 85.1 301 347 394 440 486 532 578 625 671
120% 88.8 337 385 434 482 530 579 627 676 724 Net returns above direct costs for an owner operator is calculated here as market revenue less direct production costs. Direct costs include charges for variable production costs for items such as seed, fertilizer, chemicals, fuel, labor, repair and custom application expenses.
Table 8.C2 Estimated Net Returns above Total Specified Costs for an Owner Operator Rice, Clearfield Variety, Drill Planted, Conventional Tillage, Northeast Louisiana, 2020.
Percent
80% 85% 90% 95% 100% 105% 110% 115% 120%
Yield
Rice Market Price ($/cwt)
Percent (cwt.) $9.60 $10.20 $10.80 $11.40 $12.00 $12.60 $13.20 $13.80 $14.40
--------------------------------- ($/acre) ----------------------------------
80% 59.2 -27 4 35 65 96 127 157 188 219
85% 62.9 9 42 75 108 140 173 206 239 272
90% 66.6 44 80 115 150 185 220 255 290 325
95% 70.3 80 117 155 192 229 267 304 341 379
100% 74.0 115 155 195 234 274 313 353 392 432
105% 77.7 151 193 235 276 318 360 402 443 485
110% 81.4 186 230 274 318 362 406 450 494 538
115% 85.1 222 268 314 361 407 453 499 546 592
120% 88.8 258 306 354 403 451 500 548 597 645 Net returns above total specified costs for an owner operator is calculated here as market revenue less total specified costs. Specified costs include charges for direct costs and fixed machinery costs but excludes charges for land, general farm overhead and management expenses.

35
Table 8.D1 Estimated Net Returns above Direct Costs for a Tenant Operator Rice, Clearfield Variety, Drill Planted, Conventional Tillage, Northeast Louisiana, 2020.
Percent
80% 85% 90% 95% 100% 105% 110% 115% 120%
Yield
Rice Market Price ($/cwt)
Percent (cwt.) $9.60 $10.20 $10.80 $11.40 $12.00 $12.60 $13.20 $13.80 $14.40
--------------------------------- ($/acre) ----------------------------------
80% 59.2 -25 -4 18 39 61 82 104 125 147
85% 62.9 0 23 46 69 92 115 138 161 184
90% 66.6 25 49 74 98 123 148 172 197 221
95% 70.3 49 76 102 128 154 180 206 232 259
100% 74.0 74 102 130 157 185 213 240 268 296
105% 77.7 99 128 158 187 216 245 275 304 333
110% 81.4 124 155 186 216 247 278 309 340 370
115% 85.1 149 181 214 246 278 311 343 375 408
120% 88.8 174 208 242 276 309 343 377 411 445 Net returns above direct costs for a tenant operator is calculated here as the grower’s share of market revenue less direct production costs paid by the grower. Direct costs include charges for variable production costs for items such as seed, fertilizer, chemicals, fuel, labor, repair and custom application expenses. The land rental arrangement charge represented here is a 30% crop share with the landlord paying variable and fixed irrigation pumping costs.
Table 8.D2 Estimated Net Returns above Total Specified Costs for a Tenant Operator Rice, Clearfield Variety, Drill Planted, Conventional Tillage, Northeast Louisiana, 2020.
Percent
80% 85% 90% 95% 100% 105% 110% 115% 120%
Yield
Rice Market Price ($/cwt)
Percent (cwt.) $9.60 $10.20 $10.80 $11.40 $12.00 $12.60 $13.20 $13.80 $14.40
--------------------------------- ($/acre) ----------------------------------
80% 59.2 -90 -68 -47 -25 -4 18 39 61 82
85% 62.9 -65 -42 -19 4 27 50 73 97 120
90% 66.6 -40 -15 9 34 59 83 108 132 157
95% 70.3 -15 11 37 63 90 116 142 168 194
100% 74.0 10 38 65 93 121 148 176 204 231
105% 77.7 35 64 93 122 152 181 210 239 269
110% 81.4 60 90 121 152 183 214 244 275 306
115% 85.1 84 117 149 182 214 246 279 311 343
120% 88.8 109 143 177 211 245 279 313 347 381 Net returns above total specified costs for a tenant operator is calculated here as the grower’s share of market revenue less total specified costs paid by the grower. Specified costs include charges for direct costs and fixed machinery costs but exclude charges for general farm overhead and management expenses. The land rental arrangement charge represented here is a 30% crop share with the landlord paying variable and fixed irrigation pumping costs.

36
Appendix Table 1. Rice Irrigation System 1 Costs, Water Planted, Southwest Louisiana, 2020. _________________________________________________________________________________________________________ OPERATION/ SIZE/ -------------------------DIRECT COST-------------------- FIXED TOTAL OPERATING INPUT UNIT OP INPUT FUEL R&M LABOR LEASE INTER TOTAL COST COST _________________________________________________________________________________________________________ ---------------------------------dollars-------------------------------- Underground Pipe 1 each 12.68 12.68 Gearhead 1 each 2.26 2.26 Engine 1 each 8.90 8.90 Application 1 Ac-in 12.82 0.60 0.39 0.60 14.41 14.41 Application 2 Ac-in 12.82 0.60 0.39 0.54 14.35 14.35 Application 3 Ac-in 16.03 0.75 0.49 0.60 17.87 17.87 Application 4 Ac-in 19.23 0.90 0.59 0.63 21.35 21.35 Application 5 Ac-in 19.23 0.90 0.59 0.54 21.26 21.26 Well 1 each 7.51 7.51 Pump 1 each 7.11 7.11 ------- ------- ------- ------- ------- ------- ------- ------- ------- TOTALS 0.00 80.13 3.75 2.45 0.00 2.91 89.24 38.46 127.70 _________________________________________________________________________________________________________ Note: Total irrigation application of 25 acre-inches. Appendix Table 2. Rice Irrigation System 2 Costs, Drill Planted, Southwest Louisiana, 2020. _________________________________________________________________________________________________________ OPERATION/ SIZE/ -------------------------DIRECT COST-------------------- FIXED TOTAL OPERATING INPUT UNIT OP INPUT FUEL R&M LABOR LEASE INTER TOTAL COST COST _________________________________________________________________________________________________________ ---------------------------------dollars-------------------------------- Pump 2 each 7.11 7.11 Gearhead 2 each 2.26 2.26 Engine 2 each 8.90 8.90 Application 1 Ac-in 9.62 0.40 0.26 0.45 10.73 10.73 Application 2 Ac-in 9.62 0.40 0.26 0.45 10.73 10.73 Application 3 Ac-in 16.03 0.67 0.44 0.67 17.81 17.81 Application 4 Ac-in 16.03 0.67 0.44 0.60 17.74 17.74 Application 5 Ac-in 19.23 0.80 0.52 0.63 21.18 21.18 Application 6 Ac-in 16.03 0.67 0.44 0.45 17.59 17.59 Well 2 each 7.51 7.51 Underground Pipe 2 each 12.68 12.68 ------- ------- ------- ------- ------- ------- ------- ------- ------- TOTALS 0.00 86.56 3.61 2.36 0.00 3.25 95.78 38.46 134.24 _________________________________________________________________________________________________________ Note: Total irrigation application of 28 acre-inches. Appendix Table 3. Rice Irrigation System 3 Costs, Ratoon Crop, Southwest Louisiana, 2020. _________________________________________________________________________________________________________ OPERATION/ SIZE/ -------------------------DIRECT COST-------------------- FIXED TOTAL OPERATING INPUT UNIT OP INPUT FUEL R&M LABOR LEASE INTER TOTAL COST COST _________________________________________________________________________________________________________ ---------------------------------dollars-------------------------------- Engine 1a each Application 1 Ac-in 22.44 0.68 0.51 23.63 23.63 Application 2 Ac-in 9.62 0.29 0.17 10.08 10.08 ------- ------- ------- ------- ------- ------- ------- ------- ------- TOTALS 0.00 32.06 0.00 0.97 0.00 0.68 33.71 0.00 33.71 _________________________________________________________________________________________________________ Note: Total irrigation application of 10 acre-inches. Appendix Table 4. Rice Irrigation System 5 Costs, Drill Planted, Northeast Louisiana, 2020. _________________________________________________________________________________________________________ OPERATION/ SIZE/ -------------------------DIRECT COST-------------------- FIXED TOTAL OPERATING INPUT UNIT OP INPUT FUEL R&M LABOR LEASE INTER TOTAL COST COST _________________________________________________________________________________________________________ ---------------------------------dollars-------------------------------- Engine 3 each 4.37 4.37 Application 1 Ac-in 6.74 0.21 0.48 0.29 7.72 7.72 Application 2 Ac-in 6.74 0.21 0.48 0.29 7.72 7.72 Application 3 Ac-in 11.23 0.35 0.80 0.43 12.81 12.81 Application 4 Ac-in 11.23 0.35 0.80 0.38 12.76 12.76 Application 5 Ac-in 22.46 0.70 1.59 0.65 25.40 25.40 Application 6 Ac-in 11.23 0.35 0.80 0.27 12.65 12.65 Pump 3 each 3.75 3.75 Underground Pipe 3 each 2.92 2.92 Well 3 each 2.50 2.50 Gearhead 3 each 1.19 1.19 ------- ------- ------- ------- ------- ------- ------- ------- ------- TOTALS 0.00 69.63 2.17 4.95 0.00 2.31 79.06 14.73 93.79 _________________________________________________________________________________________________________ Note: Total irrigation application of 31 acre-inches

37
Appendix Table 5. Operating Inputs: Estimated Prices for 2020. ______________________________________________________________________________________________ ITEM NAME UNIT PRICE ______________________________________________________________________________________________ dollars CUSTOM HARVEST/HAUL Custom Combine Rice acre 0.00 Haul Corn bu 0.23 Haul Cotton lb 0.02 Haul Rice bu 0.35 Haul Rice (cwt) cwt 0.25 Haul Sorghum bu 0.25 Haul Soybeans bu 0.27 Haul Wheat bu 0.26 LARice Haul cwt 0.30 CUSTOM PLANT Custom Spread + Seed appl 0.00 LARice Air Plant NE cwt 5.50 LARice Air Plant SW cwt 5.60 Plant by Air cwt 7.00 CUSTOM SPRAY App 2,4-D Helicopter appl 0.00 App by Air ( 1 gal) appl 2.50 App by Air ( 2 gal) appl 4.00 App by Air ( 3 gal) appl 5.00 App by Air ( 5 gal) appl 6.50 App by Air (10 gal) appl 9.00 App Furadan by Air appl 0.00 App Ordram by Air appl 0.00 Custom Apply acre 7.50 Custom Terragator acre 5.00 LARice GPS Charge-SW acre 0.35 LARice GPS Charge_NE acre 0.25 Spray Levees, 4whlr acre 0.00 FERTILIZERS Amm Nitrate (34% N) cwt 22.50 Amm Sulfate (21% N) cwt 13.43 Anhy Ammonia (82% N) cwt 28.00 Boron (Solubor) lb 0.75 Crop Oil ( Seed Oil) pt 3.00 DAP cwt 22.64 Fert 0-20-20 cwt 0.00 Fert 10-10-10 cwt 0.00 Fert 10-34-0 cwt 22.25 Fert 10-34-0 gal 2.59 Fert 13-13-13 cwt 0.00 Fert 41-0-0-4 cwt 13.50 Fert 5-20-20 cwt 0.00 LA Nitrogen lb 0.41 LA Phosphate lb 0.38 LA Potash lb 0.27 Phosphorus(46% P2O5) cwt 23.75 Potash (60% K2O) cwt 20.00 Sulfur lb 0.34 UAN (32% N) cwt 13.62 UAN + Sulfur (28% N) cwt 12.55 Urea, Solid (46% N) cwt 20.22 Zinc lb 0.50 FUNGICIDES Apron Maxx RTA oz 1.66 Apron XL oz 6.98 Apron XL LS oz 5.27 Benlate 50 WP lb 15.95 Captan 4L pt 2.83 Captan 50 WP lb 4.28 Crop Oil (Petroleum) pt 3.00 Cruiser 5FS oz 4.18 Delta Coat AD oz 3.75 Dithane F-45 qt 7.81 Dithane Rainsheild lb 4.08 Fungicide lb 2.82 Gem 25 WG oz 3.70 Manzate 75 DF lb 4.86 Manzate Flowable pt 4.60 Moncut 70 DF lb 32.81 Orbit oz 2.75 Prevail lb 28.50 Quadris oz 1.25

38
Appendix Table 5. Operating inputs: estimated prices Louisiana, 2020. ___________________________________________________________________________ ITEM NAME UNIT PRICE ___________________________________________________________________________ dollars Ridomil Gold PC lb 5.30 Ridomil Gold PC Liq oz 6.42 Rovral 4F pt 14.90 Rovral WG lb 0.00 Shelter oz 8.50 Stiletto oz 0.58 Stratego pt 60.00 Terrachlor Flowable pt 4.74 Terraclor 2EC pt 1.87 Terraclor Super X EC pt 3.95 Terraclor Super X G lb 2.82 Tilt 3.6 EC oz 0.72 Vitavax 200 oz 0.47 Vitavax M Flowable oz 1.06 Vitavax RTU-Thiram oz 0.40 Vitavax T-L oz 0.29 GIN/DRY Dry Corn bu 0.19 Dry Grain Sorghum cwt 0.25 Dry Rice bu 0.40 Dry Rice (cwt) cwt 0.90 Gin lb 0.11 LARice Dry cwt 0.90 GROWTH REGULATORS Early Harvest PGR oz 1.55 LA Polado oz 0.18 Mepex oz 0.07 PGR IV oz 1.55 Pix Plus oz 0.40 Pix Ultra oz 0.21 HARVEST AIDS Accelerate pt 2.59 Ammonium Sulfate lb 0.24 Boll'd pt 7.01 CottonQuik pt 6.06 Def 6 pt 7.55 Def/Folex pt 7.55 Dropp 50 WP lb 45.45 Dropp SC oz 1.09 Ethephon 6E pt 2.90 Finish 6 pt 9.37 Folex 6EC pt 8.61 Ginstar EC pt 21.44 Gramoxone Extra pt 4.86 Gramoxone Inteon oz 0.26 Gramoxone Max pt 4.16 Harvade 5F oz 0.67 Leafless pt 18.56 Prep pt 3.75 Sodium Chlorate 3L gal 3.50 Solium Chlorate 6L gal 5.57 Starfire pt 0.00 HERBICIDES 2,4-D Amine 4 pt 1.85 2,4-D Ester pt 4.17 AAtrex 4L pt 2.24 AAtrex NINE-O lb 3.96 Accent Gold oz 6.12 Accent SP oz 36.25 Aim 2EC oz 5.00 Aim DF oz 9.65 App Fert by Air cwt 7.00 Arrosolo qt 7.88 Assure II oz 0.74 Atrazine 4L pt 1.50 Atrazine 90DF lb 7.52 Authority 75DF lb 26.95 Axiom 68DF lb 25.74 Backdraft pt 2.40 Banvel pt 15.04 Basagran pt 5.43 Basis Gold lb 9.00

39
Appendix Table 5. Operating inputs: estimated prices Louisiana, 2020. ___________________________________________________________________________ ITEM NAME UNIT PRICE ___________________________________________________________________________ dollars Beacon 75% WSP oz 34.87 Beyond oz 4.48 Bicep II Magnum qt 11.01 Bicep II zmsgnum qt 10.97 Bladex 4L qt 0.00 Bladex 90DF lb 0.00 Blazer 2L pt 0.00 Blazer Ultra pt 9.79 Boa pt 3.63 Bolero 8EC pt 7.73 Boundary pt 8.84 Buctril 4EC pt 17.06 Butoxone 175(2,4-DB) pt 3.24 Butoxone 200(2,4-DB) pt 3.92 Butyrac 175 (2,4-DB) pt 3.29 Butyrac 200 (2,4-DB) pt 3.49 Canopy 75% oz 2.74 Canopy XL oz 2.23 Caparol 4L pt 4.59 Caparol Accu-Pak lb 0.00 Celebrity Plus lb 84.50 Clarity pt 11.60 Classic oz 14.02 Clincher EC oz 1.95 Cobra 2EC oz 1.72 Command 3ME pt 16.09 Command XTRA pt 0.00 Conclude Ultra pt 0.00 Conclude Ultra pt 0.00 Conclude XACT pt 11.32 Conclude XTRA pt 8.32 Cornerstone pt 2.50 Cotoran 4L pt 5.75 Cotoran DF lb 7.92 Cotton Pro Flowable pt 3.75 Crossbow pt 8.05 Cy-Pro 4L qt 0.00 Cypro 90DF lb 0.00 Delta Goal pt 9.44 Denim 0.16 EC pt 24.06 Detail pt 7.99 Direx 4L pt 3.99 Direx 80 DF lb 6.20 Diuron 4L pt 3.90 Diuron 80 DF lb 5.09 Domain 60DF lb 12.75 DSMA 4 pt 0.90 Dual 8E pt 0.00 Dual II Magnum pt 14.50 Dual Magnum pt 13.81 Duet pt 5.39 Evik DF 80W lb 11.22 Exceed oz 10.71 Exceed Custom Pak oz 11.50 Expert pt 4.39 Facet 75DF lb 50.00 First Rate oz 43.40 Flexstar HL pt 4.50 FloMet 4L pt 4.74 Freedom qt 2.51 Front Row oz 21.92 Frontier 6.0 oz 0.63 Fultime pt 6.29 Fusilade DX oz 1.06 Fusion pt 29.86 Glyfos pt 1.80 Glyphomax pt 3.49 Glyphosate Plus 4L pt 2.00 Glystar Plus pt 2.17 Goal 2XL pt 7.77 Gramoxone Extra pt 0.00 Gramoxone Max pt 3.00 Gramoxone Max pt 3.00

40
Appendix Table 5. Operating inputs: estimated prices Louisiana, 2020. ___________________________________________________________________________ ITEM NAME UNIT PRICE ___________________________________________________________________________ dollars Grandstand R qt 17.15 Guardsman pt 4.66 Guardsman Max pt 7.22 Harmony Extra oz 14.43 Hoelon 3EC pt 11.03 Karmex DF lb 5.93 LA Asulox/Asulam gal 42.20 LA Weedmaster qt 5.75 Lariat qt 7.58 Lasso 4EC qt 6.60 Lasso II 15G lb 0.00 Layby Pro qt 12.60 Lexone 75DF lb 18.90 Liberty pt 8.84 Lightning oz 14.25 Lightning oz 14.25 Linex 4L pt 9.28 Londax 60DF oz 18.08 Lorox 50DF lb 24.12 Matador pt 0.00 MSMA 6.6 pt 3.68 MSMA6 + Surfactant pt 3.63 Newpath 2SL oz 3.73 Ordram 15-G lb 1.34 Ordram 8-E pt 9.42 Outlook pt 17.47 Pendimax 3.3 pt 2.47 Permit 75DF oz 14.50 Poast 1.53 pt 12.77 Poast Plus pt 9.69 Propanil 4E qt 5.15 Prowl 3.3 EC pt 5.30 Pursuit DG oz 11.59 Pursuit Plus EC pt 7.10 Python WDG oz 15.10 Raptor oz 4.38 Reflex 2LC pt 6.52 Regiment 80WP oz 4.38 Remedy pt 8.45 Resource .86EC pt 29.40 Ricestar pt 24.35 Roundup Original pt 6.00 Roundup Original Max oz 0.38 Roundup Power Max pt 3.20 Roundup Ultra MAX pt 5.97 Roundup Ultra Dry lb 6.14 Roundup WeatherMax oz 0.26 Scepter 70 DG oz 4.50 Select 2EC oz 0.70 Sencor 4F pt 14.74 Sencor DF lb 18.00 Squadron CE pt 12.50 Stam 4E qt 5.12 Stam 80 EDF lb 9.64 Staple 85% oz 16.01 Staple Plus oz 8.55 Steadfast oz 12.26 Steel pt 10.28 Storm pt 11.58 Strongarm oz 56.42 Superwham qt 9.27 Suprend lb 10.14 Surpass 20G lb 2.36 Surpass EC qt 26.36 Touchdown qt 9.32 Touchdown 4 IQ pt 3.33 Touchdown Total qt 6.97 Treflan HFP pt 3.37 Treflan TR-10 lb 1.10
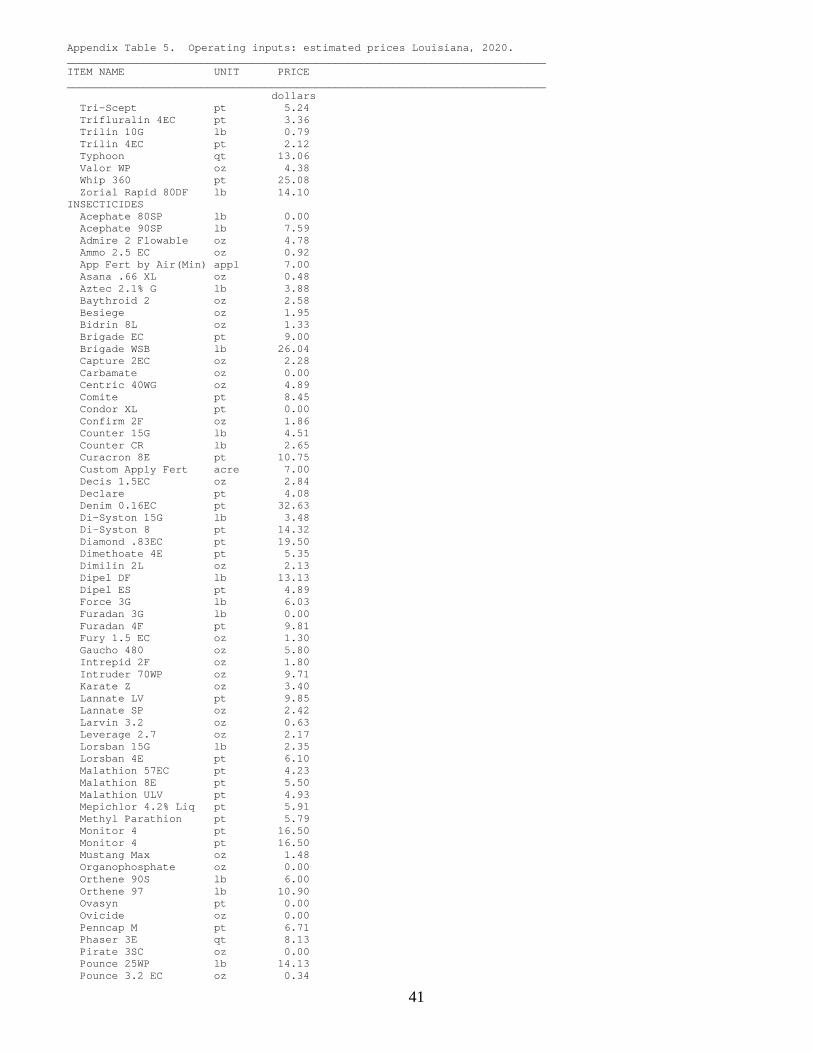
41
Appendix Table 5. Operating inputs: estimated prices Louisiana, 2020. ___________________________________________________________________________ ITEM NAME UNIT PRICE ___________________________________________________________________________ dollars Tri-Scept pt 5.24 Trifluralin 4EC pt 3.36 Trilin 10G lb 0.79 Trilin 4EC pt 2.12 Typhoon qt 13.06 Valor WP oz 4.38 Whip 360 pt 25.08 Zorial Rapid 80DF lb 14.10 INSECTICIDES Acephate 80SP lb 0.00 Acephate 90SP lb 7.59 Admire 2 Flowable oz 4.78 Ammo 2.5 EC oz 0.92 App Fert by Air(Min) appl 7.00 Asana .66 XL oz 0.48 Aztec 2.1% G lb 3.88 Baythroid 2 oz 2.58 Besiege oz 1.95 Bidrin 8L oz 1.33 Brigade EC pt 9.00 Brigade WSB lb 26.04 Capture 2EC oz 2.28 Carbamate oz 0.00 Centric 40WG oz 4.89 Comite pt 8.45 Condor XL pt 0.00 Confirm 2F oz 1.86 Counter 15G lb 4.51 Counter CR lb 2.65 Curacron 8E pt 10.75 Custom Apply Fert acre 7.00 Decis 1.5EC oz 2.84 Declare pt 4.08 Denim 0.16EC pt 32.63 Di-Syston 15G lb 3.48 Di-Syston 8 pt 14.32 Diamond .83EC pt 19.50 Dimethoate 4E pt 5.35 Dimilin 2L oz 2.13 Dipel DF lb 13.13 Dipel ES pt 4.89 Force 3G lb 6.03 Furadan 3G lb 0.00 Furadan 4F pt 9.81 Fury 1.5 EC oz 1.30 Gaucho 480 oz 5.80 Intrepid 2F oz 1.80 Intruder 70WP oz 9.71 Karate Z oz 3.40 Lannate LV pt 9.85 Lannate SP oz 2.42 Larvin 3.2 oz 0.63 Leverage 2.7 oz 2.17 Lorsban 15G lb 2.35 Lorsban 4E pt 6.10 Malathion 57EC pt 4.23 Malathion 8E pt 5.50 Malathion ULV pt 4.93 Mepichlor 4.2% Liq pt 5.91 Methyl Parathion pt 5.79 Monitor 4 pt 16.50 Monitor 4 pt 16.50 Mustang Max oz 1.48 Organophosphate oz 0.00 Orthene 90S lb 6.00 Orthene 97 lb 10.90 Ovasyn pt 0.00 Ovicide oz 0.00 Penncap M pt 6.71 Phaser 3E qt 8.13 Pirate 3SC oz 0.00 Pounce 25WP lb 14.13 Pounce 3.2 EC oz 0.34

42
Appendix Table 5. Operating inputs: estimated prices Louisiana, 2020. ___________________________________________________________________________ ITEM NAME UNIT PRICE ___________________________________________________________________________ dollars Prevathon oz 1.32 Provado 1.6F oz 1.94 Scout X-TRA oz 0.00 Sevin 80S lb 7.40 Sevin XLR Plus qt 13.23 Spintor 2SC oz 4.93 Steward pt 39.51 Surfactant pt 1.75 Synthetic Pyrethroid oz 0.00 Temik 15G Grit lb 4.00 Thimet 20-G lb 3.65 Thionex 3EC pt 4.17 Thionex 50W lb 10.45 Tracer oz 9.73 Trimax oz 1.85 Vydate C-LV oz 0.93 Warrior Z oz 1.80 Warrior ZT oz 2.57 IRRIGATION SUPPLIES Rice Gates each 3.65 Roll-Out Pipe ft 0.25 OVERHEAD Farmstead & Drainage Dol 1.00 LARice Insurance Dollar 1.00 LARice Misc. Overhd dollar 1.00 LARice Property Tax dollar 1.00 Shops Bldg & Equip. Dol 6.55 SERVICE FEE Utilities Dol 1.00 SEED/PLANTS Corn Seed Bt thous 2.60 Corn Seed BtRR thous 3.63 Corn Seed Conv. thous 2.89 Corn Seed RR thous 3.43 Corn Seed VT3 thous 3.91 Corn Seed VT3Pro thous 3.91 Cotton Seed BG/RR thous 0.62 Cotton Seed BGII/RRF thous 2.61 Cotton Seed Bt thous 2.60 Cotton Seed BtRR thous 2.60 Cotton Seed Bxn thous 0.00 Cotton Seed Conv. thous 0.00 Cotton Seed Liberty thous 1.05 Cotton Seed Liberty thous 1.05 Cotton Seed RR thous 0.63 Cotton Seed RR thous 0.63 Cotton Seed WS thous 0.49 Cotton Seed WS/RR thous 0.00 Cotton Seed WS/RRF thous 0.59 Rice Clearfield 161 lb 1.13 Rice Clearfield XL8 lb 6.12 Rice Seed (Levees) lb 0.90 Rice Seed CF(Levees) lb 0.95 Rice Seed Conv. lb 0.30 Rice Seed Hybrid lb 5.66 SC Cultured seedcane acre 484.00 Sorghum Concept lb 3.94 Sorghum Hybrid Sudax lb 1.20 Sorghum NonConcept lb 1.18 Soybean Seed LL lb 1.16 Soybean Seed Private lb 0.38 Soybean Seed Public lb 0.00 Soybean Seed RR lb 1.30 Soybean Seed Stack lb 1.28 Wheat Seed Private lb 0.24 Wheat Seed Public lb 0.00

43
Appendix Table 5. Operating inputs: estimated prices Louisiana, 2020. ___________________________________________________________________________ ITEM NAME UNIT PRICE ___________________________________________________________________________ dollars SERVICE FEE Cotton Checkoff bale 2.56 Cotton Storage bale 25.00 Crop Consultant acre 7.00 Custom Spread(Truc appl 4.50 Digital Ag Fee acre 8.50 Insect Scouting acre 7.00 Lime (Spread) ton 38.00 Rice Consultant acre 8.00 RRF Cotton Tech Fee cap/ac 48.25 SC Treating Charge acre 0.00 Survey & Mark Levees acre 4.50 Survey & Mark Levees acre 4.50 TECHNOLOGY FEE BG Cot Tech Fee thous 0.28 BG Cot Tech Fee cap/ac 19.50 BG II Cot Tech Fee thous 0.76 BG II Cot Tech Fee cap/ac 31.91 BG II/RR Tech Fee thous 1.49 BG II/RR Tech Fee cap/ac 62.69 BGII/RRF Cot Tech Fe thous 1.49 BGII/RRF Cot Tech Fe cap/ac 62.69 Eradication Fee acre 6.00 Eradication Zone 1 acre 6.00 Eradication Zone 1A acre 6.00 Eradication Zone 1B acre 6.00 Eradication Zone 2 acre 6.00 Eradication Zone 3 acre 6.00 Eradication Zone 4 acre 6.00 RR Cotton Tech Fee thous 1.04 RR Cotton Tech Fee cap/ac 43.66 RR Cotton Tech Fee thous 1.04 RR Cotton Tech Fee cap/ac 43.66 RRF Cotton Tech Fee thous 1.04 _____________________________________________________________________________________________

44
Appendix Table 6. Tractors: estimated purchase price, annual use, useful life, fuel use, and direct and fixed cost per hour, Louisiana 2020. _______________________________________________________________________________________________________ Purchase Annual Useful Fuel Labor Fuel R&M Total Fixed Total Item Name Size Price Use Life Use Direct Cost _______________________________________________________________________________________________________ dollars hours years gal/hr ----------------$/hour---------------- Combine (170-199 hp) 190hp 0 300 8 9.78 13.51 23.86 0.00 37.37 0.00 37.37 Combine (200-249 hp) 240hp 161,548 300 8 12.35 13.51 30.13 16.82 60.47 71.40 131.87 Combine (225-274 hp) Track250hp 0 300 8 12.87 13.51 31.40 0.00 44.91 0.00 44.91 Combine (250-299 hp) 275hp 352,000 300 8 14.15 13.51 34.52 36.66 84.70 155.57 240.27 Combine (250-299hp) Grass295hp 218,222 300 8 15.18 13.51 37.03 22.73 73.28 96.44 169.72 Combine (275-299 hp) Track290hp 0 300 8 14.93 13.51 36.42 0.00 49.93 0.00 49.93 Combine (300-349 hp) 325hp 383,000 300 8 16.73 13.51 40.82 39.89 94.22 169.27 263.50 Combine (300-349hp) Track320hp 0 300 8 16.47 13.51 40.18 0.00 53.69 0.00 53.69 Combine (350-379 hp) 370hp 390,000 300 8 19.04 13.51 46.45 40.62 100.59 172.37 272.96 Combine (350-379 hp) Track365hp 0 300 8 18.79 13.51 45.84 0.00 59.35 0.00 59.35 Cotton Stripper 173hp 170,000 200 8 8.08 13.51 19.71 26.56 59.78 112.70 172.49 SC Tractor 93 MDR 93 46,683 600 10 4.79 11.33 11.68 2.72 25.74 8.59 34.33 SC Tractpr 68 MDR 68 27,049 600 10 3.50 11.33 8.54 1.57 21.44 4.98 26.42 Tractor( 40-59hp)Cab 2WD 50 30,400 600 8 2.57 11.33 6.27 0.95 18.55 6.21 24.77 Tractor( 40-59hp)Cab MFWD 50 40,300 600 8 2.57 11.33 6.27 1.25 18.86 8.23 27.10 Tractor( 40-59hp)RB 2WD 50 21,600 600 8 2.57 11.33 6.27 0.67 18.28 4.41 22.69 Tractor( 40-59hp)RB MFWD 50 27,500 600 8 2.57 11.33 6.27 0.85 18.46 5.61 24.08 Tractor( 60-89hp)CAB 2WD 75 52,800 600 8 3.86 11.33 9.41 1.65 22.39 10.78 33.18 Tractor( 60-89hp)CAB MFWD 75 62,500 600 8 3.86 11.33 9.41 1.95 22.70 12.76 35.47 Tractor( 60-89hp)RB 2WD 75 38,600 600 8 3.86 11.33 9.41 1.20 21.95 7.88 29.84 Tractor( 60-89hp)RB MFWD 75 40,100 600 8 3.86 11.33 9.41 1.25 22.00 8.19 30.19 Tractor( 90-119hp)CB 2WD 105 69,300 600 8 5.40 11.33 13.18 2.16 26.68 14.15 40.84 Tractor( 90-119hp)CB MFWD 105 88,100 600 8 5.40 11.33 13.18 2.75 27.27 17.99 45.26 Tractor( 90-119hp)RB 2WD 105 62,300 600 8 5.40 11.33 13.18 1.94 26.46 12.72 39.19 Tractor( 90-119hp)RB MFWD 105 69,700 600 8 5.40 11.33 13.18 2.17 26.69 14.23 40.93 Tractor(120-139hp)CB 2WD 130 110,000 600 8 6.69 11.33 16.32 3.43 31.09 22.47 53.56 Tractor(120-139hp)CB MFWD 130 125,000 600 8 6.69 11.33 16.32 3.90 31.56 25.53 57.10 Tractor(140-159hp)CB 2WD 150 108,000 600 8 7.72 11.33 18.83 3.37 33.54 22.06 55.60 Tractor(140-159hp)CB MFWD 150 140,000 600 8 7.72 11.33 18.83 4.37 34.54 28.60 63.14 Tractor(160-179hp)CB 2WD 170 156,000 600 8 8.75 11.33 21.35 4.87 37.55 33.17 70.72 Tractor(160-179hp)CB MFWD 170 155,000 600 8 8.75 11.33 21.35 4.84 37.52 32.95 70.48 Tractor(160-199hp)CB Track 180 142,710 600 8 9.26 11.33 22.60 4.45 38.39 30.34 68.74 Tractor(180-199hp)CB 2WD 190 143,000 600 8 9.77 11.33 23.86 4.46 39.66 30.40 70.06 Tractor(180-199hp)CB MFWD 190 189,000 600 8 9.77 11.33 23.86 5.90 41.09 40.18 81.28 Tractor(200-249hp)CB 4WD 225 147,066 600 8 11.58 11.33 28.25 4.59 44.18 31.27 75.45 Tractor(200-249hp)CB MFWD 225 227,000 600 8 11.58 11.33 28.25 7.09 46.68 48.27 94.95 Tractor(200-249hp)CB Track 225 277,000 600 8 11.58 11.33 28.25 8.65 48.24 58.90 107.14 Tractor(250-349hp)CB 4WD 300 298,000 600 8 15.44 11.33 37.67 9.31 58.32 63.36 121.68 Tractor(250-349hp)CB Track 300 327,000 600 8 15.44 11.33 37.67 10.21 59.22 69.53 128.76 Tractor(350-449hp)CB 4WD 400 342,000 600 8 20.58 11.33 50.23 10.68 72.25 72.72 144.97 Tractor(350-449hp)CB Track 400 426,000 600 8 20.58 11.33 50.23 13.31 74.87 90.58 165.46 Tractor(450-uphp)CB TRACK-475 279,879 600 8 24.44 11.33 59.65 8.74 79.73 59.51 139.24 _______________________________________________________________________________________________________

45
Appendix Table 7. Self-propelled machines: estimated purchase price, annual use, useful life, fuel use, performance rate, and direct and fixed cost per acre, Louisiana 2020. _____________________________________________________________________________________________________________ Purchase Annual Useful Fuel Perf Labor Fuel R&M Total Fixed Total Item Name Size Price Use Life Use Rate Direct Cost _____________________________________________________________________________________________________________ dollars hours years gal/hr hr/ac ----------------$/acre--------------- ATV - 4 Wheeler 12' 0 100 8 1.00 0.000 0.00 0.00 0.00 0.00 0.00 0.00 ATV - 4 Wheeler 20' 8,750 100 8 1.00 0.200 2.70 0.50 0.43 3.63 2.23 5.87 Butt Levee (Backhoe) 70 HP 73,000 150 8 5.00 0.000 0.00 0.00 0.00 0.00 0.00 0.00 Cotton Picker-1st-BB 2R38"157hp 144,912 200 8 8.08 0.519 11.72 10.24 11.76 33.73 49.92 83.66 Cotton Picker-1st-BB 4R2X1260hp 317,399 200 8 13.33 0.172 3.88 5.60 8.54 18.03 36.25 54.29 Cotton Picker-1st-BB 4R30"250hp 262,000 200 8 12.86 0.327 7.38 10.27 13.40 31.07 56.86 87.93 Cotton Picker-1st-BB 4R30"325hp 350,000 200 8 18.01 0.327 7.38 14.38 17.90 39.67 75.96115.64 Cotton Picker-1st-BB 4R38"255hp 268,000 200 8 13.12 0.257 5.81 8.25 10.79 24.86 45.80 70.66 Cotton Picker-1st-BB 4R38"325hp 351,000 200 8 18.01 0.257 5.81 11.32 14.13 31.28 59.98 91.26 Cotton Picker-1st-BB 5R30"255hp 285,000 200 8 12.86 0.261 5.91 8.21 11.66 25.79 49.48 75.27 Cotton Picker-1st-BB 5R38"250hp 284,601 200 8 12.86 0.207 4.67 6.50 9.21 20.39 39.09 59.49 Cotton Picker-1st-BB 6R30"325hp 465,000 200 8 18.27 0.218 4.92 9.72 15.85 30.51 67.28 97.79 Cotton Picker-1st-BB 6R38"330hp 465,000 200 8 18.27 0.172 3.88 7.68 12.51 24.08 53.11 77.20 Cotton Picker-1st-Tr 2R38"157hp 144,912 200 8 8.08 0.519 11.72 10.24 11.76 33.73 49.92 83.66 Cotton Picker-1st-Tr 4R2X1255hp 322,137 200 8 18.01 0.172 3.88 7.57 8.67 20.13 36.79 56.93 Cotton Picker-1st-Tr 4R30"250hp 261,825 200 8 12.86 0.327 7.38 10.27 13.39 31.06 56.82 87.88 Cotton Picker-1st-Tr 4R30"325hp 311,088 200 8 16.72 0.327 7.38 13.36 15.91 36.66 67.51104.18 Cotton Picker-1st-Tr 4R38"255hp 268,000 200 8 13.12 0.257 5.81 8.25 10.79 24.86 45.80 70.66 Cotton Picker-1st-Tr 4R38"325hp 351,000 200 8 18.01 0.257 5.81 11.32 14.13 31.28 59.98 91.26 Cotton Picker-1st-Tr 5R30"255hp 285,303 200 8 13.12 0.261 5.91 8.38 11.67 25.97 49.53 75.51 Cotton Picker-1st-Tr 5R38"250hp 290,471 200 8 12.86 0.207 4.67 6.50 9.40 20.58 39.90 60.48 Cotton Picker-1st-Tr 6R30"325hp 465,000 200 8 16.72 0.218 4.92 8.90 15.85 29.69 67.28 96.97 Cotton Picker-1st-Tr 6R38"330hp 465,000 200 8 18.01 0.172 3.88 7.57 12.51 23.98 53.11 77.10 Cotton Picker-2nd-BB 2R38"157hp 144,912 200 8 8.08 0.440 9.93 8.67 9.96 28.57 42.28 70.86 Cotton Picker-2nd-BB 4R2x1260hp 322,187 200 8 18.01 0.145 3.29 6.41 7.34 17.05 31.17 48.23 Cotton Picker-2nd-BB 4R30"250hp 261,825 200 8 12.86 0.277 6.25 8.70 11.34 26.31 48.13 74.44 Cotton Picker-2nd-BB 4R30"325hp 311,088 200 8 16.72 0.277 6.25 11.31 13.47 31.05 57.19 88.25 Cotton Picker-2nd-BB 4R38"255hp 268,000 200 8 13.12 0.218 4.92 6.99 9.14 21.06 38.79 59.85 Cotton Picker-2nd-BB 4R38"325hp 351,000 200 8 18.01 0.218 4.92 9.59 11.97 26.49 50.81 77.30 Cotton Picker-2nd-BB 5R30"255hp 285,303 200 8 13.12 0.221 5.00 7.10 9.88 22.00 41.96 63.96 Cotton Picker-2nd-BB 5R38"250hp 284,601 200 8 12.86 0.175 3.96 5.51 7.80 17.27 33.11 50.39 Cotton Picker-2nd-BB 6R30"325hp 465,000 200 8 18.01 0.184 4.17 8.12 13.43 25.72 56.99 82.72 Cotton Picker-2nd-BB 6R38"330hp 465,000 200 8 18.01 0.145 3.29 6.41 10.60 20.31 44.99 65.30 Cotton Picker-2nd-Tr 2R38"157hp 144,912 200 8 8.08 0.440 9.93 8.67 9.96 28.57 42.28 70.86 Cotton Picker-2nd-Tr 4R2X1260hp 322,137 200 8 18.01 0.145 3.29 6.41 7.34 17.05 31.16 48.22 Cotton Picker-2nd-Tr 4R30"250hp 261,825 200 8 12.86 0.277 6.25 8.70 11.34 26.31 48.13 74.44 Cotton Picker-2nd-Tr 4R30"325hp 311,088 200 8 16.72 0.277 6.25 11.31 13.47 31.05 57.19 88.25 Cotton Picker-2nd-Tr 4R38"255hp 268,000 200 8 13.12 0.218 4.92 6.99 9.14 21.06 38.79 59.85 Cotton Picker-2nd-Tr 4R38"325hp 351,000 200 8 18.01 0.218 4.92 9.59 11.97 26.49 50.81 77.30 Cotton Picker-2nd-Tr 5R30"255hp 285,303 200 8 13.12 0.221 5.00 7.10 9.88 22.00 41.96 63.96 Cotton Picker-2nd-Tr 5R38"250hp 290,471 200 8 12.86 0.175 3.96 5.51 7.96 17.43 33.79 51.23 Cotton Picker-2nd-Tr 6R30"325hp 465,000 200 8 16.72 0.184 4.17 7.54 13.43 25.15 56.99 82.14 Cotton Picker-2nd-Tr 6R38"330hp 465,000 200 8 18.01 0.145 3.29 6.41 10.60 20.31 44.99 65.30 LA Pickup Truck 1/2 ton 28,000 800 5 2.50 1.000 11.33 6.25 3.15 20.73 7.74 28.47 LA Rice Combine 25 ft 181,500 300 10 8.60 0.300 5.05 6.30 14.53 25.89 23.61 49.50 LA Rice Combine-2 25 ft 181,500 300 10 8.60 0.300 5.05 6.30 14.53 25.89 23.61 49.50 LARice Combine Med 20 ft 165,000 300 10 7.10 0.210 3.53 3.63 9.24 16.41 15.01 31.43 Levee Sprayer 27' 30,768 350 8 2.57 0.038 0.69 0.24 0.06 0.99 0.44 1.44 SC Billet Harvester 6 ft 319,000 750 10 12.00 0.700 11.78 20.49 29.77 62.05 38.25100.30 SC Harvester 1Rw 6 ft 126,500 400 12 6.80 0.875 14.72 14.51 23.05 52.30 31.84 .14 SC Harvester 2Rw 12 ft 231,000 400 12 8.00 0.388 6.53 7.57 18.67 32.77 25.78 58.56 SC Loader 1Rw 6 ft 93,500 425 10 5.10 0.598 7.46 7.45 9.61 24.53 17.12 41.65 SC Loader 2Rw 12 ft 165,000 425 10 7.00 0.300 3.74 5.12 8.51 17.38 15.15 32.53 SC Transloader 33,000 120 12 4.70 0.250 3.11 2.86 4.12 10.10 7.91 18.01 SC Truck&Trailer 30 Ton 49,500 400 10 7.00 1.000 12.46 17.08 8.66 38.20 16.08 54.29 Sprayer( 300-450Gal) 47' 0 350 8 5.40 0.022 0.40 0.29 0.00 0.70 0.00 0.70 Sprayer( 300-450Gal) 60' 103,000 350 8 5.66 0.017 0.31 0.24 0.09 0.65 0.68 1.34 Sprayer( 300-450Gal) 80' 103,000 350 8 5.66 0.013 0.23 0.18 0.07 0.49 0.51 1.00 Sprayer( 600-750Gal) 60' 216,000 350 8 10.29 0.017 0.31 0.44 0.20 0.96 1.44 2.40 Sprayer( 600-825Gal) 80' 215,000 350 8 10.29 0.013 0.23 0.33 0.15 0.72 1.07 1.79 Sprayer( 600-825Gal) 90' 316,000 350 8 10.29 0.011 0.21 0.29 0.19 0.70 1.40 2.11 Sprayer(1000-1400Gal 90' 316,000 350 8 14.15 0.014 0.25 0.48 0.23 0.98 1.68 2.66 Sprayer(1200PlusGal) 120' 376,000 350 8 15.44 0.008 0.15 0.33 0.17 0.66 1.25 1.92 _____________________________________________________________________________________________________________

46
Appendix Table 8. Implements: estimated purchase price, annual use, useful life, performance rate, and direct and fixed cost per acre, Louisiana 2020. ___________________________________________________________________________________________________________________________ Power Purchase Annual Useful Perf Labor Fuel ---R&M---- Total --Fixed--- Total Item Name Size Unit Price Use Life Rate Imp. P.U. Direct Imp. P.U. Cost ___________________________________________________________________________________________________________________________ dollars hours years hr/ac ----------------------$/acre--------------------- Blade-Box 6' 2WD 130 1,221 200 20 0.020 0.22 0.32 0.01 0.06 0.63 0.01 0.44 1.09 Blade-Box 10' 2WD 50 3,700 200 20 0.000 0.00 0.00 0.00 0.00 0.00 0.00 0.00 0.00 Blade-Box 14' 2WD 50 6,270 200 20 0.000 0.00 0.00 0.00 0.00 0.00 0.00 0.00 0.00 Blade-Scraper 6' 2WD 50 1,213 200 20 1.176 13.32 7.38 0.67 0.79 22.18 0.60 5.19 27.98 Blade-Scraper 10' 2WD 50 3,550 200 20 1.176 13.32 7.38 1.98 0.79 23.49 1.77 5.19 30.46 Blade-Scraper 14' 2WD 50 6,860 200 20 0.000 0.00 0.00 0.00 0.00 0.00 0.00 0.00 0.00 Boll Buggy-1st Pick 2R38"157hp MFWD 190 30,500 200 10 0.519 5.88 12.40 3.96 3.06 25.31 8.81 20.88 55.01 Boll Buggy-1st pick 4R2x1260hp MFWD 190 30,500 200 10 0.172 1.95 4.11 1.31 1.01 8.39 2.92 6.92 18.24 Boll Buggy-1st pick 4R30"255hp MFWD 190 30,500 200 10 0.327 3.70 7.81 2.49 1.93 15.95 5.55 13.15 34.66 Boll Buggy-1st pick 4R30"325hp MFWD 190 30,500 200 10 0.327 3.70 7.81 2.49 1.93 15.95 5.55 13.15 34.66 Boll Buggy-1st pick 4R38"255hp MFWD 190 30,500 200 10 0.257 2.92 6.15 1.96 1.52 12.56 4.37 10.36 27.29 Boll Buggy-1st pick 4R38"325hp MFWD 190 30,500 200 10 0.257 2.92 6.15 1.96 1.52 12.56 4.37 10.36 27.29 Boll Buggy-1st pick 5R30"255hp MFWD 190 30,500 200 10 0.261 2.96 6.24 1.99 1.54 12.76 4.44 10.52 27.72 Boll Buggy-1st pick 5R38"255hp MFWD 190 30,500 200 10 0.207 2.34 4.94 1.57 1.22 10.09 3.51 8.32 21.93 Boll Buggy-1st pick 6R30"325hp MFWD 190 30,500 200 10 0.218 2.47 5.20 1.66 1.28 10.63 3.70 8.77 23.10 Boll Buggy-1st pick 6R38"325hp MFWD 190 30,500 200 10 0.172 1.95 4.11 1.31 1.01 8.39 2.92 6.92 18.24 Boll Buggy-2nd pick 2R38"157hp MFWD 190 30,500 200 10 0.440 4.98 10.50 3.35 2.59 21.44 7.46 17.69 46.60 Boll Buggy-2nd pick 4R2x1260hp MFWD 190 30,500 200 10 0.145 1.65 3.48 1.11 0.86 7.11 2.47 5.86 15.45 Boll Buggy-2nd pick 4R30"255hp MFWD 190 30,500 200 10 0.277 3.14 6.61 2.11 1.63 13.51 4.70 11.14 29.36 Boll Buggy-2nd pick 4R30"325hp MFWD 190 30,500 200 10 0.277 3.14 6.61 2.11 1.63 13.51 4.70 11.14 29.36 Boll Buggy-2nd pick 4R38 255hp MFWD 190 30,500 200 10 0.218 2.47 5.21 1.66 1.28 10.63 3.70 8.77 23.11 Boll Buggy-2nd pick 4R38 325hp MFWD 190 30,500 200 10 0.218 2.47 5.21 1.66 1.28 10.63 3.70 8.77 23.11 Boll Buggy-2nd pick 5R30"255hp MFWD 190 30,500 200 10 0.221 2.51 5.29 1.69 1.31 10.80 3.76 8.91 23.48 Boll Buggy-2nd pick 5R38"255hp MFWD 190 30,500 200 10 0.175 1.98 4.18 1.33 1.03 8.55 2.97 7.05 18.58 Boll Buggy-2nd pick 6R30"325hp MFWD 190 30,500 200 10 0.184 2.09 4.41 1.40 1.09 9.00 3.13 7.42 19.57 Boll Buggy-2nd pick 6R38"325hp MFWD 190 30,500 200 10 0.145 1.65 3.48 1.11 0.86 7.11 2.47 5.86 15.45 Boll Buggy-Stripper 13' Bcast MFWD 150 30,500 200 10 0.251 2.85 4.74 1.92 1.10 10.61 4.27 7.20 22.09 Boll Buggy-Stripper 16' Bcast MFWD 150 30,500 200 10 0.204 2.31 3.85 1.56 0.89 8.62 3.47 5.85 17.95 Boll Buggy-Stripper 19' Bcast MFWD 150 30,500 200 10 0.172 1.95 3.24 1.31 0.75 7.26 2.92 4.92 15.11 Boll Buggy-Stripper 4R30"2X1Br MFWD 150 30,500 200 10 0.218 2.47 4.11 1.66 0.95 9.20 3.70 6.24 19.14 Boll Buggy-Stripper 4R30"Brush MFWD 150 30,500 200 10 0.327 3.70 6.16 2.49 1.43 13.80 5.55 9.36 28.72 Boll Buggy-Stripper 4R38"2X1Br MFWD 150 30,500 200 10 0.172 1.95 3.24 1.31 0.75 7.26 2.92 4.92 15.11 Boll Buggy-Stripper 4R38"Brush MFWD 150 30,500 200 10 0.257 2.92 4.85 1.96 1.12 10.87 4.37 7.37 22.61 Boll Buggy-Stripper 5R30"Brush MFWD 150 30,500 200 10 0.261 2.96 4.93 1.99 1.14 11.04 4.44 7.49 22.97 Boll Buggy-Stripper 5R38"Brush MFWD 150 30,500 200 10 0.207 2.34 3.90 1.57 0.90 8.73 3.51 5.92 18.17 Boll Buggy-Stripper 6R30"Brush MFWD 150 30,500 200 10 0.218 2.47 4.11 1.66 0.95 9.20 3.70 6.24 19.14 Chisel Plow(Folding) 16' 2WD 130 22,500 150 12 0.115 1.30 1.88 0.93 0.39 4.53 1.79 2.59 8.92 Chisel Plow(Folding) 24' MFWD 190 42,200 150 12 0.076 0.86 1.82 1.16 0.45 4.30 2.22 3.07 9.60 Chisel Plow(Folding) 32' MFWD 225 54,200 150 12 0.057 0.65 1.63 1.13 0.40 3.82 2.15 2.78 8.77 Chisel Plow(Folding) 42' MFWD 225 65,100 150 12 0.044 0.49 1.24 1.03 0.31 3.08 1.97 2.12 7.18 Chisel Plow(Rigid) 15' 2WD 130 14,700 150 12 0.123 1.39 2.01 0.65 0.42 4.48 1.24 2.76 8.50 Chisel Plow(Rigid) 24' MFWD 190 11,700 150 12 0.077 0.87 1.83 0.32 0.45 3.49 0.62 3.09 7.20 Chisel-Harrow 21 shank 2WD 190 6,750 150 12 0.088 0.99 2.10 0.21 0.39 3.70 0.40 2.67 6.79 Chisel-Harrow 27 shank MFWD 225 14,100 150 12 0.068 0.77 1.93 0.34 0.48 3.54 0.66 3.30 7.51 Colter-Chisel-Harrow 21 shank 2WD 190 19,200 150 12 0.088 0.99 2.10 0.61 0.39 4.10 1.16 2.67 7.94 Colter-Chisel-Harrow 27 shank MFWD 225 24,000 150 12 0.068 0.77 1.93 0.59 0.48 3.78 1.13 3.30 8.22 Corn Grain Cart 8R30 500 bu MFWD 190 25,700 200 12 0.031 0.36 0.76 0.22 0.18 1.53 0.42 1.28 3.24 Corn Grain Cart 8R40 700bu MFWD 190 37,300 200 12 0.025 0.28 0.59 0.25 0.14 1.28 0.48 1.00 2.76 Cult & Post 4R-38 2WD 105 21,600 150 10 0.173 2.94 2.28 0.99 0.33 6.56 2.86 2.20 11.63 Cult & Post 6R-30 MFWD 150 25,900 150 10 0.146 4.98 2.76 1.01 0.64 9.40 2.91 4.19 16.50 Cult & Post 6R-38 MFWD 150 26,600 150 10 0.115 1.96 2.18 0.82 0.50 5.47 2.36 3.31 11.14 Cult & Post 8R-30 MFWD 190 31,500 150 10 0.110 1.86 2.62 0.92 0.64 6.06 2.65 4.42 13.14 Cult & Post 8R-38 MFWD 190 34,700 150 10 0.086 1.47 2.07 0.80 0.51 4.87 2.31 3.49 10.67 Cult & Post 8R-38 2x1 MFWD 190 47,900 150 10 0.057 0.98 1.38 0.73 0.34 3.44 2.12 2.32 7.89 Cult & Post 10R-30 MFWD 225 32,000 150 10 0.088 1.49 2.48 0.75 0.62 5.35 2.15 4.24 11.76 Cult & Post 10R-38 MFWD 225 0 150 10 0.065 1.10 1.83 0.00 0.46 3.40 0.00 3.14 6.54 Cult & Post 12R-30 MFWD 225 52,900 150 10 0.073 1.24 2.07 1.03 0.52 4.87 2.97 3.53 11.38 Cult & Post 12R-38 MFWD 225 53,200 150 10 0.057 0.98 1.63 0.82 0.41 3.85 2.36 2.79 9.00 Cultipacker 12' 2WD 130 6,910 300 12 0.124 1.40 2.03 0.20 0.42 4.07 0.30 2.79 7.17 Cultipacker 20' MFWD 150 17,000 300 12 0.074 0.84 1.40 0.29 0.32 2.87 0.44 2.13 5.46 Cultivate 4R-38 2WD 105 14,200 150 10 0.162 1.83 2.14 0.61 0.31 4.91 1.76 2.06 8.74 Cultivate 6R-30 MFWD 150 18,500 150 10 0.137 1.55 2.59 0.67 0.60 5.42 1.94 3.93 11.31 Cultivate 6R-38 MFWD 150 19,300 150 10 0.108 1.22 2.04 0.55 0.47 4.30 1.60 3.10 9.01 Cultivate 8R-30 MFWD 190 24,200 150 10 0.103 1.16 2.46 0.66 0.60 4.90 1.91 4.14 10.96 Cultivate 8R-38 MFWD 190 27,300 150 10 0.081 0.92 1.94 0.59 0.48 3.94 1.70 3.27 8.92 Cultivate 8R-38 2x1 MFWD 190 39,300 150 10 0.054 0.61 1.29 0.56 0.32 2.79 1.63 2.18 6.61 Cultivate 10R-30 MFWD 225 28,200 150 10 0.082 0.93 2.33 0.62 0.58 4.47 1.78 3.98 10.23 Cultivate 10R-38 MFWD 225 0 150 10 0.065 0.73 1.83 0.00 0.46 3.03 0.00 3.14 6.17 Cultivate 12R-30 MFWD 225 45,600 150 10 0.068 0.77 1.94 0.83 0.48 4.04 2.40 3.31 9.76 Cultivate 12R-38 MFWD 225 44,600 150 10 0.054 0.61 1.53 0.64 0.38 3.17 1.85 2.62 7.65 Disk & Incorporate 14' 2WD 130 33,200 200 10 0.149 2.54 2.44 1.49 0.51 6.99 2.85 3.36 13.21 Disk & Incorporate 24' MFWD 190 51,800 200 10 0.087 1.48 2.08 1.35 0.51 5.43 2.59 3.50 11.54 Disk & Incorporate 32' 4WD 225 66,900 200 10 0.068 1.16 1.94 1.37 0.31 4.80 2.64 2.15 9.60 Disk & Incorporate 42' MFWD 225 30,542 200 10 0.049 0.83 1.38 0.44 0.34 3.02 0.86 2.37 6.25 Disk Bed (Hipper) 4R-38 MFWD 150 9,200 160 10 0.147 1.67 2.78 0.33 0.64 5.43 0.97 4.22 10.63 Disk Bed (Hipper) 6R-30 MFWD 170 15,100 160 10 0.125 1.41 2.66 0.47 0.60 5.16 1.35 4.11 10.63 Disk Bed (Hipper) 6R-38 MFWD 170 15,200 160 10 0.098 1.11 2.10 0.37 0.47 4.07 1.07 3.25 8.40 Disk Bed (Hipper) 8R-30 MFWD 190 19,500 160 10 0.093 1.06 2.23 0.45 0.55 4.31 1.31 3.76 9.39 Disk Bed (Hipper) 8R-38 2x1 MFWD 190 37,400 160 10 0.049 0.55 1.17 0.46 0.29 2.48 1.32 1.98 5.79 Disk Bed (Hipper) 10R-30 MFWD 225 19,900 160 10 0.075 0.84 2.11 0.37 0.53 3.87 1.07 3.62 8.56 Disk Bed (Hipper) 10R-38 MFWD 225 23,100 160 10 0.059 0.67 1.67 0.34 0.41 3.10 0.98 2.85 6.93 Disk Bed (Hipper) 12R-30 MFWD 225 34,500 160 10 0.062 0.70 1.76 0.53 0.44 3.45 1.54 3.01 8.02

47
Appendix Table 8. Implements: estimated purchase price, annual use, useful life, performance rate, (Continued) and direct and fixed cost per acre, Louisiana 2020. ___________________________________________________________________________________________________________________________ Power Purchase Annual Useful Perf Labor Fuel ---R&M---- Total --Fixed--- Total Item Name Size Unit Price Use Life Rate Imp. P.U. Direct Imp. P.U. Cost ___________________________________________________________________________________________________________________________ dollars hours years hr/ac ----------------------$/acre--------------------- Disk Bed (Hipper) 12R-38 MFWD 225 37,400 160 10 0.049 0.55 1.39 0.46 0.35 2.76 1.32 2.38 6.47 Disk Bed (Hipper)Fld 8R-38 MFWD 190 27,200 160 10 0.074 0.83 1.76 0.50 0.43 3.54 1.44 2.97 7.97 Disk Bed (Hipper)Rdg 8R-38 MFWD 190 21,000 160 10 0.074 0.83 1.76 0.38 0.43 3.43 1.11 2.97 7.53 Disk Bed w/roller 8R-30 2WD 190 28,300 160 10 0.093 1.06 2.23 0.66 0.41 4.38 1.90 2.85 9.13 Disk Bed w/roller 12R-30 MFWD 225 55,200 160 10 0.062 0.70 1.76 0.86 0.44 3.78 2.47 3.01 9.27 Disk Harrow 14' 2WD 130 25,900 180 10 0.140 1.58 2.29 1.00 0.48 5.37 2.32 3.15 10.84 Disk Harrow 24' MFWD 190 44,400 180 10 0.081 0.92 1.95 1.00 0.48 4.37 2.32 3.28 9.98 Disk Harrow 28' MFWD 225 53,800 180 10 0.070 0.79 1.98 1.04 0.49 4.32 2.41 3.38 10.12 Disk Harrow 32' 59,500 180 10 0.061 0.82 0.00 1.01 0.00 0.00 2.33 0.00 0.00 Disk Harrow 42' MFWD 225 98,700 180 10 0.046 0.52 1.32 1.28 0.33 3.46 2.94 2.25 8.67 Ditcher 2WD 130 6,100 200 10 0.020 0.22 0.32 0.04 0.06 0.67 0.07 0.44 1.19 Ditcher (1m/160a) 2WD 130 6,100 200 10 0.009 0.10 0.15 0.02 0.03 0.31 0.03 0.21 0.55 Fert Appl (Liquid) 4R-38 MFWD 150 12,900 150 8 0.154 2.62 2.91 1.33 0.67 7.54 1.63 4.42 13.60 Fert Appl (Liquid) 6R-30 MFWD 170 18,500 150 8 0.130 2.22 2.79 1.61 0.63 7.27 1.97 4.31 13.56 Fert Appl (Liquid) 6R-38 MFWD 170 18,500 150 8 0.103 1.75 2.20 1.27 0.50 5.73 1.56 3.40 10.71 Fert Appl (Liquid) 8R-30 MFWD 190 18,400 150 8 0.098 1.66 2.34 1.20 0.58 5.79 1.47 3.94 11.22 Fert Appl (Liquid) 8R-38 MFWD 190 19,000 150 8 0.077 1.31 1.85 0.98 0.45 4.61 1.20 3.12 8.94 Fert Appl (Liquid) 8R-38 2x1 MFWD 190 21,600 150 8 0.051 0.87 1.23 0.74 0.30 3.16 0.91 2.07 6.15 Fert Appl (Liquid) 10R-30 MFWD 225 18,600 150 8 0.078 1.33 2.22 0.97 0.55 5.08 1.19 3.79 10.07 Fert Appl (Liquid) 10R-38 MFWD 225 20,300 150 8 0.061 1.05 1.75 0.83 0.43 4.08 1.02 2.99 8.10 Fert Appl (Liquid) 12R-30 MFWD 225 23,100 150 8 0.078 1.33 2.22 1.20 0.55 5.32 1.48 3.79 10.59 Fert Appl (Liquid) 12R-38 MFWD 225 21,600 150 8 0.051 0.87 1.46 0.74 0.36 3.45 0.91 2.49 6.85 Field Cult & Inc 12' 2WD 150 19,600 100 10 0.132 2.24 2.49 0.64 0.44 5.83 2.97 2.91 11.72 Field Cult & Inc 24' MFWD 170 30,600 100 10 0.066 1.12 1.41 0.50 0.32 3.36 2.32 2.17 7.86 Field Cult & Inc 32' MFWD 190 42,900 100 10 0.049 0.84 1.18 0.53 0.29 2.85 2.44 1.99 7.28 Field Cult & Inc 42' MFWD 225 58,400 100 10 0.037 0.64 1.06 0.55 0.26 2.52 2.53 1.82 6.88 Field Cultivate 12' 2WD 150 12,300 100 10 0.124 1.40 2.34 0.38 0.41 4.55 1.75 2.74 9.06 Field Cultivate 24' MFWD 170 30,600 100 10 0.062 0.70 1.32 0.47 0.30 2.81 2.18 2.05 7.05 Field Cultivate 32' MFWD 190 42,900 100 10 0.046 0.52 1.11 0.50 0.27 2.41 2.30 1.87 6.59 Field Cultivate 42' MFWD 225 58,400 100 10 0.035 0.40 1.00 0.51 0.25 2.17 2.38 1.71 6.28 Field Cultivate 50' MFWD 225 67,800 100 10 0.029 0.33 0.84 0.50 0.21 1.90 2.32 1.44 5.66 Gate Installer 2WD 130 2,960 10 10 0.020 0.45 0.32 0.17 0.06 1.02 0.65 0.44 2.13 Grain Drill 12' 2WD 130 27,500 150 8 0.157 3.56 2.56 1.62 0.54 8.28 3.38 3.53 15.20 Grain Drill 15' MFWD 150 33,100 150 8 0.125 2.84 2.36 1.56 0.54 7.32 3.26 3.59 14.18 Grain Drill 20' MFWD 170 39,400 150 8 0.094 2.13 2.01 1.39 0.45 5.99 2.91 3.10 12.01 Grain Drill 24' MFWD 190 65,600 150 8 0.078 1.78 1.87 1.93 0.46 6.05 4.03 3.15 13.24 Grain Drill 30' MFWD 225 63,800 150 8 0.062 1.42 1.77 1.50 0.44 5.15 3.14 3.03 11.32 Grain Drill & Pre 12' 2WD 130 34,800 150 8 0.169 3.83 2.76 2.20 0.58 9.38 4.61 3.80 17.80 Grain Drill & Pre 15' MFWD 150 40,400 150 8 0.135 3.06 2.55 2.05 0.59 8.26 4.28 3.87 16.42 Grain Drill & Pre 20' MFWD 170 46,700 150 8 0.101 2.30 2.16 1.77 0.49 6.73 3.71 3.34 13.80 Grain Drill & Pre 24' MFWD 190 73,000 150 8 0.084 1.91 2.01 2.31 0.49 6.75 4.84 3.40 14.99 Grain Drill & Pre 30' MFWD 225 71,200 150 8 0.067 1.53 1.91 1.80 0.48 5.73 3.77 3.26 12.77 Harrow 13' 2WD 130 4,360 200 10 0.119 1.35 1.95 0.18 0.41 3.89 0.29 2.68 6.88 Harrow 21' 2WD 150 6,750 200 10 0.073 0.83 1.39 0.17 0.24 2.65 0.28 1.63 4.57 Harrow 40' MFWD 190 20,200 200 10 0.038 0.43 0.92 0.27 0.22 1.86 0.45 1.56 3.88 Harrow 47' MFWD 190 23,700 200 10 0.033 0.37 0.78 0.27 0.19 1.63 0.45 1.32 3.41 Header - Corn 4R-38 240hp 25,147 300 8 0.201 2.71 6.06 1.26 3.38 13.42 2.06 14.36 29.85 Header - Corn 6R30" 240hp 50,800 300 8 0.170 2.30 5.13 2.16 2.86 12.45 3.53 12.15 28.15 Header - Corn 6R38" 240hp 51,400 300 8 0.134 1.81 4.05 1.72 2.26 9.85 2.82 9.59 22.27 Header - Corn 8R-30 240hp 62,000 300 8 0.127 1.72 3.84 1.97 2.14 9.70 3.23 9.11 22.05 Header - Corn 8R-38 275hp 67,000 300 8 0.100 1.36 3.48 1.69 3.70 10.24 2.76 15.70 28.71 Header - Corn 12R-20 275hp 102,000 300 8 0.127 1.72 4.40 3.25 4.68 14.07 5.32 19.86 39.26 Header - Corn 12R-30 275hp 103,000 300 8 0.085 1.15 2.93 2.19 3.12 9.40 3.58 13.24 26.23 Header - Rice (CL) 22' Rigid 240hp 64,400 300 8 0.288 3.89 8.69 4.64 4.85 22.08 7.59 20.59 50.27 Header - Rice (CL) 25' Rigid 240hp 64,400 300 8 0.253 3.42 7.64 4.08 4.27 19.43 6.67 18.12 44.24 Header - Rice (CL) 30' Rigid 275hp 74,100 300 8 0.211 2.85 7.30 3.91 7.75 21.83 6.40 32.91 61.15 Header - Rice (SL) 22' Rigid 240hp 64,400 300 8 0.250 3.37 7.53 4.02 4.20 19.14 6.57 17.85 43.57 Header - Rice (SL) 25' Rigid 240hp 64,400 300 8 0.220 2.97 6.62 3.54 3.70 16.84 5.78 15.70 38.34 Header - Rice (SL) 30' Rigid 275hp 74,100 300 8 0.183 2.47 6.32 3.39 6.72 18.92 5.55 28.52 52.99 Header - Soybean 15' Flex 240hp 0 300 8 0.170 2.30 5.13 0.00 2.86 10.29 0.00 12.15 22.45 Header - Soybean 18' Flex 240hp 20,309 300 8 0.141 1.91 4.27 0.72 2.38 9.30 1.17 10.13 20.61 Header - Soybean 22' Flex 240hp 33,500 300 8 0.116 1.56 3.49 0.97 1.95 7.99 1.58 8.28 17.87 Header - Soybean 25' Flex 275hp 35,900 300 8 0.102 1.38 3.52 0.91 3.74 9.57 1.49 15.89 26.96 Header - Soybean 30' Flex 275hp 42,400 300 8 0.085 1.15 2.93 0.90 3.12 8.11 1.47 13.24 22.83 Header Wheat/Sorghum 18' Rigid 240hp 19,069 300 8 0.141 1.91 4.27 0.67 2.38 9.25 1.10 10.13 20.49 Header Wheat/Sorghum 22' Rigid 240hp 19,800 300 8 0.116 1.56 3.49 0.57 1.95 7.59 0.93 8.28 16.82 Header Wheat/Sorghum 25' Rigid 240hp 21,000 300 8 0.102 1.38 3.07 0.53 1.71 6.71 0.87 7.29 14.88 Header Wheat/Sorghum 30' Rigid 275hp 25,700 300 8 0.085 1.15 2.93 0.54 3.12 7.75 0.89 13.24 21.89 Header-Cotton Bcast 13' 173hp 21,300 200 8 0.251 6.25 4.96 1.00 6.68 18.91 3.28 28.38 50.58 Header-Cotton-Bcast 16' 173hp 23,800 200 8 0.204 5.08 4.03 0.91 5.43 15.46 2.98 23.06 41.50 Header-Cotton-Bcast 19' 173hp 26,200 200 8 0.172 4.28 3.39 0.84 4.57 13.10 2.76 19.42 35.28 Header-Cotton-Brush 4R30" 173hp 20,520 200 8 0.327 8.13 6.45 1.25 8.69 24.54 4.11 36.89 65.55 Header-Cotton-Brush 4R30"2X1 173hp 34,400 200 8 0.218 5.42 4.30 1.40 5.79 16.92 4.60 24.59 46.12 Header-Cotton-Brush 4R38" 173hp 34,000 200 8 0.257 6.40 5.08 1.64 6.84 19.97 5.37 29.05 54.40 Header-Cotton-Brush 4R38"2X1 173hp 36,000 200 8 0.172 4.28 3.39 1.16 4.57 13.41 3.80 19.42 36.63

48
Appendix Table 8. Implements: estimated purchase price, annual use, useful life, performance rate, (Continued) and direct and fixed cost per acre, Louisiana 2020. ___________________________________________________________________________________________________________________________ Power Purchase Annual Useful Perf Labor Fuel ---R&M---- Total --Fixed--- Total Item Name Size Unit Price Use Life Rate Imp. P.U. Direct Imp. P.U. Cost ___________________________________________________________________________________________________________________________ dollars hours years hr/ac ----------------------$/acre--------------------- Header-Cotton-Brush 5R-30 173hp 42,800 200 8 0.261 6.50 5.16 2.10 6.95 20.72 6.87 29.51 57.11 Header-Cotton-Brush 5R-38 173hp 44,300 200 8 0.207 5.14 4.08 1.72 5.50 16.45 5.62 23.35 45.43 Header-Cotton-Brush 6R-30 173hp 52,700 200 8 0.218 5.42 4.30 2.15 5.79 17.67 7.04 24.59 49.32 Heavy Disk 14' MFWD 150 25,900 180 10 0.145 1.65 2.74 1.05 0.63 6.09 2.41 4.17 12.68 Heavy Disk 21' MFWD 170 40,600 180 10 0.097 1.10 2.07 1.09 0.47 4.74 2.52 3.20 10.47 Heavy Disk 27' MFWD 190 50,400 180 10 0.075 0.85 1.80 1.05 0.44 4.16 2.43 3.04 9.64 LA Boom Sprayer 30 ft MFWD 150 3,000 150 10 0.059 0.67 1.13 0.13 0.26 2.20 0.15 1.71 4.07 Land Plane 40'x10' MFWD 190 6,020 200 10 0.242 2.74 5.79 0.29 1.43 10.26 0.83 9.75 20.85 Land Plane 50'x16' MFWD 190 10,800 200 10 0.151 1.71 3.61 0.32 0.89 6.56 0.94 6.09 13.59 LARice Backhoe-Rrmnt 2 ft MFWD 150 6,000 100 10 0.500 5.66 9.41 2.64 2.18 19.91 3.89 14.30 38.11 LARice Land Level 13 ft MFWD 150 7,500 200 15 0.190 2.15 3.58 0.15 0.83 6.72 0.71 5.43 12.87 LARice Levee Plow 8 ft 4WD 300 4,600 150 10 0.050 0.56 1.88 0.07 0.46 2.99 0.19 3.16 6.36 LARice Water Level 24 ft 4WD 300 3,500 100 15 0.149 1.69 5.64 0.23 1.39 8.97 0.52 9.50 19.00 Levee Splitter (1/80 2 blade 2WD 150 7,180 50 10 0.004 0.04 0.07 0.00 0.01 0.14 0.06 0.09 0.30 Lo-Till & Bed 4R-38 MFWD 190 5,100 150 12 0.145 1.64 3.47 0.26 0.85 6.25 0.52 5.85 12.62 Middle Buster 6R-38 MFWD 150 12,800 160 8 0.120 1.36 2.26 0.36 0.52 4.51 1.22 3.43 9.17 Middle Buster 8R-30 MFWD 190 20,800 160 8 0.114 1.29 2.72 0.55 0.67 5.24 1.89 4.58 11.73 Middle Buster 8R-38 MFWD 190 18,100 160 8 0.090 1.02 2.15 0.38 0.53 4.09 1.30 3.62 9.02 Middle Buster 8R-40 2x1 MFWD 190 29,200 160 8 0.060 0.68 1.43 0.41 0.35 2.88 1.39 2.41 6.69 Middle Buster 10R-30 MFWD 225 29,300 160 8 0.091 1.03 2.58 0.62 0.64 4.89 2.13 4.40 11.43 Middle Buster 10R-38 MFWD 225 32,100 160 8 0.072 0.81 2.03 0.54 0.51 3.90 1.84 3.47 9.22 Middle Buster 12R-38 MFWD 225 29,200 160 8 0.060 0.68 1.69 0.41 0.42 3.21 1.39 2.90 7.51 Module Builder-1st 2R-38(157) MFWD 190 31,300 200 10 0.519 11.77 12.40 4.06 3.06 31.31 9.04 20.88 61.24 Module Builder-1st 4R-30(255) MFWD 190 34,700 200 10 0.327 7.41 7.81 2.84 1.93 20.00 6.31 13.15 39.47 Module Builder-1st 4R-30(325) MFWD 190 34,700 200 10 0.327 7.41 7.81 2.84 1.93 20.00 6.31 13.15 39.47 Module Builder-1st 4R-38(255) MFWD 190 34,700 200 10 0.257 5.84 6.15 2.23 1.52 15.75 4.97 10.36 31.08 Module Builder-1st 4R-38(325) MFWD 190 34,700 200 10 0.257 5.84 6.15 2.23 1.52 15.75 4.97 10.36 31.08 Module Builder-1st 4R2x1260hp MFWD 190 34,700 200 10 0.172 3.90 4.11 1.49 1.01 10.52 3.32 6.92 20.77 Module Builder-1st 5R-30(255) MFWD 190 34,700 200 10 0.261 5.93 6.24 2.27 1.54 16.00 5.05 10.52 31.58 Module Builder-1st 5R-38(255) MFWD 190 34,700 200 10 0.207 4.69 4.94 1.79 1.22 12.66 3.99 8.32 24.98 Module Builder-1st 6R-30(325) MFWD 190 34,700 200 10 0.218 4.94 5.20 1.89 1.28 13.33 4.21 8.77 26.31 Module Builder-1st 6R-38(325) MFWD 190 34,700 200 10 0.172 3.90 4.11 1.49 1.01 10.52 3.32 6.92 20.77 Module Builder-2nd 2R-38(157) MFWD 190 34,700 200 10 0.440 9.97 10.50 3.81 2.59 26.89 8.49 17.69 53.08 Module Builder-2nd 4R-30(255) MFWD 190 34,700 200 10 0.277 6.28 6.61 2.40 1.63 16.94 5.35 11.14 33.44 Module Builder-2nd 4R-30(325) MFWD 190 34,700 200 10 0.277 6.28 6.61 2.40 1.63 16.94 5.35 11.14 33.44 Module Builder-2nd 4R-38(255) MFWD 190 34,700 200 10 0.218 4.94 5.21 1.89 1.28 13.34 4.21 8.77 26.33 Module Builder-2nd 4R-38(325) MFWD 190 34,700 200 10 0.218 4.94 5.21 1.89 1.28 13.34 4.21 8.77 26.33 Module Builder-2nd 4R2x1 255 MFWD 190 34,700 200 10 0.145 3.30 3.48 1.26 0.86 8.91 2.81 5.86 17.60 Module Builder-2nd 5R-30(255) MFWD 190 34,700 200 10 0.221 5.02 5.29 1.92 1.31 13.55 4.28 8.91 26.75 Module Builder-2nd 5R-38(255) MFWD 190 34,700 200 10 0.175 3.97 4.18 1.52 1.03 10.72 3.38 7.05 21.16 Module Builder-2nd 6R-30(325) MFWD 190 34,700 200 10 0.184 4.18 4.41 1.60 1.09 11.29 3.56 7.43 22.29 Module Builder-2nd 6R-38(325) MFWD 190 34,700 200 10 0.145 3.30 3.48 1.26 0.86 8.91 2.81 5.86 17.60 Module Builder-Strip 13' Bcast MFWD 150 34,700 200 10 0.251 5.70 4.74 2.18 1.10 13.73 4.86 7.20 25.80 Module Builder-Strip 16' Bcast MFWD 150 34,700 200 10 0.204 4.63 3.85 1.77 0.89 11.16 3.94 5.85 20.96 Module Builder-Strip 19' Brush MFWD 150 34,700 200 10 0.172 3.90 3.24 1.49 0.75 9.39 3.32 4.92 17.65 Module Builder-Strip 4R-30 MFWD 150 34,700 200 10 0.327 7.41 6.16 2.84 1.43 17.85 6.31 9.36 33.54 Module Builder-Strip 4R-30 2X1 MFWD 150 34,700 200 10 0.218 4.94 4.11 1.89 0.95 11.90 4.21 6.24 22.35 Module Builder-Strip 4R-38 MFWD 150 34,700 200 10 0.257 5.84 4.85 2.23 1.12 14.06 4.97 7.37 26.40 Module Builder-Strip 4R-38 2X1 MFWD 150 34,700 200 10 0.172 3.90 3.24 1.49 0.75 9.39 3.32 4.92 17.65 Module Builder-Strip 5R-30 MFWD 150 34,700 200 10 0.261 5.93 4.93 2.27 1.14 14.28 5.05 7.49 26.83 Module Builder-Strip 5R-38 MFWD 150 34,700 200 10 0.207 4.69 3.90 1.79 0.90 11.30 3.99 5.92 21.22 Module Builder-Strip 6R-30 MFWD 150 34,700 200 10 0.218 4.94 4.11 1.89 0.95 11.90 4.21 6.24 22.35 Mulcher Plow 30' MFWD 225 0 100 10 0.068 0.77 1.92 0.00 0.48 3.17 0.00 3.28 6.46 NT Grain Drill 12' 2WD 130 46,100 150 8 0.163 3.70 2.67 2.82 0.56 9.77 5.91 3.67 19.36 NT Grain Drill 15' MFWD 150 55,500 150 8 0.130 2.96 2.46 2.72 0.57 8.73 5.69 3.74 18.17 NT Grain Drill 20' MFWD 170 65,100 150 8 0.098 2.22 2.09 2.39 0.47 7.19 5.01 3.23 15.44 NT Grain Drill 24' MFWD 190 90,400 150 8 0.081 1.85 1.95 2.77 0.48 7.06 5.79 3.28 16.15 NT Grain Drill 30' MFWD 225 103,000 150 8 0.065 1.48 1.85 2.52 0.46 6.32 5.28 3.16 14.77 NT Grain Drill & Pre 12' 2WD 130 55,200 150 8 0.176 3.99 2.87 3.64 0.60 11.12 7.62 3.96 22.71 NT Grain Drill & Pre 15' MFWD 150 55,500 150 8 0.141 3.19 2.65 2.93 0.61 9.40 6.13 4.03 19.57 NT Grain Drill & Pre 20' MFWD 170 65,100 150 8 0.105 2.39 2.25 2.58 0.51 7.74 5.39 3.48 16.63 NT Grain Drill & Pre 24' MFWD 190 90,400 150 8 0.088 1.99 2.10 2.98 0.52 7.60 6.24 3.54 17.39 NT Grain Drill & Pre 30' MFWD 225 110,700 150 8 0.070 1.59 1.99 2.92 0.50 7.01 6.11 3.40 16.53 NT Plant&Pre-Folding 8R-38 MFWD 170 67,100 150 8 0.083 1.89 1.78 2.10 0.40 6.18 4.39 2.75 13.34 NT Plant&Pre-Folding 8R-38 2x1 MFWD 170 99,600 150 8 0.055 1.26 1.18 2.07 0.26 4.79 4.34 1.83 10.97 NT Plant&Pre-Folding 10R-30 MFWD 190 57,555 150 8 0.084 1.91 2.01 1.82 0.49 6.26 3.81 3.40 13.48 NT Plant&Pre-Folding 10R-38 MFWD 190 52,893 150 8 0.066 1.51 1.59 1.32 0.39 4.82 2.76 2.68 10.27 NT Plant&Pre-Folding 12R-20 MFWD 190 83,300 150 8 0.105 2.39 2.52 3.30 0.62 8.84 6.90 4.25 20.00 NT Plant&Pre-Folding 12R-30 MFWD 190 8,600 150 8 0.070 1.59 1.68 0.22 0.41 3.92 0.47 2.83 7.23 NT Plant&Pre-Folding 12R-38 MFWD 190 99,600 150 8 0.055 1.26 1.32 2.07 0.32 4.99 4.34 2.23 11.58 NT Plant&Pre-Folding 16R-30 MFWD 190 129,000 150 8 0.052 1.19 1.26 2.55 0.31 5.33 5.34 2.12 12.80 NT Plant&Pre-Folding 23R-15 MFWD 190 163,000 150 8 0.073 1.66 1.75 4.48 0.43 8.34 9.38 2.95 20.67 NT Plant&Pre-Folding 24R-20 MFWD 190 182,000 150 8 0.052 1.19 1.26 3.60 0.31 6.38 7.54 2.12 16.05 NT Plant&Pre-Folding 24R-30 MFWD 190 208,000 150 8 0.035 0.79 0.84 2.74 0.20 4.59 5.74 1.41 11.76 NT Plant&Pre-Rigid 4R-30 2WD 130 34,600 150 8 0.211 4.79 3.45 2.74 0.72 11.71 5.73 4.75 22.20 NT Plant&Pre-Rigid 4R-38 2WD 130 35,600 150 8 0.166 3.77 2.71 2.22 0.57 9.29 4.64 3.74 17.68 NT Plant&Pre-Rigid 6R-30 MFWD 150 43,700 150 8 0.141 3.19 2.65 2.31 0.61 8.78 4.83 4.03 17.64 NT Plant&Pre-Rigid 6R-38 MFWD 150 42,900 150 8 0.111 2.52 2.09 1.79 0.48 6.89 3.74 3.18 13.82 NT Plant&Pre-Rigid 8R-22 MFWD 170 26,219 150 8 0.143 3.26 3.07 1.41 0.69 8.44 2.95 4.74 16.14 NT Plant&Pre-Rigid 8R-30 MFWD 170 54,300 150 8 0.105 2.39 2.25 2.15 0.51 7.32 4.50 3.48 15.30 NT Plant&Pre-Rigid 8R-38 MFWD 170 51,700 150 8 0.077 1.74 1.64 1.49 0.37 5.26 3.12 2.54 10.93 NT Plant&Pre-Rigid 10R-30 MFWD 190 51,900 150 8 0.084 1.91 2.01 1.64 0.49 6.08 3.44 3.40 12.92

49
Appendix Table 8. Implements: estimated purchase price, annual use, useful life, performance rate, (Continued) and direct and fixed cost per acre, Louisiana 2020. ___________________________________________________________________________________________________________________________ Power Purchase Annual Useful Perf Labor Fuel ---R&M---- Total --Fixed--- Total Item Name Size Unit Price Use Life Rate Imp. P.U. Direct Imp. P.U. Cost ___________________________________________________________________________________________________________________________ dollars hours years hr/ac ----------------------$/acre--------------------- NT Plant&Pre-Rigid 12R-20 MFWD 190 65,900 150 8 0.105 2.39 2.52 2.61 0.62 8.15 5.46 4.25 17.87 NT Plant&Pre-Rigid 12R-30 MFWD 190 75,300 150 8 0.070 1.59 1.68 1.99 0.41 5.68 4.16 2.83 12.68 NT Plant-Folding 8R-38 MFWD 170 59,700 150 8 0.077 1.75 1.65 1.73 0.37 5.53 3.63 2.55 11.72 NT Plant-Folding 8R-38 2x1 MFWD 170 91,000 150 8 0.051 1.17 1.10 1.76 0.25 4.28 3.68 1.70 9.68 NT Plant-Folding 10R-30 MFWD 190 52,061 150 8 0.078 1.78 1.87 1.53 0.46 5.65 3.20 3.15 12.01 NT Plant-Folding 10R-38 MFWD 190 47,646 150 8 0.061 1.40 1.47 1.10 0.36 4.35 2.31 2.49 9.16 NT Plant-Folding 12R-20 MFWD 190 75,900 150 8 0.098 2.22 2.34 2.79 0.58 7.94 5.84 3.94 17.73 NT Plant-Folding 12R-30 MFWD 190 81,000 150 8 0.065 1.48 1.56 1.98 0.38 5.42 4.15 2.63 12.21 NT Plant-Folding 12R-38 MFWD 190 91,000 150 8 0.051 1.17 1.23 1.76 0.30 4.47 3.68 2.07 10.23 NT Plant-Folding 16R-30 MFWD 190 120,000 150 8 0.049 1.11 1.17 2.20 0.29 4.78 4.61 1.97 11.37 NT Plant-Folding 23R-15 MFWD 190 155,000 150 8 0.068 1.54 1.62 3.96 0.40 7.54 8.28 2.74 18.56 NT Plant-Folding 24R-20 MFWD 190 174,000 150 8 0.049 1.11 1.17 3.20 0.29 5.77 6.69 1.97 14.44 NT Plant-Folding 24R-30 MFWD 190 194,000 150 8 0.032 0.74 0.78 2.38 0.19 4.09 4.97 1.31 10.39 NT Plant-Rigid 4R-30 2WD 130 27,200 150 8 0.196 4.45 3.20 2.00 0.67 10.33 4.18 4.41 18.93 NT Plant-Rigid 4R-38 2WD 130 28,200 150 8 0.154 3.50 2.52 1.63 0.53 8.19 3.41 3.47 15.09 NT Plant-Rigid 6R-30 MFWD 150 36,300 150 8 0.130 2.96 2.46 1.78 0.57 7.78 3.72 3.74 15.26 NT Plant-Rigid 6R-38 MFWD 150 35,600 150 8 0.103 2.34 1.94 1.38 0.45 6.12 2.88 2.95 11.96 NT Plant-Rigid 8R-22 MFWD 170 21,142 150 8 0.133 3.02 2.85 1.05 0.64 7.58 2.21 4.40 14.20 NT Plant-Rigid 8R-30 MFWD 170 46,900 150 8 0.098 2.22 2.09 1.72 0.47 6.52 3.61 3.23 13.37 NT Plant-Rigid 8R-38 MFWD 170 44,300 150 8 0.077 1.75 1.65 1.28 0.37 5.08 2.69 2.55 10.33 NT Plant-Rigid 10R-30 MFWD 190 46,500 150 8 0.078 1.78 1.87 1.37 0.46 5.48 2.86 3.15 11.51 NT Plant-Rigid 12R-20 MFWD 190 58,600 150 8 0.098 2.22 2.34 2.15 0.58 7.30 4.51 3.94 15.76 NT Plant-Rigid 12R-30 MFWD 190 70,700 150 8 0.065 1.48 1.56 1.73 0.38 5.16 3.62 2.63 11.42 Paratill & Bed 4R-30 MFWD 225 12,300 150 12 0.204 2.31 5.77 0.90 1.44 10.44 1.73 9.86 22.04 Paratill & Bed 4R-38 MFWD 225 12,300 150 12 0.160 1.82 4.54 0.71 1.14 8.22 1.36 7.76 17.35 Paratill & Bed 6R-30 MFWD 225 17,300 150 12 0.136 1.54 3.84 0.85 0.96 7.21 1.62 6.57 15.40 Paratill & Bed 6R-38 MFWD 225 17,200 150 12 0.107 1.21 3.03 0.66 0.76 5.68 1.27 5.19 12.15 Paratill & Bed 8R-30 MFWD 225 22,600 150 12 0.102 1.15 2.88 0.83 0.72 5.60 1.59 4.93 12.12 Paratill & Bed 8R382X1 MFWD 225 69,100 150 12 0.053 0.60 1.51 1.34 0.38 3.85 2.56 2.59 9.00 Paratill & Bed Fold. 8R-38 MFWD 225 54,400 150 12 0.080 0.91 2.28 1.58 0.57 5.35 3.02 3.89 12.28 Paratill & Bed Fold. 12R-38 MFWD 225 69,100 150 12 0.053 0.60 1.51 1.34 0.38 3.85 2.56 2.59 9.00 Paratill & Bed Rigid 8R-38 MFWD 225 22,600 150 12 0.080 0.91 2.28 0.65 0.57 4.42 1.25 3.89 9.58 Pipe Drag 30' 2WD 150 500 100 12 0.051 0.58 0.97 0.00 0.17 1.74 0.02 1.14 2.91 Pipe Spool 160ac 1/4m roll 2WD 130 5,400 15 12 0.003 0.09 0.05 0.00 0.01 0.16 0.11 0.07 0.34 Pipe Trailer 1m/160a 30' 2WD 130 2,700 100 15 0.003 0.17 0.06 0.00 0.01 0.25 0.00 0.08 0.34 Plant & Pre Folding 8R-38 MFWD 170 59,900 150 8 0.080 1.81 1.71 1.80 0.38 5.72 3.76 2.64 12.13 Plant & Pre Folding 8R38 2x1 MFWD 170 88,900 150 8 0.053 1.21 1.14 1.78 0.25 4.39 3.72 1.76 9.87 Plant & Pre Folding 10R-30 MFWD 190 51,900 150 8 0.081 1.84 1.93 1.58 0.47 5.83 3.30 3.26 12.40 Plant & Pre Folding 10R-38 MFWD 190 48,258 150 8 0.064 1.45 1.52 1.15 0.37 4.51 2.42 2.57 9.51 Plant & Pre Folding 12R-20 MFWD 190 72,600 150 8 0.101 2.30 2.42 2.76 0.59 8.08 5.77 4.08 17.94 Plant & Pre Folding 12R-30 MFWD 190 78,900 150 8 0.067 1.53 1.61 2.00 0.39 5.55 4.18 2.72 12.45 Plant & Pre Folding 12R-38 MFWD 190 88,900 150 8 0.053 1.21 1.27 1.78 0.31 4.58 3.72 2.14 10.45 Plant & Pre Folding 16R-30 MFWD 190 115,000 150 8 0.050 1.15 1.21 2.18 0.29 4.85 4.57 2.04 11.46 Plant & Pre Folding 23R-15 MFWD 190 143,000 150 8 0.070 1.59 1.68 3.78 0.41 7.47 7.90 2.83 18.21 Plant & Pre Folding 24R-20 MFWD 190 161,000 150 8 0.050 1.15 1.21 3.06 0.29 5.72 6.40 2.04 14.17 Plant & Pre Folding 24R-30 MFWD 190 186,000 150 8 0.033 0.76 0.80 2.36 0.19 4.13 4.93 1.36 10.42 Plant & Pre Rigid 4R-30 2WD 130 31,000 150 8 0.203 4.60 3.31 2.36 0.69 10.97 4.93 4.56 20.47 Plant & Pre Rigid 4R-38 2WD 130 32,000 150 8 0.159 3.62 2.61 1.91 0.54 8.70 4.01 3.59 16.30 Plant & Pre Rigid 6R-30 MFWD 150 38,300 150 8 0.135 3.06 2.55 1.94 0.59 8.15 4.06 3.87 16.09 Plant & Pre Rigid 6R-38 MFWD 150 37,600 150 8 0.106 2.42 2.01 1.50 0.46 6.41 3.14 3.05 12.61 Plant & Pre Rigid 8R-22 MFWD 170 23,550 150 8 0.138 3.13 2.94 1.22 0.66 7.96 2.55 4.55 15.07 Plant & Pre Rigid 8R-30 MFWD 170 47,100 150 8 0.101 2.30 2.16 1.79 0.49 6.75 3.74 3.34 13.84 Plant & Pre Rigid 8R-38 MFWD 170 44,600 150 8 0.080 1.81 1.71 1.34 0.38 5.26 2.80 2.64 10.71 Plant & Pre Rigid 10R-30 MFWD 190 46,000 150 8 0.081 1.84 1.93 1.40 0.47 5.66 2.92 3.26 11.85 Plant & Pre Rigid 12R-20 MFWD 190 55,200 150 8 0.101 2.30 2.42 2.10 0.59 7.42 4.39 4.08 15.89 Plant & Pre Rigid 12R-30 MFWD 190 68,600 150 8 0.067 1.53 1.61 1.74 0.39 5.29 3.63 2.72 11.65 Plant - Folding 8R-38 MFWD 170 52,600 150 8 0.074 1.68 1.59 1.47 0.36 5.11 3.07 2.45 10.64 Plant - Folding 8R-38 2x1 MFWD 170 80,200 150 8 0.049 1.12 1.05 1.49 0.24 3.91 3.11 1.63 8.67 Plant - Folding 10R-30 MFWD 190 47,426 150 8 0.075 1.70 1.79 1.34 0.44 5.29 2.80 3.03 11.13 Plant - Folding 10R-38 MFWD 190 43,011 150 8 0.059 1.34 1.41 0.95 0.35 4.07 2.00 2.39 8.47 Plant - Folding 12R-20 MFWD 190 65,200 150 8 0.094 2.13 2.24 2.30 0.55 7.24 4.81 3.78 15.85 Plant - Folding 12R-30 MFWD 190 70,300 150 8 0.062 1.42 1.49 1.65 0.37 4.95 3.46 2.52 10.94 Plant - Folding 12R-38 MFWD 190 80,200 150 8 0.049 1.12 1.18 1.49 0.29 4.09 3.11 1.99 9.20 Plant - Folding 16R-30 MFWD 190 106,000 150 8 0.047 1.06 1.12 1.87 0.27 4.34 3.91 1.89 10.15 Plant - Folding 23R-15 MFWD 190 134,000 150 8 0.065 1.48 1.56 3.29 0.38 6.72 6.87 2.63 16.23 Plant - Folding 24R-20 MFWD 190 152,000 150 8 0.047 1.06 1.12 2.68 0.27 5.15 5.61 1.89 12.66 Plant - Folding 24R-30 MFWD 190 178,000 150 8 0.031 0.71 0.74 2.09 0.18 3.74 4.38 1.26 9.39 Plant - Rigid 4R-30 2WD 130 23,600 150 8 0.188 4.27 3.07 1.66 0.64 9.66 3.48 4.23 17.39 Plant - Rigid 4R-38 2WD 130 24,700 150 8 0.148 3.36 2.42 1.37 0.51 7.67 2.87 3.33 13.88 Plant - Rigid 6R-30 MFWD 150 30,900 150 8 0.125 2.84 2.36 1.45 0.55 7.22 3.04 3.59 13.86 Plant - Rigid 6R-38 MFWD 150 30,200 150 8 0.099 2.24 1.86 1.12 0.43 5.67 2.34 2.83 10.86 Plant - Rigid 8R-22 MFWD 170 18,473 150 8 0.127 2.89 2.73 0.88 0.61 7.13 1.85 4.21 13.20 Plant - Rigid 8R-30 MFWD 170 39,800 150 8 0.094 2.13 2.01 1.40 0.45 6.01 2.94 3.10 12.06 Plant - Rigid 8R-38 MFWD 170 37,200 150 8 0.074 1.68 1.59 1.03 0.36 4.68 2.17 2.45 9.31 Plant - Rigid 10R-30 MFWD 190 40,700 150 8 0.075 1.70 1.79 1.15 0.44 5.10 2.40 3.03 10.54 Plant - Rigid 12R-20 MFWD 190 47,900 150 8 0.094 2.13 2.24 1.69 0.55 6.63 3.53 3.78 13.96 Plant - Rigid 12R-30 MFWD 190 60,000 150 8 0.062 1.42 1.49 1.41 0.37 4.70 2.95 2.52 10.19 Plant - Rigid 15R-15 2WD 150 58,900 150 8 0.094 2.13 1.77 2.08 0.31 6.31 4.35 2.08 12.74 Pull Levee (1m/80a)) 4 blade 2WD 50 3,180 100 10 0.003 0.04 0.02 0.00 0.00 0.06 0.01 0.01 0.09 Roller 32' MFWD 170 22,800 100 12 0.046 0.52 0.99 0.17 0.22 1.92 1.09 1.53 4.56 Rotary Cutter 7' MFWD 130 5,280 185 10 0.168 1.90 2.74 0.72 0.65 6.03 0.55 4.29 10.88 Rotary Cutter 12' 2WD 150 12,100 185 10 0.098 1.11 1.85 0.96 0.33 4.25 0.73 2.16 7.16 Rotary Cutter 15' MFWD 150 22,100 185 10 0.078 0.89 1.48 1.40 0.34 4.12 1.07 2.24 7.44

50
Appendix Table 8. Implements: estimated purchase price, annual use, useful life, performance rate, (Continued) and direct and fixed cost per acre, Louisiana 2020. ___________________________________________________________________________________________________________________________ Power Purchase Annual Useful Perf Labor Fuel ---R&M---- Total --Fixed--- Total Item Name Size Unit Price Use Life Rate Imp. P.U. Direct Imp. P.U. Cost ___________________________________________________________________________________________________________________________ dollars hours years hr/ac ----------------------$/acre--------------------- Row Cond & Inc 13' 2WD 130 16,900 100 10 0.137 2.34 2.25 0.58 0.47 5.65 2.68 3.10 11.43 Row Cond & Inc 21' 2WD 170 20,800 100 10 0.085 1.45 1.82 0.44 0.41 4.13 2.04 2.83 9.01 Row Cond & Inc 26' MFWD 190 24,000 100 10 0.063 1.07 1.51 0.38 0.37 3.34 1.74 2.54 7.64 Row Cond & Inc 38' MFWD 225 29,600 100 10 0.047 0.80 1.33 0.34 0.33 2.81 1.60 2.27 6.70 Row Cond & Inc 42' MFWD 225 20,400 100 10 0.040 0.68 1.13 0.20 0.28 2.30 0.94 1.93 5.19 Row Cond (Harrow) 13' 2WD 130 7,300 100 10 0.114 1.30 1.87 0.20 0.39 3.78 0.96 2.58 7.32 Row Cond (Harrow) 21' 2WD 170 12,000 100 10 0.071 0.80 1.51 0.21 0.34 2.88 0.98 2.35 6.22 Row Cond (Harrow) 27' MFWD 190 12,400 100 10 0.057 0.65 1.37 0.17 0.33 2.53 0.81 2.30 5.66 Row Cond (Harrow) 38' MFWD 225 22,200 100 10 0.039 0.44 1.11 0.21 0.27 2.05 1.00 1.89 4.95 Row Cond (Harrow) 42' MFWD 225 15,582 100 10 0.035 0.40 1.00 0.13 0.25 1.79 0.63 1.71 4.15 Row Cond (Plant) 13' 2WD 130 7,120 100 10 0.157 1.78 2.56 0.27 0.54 5.16 1.28 3.53 9.98 Row Cond (Plant) 21' 2WD 170 11,700 100 10 0.097 1.10 2.07 0.28 0.47 3.93 1.30 3.22 8.47 Row Cond (Plant) 27' MFWD 190 12,400 100 10 0.078 0.89 1.87 0.24 0.46 3.47 1.12 3.15 7.75 Row Cond (Plant) 38' MFWD 225 16,587 100 10 0.053 0.60 1.51 0.22 0.38 2.73 1.02 2.59 6.35 Row Cond (Plant) 42' MFWD 225 15,582 100 10 0.048 0.55 1.37 0.18 0.34 2.46 0.87 2.34 5.68 RT Cult (Early) 8R-30 2WD 170 20,774 200 12 0.103 1.16 2.20 1.02 0.50 4.89 1.13 3.42 9.45 RT Cult (Early) 12R-30 2WD 190 29,998 200 12 0.068 0.77 1.64 0.98 0.30 3.71 1.09 2.09 6.90 RT Cult (Late) 8R-30 2WD 170 20,774 200 12 0.128 1.46 2.75 1.28 0.62 6.12 1.42 4.27 11.82 RT Cult (Late) 12R-30 2WD 190 29,998 200 12 0.085 0.97 2.05 1.23 0.38 4.64 1.37 2.61 8.62 RT Cult + PD (Early) 8R-30 2WD 150 20,774 200 12 0.110 1.86 2.07 1.09 0.37 5.40 1.21 2.42 9.04 RT Cult + PD (Early) 12R-30 MFWD 225 29,998 200 12 0.073 1.24 2.07 1.05 0.52 4.89 1.16 3.53 9.60 RT Cult + PD (Late) 8R-30 2WD 170 26,264 200 12 0.137 2.33 2.93 1.73 0.67 7.67 1.91 4.56 14.15 RT Cult + PD (Late) 12R-30 2WD 190 35,493 200 12 0.091 1.55 2.18 1.55 0.40 5.71 1.72 2.78 10.23 SC 3Row (Cover) 18 ft MFWD 150 10,750 200 9 0.120 1.36 2.26 1.43 0.52 5.60 0.51 3.44 9.56 SC 3Row (Hipper) 18 ft MFWD 150 10,500 200 9 0.120 1.36 2.26 0.68 0.52 4.83 0.88 3.43 9.14 SC 3Row (Marker) 18 ft MFWD 150 8,800 200 9 0.120 1.36 2.26 0.58 0.52 4.73 0.73 3.43 8.90 SC 3Row (Offbar) 18 ft MFWD 150 11,500 200 10 0.120 1.36 2.26 0.69 0.52 4.83 0.89 3.43 9.16 SC 3Row (Opener) 18 ft MFWD 150 7,800 200 10 0.120 1.36 2.26 0.46 0.52 4.61 0.60 3.43 8.65 SC 3Row Plow 18 ft MFWD 190 17,000 200 9 0.120 1.36 2.86 1.11 0.70 6.04 1.42 4.82 12.29 SC Blade 8 ft MFWD 150 3,500 100 12 0.877 9.93 16.52 2.55 3.83 32.86 2.52 25.08 60.47 SC Boom Sprayer 16 ft MFWD 150 2,900 150 10 0.120 1.36 2.26 0.25 0.52 4.40 0.30 3.43 8.13 SC Burning Unit 18 ft 2WD 105 1,300 85 6 0.149 1.69 1.97 0.24 0.32 4.24 0.43 2.12 6.80 SC Cane Planters Aid 6 ft MFWD 150 4,500 20 20 1.000 11.33 18.83 8.43 4.37 42.98 19.42 28.60 91.00 SC Cane Plt-1R Bille 1 row MFWD 150 22,000 150 20 0.670 7.59 12.62 3.68 2.93 26.82 8.48 19.16 54.47 SC Cane Plt-3R Bille 3 row 2WD 50 34,000 50 20 0.200 2.26 1.25 5.10 0.13 8.75 11.73 0.88 21.37 SC Cane Plt-Whlstalk 6 ft MFWD 150 22,000 150 20 0.670 7.59 12.62 3.68 2.93 26.82 8.48 19.16 54.47SC SC Cane Wagon 10T 10 Ton MFWD 150 7,500 400 15 0.500 6.23 10.36 0.62 2.40 19.62 0.94 14.30 34.86 SC Cane Wgn Billt HD 10Ton MFWD 150 40,000 750 9 0.600 7.47 12.43 5.33 2.88 28.13 4.34 17.16 49.63 SC Chisel Plow 13 ft MFWD 190 6,000 200 6 0.219 2.49 5.24 0.96 1.29 9.99 1.25 8.83 20.09 SC Chisel Plow 23 ft MFWD 190 12,000 200 6 0.120 1.36 2.86 0.49 0.70 5.42 1.37 4.82 11.62 SC Cultimulcher 12 ft 2WD 105 5,500 120 15 0.110 1.24 1.45 0.29 0.23 3.23 0.50 1.55 5.29 SC Cultivate + Post 6 Row 2WD 170 8,200 200 10 0.110 1.24 2.34 0.39 0.53 4.52 0.58 3.64 8.76 SC Cultivator 30" 6 Row 2WD 150 5,350 200 10 0.140 1.58 2.63 0.32 0.47 5.02 0.48 3.09 8.60 SC Disk 12 ft 2WD 50 8,500 200 10 0.149 1.69 0.94 0.56 0.10 3.30 0.82 0.66 4.79 SC Disk 20 ft MFWD 190 17,500 200 10 0.100 1.13 2.38 0.77 0.59 4.87 1.13 4.01 10.03 SC Disk 26 ft 2WD 170 21,000 200 10 0.069 0.79 1.49 0.64 0.34 3.27 0.95 2.32 6.55 SC Disk + Pre 6 row 2WD 170 9,250 200 10 0.100 1.13 2.13 0.40 0.48 4.16 0.60 3.31 8.08 SC Double Hitch DBLHTCH 2WD 50 0 1000 10 0.000 0.00 0.00 0.00 0.00 0.00 0.00 0.00 0.00 SC Drain Cleaner 6 ft MFWD 75 3,750 300 9 0.080 0.90 0.75 0.13 0.10 1.89 0.14 0.65 2.68 SC Fert 3Row Lq App 18 ft MFWD 150 7,000 200 10 0.130 1.47 2.44 0.36 0.56 4.85 0.59 3.71 9.16 SC Fert DrySlingApp 42 ft MFWD 150 6,500 150 10 0.059 0.67 1.13 0.22 0.26 2.30 0.33 1.71 4.35 SC Flat Roller 18 ft MFWD 150 1,400 75 9 0.190 2.15 3.58 0.47 0.83 7.04 0.49 5.43 12.97 SC Hauling Hitch 6 ft 4WD 225 1,000 500 15 1.000 11.33 28.25 0.13 4.59 44.31 0.20 31.27 75.79 SC Land Plane 15 ft MFWD 150 10,000 200 15 0.300 3.40 5.65 0.66 1.31 11.03 1.50 8.58 21.13 SC Rotary Ditcher 6 ft MFWD 150 12,500 100 10 0.250 2.83 4.70 3.12 1.09 11.76 4.06 7.15 22.97 SC Rotary Hoe 18 ft 2WD 130 4,500 75 12 0.080 0.90 1.30 0.41 0.27 2.89 0.54 1.79 5.24 SC Rotary Mower 13.1 ft MFWD 75 7,000 150 10 0.250 2.83 2.35 0.51 0.31 6.01 1.51 2.04 9.57 SC Rototiller 18 ft MFWD 190 20,000 150 10 0.219 2.49 5.24 3.51 1.29 12.54 3.80 8.83 25.19 SC Tractor Blade 6 ft 2WD 105 3,500 100 15 1.000 11.33 13.18 0.86 2.16 27.54 3.51 14.15 45.21 SC Tractor Spreader 20 ft 2WD 105 700 150 10 0.110 1.24 1.45 0.04 0.23 2.98 0.06 1.55 4.60 SC Trailer Utility 10 ft 2WD 130 2,000 200 15 1.000 11.33 16.32 0.23 3.43 31.32 1.00 22.47 54.80 SCMechanical Planter 6 ft MFWD 150 15,500 160 10 1.000 11.33 18.83 7.26 4.37 41.80 12.59 28.60 83.00 Spin Spreader 5 ton MFWD 190 12,900 100 8 0.042 0.95 1.00 0.30 0.24 2.51 0.66 1.69 4.86 Spin Spreader 5 ton MFWD 190 12,900 100 8 0.042 0.95 1.00 0.30 0.24 2.51 0.66 1.69 4.86 Spray (Band) 27' MFWD 170 7,400 200 8 0.062 1.06 1.33 0.21 0.30 2.92 0.28 2.06 5.27 Spray (Band) 40' MFWD 170 8,600 200 8 0.042 0.71 0.90 0.17 0.20 1.99 0.22 1.39 3.61 Spray (Band) 50' MFWD 170 13,700 200 8 0.033 0.57 0.72 0.21 0.16 1.67 0.28 1.11 3.07 Spray (Band) 53' MFWD 170 9,940 200 8 0.031 0.54 0.68 0.14 0.15 1.52 0.19 1.05 2.77 Spray (Band) 60' MFWD 170 15,600 200 8 0.028 0.47 0.60 0.20 0.13 1.42 0.26 0.92 2.62 Spray (Bcast/HB) 13' Rigid MFWD 150 6,900 200 8 0.130 2.21 2.45 0.42 0.56 5.65 0.55 3.72 9.92 Spray (Bcast/HB) 20' Rigid 2WD 50 8,100 200 8 0.084 1.43 0.53 0.32 0.05 2.34 0.42 0.37 3.14 Spray (Bcast/HB) 27' Fold MFWD 170 15,400 200 8 0.062 1.06 1.33 0.45 0.30 3.15 0.59 2.06 5.81

51
Appendix Table 8. Implements: estimated purchase price, annual use, useful life, performance rate, (Continued) and direct and fixed cost per acre, Louisiana 2020. ___________________________________________________________________________________________________________________________ Power Purchase Annual Useful Perf Labor Fuel ---R&M---- Total --Fixed--- Total Item Name Size Unit Price Use Life Rate Imp. P.U. Direct Imp. P.U. Cost ___________________________________________________________________________________________________________________________ dollars hours years hr/ac ----------------------$/acre--------------------- Spray (Bcast/HB) 27' Rigid MFWD 170 9,800 200 8 0.062 1.06 1.33 0.28 0.30 2.99 0.37 2.06 5.43 Spray (Bcast/HB) 30' Fold MFWD 170 18,930 200 8 0.056 0.95 1.20 0.50 0.27 2.93 0.65 1.85 5.45 Spray (Bcast/HB) 40' Fold MFWD 170 22,000 200 8 0.042 0.71 0.90 0.43 0.20 2.26 0.57 1.39 4.22 Spray (Bcast/HB/HD) 27' MFWD 170 22,400 200 8 0.062 1.06 1.33 0.65 0.30 3.36 0.86 2.06 6.29 Spray (Bcast/HB/HD) 40' MFWD 170 32,200 200 8 0.042 0.71 0.90 0.63 0.20 2.46 0.83 1.39 4.69 Spray (Broadcast) 27' MFWD 170 7,400 200 8 0.062 1.06 1.33 0.21 0.30 2.92 0.28 2.06 5.27 Spray (Broadcast) 40' MFWD 170 8,600 200 8 0.042 0.71 0.90 0.17 0.20 1.99 0.22 1.39 3.61 Spray (Broadcast) 50' MFWD 170 13,700 200 8 0.033 0.57 0.72 0.21 0.16 1.67 0.28 1.11 3.07 Spray (Broadcast) 53' MFWD 170 9,940 200 8 0.031 0.54 0.68 0.14 0.15 1.52 0.19 1.05 2.77 Spray (Broadcast) 60' MFWD 170 15,600 200 8 0.028 0.47 0.60 0.20 0.13 1.42 0.26 0.92 2.62 Spray (Direct/Hood) 8R-30 MFWD 170 20,400 200 8 0.084 1.43 1.80 0.80 0.40 4.46 1.05 2.78 8.31 Spray (Direct/Hood) 8R-38 MFWD 170 21,900 200 8 0.066 1.13 1.42 0.68 0.32 3.57 0.89 2.20 6.67 Spray (Direct/Hood) 12R-30 MFWD 170 25,300 200 8 0.056 0.95 1.20 0.66 0.27 3.10 0.87 1.85 5.83 Spray (Direct/Hood) 12R-38 MFWD 170 27,100 200 8 0.044 0.75 0.95 0.56 0.21 2.48 0.73 1.46 4.69 Spray (Direct/Layby) 8R-30 MFWD 170 11,300 200 8 0.084 1.43 1.80 0.44 0.40 4.10 0.58 2.78 7.47 Spray (Direct/Layby) 8R-38 MFWD 170 11,300 200 8 0.066 1.13 1.42 0.35 0.32 3.24 0.46 2.20 5.91 Spray (Direct/Layby) 8R-38 2x1 MFWD 170 14,900 200 8 0.044 0.75 0.95 0.31 0.21 2.23 0.40 1.46 4.10 Spray (Direct/Layby) 10R-30 MFWD 170 12,200 200 8 0.067 1.15 1.44 0.38 0.32 3.31 0.50 2.23 6.04 Spray (Direct/Layby) 12R-30 MFWD 170 14,900 200 8 0.056 0.95 1.20 0.39 0.27 2.83 0.51 1.85 5.20 Spray (Direct/Layby) 12R-38 MFWD 170 14,900 200 8 0.044 0.75 0.95 0.31 0.21 2.23 0.40 1.46 4.10 Spray (Direct/Layby) 16R-20 MFWD 170 22,300 200 8 0.063 1.07 1.35 0.66 0.30 3.39 0.86 2.08 6.35 Spray (Spot) 27' MFWD 170 7,400 200 8 0.062 1.06 1.33 0.21 0.30 2.92 0.28 2.06 5.27 Spray (Spot) 40' MFWD 170 8,600 200 8 0.042 0.71 0.90 0.17 0.20 1.99 0.22 1.39 3.61 Spray (Spot) 50' MFWD 170 13,700 200 8 0.033 0.57 0.72 0.21 0.16 1.67 0.28 1.11 3.07 Spray (Spot) 53' MFWD 170 9,940 200 8 0.031 0.54 0.68 0.14 0.15 1.52 0.19 1.05 2.77 Spray (Spot) 60' MFWD 170 15,600 200 8 0.028 0.47 0.60 0.20 0.13 1.42 0.26 0.92 2.62 Stalk Shredder 14' MFWD 150 14,500 200 10 0.117 1.33 2.22 1.49 0.51 5.56 0.98 3.37 9.92 Stalk Shredder 20' MFWD 150 30,700 200 10 0.082 0.93 1.55 2.21 0.36 5.06 1.45 2.35 8.88 Stalk Shredder-Flail 12' MFWD 150 20,500 200 10 0.137 1.55 2.59 2.46 0.60 7.21 1.62 3.93 12.76 Stalk Shredder-Flail 20' MFWD 150 30,100 200 10 0.082 0.93 1.55 2.17 0.36 5.02 1.42 2.35 8.81 Subsoiler 3 shank MFWD 190 5,920 100 15 0.204 2.31 4.87 0.40 1.20 8.80 1.11 8.21 18.12 Subsoiler 4 shank MFWD 225 9,830 100 15 0.153 1.74 4.34 0.50 1.08 7.67 1.38 7.41 16.48 Subsoiler 5 shank MFWD 225 13,900 100 15 0.122 1.38 3.45 0.56 0.86 6.27 1.56 5.90 13.75 Subsoiler low-till 4 shank MFWD 225 9,830 100 15 0.153 1.74 4.34 0.50 1.08 7.67 1.38 7.41 16.48 Subsoiler low-till 6 shank MFWD 225 15,300 100 15 0.102 1.15 2.88 0.52 0.72 5.29 1.43 4.93 11.66 Subsoiler low-till 8 shank MFWD 225 22,000 100 15 0.076 0.86 2.16 0.56 0.54 4.13 1.54 3.69 9.37 TerraTill Bed w/roll 4R-38 MFWD 225 14,300 150 12 0.160 1.82 4.54 0.83 1.14 8.34 1.58 7.76 17.69 TerraTill Bed w/roll 6R-38 MFWD 225 19,400 150 12 0.107 1.21 3.03 0.75 0.76 5.77 1.43 5.19 12.40 TerraTill Bed w/roll 4R-30 MFWD 225 14,300 150 12 0.204 2.31 5.77 1.05 1.44 10.59 2.01 9.86 22.47 TerraTill Bed w/roll 6R-30 MFWD 225 15,310 150 12 0.136 1.54 3.84 0.75 0.96 7.11 1.43 6.57 15.12 ___________________________________________________________________________________________________________________________