QQuuaalliittyy aanndd RReelliiaabbiilliittyy ... · QQuuaalliittyy aanndd RReelliiaabbiilliittyy...
14
White Paper: Quality and Reliability 1 Q Q u u a a l l i i t t y y a a n n d d R R e e l l i i a a b b i i l l i i t t y y W W h h i i t t e e p p a a p p e e r r All POS systems are not created equal Table of Contents 1. Executive Summary 2. Profitability in the retail value chain a. Stair steps: Infrastructure, Customer experience, Sales b. Metrics: Up-time, Customer satisfaction, System life cycle cost, Operating profit c. Best-in-Class, Industry Average, Laggards 3. POS solutions built to last a. hardware, software, customer support components b. Total Cost of Ownership (TCO) versus Initial Purchase Price c. POS lifecycle d. An investment, not a cost 4. System Up-time and the customer shopping experience a. Components of the hardware part of a POS solution b. POS quality and reliability c. Services that are responsive, even predictive d. The Transaction vs. the Experience 5. Posiflex designs-manufactures-partners a. Posiflex Quality Strategy b. Design, select, build, assemble, test, package c. Partnership with distribution, ISV’s, resellers Figure 1: Profitability in the Retail Value Chain Figure 2: In-store customer satisfaction rate and system up-time Figure 3: Metrics for Up-Time, customer satisfaction, system life cycle cost, operating profit Figure 4: Quality and Reliability of POS Hardware Figure 5: Metrics for System Up -Time and Store Operating Profit Figure 6: Building Blocks to Profitability Figure 7: Purchase Price vs TCO of POS Solution Figure 8: Total Cost of Ownership, TCO Figure 9: Components of the Hardware System Figure 10: Building Blocks to POS Availability Figure 11: All POS systems are not created equal Figure 12: Posiflex Total Cost of ownership Beats the Competition
Transcript of QQuuaalliittyy aanndd RReelliiaabbiilliittyy ... · QQuuaalliittyy aanndd RReelliiaabbiilliittyy...
White Paper: Quality and Reliability 1
QQuuaalliittyy aanndd RReelliiaabbiilliittyy WWhhiitteeppaappeerr
AAllll PPOOSS ssyysstteemmss aarree nnoott ccrreeaatteedd eeqquuaall
Table of Contents
1. Executive Summary 2. Profitability in the retail value chain a. Stair steps: Infrastructure, Customer experience, Sales b. Metrics: Up-time, Customer satisfaction, System life cycle cost, Operating profit c. Best-in-Class, Industry Average, Laggards
3. POS solutions built to last a. hardware, software, customer support components b. Total Cost of Ownership (TCO) versus Initial Purchase Price c. POS lifecycle d. An investment, not a cost
4. System Up-time and the customer shopping experience a. Components of the hardware part of a POS solution b. POS quality and reliability c. Services that are responsive, even predictive d. The Transaction vs. the Experience
5. Posiflex designs-manufactures-partners
a. Posiflex Quality Strategy
b. Design, select, build, assemble, test, package
c. Partnership with distribution, ISV’s, resellers
Figure 1: Profitability in the Retail Value Chain
Figure 2: In-store customer satisfaction rate and system up-time
Figure 3: Metrics for Up-Time, customer satisfaction, system life cycle cost, operating profit
Figure 4: Quality and Reliability of POS Hardware
Figure 5: Metrics for System Up -Time and Store Operating Profit
Figure 6: Building Blocks to Profitability
Figure 7: Purchase Price vs TCO of POS Solution
Figure 8: Total Cost of Ownership, TCO
Figure 9: Components of the Hardware System
Figure 10: Building Blocks to POS Availability
Figure 11: All POS systems are not created equal
Figure 12: Posiflex Total Cost of ownership Beats the Competition
White Paper: Quality and Reliability 2
Executive summary
POS hardware, POS software and POS services help transform shoppers into satisfied buyers. How do you guarantee maximum system uptime for your customers?
A retail shop or restaurant or cinema or grocery or convenience store provides an environment for shoppers that
delivers its signature ambiance, provides information services for the customer and makes available products and
services to purchase. The value chain starts with the physical infrastructure of the facility and adds tools and
personal assistance from employees to serve the needs of the shopper. This value chain is designed to create a
positive shopping experience that transforms the shopper into a customer when he or she makes a first purchase. If
the experience is positive enough the customer will return another time and buy again. A repeat customer can
become a loyal customer and that leads to retail profit. The pieces of the value chain puzzle need to fit together so
the shopping experience is seamless and repeatable. A value chain that breaks down can produce a negative
shopping experience and not only lead to no sale that day, but also lead to no sale, ever.
POS systems are integral parts of today’s retail infrastructure and market researchers survey retailers and track
metrics of system up-time, customer satisfaction of the in-store shopping experience, changes year over year in
system life cycle cost, and changes year over year in store operating profit. According to Aberdeen Group’s survey
(Anand, S. 2009. The automated and connected store- next generation shopping experience), the top 20% Best-in-
Class retailers differ from the mid 50% Industry Average retailers and the bottom 30% Laggard retailers in terms of
the attention paid to the business processes that score these metrics.
On the basis of averages of 107 surveyed retailers, a difference of 13% points in system up-time correlates with a
difference in customer satisfaction of 15% points, and that correlates with a difference in change of life cycle costs
of 13% points and a change of operating profit of 8% points. That 8% point difference in year over year change in in-
store operating profit is an operating profit increase of 9% versus an operating profit increase of 1%. This is not the
same as net margin. Rather it is change in net margin and a significant 900% difference.
This white paper makes the case for the components of a total POS solution, quality POS hardware, quality POS
software and quality POS customer support, resulting in POS reliability and high system up-time. If the retailer can
achieve 98% system up-time versus 85% uptime the business will do better, most likely much better. One cannot
claim that there will be a direct cause-effect of high system up-time on exact positive change in in-store operating
profit, since many factors enter into final calculations of bottom line operating profit, beyond these four metrics. But
investors and boards of directors will draw their own conclusions about the value of high system up-time. So how do
POS hardware and POS software and POS customer support deliver these quality products and services?
This whitepaper is part one of a three part series that provides a framework for evaluating vendors that will be
White Paper: Quality and Reliability 3
useful for prospective customers of POS systems. POS hardware vendors build computer systems used in POS
applications with different approaches and these approaches produce differing standards of quality and reliability.
Since the cost of the POS processor and touch screen is typically half of the installed cost of the full system with
peripherals, and since the total cost of ownership over the life of the POS system can be three to four times the
original purchase price, it makes good business sense when investing in a business capital asset that drives customer
satisfaction to buy quality hardware that produces a reliable business process. It never makes good business sense
to plan on having to cope with broken systems that make it difficult for the customer to make a purchase. Investing
in quality has always been a wise move for those who think long term and choose to focus on delivering their own
special advantages to the in-store customer experience instead of coping with the shortcomings of a lowest bid
product.
This whitepaper concludes with characterization of the Posiflex approach to designing for quality and manufacturing
for reliability and longevity.
White Paper: Quality and Reliability 4
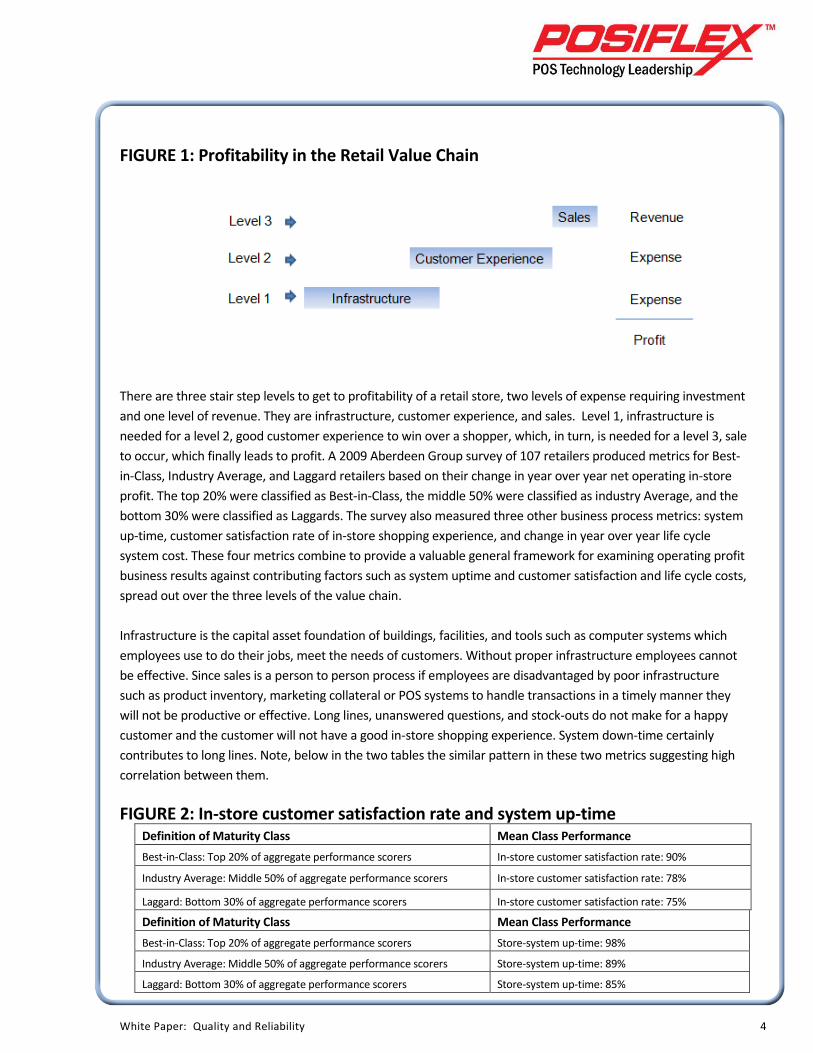
FIGURE 1: Profitability in the Retail Value Chain
There are three stair step levels to get to profitability of a retail store, two levels of expense requiring investment
and one level of revenue. They are infrastructure, customer experience, and sales. Level 1, infrastructure is
needed for a level 2, good customer experience to win over a shopper, which, in turn, is needed for a level 3, sale
to occur, which finally leads to profit. A 2009 Aberdeen Group survey of 107 retailers produced metrics for Best-
in-Class, Industry Average, and Laggard retailers based on their change in year over year net operating in-store
profit. The top 20% were classified as Best-in-Class, the middle 50% were classified as industry Average, and the
bottom 30% were classified as Laggards. The survey also measured three other business process metrics: system
up-time, customer satisfaction rate of in-store shopping experience, and change in year over year life cycle
system cost. These four metrics combine to provide a valuable general framework for examining operating profit
business results against contributing factors such as system uptime and customer satisfaction and life cycle costs,
spread out over the three levels of the value chain.
Infrastructure is the capital asset foundation of buildings, facilities, and tools such as computer systems which
employees use to do their jobs, meet the needs of customers. Without proper infrastructure employees cannot
be effective. Since sales is a person to person process if employees are disadvantaged by poor infrastructure
such as product inventory, marketing collateral or POS systems to handle transactions in a timely manner they
will not be productive or effective. Long lines, unanswered questions, and stock-outs do not make for a happy
customer and the customer will not have a good in-store shopping experience. System down-time certainly
contributes to long lines. Note, below in the two tables the similar pattern in these two metrics suggesting high
correlation between them.
FIGURE 2: In-store customer satisfaction rate and system up-time Definition of Maturity Class Mean Class Performance
Best-in-Class: Top 20% of aggregate performance scorers In-store customer satisfaction rate: 90%
Industry Average: Middle 50% of aggregate performance scorers In-store customer satisfaction rate: 78%
Laggard: Bottom 30% of aggregate performance scorers In-store customer satisfaction rate: 75%
Definition of Maturity Class Mean Class Performance
Best-in-Class: Top 20% of aggregate performance scorers Store-system up-time: 98%
Industry Average: Middle 50% of aggregate performance scorers Store-system up-time: 89%
Laggard: Bottom 30% of aggregate performance scorers Store-system up-time: 85%
White Paper: Quality and Reliability 5
FIGURE 4: Quality and Reliability of POS Hardware
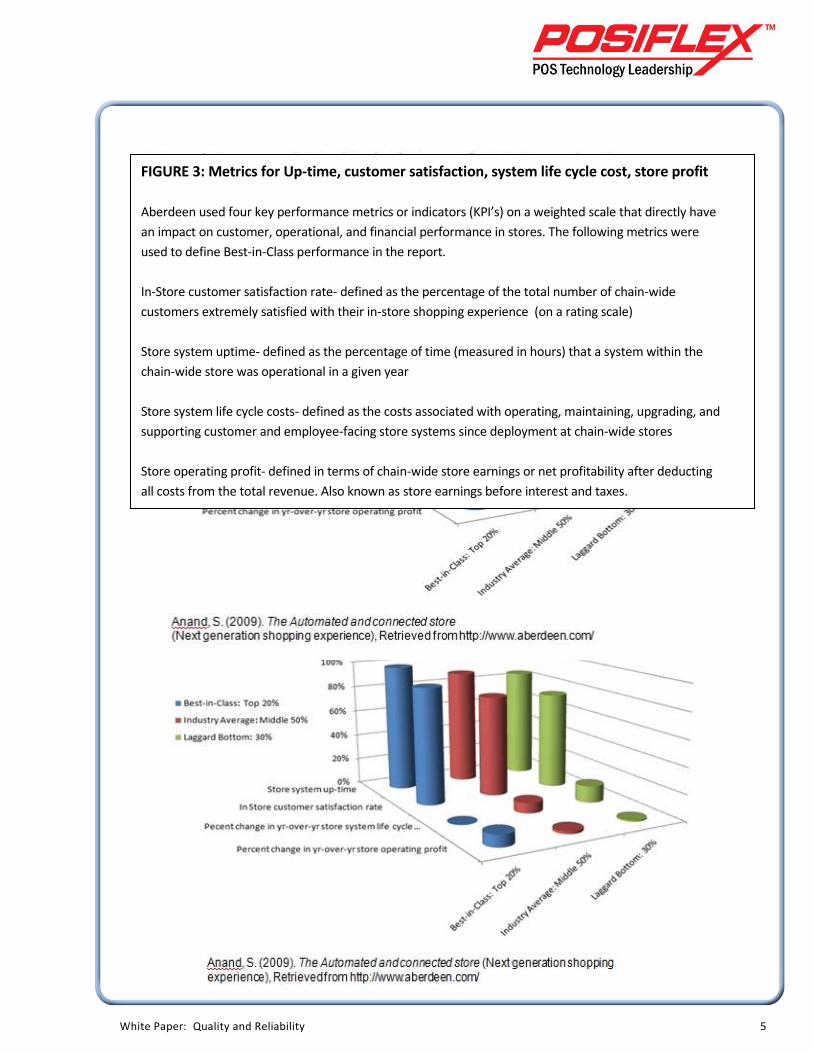
FIGURE 3: Metrics for Up-time, customer satisfaction, system life cycle cost, store profit
Aberdeen used four key performance metrics or indicators (KPI’s) on a weighted scale that directly have
an impact on customer, operational, and financial performance in stores. The following metrics were
used to define Best-in-Class performance in the report.
In-Store customer satisfaction rate- defined as the percentage of the total number of chain-wide
customers extremely satisfied with their in-store shopping experience (on a rating scale)
Store system uptime- defined as the percentage of time (measured in hours) that a system within the
chain-wide store was operational in a given year
Store system life cycle costs- defined as the costs associated with operating, maintaining, upgrading, and
supporting customer and employee-facing store systems since deployment at chain-wide stores
Store operating profit- defined in terms of chain-wide store earnings or net profitability after deducting
all costs from the total revenue. Also known as store earnings before interest and taxes.
White Paper: Quality and Reliability 6
FIGURE 5: Metrics for system life cycle cost and store operating profit
Definition of Maturity Class Mean Class Performance
Best-in-Class: Top 20% of aggregate performance scorers Percentage change in year-over-year store
system lifecycle costs: 0%
Industry Average: Middle 50% of aggregate performance scorers Percentage change in year-over-year store
system lifecycle costs: 8%
Laggard: Bottom 30% of aggregate performance scorers Percentage change in year-over-year store
system lifecycle costs: 13%
Definition of Maturity Class Mean Class Performance
Best-in-Class: Top 20% of aggregate performance scorers Percentage change in year-over-year store
operating profit: 9%
Industry Average: Middle 50% of aggregate performance scorers Percentage change in year-over-year store
operating profit: 2%
Laggard: Bottom 30% of aggregate performance scorers Percentage change in year-over-year store
operating profit: 1%
So if Laggard retailers adopt business practices and processes that result in system down time of 15% per year,
that translates into 54 days a year or 4.5 days a month! That’s being down and unable to take orders one day a
week! It’s no wonder that Laggards experience higher system life cycle costs since they are almost continuously
reacting and repairing and not selling. It is also not surprising that Laggards experience year over year gains in
operating profit that are much smaller than the year over year gains of the Best-in-Class retailers.
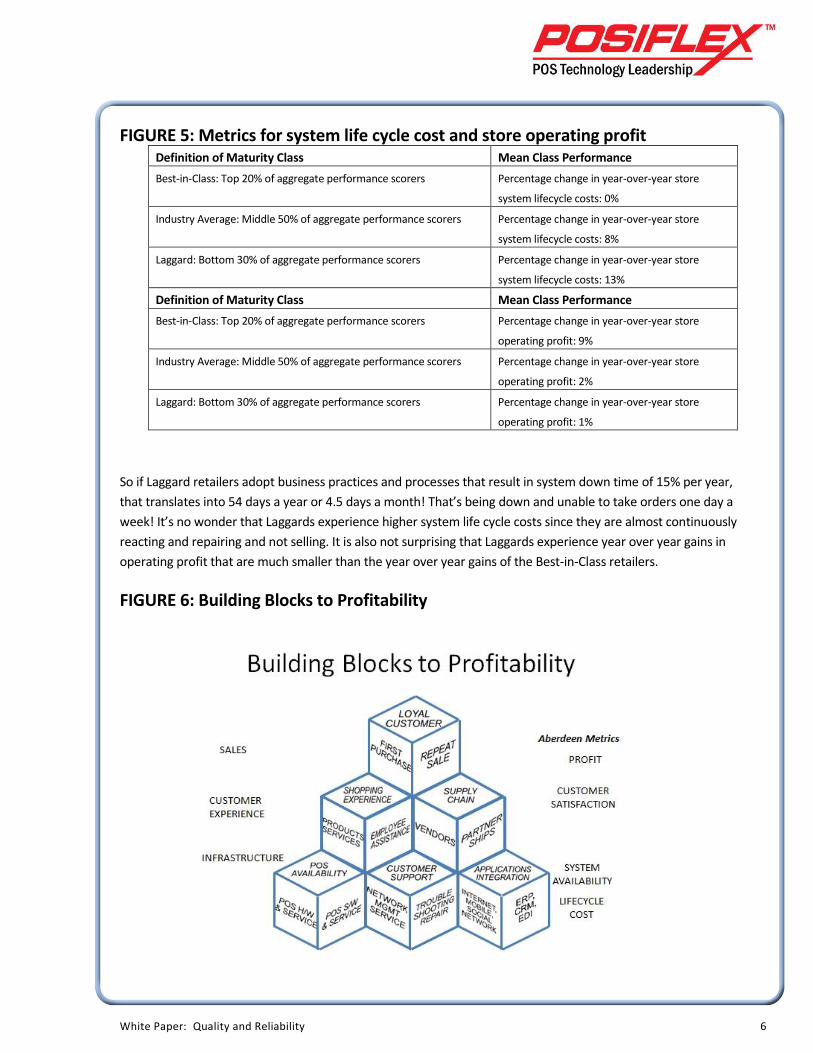
FIGURE 6: Building Blocks to Profitability
White Paper: Quality and Reliability 7
So, for example, in the three dimensional Building Blocks to Profitability figure, POS Hardware and service plus
POS S/W and service plus POS customer support together produce POS Availability. All three elements are
required and whether these components come from a single vendor with dedicated hardware and software or
from a one stop shopping value added reseller who selects the best components for the retailer and delivers a
complete solution, it is clear that only high reliability hardware and high quality software produce high
availability POS systems. And high availability POS systems provide one aspect of a good shopping experience for
a prospective customer. Coupled with the right products and services and employee assistance the shopper will
have a good shopping experience. He or she will make a first purchase and be satisfied. This will lead to a return
visit, a repeat purchase and eventually a loyal customer. Repeat business leads to profitability.
Of course, other building blocks are required to support sales and profits as well. If there are no products to sell
due to problems with the supply chain the shopping experience will be compromised. And if the POS
applications are not properly integrated into other backroom and corporate systems and customer relationship
systems, data from POS will not be available to influence decision making to enable personalized selling to the
retailer’s most strategic and profitable target market segments.
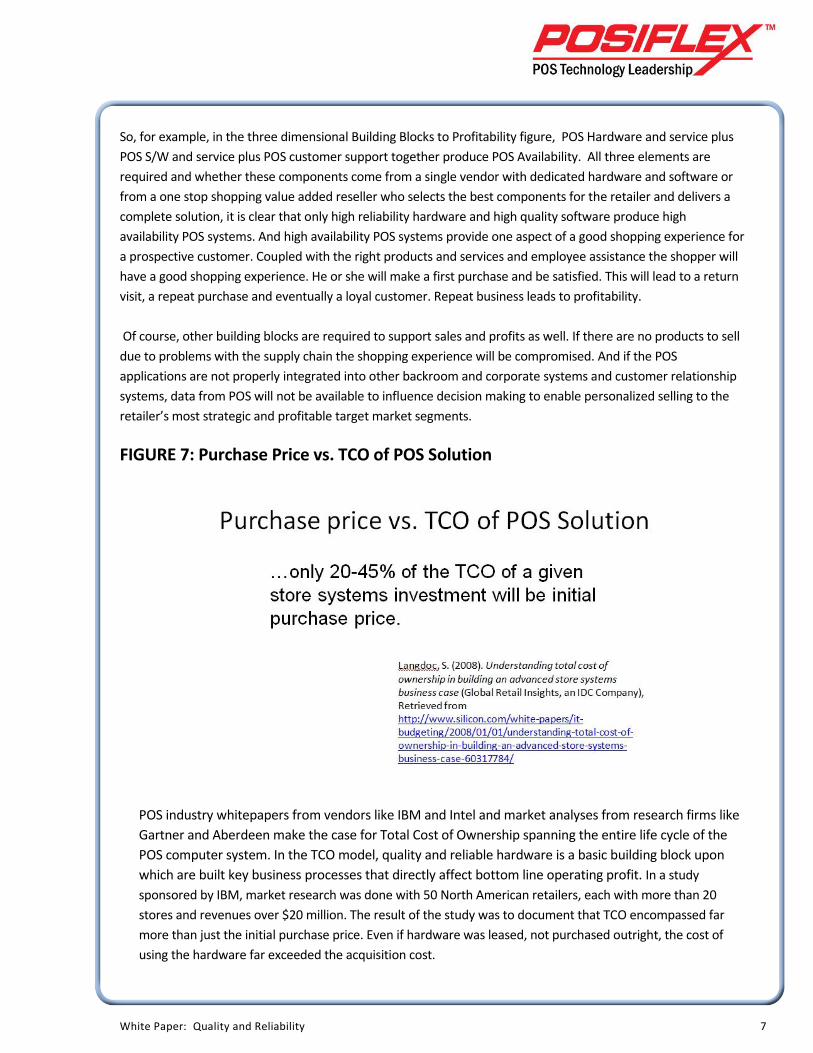
FIGURE 7: Purchase Price vs. TCO of POS Solution
POS industry whitepapers from vendors like IBM and Intel and market analyses from research firms like
Gartner and Aberdeen make the case for Total Cost of Ownership spanning the entire life cycle of the
POS computer system. In the TCO model, quality and reliable hardware is a basic building block upon
which are built key business processes that directly affect bottom line operating profit. In a study
sponsored by IBM, market research was done with 50 North American retailers, each with more than 20
stores and revenues over $20 million. The result of the study was to document that TCO encompassed far
more than just the initial purchase price. Even if hardware was leased, not purchased outright, the cost of
using the hardware far exceeded the acquisition cost.
White Paper: Quality and Reliability 8
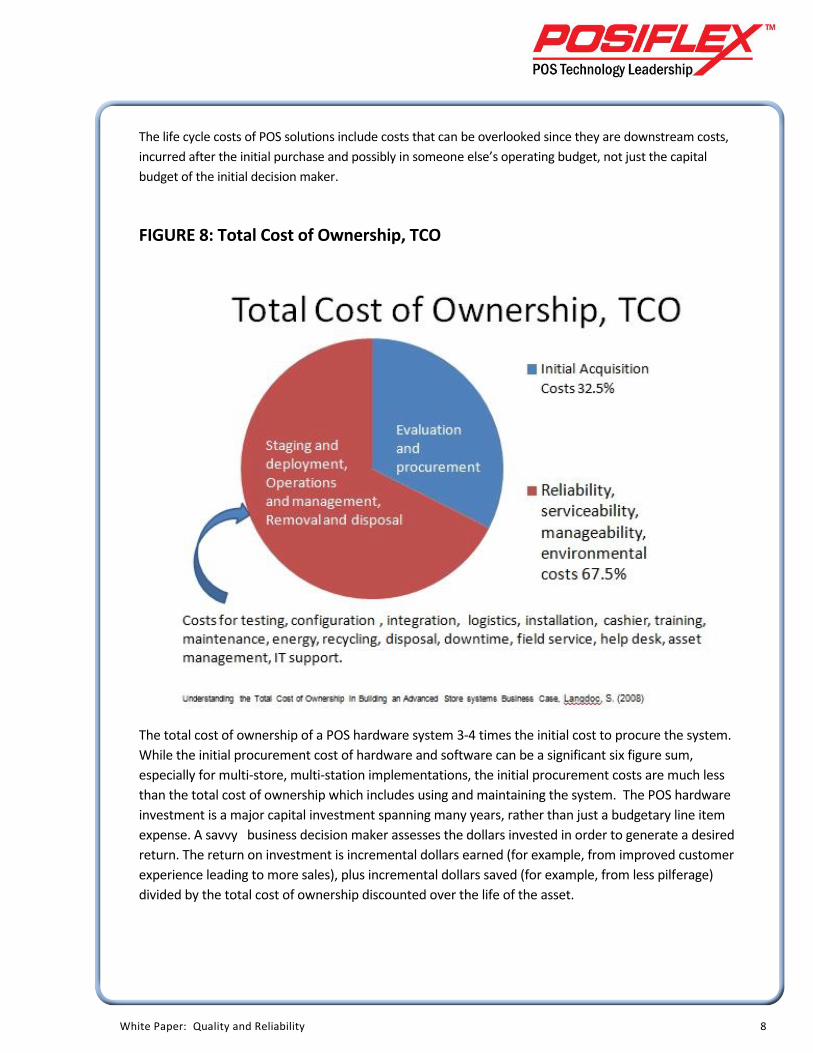
The life cycle costs of POS solutions include costs that can be overlooked since they are downstream costs,
incurred after the initial purchase and possibly in someone else’s operating budget, not just the capital
budget of the initial decision maker.
FIGURE 8: Total Cost of Ownership, TCO
The total cost of ownership of a POS hardware system 3-4 times the initial cost to procure the system.
While the initial procurement cost of hardware and software can be a significant six figure sum,
especially for multi-store, multi-station implementations, the initial procurement costs are much less
than the total cost of ownership which includes using and maintaining the system. The POS hardware
investment is a major capital investment spanning many years, rather than just a budgetary line item
expense. A savvy business decision maker assesses the dollars invested in order to generate a desired
return. The return on investment is incremental dollars earned (for example, from improved customer
experience leading to more sales), plus incremental dollars saved (for example, from less pilferage)
divided by the total cost of ownership discounted over the life of the asset.
White Paper: Quality and Reliability 9
Reliability The costs of poor hardware reliability include downtime opportunity costs of lost sales, as well as the explicit
cost in time and money of dealing with a broken POS system. The troubleshooting and repair and
reconfiguration of the system and restoration of data all cost money and require deployment of technical
expertise from within the retailer’s organization even if experts from the service provider or manufacturer
are involved. The more failures occur, the more costly for the retailer, so selection of high reliability hardware
is obviously a wise move, even if that hardware costs slightly more than bargain-basement priced hardware
with poor reliability.
Serviceability and Manageability
When in-house IT personnel or reseller technical support personnel open up a POS terminal the process
might take minutes or seconds, require many steps or just a few, involve use of numerous tools or none.
When the terminal is initially configured and installed the process might take minutes or hours.
Thoughtfulness of design of the terminal I/O configuration and the out-of-the-box complement of cables for
easy wall mount or tabletop mount POS application make a difference to the cost incurred by service
personnel.
Environmental In addition to recycle and disposal costs at end of life, the cost of energy to power the terminal over its life
cycle can be significant. Most hardware vendors use off-the-shelf industry motherboards to build their
machines and rely on the latest in CPU processor energy saving designs to achieve energy savings. They tout
up to 50% energy savings compared to older generation computers. POS terminals designed from the
motherboard up can achieve significant energy savings based on hardware design even before taking
advantage of CPU processor software energy saving functions.
So the consequences of making a “lowest bid” purchase decision can be significant for hardware and for
software for years and years. For example, unreliable hardware can result in unplanned and excessive
downtime of customer facing systems and that can lead to customer dissatisfaction and higher than
expected maintenance costs and significant lost sales.
So, selection of the right POS hardware can reduce the cost of staging, deploying, operating, managing,
removing and ultimately disposing of the asset. And selection of the right hardware can enhance the
revenue generated as well, by being up 98% or more of the time, always ready to reliably and quickly
process customer purchase transactions. Also hardware with an industry leading, long useful life cycle
will be a work horse that can stretch the return on investment to be a highly economical and profitable
double digit positive investment. The purchase decision is actually an investment decision. It’s an
investment, not a cost.
White Paper: Quality and Reliability 10
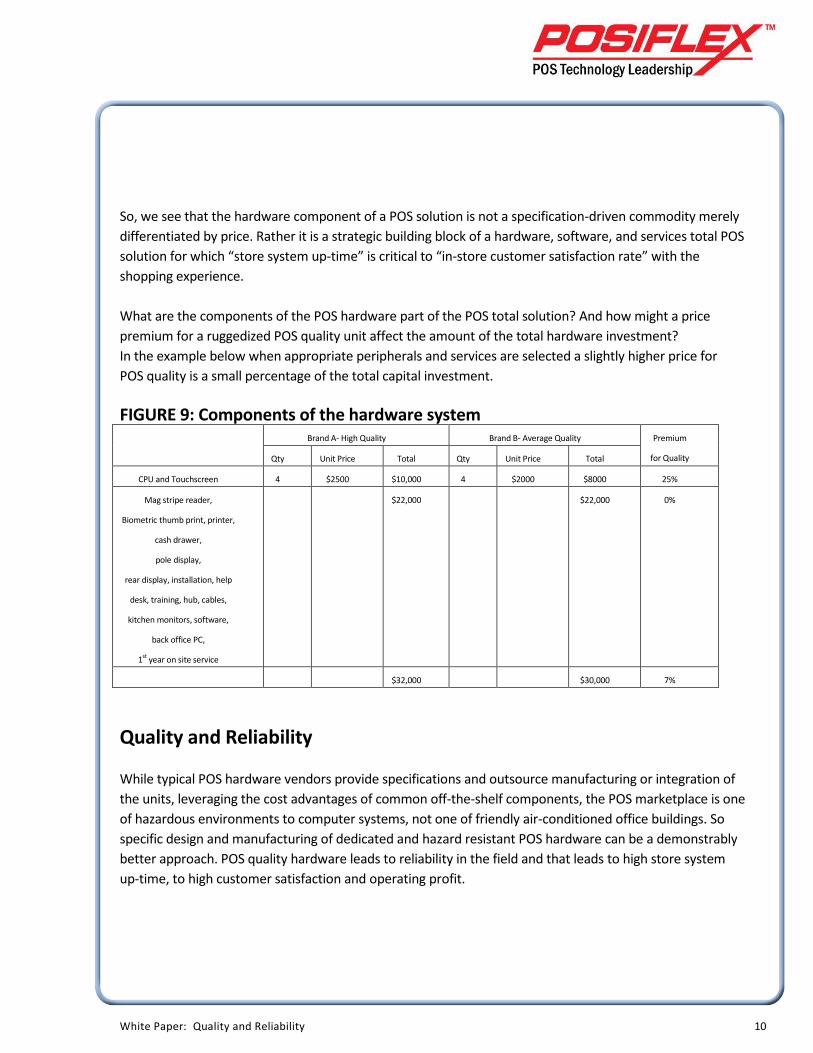
So, we see that the hardware component of a POS solution is not a specification-driven commodity merely
differentiated by price. Rather it is a strategic building block of a hardware, software, and services total POS
solution for which “store system up-time” is critical to “in-store customer satisfaction rate” with the
shopping experience.
What are the components of the POS hardware part of the POS total solution? And how might a price
premium for a ruggedized POS quality unit affect the amount of the total hardware investment?
In the example below when appropriate peripherals and services are selected a slightly higher price for
POS quality is a small percentage of the total capital investment.
FIGURE 9: Components of the hardware system Brand A- High Quality Brand B- Average Quality Premium
for Quality Qty Unit Price Total Qty Unit Price Total
CPU and Touchscreen 4 $2500 $10,000 4 $2000 $8000 25%
Mag stripe reader,
Biometric thumb print, printer,
cash drawer,
pole display,
rear display, installation, help
desk, training, hub, cables,
kitchen monitors, software,
back office PC,
1st year on site service
$22,000
$22,000 0%
$32,000 $30,000 7%
Quality and Reliability
While typical POS hardware vendors provide specifications and outsource manufacturing or integration of
the units, leveraging the cost advantages of common off-the-shelf components, the POS marketplace is one
of hazardous environments to computer systems, not one of friendly air-conditioned office buildings. So
specific design and manufacturing of dedicated and hazard resistant POS hardware can be a demonstrably
better approach. POS quality hardware leads to reliability in the field and that leads to high store system
up-time, to high customer satisfaction and operating profit.
White Paper: Quality and Reliability 11
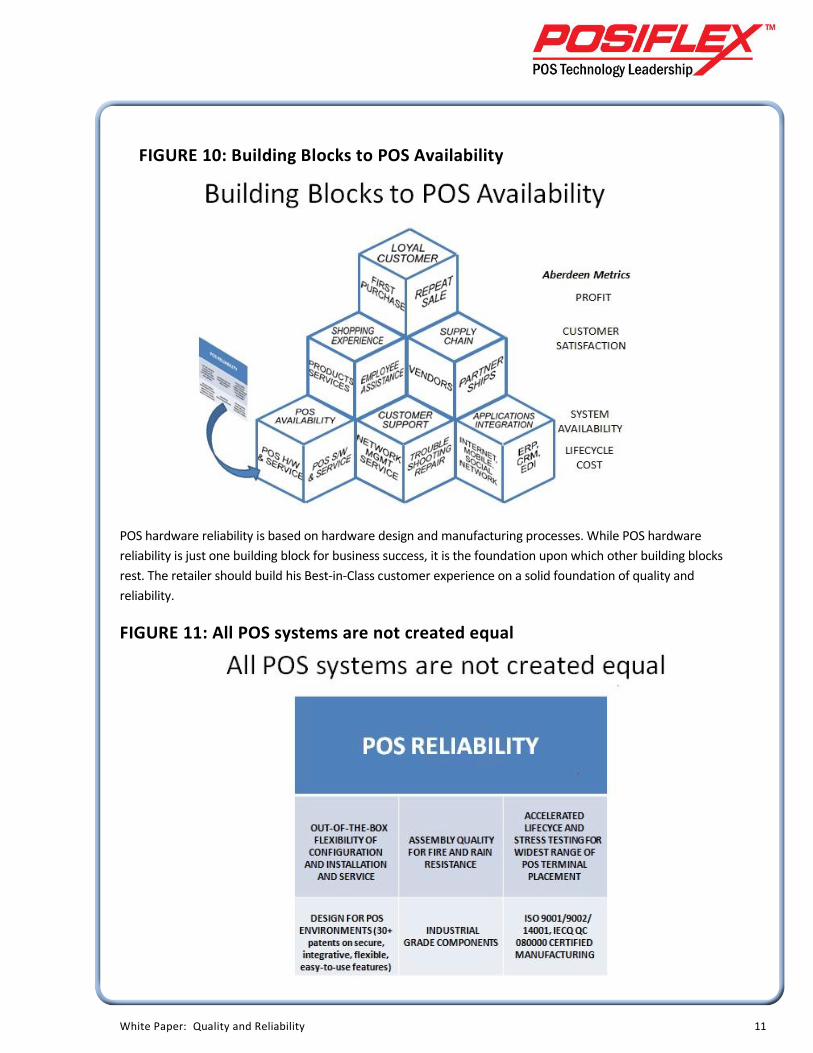
FIGURE 10: Building Blocks to POS Availability
POS hardware reliability is based on hardware design and manufacturing processes. While POS hardware
reliability is just one building block for business success, it is the foundation upon which other building blocks
rest. The retailer should build his Best-in-Class customer experience on a solid foundation of quality and
reliability.
FIGURE 11: All POS systems are not created equal
White Paper: Quality and Reliability 12
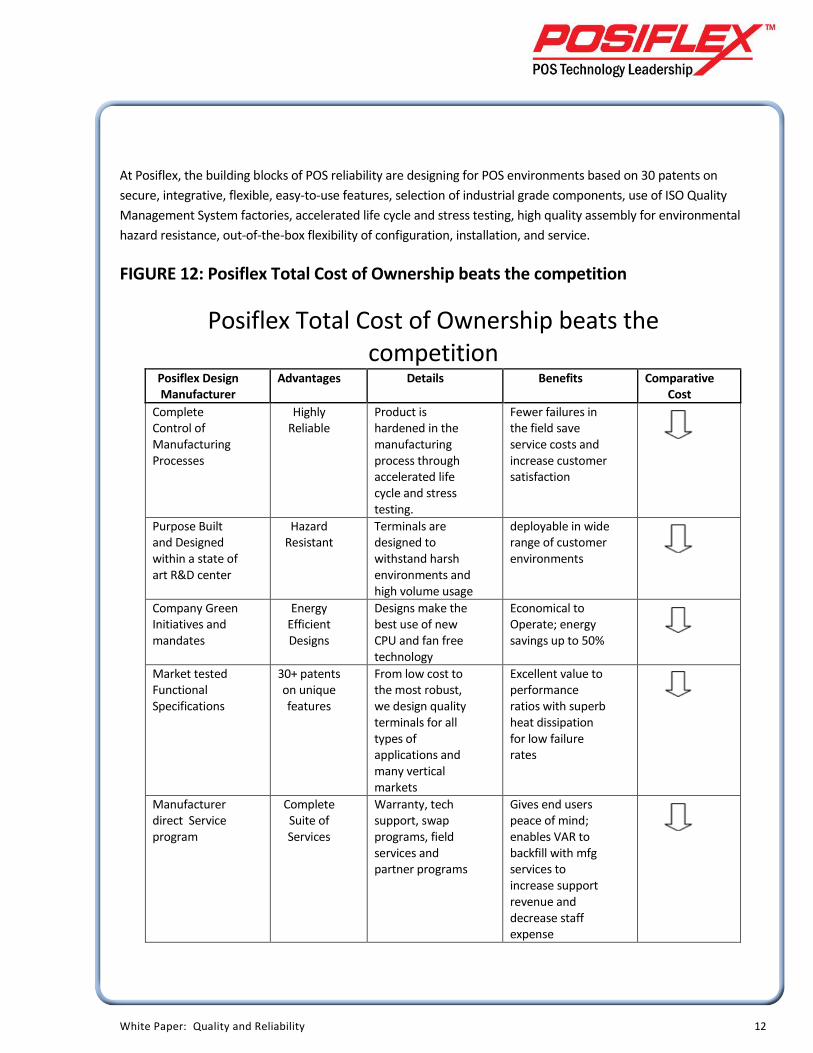
At Posiflex, the building blocks of POS reliability are designing for POS environments based on 30 patents on
secure, integrative, flexible, easy-to-use features, selection of industrial grade components, use of ISO Quality
Management System factories, accelerated life cycle and stress testing, high quality assembly for environmental
hazard resistance, out-of-the-box flexibility of configuration, installation, and service.
FIGURE 12: Posiflex Total Cost of Ownership beats the competition
Posiflex Total Cost of Ownership beats the competition
Posiflex Design Manufacturer
Advantages Details Benefits Comparative Cost
Complete Control of Manufacturing Processes
Highly Reliable
Product is hardened in the manufacturing process through accelerated life cycle and stress testing.
Fewer failures in the field save service costs and increase customer satisfaction
Purpose Built and Designed within a state of art R&D center
Hazard Resistant
Terminals are designed to withstand harsh environments and high volume usage
deployable in wide range of customer environments
Company Green Initiatives and mandates
Energy Efficient Designs
Designs make the best use of new CPU and fan free technology
Economical to Operate; energy savings up to 50%
Market tested Functional Specifications
30+ patents on unique features
From low cost to the most robust, we design quality terminals for all types of applications and many vertical markets
Excellent value to performance ratios with superb heat dissipation for low failure rates
Manufacturer direct Service program
Complete Suite of Services
Warranty, tech support, swap programs, field services and partner programs
Gives end users peace of mind; enables VAR to backfill with mfg services to increase support revenue and decrease staff expense
White Paper: Quality and Reliability 13
Posiflex designs and manufactures for the retailer that plans POS systems investments strategically, keeping
in mind minimizing TCO and maximizing the effectiveness of the customer shopping experience. Posiflex
brings to the market families of thoughtfully designed and manufactured POS terminals, customer
satisfaction engines that are the hardware building blocks of POS systems that drive sales and profitability.
As a technology leader in POS design and manufacturing, Posiflex is not limited to working solely with off
the shelf components. Posiflex is known for working with ISV’s and service partners to implement solutions
that meet the needs of specific customer segments. Posiflex has technology partnerships with component
suppliers to offer building block solutions for self-service kiosks that supplement on-site customer
employee assistance. Self–service kiosks enable online ordering and in-store pickup and many customer
friendly information services such as bridal registries, etc… Customer facing screens at POS checkout
terminals facilitate enhanced sales through customer-relevant, instant promotions. On-site capturing of
customer contact data and product preferences enables the retailer to enhance the customer relationship
by offering opt-in newsletters and promotional offers. These tools maintain a dialog with the customer and
draw the customer back into the store, they facilitate the customer making referrals to the retailer as well.
Client-server solutions that lower the per terminal cost of POS solutions are also being deployed. Some of
the clients are slave touch screens, some are mobile handheld units.
Continuous improvement in reducing the cost of purchase transactions and serving the customer’s
information needs are expected in the competitive Point-of Sale/Service marketplace. One important
aspect of reducing the total cost of ownership is access to efficient hardware and systems service. ISVs and
resellers will increasingly rely on outsourced solutions as the cost and complexity of providing immediate
service rises. A benefit to manufacturer direct services such as next business day exchange and onsite
swap services is the deep understanding of hardware revision control and providing replacements as fast
as possible that are guaranteed to work and provide a first time resolution. In addition to providing
hardware exchange and extended warranty programs, Posiflex offers a complete and competitive remote
solution tool to provide network monitoring, automatic update and patch deployment, remote access,
alerts and dashboard summary information by customized or ad-hoc groupings. Network management
tools that enable proactive system and peripheral monitoring and that enable remote troubleshooting are
increasingly available to large IT departments to administer throughout their distributed organizations.
Network management tools are also being offered as part of the services offerings of solutions providers
directly to small and medium sized businesses. Such tools allow the reseller community to move from the
traditional break-fix model to a more proactive service model, guaranteeing improved system uptime and
customer satisfaction. As a design-manufacturer Posiflex is well positioned to continue to serve the POS
marketplace with hardware characterized by quality, reliability and a complete suite of manufacturer
direct services.
White Paper: Quality and Reliability 14
In conclusion, POS hardware is a key building block of computer systems tools that are necessary for
meeting the retailer’s bread and butter customer needs in retail transactions of all kinds at brick and mortar
outlets, and increasingly also for online and mobile and self service selling applications. POS Hardware is not
a commodity since most POS applications operate in the real world where heat, moisture, shock, vibration,
grease, and dust are commonplace and where many users with varying work styles can access any machine
without an expectation that they will be gentle or conscientious. So POS qualifies as hazardous duty and
achieving high availability, 98% or higher, for users is a technical design and manufacturing challenge.
Investing in the right POS hardware and software and services for a retail application makes good business
sense since the shopper’s positive, hassle-free shopping experience is a requirement to gain trust and
transform the shopper into a buyer and a buyer into a loyal, repeat customer. Hardware manufacturers
generally have treated POS hardware as a computer system like any other. Posiflex designs and
manufacturers its several lines of energy efficient and reliable POS terminals and peripherals for the real
world of POS. The Posiflex POS line is the premier cost-effective POS hardware investment that a retail
operation can make to create success with customers.
For More Information
Posiflex Business Machines
30689 Huntwood Avenue
Hayward, CA 94544
Toll-free: 888-968.1668
Phone 510.429.7097
Email: [email protected]
www.posiflexusa.com