
PROVINCIAL WATER SUPPLY AND SANITATION PROJECT … · vi Table 12-1 Summary of Impacts and...
121
i PROVINCIAL WATER SUPPLY AND SANITATION PROJECT Project/loan number: 48158 - 002 - CAM CLIMATE RISK AND VULNERABILITY ASSESSMENT JUNE 2017 Provincial Water Supply and Sanitation Project (RRP CAM 48158)
Transcript of PROVINCIAL WATER SUPPLY AND SANITATION PROJECT … · vi Table 12-1 Summary of Impacts and...

i
PROVINCIAL WATER SUPPLY AND SANITATION PROJECT
Project/loan number: 48158 - 002 - CAM
CLIMATE RISK AND VULNERABILITY ASSESSMENT
JUNE 2017
Provincial Water Supply and Sanitation Project (RRP CAM 48158)

ii
Table of Contents Project Climate Risk and Vulnerability Assessment Summary .......................................... ii
1. Executive Summary ......................................................................................................... 1
2. Introduction ...................................................................................................................... 3
2.1. The Project ............................................................................................................... 3
2.2. ADB's Approach to Water Supply and Sanitation ...................................................... 4
2.3. ADB's Approach to Climate Change ......................................................................... 5
2.1. Cambodia Approach to Climate Change ................................................................... 5
3. Design Overview .............................................................................................................. 6
3.1. Battambang Water Supply ........................................................................................ 6
3.2. Battambang Sanitation ............................................................................................ 10
3.3. Kampong Cham Water Supply ................................................................................ 14
3.4. Kampong Cham Septage ........................................................................................ 18
3.5. Sihanoukville Sanitation .......................................................................................... 20
3.6. Siem Reap Sewer ................................................................................................... 26
4. Site Visits and Meetings ................................................................................................. 30
4.1. Site Visits ................................................................................................................ 30
4.2. Battambang ............................................................................................................ 30
4.3. Kampong Cham ...................................................................................................... 32
4.4. Sihanoukville ........................................................................................................... 33
4.5. Siem Reap .............................................................................................................. 34
4.6. Meetings ................................................................................................................. 35
5. Assessing Climate Change ............................................................................................ 36
5.1. ADB’s Climate Risk Management Framework ......................................................... 36
5.2. Climate Risk Screening ........................................................................................... 36
5.3. Climate Risk and Vulnerability Assessment ............................................................ 36
5.1. Technical and Economic Evaluation of Adaptation Options ..................................... 36
5.2. Identification of Adaptation Options ......................................................................... 38
5.3. Monitoring and Reporting ........................................................................................ 38
5.4. Climate Proofing Projects ........................................................................................ 38
6. Potential Impacts of Climate Change on Water Supply and Sanitation ........................... 39
6.1. Changes in Precipitation ......................................................................................... 39
6.2. Changes in temperatures ........................................................................................ 39
6.3. Changes in extreme weather events ....................................................................... 40
6.4. Changes in Sea Conditions ..................................................................................... 40
6.5. Adaptation Measures .............................................................................................. 40
6.6. AWARE for Projects ................................................................................................ 41
7. Assessing Vulnerabilities ............................................................................................... 46
7.1. ADB Guidelines ...................................................................................................... 46
7.2. Adaptation Assessment .......................................................................................... 47
7.3. Climate Change and Water Governance in Cambodia, ........................................... 48
7.4. Climate Change Strategic Plan for Water Resources and Meteorology 2013-2017 . 48
8. Climate Change Projections ........................................................................................... 52
8.1. Developing Appropriate Climate Change Scenarios................................................ 52
8.2. Climate Change Science......................................................................................... 52
8.3. MPWT FRMI - Flood Risk Management Interface Software .................................... 54

iii
8.4. CLIMSYSTEMS ...................................................................................................... 54
8.5. Reference Materials ................................................................................................ 54
9. MPWT FRMI .................................................................................................................. 56
9.1. Flood Risk Management Interface - FRMI ............................................................... 56
9.2. FRMI Methodology .................................................................................................. 56
9.3. SRTM Accuracy ...................................................................................................... 56
9.4. Road Catchment Area vs. River Catchment Area Method ....................................... 56
9.5. Flood Risk Damage Maps ....................................................................................... 56
9.6. Multiple Flood Vulnerability ..................................................................................... 59
9.7. Climate Change Projections .................................................................................... 59
9.8. Appropriateness of FRMI ........................................................................................ 59
9.9. Battambang ............................................................................................................ 62
9.10. Kampong Cham .................................................................................................. 62
9.11. Sihanoukville ....................................................................................................... 63
9.12. Siem Reap .......................................................................................................... 64
10. CLIMSYSTEMS .......................................................................................................... 66
10.1. Introduction ......................................................................................................... 66
10.2. Rainfall Data ........................................................................................................ 66
10.3. Temperature Data ............................................................................................... 67
10.4. Supporting Data .................................................................................................. 67
10.5. Methodologies ..................................................................................................... 67
10.6. Drought analysis .................................................................................................. 72
10.7. GCMs and pattern scaling approach for climate change scenarios...................... 72
10.8. Results of Climate Change Projections ............................................................... 73
10.9.1. Results .......................................................................................................... 73
11. Climate Change Impacts ............................................................................................ 80
11.1. Rainfall 30 minutes to 3 days ............................................................................... 80
11.2. Rainfall Duration 60 minutes ................................................................................ 85
11.3. Drought ............................................................................................................... 90
11.4. Temperature ........................................................................................................ 92
12. Impacts and Adaptation Measures for Each Subproject ............................................. 92
12.1. Battambang Water Supply ................................................................................... 92
12.2. Battambang Wastewater and Sanitation .............................................................. 95
12.3. Kampong Cham Water Supply ............................................................................ 97
12.4. Kampong Cham Septage Treatment ................................................................. 100
12.5. Sihanoukville Waterwater and Sanitation........................................................... 101
12.6. Siem Reap Interceptor Sewer Replacement ...................................................... 105
13. Conclusions .............................................................................................................. 107
14. Annex A : GCM and RCM Data ................................................................................ 109
15. Annex B References................................................................................................. 112

iv
Figures
Figure 2-1 Location of the study sites.................................................................................. 3
Figure 3-1 Battambang Water Supply subproject coverage area and project facilities location
7
Figure 3-2 Phase 1 & 2 service area of Battambang sanitation project ............................. 10
Figure 3-3 Location of pumping station and trunk sewers in Phase 1 for Battambang project
11
Figure 3-4 Kampong Cham WS subproject coverage area ............................................... 15
Figure 3-5 Kampong Cham project facilities location ......................................................... 16
Figure 3-6 Proposed location for septage treatment facility at Kampong Cham ................ 19
Figure 3-7 Existing and proposed service areas for Sihanoukville ..................................... 22
Figure 3-8 Trunk sewer network overview ......................................................................... 23
Figure 3-9 Location of pumping station and route of pumping main .................................. 24
Figure 3-10 Current WW infrastructure in Siem Reap ......................................................... 27
Figure 3-11 Typical pipe splitting equipment ....................................................................... 29
Figure 4-1 Proposed River Raw Water Abstraction Point .................................................. 30
Figure 4-2 Proposed Water Treatment Plant Site .............................................................. 30
Figure 4-3 Kanghot Irrigation Dam upstream of Offtake Point ........................................... 31
Figure 4-4 Battambang Old WWTP ................................................................................... 31
Figure 4-5 Battambang Site for new WWTP...................................................................... 31
Figure 4-6 Existing Raw Water Pumping Station ............................................................... 32
Figure 4-7 Location of Proposed Raw Water Offtake ........................................................ 32
Figure 4-8 Existing Offtake Point and Pumping Station ..................................................... 32
Figure 4-9 Kampong Cham Existing Water Treatment Plant ............................................. 32
Figure 4-10 Kampong Cham Septage Site .......................................................................... 33
Figure 4-11 Site of a Sihanoukville Pumping Station and Existing WWTP Lagoons ............ 33
Figure 4-12 Trunk Sewer Manhole and Pumping Station .................................................... 34
Figure 4-13 Siem Reap Waste Water Treatment Plant and Lagoons .................................. 34
Figure 5-1 Risk Assessment Process................................................................................ 37
Figure 6-1 Example of "Aware" Risk Assessment ............................................................ 42
Figure 7-1 Climate Change Adaptation Assessment ......................................................... 47
Figure 7-2 Arsenic Risk Contamination in Cambodia ........................................................ 50
Figure 8-1 RPCs from IPCC AR5 (2011) ........................................................................... 53
Figure 9-1 Flow Chart for Derivation of Flood Index .......................................................... 58
Figure 9-2 Climate Change Analysis ................................................................................. 58
Figure 9-3 National Flood Risk under Current Climate Conditions .................................... 60
Figure 9-4 National Flood Risk under Future Climate Conditions ...................................... 61
Figure 9-5 Total Combined Risk of Flooding Battambang RCP 85 year 2055 ................... 62
Figure 9-6 Total Combined Risk of Flooding Kampong Cham RCP 85 year 2055 ............ 63
Figure 9-7 Total Combined Risk of Flooding Sihanoukville RCP 85 year 2055 ................. 64
Figure 9-8 Total Combined Risk of Flooding Siem Reap RCP 85 year 2055 .................... 65
Figure 10-1 Location of the study sites................................................................................ 66
Figure 10-2 Equidistance quantile-matching method for generating future DDF curves under
climate change. ..................................................................................................................... 69
Figure 10-3 The log-log straight line relationship for Depth Duration Frequency (DDF) ....... 71
Figure 11-1 Depth of Rainfall versus Duration Baseline Battambang .................................. 80

v
Figure 11-2 Depth of Rainfall versus Duration 2030 Battambang ........................................ 80
Figure 11-3 Depth of Rainfall versus Duration 2050 Battambang ........................................ 81
Figure 11-4 Depth of Rainfall versus Duration Baseline Kg Cham ...................................... 81
Figure 11-5 Depth of Rainfall versus Duration 2030 Kg Cham ............................................ 82
Figure 11-6 Depth of Rainfall versus Duration 2050 Kg Cham ............................................ 82
Figure 11-7 Depth of Rainfall versus Duration Baseline Sihanoukville ................................ 82
Figure 11-8 Depth of Rainfall versus Duration 2030 Sihanoukville ...................................... 83
Figure 11-9 Depth of Rainfall versus Duration 2050 Sihanoukville ...................................... 83
Figure 11-10 Depth of Rainfall versus Duration Baseline Siem Reap ................................ 84
Figure 11-11 Depth of Rainfall versus Duration 2030 Siem Reap ...................................... 84
Figure 11-12 Depth of Rainfall versus Duration 2050 Siem Reap ...................................... 85
Figure 11-13 Depth of Rainfall in 1 hour Battambang ........................................................ 86
Figure 11-14 Change in Depth of Rainfall in 1 hour Battambang ....................................... 86
Figure 11-15 Depth of Rainfall in 1 hour Kampong Cham .................................................. 87
Figure 11-16 Change in Depth of Rainfall in 1 hour Kampong Cham ................................ 87
Figure 11-17 Depth of Rainfall in 1 hour Siem Reap .......................................................... 88
Figure 11-18 Change in Depth of Rainfall in 1 hour Siem Reap......................................... 88
Figure 11-19 Depth of Rainfall in 1 hour Sihanoukville ...................................................... 89
Figure 11-20 Change in Depth of Rainfall in 1 hour Sihanoukville ..................................... 89
Figure 11-21 Kanghot Irrigation Dam upstream of Offtake Point ........................................ 93
Figure 11-22 Site for Battambang WWTP ......................................................................... 95
Tables
Table 1-1 Final subproject selection................................................................................... 1
Table 1-2 Climate Change Risks ....................................................................................... 2
Table 2-1 Final subproject selection................................................................................... 3
Table 2-2 Summary of Cost estimates for the 6 selected subprojects (USD Millions) ........ 4
Table 3-1 Phase 1 (Year 2020-2025) for Battambang ........................................................ 8
Table 3-2 Current and Proposed situation for sanitation in West Battambang .................. 11
Table 3-3 Sizes of selected aerated lagoons ................................................................... 12
Table 3-4 Outline of Facilities for Kampong Cham in Phase 1 (2020-2025) ..................... 17
Table 3-5 Current and Proposed situation for sanitation in Sihanoukville ......................... 20
Table 3-6 Current and Proposed situation for septage treatment in Sihanoukville............ 21
Table 7-1 Conceptual Framework for Climate Risk and Vulnerability Assessment ........... 46
Table 10-1 Study location ............................................................................................... 66
Table 10-2 Dry Component of the SPEI and Sample Probability of Recurrence ............ 72
Table 10-3 Global mean temperature changes applied in this study from a 40 GCM
global ensemble of CMIP5 data. ......................................................................................... 73
Table 10-4 Extreme Precipitation Depth Duration tables for Cambodia sites ................. 75
Table 10-5 Monthly precipitation changes for 4 sites in Cambodia (% per degree global
warming) 77
Table 10-6 Relative drought change in Cambodia sites .................................................. 78
Table 10-7 Daily extreme high temperature for Cambodia sites ...................................... 78
Table 11-1 Dry Component of the SPEI and Sample Probability of Recurrence ............. 91
Table 11-2 Relative drought change ............................................................................... 91

vi
Table 12-1 Summary of Impacts and Adaptation Measures for Battambang Water Supply
Subproject 94
Table 12-2: Summary of Impacts and Adaptation Measures for Battambang Wastewater
Subproject ............................................................................................................................. 96
Table 12-3: Summary of Impacts and Adaptation Measures for the Kampong Cham Water
Supply Subproject ................................................................................................................. 98
Table 12-4: Summary of Impacts and Adaptation Measures for the Kampong Cham Septage
Treatment Subproject.......................................................................................................... 101
Table 12-5: Summary of Impacts and Adaptation Measures for the Sihanoukville Wastewater
Subproject ........................................................................................................................... 102
Table 12-6: Summary of Impacts and Adaptation Measures for the Siem Reap Sewer
Replacement Subproject ..................................................................................................... 106
Table 13-1 Climate Change Risks ................................................................................ 107

vii
Acronyms
ADB Asian Development Bank
AFD Agence Française de Développement
ARI average return interval
CCSP Climate Change Strategic Plan
CDIA City Development Initiative for Asia
CHIRPS Climate Hazards Group InfraRed Precipitation with Station data
CR-PRIP Climate Resilience for the Provincial Road Improvement Project
CRVA climate risk and vulnerability assessment
CSIRO CCAM Conformal Cubic Atmospheric Model of the Commonwealth Scientific and
Industrial Research Organisation
DCI ductile cast iron
DDF depth, duration, frequency
DIH Provincial Department of Industry and Handicrafts
FRMI Flood Risk Management Interface (of MPWT, Cambodia)
GCM general circulation model
GEF Global Environment Facility
GEV generalized extreme value
GHG greenhouse gas
GIS geographic information system
GLO generalized logic
IDF intensity, duration, frequency
IPCC Intergovernmental Panel on Climate Change
MOWRAM Ministry of Water Resources and Meteorology
MPWT Ministry of Public Works and Transport
MRC Mekong River Commission
MSQWEP Multi-Source Quantile Weighted-Ensemble Precipitation
NPV net present value
NSDP National Strategic Development Plan
OECD Organisation for Economic Co-operation and Development
PDSI Palmer Drought Severity Index
PET potential evapotranspiration
RAMS road asset management system
RCM regional climate model
RCP Representative Concentration Pathway
RGC Royal Government of Cambodia
SPEI Standard Precipitation Evapotranspiration Index
SRES special report on emissions scenarios
SRTM Shuttle Radar Topographic Mission
UNFCCC United Nations Framework Convention on Climate Change
WQ water quality
WSS water supply and sanitation
WTP water treatment plant
WWTP wastewater treatment plant


1
1. Executive Summary
1. An agreement was reached by MIH, MPWT and MEF on six (6) prioritized subprojects in
four (4) towns. The Table 1-1 below summarizes the final outcome of the prioritization
exercise:
Table 1-1 Final subproject selection
City Water Supply Wastewater Septage
Battambang X X
Kampong Cham X X
Sihanoukville X
Siem Reap X (sewer rehabilitation)
2. Climate change projections have been carried out for the four cities. The projections are
based on Representative Concentration Pathway1 (RCP)8.5 for the years 2030 and 2050.
Rainfall data on a daily basis for 25 years was obtained from MOWRAM.
3. Flood risks have been assessed using the MPWT in house software Flood Risk
Management Interface FRMI2.
4. Projections show that the increase in intensity of rainfall during extreme weather events
does not vary across the country.
5. The 1 in 10 year event by 2030 under RCP 8.5 will experience a 4 % increase in 1 hour
rainfall intensity and by 2050 under RCP 8.5 there will be a 7% increase in 1 hour rainfall
intensity.
6. The 1 in 100 year event by 2030 under RCP 8.5 will experience a 7 % increase in 1 hour
rainfall intensity and by 2050 under RCP 8.5 there will be a 12% increase in 1 hour rainfall
intensity.
7. The projected results show that by the year 2050 daily peak temperatures could reach
49.5oC. This would be a 1 in 100 year event. A more common scenario would be daily peak
temperatures reaching 47oC which would be a 1 in 10 year event.
8. The highest probability of a severe drought occurring is 7.5% by the year 2050 in
Battambang. This equates to a 1 in 13 year event. The highest probability of an extreme drought
occurring is 4.29% by the year 2030 in Siem Reap. This equates to a 1 in 23 year event. The
climate change risks for the cities and associated subproject components are given below.
1 Representative Concentration Pthways (RCPs) are models of distribution and concentration of four representative greenhouse gases, used for climate modelling and sanctioned by the Intergovernmental Panel on Climate Change (IPCC). RCPs supersede Emissions Scenarios previously adopted by IPCC 2 Flood risk modelling software developed for the Ministry of Public Works and Transport, Cambodia that integrates meteorological and spatial input data to provide users with risk and cost information to guide decision making.

2
Table 1-2 Climate Change Risks
City Water Supply Wastewater Septage Climate Change Risk
Battambang X High
Battambang X Moderate
Kampong Cham X Moderate
Kampong Cham X Low
Sihanoukville X Moderate
Siem Reap X (sewer rehab) Low

3
2. Introduction
2.1. The Project
9. The project comprises the following components :
• Battambang: Water Supply + Wastewater and Sanitation
• Kampong Cham: Water Supply + Septage Treatment
• Sihanoukville: Wastewater and Sanitation
• Siem Reap: Wastewater/ Drainage (trunk replacement)
Figure 2-1 Location of the study sites
An agreement was reached by MIH, MPWT and MEF on July 14, 2016, and subsequently
shared with CDIA, ADB and AFD, that Preliminary Engineering Design and costing work will be
carried out for six (6) prioritized subprojects in four (4) towns. The Table below summarizes
the final outcome of the prioritization exercise:
Table 2-1 Final subproject selection
City Water Supply Wastewater Septage
Battambang X X
Kampong Cham X X
Sihanoukville X
Siem Reap X (sewer rehabilitation)

4
10. Preliminary cost estimates for these six (6) subprojects in the four (4) towns presented at
the DFR Workshop and subsequently updated are presented in the table below.
Table 2-2 Summary of Cost estimates for the 6 selected subprojects (USD Millions)
Town Water Supply Sanitation Total
Battambang
Kampong Cham
Sihanoukville
Siem Reap
34.9 M
12.7 M
10.6 M
0.79 M
14.6 M
15.9 M
45.5 M
13.5 M
14.6 M
15.9 M
Total
47.6 M
41.9 M
89.5 M
2.2. ADB's Approach to Water Supply and Sanitation
11. Water supply and sanitation is an important sector of investment supported by the Asian
Development Bank (ADB). For the period 2006–2014, ADB-approved investments in water
supply and sanitation amounted to nearly $10 billion or around 7% of ADB’s lending portfolio.3
12. The provision of water supply and sanitation services is particularly vulnerable to projected
changes in climate conditions (temperature and precipitation among others), in the frequency
and intensity of extreme weather events, as well as in the projected rise in sea level and the
intensification of storm surges4. With respect to Cambodia this can lead to the following effects:
• In coastal areas, sea-level rise and the increased intensity of storm surges may lead to
saline intrusion into groundwater aquifers as well as surface water.
• Warmer temperatures may increase evaporation from surface waters and reduce water
supply availability.
• Higher water temperatures may induce a greater presence of existing or new
microorganisms which water and wastewater treatment facilities may find increasingly
difficult and costly to treat to required standards.
• Water supply and wastewater treatment infrastructure may experience a greater risk of
damage as a result of more frequent and/or more intense extreme weather events,
floods, and drought.
13. These possible impacts may have significant consequences for water and sanitation
projects.5
3 Guidelines For Climate Proofing Investment in the Water Sector : Water Supply And Sanitation, ADB 2016
4 Sector Briefing on Climate Change Impacts and Adaptation: Water Supply And Sanitation ADB, January 2012
5 Climate Change and Water Governance in Cambodia, Challenge and Perspectives for Water Security and Climate Change in
Selected Catchments, Cambodia, Cambodia Development Resource Institute, Phnom Penh, December 2015.

5
2.3. ADB's Approach to Climate Change
14. From 2011 to 2015, ADB approved over $15.5 billion of climate financing. In 2016 ADB
approved a further $3.7 billion in climate finance investments representing a 42% increase over 2015.6
15. ADB have published many guidelines on climate change and these have been referred to
in the preparation of this report. These include :
• Sector Briefing on Climate Change Impacts and Adaptation: Water Supply And
Sanitation ADB, January 2012.
• Guidelines For Climate Proofing Investment in the Water Sector : Water Supply And
Sanitation, ADB 2016
2.1. Cambodia Approach to Climate Change
16. In addition to ADB publications Cambodia has produced several guides on Climate Change
and they have been referenced in this report. They include:
• Climate Change and Water Governance in Cambodia, Challenge and Perspectives for
Water Security and Climate Change in Selected Catchments, Cambodia, Cambodia
Development Resource Institute, Phnom Penh, December 2015.
• Climate Change Strategic Plan for Water Resources and Meteorology (2013-2017),
Ministry of Water Resources and Meteorology, Phnom Penh, 2012
17. Further references are given where appropriate in the report.
6 ADB's Focus on Climate Change and Disaster Risk Management, WWW.AB.ORG, 2017
6
3. Design Overview
3.1. Battambang Water Supply
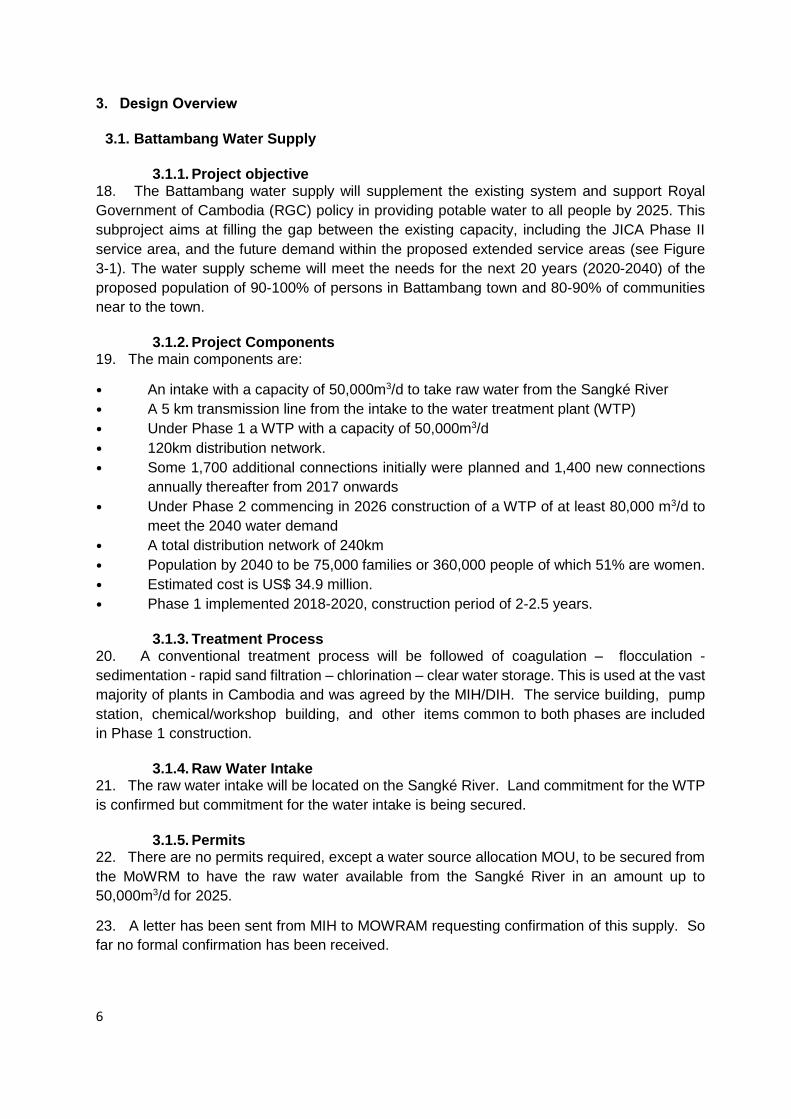
3.1.1. Project objective 18. The Battambang water supply will supplement the existing system and support Royal
Government of Cambodia (RGC) policy in providing potable water to all people by 2025. This
subproject aims at filling the gap between the existing capacity, including the JICA Phase II
service area, and the future demand within the proposed extended service areas (see Figure
3-1). The water supply scheme will meet the needs for the next 20 years (2020-2040) of the
proposed population of 90-100% of persons in Battambang town and 80-90% of communities
near to the town.
3.1.2. Project Components 19. The main components are:
• An intake with a capacity of 50,000m3/d to take raw water from the Sangké River
• A 5 km transmission line from the intake to the water treatment plant (WTP)
• Under Phase 1 a WTP with a capacity of 50,000m3/d
• 120km distribution network.
• Some 1,700 additional connections initially were planned and 1,400 new connections
annually thereafter from 2017 onwards
• Under Phase 2 commencing in 2026 construction of a WTP of at least 80,000 m3/d to
meet the 2040 water demand
• A total distribution network of 240km
• Population by 2040 to be 75,000 families or 360,000 people of which 51% are women.
• Estimated cost is US$ 34.9 million.
• Phase 1 implemented 2018-2020, construction period of 2-2.5 years.
3.1.3. Treatment Process 20. A conventional treatment process will be followed of coagulation – flocculation -
sedimentation - rapid sand filtration – chlorination – clear water storage. This is used at the vast
majority of plants in Cambodia and was agreed by the MIH/DIH. The service building, pump
station, chemical/workshop building, and other items common to both phases are included
in Phase 1 construction.
3.1.4. Raw Water Intake 21. The raw water intake will be located on the Sangké River. Land commitment for the WTP
is confirmed but commitment for the water intake is being secured.
3.1.5. Permits 22. There are no permits required, except a water source allocation MOU, to be secured from
the MoWRM to have the raw water available from the Sangké River in an amount up to
50,000m3/d for 2025.
23. A letter has been sent from MIH to MOWRAM requesting confirmation of this supply. So
far no formal confirmation has been received.
7
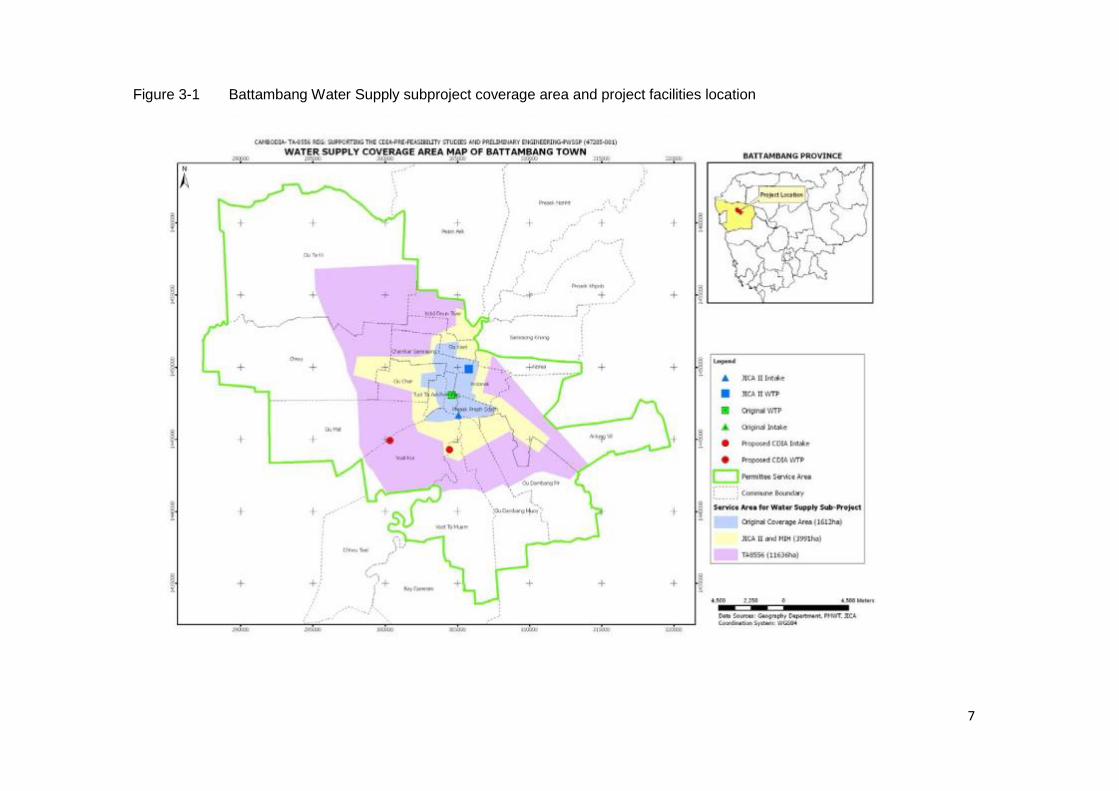
Figure 3-1 Battambang Water Supply subproject coverage area and project facilities location

8
3.1.6. Summary Proposed Facilities
24. A summary of the project Phase 1 is given below.
Table 3-1 Phase 1 (Year 2020-2025) for Battambang
Raw Water
Water Source Sangké River; Battambang
HWL=15.57 masl, LWL=4.81 masl
Intake
Capacity 50,000 m3/d
Pump • Total pump capacity: 2,083 m3/h or 579 L/second
• Four pumps (vertical turbine pump) will be installed: 3 duty and 1
standby
• Total head 35 m
Raw Water Transmission
Raw water pipe Diameter : 710 mm
Length : 5 km
Water Treatment Plant
(WTP)
Capacity 50,000 m3/d
Treatment facilities • Receiving well: Reinforced concrete; 2 units
• Rapid Mixing: Reinforced Concrete Structure with
gravitational force mixing using a weir; 2 units
• Flocculation: Vertical channel baffled flocculator; 8 units
• Sedimentation: Reinforced Concrete Structure, Horizontal- Flow
Sedimentation Basin; 8 units;
• Filtration: Reinforced Concrete Structure; 12 units; Underdrain
System: Porous Filter Bed Method; Filtration Rate: V=126.6 m/day
(120-150 m/day)
• Flow Control: Lower Part Control Method
• Backwash Method: Simultaneous Backwash Method by Air and Water
• Clearwater Reservoir: Reinforced Concrete Structure using Flat Slab
Structure; Effective Volume: 12,800 m3, Effective Water Depth: H=
4.30, Detention Time: T= 3 hours
Booster pump at WTP • Total pump capacity: 3,192 m3/h or 887 L/s
• Four booster pump will be installed: 3 on-duty and 1 standby
• Total head 26m
Distribution Networks
Pipe network 120 km including 109 km of mains and 11km for connection of
secondary and tertiary road houses
Construction Plan 2018-2020
Cost Estimates Phases 1 and 2 : $34,899,700.

9
3.1.7. Cost Estimate 25. The preliminary cost estimate for Phases 1 and 2 of the proposed subproject is $34,899,700.
10
3.2. Battambang Sanitation
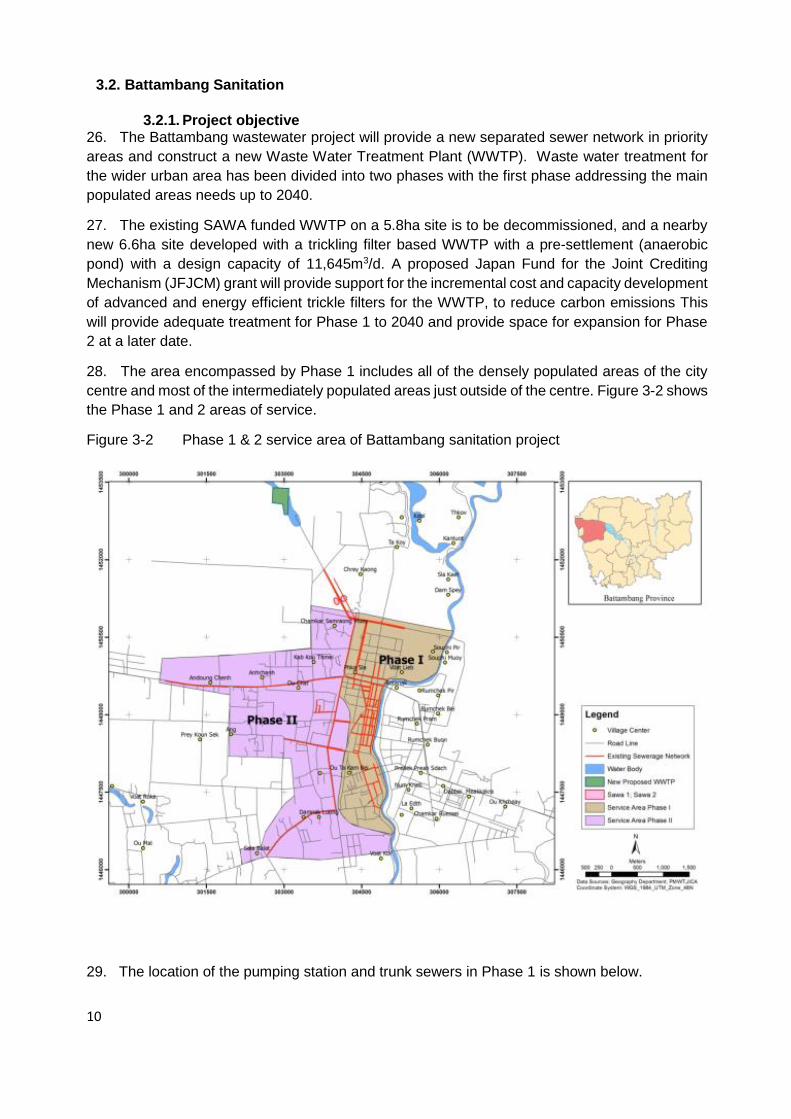
3.2.1. Project objective 26. The Battambang wastewater project will provide a new separated sewer network in priority
areas and construct a new Waste Water Treatment Plant (WWTP). Waste water treatment for
the wider urban area has been divided into two phases with the first phase addressing the main
populated areas needs up to 2040.
27. The existing SAWA funded WWTP on a 5.8ha site is to be decommissioned, and a nearby
new 6.6ha site developed with a trickling filter based WWTP with a pre-settlement (anaerobic
pond) with a design capacity of 11,645m3/d. A proposed Japan Fund for the Joint Crediting
Mechanism (JFJCM) grant will provide support for the incremental cost and capacity development
of advanced and energy efficient trickle filters for the WWTP, to reduce carbon emissions This
will provide adequate treatment for Phase 1 to 2040 and provide space for expansion for Phase
2 at a later date.
28. The area encompassed by Phase 1 includes all of the densely populated areas of the city
centre and most of the intermediately populated areas just outside of the centre. Figure 3-2 shows
the Phase 1 and 2 areas of service.
Figure 3-2 Phase 1 & 2 service area of Battambang sanitation project
29. The location of the pumping station and trunk sewers in Phase 1 is shown below.

11
Figure 3-3 Location of pumping station and trunk sewers in Phase 1 for Battambang project
3.2.2. Project Components Shortfalls and Solutions 30. The table below summarises the current situation, shortfalls in service, and the solutions to
these shortfalls offered under the proposed subproject.
Table 3-2 Current and Proposed situation for sanitation in West Battambang
Current situation Shortfall Proposed
Main colonial-era city centre area served
Very limited service area Two phases of development: city centre area followed by wider urban area.
Combined system Very large flows during wet season, with combined flows flooding town and entering environment untreated.
A separated system is proposed
Trunk sewers sized for city centre only, with restrictions in some areas.
Insufficient or wrongly configured trunk sewers
New main trunk sewers

12
Old pumps between anaerobic ponds and facultative ponds are limiting capacity of existing WWTP
Pumps operating at 450m3/d
instead of designed 1,000m3/d
Decommissioning of existing 5.8ha WWTP lagoon site.
WWTP designed for
1,000m3/d which was intended to serve 15,000 people or 3,125 households.
Now reduced to 450m3/d serving 1,400 households
11,645m3/d required for Phase 1; 20,694m3/d required for full city to 2040
Decommissioning of existing 5.8ha WWTP lagoon site.
Development of conventional trickling filters for proposed new 6.6ha site, staged for 2 Phases.
Development of aerated lagoons if a minimum of 15ha becomes available. Phase 1 will serve 40,311 people on commissioning in 2020 and 57,803 by 2040.
Current WWTP land was fully utilized by 1994 project
No further reserved land for expansion
A further 6.6ha site is approved by District Governor
Septic tank septage disposed of to agricultural land
No septage management Each settlement pond to have septage disposal bay with concrete apron and service water for cleaning.
There are 7 nos private septage vacuum trucks operating
No regulation of private septage trucks.
No DPT vacuum truck.
Provide one 6m3 septage vacuum truck for DPWT. Develop regulation of private septage trucks under capacity building.
No sludge removal or drying facility
No equipment or space on site Include sludge drying beds plus supply of dewatering container and compact excavator.
3.2.3. WWTP Options 31. Two options have been recommended, dependent on final land availability.
3.2.3.1. Aerated Lagoons 32. The current “SAWA” WWTP on 5.8ha would be decommissioned. With a 15ha site all
separated wastewater to year 2040 could be treated using aerated lagoons. The WWTP would
consist of two separable trains of lagoons, each train being two anaerobic lagoons, one facultative
lagoon and one maturation lagoon. The extension to land already acquired would need to be of
an appropriate shape to accommodate these lagoon trains. The anaerobic lagoons would have
solar aerators specifically designed for these lagoons installed, which disturb only the upper 20-
30cm of water and reduce odours and break the scum layer without producing aerosols. The
size of the lagoons is shown below.
Table 3-3 Sizes of selected aerated lagoons
Process No. ponds Length Width Depth Area (ha) Anaerobic 4 40 25 4 0.193
Facultative 2 157 57 1.75 1.499
Maturation 2 348 120 1.5 8.352
Total 10.044

13
33. The remaining 5.6ha of the required 15ha site will be taken up with site roads, sludge drying
beds, office, store, car parking and bunds.
3.2.3.2. Conventional Trickling Filters 34. Should an additional 8.4ha immediately adjacent to the ready-acquired 6.6ha not become
available in the near future, then the recommendation is for sedimentation ponds and
conventional trickling filters on the same 6.6ha site.
3.2.4. Septage Collection 35. Only 17% of the central city area is currently connected to the wastewater treatment plant
so the majority of urban properties are reliant on either a septic tank or concrete holding/soakaway
tank (pour flush pit latrine). There is no record of numbers, volumes or condition of septic
tanks in the city. Demand from householders to have their septic tanks de-sludged is based on
when they block or cause a smell nuisance rather than by preventative maintenance or periodic
checking of sludge depth. Septage is currently collected by 7 private vacuum trucks who
disposed of it to agricultural land on the edges of the town.
36. Private septage collectors will require regulating once the new WWTP is opened, both to
ensure that septage is co-treated in the WWTP and that private operators pay for this service. It
is suggested that all septage collection operators require a license to operate in the urban area,
and that a condition of this licence is that all septage is disposed of to the WWTP.
3.2.5. Septage Treatment 37. If the new WWTP proposal option of provision of trickling filters are taken, co-treatment of
septage is recommended in the upstream anaerobic ponds. Septage will be collected and treated
in the anaerobic lagoons prior to the trickling filter based WWTP. Sludge will be removed and
thickened by the sludge dewatering container and then disposed of as cover for the nearby
landfill.
3.2.6. Cost estimate 38. The cost estimate for this wastewater and sludge co-treatment subproject is $10,646,687.

14
3.3. Kampong Cham Water Supply
3.3.1. Project Objective 39. The Kampong Cham water supply will supplement the existing system and support RGC’s
policy in providing potable water to all people by 2025. This subproject aims at filling the gap
between the existing capacity, including the JICA Phase II service area, and the future demand
within the proposed extended service areas. (See Figure 3-4) The water supply scheme will meet
the needs for the next 20 years (2020-2040) of the proposed population of 90-100% of Kampong
Cham and 85% of the three communities nearby the town.
3.3.2. Project Components 40. The main project components are:
• A water intake with a capacity of 11,600m3/d to draw raw water from the Mekong River
• A 4km transmission line to the WTP.
• A new WTP of at least 26,100 m3/d to provide sufficient capacity until 2040
• 80km of distribution network
• Expanded service area of 35km2 by 2025.
• Served population (to 2040): approximately of 31,182 families with total 140,318 persons,
out of which 71,562 are women (50.9%).
• A 2.5 year contract period from 2018 to 2020.
3.3.3. Treatment Process 41. A conventional treatment process will be followed of coagulation – flocculation -
sedimentation - rapid sand filtration – chlorination – clear water storage). This is used at the vast
majority of plants in Cambodia and was agreed by the MIH/DIH.
42. The location of the proposed WTP is shown in figure 3-5. The service building, pump
station, chemical/workshop building, and other items common to both phases are included in
Phase 1 construction.
3.3.4. Raw Water Intake 43. A raw water intake will be located on the Mekong River extracting up to 11,600m3/d by 2025.
3.3.5. Permits 44. There are no permits required, except a water source allocation MOU, to be secured from
the MoWRM for the raw water extraction from the Mekong River to the proposed WTP. Land
commitment on the WTP and the Intake is confirmed.

15
Figure 3-4 Kampong Cham WS subproject coverage area

16
Figure 3-5 Kampong Cham project facilities location

17
3.3.6. Summary Proposed Facilities 45. A summary of the project Phase 1 is given below.
Table 3-4 Outline of Facilities for Kampong Cham in Phase 1 (2020-2025)
Raw Water
Water source Mekong river; HWL=15.18 m, LWL=0.63 m
Intake
Capacity 11,600 m3/d
Pump • Total pump capacity: 135 L/s • Three pumps (vertical turbine pump) will be installed: 1
in duty and 1 standby
• Total head 41m
Raw Water Transmission
Raw water pipe
transmission pipe (DIP)
Diameter : 350 mm ; Length : 4 km
Water Treatment Plant (WTP)
Capacity 11,600 m3/d
Booster pump at WTP • Total pump capacity: 227 L/s • Three Booster pump will be installed: 2 in duty and 1
standby
• Total head 36m (following pump selection)
Treatment facilities • Rapid Mixing
• Flocculation • Sedimentation • Filtration • Disinfection
Distribution Networks
Pipe network 52 Km main pipes + 28 km of smaller pipes
Booster pump along the
distribution network
• Total pump capacity: 136 L/s • Three Booster pump will be installed: 2 in duty and 1
standby with capacity 68 L/s each pump
• Total head 29m (following pump selection)
Construction plan 2018-2020
Cost Estimates $12,765,500
3.3.7. Cost Estimate 46. The preliminary cost estimates for Phase 1 is $12,765,500.

18
3.4. Kampong Cham Septage
3.4.1. Project Objective 47. The Kampong Cham septage subproject is proposed to rectify the poor situation in
Kampong Cham with respect to septage collection and disposal from existing septic tanks.
3.4.2. Septage collection 48. The coverage of septic tanks in central Kampong Cham, whilst numbers are not known, is
thought to be fairly low, and the size, age and condition of septic tanks is unknown. Many
households, even in the central city, have concrete ring soak away tanks which do not provide
any treatment and pollute the water table. Septage collection, in common with other towns in
Cambodia, is currently mainly carried out by the private sector. There are currently only a small
number of vacuum truck operators in Kampong Cham, but with the capacity building and public
awareness proposed under the subproject this should increase. As operators become busier,
carrying more loads per day, the incentive to invest further in another truck will arise, in addition
to more interest generated for more business people to become involved in the sector.
3.4.3. Project Components 49. The project will obtain suitable land and construct a 2,400m3 treatment facility, including two
facultative lagoons in parallel. Once septage is sufficiently dried for handling, the treated sludge
can be removed from the lagoon using a compact excavator and truck, and either dewatered
further using a dewatering container, deposited into sludge drying beds, or carried directly to
landfill for disposal. The figure 3-6 below shows the currently proposed location for the facility.
50. The subproject will supply equipment to the DPWT for use with the septage treatment plant
including :
• A 6m3 vacuum truck
• Dewatering container (basic model)
• Compacting excavator
51. The subproject will also include capacity building for DPWT and private vacuum truck
operators and a public awareness campaign aimed at increased understanding of septic tanks
and the need for maintenance.
52. Capacity building is proposed for both septage treatment facility operators (DPWT staff)
and the private sector. For the sustainability of the septage treatment facility it is vital to have
both the support of the private vacuum truck operators through licensing and the increased
awareness of the public in having their septic tanks emptied.
3.4.1. Cost estimates 53. The cost estimate for the sludge treatment subproject is US$790,000.

19
Figure 3-6 Proposed location for septage treatment facility at Kampong Cham

20
3.5. Sihanoukville Sanitation
3.5.1. Project Objective 54. The Sihanoukville wastewater subproject will address priority areas by constructing a
separated sewer network, installing free domestic connections, and upgrading the existing
WWTP to increase capacity. The upgrade of the current WWTP is limited to the current land
footprint as no more land is available and several options for increasing wastewater
treatment capacity have been discussed.
3.5.1. Project Components
3.5.1.1. Shortfalls in Service and Remedies 55. Table 3-5 summarises the current situation, shortfalls in service, and the solutions to
these shortfalls offered under the proposed subproject.
Table 3-5 Current and Proposed situation for sanitation in Sihanoukville
Current Shortfall Proposed
Main city centre area served Beach tourism areas and rest of city not served. Areas that could be connected without pumping only were considered.
4 main beach areas plus main urban centre to north west of existing service area to be connected
Only 1,767 of 3,368 (52%) properties proposed under first project have been connected to date
Free connections were not included under first project
Free connections for remainder of 3,368 properties under first project service area, plus growth to 2020 for this service area (1,707 properties), plus 5 new service areas. Total new connections 8,295.
Trunk sewers sized for city centre only
Existing trunk sewers cannot be used for proposed extended service area
New trunk sewers proposed in parallel with existing ones to maintain service during construction
No pump stations. The part of the city centre forming the original service area was defined by the areas that could be served by gravity flow.
Large tracts of the city not connected due to pumping requirements.
Three new pump stations in the city and one each on Occheuteal and Otres beaches.
WWTP limited to 6,900m3/d which was intended for 5,900m3/d to serve 3,368 households plus a 1,000m3/d allowance for effluent from Cambrew.
In reality approx. 3,000m3/d used by 1,767 households and the remaining 3,900m3/d (or more) from Cambrew.
Upgrade of WWTP by mixing/aeration or other methods can increase capacity. Aeration alone can increase capacity up to 250% to meet 2040 demands for proposed new service areas. Trickling filters, oxidation ditches and UASB have also been considered.
Current WWTP land was intended for expansion by 2020 under original design
Land no longer available WWTP expansion is limited to current site.
21
Beaches were intended to each have their own localised WWTP under original design
Land no longer available WWTP expansion is limited to current site.
1 anaerobic pond full of sludge and other 3 half full
No portable sludge pump, no willingness to desludge manually, limited access into ponds.
Purchase of suitable portable sludge pumps with long intakes. Desludging under proposed project with improved access and equipment supply (bobcat)
No designed sludge drying bays.
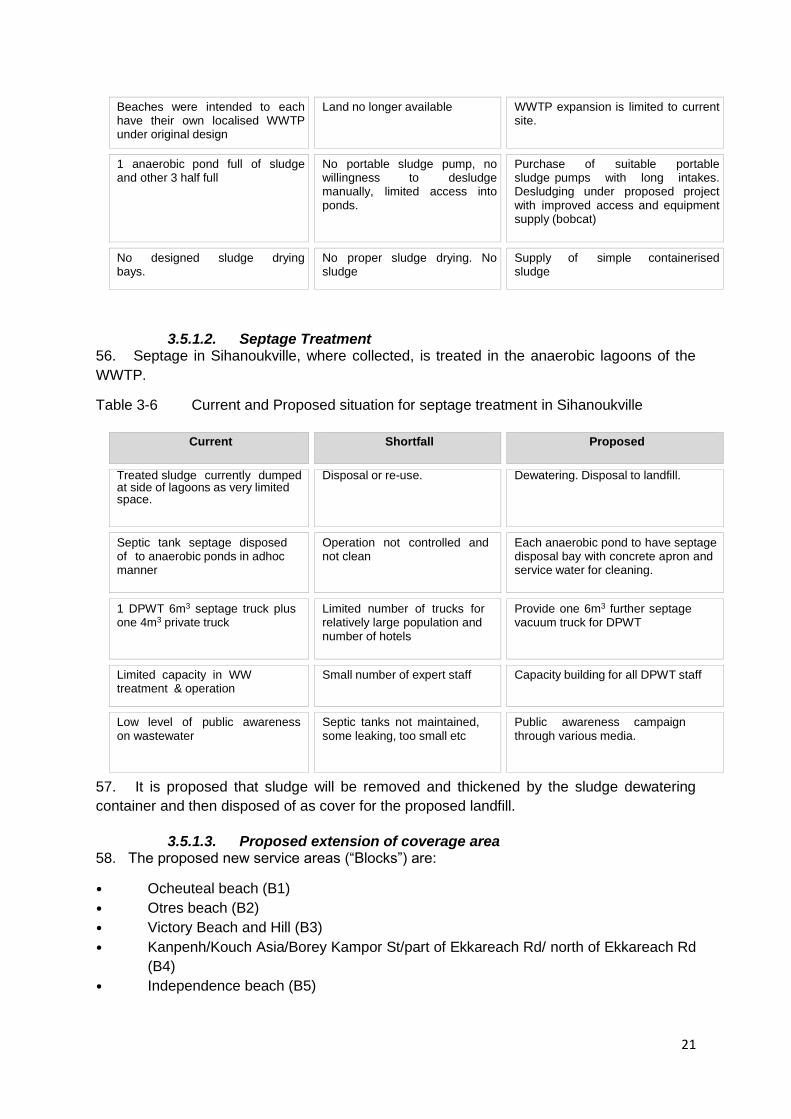
No proper sludge drying. No sludge
Supply of simple containerised sludge
3.5.1.2. Septage Treatment 56. Septage in Sihanoukville, where collected, is treated in the anaerobic lagoons of the
WWTP.
Table 3-6 Current and Proposed situation for septage treatment in Sihanoukville
Current Shortfall Proposed
Treated sludge currently dumped at side of lagoons as very limited space.
Disposal or re-use. Dewatering. Disposal to landfill.
Septic tank septage disposed of to anaerobic ponds in adhoc manner
Operation not controlled and not clean
Each anaerobic pond to have septage disposal bay with concrete apron and service water for cleaning.
1 DPWT 6m3 septage truck plus one 4m3 private truck
Limited number of trucks for relatively large population and number of hotels
Provide one 6m3 further septage vacuum truck for DPWT
Limited capacity in WW treatment & operation
Small number of expert staff Capacity building for all DPWT staff
Low level of public awareness on wastewater
Septic tanks not maintained, some leaking, too small etc
Public awareness campaign through various media.
57. It is proposed that sludge will be removed and thickened by the sludge dewatering
container and then disposed of as cover for the proposed landfill.
3.5.1.3. Proposed extension of coverage area 58. The proposed new service areas (“Blocks”) are:
• Ocheuteal beach (B1)
• Otres beach (B2)
• Victory Beach and Hill (B3)
• Kanpenh/Kouch Asia/Borey Kampor St/part of Ekkareach Rd/ north of Ekkareach Rd
(B4)
• Independence beach (B5)

22
Figure 3-7 Existing and proposed service areas for Sihanoukville
3.5.1.4. Trunk sewer network overview 59. Trunk sewers have been designed for each proposed new area with wastewater from
Victory Beach(B3), Kampenh Village/Kuch Asia(B4) and Independence Beach (B5) being
delivered from the west to the beginning of a new 1200mm main trunk sewer starting at the
Golden Lion roundabout, and Otres Beach(B2) and Occheuteal Beach(B1) being pumped
separately from the east directly to the WWTP. The trunk sewer network is illustrated in the
figure below.

23
Figure 3-8 Trunk sewer network overview
3.5.1.5. Pump Stations for Sihanoukville sewer system 60. In B-05 block (Independence beach area), there are two alternative proposed locations
for the pump station, one on the road at a low point where surface water drains into the north
east corner of the natural lake Boeng Preak Tub, and the other at the beach. The first option
is the topographical preference but it might be difficult to acquire the land for pump station
construction. The second option on public land at the beach is slightly higher but is much more
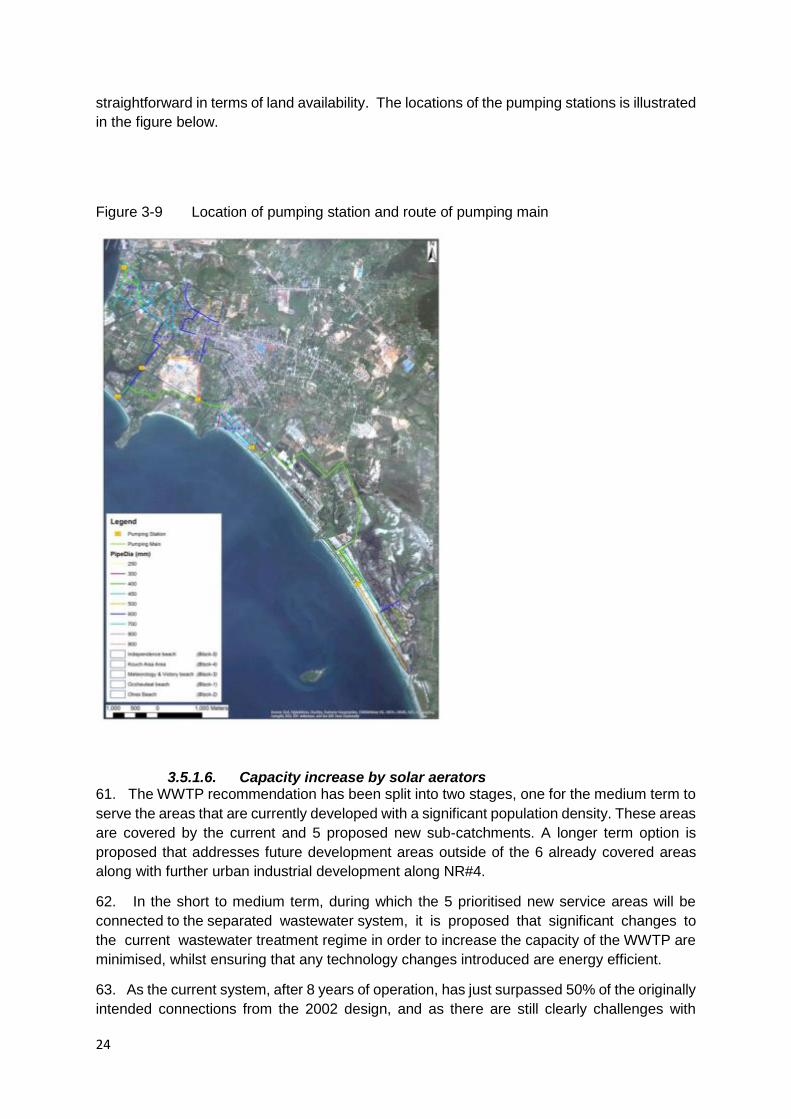
24
straightforward in terms of land availability. The locations of the pumping stations is illustrated
in the figure below.
Figure 3-9 Location of pumping station and route of pumping main
3.5.1.6. Capacity increase by solar aerators 61. The WWTP recommendation has been split into two stages, one for the medium term to
serve the areas that are currently developed with a significant population density. These areas
are covered by the current and 5 proposed new sub-catchments. A longer term option is
proposed that addresses future development areas outside of the 6 already covered areas
along with further urban industrial development along NR#4.
62. In the short to medium term, during which the 5 prioritised new service areas will be
connected to the separated wastewater system, it is proposed that significant changes to
the current wastewater treatment regime in order to increase the capacity of the WWTP are
minimised, whilst ensuring that any technology changes introduced are energy efficient.
63. As the current system, after 8 years of operation, has just surpassed 50% of the originally
intended connections from the 2002 design, and as there are still clearly challenges with
25
providing adequate O&M to the plant (sludge drying and handling, influent and effluent quality
and volume monitoring), it is recommended that floating solar powered mixers be used to
increase the capacity of the current WWTP to between 200-300% of the current maximum.
These mixers are stand-alone and, whilst more expensive than conventional mixers, use more
advanced technology to offer significant lifetime power cost savings, and offer a very low
carbon footprint. The solar mixers will also have the option to be run from mains power during
periods of lower sunlight or during maintenance of solar panels.
64. Once the proposed 5 priority sub-catchments are served, there will be very few developed
areas in Sihanoukville that will not be covered by the WW system for the short to medium
term. In the longer term, beyond 2040, when further areas of the wider urban area which are
currently sparsely populated become developed, it is proposed to employ conventional
trickling filters.
3.5.1.7. Septage Collection and Treatment 65. Only 52% of the central city area is currently connected to the wastewater treatment plant
and this is less than 15% of the total number of households in the city. The majority of urban
properties are reliant on either a septic tank or concrete holding/soak away tank (pour flush
pit latrine).
66. Septage in Sihanoukville is currently collected by only 2 vacuum trucks, one of 6m3 owned
by DPWT and one privately owned truck of 4m3. Neither are fully employed. Demand from
householders to have their septic tanks de-sludged is based on when they block or cause a
smell nuisance rather than by preventative maintenance or periodic checking of sludge depth.
67. There is no record of numbers, volumes or condition of septic tanks in the city. A septic
tank survey and public awareness campaign are recommended.
68. Septage in Sihanoukville, where collected, is treated in the anaerobic lagoons of the
WWTP. There is currently no constructed service bay for septage off loading, but instead it is
emptied into the side of one of the four lagoons. No septage volume or truckload records are
taken.
69. This co-treatment of septic sludge is an established method of primary treatment as the
septic tank sludge mixes with the sludge from the reticulated wastewater from the service
area. This increases the loading to the pond which is beneficial for anaerobic decomposition.
If the WWTP upgrade options of either mixing or provision of trickling filters are taken, co-
treatment of septage can continue in the anaerobic ponds.
3.5.2. Cost estimates 70. The cost estimate for this wastewater and sludge co-treatment subproject is $14,653,560.

26
3.6. Siem Reap Sewer
3.6.1. Failure of Existing Interceptor Sewer 71. The interceptor sewer was installed under the SRWM project between 2007-2009 and
commissioned in 2010. It consists of 632m of 600mm GRP pipe and 3,043m of 700mm GRP
pipe. It begins at National Road NR6 running north to south down Sivatha St, then turning
southwest onto Wat Chork St, crossing the Ring Road, and ending at a pump station. From
this pump station wastewater is delivered to the WWTP, also constructed under the SRWM
project.
72. The pipe invert at the upstream end was at 3m depth (600mm dia) and at the downstream
end reached its maximum IL depth at 8.3m (700mm dia). The grade of the 632m of 600mm
pipe was 0.237% and the downstream 3,043m of 700mm pipe 0.187%.
73. Between 2011 and 2014, the road surface above the pipeline failed in 5 locations. In the
furthest up stream failure the top of the pipe deformed inwards at the top and developed a
leak at the top, but did not break. In the four downstream cases the pipe failure was a typical
compression failure with complete collapse at all 4 road failure locations. Three of these
collapse locations have been fully repaired, the upstream deformity has had a temporary repair
and backfill, and the fifth failure point around 500m upstream of the pump station has not been
repaired due to lack of budget. The pipe remains closed at this location. Therefore the
interceptor sewer is not functioning.
74. Further failures could happen at any time, and there may be many more deformed areas
of pipe that have not been detected yet as there is no road collapse evident. Failure along any
part of this pipe means that there is no way for wastewater to reach the WWTP, and all of it is
discharged via overflow weirs to the town drainage.
75. The layout is shown in Figure 3-10.

27
Figure 3-10 Current WW infrastructure in Siem Reap

28
3.6.2. Options for replacing interceptor sewer 76. There are three main options for replacing the 3.7km length of interceptor sewer. All
options will include increasing the capacity from the current 600/700mm diameter and using
a stronger pipe material such as ductile cast iron (DCI). The options are :
• Option 1: Same deep alignment as existing, using trenchless technology for one
1000mm diameter DCI pipe
• Option 2: Shallower alignment with multiple (3-4) in-line pump stations, using open
cut trenching for one 1000mm diameter DCI pipe.
• Option 3: Same deep alignment as existing, using open cut trenching for one
1000mm diameter DCI pipe.
77. Pipe sizes above are suggested sizes only and will need to be confirmed during detail
design.
78. Option 3 has been discounted due to the serious problems experienced on the original
project with dewatering, proper compaction, operating in a deep trench, necessary road
closures, disruption and mess in the main tourist area and economic losses from affected
businesses and associated tax revenue to the government.
79. During the initial 2006 design, a cost comparison was made between deep trenching
for a gravity-flow pipe against shallow trenching with multiple pump stations, and the
outcome was that the lifetime cost effectiveness was better for trenching without pumping
up to a depth of 10m.
80. Currently, if the interceptor was in working condition, the flow would be limited to
25,800m3/day which is the maximum capacity of the 600mm pipe. This is sufficient for the
central and western areas up to and beyond 2030 as a wastewater flow of 16,000m3/day
is projected for these areas by 2030. However, as the pipe needs to be deep due to the
flat topography of Siem Reap, is expensive and difficult to construct, it should be sized for
a much longer lifetime and a 50 year life to 2070 is suggested.
3.6.3. Time Horizon 81. The wastewater generation estimate for the east and west service areas by 2070 based
on a 2015 generation of 14,157m3/day and a growth rate of 3% is 71,950m3/day. If the
eastern area is disconnected from the trunk sewer and diverted to a new separate WWTP
as proposed by the Korean project design, then the required 2070 wastewater capacity of
the proposed trunk sewer replacement will reduce to 47,000m3/day. A 1000mm diameter
pipe will be able to take this flow.
3.6.4. Options for trunk sewer replacement - Trenchless Technology 82. The preferred construction method is pipe bursting with pipe splitting to replace
the existing 600/700mm diameter GRP pipe with 1000mm lined DCI pipe. Pipe splitting has
an advantage over pipe jacking in that the same existing alignment can be used and the

29
amount of excavated spoil requiring disposal offsite is less. Otherwise, pipe jacking is also
a good option and is of a similar cost.
83. However it is recognised that large diameter pipe bursting is a specialised activity and
that the relatively small number of regional companies involved in this method of trenchless
technology may cause problems in securing a contractor in the timeframe desired. The
Design-Build contract will therefore leave the methodology open to other trenchless
technology methods such as pipejacking, both in order to maximise the number of potential
interested bidders and take advantage of the expertise of these companies in putting
forward alternative solutions.
Figure 3-11 Typical pipe splitting equipment
84. The capital cost estimates, whilst preliminary at this stage, show the trenchless option
to be around 18% more expensive than shallower open cut with 3 pump stations. This
difference is mainly in hiring the pipe bursting equipment and operator team.
However, the lifetime cost of the trenchless option is significantly less due to having no
ongoing power costs.
3.6.5. Cost Estimates 85. Companies were generally not willing to provide quotes or cost estimates outside of a
formal bidding process. Costs vary widely based on factors such as geology, access,
availability of existing service plans, local auxiliary equipment hire etc. Seven quotes were
obtained but the estimates are based on 3 Chinese quotes and one US quote.
86. The cost estimate for this sewer pipe replacement with pipe bursting and installing a
1000mm DCI pipe is $15,911,610
87. Should pipejacking be selected as the preferred methodology, the cost will likely be an
increment higher than the cost for pipe bursting to reflect the hire cost of more sophisticated
mechanical and electrical equipment.

30
4. Site Visits and Meetings
4.1. Site Visits
88. Site visits were carried out between May 5th to May 9th 2017. Site photo records are
given below.
4.2. Battambang
4.2.1. Water Supply
Figure 4-1 Proposed River Raw Water Abstraction Point
Figure 4-2 Proposed Water Treatment Plant Site

31
Figure 4-3 Kanghot Irrigation Dam upstream of Off-take Point
4.2.2. Wastewater and Sanitation
Figure 4-4 Battambang Old WWTP Figure 4-5 Battambang Site New WWTP

32
4.3. Kampong Cham
4.3.1. Water Supply
Figures 4-6 and 4-7 Existing Raw Water Pump Station and Proposed Raw Water Off-take
Figure 4-7 Existing Off-take Point and Pumping Station
Figure 4-8 Kampong Cham Existing Water Treatment Plant
33
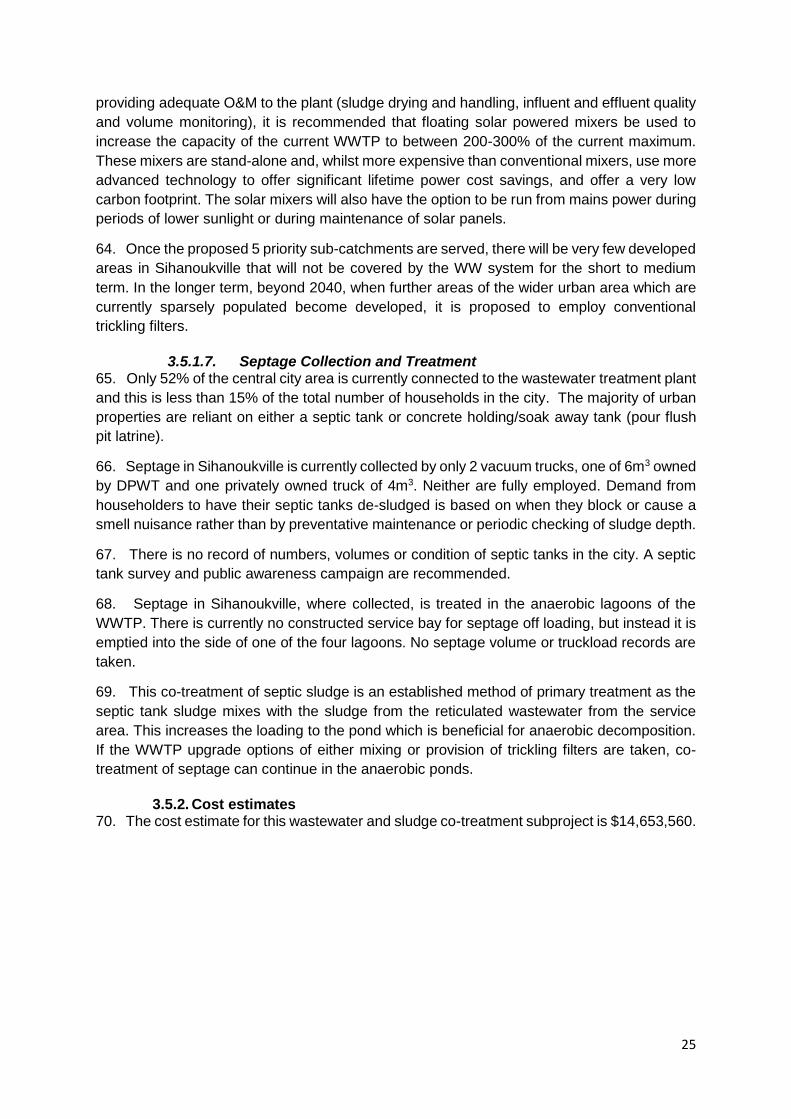
4.3.2. Septage Treatment
Figure 4-9 Kampong Cham Septage Site
4.4. Sihanoukville
4.4.1. Wastewater and Sanitation
Figure 4-10 Site of a Sihanoukville Pumping Station and Existing WWTP Lagoons
34
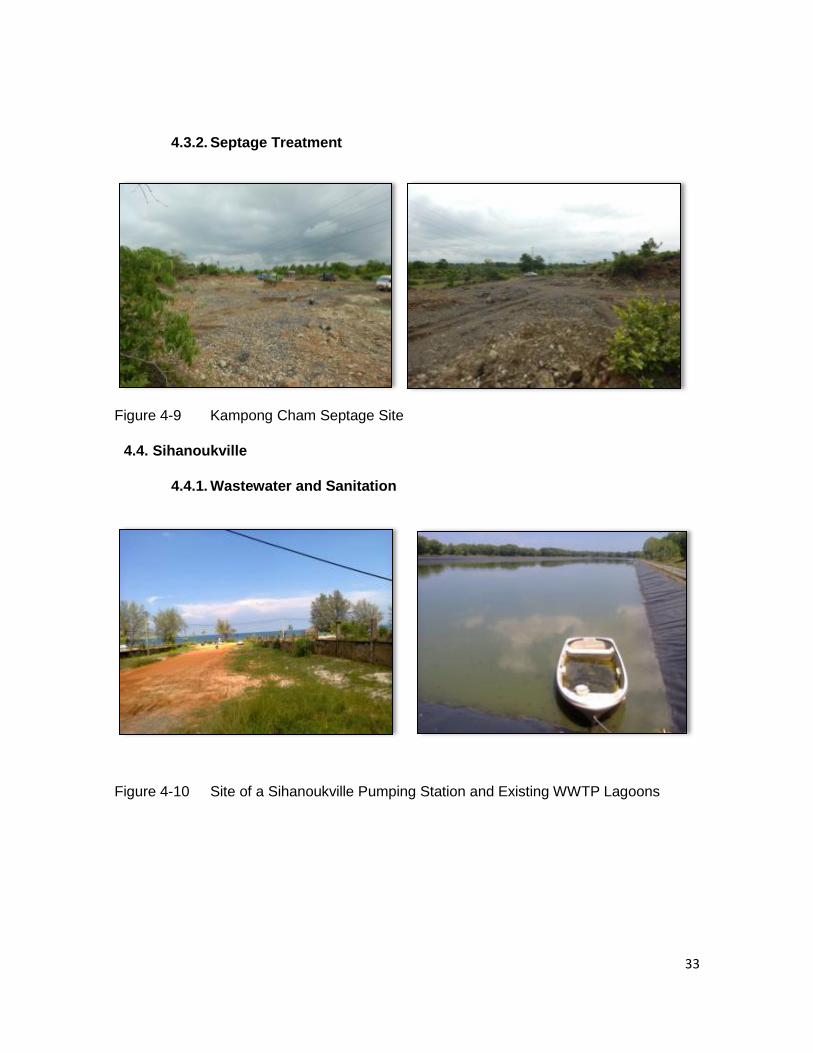
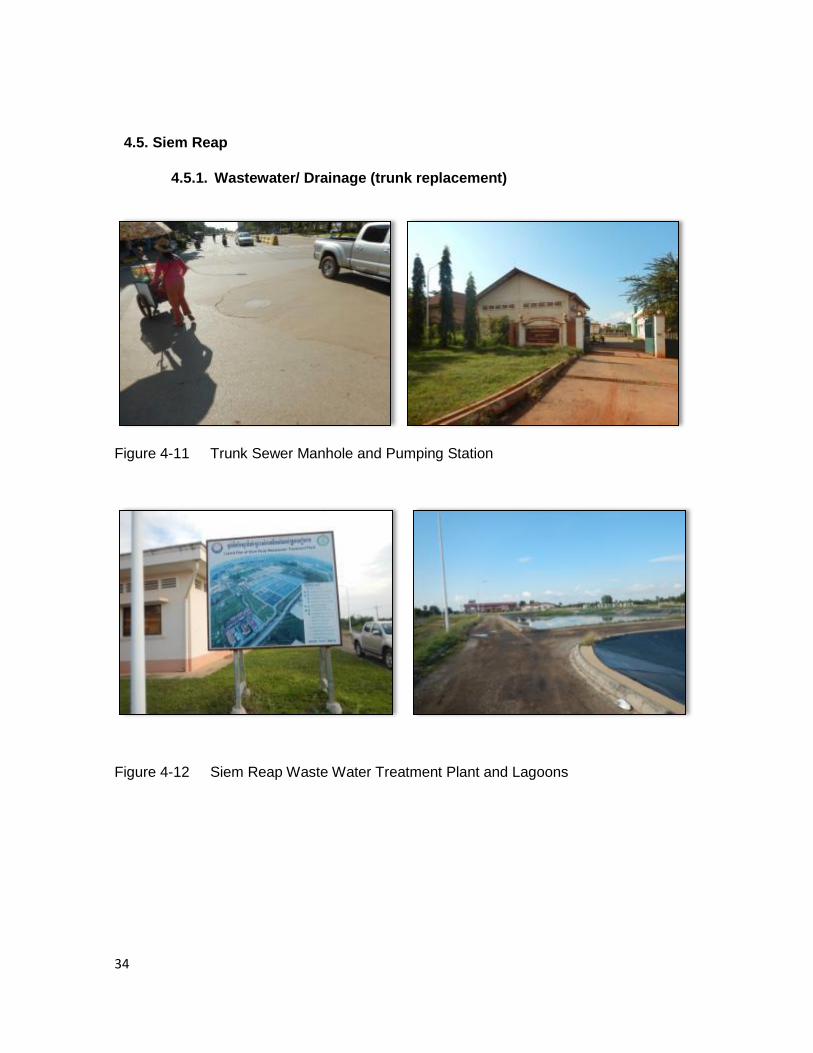
4.5. Siem Reap
4.5.1. Wastewater/ Drainage (trunk replacement)
Figure 4-11 Trunk Sewer Manhole and Pumping Station
Figure 4-12 Siem Reap Waste Water Treatment Plant and Lagoons

35
4.6. Meetings
89. Consultations took place with senior management of MPWT and the use of FRMI was
recommended.
90. The PPTA included consultations with MIH, MPWT and their provincial departments
on key matters relating to water safety, as part of the design to institutional support including
support to developing water safety plans. During these discussions, issues related to
climate change that were discussed included (i) effects of flooding after rainfall events at
the WWTPs at Sihanoukville and Battambang, (ii) periods of insufficient water supply during
drought periods, particularly at Battambang where the system is reliant on the Sangké river
which also supplies irrigation schemes, (iii) effects of periods of high temperature on water
consumption, and (iv) risks of drought and higher temperatures causing impaired
wastewater plant function and inadequate water to flush the sewerage system. Features of
the preliminary design carried out by the CDIA team that address these were discussed. In
all cases it was agreed that measures incorporated into preliminary design were
appropriate, but that detailed design would need to be informed by more detailed analysis
of climate related risks

36
5. Assessing Climate Change
5.1. ADB’s Climate Risk Management Framework
91. The climate risk management approach of the Asian Development Bank (ADB) aims
to reduce risks resulting from climate change to investment projects. ADB’s framework
identifies climate change risks to project performance in the early stages of project
development, and incorporates adaptation measures in the design of projects at risk. ADB
climate risk management framework comprises the following steps:
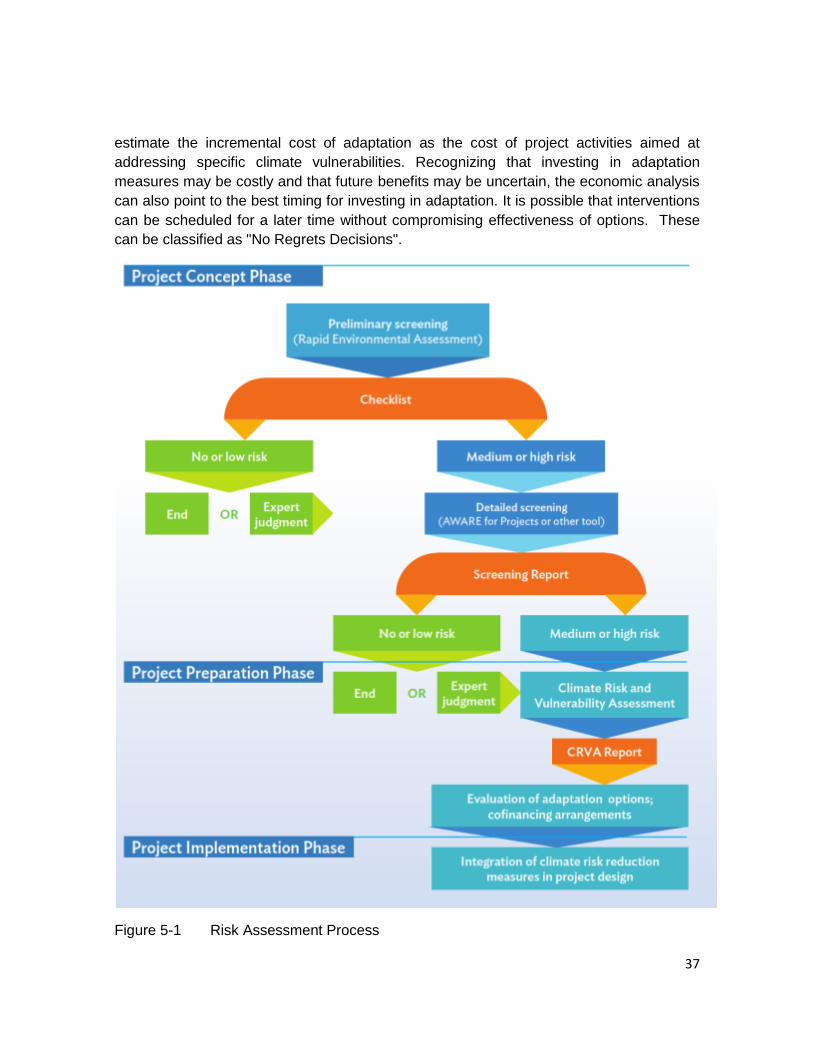
i. context-sensitive climate risk screening at the concept development stage to identify
projects that may be at medium or high risk;
ii. climate change risk and vulnerability assessment during preparation of projects at
risk;
iii. technical and economic evaluation of adaptation options;
iv. identification of adaptation options in project design; and
v. monitoring and reporting of the level of risk and climate-proofing measures.
5.2. Climate Risk Screening
92. All ADB projects are screened for climate risks. An initial screening identifies medium
or high risks which need further screening. Risks considered are those resulting from
temperature increase, precipitation change, wind speed change, sea level rise, solar
radiation change, water availability, flooding, tropical storms, wildfire and landslide.
5.3. Climate Risk and Vulnerability Assessment
93. A detailed climate risk and vulnerability assessment is carried out for projects classified
as medium or high risk during project preparation. The assessment aims to quantify risks
and identify adaptation options that can be integrated into the project design. The level of
technical rigor of the assessment depends on the project complexity and availability of
climate data and information for the project area. It can range from a simple desk analysis
to a complex assessment based on custom climate projections to enable a more detailed
assessment. This was the approach adopted in this study with site specific climate change
projections being produced.
5.1. Technical and Economic Evaluation of Adaptation Options
94. Based on the climate risk and vulnerabilities assessed, adaptation options are identified
and evaluated on the basis of their technical feasibility and economic viability. Technical
feasibility evaluates whether proposed engineering and non engineering measures can be
implemented with available skills, equipment, and other local factors such as geography,
governance, and capacity.
95. The economic analysis involves estimating and comparing the cost and benefits of the
project based on two different scenarios: (i) the project under climate change without
adaptation measures, and (ii) the project under climate change with adaptation measures.
It aims to identify which adaptation option yields the highest net benefit. It also aims to
37
estimate the incremental cost of adaptation as the cost of project activities aimed at
addressing specific climate vulnerabilities. Recognizing that investing in adaptation
measures may be costly and that future benefits may be uncertain, the economic analysis
can also point to the best timing for investing in adaptation. It is possible that interventions
can be scheduled for a later time without compromising effectiveness of options. These
can be classified as "No Regrets Decisions".
Figure 5-1 Risk Assessment Process

38
96. Decision makers may elect to invest minimally at the early stages of a project but
ensure that the project can be climate proofed in the future if and when circumstances
indicate this to be a better option than not climate proofing. This decision ensures that the
project is “ready” for climate proofing, if and when required. This is known as "climate
readiness" and avoids the foreclosure of climate-proofing options and preserves flexibility
to improve climate resilience as climate change is actually observed as opposed to
projected.
5.2. Identification of Adaptation Options
97. The most viable adaptation options or climate proofing measures are identified in
consultation with the executing agencies or project sponsors, and are integrated in the
project design. There is no standardized approach to climate proofing. In some cases,
climate proofing is essential to ensure the project is not negatively affected by climate
change. In other cases, the lifetime of the project is such that climate proofing is not a viable
option or climate readiness is a more appropriate approach. Climate proofing may involve
adjusting engineering design such as increasing drainage capacity of water supply systems,
elevating roads in areas particularly at risk from flooding, or ecosystem-based adaptation
measures such as revegetation of unstable slopes.
5.3. Monitoring and Reporting
98. The level of risk identified during project concept development and the findings of
climate risk and vulnerability assessment carried out during project preparation are
documented within ADB. The level of risk assigned to the project and the budget allocated
to the incremental cost of adaptation are recorded for monitoring and reporting purposes.
5.4. Climate Proofing Projects
99. The process of climate proofing investment projects aims both at assessing the climate
risk to a project’s future costs and benefits and at undertaking a technical and economic
analysis of options to alleviate or mitigate those risks. Accounting for climate change at the
outset of the project cycle does not imply that climate-proofing measures with large and
costly investments need to be put in place as project implementation is initiated. It does
imply, however, that decisions about project design and the adoption and timing of climate-
proofing measures be informed with the possible impacts of climate change in the initial
phases of the project cycle and that decisions of an irreversible nature be avoided. This is
the essence of "No Regrets" Decisions.

39
6. Potential Impacts of Climate Change on Water Supply and Sanitation
100. There are many potential impacts of climate change on water supply and sanitation
related projects.7 These are discussed below.
6.1. Changes in Precipitation
101. Changes in precipitation can affect water supply availability and quality in the following
manner :
• Reduced precipitation levels can decrease the availability of both surface water and
groundwater.
• Increased precipitation intensity and flooding can overwhelm existing drainage
infrastructure.
• High-intensity precipitation may increase erosion; larger sediment loads may result
in more rapid sedimentation of storage reservoirs, reducing storage capacity.
• Changes in the amount of rainfall may affect the performance and operation of water
systems; increases in precipitation may put pressure on urban drainage systems
while sewerage systems may become more difficult to operate and maintain if
precipitation levels and discharge decline.
• Long-term rainfall increases may elevate groundwater levels, decreasing the
efficiency of natural purification processes and increasing the risk of infectious
disease and exposure to toxic chemicals.
6.2. Changes in temperatures
102. Changes in ambient air and water temperatures can affect water supply availability
and quality in the following manner :
• In some instances, warmer temperatures may improve biochemical treatment
processes, particularly in cold regions or seasons; in other instances (particularly in
warm areas), the efficiency of these processes may be reduced if critical thresholds
are exceeded.
• Temperature increases may result in a reduction of surface water availability by
decreasing runoff and increasing evaporation from lakes and reservoirs.
• Higher water temperatures will decrease dissolved oxygen capacity, potentially
leading to hypoxia, toxic algae growth, and proliferation of waterborne diseases.
• Higher temperatures may increase agricultural water demand due to decreasing
soil moisture and increasing evapotranspiration demand.
• Increases in periods of intense heat may result in higher water demands for
domestic and industrial uses.
7 Guidelines For Climate Proofing Investment in the Water Sector : Water Supply And Sanitation, ADB 2016
40
6.3. Changes in extreme weather events
103. Changes in frequency, duration, severity, and distribution of extreme weather events
can affect water supply and sanitation services and infrastructure in the following manner :
• Service disruptions may increase due to breakdowns in water distribution pipelines
from extreme events, such as unseasonal precipitation patterns and flash floods.
• The structural integrity of basic water infrastructure may deteriorate due to floods
and periods of intense heat and cold.
• Increases in the intensity of floods may result in the contamination of water sources
and may increase the incidence of waterborne and water-related diseases.
• Increases in the frequency and intensity of droughts will cause reduced surface
discharge and falling groundwater tables, which can lead to increasing source water
pollution and to the drying up of wells, extending the distances that must be travelled
to collect water.
6.4. Changes in Sea Conditions
104. Sea-level rise and storm surges put water supply at risk in the following manner :
• Saline intrusion in low-lying coastal areas may contaminate aquifers and force
currently secure water sources out of use.
• Saltwater intrusion may corrode materials used in water distribution.
• Coastal storms in combination with sea-level rise can damage coastal water supply
and wastewater treatment facilities.
• Ocean discharge from treated wastewater outfalls can be impaired by sea-level rise,
particularly during high tides or storm surges.
6.5. Adaptation Measures
105. Various adaptation measures are available such as the following:
• Water supply can be protected against increasing variability of seasonal and annual
precipitation and runoff by building additional water storage infrastructure, such as
reservoirs or storage tanks, to provide buffers.
• Adjusting infrastructure designs and introducing flexibility in water systems
operations can build resilience to changing climatic conditions such as changes in
the seasonality of precipitation and changes in flood return periods.
• Diversifying water supply sources—including conjunctive use of surface and
groundwater, reuse and recycling, and use of household-level water sources such
as roof water harvesting—can mitigate the impacts of weather-related disruptions
on any given component of the water supply system.
• Flood protection infrastructure can help prevent contamination of water supply
sources and treatment works. In some cases, water storage can also contribute to
downstream flood control.
• Increasing coverage of community water supply infrastructure can improve
dependability under changing climatic conditions.

41
• Green roofs, street trees, wetlands, and porous paving can reduce the volume of
stormwater runoff and decrease pressure on wastewater treatment facilities.
• The preservation of riparian wetlands upstream of water users can improve water
quality and quantity and provide flood protection at times of high-intensity or long-
duration precipitation.
• Separation of stormwater and sanitary sewers can minimize the risk of
overwhelming collection systems and water treatment facilities in times of heavy
precipitation.
• Integrated water resources management within river basins can improve the
allocation and management of scarce water resources in the context of climate
change.
• Promoting the efficient use of water through programs, incentives, and technologies
for water conservation and water recycling can help reduce water demand.
• In coastal areas, water utilities can utilize desalination of seawater or brackish water
to supplement insufficient freshwater resources.
• A properly prepared disaster response strategy can reduce the negative effects of
water service disruptions, particularly to critical services such as sanitation and
domestic water supply.
• Ensuring that water authorities and stakeholders are equipped with adequate data,
information, and skills will help them to respond to the impacts of climate change.
6.6. AWARE for Projects
106. AWARE for Projects is an online tool used by ADB project teams to screen projects
for climate risks. The tool uses data from 16 general circulation models, as well as
databases on temperature increase, wildfire, permafrost, sea ice, water availability,
precipitation change, flooding, snow loading, tropical storms, and landslides. For each
project screened, the tool generates an overall climate risk ranking of low, medium, or high;
key risk areas; and narratives on potential impacts and adaptive measures to guide
subsequent activities. The following diagrams quote the findings for climate risk and for and
geological hazard risk for the wastewater and for the water supply subprojects.

42
Figure 6-1 AWARE climate risk ratings for wastewater subprojects

43
Figure 6-2: AWARE geotechnical hazard risk ratings for wastewater subprojects

44
Figure 6-3: AWARE climate risk ratings for water supply subprojects
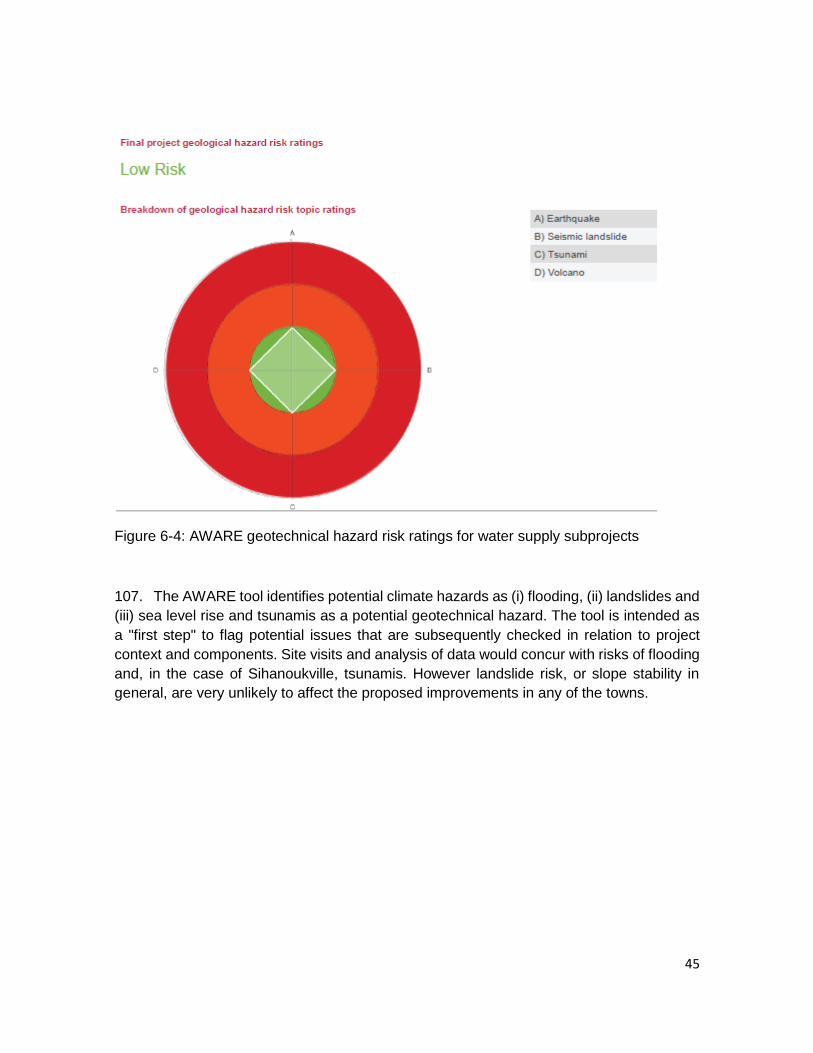
45
Figure 6-4: AWARE geotechnical hazard risk ratings for water supply subprojects
107. The AWARE tool identifies potential climate hazards as (i) flooding, (ii) landslides and
(iii) sea level rise and tsunamis as a potential geotechnical hazard. The tool is intended as
a "first step" to flag potential issues that are subsequently checked in relation to project
context and components. Site visits and analysis of data would concur with risks of flooding
and, in the case of Sihanoukville, tsunamis. However landslide risk, or slope stability in
general, are very unlikely to affect the proposed improvements in any of the towns.

46
7. Assessing Vulnerabilities
7.1. ADB Guidelines
108. The vulnerability assessment examines each project component or asset and
attempts to establish causal relationships. This is shown in Table 7-1. 8
Table 7-1 Conceptual Framework for Climate Risk and Vulnerability Assessment
109. Vulnerability refers to the degree to which a system is susceptible to, and unable to
cope with, the adverse effects of climate change. Vulnerability, exposure and adaptive
capacity are very dependent on local conditions and often highly site-specific.
There are four sites under consideration :
8 Guidelines For Climate Proofing Investment In The Water Sector Water Supply And Sanitation, ADB 2016
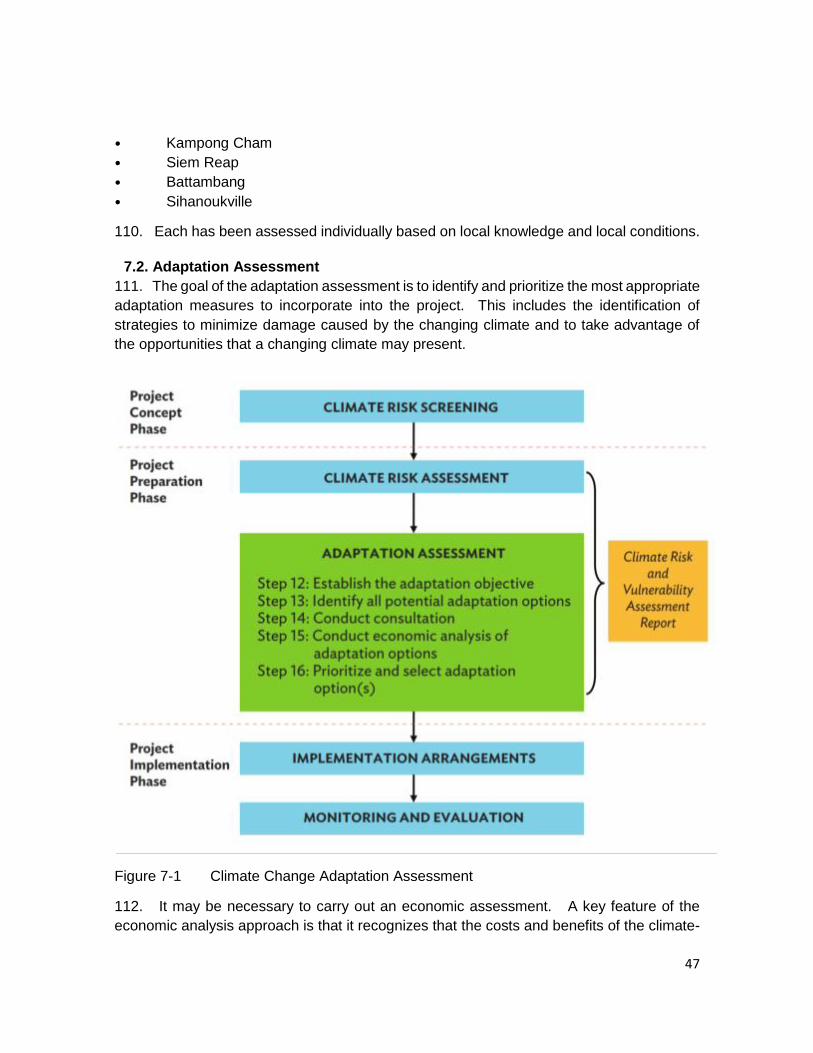
47
• Kampong Cham
• Siem Reap
• Battambang
• Sihanoukville
110. Each has been assessed individually based on local knowledge and local conditions.
7.2. Adaptation Assessment
111. The goal of the adaptation assessment is to identify and prioritize the most appropriate
adaptation measures to incorporate into the project. This includes the identification of
strategies to minimize damage caused by the changing climate and to take advantage of
the opportunities that a changing climate may present.
Figure 7-1 Climate Change Adaptation Assessment
112. It may be necessary to carry out an economic assessment. A key feature of the
economic analysis approach is that it recognizes that the costs and benefits of the climate-

48
proofing options must be assessed by identifying and quantifying the climate change
impacts along two scenarios:
• Scenario without climate proofing: What are the expected impacts of climate change
on the project in the future if there were to be no climate-proofing measures in
place?
• Scenario with climate proofing: What are the expected impacts of climate change
on the project in the future if there were to be climate proofing measures in place?
7.3. Climate Change and Water Governance in Cambodia,
113. Cambodia has abundant water resources but they are spatially and temporally
unevenly distributed. In reality, many communities face problems brought on by too much
or too little water. This situation is compounded by the effects of catchment degradation
caused by physical alteration of inland water systems (both quantity and quality),
deforestation and habitat destruction, water withdrawal for agriculture, mining and
urbanisation, pollution, and hydrological and environmental changes due to infrastructure
developments within and outside of Cambodia9
114. It is acknowledged that uncertainties stem from incomplete knowledge of the climate
system and its representation in climate models. Downscaled data using regional climate
model and global climate model datasets is coarse and based on uncertainty in the
trajectory of future emissions and concentrations of greenhouse gases and aerosols.
Natural variability inherent in the climate system is another cause of uncertainty.10
7.4. Climate Change Strategic Plan for Water Resources and Meteorology 2013-2017
115. The Kingdom of Cambodia is considered one of the most water-abundant countries
in the region. There are two types of fresh water available in Cambodia: annually around
75,000 million cubic meters of surface water runoff; and 17.6 million cubic meters of aquifer
ground water.
116. Rivers and streams, lakes, aquifers and marine water are important sources for
national economic development in many sectors, such as agriculture, manufacturing and
small-scale industries, hydropower, navigation, tourism, environmental protection and daily
life. Cambodia’s economy is highly dependent on water.
117. The importance of water for food production, rural livelihoods and economic
development is recognized in the Government’s Rectangular Strategy (RS) on Growth,
Employment, Equity and Efficiency, the National Strategic Development Plan (NSDP) and
the Strategy for Agriculture and Water Resources.
9 Climate Change and Water Governance in Cambodia, Challenge and Perspectives for Water Security and Climate Change
in Selected Catchments, Cambodia, Cambodia Development Resource Institute, Phnom Penh, December 2015
10 Ministry of Water Resources and Meteorology, 2012

49
118. It has been accepted that Climate Change (CC) will increase water management
challenges; less rainfall is anticipated during the dry season and more during the wet
season, with more extreme weather events and potentially worse seasonal water shortages
and floods.
119. The Ministry of Water Resources and Meteorology (MoWRAM) has committed itself
to overcoming the impacts of climate change, introducing a law on water resource
management, a national water resource management policy and strategy, and many more
guidelines and regulations for better climate change-adapted management and
development.
120. Water quality is determined by natural processes, particularly by the dilution effects
of water runoff from heavy rainfall, which normally occurs during the wet season. At this
time, bacteriological and chemical water quality is generally high, although physical water
quality may be reduced because of heavy sediment loads. However, when river flows
decline, water quality may deteriorate significantly due to contaminants being diluted to a
much smaller extent. In addition, due to human population growth and socio-economic
development, water quality has been increasingly threatened, especially during the dry
season, and particularly during years of less rainfall.
121. Cambodia’s climate is dominated by the monsoon, which drives the tropical wet and
dry climates. The monsoon brings rain to Cambodia during May to September or early
October – called wet season; while the northeast monsoon blows during November to
March, bringing dry, cool air, with hotter localized air during late March to late April.
122. Temperatures are fairly uniform throughout the Mekong River Basin, with only small
variations from the average annual mean temperature of around 28oC and the average
maximum and minimum temperatures of 34oC and 21oC, respectively. The coldest
temperature can be as low as 10oC during the month of January. The warmest month is in
April, during which the temperature can be as high as 38oC before the rainy season arrives.
Normally, typhoons and tropical storms hit Vietnam first leaving Cambodian areas less
damaged.
123. The average precipitation rate in Cambodia is 1,600 mm per year. Around Tonle Sap
Basin and the lowlands near the Mekong River rainfall varies from 1,300 to 1,900 mm per
year.
124. Most Cambodian people face a shortage of fresh water during the dry season, and
also during the “small dry season” in the wet season; but in the rainy season they face too
much water, and flooding. Irrigation infrastructure is insufficient, old and run-down, which
has a severe impact on water storage, distribution and supply, sanitation and food
production. The waters of the Gulf of Thailand are enclosed by land, and there is a growing
risk that contaminants and sediment from coastal towns, agricultural areas and forest
logging may pollute the sea. Furthermore, shipping and off-shore exploration for oil and gas
reserves present additional risks to water resources.

50
125. The most concerning issue for ground water quality is arsenic content. There are
many wells exceeding World Health Organization (WHO) guidelines on arsenic content; this
is known to be caused naturally, not by human-induced activities. Increased arsenic content
in ground water also affects surface water quality.
Figure 7-2 Arsenic Risk Contamination in Cambodia
126. The impact of drought has been addressed by a number of programs aiming to
improve the irrigation system, rehabilitation of pumping stations and water pumps, water
supply and sanitation, and the establishment of Farmer Water User Committees (FWUC).
127. Extreme weather events, such as storms or typhoons, are not usually considered a
major problem in Cambodia as the country is protected by surrounding mountain ranges.
Storms do occasionally affect the country, with most storm-related damage being caused
by localized floods associated with heavy rain. Tropical storms can also affect the level of
Mekong River flooding experienced in a given year. Greatest damage occurs when these
arrive during September and October when the seasonal discharge of the Mekong River is
already high, and a second significant peak to the annual flood is generated.
128. Wind damages human property such as houses, as well as agriculture and ecological
systems. Typhoon Ketsana damaged hundreds of houses in Kampong Thom and Siem
Reap in 2009.
129. The vision of the Climate Change Strategic Plan (CCSP) for Water Resources and
Meteorology is sustainable use of water resources in adapting to climate change; and
timely, trusted weather and climatic information.
51
130. Cambodia is expected to experience higher and more intense rainfall followed by
periods of drought. The effects are likely to include more severe water scarcity and more
frequent floods, resulting in crop failures and food shortages. Accelerated loss of
biodiversity will negatively affect ecosystems. Coastal communities and eco-systems are
likely to be affected by rises in sea levels, and higher temperatures and humidity will create
conditions for increased incidence of malaria and dengue fever. The poor and marginalized,
particularly women and children, will be worst affected.
7.4.1. Water Availability 131. The impacts of climate change on the water resources sector include problems of
increased flood and drought, changes in water supply and water quality, and increased
competition for water. The irregular seasonal times of wet and dry months caused by climate
change, especially during the last few decades, impacts on water resources management
and development efforts. At the same time, there is increased demand for water from
emerging sectors, including industry, livestock, domestic use, and especially agriculture;
coupled with seasons changing due to climate change, this creates many more social
problems. With global warming, Cambodia’s temperature has increased making it difficult
to prevent loss of water from evaporation. Ground water requires recharging annually from
rain water. Due to climate change impacts on the amount of rain water needed to recharge
ground water, the recharge rate is seriously reduced, leading to Cambodian farmers having
insufficient ground water for farming.
7.4.2. Reservoirs 132. Many reservoirs are gradually getting shallower because of sedimentation, which
leads to reduced capacity for water storage. Irrigation systems and hydraulic infrastructure
have not yet been modernized, or taken climate change into consideration in almost all
areas of the country. Floods and droughts impact on irrigation systems and hydraulic
infrastructure. Most importantly, floods cause tremendous negative impacts on irrigation
systems located in low land areas.
7.4.3. Dams 133. Frequent floods destroy dams; most of them are old and the impacts of climate change
on them have not been considered. Flood Protection Dikes have been destroyed by floods,
as during each flood, water overflows on these Flood Protection Dikes. The potential
impacts of climate change were not taken into account during their construction and they
are made from soil.
7.4.4. Erosion 134. River banks and coastal areas suffer erosion of beaches/banks caused by floods
and/or high speed waves, brought on by the impacts of unpredictable climate change, which
leads to negative impacts on rural livelihoods, especially on farmers who are completely
dependent on limited land areas.

52
8. Climate Change Projections
8.1. Developing Appropriate Climate Change Scenarios
135. Climate projections are representations of the responses of the climate system to
greenhouse gas (GHG) emissions or atmospheric GHG concentrations. They are typically
based on general circulation model11 (GCM) simulations. Climate change projections can
be useful in determining how climate variables, such as temperature and precipitation, may
change in the future under various assumptions about GHG emissions.
136. However, projections based on climate model outputs are limited by the imperfect
representation of the climate system within such models and by uncertainties associated
with future GHG emissions among other factors. Therefore, climate projections should not
be viewed as forecasts or predictions, but rather as plausible alternative characterizations
of future climate conditions. They are helpful in exploring “what-if” questions; they do not
aim to provide accurate or definitive predictions of how climate will behave in the future.
There are four generally used climate change scenarios. These are discussed below.
8.2. Climate Change Science
8.2.1. IPCC 137. The Intergovernmental Panel on Climate Change (IPCC) is a U.N. scientific body who
produce a series of international assessment reports on the current state of climate change
knowledge.(AR5 is the current edition) The release of CO2 and other greenhouse gasses
(GHGs) into the atmosphere will lead to further increases in the average temperature in the
future. It is likely that these higher temperatures across the globe will change rainfall
patterns. The IPCC has facilitated comparison of GCM (Global Climate Models) by
suggesting future CO2and other GHGs related forcing scenarios and standard input data
such as temperature, rainfall, wind speed etc. GCMs are constantly being updated and
results from each new model are compared to the outputs from all of the others. Then on
behalf of the IPCC the World Climate Research Program conducts inter-comparison studies
of GCM results.
8.2.2. Future Scenarios 138. Future climate is contingent on human actions (primarily CO2 emissions) which will
depend on societal decisions yet to be taken, so accurately forecasting is impossible in
principle. Also caution must be used in attempting to forecast future climates because of
uncertainties in the interactions between the oceans, atmosphere and biosphere. As a result
GCMs produce a range of modeled future climate situations. These are not attempts to
11 Computer simulations of air mass and ocean current movements for climate change forecasts and weather forecasts

53
predict the likelihood of what may happen but the consequences of certain concentrations
of GHGs. These are called climate projections.
139. Previous IPCC reports (2000 to 2007) have used the Special Report on Emissions
Scenarios (SRES) that make different assumptions about global changes in future
greenhouse gas pollution, land-use and other driving forces. Some scenarios have
assumed very high rapid economic growth and associated high CO2 future emissions.
Others assume a reduction in the use of fossil fuels with proportionally reduced CO2 levels.
140. The latest IPCC report (Number 5) uses a new description “Representative
Concentrations Pathway (RCP)”. These RCP scenarios are projections of the change in the
balance between incoming and outgoing radiation to the atmosphere. The numbers refer to
global energy imbalances, measured in watts per square meter, by the year 2100.
141. RCP 2.6 (PD) refers to a scenario where CO2 emissions peak in the near future and
then decline. This is optimistic. RCP 4.5 and 6.0 are intermediate scenarios. RCP 8.5 refers
to the most severe case of the 4 scenarios considered. where emissions continue to rise
until 2100 leading to global temperature increases. This is pessimistic.
Figure 8-1 RPCs from IPCC AR5 (2011)
142. Recent climate change studies use RCPs of 8.5 for extreme CO2 future concentrations
and values of 2.6 or 4.5 to represent low CO2 future concentrations. In the projections for
MPWT the RCP 8.5 is used. This is a pessimistic scenario which although it is no less likely
than the other scenarios and not necessarily the worst case it is designated the “extreme
scenario”.

54
8.3. MPWT FRMI - Flood Risk Management Interface Software
143. Cambodia is one of the pilot countries participating in the Pilot Program for Climate
Resilience (PPCR). The PPCR provides incentives for scaled-up action and
transformational change in integrating consideration of climate risks and resilience in
national development planning, consistent with poverty reduction and sustainable
development goals.
144. The improvement of access to knowledge, to its dissemination and its conservation
was addressed by the development within MPWT of a knowledge management tool called
Flood risk management interface (FRMI). This software provides easy access to information
about floods and roads, as well as flood risk maps developed under the CR-PRIP.
145. A copy of the Flood Risk Management Interface (FRMI) Version 1.2 was obtained
from MPWT September 2016. In the interviews with MPWT it was recommended that it be
used in the Climate Risk and Vulnerability Analysis study (CRVA). FRMI simulates flood
risk projections for Cambodia under RCP8.5 for 2050. Further details of outputs obtained
from FRMI are given in Section 9.
8.4. CLIMSYSTEMS
146. CLIMsystems of New Zealand were retained to produce projected values for
precipitation and temperature under various RCP scenarios for target years of interest at
the four sites. Projections were based on historical data for rainfall obtained from
MOWRAM. Daily rainfall figures for the preceding 25 years were obtained and utilised.
Further details of outputs obtained from the projections are given in Chapter 10.
8.5. Reference Materials
147. As mentioned previously, ADB have published many useful guidelines on climate
change and these have been used in the preparation of this report. Two specific ones are
highly relevant:
• Sector Briefing on Climate Change Impacts and Adaptation: Water Supply And
Sanitation ADB, January 2012.
• Guidelines For Climate Proofing Investment in the Water Sector : Water Supply
And Sanitation, ADB 2016
148. In addition we have taken account of the following reports and publications :
1. Mekong River Commission, Roads and Floods, MRC Technical Paper No. 35, 2011
2. Climate Change Impact and Hydrology, MRD June 2013
3. Climate Change Adaptation Options, MRD May 2014
4. Climate Change Adaptation Report August, MRD, (Manley, R) August 2014
5. Reinforcing Community Flood Resilience, MPWT, August 2014
6. Report on Knowledge Management, MPWT, June 2015

55
7. Non Mandatory Guidelines for Flood Proofing Roads, MPWT September 2015
8. Road Design Standard Changes Report, MPWT September 2015
9. Flood Risk Management Interface Manual, MPWT, September 2015
10. Vulnerability Mapping Report, MPWT, January 2016
11. Climate Modelling Report, MPWT, January 2016

56
9. MPWT FRMI
9.1. Flood Risk Management Interface - FRMI
9.2. FRMI Methodology
149. The FRMI methodology consists of identifying of road links and parameters based on
topographical analysis of road physical parameters and assessing the flooding types that
they are exposed to. The topographical analysis is derived from Shuttle Radar Topographic
Mission (SRTM) data available from public internet sources. Topographical data is based
on remote sensing not physical site measurements.
150. Road segments from the National and provincial road network are sourced from
MPWT RAMS data and catchment areas. Other geographical parameters are then
calculated for each road segment. Road resilience is derived from its condition level as
provided by the RAMS system. Finally, flood impact or damage risk assessments are
carried out for four specific types of flood and mapped.
9.3. SRTM Accuracy
151. The approximate accuracy of a road location and elevation can be obtained from
SRTM but that accuracy is in principle limited by the size of the grid utilized. The SRTM data
used in the project was retrieved from a 90 m grid or cell. For such a grid the absolute
accuracy of SRTM data ranges from 10 to 20 meters in all directions.
152. The distance of 90 m means that break points, steep slopes or vertical drops would
not be traced accurately for countries with significant mountainous terrain, as all slopes are
interpolated from point measurements. In low variability terrains like flood plains in
Cambodia the overall error in elevation is relatively low. Errors factors of 1 to 2 meters have
been established by comparing SRTM data with measured and benchmarked elevations
from roads.
9.4. Road Catchment Area vs. River Catchment Area Method
153. The FRMI uses a road catchment area method rather than a river catchment area
method, mainly for effectiveness purpose related to data management and better correlation
to road impacts. It is possible to calculate every major river catchment area in the whole
country and to organize the gained information according to the river flow network. However
MPWT data is orientated towards the road network, not the river network. It is much easier
to use the existing road section data base as the main analytical unit and attach flooding
values to the individual road sections. Also repair budgets are attached to established road
sections, rather than catchment areas or river sections.
9.5. Flood Risk Damage Maps
154. Flood risk damage maps have been produced for various types of floods. The road
vulnerability maps present four road risk flooding damage indexes corresponding to different
flood types. Another index combines the risk of the four flood type for prioritization purposes.
57
It must be noted that experiencing flooding or being subject to flood risk does not necessarily
inflict a lot of damage to every road.
The overall equation is:
Flood damage risk = Risk of flood occurrence x Road condition factors
155. The flood risk calculation process starts by evaluating the risk of occurrence of the
four types of flood. The main input is the 1 day or 5 day extreme rainfall event, the drainage
areas, slope and shape. This leads to the build up intensity next to the road. It then
introduces factors to account for the resilience of the road to these floods. Road resilience
is assessed in the model through three indicators, the pavement surface roughness, the
pavement type and the condition of the drainage structures.
156. The road resilience factors are then applied in terms of the pavement structure and
how efficient the drainage system is under extreme rainfall. Four flood indexes are produced
which are then combined into one composite index.
The flood risk indexes are:
Flash Flood Index
Large Drainage Area Index
Build-up Area Flooding Index
Low Land Flooding Index
Combined flood risk index
157. The flow chart for this is shown below.

58
Figure 9-1 Flow Chart for Derivation of Flood Index
158. All these indexes are the basic tools for prioritizing the climate proofing of individual
road sections. To this is then added the impact of climate change on the flood risk situation.
This is projected to the year 2055.
Figure 9-2 Climate Change Analysis
159. A climate change scenario calculation using the projected 2055 rainfall data was
carried out and the changes compared to the existing situation. The relevant maps have
been produced at the national scale and for all the provinces. The types of maps available
are :
Flood damage risks – current conditions
Flood damage risks – future conditions
Flood damage risk changes in time
160. A flood damage risk map shows the road sections associated with four risk levels,
ranging from high (red), moderate (orange), low (yellow) to none (green). Maps of the flash

59
flood analysis show that flash flood risks are located in all provinces where there is
mountainous terrain. Highest risk areas are in Mondulkiri, Ratanakkiri and Pursat.
161. Large catchment areas high floods risks are distributed all over the country with no
specific patterns as urban flood risk areas and lowland flood risk areas are concentrated
along the Tonle Sap and the lower Mekong region. This is where most of the population is
located and it is an area of low geographical elevations.
9.6. Multiple Flood Vulnerability
162. For each province each road may be at risk from multiple sources of flooding. The
analysis was carried out on the basis of road sections so the entire length of any section
may not be susceptible to each flood risk factor and the lengths shown can be an over
estimation.
9.7. Climate Change Projections
163. The projections are based on current conditions and future values for 2055 under a
high CO2 climate change scenario which is RCP 8.5.
9.8. Appropriateness of FRMI
164. It is acknowledged that FRMI is targeted at road segments. However it does cover
the whole of Cambodia and the flood risks considered are generated by overland flow due
to flat terrain or flash floods in water courses. Therefore although roads are the main
consideration any other structures in the vicinity may be exposed to a similar level of risk.
165. This software is promoted by MPWT and the consultants were advised by MPWT
management to utilise it.
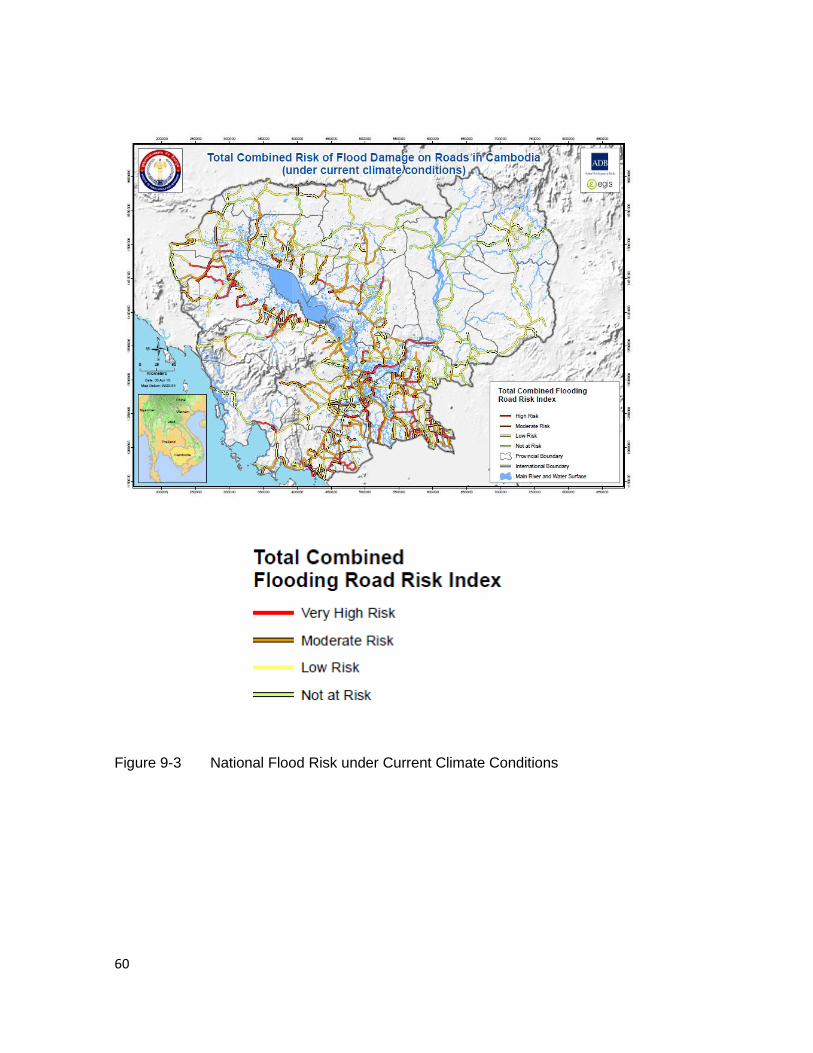
60
Figure 9-3 National Flood Risk under Current Climate Conditions

61
Figure 9-4 National Flood Risk under Future Climate Conditions

62
9.9. Battambang
166. Under future climate conditions year 2055 RCP 8.5 the area around Battambang is
classed as being at Moderate Risk. This location is in the catchment area of the Sangké
River which runs off from Mount Aoral.
Figure 9-5 Total Combined Risk of Flooding Battambang RCP 8.5 year 2055
9.10. Kampong Cham
167. Under future climate conditions year 2055 RCP 8.5 the area around Kampong Cham
to the south, southwest and east is classed as being at Moderate Risk. The area around
Kampong Cham to the north and northwest is classed as being at Low Risk. This location
is highly influenced by direct flows and overland flows from the Mekong river.

63
Figure 9-6 Total Combined Risk of Flooding Kampong Cham RCP 8.5 year 2055
9.11. Sihanoukville
168. Under future climate conditions year 2055 RCP 8.5 the area around Sihanoukville is
classed as being at Moderate to High Risk. Due to the hilly area and large number of water
courses this is due to flash floods. Sea level rise at this location is of the order 3mm/year.

64
Figure 9-7 Total Combined Risk of Flooding Sihanoukville RCP 8.5 year 2055
9.12. Siem Reap
169. Under future climate conditions year 2055 RCP 8.5 the area around Siem Reap is
classed as being at Moderate to High Risk. This location is influenced by the expansion
and contraction of Tonle Sap.

65
Figure 9-8 Total Combined Risk of Flooding Siem Reap RCP 8.5 year 2055
170. The implications of these risk maps are discussed in Chapter 11.

66
10. CLIMSYSTEMS
10.1. Introduction
171. This CRVA study examined the following locations
Table 10-1 Study location
Site name Latitude Longitude
Battambang 13.095 103.202
Kampong Cham 11.992 105.464
Siem Reap 13.367 103.844
Preah Sihanouk 10.625 103.523
Figure 10-1 Location of the study sites
10.2. Rainfall Data
172. Daily observation for 25 years from MOWRAM was cross checked with other
international data sources and provided the possible best data for this study. Other datasets
were also checked to avoid potential errors in the data, including three international
67
datasets: MSQWEP12 three hourly data, CHIRPS13 daily data and Asian daily precipitation
dataset. This cross checking confirmed that the local observation data is reasonably
reliable. Therefore only the local observation data was used in the daily extreme
precipitation analysis.
10.3. Temperature Data
173. Extreme temperature is calculated from global gridded datasets and may be not
exactly the same as the local observation records. However it is adequate for risk
assessment.
10.4. Supporting Data
174. Historical daily precipitation, maximum and minimum temperature, solar radiation
data for SPEI calculations for study areas were extracted from the Global Meteorological
Forcing Dataset for land surface modelling, 0.5 by 0.5 degree, from 1961-2012. (For
information access: http://hydrology.princeton.edu/data.php.)
10.5. Methodologies
10.5.1. Extreme precipitation depth and duration
10.5.1.1. Historical DDF Development 175. A fundamental issue in the estimation of quantiles is the need to extrapolate to
recurrence intervals significantly larger than the available records. This can be solved using
regionalization, a standard practice for improving the estimation of event quantiles at sites
with comparatively short records. In this report, the index regional flood frequency analysis
method based on L-moments proposed by Hosking (Hosking and Wallis, 2005) is discussed
to estimate the regional rainfall quantiles for the studied area.
Step 1: Derive the rainfall intensity time series of the different durations from historical hourly
data time series. The durations include: 3, 6, 12, 24, 48, 72, 120, 144 and 168 hours, then
select annual maxima series from the rainfall intensity series. Fit the annual maxima series
for each duration to a group of probability distribution functions. Three distribution functions
can be tested, including: Generalized Logistic (GLO), generalized extreme value (GEV),
and Gumbel distribution14. Choose the method to deploy for distribution parameter
estimation.
12 Multi-Source Quantile Weighted-Ensemble Precipitation. A method of predicing rainfall using a set of circulation models 13 Climate Hazards Group InfraRed Precipitation with Station data. A global rainfall dataset which incorporates 0.05° resolution satellite imagery and in-situ station data to create gridded rainfall time series for trend analysis and seasonal drought monitoring. 14 GLO, GEV and Gumbel distributions are statistical models for the prediction of extrme events

68
Step 2: Assess their goodness of fit with the Anderson-Darling test to follow the method
(Vigione, 2008). The Anderson-Darling test measures the extent of the departure, in terms
of probabilities, between a simulated hypothetical distribution and the frequency distribution
for consideration. If the estimated probability is greater than some defined significance
level, the test fails. Explore which of the three distributions, provides the best fit. For the
purpose of illustration we continue with the presumption that GEV parameters are used for
further analysis.
Step 3: Calculate rainfall depths for the range of return periods (including 2, 3, 5, 10, 15, 25,
50, 100, 200 and 300 year) for each storm duration using GEV distribution parameters
obtained from Step 1. The values consist of the table of depth-duration-frequency (DDF).
The intensity-frequency-duration (IDF) table can be computed directly from the DDF table
by simply dividing the rainfall depths by duration in hours.
Step 4: Generate the DDF and IDF curves based on the tables of DDF and IDF. A shape-
preserving piecewise cubic interpolation is used to produce smooth DDF and IDF curves.
This is shown in Figure 10-2 below.

69
Figure 10-2 Equidistance quantile-matching method for generating future DDF curves
under climate change.
10.5.1.2. Future DDF Development 176. The impacts of climate change on historical DDF and IDF are evaluated based on
climate model data. In order to reduce uncertainty of climate change simulated by GCMs, the
outputs of as many as possible of these GCMs should be used. According to the Fifth
Assessment Report of IPCC (AR5), there are 42 GCM models developed by various research
centres around the world. Currently, only 22 GCMs out of the 42 GCMs are validated
because: i) Not all the GCMs generate selected RCPs for future climate scenarios (i.e., 4.5
and 8.5); and ii) there are some technical issues related to downloading (such as connection
to remote servers or repositories) for some GCM models. Please see Table A1 Annex A for
model details for sub-daily precipitation analysis.
177. The basic procedure is to employ an equidistant quantile matching (EQM) method to
update the DDF and IDF curves under changing climate conditions.
Step 1: GCM 3 hourly output for each grid cell are analysed using extreme value analysis
(EVA) to calculate extreme rainfall amounts for current climate (called the baseline, 1986-
2005), and the future periods of interest.

70
Step 2: DDF and IDF change factors for the range of durations (3, 6, 12, 24, 48, and 72, 120,
144 and 168 hours) and return years (2, 3, 5, 10, 15, 25, 50, 100, 200 and 300 year) for each
GCM under RCP4.5 and RCP8.5 (or other RCPs) can be calculated by applying a pattern
scaling approach (Li and Ye, 2011).
Step 3: Interpolate the global DDF and IDF change patterns into the same spatial resolutions
(0.5o x 0.5o) to construct a global database. Furthermore, a super ensemble method can be
applied to derive ensemble statistics at different percentiles (e.g., 25th and 75th percentile of
the GCM ensemble), with both RCP4.5 and RCP8.5 change factors for all GCMs being
applied equally without any weighting.
Step 4: Project the historical estimated precipitation depth/intensity values of each duration
and return period using the global DDF and IDF change factors for the studied area for
selected future time periods (e.g. 2060 RCP8.5). The global DDF and IDF changes show
high variability around the world. There are also considerable differences among GCM
members. To further reduce the impact of natural variabilities, the change factors applied can
be averaged over the studied region. Note: A single grid cell GCM/RCM change factor could
cause serious bias to the final result. Hence the methodological need to take a more regional
approach.
178. This approach is to perturb the change in extreme event changes, which is crucial for
storm water management. Sørup et al. (2017) applied a similar IDF perturbation method,
which is a promising way of creating artificially perturbed precipitation time series, which can
represent a changed climate and be used as input in hydrologic and hydraulic models. The
methodology perturbs existing time series based on a semi-Markov system where
precipitation time series are split into events characterised as dry, extreme or non-extreme.
The wet events are divided into different states based on an Intensity-Duration-Frequency
relationship based on state selection criterion.
10.5.2. Short duration simple scaling methodology 179. This part is for the perturbation of short duration (<1.0 hour), which is very important
for storm water design. However either no GCM data are available or it is construed to be
less reliable. After the longer duration intensity and duration chart is formed, a log-log linear
relationship could be calculated for different return periods (see figure 10-3). The slope of the
linear equation could be applied for shorter durations to determine the intensity.
180. In this study log-log scaling factors were calculated from Multi-Source Weighted-
Ensemble Precipitation (MSWEP), 3 hourly, 0.25*0.25 latitude longitude degree spatial
resolution, 1979-2015 (http://www.gloh2o.org/). Then these factors were applied for sub-daily
duration precipitation estimation.

71
Figure 10-3 The log-log straight line relationship for Depth Duration Frequency (DDF)
181. The study of Agbazo et al. (2016) for rainfall intensities from ten rainfall stations showed
that rainfall displayed scale invariance properties from 5 min to 1440 min. For time scaling,
the statistical properties of rainfall followed the hypothesis of simple scaling. Therefore, a
simple scaling model is thought to be a viable approach to estimate IDF curves of hourly and
sub-hourly rainfall from rainfall projections. The obtained scaling exponents are less than 1
and range from 0.23 to 0.59.
182. The linearity of the moment from this study is also observed in others region of world.
For example, Ghanmi (2014) in Tunisia (Northern of Africa) found that data from (Tunis)
presented linearity, Ceresseti (2011) in France; Bara, et al. (2009) in Slovakia; Nhat (2006)
in Japan, Bougadis and Admowski (2006) in Canada have found linearity in similar studies.
10.5.3. Extreme temperature analysis 183. Similar to extreme precipitation approach, daily extreme maximum temperature
analysis applied generalized extreme values (GEV) analysis using L-moments method
(Hosking and Wallis, 2005).
184. Historical daily maximum temperature data for the study areas were extracted from the
Global Meteorological Forcing Dataset for land surface modelling, 0.25 by 0.25 degree, from
1961-2012. (For information access: http://hydrology.princeton.edu/data.php.)

72
10.6. Drought analysis
185. It is relevant to consider the Standard Precipitation Evapotranspiration Index (SPEI).
Based upon precipitation and potential evapotranspiration data, an SPEI approach has the
capacity to include the effects of temperature variability in drought risk assessments. SPEI is
based on a water balance; it can be compared to the self-calibrated Palmer Drought Severity
Index15 (PDSI) developed by Serrano, Begueria and Moreno (Vicente-Serrano et al.
2010).The SPEI uses the monthly (or weekly) difference between precipitation and PET
(Potential Evapotranspiration) which is a simple water balance methodology (based upon the
work of Thornthwaite, 1948) that is calculated at different time scales to obtain the SPEI. A
serially complete data set of both temperature and precipitation (daily, weekly or monthly) is
needed to calculate the SPEI. The results of an SPEI calculation are represented as positive
(wetter than normal) and negative (drier than normal) conditions. As drought is a key concern
of this analysis an example of the SPEI number (0 to -0.99) and their relationship with the
severity of drought being modelled and the return period likelihood per 100 years are provided
in Table 10-2.
186. Historical daily precipitation, maximum and minimum temperature, solar radiation data
for SPEI calculations for study areas were extracted from the Global Meteorological Forcing
Dataset for land surface modelling, 0.5 by 0.5 degree, from 1961-2012. For information
access: http://hydrology.princeton.edu/data.php.
Table 10-2 Dry Component of the SPEI and Sample Probability of Recurrence
SPEI Category # of times in 100 yrs. Severity of event
0 to -0.99 Mild dryness 33 1 in 3 yrs.
-1.00 to-1.49 Moderate dryness 10 1 in 10 yrs.
-1.5 to -1.99 Severe dryness 5 1 in 20 yrs.
< -2.0 Extreme dryness 2.5 1 in 50 yrs.
10.7. GCMs and pattern scaling approach for climate change scenarios
187. Pattern scaling techniques have been widely used to provide climate change
projections for time periods and emission scenarios that have not been simulated by GCMs.
The assumption underlying these methods is that the local response of a climate variable is
linearly related to the global mean temperature change, with the geographical pattern of
change independent of the forcing (Mitchellet al., 1999, and Mitchell, 2003).Thus the anomaly
in variable V, for a particular grid-box (i), month or season (j), year or period (y), and forcing
scenario (x) is given by:
15 An index of dryness using recent precipitation and temperature data

73
ΔVxijy = ΔTxy . V’ij
where ΔT is the global mean temperature anomaly and V’ is a fixed response pattern.
Climate change scenario data from the SimCLIM data package were used for this pattern
scaling application and were applied to monthly temperature and precipitation data.
(For details, please visit: http://documents.climsystems.com/news/6-11-2013/ SimCLIM_
2013_ AR5_data_manual.pdf)
188. The outputs of these 40 GCM models and 6 CORDEX RCM monthly ensemble median
temperature and precipitation monthly change factors were used to derive the global mean
temperature change figures given below.
Table 10-3 Global mean temperature changes applied in this study from a 40 GCM
global ensemble of CMIP516 data.
RCP and time slice Global mean
temperature change
(Celsius)
RCP8.5mid_2030, 0.94
RCP8.5mid_2050, 1.70
Under RCP 8.5 by 2030 global temperatures may have risen by 0.94oC and by 2050 by
1.70 oC.
These increments were used in for future drought analysis and long term rainfall analysis.
(See Annex A Table A2 and Table A3 for model details.)
10.8. Results of Climate Change Projections
10.9. 1. Results
1. The following parameters have been produced:
1) Historical sub-daily or daily extreme precipitation intensity for 10, 25, 50, 100 year
average return interval (ARI) and seasonal precipitation total
16 Coupled Model Intercomparison Project. An ocean-atmosphere modelling system of the Working Group on Coupled Modelling (WGCM), overseen by the Joint Scientific Committee for the World Climate Research Program using data from about 30 coupled GCMs. Successive phases of the project include more realistic scenarios of climate forcing for both historical, paleoclimate and future scenarios. The most recent is the fifth phase - CMIP5.

74
2) Future (2030, 2050, RCP8.5 scenario) daily extreme precipitation intensity for 10, 25,
50, 100 year average return interval (ARI)
3) Historical sub daily or daily maximum temperature for 10, 25, 50, 100 year average
return interval (ARI)
4) Future (2030, 2050, RCP8.5 scenario) sub daily or daily maximum temperature for
10, 25, 50, 100 year average return interval (ARI)
5) Historical severe and extreme drought frequency
6) Future (2030, 2050, RCP8.5 scenario) severe and extreme drought frequency
The results are given below.

75
10.9.1. Rainfall Table 10-4 Extreme Precipitation Depth Duration tables for Cambodia sites
Battambang
ARI
Duration (minutes)
30 60 180 360 720 1080 1440 2880 4320
Baseline
10
25
50
100
31.4 38.7 53.8 66.3 81.6 92.1 100.4 123.7 139.7
33.6 41.4 57.6 70.9 87.3 98.6 107.4 132.3 149.4
34.9 43.0 59.7 73.6 90.6 102.3 111.5 137.3 155.0
35.9 44.2 61.5 75.7 93.2 105.2 114.7 141.2 159.5
2030
10
25
50
100
32.9 40.5 56.3 69.1 85.0 96.0 104.3 128.0 144.4
35.5 43.7 60.7 74.5 91.6 103.5 112.5 137.9 155.7
37.1 45.6 63.4 77.8 95.7 108.1 117.5 144 162.6
38.4 47.2 65.7 80.6 99.1 111.9 121.7 149.1 168.4
2050
10
25
50
100
34.0 41.9 58.2 71.4 87.7 99.0 107.4 131.5 148.2
37.0 45.5 63.3 77.5 95.2 107.5 116.6 142.5 160.8
38.8 47.8 66.4 81.3 99.8 112.7 122.4 149.4 168.7
40.4 49.7 69.1 84.5 103.8 117.3 127.4 155.4 175.6
Kampong Cham
Duration (minutes)
ARI
10.0
25.0
50.0
100.0
30.0 60.0 180.0 360.0 720.0 1080.0 1440.0 2880.0 4320.0
Baseline
41.6 51.2 71.2 87.7 107.9 121.9 132.9 163.6 184.8
46.9 57.8 80.4 98.9 121.8 137.6 150.0 184.6 208.5
50.6 62.3 86.6 106.7 131.3 148.3 161.7 199.0 224.8
54.0 66.5 92.4 113.8 140.1 158.2 172.5 212.4 239.9
2030
10.0
25.0
50.0
100.0
43.4 53.4 74.2 91.2 112.1 126.6 137.6 169.0 190.8
49.4 60.8 84.5 103.7 127.5 144.0 156.6 192.1 216.9
53.6 66.0 91.7 112.5 138.3 156.2 169.9 208.3 235.3
57.6 70.9 98.6 120.8 148.5 167.7 182.4 223.6 252.8
2050
10.0
25.0
50.0
100.0
44.8 55.1 76.7 94.0 115.5 130.5 141.5 173.4 195.6
51.3 63.2 87.9 107.6 132.2 149.3 162.0 198.2 223.7
56.0 68.9 95.9 117.3 143.9 162.6 176.6 215.8 243.8
60.5 74.4 103.5 126.5 155.2 175.3 190.5 232.8 263.2

76
Siem Reap
Duration (minutes)
ARI 30.0 60.0 180.0 360.0 720.0 1080.0 1440.0 2880.0 4320.0
Baseline
10.0
25.0
50.0
100.0
49.5 60.9 84.7 104.3 128.4 145.0 158.1 194.6 219.8
61.1 75.2 104.6 128.8 158.6 179.1 195.2 240.4 271.4
70.6 86.9 120.9 148.8 183.2 206.9 225.6 277.7 313.6
80.8 99.5 138.4 170.3 209.7 236.8 258.2 317.9 359.0
2030
10.0
25.0
50.0
100.0
51.7 63.6 88.5 108.7 133.7 151.0 164.1 201.4 227.2
64.4 79.3 110.2 135.4 166.4 188.0 204.4 250.6 282.9
74.9 92.2 128.2 157.4 193.5 218.6 237.8 291.3 328.9
86.3 106.2 147.7 181.2 222.9 251.7 274.0 335.6 379.1
2050
10.0
25.0
50.0
100.0
53.4 65.8 91.5 112.2 137.9 155.8 169.0 206.9 233.2
67.1 82.6 114.8 140.7 172.8 195.2 211.9 259.0 292.2
78.4 96.5 134.2 164.3 201.9 228.0 247.6 302.4 341.3
90.7 111.7 155.3 190.0 233.6 263.8 286.8 350.0 395.3
Sihanouk ville
Duration
ARI 30.0 60.0 180.0 360.0 720.0 1080.0 1440.0 2880.0 4320.0
Baseline
10.0
25.0
50.0
100.0
56.3 69.3 96.3 118.6 146.0 164.8 179.7 221.2 249.9
63.1 77.7 108.1 133.1 163.8 185.0 201.7 248.3 280.4
67.7 83.3 115.8 142.6 175.5 198.3 216.1 266.1 300.5
71.7 88.3 122.8 151.1 186.1 210.1 229.1 282.0 318.5
2030
10.0
25.0
50.0
100.0
58.7 72.3 100.5 123.4 151.7 171.4 186.2 228.6 257.9
66.5 81.8 113.8 139.6 171.6 193.8 210.6 258.3 291.7
71.7 88.3 122.8 150.5 184.9 208.8 227.0 278.4 314.4
76.5 94.2 131.0 160.4 197.1 222.6 242.0 296.7 335.3
2050
10.0
25.0
50.0
100.0
60.7 74.7 103.9 127.3 156.4 176.6 191.5 234.5 264.4
69.2 85.2 118.4 144.8 177.8 200.9 217.8 266.4 300.8
75.0 92.3 128.4 156.9 192.5 217.4 235.7 288.3 325.6
80.4 99.0 137.7 168.0 206.0 232.6 252.4 308.6 348.9

77
Table 10-5 Monthly precipitation changes for 4 sites in Cambodia (% per degree global
warming)
Change percentages have not been scaled to table 10-3 changes in global mean temperature
for 2030 and 2050. Therefore for 2030 all results need to be multiplied by 0.94 and for 2050
multiply by 1.7.
Jan Feb Mar Apr May Jun Jul Aug Sep Oct Nov Dec Annual
Baseline (mm) 5.10 19.10 42.20 88.50 134.70 139.40 157.20 172.90 230.10 238.20 56.20 7.70 1292.30
Median (50%) 5.41 6.55 4.13 0.70 1.34 2.12 1.09 1.20 2.61 5.29 9.82 21.23 3.17
Low Percent (10%) -13.71 22.72 -11.60 -15.79 -10.51 -9.66 -5.78 -8.90 -2.69 4.49 9.15 -7.32 -7.63
High Percent (90%) 60.60 62.14 47.42 14.08 11.45 9.85 9.15 10.98 9.40 19.82 24.51 67.93 15.73
Jan Feb Mar Apr May Jun Jul Aug Sep Oct Nov Dec Annual
Baseline (mm) 12.40 18.90 57.40 105.50 173.10 185.30 193.40 188.90 281.60 201.30 60.80 17.30 1497.90
Median (50%) 3.19 0.25 2.37 4.97 0.50 2.55 2.89 1.47 1.96 3.84 4.81 12.63 1.79
Low Percent (10%) -12.41 18.75 -18.00 -18.57 -11.30 -9.77 -4.65 -7.65 -2.53 5.00 9.61 -7.04 -8.17
High Percent (90%) 34.14 55.22 39.31 17.22 15.25 8.71 10.64 12.00 9.95 15.49 18.03 50.46 14.56
Jan Feb Mar Apr May Jun Jul Aug Sep Oct Nov Dec Annual
Baseline (mm) 5.00 4.30 23.10 54.40 143.50 225.50 228.40 200.70 291.70 210.70 46.50 9.70 1446.50
Median (50%) 7.90 8.21 4.69 0.14 0.92 1.96 1.73 1.29 3.01 5.03 10.41 23.10 2.59
Low Percent (10%) -20.29 22.81 -12.23 -15.70 -14.62 -8.62 -5.73 -7.56 -1.27 5.05 9.46 -4.30 -7.20
High Percent (90%) 52.62 55.12 41.14 13.25 10.26 9.63 9.73 14.11 10.26 26.62 24.16 67.94 14.49
Jan Feb Mar Apr May Jun Jul Aug Sep Oct Nov Dec Annual
Baseline (mm) 26.00 24.00 75.00 133.40 266.40 413.50 522.10 516.10 485.90 273.90 110.60 35.20 2886.10
Median (50%) 9.32 3.78 0.32 2.10 0.79 0.85 2.02 2.28 0.81 2.00 1.90 11.73 1.25
Low Percent (10%) -14.33 15.46 -20.71 -14.60 -11.74 -8.74 -8.49 -7.38 -5.62 4.42 11.96 -9.45 -8.74
High Percent (90%) 40.71 40.80 51.26 27.87 15.83 11.60 8.37 12.75 7.42 11.19 18.29 43.20 13.64
Siem Reap monthly precipitation
Kampong Cham monthly precipitation
Battambang monthly precipitation
Sihanoukville monthly precipitation

78
10.9.2. Drought Index
Table 10-6 Relative drought change in Cambodia sites
10.9.1. Temperature Table 10-7 Daily extreme high temperature for Cambodia sites
Site Scenario Severe
Dry(%)
Extreme
Dry(%)
Battambang Baseline 3.47 1.26
Battambang 2030 5.93 2.16
Battambang 2050 7.51 3.83
Kampong
Cham Baseline 2.95 2.65
Kampong
Cham 2030 3.83 4.02
Kampong
Cham 2050 4.73 5.38
Siem Reap Baseline 3.80 2.24
Siem Reap 2030 4.54 2.92
Siem Reap 2050 5.06 3.44
Sihanoukville Baseline 3.12 2.57
Sihanoukville 2030 3.74 4.29
Sihanoukville 2050 4.73 5.41
Scenario ARI
Sites 10 25 50 100
Battambang Baseline 44.8 45.8 46.5 47.2
Battambang 2030 45.8 46.7 47.5 48.2
Battambang 2050 46.8 47.9 48.7 49.4
Kampong Cham
Baseline 43.7 44.5 45.0 45.4
Kampong Cham
2030 44.9 45.8 46.3 46.7
Kampong Cham
2050 46.0 46.8 47.2 47.6
Siem Reap Baseline 44.8 45.7 46.4 47.0
Siem Reap 2030 45.9 46.8 47.5 48.1
Siem Reap 2050 47.0 48.1 48.8 49.5
Sihanoukville Baseline 41.4 42.3 42.9 43.5

79
Sihanoukville 2030 42.3 43.2 43.8 44.3
Sihanoukville 2050 43.1 44.0 44.6 45.2

80
11. Climate Change Impacts
11.1. Rainfall 30 minutes to 3 days
2. Extreme rainfall has been calculated for time durations of 30 minutes up to 4,320 minutes
or 72 hours or 3 days. The frequency of occurrence of the rain fall is an important parameter
and precipitation for Annual Return Intervals (ARI) of 10, 25, 50 and 100 years is given.
3. The baseline, or current situation is given, then two projected scenarios. These are based
on RCP8.5 for the years 2030 and 2050. The results are shown below.
11.1.1. Battambang
Figure 11-1 Depth of Rainfall versus Duration Baseline Battambang
Figure 11-2 Depth of Rainfall versus Duration 2030 Battambang
0
20
40
60
80
100
120
140
160
180
30 60 180 360 720 1080 1440 2880 4320
De
pth
rai
n in
mm
Battambang Duration in minutes Baseline
ARI 10
ARI 25
ARI 50
ARI 100
0
20
40
60
80
100
120
140
160
180
30 60 180 360 720 1080 1440 2880 4320
De
pth
rai
n in
mm
Battambang Duration in minutes 2030
10
25
50
100

81
Figure 11-3 Depth of Rainfall versus Duration 2050 Battambang
11.1.2. Kampong Cham
Figure 11-4 Depth of Rainfall versus Duration Baseline Kg Cham
0
20
40
60
80
100
120
140
160
180
200
30 60 180 360 720 1080 1440 2880 4320
De
pth
rai
n in
mm
Battambang Duration in minutes 2050
10
25
50
100
0.0
50.0
100.0
150.0
200.0
250.0
300.0
De
pth
rai
n in
mm
Kampong Cham Duration in minutes Baseline
ARI 10
ARI 25
ARI 50
ARI 100

82
Figure 11-5 Depth of Rainfall versus Duration 2030 Kg Cham
Figure 11-6 Depth of Rainfall versus Duration 2050 Kg Cham
11.1.3. Sihanoukville
Figure 11-7 Depth of Rainfall versus Duration Baseline Sihanoukville
0.0
50.0
100.0
150.0
200.0
250.0
300.0D
ep
th r
ain
in m
m
Kampong Cham Duration in minutes 2030
10.0
25.0
50.0
100.0
0.0
50.0
100.0
150.0
200.0
250.0
300.0
De
pth
rai
n in
mm
Kampong Cham Duration in minutes 2050
10.0
25.0
50.0
100.0
0.0
50.0
100.0
150.0
200.0
250.0
300.0
350.0
De
pth
rai
n in
mm
S ihanoukville Duration in minutes Baseline
ARI 10
ARI 25
ARI 50
ARI 100

83
Figure 11-8 Depth of Rainfall versus Duration 2030 Sihanoukville
Figure 11-9 Depth of Rainfall versus Duration 2050 Sihanoukville
0.0
50.0
100.0
150.0
200.0
250.0
300.0
350.0
400.0D
ep
th r
ain
in m
m
S ihanoukville Duration in minutes 2030
10.0
25.0
50.0
100.0
0.0
50.0
100.0
150.0
200.0
250.0
300.0
350.0
400.0
De
pth
rai
n in
mm
S ihanoukville Duration in minutes 2050
10.0
25.0
50.0
100.0

84
11.1.1. Siem Reap
Figure 11-10 Depth of Rainfall versus Duration Baseline Siem Reap
Figure 11-11 Depth of Rainfall versus Duration 2030 Siem Reap
0.0
50.0
100.0
150.0
200.0
250.0
300.0
350.0
400.0
De
pth
rai
n in
mm
S iem Reap Duration in minutes Baseline
ARI 10
ARI 10
ARI 25
ARI 100
0.0
50.0
100.0
150.0
200.0
250.0
300.0
350.0
400.0
De
pth
rai
n in
mm
S iem Reap Duration in minutes 2030
ARI 10
ARI 25
ARI 50
ARI 100

85
Figure 11-12 Depth of Rainfall versus Duration 2050 Siem Reap
4. As can be seen in all graphs the major divergence occurs at the higher ARI numbers in
2050.
11.2. Rainfall Duration 60 minutes
5. The above graphs show rainfall over a large duration from half an hour to 72 hours. For
engineering design purposes the most common parameter is the 1 hour rainfall figure.
Sometimes a 30 minutes or even 15 minutes figure is used if the historical rain fall data
includes such short time periods. This is uncommon and in fact the most usual rainfall records
are 24 hourly, as in this case.
6. Empirical evidence suggests that in extreme weather events the 1 hour rainfall figure
represents 20% - 40% of the daily rainfall. Therefore the 1 hour figure, and any changes in it
due to climate change, is a useful indicator. The following graphs are based on the extracted
60 minutes figures.
0.0
50.0
100.0
150.0
200.0
250.0
300.0
350.0
400.0
450.0D
ep
th r
ain
in m
m
S iem Reap Duration in minutes 2050
ARI 10
ARI 25
ARI 50
ARI 100

86
Figure 11-13 Depth of Rainfall in 1 hour Battambang
Figure 11-14 Change in Depth of Rainfall in 1 hour Battambang
7. The 1 in 10 year event is the most commonly used descriptor for urban drainage design.
In Battambang by 2030 under RCP 8.5 there will be a 4 % increase in 1 hour rainfall intensity
and by 2050 under RCP 8.5 there will be a 8% increase in 1 hour rainfall intensity.
8. If one takes the 1 in 100 year event as the extreme value figure then in Battambang by
2030 under RCP 8.5 there will be a 6 % increase in 1 hour rainfall intensity and by 2050
under RCP 8.5 there will be a 12% increase in 1 hour rainfall intensity.
9. A 12% increase in rainfall intensity is considered significant.
0
10
20
30
40
50
60
Baseline 2030 2050
Rai
nfa
ll in
mm
in 6
0 m
ins
Battambang
ARI 10
ARI 25
ARI 50
ARI 100
0.92
0.94
0.96
0.98
1
1.02
1.04
1.06
1.08
1.1
1.12
1.14
Baseline 2030 2050
% C
han
ge in
Rai
nfa
ll
Battamabang
ARI 10
ARI 25
ARI 50
ARI 100

87
Figure 11-15 Depth of Rainfall in 1 hour Kampong Cham
Figure 11-16 Change in Depth of Rainfall in 1 hour Kampong Cham
10. The 1 in 10 year event for Kampong Cham shows that by 2030 under RCP 8.5 there will
be a 4 % increase in 1 hour rainfall intensity and by 2050 under RCP 8.5 there will be a 7%
increase in 1 hour rainfall intensity.
11. The 1 in 100 year event for Kampong Cham shows that by 2030 under RCP 8.5 there
will be a 7 % increase in 1 hour rainfall intensity and by 2050 under RCP 8.5 there will be a
11% increase in 1 hour rainfall intensity.
0
10
20
30
40
50
60
70
80
Baseline 2030 2050
Rai
nfa
ll in
mm
in 6
0 m
ins
Kampong Cham
ARI 10
ARI 25
ARI 50
ARI 100
0.94
0.96
0.98
1
1.02
1.04
1.06
1.08
1.1
1.12
1.14
Baseline 2030 2050
% C
han
ge in
Rai
nfa
ll
Kampong Cham
ARI 10
ARI 25
ARI 50
ARI 100

88
Figure 11-17 Depth of Rainfall in 1 hour Siem Reap
Figure 11-18 Change in Depth of Rainfall in 1 hour Siem Reap
12. Taking the 1 in 10 year event in Siem Reap by 2030 under RCP 8.5 there will be a 4 %
increase in 1 hour rainfall intensity and by 2050 under RCP 8.5 there will be a 8% increase in
1 hour rainfall intensity.
13. Taking the 1 in 100 year event as the extreme value figure then in Siem Reap by 2030
under RCP 8.5 there will be a 7 % increase in 1 hour rainfall intensity and by 2050 under
RCP 8.5 there will be a 12% increase in 1 hour rainfall intensity.
14. A 12% increase in rainfall intensity is considered significant.
0
20
40
60
80
100
120
Baseline 2030 2050
Rai
nfa
ll in
mm
in 6
0 m
ins
Siem Reap
ARI 10
ARI 25
ARI 50
ARI 100
0.92
0.94
0.96
0.98
1
1.02
1.04
1.06
1.08
1.1
1.12
1.14
Baseline 2030 2050
% C
han
ge in
Rai
nfa
ll
Siem Reap
ARI 10
ARI 25
ARI 50
ARI 100

89
Figure 11-19 Depth of Rainfall in 1 hour Sihanoukville
Figure 11-20 Change in Depth of Rainfall in 1 hour Sihanoukville
15. Taking the 1 in 10 year event in Sihanoukville by 2030 under RCP 8.5 there will be a 4
% increase in 1 hour rainfall intensity and by 2050 under RCP 8.5 there will be a 7% increase
in 1 hour rainfall intensity.
16. Taking the 1 in 100 year event as the extreme value figure then in Sihanoukville by 2030
under RCP 8.5 there will be a 7 % increase in 1 hour rainfall intensity and by 2050 under RCP
8.5 there will be a 12% increase in 1 hour rainfall intensity.
17. A 12% increase in rainfall intensity is considered significant.
0
20
40
60
80
100
120
Baseline 2030 2050
Rai
nfa
ll in
mm
in 6
0 m
ins
Sihanoukville
ARI 10
ARI 25
ARI 50
ARI 100
0.92
0.94
0.96
0.98
1
1.02
1.04
1.06
1.08
1.1
1.12
1.14
Baseline 2030 2050
% C
han
ge in
Rai
nfa
ll
Sihanoukville
ARI 10
ARI 25
ARI 50
ARI 100
90
18. There is no geographical variation in likely increases in short term rainfall intensity across
Cambodia. This does not mean that the rainfall is the same everywhere but that the increase
for 1 in 10 year events and 1 in 100 year events under RCP 8.5 in 2030 and 2050 are around
4% and 12% in all four sites.
11.3. Drought
19. Drought is a complex natural phenomenon without a general and commonly accepted
definition. In contrast to other extreme events such as floods, which are typically restricted to
small regions and well-defined temporal intervals, droughts are difficult to pinpoint in time and
space, affecting wide areas over long periods of time. It is very difficult to isolate the beginning
of a drought, as drought development is slow and very often the drought is not recognized
until human activities, or the environment, are affected. Moreover, the effects of a drought can
persist over many years after it has ended.
20. Drought is an important parameter in Cambodia, particularly for farmers, as extended
periods of drought can only be mitigated by additional irrigation.
21. It is very difficult to objectively quantify their characteristics in terms of intensity,
magnitude, duration and spatial extent. We identify a drought by its effects at different levels,
but there is not a physical variable we can measure to quantify droughts. Given the large
difficulties to objectively quantify their characteristics (duration, intensity, magnitude, spatial
extent, onset, etc.) several drought indices have been developed in the last decades (Heim,
2002: Bulletin of the American Meteorological Society, 83: 1149-1165) At present the two most
widely used drought indices are:
Palmer Drought Severity Index (PDSI Palmer 1965) - Based on a simplified water balance
equation. Incorporates prior precipitation, moisture supply, runoff and evaporation demand
at the surface level
Standardised Precipitation Index (SPI McKee et al. 1993) - Based on precipitation
anomalies
22. A critical issue in the study of the drought impacts is the multi-scalar nature of drought,
since the response of the hydrological (soil moisture, groundwater, river discharge, reservoir
storage, etc) and biological (crops, natural vegetation, etc) systems to water shortage varies
markedly and have different response times. This explains why severe drought conditions can
be recorded in one system (e.g., low river flows) whereas other systems in the same region
(e.g., crops) have normal or even humid conditions.
23. The SPI calculation is based on two assumptions:
the variability of precipitation is much higher than that of other variables, such as
temperature and potential evapotranspiration (PET)
the other variables (PET) are stationary i.e. they have no temporal trend.
24. This assumes droughts are controlled by the time wise changes in precipitation. However,
temperature can have a marked effect on drought conditions. The general temperature
increase (0.5-2°C) during the last past 150 years and the increase predicted by climate change
models during the 21st century (IPCC, 2007) are expected to have dramatic consequences
on drought conditions, with an increase in water demand due to evapotranspiration (Sheffield
and Wood, 2008; Dubrovsky et al., 2008). The use of drought indices which include
temperature data in their formulation (such as the PDSI) is preferable, especially for
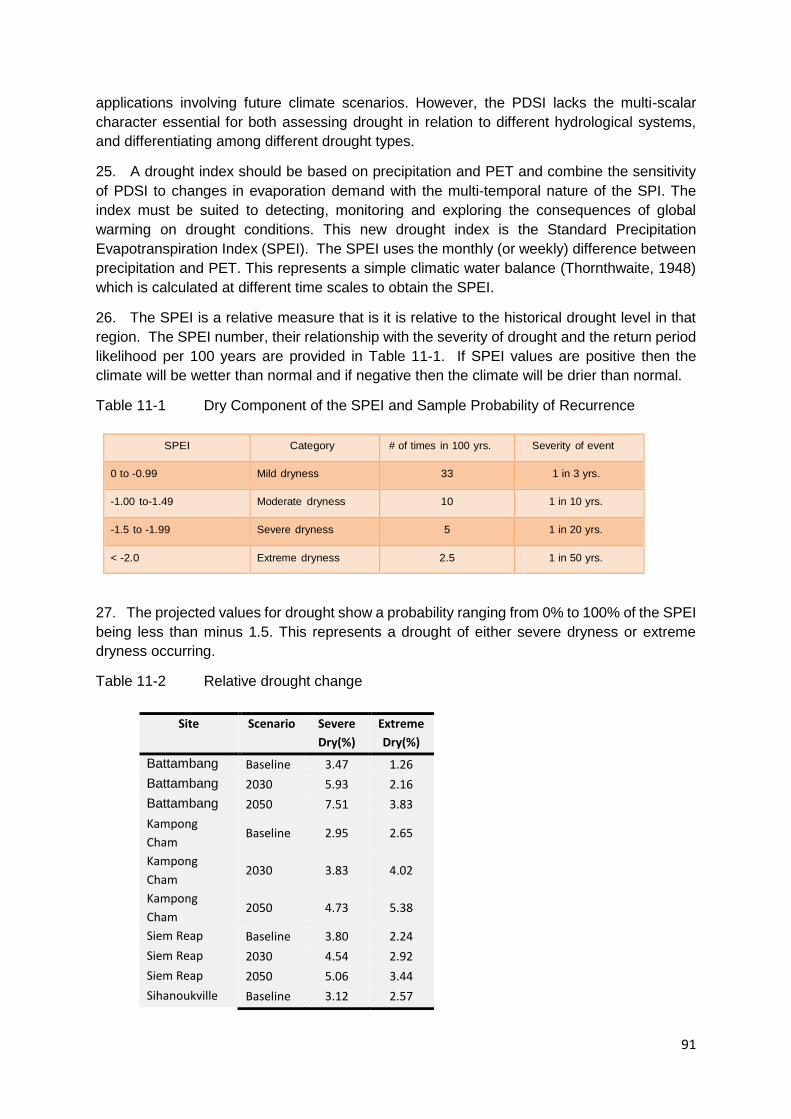
91
applications involving future climate scenarios. However, the PDSI lacks the multi-scalar
character essential for both assessing drought in relation to different hydrological systems,
and differentiating among different drought types.
25. A drought index should be based on precipitation and PET and combine the sensitivity
of PDSI to changes in evaporation demand with the multi-temporal nature of the SPI. The
index must be suited to detecting, monitoring and exploring the consequences of global
warming on drought conditions. This new drought index is the Standard Precipitation
Evapotranspiration Index (SPEI). The SPEI uses the monthly (or weekly) difference between
precipitation and PET. This represents a simple climatic water balance (Thornthwaite, 1948)
which is calculated at different time scales to obtain the SPEI.
26. The SPEI is a relative measure that is it is relative to the historical drought level in that
region. The SPEI number, their relationship with the severity of drought and the return period
likelihood per 100 years are provided in Table 11-1. If SPEI values are positive then the
climate will be wetter than normal and if negative then the climate will be drier than normal.
Table 11-1 Dry Component of the SPEI and Sample Probability of Recurrence
SPEI Category # of times in 100 yrs. Severity of event
0 to -0.99 Mild dryness 33 1 in 3 yrs.
-1.00 to-1.49 Moderate dryness 10 1 in 10 yrs.
-1.5 to -1.99 Severe dryness 5 1 in 20 yrs.
< -2.0 Extreme dryness 2.5 1 in 50 yrs.
27. The projected values for drought show a probability ranging from 0% to 100% of the SPEI
being less than minus 1.5. This represents a drought of either severe dryness or extreme
dryness occurring.
Table 11-2 Relative drought change
Site Scenario Severe
Dry(%)
Extreme
Dry(%)
Battambang Baseline 3.47 1.26
Battambang 2030 5.93 2.16
Battambang 2050 7.51 3.83
Kampong
Cham Baseline 2.95 2.65
Kampong
Cham 2030 3.83 4.02
Kampong
Cham 2050 4.73 5.38
Siem Reap Baseline 3.80 2.24
Siem Reap 2030 4.54 2.92
Siem Reap 2050 5.06 3.44
Sihanoukville Baseline 3.12 2.57

92
28. The values in the drought dataset represent probabilities (i.e. 0-100%). For example, a
probability of 20 percent means that there is a 1 in 5 chance of an SPEI rating of<-1.5 which
represents a drought of either severe dryness or extreme dryness occurring in the year of
analysis e.g. 2050. The SPEI is a relative measure that represents the potential relationship
of the risk of future drought to the historical drought level for that region.
29. The results already given, and for convenience repeated above in Table 11-2, show that
the highest probability of a severe drought occurring is 7.5% by the year 2050 in Battambang.
This equates to a 1 in 13 year event. The highest probability of an extreme drought occurring
is 4.29% by the year 2030 in Siem Reap. This equates to a 1 in 23 year event.
11.4. Temperature
30. Under global warming temperature will play a more important role than precipitation in
explaining drought conditions.
31. The projected results show that by the year 2050 daily peak temperatures could reach
49.5oC. This would be a 1 in 100 year event. A more common scenario would be daily peak
temperatures reaching 47oC which would be a 1 in 10 year event.
32. There is no significant difference between inland and coastal extreme temperatures. Siem
Reap shows projected temperatures about 2oC lower than the other sites.
12. Impacts and Adaptation Measures for Each Subproject
12.1. Battambang Water Supply
12.1.1. Overview 33. The Battambang water supply requires a guaranteed raw water supply of at least
50,000m3/day. A request has been made from MIH to MOWRAM to give a formal commitment
to provide this amount but to date no such confirmation has been issued.
34. The intended off-take point is downstream of the Kanghot irrigation scheme which
provides local rice farmers with irrigation water. No information was obtainable on the volumes
of water supplied.
35. There is no clear agreement between national and level administration on which takes
priority, water for agricultural irrigation or potable water supply for human consumption.
36. Further upstream of Kangkot Irrigation dam at a distance of 35kms is the Sek Sak
Reservoir. This has a newly constructed 60 metre high rockfill dam and has a capacity of 280
million cubic metres. It contains a 13MW hydroelectric scheme.
37. At this moment it is still undergoing commissioning trials which may take 2 years to
complete. MOWRAM are reluctant to give guaranteed discharge figures until the integrity of
the dam and its backfilled reservoir are firmly established. Their position is that water will be
Sihanoukville 2030 3.74 4.29
Sihanoukville 2050 4.73 5.41

93
supplied if available if the needs of the hydroelectric station and the minimum ecological flow
have been satisfied.
38. Downstream of the intended off-take point is the location of another water supply scheme
to be funded under Korean financing. This is the Sala Ta On spillway which is 7kms
downstream of Battambang. No details have yet been obtained of their off-take requirements.
Figure 12-1 Kanghot Irrigation Dam upstream of Off-take Point
39. The feasibility studies for these three schemes Kanghot, Sek Sork and Sala Ta have
been requested but not yet sighted.
40. The climate change projections show that there is a 7.5% probability of a severe drought
occurring by the year 2050 in Battambang. This is the highest of the four sites examined. This
could be a 1 in 13 year event. This will doubtless put more strain on the agricultural activities
in the area.
41. The short term rainfall increase in this location will be 12% but this is only short term
intensity. The long term average rainfall may not change. There may be an increased demand
for water but no concomitant increase in precipitation.
42. Until the raw water source can be guaranteed with a high degree of certainty this scheme
is considered to be High Risk.
43. The climate change risk is classed as High Risk.
12.1.2. Adaptation Measures 44. Error! Reference source not found. below summaries the predicated impacts and
adaptation measures that have been taken account of in preliminary design and project
design. Of these, the development of a Water Safety Plan, ot guide management responses
to potential periods of water shortages, will cost an estimated US$ 10,000 while annual costs
of updating are estimated at $3,000 approximately.

94
Table 12-1 Summary of Impacts and Adaptation Measures for Battambang Water Supply
Subproject
Climate Change effect
Potential impacts
Responses in project design and preliminary engineering design
Cost implication Recommendations for detailed design
Rainfall intensity effects.
Localised short-term flooding over pipelines.
System to be designed as fully pressurised with no potential for siphoning and back feeding into pipelines. Above ground pipelines, if any, to be adequately supported by well engineered support piles and foundations to prevent the undermining of the pipelines.
None – as normal designs will provide for a fully pressurised system with pipes and fittings of required specifications. Above ground supported pipelines will be designed and constructed with structurally adequate and well founded piles and foundation pads
Good design with pipes selected with adequate strength and safety factor for expected supply pressures. Structurally sound design for piles and foundation pads supporting any above ground sections of pipeline.
Maximum temperature effects
Increased per capita day consumption as a result of the higher ambient temperatures
Two percent for each oC increase for an urban society in a developed county17 and two liters/day18 for a developing country (i.e. Cambodia)
None as the additional consumption is accommodated within the average per capita day consumption adopted for detailed design
Average consumption adopted for design will allow for increased average per capita day demand resulting from the higher ambient temperature within the design life of the system
Drought effects
Periods of insufficient water supply
Development of Battambang provincial waterworks Water Safety Plan (WSP) with provision for a drought response planning, awareness raising, early warning and appropriate management measures for the control of wastage and the marshalling and, if required, rationing of available supplies.
Approx $10,000 for assistance with WSP development Annual expenses of $3,000 approx for expenses relating to WSP monitoring and updating
Development, adoption and refinement of WSP during detailed design and subproject implementation phases
17 A statistical analysis of water use in New York City showed that daily per capita water use increases by 11
litres/1°C increase in temperature (roughly 2% of current daily per capita use) (Protopapas et al., 2000)
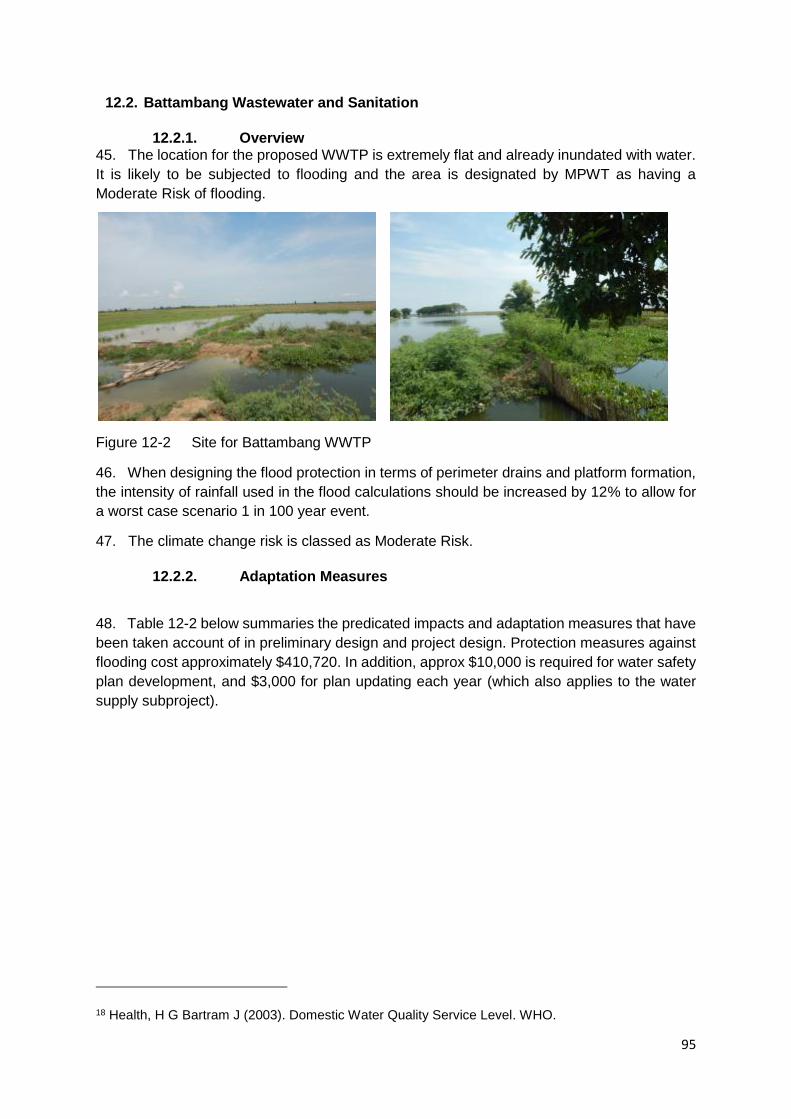
95
12.2. Battambang Wastewater and Sanitation
12.2.1. Overview 45. The location for the proposed WWTP is extremely flat and already inundated with water.
It is likely to be subjected to flooding and the area is designated by MPWT as having a
Moderate Risk of flooding.
Figure 12-2 Site for Battambang WWTP
46. When designing the flood protection in terms of perimeter drains and platform formation,
the intensity of rainfall used in the flood calculations should be increased by 12% to allow for
a worst case scenario 1 in 100 year event.
47. The climate change risk is classed as Moderate Risk.
12.2.2. Adaptation Measures
48. Table 12-2 below summaries the predicated impacts and adaptation measures that have
been taken account of in preliminary design and project design. Protection measures against
flooding cost approximately $410,720. In addition, approx $10,000 is required for water safety
plan development, and $3,000 for plan updating each year (which also applies to the water
supply subproject).
18 Health, H G Bartram J (2003). Domestic Water Quality Service Level. WHO.

96
Table 12-2: Summary of Impacts and Adaptation Measures for Battambang Wastewater
Subproject
Climate Change effect
Potential impacts
Responses in project design and preliminary engineering design
Cost implication Recommendations for detailed design
Rainfall intensity effects
Risk of heightened flood causing overflowing of WWTP ponds, surcharge of network and release of raw sewage
Appropriate allowance made for increased height of bund around anaerobic ponds ($18,720), around the WWTP site $192,000) and construction of bunded sludge drying beds ($100,000). Design levels adopted to raise treatment plant and trickle filters above likely flood levels. Design of manholes and household connections to raise fittings above potential flood levels in low lying areas.
$310,720 has been allowed for bunding and site protection in the estimates of costs established by the preliminary engineering design for the WWTP site. An additional $100,000 has been allowed for site excavation and formation.
Design calculations to allow for an increase of 12% short duration rainfall intensity in overland flow paths around the WWTP without over topping of the earthen bunds around the anaerobic ponds and/or risk to the trickling filters
Maximum temperature effects
Impact on performance of the anaerobic ponds and the likelihood of algae blooms due to higher ambient water temperatures preventing water from mixing allowing algae to grow thicker and faster. Also algae blooms absorbing sunlight making water even warmer and promoting more blooms.
To consider in the detailed design process and allow provision for fitting of temporary mechanical (solar) mixers if required in the future.
None immediately
Allow for temperatures of >40oC in design

97
Climate Change effect
Potential impacts
Responses in project design and preliminary engineering design
Cost implication Recommendations for detailed design
Drought effects
Reduced water used for the flushing of sewerage as a result of water restrictions or limitations could result in higher nutrient loadings of sewage feeding algal blooms and reducing plant capacity.
To consider in the detailed design process in regard to the management of the WWTP in such circumstances. Again this may require provision for fitting temporary mechanical (solar) mixers if required in the future.
None immediately but may have short-term operational implications when these circumstances arise
To be considered in the detailed design process.
12.3. Kampong Cham Water Supply
12.3.1. Overview 49. The Kampong Water supply occupies a site adjacent to the existing Water Treatment
Plant. This is in an area classed as being exposed to Moderate Risk of flooding. Designs for
flood protection should allow an increase of 12% on short duration rainfall intensity.
50. The climate change risk is classed as Moderate Risk.

98
12.3.2. Adaptation Measures 51. Table 12-3 below presents the summary of impacts and adaptation measures. Adaptation
costs are $262,000 approximately.
Table 12-3: Summary of Impacts and Adaptation Measures for the Kampong Cham Water
Supply Subproject

99
Climate Change effect
Potential impacts
Responses in project design and preliminary engineering design
Cost implication
Recommendations for detailed design
Damage to raw water intake if Mekong River level rises and inundates the raw water intake and pumps
The intake structure and pumps are to be constructed on the edge of the river corridor above historic and anticipated flood levels
Preliminary engineering design has fully estimated the costs of the intake structure and equipment. No additional costs are anticipated, but the detailed design must reassess risk and determine the placement and level of the intake structure.
To be considered in the detailed design process.
To be considered in the detailed design process.
Damage to WTP if the area becomes inundated during flooding
The site is on formed land above likely flood plains. Notwithstanding the detailed design must assess the construction levels, and the formation of storm water overland flow paths around the WTP site to alleviate any potential risk of flooding.
Site formation and preparation assessed at $262,000, representing 5% of the cost of the WTP.
Designs for flood protection or site flooding to be based on an increase of 12% on short duration rainfall intensity
Designs for flood protection or site flooding to be based on an increase of 12% on short duration rainfall intensity
Increased per capita day consumption as a result of the higher ambient temperatures
Two percent for each oC increase for an urban society in a developed county19 and two liters/day20 for developing country
None as the additional consumption is accommodated within the average per capita day consumption adopted for detailed design
Average consumption adopted for design will allow for increased average per capita day demand resulting from the higher ambient temperature within the design life of the system
Average consumption adopted for design will allow for increased average per capita day demand resulting from the higher ambient temperature within the design life of the system
19 A statistical analysis of water use in New York City showed that above 25°C, daily per capita water use increases
by 11 litres/1°C (roughly 2% of current daily per capita use) (Protopapas et al., 2000) 20 Republic of Kiribati Water supply and Sanitation Roadmap 2011 – 2030 and Kiribati Adaptation Programme.

100
Climate Change effect
Potential impacts
Responses in project design and preliminary engineering design
Cost implication
Recommendations for detailed design
The Kampong Cham water supply system will be fed from the Mekong River which has a large catchment and is also fed by the Himalaya melts and has been assessed in an earlier JICA study21 as maintaining high flows even during predicted drought conditions.
Development of Kampong Cham provincial waterworks Water Safety Plan (WSP) with provision for a any required drought response planning, awareness raising, early warning and appropriate management measures for the control of wastage.
Approx $10,000 for assistance with WSP development Annual expenses of $3,000 approx for expenses relating to WSP monitoring and updating
Development, adoption and refinement of WSP during detailed design and subproject implementation phases
Development, adoption and refinement of WSP during detailed design and subproject implementation phases
12.4. Kampong Cham Septage Treatment
12.4.1. Overview 52. The septage treatment site is elevated and unlikely to flood. Sludge drying beds are open
to the weather and may be inundated with intense rainfall. Light weight free standing roofs
over the sludge beds should be considered.
53. The climate change risk is classed as Low Risk.
12.4.2. Adaptation 54. Table 12-4 presents the summarised impacts and adaptaiton measures. The estimated
costs of climate change adaptation measures is $88,400.
21 Preparatory Survey on the Project on Additional New Water Treatment Plants for Kampong Cham and Battambang Waterworks in the Kingdom of Cambodia, March 2013, JICA
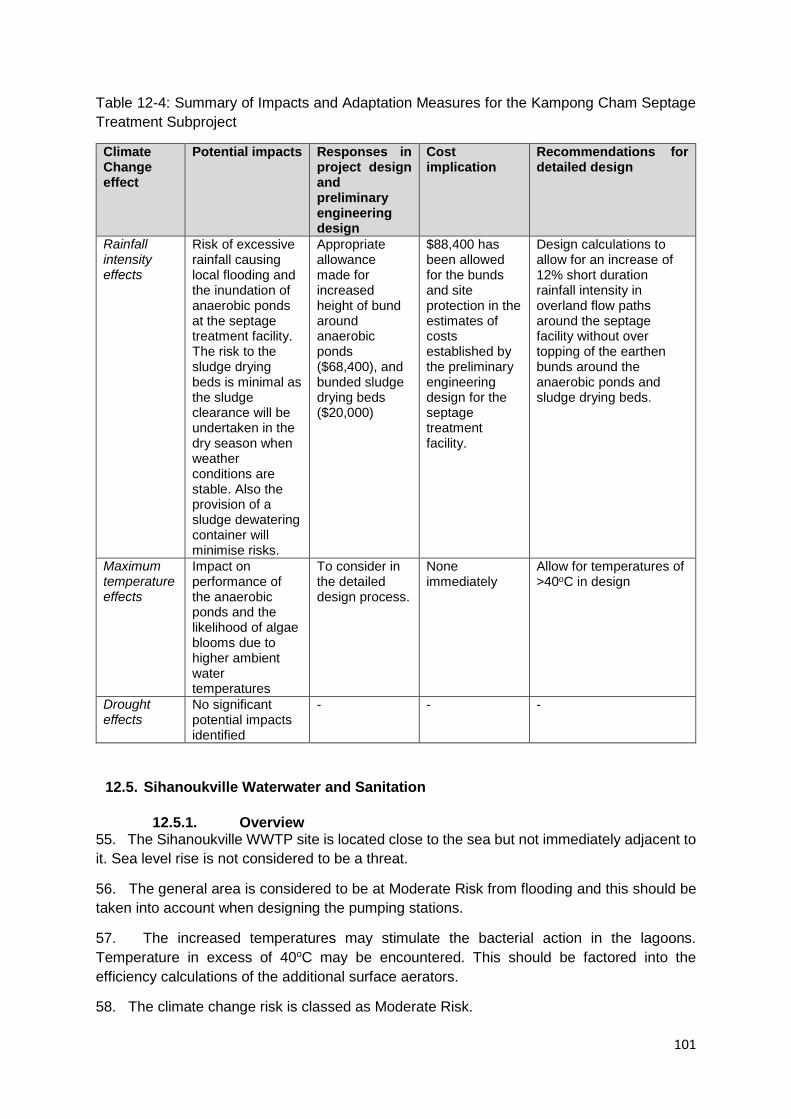
101
Table 12-4: Summary of Impacts and Adaptation Measures for the Kampong Cham Septage
Treatment Subproject
Climate Change effect
Potential impacts Responses in project design and preliminary engineering design
Cost implication
Recommendations for detailed design
Rainfall intensity effects
Risk of excessive rainfall causing local flooding and the inundation of anaerobic ponds at the septage treatment facility. The risk to the sludge drying beds is minimal as the sludge clearance will be undertaken in the dry season when weather conditions are stable. Also the provision of a sludge dewatering container will minimise risks.
Appropriate allowance made for increased height of bund around anaerobic ponds ($68,400), and bunded sludge drying beds ($20,000)
$88,400 has been allowed for the bunds and site protection in the estimates of costs established by the preliminary engineering design for the septage treatment facility.
Design calculations to allow for an increase of 12% short duration rainfall intensity in overland flow paths around the septage facility without over topping of the earthen bunds around the anaerobic ponds and sludge drying beds.
Maximum temperature effects
Impact on performance of the anaerobic ponds and the likelihood of algae blooms due to higher ambient water temperatures
To consider in the detailed design process.
None immediately
Allow for temperatures of >40oC in design
Drought effects
No significant potential impacts identified
- - -
12.5. Sihanoukville Waterwater and Sanitation
12.5.1. Overview 55. The Sihanoukville WWTP site is located close to the sea but not immediately adjacent to
it. Sea level rise is not considered to be a threat.
56. The general area is considered to be at Moderate Risk from flooding and this should be
taken into account when designing the pumping stations.
57. The increased temperatures may stimulate the bacterial action in the lagoons.
Temperature in excess of 40oC may be encountered. This should be factored into the
efficiency calculations of the additional surface aerators.
58. The climate change risk is classed as Moderate Risk.

102
12.5.2. Adaptation
59. Table 12-5 below shows the impacts and adaptation measures identified for the
subproject. Adaptation costs total an estimated $900,000 to cover supply and installation of
solar powered aerators aerators to increase plant capacity and reduce reliance on mains
electrical power supply.
Table 12-5: Summary of Impacts and Adaptation Measures for the Sihanoukville Wastewater
Subproject
Climate Change effect
Potential impacts Responses in project design and preliminary engineering design
Cost implication Recommendations for detailed design
Rainfall intensity effects
Risk of heightened flood causing overflowing of existing WWTP ponds, surcharge of pump stations and network, and release of raw sewage
Existing WWTP Lagoons are presently bunded to a level above the surrounding ground levels and to provide protection from flows in the adjacent Occheuteal Stream. However there will be the need to assess peak discharge flows in the stream and the secondary overland flow paths as part of the detailed design. The design of manholes and household connections will assess the need manholes and fittings to be raised above potential flood levels in low lying areas. A similar requirement will apply to the location of the five pump stations in the main reticulation network.
The need for any adjustment to existing bunds or secondary overland flow paths will only be know when the detailed design is carried out. Other costs associated with the design and construction of manholes and fittings, and the pump stations are already a contingent part of the costs for these items established by the pre engineering feasibility study designs
Design calculations to allow for an increase of 12% short duration rainfall intensity in overland flow paths around the WWTP without over topping of the earthen bunds around the anaerobic ponds and/or risk to the trickling filters

103
Climate Change effect
Potential impacts Responses in project design and preliminary engineering design
Cost implication Recommendations for detailed design
Maximum temperature effects
Impact on performance of the anaerobic ponds and the likelihood of algae blooms due to higher ambient water temperatures preventing water from mixing allowing algae to grow thicker and faster. Also algae blooms absorbing sunlight making water even warmer and promoting more blooms.
The existing WWTP will be upgraded with the installation of 12 solar powered mixers/aerators to increase the capacity of the plant up to 250% to meet 2040 demands for the proposed new service areas.
The mixers/aerators with hoses, freight and installation have an estimated cost of $900,000
Allow for temperatures of >40oC in design
Drought effects
Reduced water used for the flushing of sewerage as a result of water restrictions or limitations could result in higher nutrient loadings of sewage feeding algal blooms and reducing plant capacity.
To consider in the detailed design process in regard to the management of the WWTP in such circumstances. The proposed mixers/ aerators will assist mixing and treatment and will alleviate the risk.
Costs already provided for in the estimates established by the preliminary engineering design.
To be considered in the detailed design process.

104
Climate Change effect
Potential impacts Responses in project design and preliminary engineering design
Cost implication Recommendations for detailed design
Land stability
ADB’s “AWRENESS” filtering suggested the risk of landslides in the Sihanoukville coastal zone. Notwithstanding the geomorphology of the costal fringe of the town area would suggest that land slippage is highly unlikely.
The Sihanoukville peninsula forms an extension of the foothills of the Cardamom Mountains, which extend along the whole of the shore of the Gulf of Thailand. Landforms are gently to steeply incised. The predominant rock type is sandstone, identified22 as the Upper Indosinian formation, of the upper Cretaceous period. This formation consists of a thick (of the order of 1000 metres) sequence of sandstone, shales, clay, marl and conglomerates.
None None
22 Workman, David R., Geology of Laos, Cambodia, South Vietnam and the eastern part of Thailand

105
Climate Change effect
Potential impacts Responses in project design and preliminary engineering design
Cost implication Recommendations for detailed design
Sea level rise and storm surge
Potential sea level rise and overtopping from storm surges.
The Sihanoukville WWTP site while located close to the sea it is not immediately adjacent to it. Sea level rise is not considered to be a threat. The general area is considered to be at Moderate Risk from flooding and this should be taken into account when designing the pumping stations. The coastal areas are protected by outlying islands close to the shore and the area is not subjected to long term prevailing on shore winds. Storm surge has not been an issue, and is not expected to be an issue.
Pump stations in the lower part of the catchments closer to the shore are to be located well above potential sea level rise, and at a height and distance beyond likely storm surges
To be considered in the detailed design process.
12.6. Siem Reap Interceptor Sewer Replacement
12.6.1. Overview 60. The replacement mains sewer is proposed to be 1000 mm diameter and this is the
generally accepted minimum to ensure effective maintenance. The area is classed as having
a Moderate Risk of flooding and this may impact on the construction program. Other than that
no major climate change impacts are envisioned.
The climate change risk is classed as Low Risk.
12.6.2. Adaptation 61. Table 12-6 identifies the climate change impacts and design responses. The principal
measures are primarily part of good engineering practice and the proposed adaptation is
mainly requirement of high standards of construction practices, and are not incremental
adaptation costs as such.

106
Table 12-6: Summary of Impacts and Adaptation Measures for the Siem Reap Sewer
Replacement Subproject
Climate
Change
effect
Potential
impacts
Responses in project
design and
preliminary
engineering design
Cost
implication
Recommendations
for detailed design
Rainfall intensity effects
Risk associated with construction only, likelihood of occurrence of 1 in 10 year event during construction period negligible
Provision to be made in construction specification for the temporary pumping and diversion of storm water flows around construction works to approved drainage channels and without risk to adjacent properties. Also provision of temporary silt barriers to control sediment in the flows, with arrangements for the clearance and satisfactory removal of sediment.
Contractor costs to be incorporated with the contract amount.
Inclusion of elated requirements in contract documentation, and compliance by the Contractor for the design/build contract works.
Maximum temperature effects
Work conditions of employees engaged on the contract works and risk of dehydration.
Contract documents to require contractor to provide drinking water on-site for employees working in the confined site conditions for a consumption of 5 liters/ employee/ day.23 The WHO publication Water Requirements and Recommended Intakes, A Grandjean 2004 provides a suitable reference document
Contractor costs to be incorporated with the contract amount.
Inclusion of elated requirements in contract documentation, and compliance by the Contractor for the design/build contract works.
Drought effects
No Identified impacts
- - -
23 Dehydration is the adverse consequence of inadequate water intake. The symptoms of acute dehydration vary
with the degree of water deficit (1). For example, fluid loss at 1% of body weight impairs thermoregulation and, thirst occurs at this level of dehydration. Thirst increases at 2%, with dry mouth appearing at approximately 3%. Vague discomfort and loss of appetite appear at 2%. The threshold for impaired exercise thermoregulation is 1% dehydration, and at 4% decrements of 20-30% is seen in work capacity. Difficulty concentrating, headache, and sleepiness are observed at 5%. Tingling and numbness of extremities can be seen at 6%, and collapse can occur around 7% dehydration. A 10% loss of body water through dehydration is life threatening. While the vague discomfort that accompanies a 2% dehydration may not have a significant impact, the 20 – 30% reduction in work capacity seen at 4% can have a significant negative impact on productivity. WHO 2004.

107
13. Conclusions
62. Climate change projections have been carried out for four sites. The projections are
based on RCP8.5 for the years 2030 and 2050. Rainfall data on a daily basis for 25 years was
obtained from MOWRAM.
63. Flood risks have been assessed using the MPWT in house software FRMI.
64. Projections show that the increase in intensity of rainfall during extreme weather events
does not vary across the country.
65. The 1 in 10 year event by 2030 under RCP 8.5 will experience a 4 % increase in 1 hour
rainfall intensity and by 2050 under RCP 8.5 there will be a 7% increase in 1 hour rainfall
intensity.
66. The 1 in 100 year event by 2030 under RCP 8.5 will experience a 7 % increase in 1 hour
rainfall intensity and by 2050 under RCP 8.5 there will be a 12% increase in 1 hour rainfall
intensity.
67. The projected results show that by the year 2050 daily peak temperatures could reach
49.5oC. This would be a 1 in 100 year event. A more common scenario would be daily peak
temperatures reaching 47oC which would be a 1 in 10 year event.
68. The highest probability of a severe drought occurring is 7.5% by the year 2050 in
Battambang. This equates to a 1 in 13 year event. The highest probability of an extreme
drought occurring is 4.29% by the year 2030 in Siem Reap. This equates to a 1 in 23 year
event.
69. The climate change risks are given below.
Table 13-1 Climate Change Risks
70. Total subproject costs and costs of adaptation are summarised below.
Subproject Total Estimated Cost
Estimated adaptation cost
Percentage
Battambang Water Supply $34,899,700 $72,000 0.2%
Battambang Wastewater $10,646,687 $410,720 3.9%
Kampong Cham Water Supply $12,765,500 $262,000 2.1%
Kampong Cham Septage $790,000 $88,400 11.2%
Sihanoukville Wastewater $14,653,560 $900,000 6.1%
Siem Reap Interceptor Sewer $15,911,610 - -
Total $89,667,057 $1,733,120 1.9%
City Water Supply Wastewater Septage Climate Change Risk
Battambang X High
Battambang X Moderate
Kampong Cham X Moderate
Kampong Cham X Low
Sihanoukville X Moderate
Siem Reap X (sewer rehab) Low

108

109
14. Annex A : GCM and RCM Data
Table A1: GCMs with 3 hourly precipitation data available
GCM nlat nlon
1 ACCESS1-0 145 192
2 BCC-CSM1-1 64 128
3 BCC-CSM1-1-M 160 320
4 CCSM4 192 288
5 CMCC-CM 240 480
6 CNRM-CM5 128 256
7 EC-EARTH 160 320
8 FGOALS-g2 60 128
9 GFDL-CM3 90 144
10 GFDL-ESM2G 90 144
11 GFDL-ESM2M 90 144
12 GISS-E2-H 90 144
13 GISS-E2-R 90 144
14 HadGEM2-ES 145 192
15 inmcm4 120 180
16 IPSL-CM5A-LR 96 96
17 IPSL-CM5A-MR 143 144
18 MIROC5 128 256
19 MIROC-ESM 64 128
20 MIROC-ESM-CHEM 64 128
21 MRI-CGCM3 160 320
22 NorESM1-M 96 144
Table A2. Availability of GCM variables in the CMIP5 database
Model Temp Precip SolRad RelHum Wind SLR
1 ACCESS1.3 Yes Yes Yes Yes Yes
2 ACCESS1.0 Yes Yes Yes Yes Yes
3 BCC-CSM1-1 Yes Yes Yes Yes Yes
4 BCC-CSM1-1-m Yes Yes Yes Yes
5 BNU-ESM Yes Yes
6 CanESM2 Yes Yes Yes Yes Yes Yes
7 CCSM4 Yes Yes Yes Yes Yes
8 CESM1-BGC Yes Yes Yes Yes

110
Model Temp Precip SolRad RelHum Wind SLR
9 CESM1-CAM5 Yes Yes Yes Yes
10 CMCC-CM Yes Yes Yes Yes Yes
11 CMCC-CMS Yes Yes Yes Yes Yes
12 CNRM-CM5 Yes Yes Yes Yes Yes
13 CSIRO-Mk3-6-0 Yes Yes Yes Yes Yes Yes
14 EC-EARTH Yes Yes Yes
15 FGOALS-g2 Yes Yes
16 FGOALS-s2 Yes Yes
17 GFDL-CM3 Yes Yes Yes Yes Yes Yes
18 GFDL-ESM2G Yes Yes Yes Yes Yes Yes
19 GFDL-ESM2M Yes Yes Yes Yes Yes Yes
20 GISS-E2-H Yes Yes Yes Yes Yes
21 GISS-E2-H-CC Yes Yes Yes Yes Yes
22 GISS-E2-R Yes Yes Yes Yes Yes
23 GISS-E2-R-CC Yes Yes Yes Yes Yes
24 HADCM3 Yes Yes Yes Yes Yes
25 HadGEM2-AO Yes Yes Yes Yes
26 HadGEM2-CC Yes Yes Yes Yes Yes Yes
27 HadGEM2-ES Yes Yes Yes Yes Yes Yes
28 INMCM4 Yes Yes Yes Yes Yes Yes
29 IPSL-CM5A-LR Yes Yes Yes Yes Yes
30 IPSL-CM5A-MR Yes Yes Yes Yes Yes
31 IPSL-CM5B-LR Yes Yes Yes Yes Yes
32 MIROC4H Yes Yes Yes Yes
33 MIROC5 Yes Yes Yes Yes Yes Yes
34 MIROC-ESM Yes Yes Yes Yes Yes Yes
35 MIROC-ESM-CHEM Yes Yes Yes Yes Yes Yes
36 MPI-ESM-LR Yes Yes Yes Yes Yes
37 ESM MPI Yes Yes Yes Yes Yes
38 MRI-CGCM3 Yes Yes Yes Yes Yes Yes
39 NorESM1-M Yes Yes Yes Yes
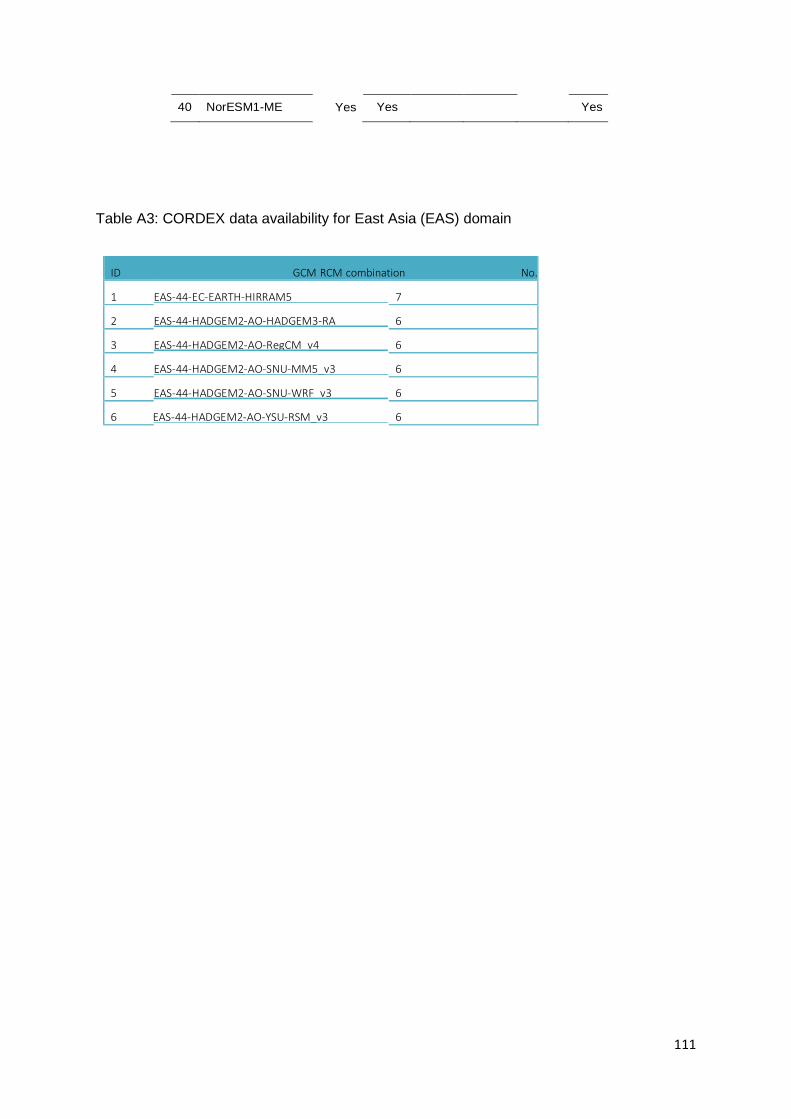
111
40 NorESM1-ME Yes Yes Yes
Table A3: CORDEX data availability for East Asia (EAS) domain
ID GCM RCM combination No. of variables
1
EAS-44-EC-EARTH-HIRRAM5
EAS-44-HADGEM2-AO-HADGEM3-RA
EAS-44-HADGEM2-AO-RegCM_v4
EAS-44-HADGEM2-AO-SNU-MM5_v3
EAS-44-HADGEM2-AO-SNU-WRF_v3
EAS-44-HADGEM2-AO-YSU-RSM_v3
7
2
6
3
6
4
6
5
6
6
6

112
15. Annex B References
Agbazo, M., Koton'Gobi, G., Kounouhewa, B., Alamou, E., & Afouda, A. (2016). Estimation of IDF Curves of
Extreme Rainfall by Simple Scaling in Northern Oueme Valley, Benin Republic (West Africa). Earth Sciences
Research Journal, 20(1), 1-7.
Al Mamoon, A., Joergensen, N. E., Rahman, A., & Qasem, H. (2016). Design rainfall in Qatar: sensitivity to climate
change scenarios. Natural Hazards, 81(3), 1797-1810.
Anandhi, A., Frei, A., Pierson, D., Schneiderman, E., Zion, M., Lounsbury, D., Matonse, A. (2011). Examination of
change factor methodologies for climate change impact assessment. Water Resources Research. 47 (3):1-10,
W03501, doi:10.1029/2010WR009104.
Bara, M., Gaal, L., Kohnova, S., Szolgay, J., Hlavcova, K. (2009). Simple scaling extreme rainfall in Slovakia a
case study. Meteorological Journal 11, 153–157.
Ceresetti D. Anquetin S., Molinié G., Leblois E., et Creutin J. D. (2011), Severity diagrams: a new approach for the
multi-scale evaluation of extreme rainfall events. Weather and Forecasting.
Dagnet, Y., Waskow, D., Elliot, C., Northrop, E., Thwaites, J., Modelgaard, K., Krnjaic, M., Levin, K., McGray, H.
(2016). Staying on Track from Paris: Advancing the Key Elements of the Paris Agreement. Working Paper.
Washington, DC: World Resources Institute. Available online at http//www.wri.org/ontrackfromparis.
Dwyer, I.J., Reed, D.W., (1995). Allowance for discretization in hydrological and environmental risk estimation,
Institute of Hydrology, Wallingford, UK.
Eyre, J., Bhalchandra, P. (2014). Permeable Concrete Block Paving Applications in the United Arab Emirates.
International Journal of Engineering Trends and Technology (IJETT) Vol 16 No 5:227-236.
Fadhel, S., Rico-Ramirez, M. A., & Han, D. (2017). Uncertainty of Intensity–Duration–Frequency (IDF) curves due
to varied climate baseline periods. Journal of Hydrology, 547, 600-612.
Ghanmi, H., (2014). Estimation des courbes Intensité-Durée-AireFrequence (IDAF) de la region de Tunis dans un
context multifractal. Université de Versailles Saint-Quentin-enYvelines et Université de Tunis EL Manar, à l’UVSQ-
LATMOS (Guyancourt-France) Thèse de doctorat.
Hosking, J.R.M., Wallis, J. R., (2005). Regional Frequency Analysis: An approach Based on L-moments.
Cambridge University Press, New York.
Knutti et al. (2010). Good Practice Guidance Paper on Assessing and Combining Multi Model Climate Projections.
IPCC Expert Meeting on Assessing and Combining Multi Model Climate Projections. National Center for
Atmospheric Research Boulder, Colorado, USA25-27 January 2010.
Li, Y. and Ye, W. (2011). Applicability of ensemble pattern scaling method on precipitation intensity indices at
regional scale. Hydrology and Earth System Sciences Discussion, 8, 5227. 5261, doi:10.5194/hessd-8-5227-2011.
Liew, S.C., Raghavan, S.V., Liong, S. (2014). Development of Intensity-Duration-Frequency curves at ungauged
sites: risk management under changing climate. Geoscience Letters, 1:8.
Mahoney, K., Alexander, M., Scott, J. D., & Barsugli, J. (2013). High-Resolution Downscaled Simulations of Warm-
Season Extreme Precipitation Events in the Colorado Front Range under Past and Future Climates. Journal of
Climate, 26(21), 8671-8689.
Mamoon, A.A., Joergensen, N.E., Rahman, A., Qasam, H. (2014). Derivation of new design rainfall in Qatar using
L-moment based index frequency approach. Gulf Organisation for Research and Development. International
Journal of Sustainable Built Environment. Vol. 3: 111-118.
Milly, P.C.D., Betancourt, J., Falkenmark, M., Hirsch, R.M., Zbigniew, W. Kundzewicz, D., Lettenmaier, P., Stouffer.
R. J. (2008). Stationarity Is Dead: Whither Water Management?, Science, 319 (5863), 573-574.
[DOI:10.1126/science.1151915].

113
Nhat L.M., Tachikawa Y., Sayama T., Takara K. (2006). Establishment of intensity-duration-frequency curves for
precipitation in monsoon area of Vietnam. Annuals of disas. Prev, Res, Inst, Kyoto Univ.
Peck , A., Prodanovic , P., Slobodan P., Simonovic, P. (2012). Rainfall Intensity Duration Frequency Curves Under
Climate Change: City of London, Ontario, Canada. Canadian Water Resources Journal / Revue Canadienne des
Ressources Hydriques. Vol.37, Iss.3.
Rudd, A. C., & Kay, A. L. (2015). Use of very high resolution climate model data for hydrological modelling:
estimation of potential evaporation. Hydrology Research, nh2015028.
Sherif, M., Chowdhury, R. (2014a). Analysis of rainfall, PMP and drought in the United Arab Emirates. International
Journal of Climatology. March 2014. DOI: 10.1002/joc.3768.
Sherif, M., Chowdhury, R. (2014b).Rainfall and Intensity-Duration-Frequency (IDF) Curves in the United Arab
Emirates. May 2014. DOI: 10.1061/9780784413548.231.
Sørup, H. J. D., Georgiadis, S., Gregersen, I. B., & Arnbjerg-Nielsen, K. (2017). Formulating and testing a method
for perturbing precipitation time series to reflect anticipated climatic changes. Hydrology and Earth System
Sciences, 21(1), 345.
Srivastav, R.K., Schardong, A. and Slobodan, S.P. (2014). Computerized Tool for the Development of Intensity-
Duration-Frequency Curves under a Changing Climate: Technical Manual v.1 Water Resources Research Report
no. 089, Facility for Intelligent Decision Support, Department of Civil and Environmental Engineering, London,
Ontario, Canada, 52 pages. ISBN: (print) 978-0- 7714-3087-9; (online) 978-0-7714-3088-6.
Sugahara, S.,I, Rocha R.P., Silveira R (2009). Non-stationary frequency analysis of extreme daily rainfall in Sao
Paulo , Brazil, 29, 1339–1349. doi:10.1002/joc.
Vicente-Serrano S.M., Santiago Beguería, Juan I. López-Moreno, (2010) A Multi-scalar drought index sensitive
to global warming: The Standardized Precipitation Evapotranspiration Index – SPEI. Journal of Climate 23: 1696-
1718.
Viglione, A, (2008). Contributed R-Package: nsRFA (Non-supervised Regional Frequency Analysis). URL:
http://www.r-project.org.
Wang, D., Hagen, S. C., & Alizad, K. (2013). Climate change impact and uncertainty analysis of extreme rainfall
events in the Apalachicola River basin, Florida. Journal of Hydrology, 480, 125-135.
Willems, P., Arnbjerg-Nielsen, K., Olsson, J., & Nguyen, V. T. V. (2012). Climate change impact assessment on
urban rainfall extremes and urban drainage: methods and shortcomings. Atmospheric research, 103, 106-118.
WMO. (2009). Guide to Hydrological Practices, Volume II: Management of Water Resources and Application of
Hydrological Practices, WMO-No. 168, 6th Edition, World Meteorological Organization.
Yang, W., Andréasson, J., Graham, L. P., Olsson, J., Rosberg, J., & Wetterhall, F. (2010). Distribution- based
scaling to improve usability of regional climate model projections for hydrological climate change impacts studies.
Hydrology Research, 41(3-4), 211-229.
Yilmaz, A. G., & Perera, B. J. C. (2013). Extreme rainfall nonstationarity investigation and intensity–frequency–
duration relationship. Journal of Hydrologic Engineering, 19(6), 1160-1172.
Yin, C. (2011). Applications of Self-Organizing Maps to Statistical Downscaling of Major Regional Climate
Variables (Doctoral dissertation, University of Waikato).
Yu, M., & Liu, Y. (2015). The possible impact of urbanization on a heavy rainfall event in Beijing. Journal of
Geophysical Research: Atmospheres,120(16), 8132-8143.