
Providing Opportunities for Post-Secondary Education Among Under-Represented Groups by Barbara...
28
Providing Opportunities for Post-Secondary Education Among Under- Represented Groups Barbara Schneider Michigan State University March 17-18, 2016
-
Upload
eduskills-oecd -
Category
Education
-
view
38 -
download
0
Transcript of Providing Opportunities for Post-Secondary Education Among Under-Represented Groups by Barbara...

Providing Opportunities for Post-Secondary Education Among Under-Represented Groups
Barbara Schneider Michigan State University
March 17-18, 2016

• The Problem • The Solution • The Evidence • What this means for Chile
The Problem
The proportion of low income and
minority groups is underrepresented
in colleges and universities.
The problem is global.


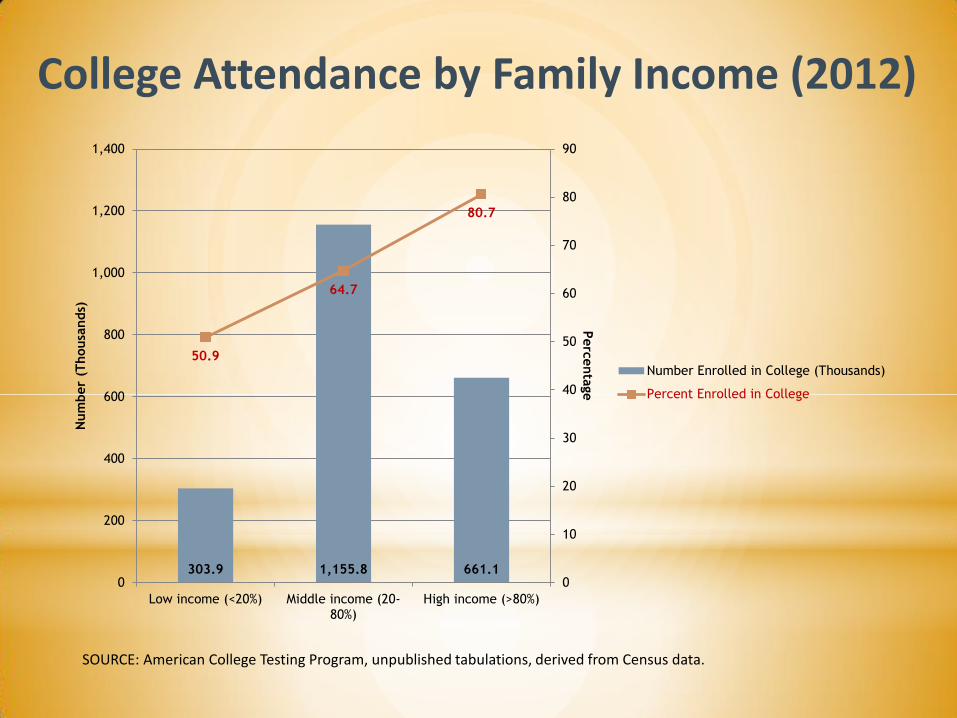
303.9 1,155.8 661.1
50.9
64.7
80.7
0
10
20
30
40
50
60
70
80
90
0
200
400
600
800
1,000
1,200
1,400
Low income (<20%) Middle income (20-80%)
High income (>80%)
Perc
enta
ge
Num
ber
(Thousa
nds)
Number Enrolled in College (Thousands)
Percent Enrolled in College
SOURCE: American College Testing Program, unpublished tabulations, derived from Census data.
College Attendance by Family Income (2012)

What Are The Solutions? How Can We Fix This?
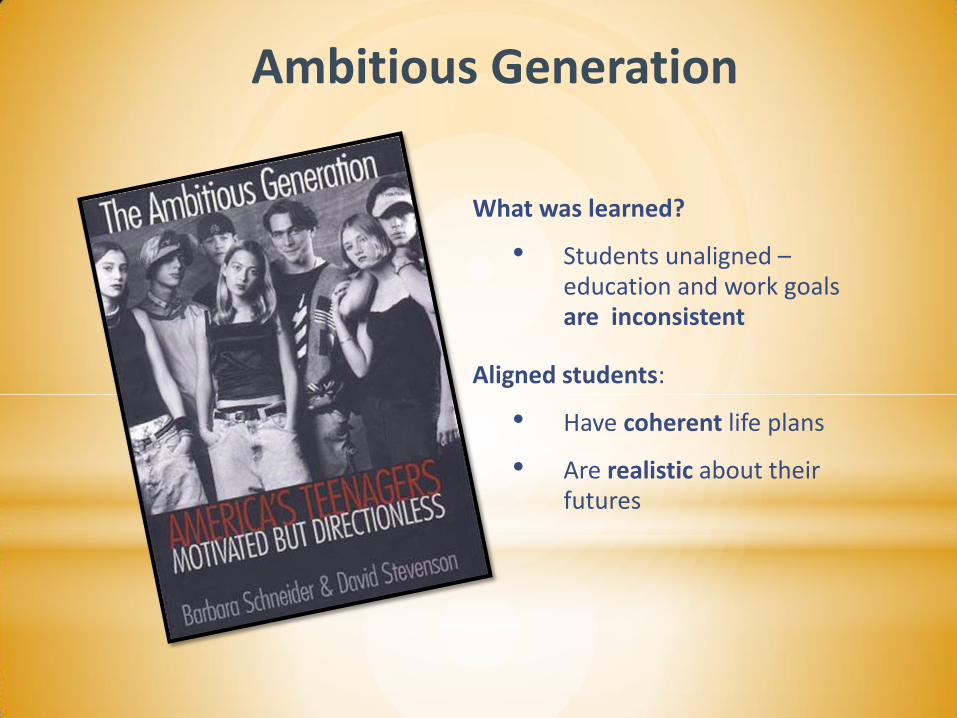
Ambitious Generation
What was learned?
• Students unaligned – education and work goals are inconsistent
Aligned students:
• Have coherent life plans
• Are realistic about their futures
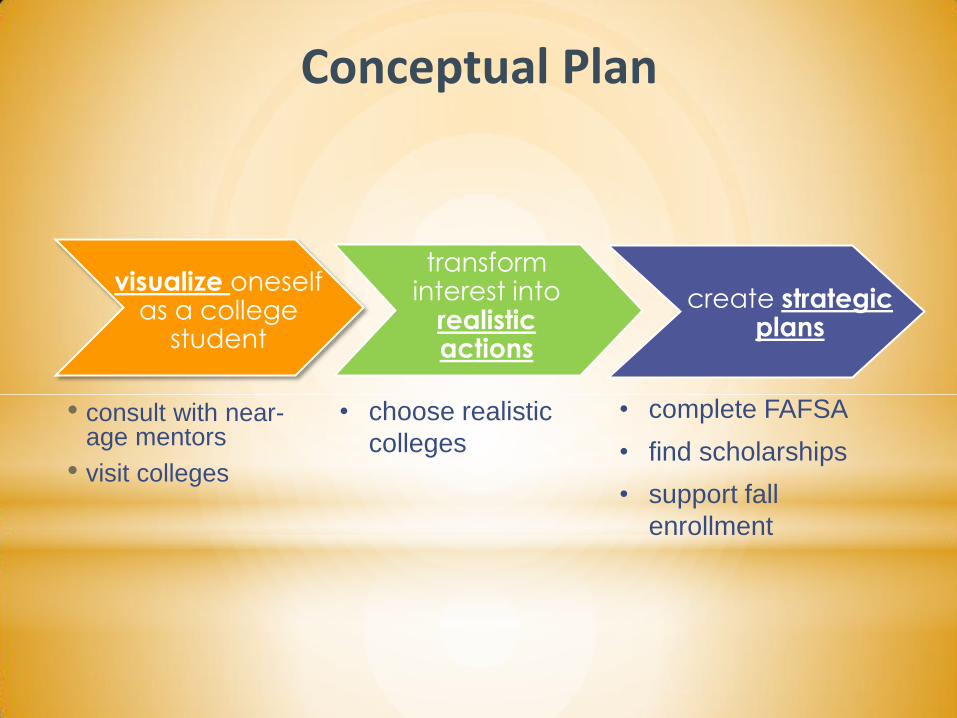
Conceptual Plan
• consult with near-age mentors
• visit colleges
visualize oneself as a college
student
transform interest into
realistic actions
• choose realistic
colleges
create strategic plans
• complete FAFSA
• find scholarships
• support fall
enrollment

The College Ambition Program
• CAP is an intervention with a staggered rollout
• Began with two treatment and two control high schools in 2010
• Thirteen in 2013-2014

CAP Description
• CAP Center open to all students
• CAP coordinates with school counseling staff and teachers
• Staffed by a site coordinator
• Offers: (1) tutoring and mentoring; (2) course-counseling and advising; (3)
financial aid planning; and (4) college visits
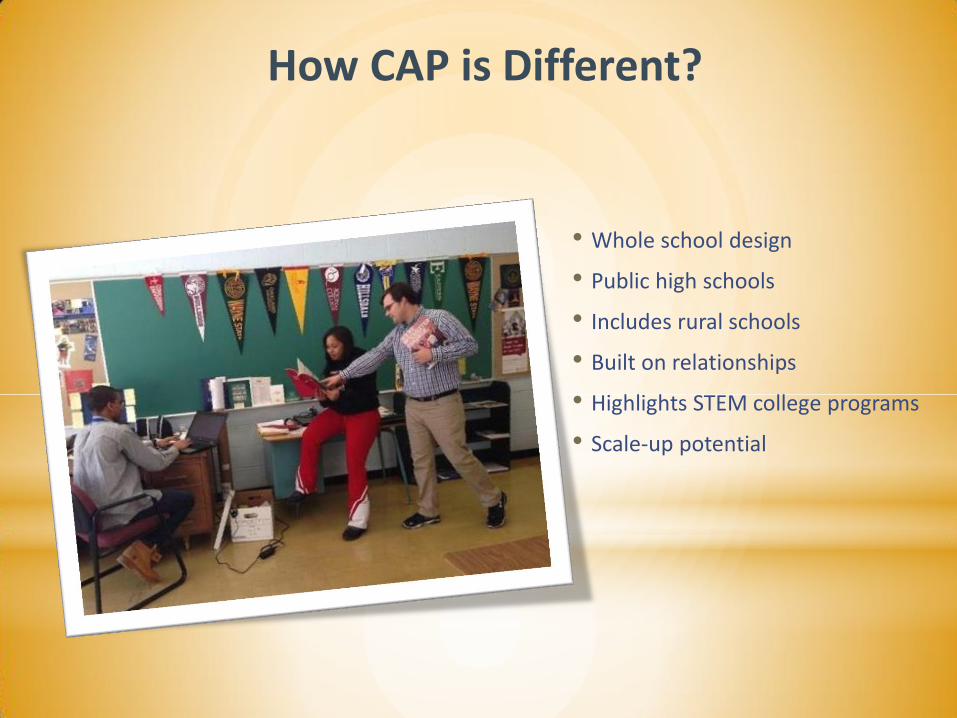
How CAP is Different?
• Whole school design
• Public high schools
• Includes rural schools
• Built on relationships
• Highlights STEM college programs
• Scale-up potential
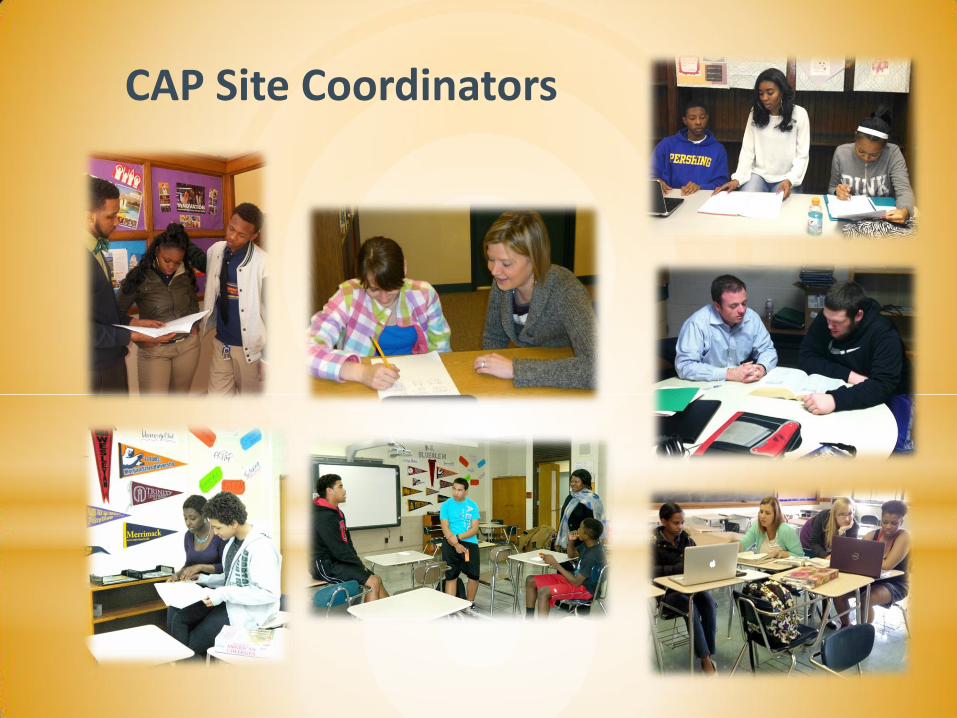
CAP Site Coordinators

Measures and Materials
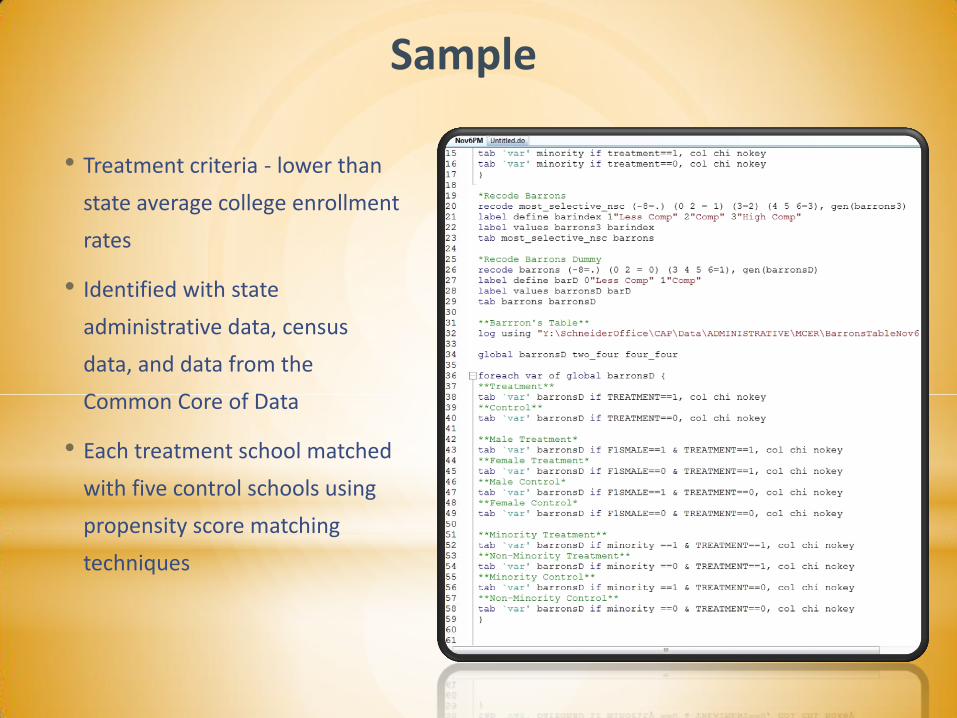
Sample
• Treatment criteria - lower than
state average college enrollment
rates
• Identified with state
administrative data, census
data, and data from the
Common Core of Data
• Each treatment school matched
with five control schools using
propensity score matching
techniques
School Matching Criteria
Postsecondary enrollment rates, school size, census
designation, poverty rate, and racial/ethnic diversity
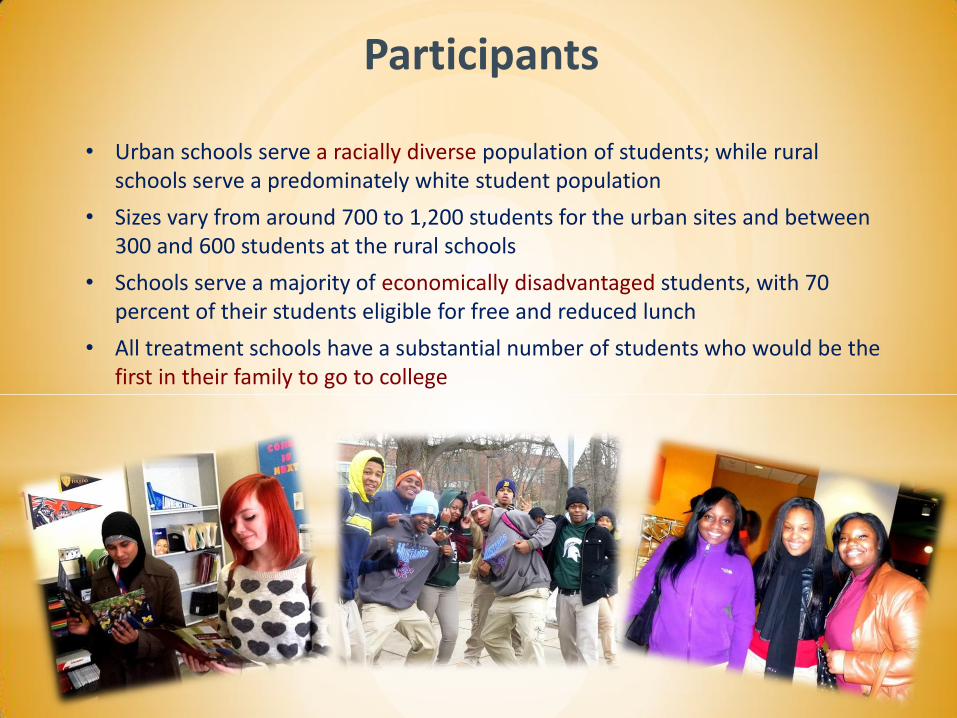
Participants
• Urban schools serve a racially diverse population of students; while rural schools serve a predominately white student population
• Sizes vary from around 700 to 1,200 students for the urban sites and between 300 and 600 students at the rural schools
• Schools serve a majority of economically disadvantaged students, with 70 percent of their students eligible for free and reduced lunch
• All treatment schools have a substantial number of students who would be the first in their family to go to college
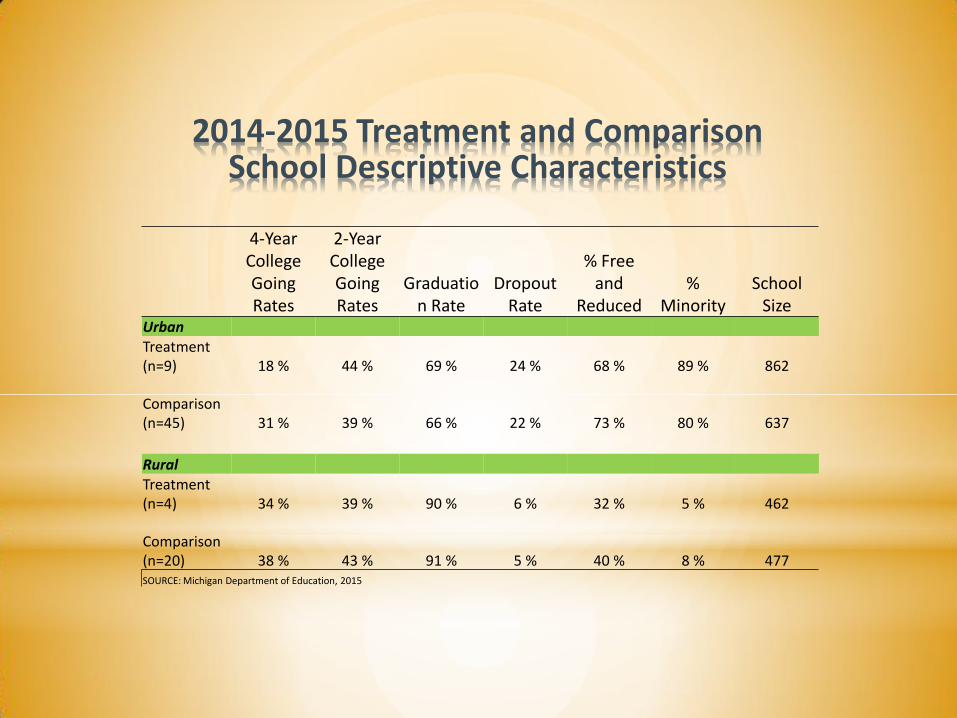
2014-2015 Treatment and Comparison School Descriptive Characteristics
4-Year College Going Rates
2-Year College Going Rates
Graduation Rate
Dropout Rate
% Free and
Reduced %
Minority School
Size Urban Treatment (n=9) 18 % 44 % 69 % 24 % 68 % 89 % 862
Comparison (n=45) 31 % 39 % 66 % 22 % 73 % 80 % 637
Rural Treatment (n=4) 34 % 39 % 90 % 6 % 32 % 5 % 462
Comparison (n=20) 38 % 43 % 91 % 5 % 40 % 8 % 477 SOURCE: Michigan Department of Education, 2015
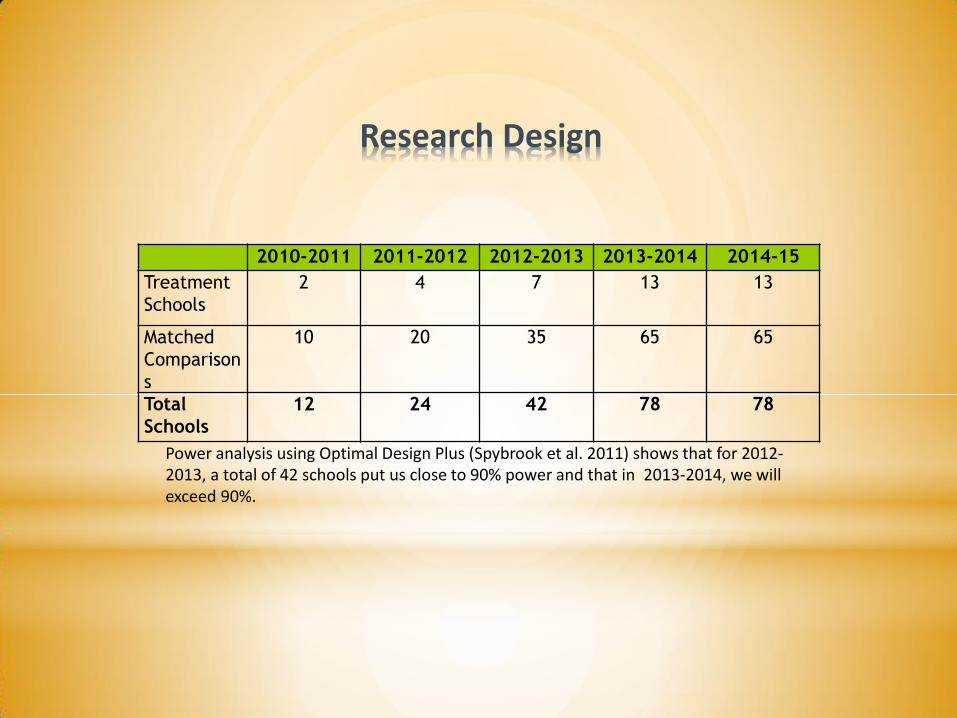
Research Design
2010-2011 2011-2012 2012-2013 2013-2014 2014-15
Treatment
Schools
2 4 7 13 13
Matched
Comparison
s
10 20 35 65 65
Total
Schools
12 24 42 78 78
Power analysis using Optimal Design Plus (Spybrook et al. 2011) shows that for 2012-2013, a total of 42 schools put us close to 90% power and that in 2013-2014, we will exceed 90%.
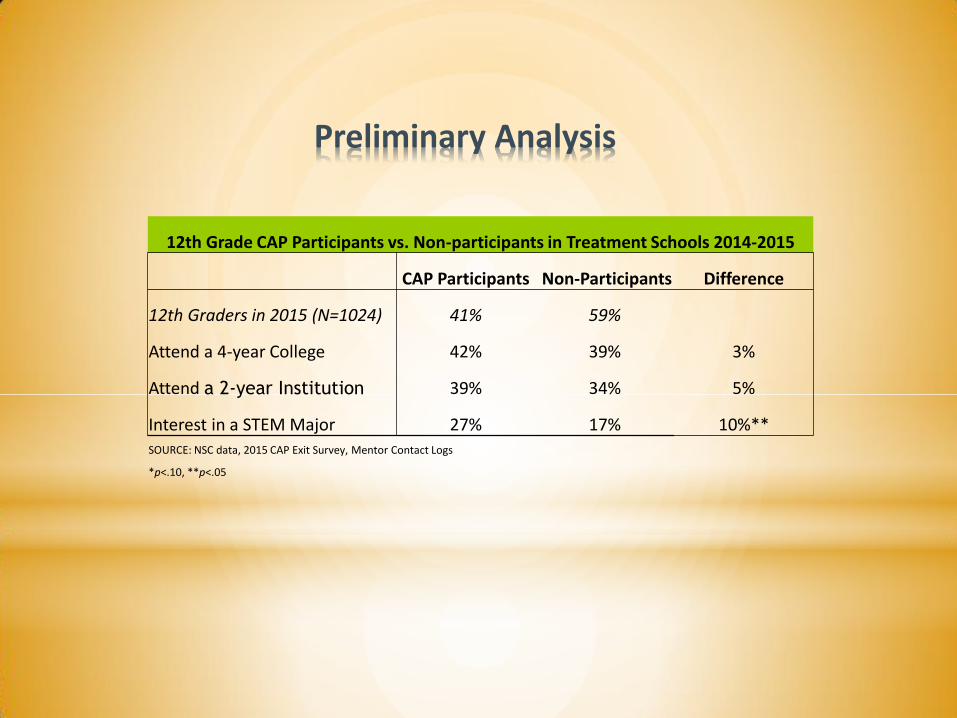
Preliminary Analysis
12th Grade CAP Participants vs. Non-participants in Treatment Schools 2014-2015
CAP Participants Non-Participants Difference
12th Graders in 2015 (N=1024) 41% 59%
Attend a 4-year College 42% 39% 3%
Attend a 2-year Institution 39% 34% 5%
Interest in a STEM Major 27% 17% 10%** SOURCE: NSC data, 2015 CAP Exit Survey, Mentor Contact Logs
*p<.10, **p<.05

Any College Enrollment Treatment vs. Control Schools

Two Year College Enrollment Treatment vs. Control Schools
Research Take-Aways
• Schools are dynamic places that are changing
• Partnerships are key for research in schools
• Changing student behaviors/and plans depends on personal interaction with a trusted knowledgeable individual
• College interventions should be low-cost and designed to be scaleable

Personal Take-Aways
• Continue in the face of disappointment
• In a crowded field be sure what you are pursuing has a unique feature
• Replication is indeed important but the key to replication is variation
• Pursue ideas that you are passionate about

Pictures of Staff
This material is based in part upon work supported by the National Science Foundation under Grant #s 0929635, DRL-1255807, DRL-1316702, NIH Grant
# 1R01GM102637-01, the Michigan Department of Education, and a Pre-Doctoral Training Grant from the Institute of Education Sciences, U.S.
Department of Education Award # R305B090011. Any opinions, findings, and conclusions or recommendations expressed in this material are those of
the author(s) and do not necessarily reflect the views of the funding agencies.

Pictures of CAP Participants
Sophia Bozzo Michigan State University
Majoring in Food Science
Zahna Woodson Alma College
Majoring in Communications,
Minor in Cultural Studies
Michael Rogers Michigan State University
Majoring in Food Science
Nate Hall University of Michigan
Double majoring in Economics
and Informatics
Kenny Heindel University of Michigan
Science of Information
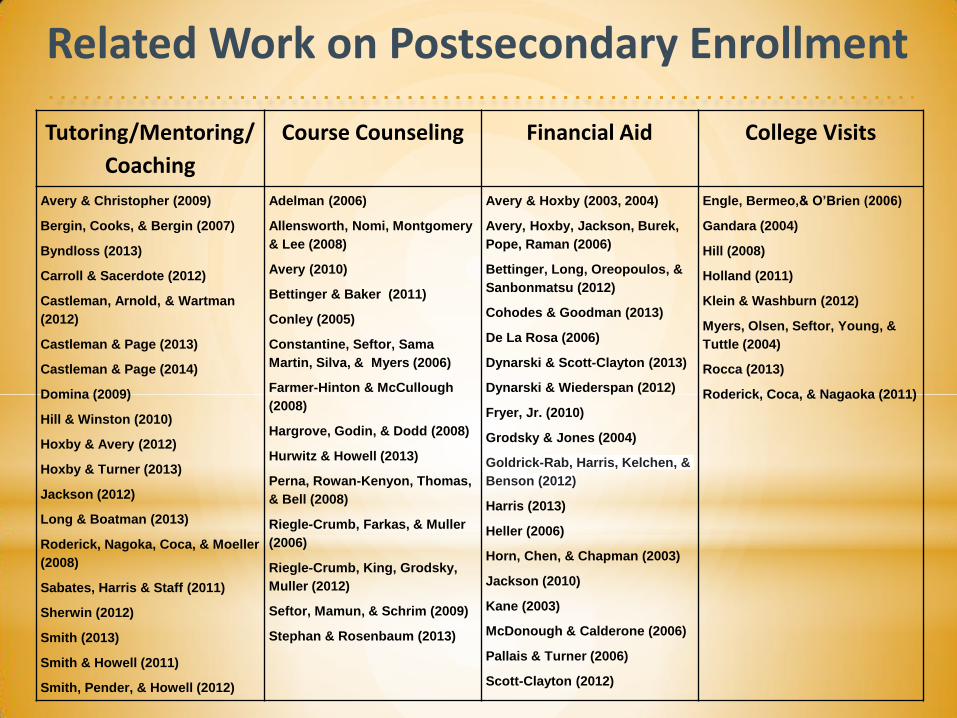
Related Work on Postsecondary Enrollment
Tutoring/Mentoring/
Coaching
Course Counseling Financial Aid College Visits
Avery & Christopher (2009)
Bergin, Cooks, & Bergin (2007)
Byndloss (2013)
Carroll & Sacerdote (2012)
Castleman, Arnold, & Wartman
(2012)
Castleman & Page (2013)
Castleman & Page (2014)
Domina (2009)
Hill & Winston (2010)
Hoxby & Avery (2012)
Hoxby & Turner (2013)
Jackson (2012)
Long & Boatman (2013)
Roderick, Nagoka, Coca, & Moeller
(2008)
Sabates, Harris & Staff (2011)
Sherwin (2012)
Smith (2013)
Smith & Howell (2011)
Smith, Pender, & Howell (2012)
Adelman (2006)
Allensworth, Nomi, Montgomery
& Lee (2008)
Avery (2010)
Bettinger & Baker (2011)
Conley (2005)
Constantine, Seftor, Sama
Martin, Silva, & Myers (2006)
Farmer-Hinton & McCullough
(2008)
Hargrove, Godin, & Dodd (2008)
Hurwitz & Howell (2013)
Perna, Rowan-Kenyon, Thomas,
& Bell (2008)
Riegle-Crumb, Farkas, & Muller
(2006)
Riegle-Crumb, King, Grodsky,
Muller (2012)
Seftor, Mamun, & Schrim (2009)
Stephan & Rosenbaum (2013)
Avery & Hoxby (2003, 2004)
Avery, Hoxby, Jackson, Burek,
Pope, Raman (2006)
Bettinger, Long, Oreopoulos, &
Sanbonmatsu (2012)
Cohodes & Goodman (2013)
De La Rosa (2006)
Dynarski & Scott-Clayton (2013)
Dynarski & Wiederspan (2012)
Fryer, Jr. (2010)
Grodsky & Jones (2004)
Goldrick-Rab, Harris, Kelchen, &
Benson (2012)
Harris (2013)
Heller (2006)
Horn, Chen, & Chapman (2003)
Jackson (2010)
Kane (2003)
McDonough & Calderone (2006)
Pallais & Turner (2006)
Scott-Clayton (2012)
Engle, Bermeo,& O’Brien (2006)
Gandara (2004)
Hill (2008)
Holland (2011)
Klein & Washburn (2012)
Myers, Olsen, Seftor, Young, &
Tuttle (2004)
Rocca (2013)
Roderick, Coca, & Nagaoka (2011)