Providing Easy Access to Cross-Country Comparative Contextual Data for Demographic Research
33
MPIDR WORKING PAPER WP 2013-001 JANUARY 2013 Arianna Caporali Sebastian Klüsener ([email protected]) Gerda Neyer Sandra Krapf Olga Grigorieva Providing Easy Access to Cross-Country Comparative Contextual Data for Demo- graphic Research: Concept and Recent Advances of the Generations & Gender Programme Contextual Database Max-Planck-Institut für demografische Forschung Max Planck Institute for Demographic Research Konrad-Zuse-Strasse 1 · D-18057 Rostock · GERMANY Tel +49 (0) 3 81 20 81 - 0; Fax +49 (0) 3 81 20 81 - 202; http://www.demogr.mpg.de This working paper has been approved for release by: Mikołaj Szołtysek ([email protected]), Deputy Head of the Laboratory of Historical Demography. © Copyright is held by the authors. Working papers of the Max Planck Institute for Demographic Research receive only limited review. Views or opinions expressed in working papers are attributable to the authors and do not necessarily reflect those of the Institute.
Transcript of Providing Easy Access to Cross-Country Comparative Contextual Data for Demographic Research

MPIDR WORKING PAPER WP 2013-001JANUARY 2013
Arianna CaporaliSebastian Klüsener ([email protected])Gerda NeyerSandra KrapfOlga Grigorieva
Providing Easy Access to Cross-Country Comparative Contextual Data for Demo-graphic Research: Concept and Recent Advances of the Generations & Gender Programme Contextual Database
Max-Planck-Institut für demografi sche ForschungMax Planck Institute for Demographic ResearchKonrad-Zuse-Strasse 1 · D-18057 Rostock · GERMANYTel +49 (0) 3 81 20 81 - 0; Fax +49 (0) 3 81 20 81 - 202; http://www.demogr.mpg.de
This working paper has been approved for release by: Mikołaj Szołtysek ([email protected]),Deputy Head of the Laboratory of Historical Demography.
© Copyright is held by the authors.
Working papers of the Max Planck Institute for Demographic Research receive only limited review.Views or opinions expressed in working papers are attributable to the authors and do not necessarily refl ect those of the Institute.

1
Providing Easy Access to Cross-Country Comparative Contextual Data for
Demographic Research: Concept and Recent Advances of the Generations &
Gender Programme Contextual Database
Arianna Caporali1, Sebastian Klüsener
2, Gerda Neyer
3, Sandra Krapf
2, Olga Grigorieva
2
1 Service des enquêtes et sondages, Institut national d’études démographiques (Ined, France). 2 Max Planck Institute for Demographic Research (MPIDR, Germany). 3 Stockholm University, Demography Unit (SUDA, Sweden).

2
Contents
Abstract ........................................................................................................................................................................................ 2
1. Introduction – The Generations and Gender Programme ....................................................................................................... 3
2. Contextualising individual behaviour - Conceptual framework and content of the GGP Contextual Database ..................... 5
3. Data collection, data preparation, and database development ................................................................................................. 9
3.1. UP TO 2008...................................................................................................................................................................... 9
3.2. DEVELOPMENTS BETWEEN 2009-2012 ............................................................................................................................... 10
3.2.1. Increasing the number of comparative indicators ................................................................................................ 10
3.2.2. New guidelines for national data collections ....................................................................................................... 12
3.2.3. Improved data harmonisation and data preparation ............................................................................................. 13
3.2.4 The new Web interface and database functionality .............................................................................................. 15
4. Data availability as of January 2013 ....................................................................................................................................... 16
5. Conclusion .............................................................................................................................................................................. 17
References .................................................................................................................................................................................. 18
Appendix A: An extract from the variable-by-variable overview of data in the Contextual Database and other international
databases – indicator “Gini Coefficient” ........................................................................................................................... 21
Appendix B: Main international comparative sources examined. ............................................................................................. 22
Appendix C: Extract from the new guidelines for national data collectors ............................................................................... 24
Appendix D: Combination of national sources with international sources – indicator “Mean Age at Birth”, Lithuania ......... 26
Appendix E: Combination of international sources with other international sources – indicator “Labour Force
Participation”, France ....................................................................................................................................................... 28
Appendix F: Screenshots of the new Web interface ................................................................................................................... 30
Abstract
Demographic behaviour is shaped not only by characteristics at the individual level, but also by the
context in which individuals are embedded. The Contextual Database of the Generations and
Gender Programme (GGP) supports research on these micro-macro links by providing cross-
country comparative contextual data on demographic, socio-economic, and policy developments
covering up to 60 countries in Europe, North America, Asia, and Oceania. This paper presents
conceptual considerations and recent advances in the implementation of this database. Although
conceptually linked to the Generations and Gender Survey, the GGP Contextual Database can also
be used for the analysis of data from other surveys or to study macro-developments. With its unique
combination of features, this database could serve as a model for the development of contextual
databases linked to other surveys. These features include the provision of harmonised national and
sub-national regional time series of indicators in a dynamic web environment with innovative
functionalities, such as metadata documentation by single data entry and automatic geocoding.

3
1. Introduction – The Generations and Gender Programme
Demographic aspects, such as increasing life expectancy and low fertility, present policy challenges
for many national governments in Europe and other industrialised countries. To meet these
challenges, policy makers need a better understanding of individual behaviour, as well as of the
social, economic, demographic, and policy-related factors that influence these developments. In
studying these issues, researchers must have access not only to cross-country comparative
individual data on demographic behaviour, but also to information on the contextual political and
socio-economic conditions in which this behaviour is embedded. However, it can be a tedious and
time-consuming endeavour for researchers to compile cross-country comparative contextual data by
themselves. Data often have to be derived from different international and national databases, and
then checked for reliability and comparability. The Contextual Database (CDB) of the Generations
and Gender Programme (GGP) assists researchers in this task by providing them with easy access to
harmonised cross-country comparative data on demographic, socio-economic, and policy contexts.
The CDB is an integral part of the GGP, which aims to provide internationally comparable
individual-level data on demographic behaviours and contextual information on demographic,
social, economic, and political macro-conditions. The main focus of the GGP is on Europe, but it
also covers developed countries of other continents, such as Japan and Australia. The central topics
of the programme are fertility, partnership, transition to adulthood, and economic activity; as well
as intergenerational and gender relations between people, as expressed in care relationships or the
organisation of paid and unpaid work. For example, the GGP data allow us to investigate the
reasons for low fertility in large parts of Europe and Asia, or the ways in which welfare states
support the family in light of the profound transformations that families and family relationships are
undergoing.
The GGP was initiated by the Population Unit (PU) of the United Nation's Economic Commission
of Europe (UNECE) at the 2000 Geneva meeting on Generations and Gender (United Nations 2007,
2008, 2009). To develop the Programme, PU formed the GGP Consortium Board, which brought
together the considerable resources of Europe’s largest demographic institutions and statistical
offices4. To map the field of the GGP, four conceptual papers were developed at the launch of the
4 Since 2009, the Netherlands Interdisciplinary Demographic Institute (NIDI) has been in charge of the co-ordination of
the project. At the national level, GGP National Committees deal with the implementation of the Programme. The
Consortium is composed of 11 institutions: Netherlands Interdisciplinary Demographic Institute (NIDI), Institut

4
programme to discuss the research and data collection on children and adolescents, the working-age
population, older people, and intergenerational relationships (United Nations 2000). The GGP was
the continuation of the Comparative Fertility Study (CFS), which was concluded in the mid-1970s;
the World Fertility Survey (WFS), which came thereafter; and the Fertility and Family Survey
(FFS) project, which was conducted in the 1990s (Festy 2004). The GGP introduced a number of
innovations that distinguish it from its predecessors. The programme’s goal is to be ―prospective,
multidisciplinary, context-sensitive and highly comparative‖ (Macura 2002: 6). The GGP is built
around the Generations and Gender Survey (GGS), a longitudinal survey that breaks with the
tradition of cross-sectional surveys. From its inception, the GGP has been a multi-country effort to
develop a joint comparative project based on a multidisciplinary approach to the interactions
between generations and gender, and to their effects on child-parent relationships and partner-
partner relationships.
The GGS represents the core element of the GGP. It is a panel survey conducted at intervals of
approximately three years. The respondents are individuals between the ages of 18 and 79 who do
not live in institutions (see Vikat et al. 2007 for details). The primary aim of the survey is to help
explain the process of leaving home, partnership dynamics, childbearing, and retirement. To this
end, it collects retrospective data on individuals’ mezzo context (e.g., questions on the parental
home during childhood). The prospective focus is maintained through a standard block of questions
on intentions. The domains covered in the survey include economic aspects of individuals’ lives
(e.g., economic activity, income, and economic well-being), values and attitudes regarding family
and fertility changes, intergenerational relationships, gender relationships, household composition
and housing, residential mobility, social networks and private transfers, education, health, and
public transfers.
The GGP was one of the first survey programmes to combine for each participating country the
micro-level data collection of the GGS with the macro- (national) and meso-level (regional) data
collection of the CDB (Festy 2004; Macura 2002; Vikat et al. 2007). These contexts—which are
defined as national policies, educational systems, labour and housing markets, regional and local
conditions, and social groups—determine the opportunity structures that affect an individual’s life
national d’études démographiques (Ined, France), Carlo F. Dondena Centre for Research on Social Dynamics of
Bocconi University (Italy), Statistics Norway, Demographic Research Institute of the Hungarian Central Statistical
Office (Hungary), NOVA (Norway), Faculty of Social Sciences of the University of Ljubljana (Slovenia), Utrecht
University (Netherlands), Department of Social Policy of the University of York (Great Britain), Max Planck Institute
for Demographic Research (MPIDR, Germany), Erasmus University Rotterdam (Netherlands), PU - UNECE.
5
course and critical transitions (e.g., transition to adulthood, parenthood, retirement). The CDB aims
to provide ready-to-use, cross-country comparative data on these topics for the 56 countries covered
by the United Nations Economic Commission for Europe (UNECE), and beyond.
The importance of enhancing micro-level data with macro-level information has already been
emphasised in conjunction with the FFS (Goldscheider 2000), which provided a small static macro-
data collection on its webpage. The first explorative studies on database design and information
context were conducted within the GGP International Working Group (Festy 2001). These studies
underlined the need for defining, both conceptually and statistically, the context not only of
intergenerational relationships, but also of gender relationships; they also recommended co-
operating with national experts in the identification of adequate international comparative concepts
and statistics. In 2002, a GGP-CDB Working Group5 was set up to develop the database on the
basis of theoretical and methodological background papers (Bisogno 2002; Festy 2002; Neyer 2002;
Racioppi and Rivellini 2002). The group discussed not only conceptual, but also practical and
organisational issues (Festy 2004). These considerations served as a blueprint for the
implementation of the CDB, which has been co-ordinated since 2003 by the Max Planck Institute
for Demographic Research (MPIDR), based in Rostock (Germany).
2. Contextualising individual behaviour - Conceptual framework and content of the GGP
Contextual Database
A four-way approach guided the development of the CDB conceptual framework and content. First,
the content of the GGS questionnaire served as a starting point for determining the relevant
contextual domains (Festy 2002). Following a life course perspective, the micro-level information
of the survey was structured around five main careers: (1) life career, (2) activity career, (3)
residential career, (4) partnership career, and (5) fertility career. For each life course segment, a
corresponding contextual domain for the CDB was identified (Spielauer 2004a). For instance,
individual choices concerning parenthood were placed into macro contexts, such as the maternity
5 The group was headed by Patrick Festy from Ined. Members of the group included: Antonella Pinnelli and Filomena
Racioppi (―La Sapienza‖, University of Rome, Italy), Giulia Rivellini (University of Milan, Italy), Gerda Neyer
(MPIDR, Germany), Lars Østby (Statistics Norway), Jacques Légaré (Statistics Canada), Martin Spielauer (Austrian
Institute for Family Studies, Oif), Teresa Munzi (Luxembourg Income Study, LIS), Enrico Bisogno, Martine Corijn,
Miroslav Macura and Alphonse McDonald (PU, UNECE), Mark Pearson (Organization for Economic Co-operation and
Development, OECD), Pau Baizan (University of Barcelona) and Gösta Esping-Andersen (University of Barcelona).

6
leave system, job protection, and the birth preparation system. These contexts may vary
considerably across countries.
The second approach was concerned with theories and hypotheses that relate to the GGS key
dependent variables, which are childbearing, partnership formation and dissolution, transition to
adulthood, living arrangements, and economic activity (Spielauer 2004a, 2007). The contextual
domains were intended to encompass the dimensions used in the GGS to investigate gender and
inter-generation relations (i.e., legal, co-residence, intensity, quality, power and decision-making,
care relations, economic exchange), the socio-economic situation and the welfare state (i.e., jobs
and the labour market, non-labour income, wealth, expenditures on care, and household services),
attitudes and value orientations towards the domains studied, and religiosity. Two overlapping
concepts of context were supposed to influence individual behaviours. While the macroeconomic
situation and cultural, religious, and social norms may affect individual choices, state policies
impose regulations that may also have an impact on individual life courses (e.g., education
regulations) (Spielauer 2004a, 2007).
To develop a conceptual framework for the collection of policy data, Neyer (2003) analysed
concepts from comparative welfare state research theories. She clustered key measurement
dimensions of policies around four main concepts: (1) equality, (2) agency, (3) social rights, and (4)
risks and security. For example, levels of equality may be measured based on income distribution
and the public representation of different groups of the population (e.g., women’s labour force
participation or the representation of women in the political arena). Agency may be evaluated based
on the degree of access to social services (e.g., care services) and national social expenditures.
Social rights may be measured in terms of entitlements to the rights provided, while risk and
security may be captured in terms of the distribution of social security (e.g., health, unemployment,
maternity). Drawing from feminist welfare state research, Neyer (2003) further emphasised the
importance of considering how policies shape gender (and inter-generational) relations.
The third approach explored the methodological issues involved in the data analysis. To enable
researchers to conduct multi-level comparative studies in combination with GGS micro-level data,
the CDB had to match the retrospective, prospective, and geographical information collected in the
survey (Racioppi and Rivellini 2002). In addition, it had to allow for the linkage over time between
individuals and their geographical context, and between them and their membership groups.
Furthermore, the data had to be comparative across countries. The fourth and final approach began

7
with an inventory of existing international comparative databases (Bisogno 2002; Neyer 2003;
Spielauer 2004a), which was designed to provide information about data availability and past
experiences in conceptual framework development and data collection. Neyer (2003) screened all of
the relevant databases that contained policies to determine whether they should be included and
collected for GGP purposes.
The combination of these four approaches led to the identification of more than 200 variables
structured around 16 key topics (see Fig. 1). Among the CDB variables, there are around 95
national-level time series and 60 policy indicators. The time series are primarily yearly numeric
variables, while the policy histories provide standardised descriptions of key policy changes over
time. To match the retrospective depth of the GGS, all of the indicators would have to go back to
1970 or earlier. Moreover, the CDB includes around 65 sub-national regional variables, with the
goal of capturing the sub-national variation of contexts. As it might be particularly difficult to
obtain long time series for sub-national regional indicators, the focus of the data collection activities
for these indicators is on the period after 2000. The level of geographic detail at which the sub-
national regional data are provided varies across countries. It depends on the sample size
requirement for multi-level analysis, the availability of sub-national data, and the level of
geographic regional detail at which the identifier for the place of residence of an interviewed person
is given in the national GGS. Ultimately, to meet the criteria of the generations and gender
dimensions of the GGS, most contextual indicators are collected by sex and age groups. Being a
cross-country comparative database, variables are defined according to international definitions.
National variable definitions may only be applied in cases in which comparable data across
countries are not available.
Fig. 1 Overview – Indicators in the Contextual Database by Domain
Domains National-level indicators Regional-level indicators Policy histories
1. Demography
Total fertility rate, Live births, Marital live births,
Mean age at birth for all and first (live) births, Age-
specific fertility rates, Cohort mean age at all and first
(live) births, Completed cohort fertility, Induced legal
abortions, Proportion of childless women by birth
cohort. Mean age at first marriage, No. of marriages,
First marriages by 1000 women by age group,
Proportion of ever-married women at age 50 by birth
cohort, Marriage matrix by important ethnic or
national groups, Children with single mothers and
fathers by age group, No. of divorces, Total divorce
rate, Median duration of marriage at divorce. Life
expectancy at specific ages. International net migration
by 10,000, Marital status by age group and sex, Total
population by age group and sex, Median age by sex.
Total fertility rate, Live births,
First live births, Marital live
births, Mean age at birth (all live
births), Mean age at first live
birth. Mean age at first marriage
- male & female, No. of
marriages, First marriages,
Children with single mothers
and fathers by age group, No. of
divorces, Marital status by age
group - male & female, Total
male & female population by
age group.
No policy histories.

8
Fig. 1 (Continued).
Domains National level indicators Regional level indicators Policy Histories
2. Economic &
social system
Real GDP per capita, Consumer Price Index, GINI
coefficient of income distribution, Poverty by age and
sex, Poverty by activity status and sex, Poor
households by household type.
Household income deciles,
Poverty line, Children aged 0-14
living in poor households,
Mothers of children aged 0-14
living in poor households ,
People aged 15-64 living in poor
households, People aged 65+
living in poor households,
People living in poverty.
Poverty definition.
3. Labour
market and
employment
Labour market participation by sex, Sectoral
employment by ISIC activity and sex, Public
employment as percentage of people in labour force,
Employment by ISCO-88 occupational group and sex,
Distribution of employed persons by usual weekly
hour bands and by sex, Average vacation days per year
of employees, Average wage by ISIC activity and sex,
Minimum monthly wage, Average wage by age and
sex, Wage income deciles by sex, Public expenditure
for active labour market programs.
Labour market participation by
age group and sex, Employment
of mothers and fathers by age of
youngest child, Public
employment by age and sex,
Average monthly wages,
Average wages by age group
and sex, Wage income deciles
by sex.
Regulations on working hours and
paid vacation days per year, Measures
on part-time work.
4. Parental
Leave
Average or typical take-up times of child-related leave
programs. No regional level indicators.
Comparative table of maternity,
parental, and childcare leave
programs, Descriptions of leave
programs for sick children.
5. Pension
system
Average retirement age by sex, Minimum pension per
type, Public pension spending as % of GDP, Persons
receiving old age, survivors and disability pensions,
Average old age pension by sex.
Average old age pension by sex.
General description of the pension
system, Regular legal and early
retirement age, Mechanism that links
pension contributions to benefits,
Consequences of child and family
care periods on pensions.
6. Childcare
policies and
institutions
Enrolment rates in childcare institutions, Child-staff
ratio, Public pre-school childcare expenditure. Percentage of children living in
institutions by age group.
Description of main childcare
institutions and arrangements, Legal
entitlement to childcare, Preschool:
availability and entry age, typical
opening hours, requirements of
childcare staff.
7. Military and
alternative
civilian service
system
People in armed forces, Military expenditure as % of
GDP. No regional level indicators.
General description of national
(military & alternative) service,
Conscription age, Duration,
Population exempt, Availability and
restrictions of alternative (civilian)
service, Reconciliation of national
service with family obligations.
8.
Unemployment
Unemployment by age group and sex, Unemployment
by ISCO-88 occupational group and sex,
Unemployment by ISCED education level and sex,
Sectoral unemployment by ISIC activity and sex,
Long-term unemployment by sex, Average time in
unemployment by sex, Public expenditure on
unemployment as % of GDP, Unemployment by
important ethnic or national groups.
Unemployment by age group
and sex, Unemployment by sex,
Long-term unemployment by
sex.
Description of the unemployment
system, Extent of and reasons for
unemployment in different periods,
Duration of unemployment benefits,
Unemployment benefit calculation
formula, Unemployment benefit
eligibility.
9. Tax/benefit
system Total social expenditure as percentage of GDP. No regional level indicators.
General characteristics of the income
tax system, Impact of marriage on
taxes and benefits, Child benefits,
Marginal income tax rate, Regular
VAT rate, Social security contribution
rate.
10. Housing
market and
policies
Public expenditures on housing, Household type by
age group and sex.
Average dwelling size (sqm),
Housing construction by main
housing/ownership type,
Housing stock by main
housing/ownership type.
Housing situation, market and prices,
Housing policies.
11. Legal
regulations of
personal
relations &
family
responsibilities
Percentage of children staying with their mothers after
divorce of parents. No regional level indicators.
Legal restrictions on abortions, Social
security coverage of abortions, Legal
treatment of same-sex partnerships,
Restrictions on divorce, Legal care
obligations for elderly parents.

9
Fig. 1 (Continued).
Domains National level indicators Regional level indicators Policy Histories
12. Education
system
Percentage of students in private schools by ISCED
level, Highest educational attainment (ISCED) by age
and sex, Average school-leaving age by educational
level, Pupil-teacher ratio by school level (ISCED),
Total education expenditures % of GDP and share of
public expenditures.
Education enrolment rates by
age and sex.
Description of main educational
tracks, Entry age and duration of
compulsory schooling, Years of
common education before the first
important educational differentiation,
School days and total hours per week
by ISCED level, Registration and/or
Tuition Fees and financial support for
students in tertiary education.
13. Health
Healthy life expectancy at birth, Maternal deaths per
100,000 live births, Infant deaths per 1000 live births,
Healthy life expectancy at age 60, Percentage of total
population covered by health insurance, Physicians per
10,000, Hospital beds per 10,000, Total health
expenditures as % of GDP and share of public
expenditures, Health insurance coverage for non-active
population.
Life expectancy at birth. Description of health care system.
14. Elderly care
Elderly people living in institutions by sex; Elderly by
age group receiving private, formal, or private &
formal home care by sex; Public expenditures for
elderly care services.
No regional level indicators.
Measures for elderly in need for care,
Pension benefits for family care-
givers, Supportive measures for
working care givers.
15. Political
system
Ruling governmental coalitions on the regional level,
Main political parties. Ruling governmental coalitions. No policy histories.
16. Culture &
values Internet users (per 1000 people).
Religious, language, and ethnic
composition of the population. No policy histories.
3. Data collection, data preparation, and database development
3.1. Up to 2008
The data collection up to 2008 was conducted in a decentralised manner by national teams of
national statistical offices, research institutes, or research departments within statistical offices that
were involved in the GGP. It was carried out on the basis of specific guidelines, variable
definitions, and table templates provided in spread-sheets by the co-ordination team at the MPIDR
(Spielauer 2004b, 2007). The guidelines incorporated the recommendations made in the papers that
developed the conceptual framework and content of the database. They included all of the variables
and topics illustrated in Fig. 1 and a list of preferred international data sources. The data were
checked and published online by the CDB co-ordination team of the MPIDR. The web
implementation was realised as a static web application. This made it possible for users to navigate
by country and database topic. Users could access and download (in .HML, .XLS, or .CDL)
individual tables, which were complemented by variable definitions and links to corresponding
tables of other countries (Spielauer 2004b, 2007). As of December 2008, data were available for
nine countries: Bulgaria, Canada, Georgia, Hungary, Lithuania, Norway, Poland, Romania, and
Russia.
10
3.2. Developments between 2009-2012
One of the lessons learned from the database implementation process through the end of 2008 was
that the focus on decentralised data collection was making it difficult to compile cross-county
comparative data. The national data that were collected often did not comply with the variable
definition provided by the CDB co-ordination team, which interfered with the goal of making cross-
country comparative data available in the database. Moreover, the collection of data for more than
200 indicators created a substantial workload for the national experts. Database users were also
concerned with the functionality of the web application, as it did not allow them to visualise and
extract data for multiple countries simultaneously.
Financial support received from the EU 7th Framework Research Programme made it possible to
address and overcome these problems. In seeking solutions, the CDB co-ordination team of the
MPIDR6 established the following objectives:
1. Centralise specific parts of the data collection activities in order to increase the number of
indicators that are comparative across countries. The CDB indicators that had become
available in international web databases over the previous decade could be collected directly
by the central co-ordination team. In addition, the CDB team continued its efforts to
harmonise the data that had already been collected.
2. Collaborate with national representatives to increase the number of countries that submit
detailed national data to the CDB, and update the time series of the data that had already
been collected.
3. Improve the functionality of the database.
3.2.1. Increasing the number of comparative indicators
The CDB co-ordination team started off with a comprehensive variable-by-variable comparison of
the data that had already been collected for the following: cross-country comparability;
completeness of the time series; errors; deviation from the required definitions; and completeness of
the data sources, notes, and other documentation necessary to understand the variables, to
6 The co-ordination team was composed by Arianna Caporali (data harmonisation and documentation, review of
national data collections), Sebastian Klüsener (relations with national data collectors, concept development for the new
web environment, adviser in data harmonisation and documentation), Gerda Neyer (senior scientific advisor), Sandra
Krapf (coordination of student assistants), Olga Grigorieva (legal aspects linked to the dissemination of data obtained
from national and international sources), and Fred Heiden (programmer).

11
reconstruct them, and/or to find the proper sources to update them. The screening of each variable
was documented (see Appendix A), and a systematic overview was created to facilitate subsequent
corrections, updates, and efforts to further improve cross-country comparability.
The main finding that arose from the cross-country variable-by-variable comparison was that clear
and detailed guidelines and precise variables definitions were needed to provide the national expert
teams with instructions on which data should be collected, and on how to collect the data. The team
also found that a metadata documentation of the collected data was essential to ensure
comparability and transparency. This issue was of special concern because the CDB team had
decided to improve metadata access in the new database environment. Thus, in addition to giving
meta-information for each indicator, the new database environment also provides access to
metadata for each single data entry. This includes information on the source and quality flags. If, for
example, the data provided for some countries or regions deviates from the variable definition, this
is documented in the metadata information. A quality flag is also assigned to each indicator. The
flag is green for all of the indicators that contain only cross-country comparative data, while it is red
for those indicators that contain non-comparative data; the latter are, however, the exception.
Moreover, it was necessary to ensure that the regional data complied with the regions used to
geocode the place of residence and place of birth of the persons interviewed in the GGS, and with
other international regional coding schemes (i.e., NUTS and OECD). This was important because
the new web environment was designed to automatically link the extracted regional data with these
geocodes.
To ensure the highest levels of availability and comparability over as many countries and as much
time as possible, the data compiled by the national experts were contrasted with the data accessible
in international databases of supranational organisations (e.g., European Union, World Bank,
UNESCO, OECD, WHO) and databases of research consortia (e.g., Human Fertility Database, and
Human Mortality Database) (see Appendix B) for each variable in the CDB. In addition, the data
were compared with comparative data assembled by UNECE/ PU for inclusion in the CDB7. The
inventories of the main international comparative databases (Bisogno 2002; EDACwowe website;
Neyer 2003; Saraceno and Keck 2008; Spielauer 2004a; Thévenon 2008) were used as starting
points for identifying the relevant databases. This was done for each of the variables included in the
CDB. A schematic overview of this comparison was worked out (see Appendix A) to provide some
7 The collection was carried out by Luciano Lavecchia in September 2008.

12
insight into the extent to which the available international databases provided data for each indicator
that were based on the same definitions.
This comparison showed that the CDB offered much more data than other international databases in
some areas. For example, the CBD provided rich data at the sub-national regional level, long time
series for many indicators (as far back as the 1970s), and extensive coverage of Central and Eastern
European countries. However, for certain variables (e.g., in the areas of economy, labour market,
and unemployment), the data from the international databases allowed the team to replace
incomparable data with comparable data or to complement national data in the CDB with the
purpose to provide longer time series. Furthermore, international sources allowed the coordination
team to increase the number of variables and countries not yet included in the CDB. Therefore, the
team decided to extend the country coverage of the GGP-CDB to all countries in the UNECE region
(Europe and Central Asia) and to the GGP countries in North America, Asia, and Oceania. In
addition, the team decided to include a set of new variables available in international databases that
correspond to the GGS modules and sections. These data were collected ex-ante by the CDB co-
ordination team; the national collectors were then asked to compare and complement these data
with data from national sources, and to provide any missing data. For example, the CDB now
includes comparative policy indicators from Anne Gauthier’s Comparative Family Policy Database
that cover all OECD-countries.
Two main sets of improvements came from this work. First, the team decided to further improve the
guidelines for data collectors in order to increase the cross-country comparability of the indicators
provided in the database. Second, the data harmonisation and preparation process by the CDB co-
ordination team was modified.
3.2.2. New guidelines for national data collections
Definitions and references to international sources were revised for each variable (see Appendix C).
The collectors are now asked to provide national variable definitions, as well as extensive
references and information on national data sources. In order to make the data collection more
efficient, variables are identified for which data can be obtained centrally by the CDB team from
international sources. These data are included in the data collection sheets that are sent out to the
national experts. Depending on the available data, the national collaborators may be asked to check,
validate, or complement the data. The new guidelines are expected to substantially reduce the
workload of the national experts and to make the process of collecting and providing data more
13
efficient in terms of comparability across countries. The new template was presented and approved
at the GGP Consortium Board meeting in Paris in March 2011.
3.2.3. Improved data harmonisation and data preparation
The data harmonisation and preparation is carried out by the CDB co-ordination team with support
provided by student assistants employed at the MPIDR8. The decision regarding which variables
should be given priority in the harmonisation process is made in close collaboration with the
researchers involved in the GGP. A list of indicators of key importance for multi-level analyses
using GGS was discussed and approved at the Consortium Board meeting Paris in March 2011. The
board decided to focus the harmonisation efforts mostly on demographic and socio-economic
indicators, while postponing harmonisation activities for the majority of the policy indicators to a
later stage of the project.9
The data harmonisation consists of five phases. First, for a given indicator, the CDB team pulls
together all of the available data and metadata in a single spread-sheet file. This file includes data
and metadata provided by the national teams (when available), as well as data downloaded from the
selected international databases. For each source, metadata information on the data and the variable
definition are also collected. The student assistants help to organise all of the data in a single table
by years (in the rows) and sources (in the columns). This provides a comprehensive overview of all
of the available data for each indicator from each country, and makes it possible to compare data
from different sources.
Second, the team cross-checks all of the various sources and selects the best combinations. The
choice of data sources is determined by the following set of pre-established criteria: compliance
with GGP-CDB guidelines and with international standards, comparability across countries,
completeness, the spatial and temporal availability of the respective indicators, and the availability
of well-documented metadata information and of variable definitions. Two cases can be identified;
in both cases, the time series may be the result of combinations of different data sources:
1) For those variables related to the core competencies of the collaborating national institutions
and experts (e.g., demographic indicators), national sources provided by CDB national data
8 In alphabetic order: Jana Amtsberg, Maria Asmus, Ingrid-Erika Banciu, Matthias Dettendorfer, Michael Henke, Jonas
Richter-Dumke, Mathias Voigt. 9 This decision was made because several other international research teams were collecting policy data (particularly
policies related directly to family and fertility issues). Following discussions with these research teams, the CDB
decided to await their work rather than repeating work which was already being carried out by other researchers.

14
collectors are preferred, assuming they are available and are in compliance with the pre-
established set of criteria. If the time series contain gaps, an effort is made to fill them with
data from international sources that are comparable with the data provided by national
collectors. The same international sources are used to derive data for missing countries. This
method was, for example, implemented for demographic variables such as mean age at birth,
number of marriages, and mean age at first marriage (see Appendix D).
2) For indicators that are already harmonised and checked for comparability across countries
by databases of international organisations and/or research consortia (e.g., macro-
economic indicators and labour market variables) these international sources are preferred.
So that the data of international organisations could be included in the CDB, the team
obtained formal (legal) permission and authorisation to disseminate the data from these
organizations. Permission to disseminate was also sought from the research teams who
provided their data for the CDB.10
In order to cover the greatest possible number of
countries and years, it is sometimes necessary to combine a number of comparable sources.
To ensure data consistency, an effort is made to avoid using different sources across
countries for the same years. Visual representations and consistency checks are used in
making decisions about what data should be included in the database. National sources
provided by CDB national data collectors are used only for the countries that are missing in
international databases, and then only if their data are comparable with the data from other
countries, and are in compliance with the pre-established criteria. This has been done for
some Central and Eastern European countries. For example, this method has been applied
for indicators related to the gross domestic product, the consumer price index, poverty,
labour force participation, unemployment, and various public expenditures (e.g.,
expenditures on health, childcare, education, pensions, family allowances) (see Appendix
E).
The third phase of the data harmonisation process consists of organising the metadata information.
The metadata linked to each indicator include a definition of the data, a list of all of the national and
international sources used to derive the data, and general comments about the sources used and the
time series provided. As was mentioned above, the indicators are also marked with quality flags that
provide information about the cross-country comparability of the data provided. The meta-
10 The authors wish to thank all of the international organisations and research consortium and all of the GGP national
collection teams who have given us permission to disseminate their data.

15
information linked to each single data entry includes the following: information on the source,
usually with a link; the deviation from the general indicator definition, where applicable; and
information on the calculation/estimation procedures to derive the given number. Furthermore, for
each data entry, specific comments may provide information about any possible break in the series
due to revisions of data collections methods and/or changes in national and sub-national regional
boundaries.
In the fourth phase of the data harmonisation process, student assistants help to prepare and code all
of the collected data and metadata in order to upload it into the new database web environment.
Finally, the harmonised time series that have been built are revised following the submission of new
data collected by national teams. When applicable, the data in the harmonised data files are replaced
with the new data provided by national collectors.
3.2.4 The new Web interface and database functionality
The funding received by the EU 7th Framework Research Programme also allowed the coordination
team to improve the functionality of the CDB and to integrate it into the new official webpage of
the GGP programme (http://www.ggp-i.org). The new database environment is set up as a dynamic
system, based on a relational database (MS SQL Server). The web interface is programmed in
PERL using additional technologies (JavaScript, Ajax, and Flash). In contrast to the static system
that preceded it, the new system offers a dynamic choice of indicator values across countries,
regions, and time, as well as other selection features when available (e.g., age, sex). In addition, the
user can choose the dimensions of the output (e.g., to organise the data columns by regions, by time,
etc.) (see Appendix F).
As was mentioned above, unlike the majority of existing databases, the CDB provides not only
general indicator-wise metadata, but also meta-information for each single data entry. One way the
user can access this meta-information is by clicking on the data cell in the output. Another option
for accessing the meta-information linked to single data entries is offered to the user in the process
of defining the dimensions of the output. Here, the user can choose the ―Single value column incl.
meta data‖ output, which displays both the values and the meta-information in a single table. The
new database also offers to plot the data. Several dynamic plot options are available, including bar
plot, line plot, and pie plot. These plots are interactive, allowing the user to zoom in on specific time
periods, or to include or exclude countries and/or regions.
16
Another feature that makes the GGP-CDB database different from most other databases is its
dynamic geocoding and export function. For contextual data from countries and regions covered in
the GGP survey, the user can choose to include an ID column in the output that provides the
geocode used in the survey to identify the place of residence of an interviewed person. With this
code, the user should find it easy to match the extracted CDB data with the GGP survey data. In
addition to the GGP codes, other regional coding schemes, such as NUTS and OECD, are also
supported, which allows researchers to match the CDB data with data from other surveys (e.g., the
European Social Survey). Data can be exported in different formats (e.g., CSV, XLS, and XML).
4. Data availability as of January 2013
In accessing the CDB webpage, the user can choose between two options: the Contextual Database
(CDB) and the Contextual Data Collection (CDC). With a few exceptions, the Contextual Database
(CDB) contains only harmonised contextual variables. An overview table in Excel format
―Overview - Available Indicators per Country‖ provided on the webpage contains information on
data availability by indicators and countries. It also tells the user whether the data are available at
the national level only, or also at the regional level. As of January 2013, the database contains 93
indicators covering up to almost 60 countries in Europe, North America, Asia, and Oceania. The
time frame reaches as far back as possible (for most indicators, until 1970) and ends with the most
recent data obtainable at the time of data preparation. The available indicators are related to the
following 10 domains of the CDB: Demography, Economy and Social Aspects, Labour and
Employment, Unemployment, Childcare, Education, Health, Pension, Culture, Tax and Benefits.
The Contextual Data Collection (CDC) contains the complete national datasets with more than 200
indicators, which were collected by the national experts in the participating GGP countries. While
the CDC national datasets are not always comparative across countries, they are very rich in terms
of the national sources used, and they may be very useful in making regional comparisons within
countries. They also contain summaries of policy reforms and descriptions of economic and social
systems.
As of January 2013, the CDC contains 12 datasets available for download: Austria, Belgium,
Bulgaria, Canada, France, Georgia, Germany, Hungary, Lithuania, Norway, Romania, and Russia.

17
5. Conclusion
This paper provided an overview of the conceptual considerations and recent advances in the
implementation of the GGP Contextual Database. Although the database was primarily designed to
support multi-level research in demography, it may also be useful to researchers interested in
studying macro-level trends. The main characteristics of GGP-CDB are as follows: 1) it offers
regional-level data for nearly all its indicators; 2) it includes descriptions of key policy reforms
concerning almost all of its domains; 3) it contains harmonised time series comparable both across
countries and years for a substantial number of indicators; and 4) it makes available harmonised
time series in a dynamic, user-friendly web environment with innovative functionalities, both in
terms of metadata documentation and the automatic geocoding of national as well as regional data.
The co-existence of all these features in the GGP-CDB makes it a unique support tool for
researchers interested in the micro-macro linkages of social structures and processes. It might also
serve as a model for the development of contextual databases of other surveys.
In the future, the GGP-CDB will include an update of the indicators that have already been
harmonised, as well as a greater number of indicators that are comparable across countries. Efforts
will be made to harmonise policy histories. To learn more about how this can be done, the CDB
team will examine recent experiences with the establishment of international databases of policy
measures, such as the Multilinks Database on Intergenerational Policy Indicators (http://multilinks-
database.wzb.eu/) and the Population and Policy Database (PPD, http://www.demogr.mpg.de/cgi-
bin/databases/PPD/index.pli). The possibility of deriving aggregate data from GGS individual-level
data will also be explored. Eventually, the metadata might be adapted to meet international
standards of data documentation, such as the SDMX (Statistical Data and Metadata Exchange,
http://www.sdmx.org) (Gregory and Heus 2007).

18
References
Bisogno, E. (2002). UNECE data of possible interest to GGP Contextual Database. In GGP
Contextual database group: Activities and conclusions (23-26). Available at
http://www.unece.org/fileadmin/DAM/pau/_docs/ggp/2003/GGP_2003_IWG002_BgDocCDBWG.
pdf.
EDACwowe website (http://www.edac.eu). European Data Center for Work and Welfare.
Festy, P. (2001). Designing a Macro-Context for the G&G Individual Data. Paper presented at the
First Meeting of the Informal Working Group of the Generations and Gender Programme,
Budapest, Hungary, 24-25 September 2001. Available from the author: [email protected]
Festy P. (2002). From GGS to GGP; from micro- to macro- via meso- levels. Variables in the
survey [GGS] and in the contextual database [CDB]. In GGP Contextual database group: Activities
and conclusions (18-21). Available at
http://www.unece.org/fileadmin/DAM/pau/_docs/ggp/2003/GGP_2003_IWG002_BgDocCDBWG.
pdf.
Festy, P. (2004). GGP Contextual database group: first discussions, first conclusions. Available
from the author: [email protected]
Gregory , A., Heus, P. (2007). DDI and SDMX: Complementary, not Competing, Standards. Open
Data Foundation Papers.
Available at: http://www.opendatafoundation.org/papers/DDI_and_SDMX.pdf.
Goldscheider, F. K. (2000). Realizing the Potential of FFS1 with Contextual Data, Presentation at
the FFS Flagship Conference 2000. Available at
http://www.unece.org/fileadmin/DAM/pau/_docs/ffs/FFS_2000_FFConf_SolicGoldscheider.pdf
Macura, M. (2002). Executive Summary. The Generations and Gender Programme: A Study of the
Dynamics of Families and family Relationships. Available at
http://www.unece.org/fileadmin/DAM/pau/_docs/ggp/2003/GGP_2003_IWG002_BgDocProgrExe
cSumm.pdf.
Neyer G. (2002). Gender and Generations Dimensions in Welfare-State Policies. In GGP
Contextual database group: Activities and conclusions (5-10). Available at

19
http://www.unece.org/fileadmin/DAM/pau/_docs/ggp/2003/GGP_2003_IWG002_BgDocCDBWG.
pdf.
Neyer, G. (2003). Gender and Generations Dimensions in Welfare-State Policies, MPIDR Working
Paper WP 2003-022. Rostock: Max Planck Institute for Demographic Research. Available at
http://www.demogr.mpg.de/papers/working/wp-2003-022.pdf.
Racioppi, F. and G. Rivellini (2002). The Contextual Dimension in GGP: Some Methodological
Issues about Data Collection and Sampling Procedures In GGP Contextual database group:
Activities and conclusions (11-17). Available at
http://www.unece.org/fileadmin/DAM/pau/_docs/ggp/2003/GGP_2003_IWG002_BgDocCDBWG.
pdf.
Saraceno, C. and W. Keck. (2008). The Institutional Framework of Intergenerational Family
Obligations in Europe: A Conceptual and Methodological Overview. Wissenschaftszentrum Berlin
für Sozialforschung (WZB). First deliverable of work package 1 of the multilinks project funded by
the European Commission under the seventh framework programme. Available at: http://multilinks-
database.wzb.eu/pdf/conceptual-report.pdf
Spielauer, M. (2004a). The Contextual Database of the Generations and Gender Program:
Overview, Conceptual Framework and the Link to the Generations and Gender Survey, MPIDR
Working Paper WP 2004-014. Rostock: Max Planck Institute for Demographic Research. Available
at http://www.demogr.mpg.de/papers/working/wp-2004-014.pdf.
Spielauer, M. (2004b). The Generations and Gender Contextual Database: Concepts and Content,
MPIDR Working Paper WP 2004-026. Rostock: Max Planck Institute for Demographic Research.
Available at http://www.demogr.mpg.de/papers/working/wp-2004-026.pdf.
Spielauer, M. (2006). The Contextual Database of the Generations and Gender Program. MPIDR
Working Paper WP 2006-030. Available at: http://www.demogr.mpg.de/papers/working/wp-2006-
030.pdf.
Spielauer, M. (2007). PART TWO - The Contextual Database of the Generations and Gender
Programme. In United Nations, Generations and Gender Programme - Concepts and Guidelines
(33-44). New York/ Geneva: United Nations Publications. Available at:
http://www.unece.org/fileadmin/DAM/pau/_docs/ggp/2008/GGP_2008_Publ.pdf.

20
Thévenon O. (2008). Family Policy in Europe: Available databases and Initial Comparisons. Vienna
Yearbook of Population Research. 2008: 165-177.
Available at: http://hw.oeaw.ac.at/0xc1aa500d_0x001c9ea5.pdf.
United Nations (2000). Generations and Gender Programme: Exploring Future Research and Data
Collection Options. New York/ Geneva: United Nations Publications.
United Nations (2005). Generations and Gender Programme: Survey Instruments. New York/
Geneva: United Nations Publications.Availale at:
http://www.unece.org/pau/pub/ggp_survey_instruments.html.
United Nations (2007). Generations and Gender Programme: Concepts and Guidelines. New York/
Geneva: United Nations Publications. Available at:
http://www.unece.org/pau/pub/ggp_concepts_guidelines.html.
United Nations (2008). What UNECE does for you…UNECE works on the generations and gender
programme. New York/ Geneva: United Nations Publications. Available at;
http://www.unece.org/index.php?id=17623.
United Nations (2009). How generations and gender shape demographic change. Towards Policies
Based on Better Knowledge. Conference Proceedings. New York/ Geneva: United Nations
Publications. Available at: http://www.unece.org/pau/pub/ggp_conference_2009.html.
Vikat et al. (2007). Generations and Gender Survey (GGS): Towards a better understanding of
relationships and processes in the life course. Demographic Research 17 (14): 389–440. Available
at http://www.demographicresearch.org.
21
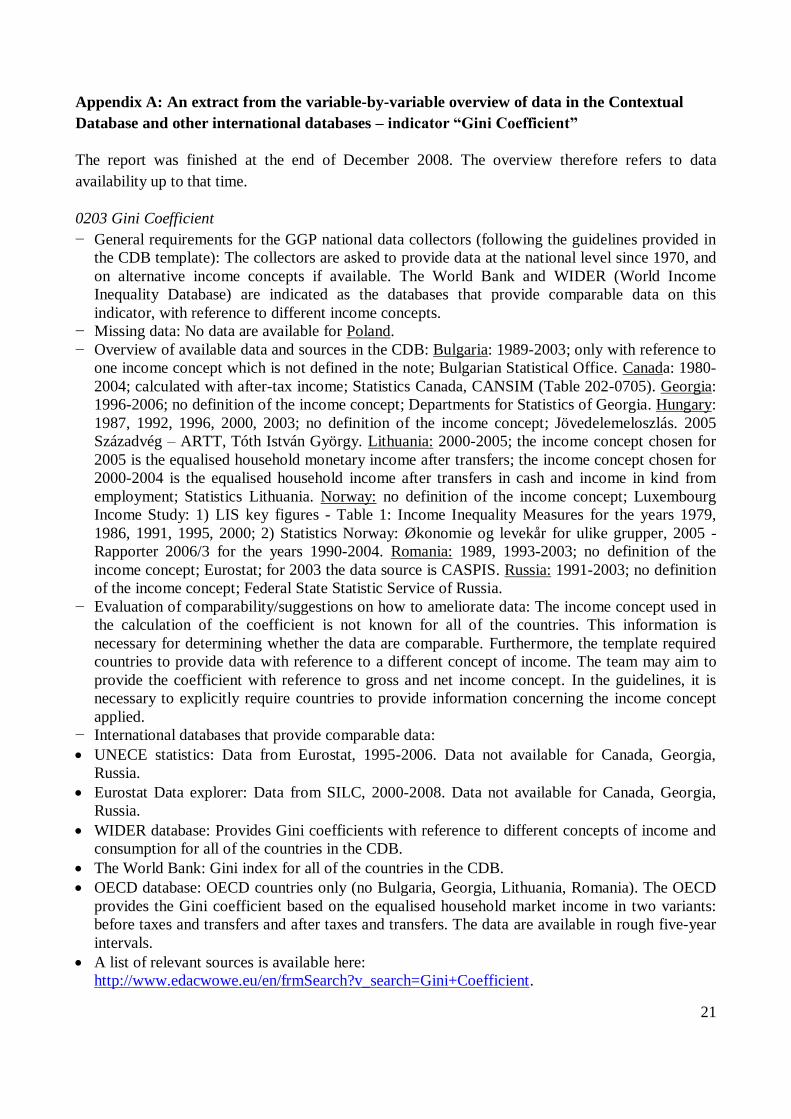
Appendix A: An extract from the variable-by-variable overview of data in the Contextual
Database and other international databases – indicator “Gini Coefficient”
The report was finished at the end of December 2008. The overview therefore refers to data
availability up to that time.
0203 Gini Coefficient
− General requirements for the GGP national data collectors (following the guidelines provided in
the CDB template): The collectors are asked to provide data at the national level since 1970, and
on alternative income concepts if available. The World Bank and WIDER (World Income
Inequality Database) are indicated as the databases that provide comparable data on this
indicator, with reference to different income concepts.
− Missing data: No data are available for Poland.
− Overview of available data and sources in the CDB: Bulgaria: 1989-2003; only with reference to
one income concept which is not defined in the note; Bulgarian Statistical Office. Canada: 1980-
2004; calculated with after-tax income; Statistics Canada, CANSIM (Table 202-0705). Georgia:
1996-2006; no definition of the income concept; Departments for Statistics of Georgia. Hungary:
1987, 1992, 1996, 2000, 2003; no definition of the income concept; Jövedelemeloszlás. 2005
Századvég – ARTT, Tóth István György. Lithuania: 2000-2005; the income concept chosen for
2005 is the equalised household monetary income after transfers; the income concept chosen for
2000-2004 is the equalised household income after transfers in cash and income in kind from
employment; Statistics Lithuania. Norway: no definition of the income concept; Luxembourg
Income Study: 1) LIS key figures - Table 1: Income Inequality Measures for the years 1979,
1986, 1991, 1995, 2000; 2) Statistics Norway: Økonomie og levekår for ulike grupper, 2005 -
Rapporter 2006/3 for the years 1990-2004. Romania: 1989, 1993-2003; no definition of the
income concept; Eurostat; for 2003 the data source is CASPIS. Russia: 1991-2003; no definition
of the income concept; Federal State Statistic Service of Russia.
− Evaluation of comparability/suggestions on how to ameliorate data: The income concept used in
the calculation of the coefficient is not known for all of the countries. This information is
necessary for determining whether the data are comparable. Furthermore, the template required
countries to provide data with reference to a different concept of income. The team may aim to
provide the coefficient with reference to gross and net income concept. In the guidelines, it is
necessary to explicitly require countries to provide information concerning the income concept
applied.
− International databases that provide comparable data:
UNECE statistics: Data from Eurostat, 1995-2006. Data not available for Canada, Georgia,
Russia.
Eurostat Data explorer: Data from SILC, 2000-2008. Data not available for Canada, Georgia,
Russia.
WIDER database: Provides Gini coefficients with reference to different concepts of income and
consumption for all of the countries in the CDB.
The World Bank: Gini index for all of the countries in the CDB.
OECD database: OECD countries only (no Bulgaria, Georgia, Lithuania, Romania). The OECD
provides the Gini coefficient based on the equalised household market income in two variants:
before taxes and transfers and after taxes and transfers. The data are available in rough five-year
intervals.
A list of relevant sources is available here:
http://www.edacwowe.eu/en/frmSearch?v_search=Gini+Coefficient.

22
Appendix B: Main international comparative sources examined.
− International databases of national and supranational organisations (in alphabetical order):
CIA (Central Intelligent Agency) – The World Factbook:
https://www.cia.gov/library/publications/the-world-factbook/
COE (Council of Europe) - Recent Demographic Trends:
http://www.coe.int/t/e/social_cohesion/population/demographic_year_book/
EDACO (European Data Center for Work and Welfare):
http://www.edac.eu/fswjpb/spits.edac.frmIndex
European Commission – Social protection systems MISSOC database:
http://ec.europa.eu/employment_social/missoc/db/public/compareTables.do?lang=en
European Observatory on Health Systems and Policies – Health System Reviews (HiTs):
http://www.euro.who.int/en/who-we-are/partners/observatory/health-systems-in-transition-
hit-series
EURYDICE - Information Network for Education:
http://eacea.ec.europa.eu/education/eurydice/eurybase_en.php
Eurostat - data explorer: http://epp.eurostat.ec.europa.eu
HDR (Human Development Report): http://hdr.undp.org/en/statistics/
ILO (International Labour Organisation) Databases: http://www.ilo.org/global/statistics-
and-databases/lang--en/index.htm
Nation Master: http://www.nationmaster.com/index.php
OECD – OECD. Stat: http://stats.oecd.org/index.aspx
OECD - Family Database:
http://www.oecd.org/document/4/0,3343,en_2649_34819_37836996_1_1_1_1,00.html
OECD - Social Expenditure Database (SOCX):
http://www.oecd.org/social/socialpoliciesanddata/socialexpendituredatabasesocx.htm
OECD – Tax Database:
http://www.oecd.org/document/60/0,3343,en_2649_34533_1942460_1_1_1_1,00.html
U.S. Social Security Administration - Social Security Programs Throughout the World:
http://www.socialsecurity.gov/policy/docs/progdesc/ssptw/
TransMonEE (Transformative Monitoring for Enhanced Equity):
http://www.transmonee.org
United Nations (UN) Statistical Division – UNdata explorer:
http://data.un.org/Explorer.aspx
United Nations Economic Commission for Europe (UNECE) Statistical Database:
http://w3.unece.org/pxweb/Dialog/.
UNO WIDER – United Nations University World Institute for Development Economics
Research: http://www.wider.unu.edu/research/Database/en_GB/database/
UNESCO Institute for Statistics: http://stats.uis.unesco.org
U.S. Census Bureau - International Data Base (IDB):
http://www.census.gov/ipc/www/idb/informationGateway.php
The World Bank: http://databank.worldbank.org

23
WHO HFA-DB (World Health Organisation - European health for all database):
http://data.euro.who.int/hfadb/
WHO WHOSIS (World Health Organisation - Statistical Information System):
http://apps.who.int/whosis/data
− International databases of research consortia (in alphabetical order):
CESifo (Centre for Economic Studies – Ifo institute) DICE - Database for Institutional
Comparisons in Europe: http://www.cesifo-group.de/ifoHome/facts/DICE.html
Clearinghouse on International Developments in Child, Youth and Family Policies at
Columbia University: http://www.childpolicyintl.org/
Comparative Family Policy Database: http://www.demogr.mpg.de/cgi-
bin/databases/FamPolDB/index.plx
GESIS – Leibniz Institute for the Social Sciences - EUSI European System of Social
Indicators: http://www.gesis.org/en/services/data/social-indicators/eusi/
Human Fertility Database: http://www.humanfertility.org/cgi-bin/main.php
Human Mortality Database: http://www.mortality.org/
Ined – Database on Developed Countries :
http://www.ined.fr/en/pop_figures/developed_countries_database
International Network on Leave Policy and Research – The annual reviews:
http://www.leavenetwork.org/archive_2005_2009/annual_reviews/
LIS (Luxembourg Income Study) Databases :
http://www.lisdatacenter.org/resources/other-databases/
Population and Policy Database: http://www.demogr.mpg.de/cgi-
bin/databases/PPD/index.pli
SCIP (Social Citizenship Indicator Program) at SOFI (Swedish Institute for Social
Research)
WRI (World Resources Institute) Earth Trends: http://www.wri.org/project/earthtrends/
24
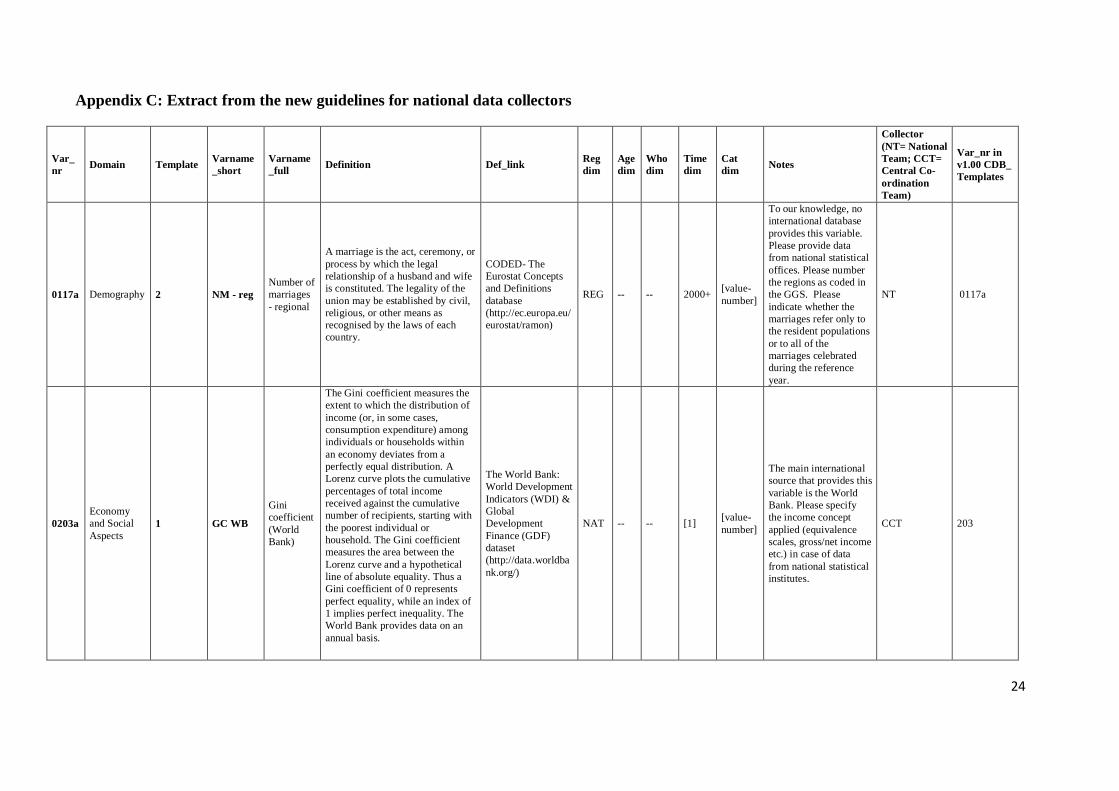
Appendix C: Extract from the new guidelines for national data collectors
Var_
nr Domain Template
Varname
_short
Varname
_full Definition Def_link
Reg
dim
Age
dim
Who
dim
Time
dim
Cat
dim Notes
Collector
(NT= National
Team; CCT=
Central Co-
ordination
Team)
Var_nr in
v1.00 CDB_
Templates
0117a Demography 2 NM - reg
Number of
marriages
- regional
A marriage is the act, ceremony, or
process by which the legal
relationship of a husband and wife
is constituted. The legality of the
union may be established by civil,
religious, or other means as
recognised by the laws of each
country.
CODED- The
Eurostat Concepts
and Definitions
database
(http://ec.europa.eu/
eurostat/ramon)
REG -- -- 2000+ [value-
number]
To our knowledge, no
international database
provides this variable.
Please provide data
from national statistical
offices. Please number
the regions as coded in
the GGS. Please
indicate whether the
marriages refer only to
the resident populations
or to all of the
marriages celebrated
during the reference
year.
NT 0117a
0203a
Economy
and Social
Aspects
1 GC WB
Gini
coefficient
(World
Bank)
The Gini coefficient measures the
extent to which the distribution of
income (or, in some cases,
consumption expenditure) among
individuals or households within
an economy deviates from a
perfectly equal distribution. A
Lorenz curve plots the cumulative
percentages of total income
received against the cumulative
number of recipients, starting with
the poorest individual or
household. The Gini coefficient
measures the area between the
Lorenz curve and a hypothetical
line of absolute equality. Thus a
Gini coefficient of 0 represents
perfect equality, while an index of
1 implies perfect inequality. The
World Bank provides data on an
annual basis.
The World Bank:
World Development
Indicators (WDI) &
Global
Development
Finance (GDF)
dataset
(http://data.worldba
nk.org/)
NAT -- -- [1] [value-
number]
The main international
source that provides this
variable is the World
Bank. Please specify
the income concept
applied (equivalence
scales, gross/net income
etc.) in case of data
from national statistical
institutes.
CCT 203

25
This update (1.10) of the previous version of the guidelines (v1.00 CDB_ Templates) includes two new
columns: 1) ―Collector (NT= National Team; CCT= Central Co-ordination Team)‖; and 2)―Var_nr in
v1.00 CDB_ Templates‖. The first of these new columns identifies whether the indicator can be provided
by the co-ordination team at the MPIDR, or whether the national collectors should collect these data. For
example, since the indicator 0117a ―Number of marriages – regional‖ does not appear to be available in
any international database, the national collectors are asked to provide this figure from the national
statistical offices. The national experts are provided with specific guidelines about the data required in the
columns ―Definition‖ and ―Note‖. Meanwhile, the indicator 0203 ―Gini Coefficient (World bank)‖ is
collected centrally by the team at the MPIDR from the World Bank database. However, if the indicator is
not available in the World Bank database for a country, the national collectors of that country will be
required to provide comparable data and the corresponding metadata that may allow the team to include
this country in the internationally comparable data series (see column ―Note‖).
The second of the new columns indicates the corresponding indicator number in the old templates. In the
current templates, new indicators have been introduced, and some indicators that were in the old
templates have been moved to a different domain.
26
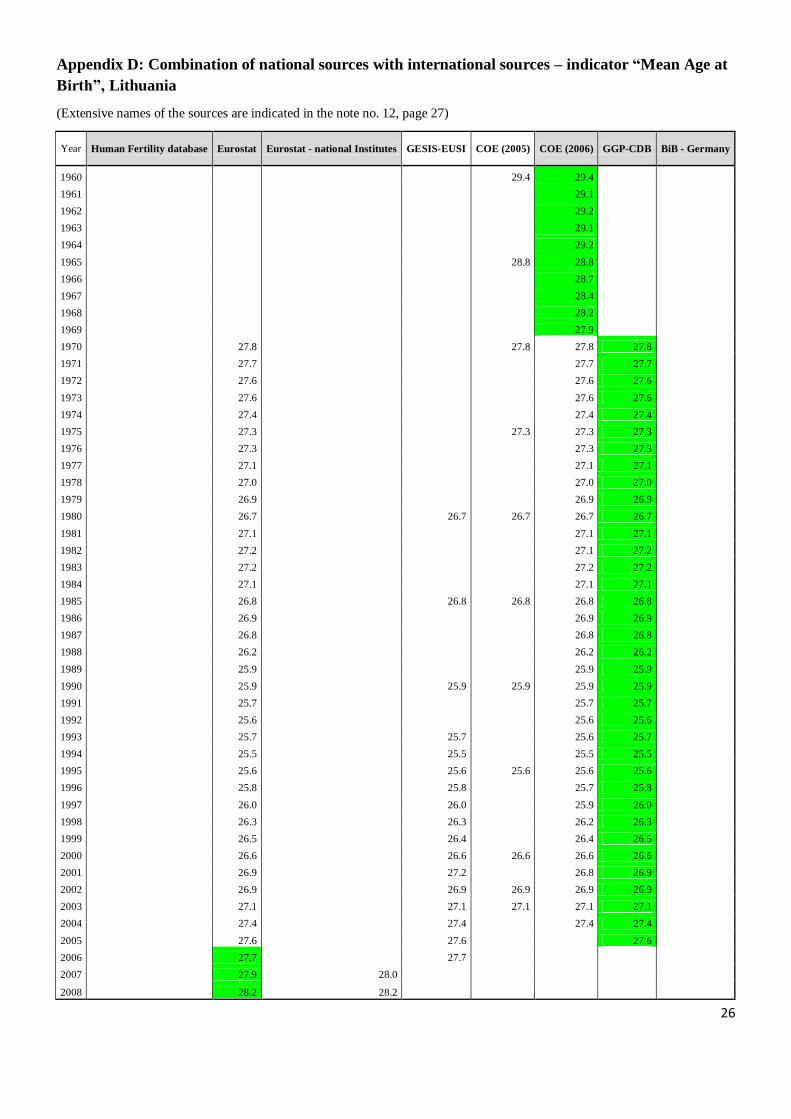
Appendix D: Combination of national sources with international sources – indicator “Mean Age at
Birth”, Lithuania
(Extensive names of the sources are indicated in the note no. 12, page 27)
Year Human Fertility database Eurostat Eurostat - national Institutes GESIS-EUSI COE (2005) COE (2006) GGP-CDB BiB - Germany
1960 29.4 29.4
1961 29.1
1962 29.2
1963 29.1
1964 29.2
1965 28.8 28.8
1966 28.7
1967 28.4
1968 28.2
1969 27.9
1970 27.8 27.8 27.8 27.8
1971 27.7 27.7 27.7
1972 27.6 27.6 27.6
1973 27.6 27.6 27.6
1974 27.4 27.4 27.4
1975 27.3 27.3 27.3 27.3
1976 27.3 27.3 27.3
1977 27.1 27.1 27.1
1978 27.0 27.0 27.0
1979 26.9 26.9 26.9
1980 26.7 26.7 26.7 26.7 26.7
1981 27.1 27.1 27.1
1982 27.2 27.1 27.2
1983 27.2 27.2 27.2
1984 27.1 27.1 27.1
1985 26.8 26.8 26.8 26.8 26.8
1986 26.9 26.9 26.9
1987 26.8 26.8 26.8
1988 26.2 26.2 26.2
1989 25.9 25.9 25.9
1990 25.9 25.9 25.9 25.9 25.9
1991 25.7 25.7 25.7
1992 25.6 25.6 25.6
1993 25.7 25.7 25.6 25.7
1994 25.5 25.5 25.5 25.5
1995 25.6 25.6 25.6 25.6 25.6
1996 25.8 25.8 25.7 25.8
1997 26.0 26.0 25.9 26.0
1998 26.3 26.3 26.2 26.3
1999 26.5 26.4 26.4 26.5
2000 26.6 26.6 26.6 26.6 26.6
2001 26.9 27.2 26.8 26.9
2002 26.9 26.9 26.9 26.9 26.9
2003 27.1 27.1 27.1 27.1 27.1
2004 27.4 27.4 27.4 27.4
2005 27.6 27.6 27.6
2006 27.7 27.7
2007 27.9 28.0
2008 28.2 28.2

27
For indicator 0107a, ―Mean Age at Birth‖ (at the national level), all of the sources indicated in grey in the
header of the table were selected11
. For Lithuania, the data highlighted in green were combined. The data
produced by Statistics Lithuania and provided to the CDB co-ordination team by the CDB national team
were chosen. The missing years were filled in with data taken from the Eurostat Statistics Database
(available at http://epp.eurostat.ec.europa.eu/) and data collections provided by the Council of Europe
(COE. Recent demographic developments in Europe 2005. Council of Europe Publishing. 2006. Data on
CD-Rom.) which were comparable to the data provided by the CDB national team. The selection was
done with the data available to the CDB co-ordination team as of September 2010.
11 In total, the following sources were considered: The Human Fertility Database (http://www.humanfertility.org/cgi-
bin/main.php), Eurostat - data explorer (http://epp.eurostat.ec.europa.eu), GESIS – Leibniz Institute for the Social Sciences -
EUSI European System of Social Indicators (http://www.gesis.org/en/services/data/social-indicators/eusi/), COE (Council of
Europe) - Recent Demographic Trends (http://www.coe.int/t/e/social_cohesion/population/demographic_year_book/), Council of Europe. Recent demographic developments in Europe 2005. Council of Europe Publishing. 2006. Data on CD-Rom,
Statistics Lithuania (http://www.stat.gov.lt/en/), BiB – Federal Institute for Population Research (http://www.bib-
demografie.de/EN/Home/home_node.html).
28
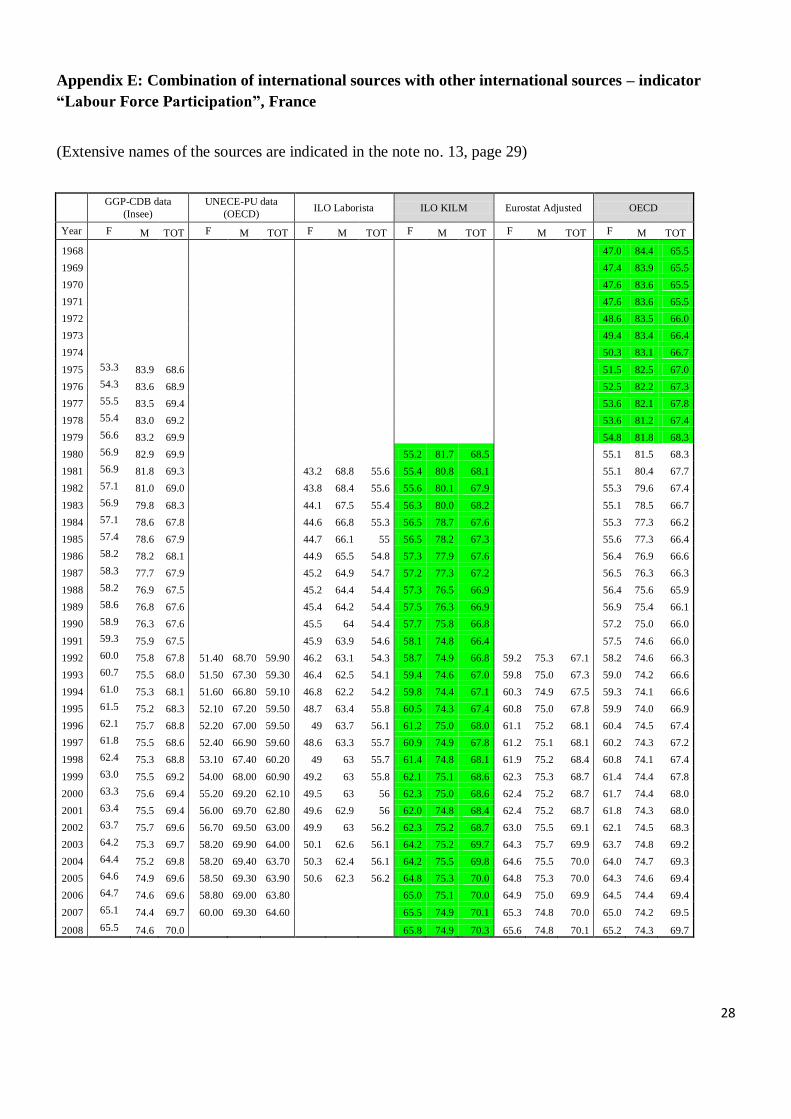
Appendix E: Combination of international sources with other international sources – indicator
“Labour Force Participation”, France
(Extensive names of the sources are indicated in the note no. 13, page 29)
GGP-CDB data
(Insee)
UNECE-PU data
(OECD) ILO Laborista ILO KILM Eurostat Adjusted OECD
Year F M TOT F M TOT F M TOT F M TOT F M TOT F M TOT
1968 47.0 84.4 65.5
1969 47.4 83.9 65.5
1970 47.6 83.6 65.5
1971 47.6 83.6 65.5
1972 48.6 83.5 66.0
1973 49.4 83.4 66.4
1974 50.3 83.1 66.7
1975 53.3 83.9 68.6 51.5 82.5 67.0
1976 54.3 83.6 68.9 52.5 82.2 67.3
1977 55.5 83.5 69.4 53.6 82.1 67.8
1978 55.4 83.0 69.2 53.6 81.2 67.4
1979 56.6 83.2 69.9 54.8 81.8 68.3
1980 56.9 82.9 69.9 55.2 81.7 68.5 55.1 81.5 68.3
1981 56.9 81.8 69.3 43.2 68.8 55.6 55.4 80.8 68.1 55.1 80.4 67.7
1982 57.1 81.0 69.0 43.8 68.4 55.6 55.6 80.1 67.9 55.3 79.6 67.4
1983 56.9 79.8 68.3 44.1 67.5 55.4 56.3 80.0 68.2 55.1 78.5 66.7
1984 57.1 78.6 67.8 44.6 66.8 55.3 56.5 78.7 67.6 55.3 77.3 66.2
1985 57.4 78.6 67.9 44.7 66.1 55 56.5 78.2 67.3 55.6 77.3 66.4
1986 58.2 78.2 68.1 44.9 65.5 54.8 57.3 77.9 67.6 56.4 76.9 66.6
1987 58.3 77.7 67.9 45.2 64.9 54.7 57.2 77.3 67.2 56.5 76.3 66.3
1988 58.2 76.9 67.5 45.2 64.4 54.4 57.3 76.5 66.9 56.4 75.6 65.9
1989 58.6 76.8 67.6 45.4 64.2 54.4 57.5 76.3 66.9 56.9 75.4 66.1
1990 58.9 76.3 67.6 45.5 64 54.4 57.7 75.8 66.8 57.2 75.0 66.0
1991 59.3 75.9 67.5 45.9 63.9 54.6 58.1 74.8 66.4 57.5 74.6 66.0
1992 60.0 75.8 67.8 51.40 68.70 59.90 46.2 63.1 54.3 58.7 74.9 66.8 59.2 75.3 67.1 58.2 74.6 66.3
1993 60.7 75.5 68.0 51.50 67.30 59.30 46.4 62.5 54.1 59.4 74.6 67.0 59.8 75.0 67.3 59.0 74.2 66.6
1994 61.0 75.3 68.1 51.60 66.80 59.10 46.8 62.2 54.2 59.8 74.4 67.1 60.3 74.9 67.5 59.3 74.1 66.6
1995 61.5 75.2 68.3 52.10 67.20 59.50 48.7 63.4 55.8 60.5 74.3 67.4 60.8 75.0 67.8 59.9 74.0 66.9
1996 62.1 75.7 68.8 52.20 67.00 59.50 49 63.7 56.1 61.2 75.0 68.0 61.1 75.2 68.1 60.4 74.5 67.4
1997 61.8 75.5 68.6 52.40 66.90 59.60 48.6 63.3 55.7 60.9 74.9 67.8 61.2 75.1 68.1 60.2 74.3 67.2
1998 62.4 75.3 68.8 53.10 67.40 60.20 49 63 55.7 61.4 74.8 68.1 61.9 75.2 68.4 60.8 74.1 67.4
1999 63.0 75.5 69.2 54.00 68.00 60.90 49.2 63 55.8 62.1 75.1 68.6 62.3 75.3 68.7 61.4 74.4 67.8
2000 63.3 75.6 69.4 55.20 69.20 62.10 49.5 63 56 62.3 75.0 68.6 62.4 75.2 68.7 61.7 74.4 68.0
2001 63.4 75.5 69.4 56.00 69.70 62.80 49.6 62.9 56 62.0 74.8 68.4 62.4 75.2 68.7 61.8 74.3 68.0
2002 63.7 75.7 69.6 56.70 69.50 63.00 49.9 63 56.2 62.3 75.2 68.7 63.0 75.5 69.1 62.1 74.5 68.3
2003 64.2 75.3 69.7 58.20 69.90 64.00 50.1 62.6 56.1 64.2 75.2 69.7 64.3 75.7 69.9 63.7 74.8 69.2
2004 64.4 75.2 69.8 58.20 69.40 63.70 50.3 62.4 56.1 64.2 75.5 69.8 64.6 75.5 70.0 64.0 74.7 69.3
2005 64.6 74.9 69.6 58.50 69.30 63.90 50.6 62.3 56.2 64.8 75.3 70.0 64.8 75.3 70.0 64.3 74.6 69.4
2006 64.7 74.6 69.6 58.80 69.00 63.80 65.0 75.1 70.0 64.9 75.0 69.9 64.5 74.4 69.4
2007 65.1 74.4 69.7 60.00 69.30 64.60 65.5 74.9 70.1 65.3 74.8 70.0 65.0 74.2 69.5
2008 65.5 74.6 70.0 65.8 74.9 70.3 65.6 74.8 70.1 65.2 74.3 69.7

29
For the indicator 0301, ―Labour Force Participation rate by sex‖ (at the national level), for all of the
countries the source indicated in grey in the header of the table was selected. The database ILO-KILM
(Key Indicators of the Labor Market) maintained by the International Labour Organisation (available at
http://www.ilo.org/empelm/what/WCMS_114240/lang--en/index.htm) was selected as the main source,
because it was the richest source in terms of number of countries and years covered which also provided
data comparable across countries. This choice was further determined by the fact that this source also
offered well-documented metadata on data processing and adjustment procedures. For the OECD
countries, such as for France, which is shown in the example12
, the missing years 1968-1979 were filled
with data from the OECD Databases (available at http://stats.oecd.org/).
12 For France, in addition to ILO-KILM and OECD, the following sources were considered:
1) Insee – Institut national de la statistique et des études économiques (http://www.insee.fr/fr/); this source was provided
by the national collector.
2) UNECE-PU data; data assembled by UNECE/ PU in September 2008 and made available, as part of the GGP, for inclusion in the CDB.
3) ILO Laborista (http://laborsta.ilo.org/).
4) Eurostat - European Labour Force Survey, adjusted series (http://epp.eurostat.ec.europa.eu).

30
Appendix F: Screenshots of the new Web interface
- Choosing indicators (demography section)

31
- Data output (with GGP geocodes and access to metadata for each single data entry)
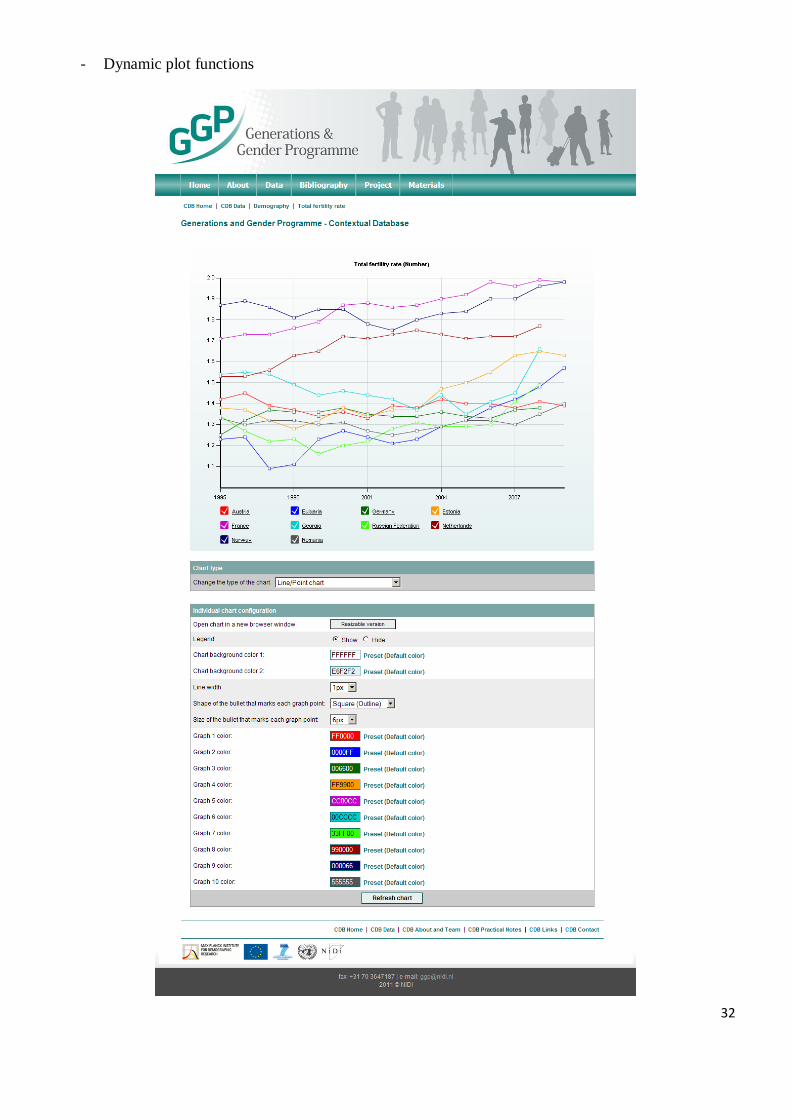
32
- Dynamic plot functions