
Protein expression in flat and depressed colorectal...
262
Protein expression in colorectal cancer EM Tweedle i PROTEIN EXPRESSION IN COLORECTAL CANCER Thesis submitted in accordance with the requirements of the University of Liverpool towards the Degree of Doctor of Medicine by Elizabeth Tweedle MBChB, MRCS (Eng) January 2011 Division of Surgery and Oncology, School of Cancer Studies, University of Liverpool.
-
Upload
phungtuong -
Category
Documents
-
view
223 -
download
0
Transcript of Protein expression in flat and depressed colorectal...

Protein expression in colorectal cancer EM Tweedle
i
PROTEIN EXPRESSION IN COLORECTAL
CANCER
Thesis submitted in accordance
with the requirements of the University of Liverpool
towards the Degree of Doctor of Medicine by
Elizabeth Tweedle
MBChB, MRCS (Eng)
January 2011
Division of Surgery and Oncology,
School of Cancer Studies,
University of Liverpool.

Protein expression in colorectal cancer EM Tweedle
ii
This MD thesis is dedicated to my father and step-mother, Mark and Annabel; my
mother Sandra; and my sisters Rachel and Jennifer, with thanks for their support.

Protein expression in colorectal cancer EM Tweedle
ii
ABSTRACT
Introduction: Colorectal cancer is the second most common UK cancer. Biomarkers which predict
survival may be valuable for targeting adjuvant therapy and can provide insights into tumour
biology. Small and early cancers are being diagnosed more commonly in the UK population due to
the introduction of population-based colorectal cancer screening in 2005. Analysis of resected small
(≤20mm across) tumours in Liverpool has established that flat and depressed morphology can
predict advanced stage at presentation. Proteomic analysis of small cancers was conducted with
the aim of generating biomarkers which correspond to morphology, stage and patient survival.
Patients and Methods: Laser capture microdissection was used to procure enriched matched
benign and malignant colorectal epithelial cell populations. Laser captured proteins were extracted
into lysis buffer, normalised against a reference standard, separated using 2D SDS-PAGE and
visualized with silver staining. Comparison was made between the tumour gels, (n=10) and
matched normal colonic gels, (n=9) by two different observers and gel analysis software, Progenesis
SameSpots. Differentially expressed proteins were identified using tandem mass spectrometry and
included redox proteins peroxiredoxin 2, peroxiredoxin 6 and SH3 binding glutamic acid-rich
protein-like 3; and cytoskeletal protein cofilin1. Also identified were the anti-apoptotic protein heat
shock protein 27 and inflammatory protein S100A8, which had been previously identified in 2D gel
analysis of undissected colorectal cancer in our Institution (n=12 gels) and previously validated in a
small cohort of paraffin-embedded colorectal cancers (n=98). In this study, HSP27 was further

Protein expression in colorectal cancer EM Tweedle
iii
evaluated in a large cohort of paraffin-embedded colorectal cancer tissue (n=404). S100A8 and
related proteins S100A9 and Smad4 were similarly evaluated in a large cohort (n=313).
Results: High HSP27 levels were strongly associated with poor cancer-specific survival in rectal
cancer (n=205, P=0.0063) but not colon cancer; (n=199, P=0.7385). Multivariate Cox regression
confirmed nodal metastases (P=0.0001) and HSP27 expression (P=0.0233) as independent markers
of survival in rectal cancer. HSP27 levels remained unchanged in the majority of cases 65/80 (81%)
between diagnostic biopsies and matched surgical samples, regardless of whether patients had
undergone preoperative radiotherapy.
S100A8 expression co-localised with a subset of S100A9-positive monocytes. S100A9 was co-
expressed with CD14 in tumour-associated monocytes, but not with CD68 in tissue macrophages.
Smad4 was expressed in the tumour cytoplasm of 262/304 (14%) tumours. Loss of Smad4
expression correlated with a reduction in the stromal S100A8-positive, but not S100A9-positive cell
count, (P=0.034, Mann-Whitney U test) and was associated with a poorer overall survival in
patients with stage I-II disease, but not stage III disease. Antibodies to cofilin1 and cofilin-
phospho(ser3) were assessed in colorectal cancer cell and tissue lysate and found to be specific on
1D and 2D western blot.
Conclusion: Elevated HSP27 is an independent marker of poor prognosis in rectal cancer whose
expression is not altered by neo-adjuvant radiotherapy. Smad4-negative tumours are associated
with fewer infiltrating S100A8 positive stromal monocytes. In node-negative tumours, loss of
Smad4 expression in associated with a poorer prognosis. These findings provide a sound platform
for further investigation of both S100A8 and HSP27 proteins in colorectal cancer.

Protein expression in colorectal cancer EM Tweedle
iv
ACKNOWLEDGEMENTS
I would like to thank the following people:
My supervisors, Dr Eithne Costello, Dr Bill Greenhalf and Mr Paul Rooney
Mr Ilyas Khattak for allowing me access to images from 2D gels of undissected colorectal cancers he
produced in the Division of Surgery and Oncology and for access to Heat Shock Protein 27 staining
data from the first 98 patients on the tissue microarray
Dr Chris Thompson for developing the methodology for laser capture microdissection and 2D SDS-
PAGE
Dr Sara Tonack, Dr Mark Aspinall-O’Dea and Dr Taoufik Nedjadi for their instruction in 1D western
blot, cell culture and protein identification
Dr Roz Jenkins, Dr Neil Kitteringham, Professor Kevin Park in the Department of Pharmacology and
Therapeutics for instruction in 2D electrophoresis and western blotting and for tandem mass
spectrometry identification of protein spots
Anne Anderson and Helen Kalirai in the Cancer Tissue Bank Research Centre, CTBRC
Andy Dodson for the immunohistochemistical staining and instruction
Dr Bahram Azadeh and Dr Monica Terlizzo for their expert assistance in scoring the microarrays
Professor Neoptolemos for giving me the opportunity to work in the Division of Surgery and
Oncology

Protein expression in colorectal cancer EM Tweedle
v
ABBREVIATIONS
2DE Two-dimensional electrophoresis
5FU 5-fluorouracil
µg Microgram
µl Microlitre
µM Micromolar
:C degrees Celsius
ACG American College of Gastroenterologists
ACN Acetonitrile
AJCC American Joint Committee on Cancer
AMH Anti-mullerian hormone
APC Adenomatous polyposis coli
APS ammonium persulphate
ATM Ataxia-telangiectasia mutated gene
AUC Area under curve
BCA Bicinchoinic acid
BCL2 B-cell lymphoma 2
BMP Bone morphogenic protein

Protein expression in colorectal cancer EM Tweedle
vi
BRCA Breast cancer associated
BSG British Society of Gastroenterologists
C Cytosine
CA19-9 Carbohydrate antigen 19-9
CA242 Carbohydrate antigen 242
CCD Charged couple device
Cdc2 Cell division cycle 2
CDK Cyclin dependant kinase
CEA Carcinoembryonic antigen
CHAPS 3-(3-cholamidopropyldimethylammonio-1-propane) sulphate
CHRPE Congenital hypertrophy of retinal pigment epithelium
CI Confidence interval
CID Collision induced decomposition
CIMP CpG-island methylator phenotype
CIN Chromosomal instability
CRC Colorectal cancer
CRM Circumferential resection margin
CT Computed tomography
DCBE Double contrast barium enema
DCC Deleted in colorectal cancer

Protein expression in colorectal cancer EM Tweedle
vii
DIGE Difference in-gel electrophoresis
DNA Deoxyribonucleic acid
Dpi dots per inch
DSH Dishevelled
dTMP Deoxythymidine monophosphate
DTT Dithiothreitol
dUMP Deoxyuridine monophosphate
EDTA Ethylendiaminetetraacetic acid
EGF Epidermal growth factor
EGFR Epidermal growth factor receptor
EGTM European Group on Tumour Markers
EMR Endoscopic mucosal resection
ESI Electrospray ionization
EVI Extramural vascular invasion
FA folinic acid
FACS Flourescence activated cell sorting
FAP Familial adenomatous polyposis
FGF2 Fibroblast growth factor 2
fmol femtomole (10-15M)
FOBT Faecal occult blood test

Protein expression in colorectal cancer EM Tweedle
viii
FTICR Fourier transform ion cyclotron
G Guanine
GDF Growth and differentiation factors
GDP Guanidine diphosphate
GI Gastrointestinal
GRX Glutaredoxins
GSK3β Glycogen synthase kinase 3- beta
GTP Guanidine triphosphate
H Hydrogen
H&E Haematoxylin and eosin
HCl Hydrochloric acid
HNPCC Hereditary Non-polypoid Colorectal Cancer
HR Hazard ratio
HSP27 Heat shock protein 27
HSE Heat shock element
HSF1 Heat shock factor 1
ICAT Isotope coded affinity tags
id Internal diameter
IEF Isoelectric focusing
IFL irinotecan/fluorouracil/leucovorin chemotherapy

Protein expression in colorectal cancer EM Tweedle
ix
IHC Immunohistochemistry
IPG Immobilised pH gradient
IRA Ileorectal anastomosis
iTRAQ Isobaric tags for relative and absolute quantification
JRSC Japanese Research Society on Colon Cancer
kDa KiloDaltons
L Deuterium
LC Liquid chromatography
LC-MS Liquid chromatography plus mass spectrometry
LCM Laser Capture microdissection
M Molar
ml Mililitre
MALDI Matrix assisted laser desorption ionization
Mdm2 Murine double minute 2
MGMT 0-6-methylguanine DNA methyltransferase
min Minute
mM Milimolar
MMP2 Metalloproteinase 2

Protein expression in colorectal cancer EM Tweedle
x
MMR Mis-match repair
ms Milisecond
MS Mass spectrometry
MSI Microsatellite instability
MSI-H High level microsatellite instability
MSI-L Low level microsatellite instability
MS/MS Tandem mass spectrometry
mW Miliwatt
NBS1 Nijmegen breakage syndrome 1
NCBI National Center for Biotechnology Information
NICE National institute for clinical excellence
NCI National cancer institute
ng Nanogram
PAGE Polyacrylamide gel electrophoresis
PBS Phosphate buffered saline
PMF Peptide mass fingerprinting
Prx Peroxiredoxin
PTEN Phosphate and tensin homolog gene

Protein expression in colorectal cancer EM Tweedle
xi
RAGE Receptor for advanced glycation end products
RB Retinoblastoma
Rcf Relative centrifugal force
RNA Ribose nucleic acid
ROC Receiver operating characteristic
ROS Reactive oxygen species
RR Relative risk
s Second
SDS Sodium dodecyl sulphate
SH3BGRPL3 SH3 binding glutamic acid rich protein like-3
SIL Stable isotope labelling
SPARC Secreted protein, acidic and rich in cysteines
TAM Tissue associated macrophage
TCF T- cell factor
TEM Transanal endoscopic microsurgery
TEMED N,N,N’,N’ – tetramethylethylenediamine
TFA Trifluoroacetic acid
TGFβ Transforming Growth Factor-beta
TIFF Tagged image file format
TIMP Tissue inhibitor of matrix metalloproteinase

Protein expression in colorectal cancer EM Tweedle
xii
TIP-B1 Tumour necrosis factor inhibitory protein – B1
TMA Tissue microarray
TNFα Tumour necrosis factor-alpha
TNM Tumour/Nodes/Metastases
Tof Time of flight
TPA Tissue polypeptide antigen
TPS Tissue polypeptide specific antigen
Tris tris(hydroxymethyl)aminomethane
TS Thymidylate synthase
US Ultrasound
V Volt
VEGF Vascular endothelial growth factor
w/v weight per volume

Protein expression in colorectal cancer EM Tweedle
xiii
TABLE OF CONTENTS
ABSTRACT ............................................................................................................................................... II
ACKNOWLEDGEMENTS ......................................................................................................................... IV
ABBREVIATIONS ..................................................................................................................................... V
TABLE OF CONTENTS ........................................................................................................................ XIII
LIST OF FIGURES .................................................................................................................................. XX
LIST OF TABLES ............................................................................................................................... XXVII
1. INTRODUCTION ........................................................................ 1
1.1 COLORECTAL ADENOCARCINOMA: INCIDENCE AND SURVIVAL .................................................. 1
1.2 COLORECTAL ADENOCARCINOMA: PROGNOSIS ............................................................................ 2
1.2.1 Staging .............................................................................................................................. 3
1.2.2 Excision margins .......................................................................................................... 6
1.2.3 Histological grade ........................................................................................................ 6
1.2.4 extramural vascular invasion and lymphatic invasion ................................. 7
1.2.5 Perineural invasion ..................................................................................................... 7
1.2.6 Tumour border configuration................................................................................. 7
1.3 MERSEYSIDE AND THE NORTH WEST .......................................................................................... 8
1.4 GENETIC PREDISPOSITION TO COLORECTAL CANCER .............................................................. 12
1.4.1 Hereditary Non-polyposis Colorectal Cancer, HNPCCC ............................. 13
1.4.2 Familial adenomatous polyposis, FAP .............................................................. 15

Protein expression in colorectal cancer EM Tweedle
xiv
1.4.3 hamartomatous polyposis syndromes ............................................................. 16
1.5 DEVELOPMENT OF SPORADIC COLORECTAL CANCER ............................................................... 16
1.5.1 Chromosomal instability: the adenoma-carcinoma sequence ................ 16
1.5.1.1 The Wnt pathway .................................................................................................................................................................. 18
1.5.1.2 RAS/RAF pathway ................................................................................................................................................................. 20
1.5.1.3 18q ............................................................................................................................................................................................... 21
1.5.1.4 p53 ............................................................................................................................................................................................... 22
1.5.2 Microsatellite instability, MSI .............................................................................. 24
1.6 DIAGNOSIS: POPULATION-BASED COLORECTAL CANCER SCREENING .................................... 27
1.6.1 Colonoscopy ................................................................................................................ 27
1.6.2 Flexible Sigmoidoscopy .......................................................................................... 29
1.6.3 Double-Contrast Barium Enema, DCBE ........................................................... 30
1.6.4 CT colonography ....................................................................................................... 31
1.6.5 Guaiac Faecal Occult Blood testing, G-FOBT .................................................. 31
1.6.6 Faecal DNA testing ................................................................................................... 32
1.7 MANAGEMENT OF COLORECTAL CANCER: THE RATIONALE FOR TREATMENT...................... 33
1.7.1 Surgery .......................................................................................................................... 33
1.7.2 Adjuvant chemotherapy ......................................................................................... 34
1.7.3 Adjuvant radiotherapy ........................................................................................... 35
1.7.4 New adjuvant treatment modalities .................................................................. 35
1.8 EARLY COLORECTAL CANCER: MANAGEMENT OPTIONS .......................................................... 36
1.8.1 Transanal Endoscopic Microsurgery (TEM) .................................................. 37

Protein expression in colorectal cancer EM Tweedle
xv
1.8.2 Endoscopic Mucosal resection (EMR) and Snare-polypectomy ............. 38
1.9 FLAT AND DEPRESSED-TYPE COLORECTAL CANCER ................................................................ 39
1.9.1 Morphological classification of colorectal lesions ....................................... 39
1.9.2 Flat and depressed lesions: incidence .............................................................. 40
1.9.3 Flat and depressed lesions: detection .............................................................. 43
1.9.4 Flat and depressed tumours: liverpool experience ..................................... 43
1.9.4.1 Materials and Methods ........................................................................................................................................................ 43
1.9.4.2 Results ........................................................................................................................................................................................ 44
1.9.5 Flat and depressed lesions: molecular biology ............................................. 47
1.10 OVERVIEW OF PROTEOMICS ..................................................................................................... 50
1.10.1 Sample storage ........................................................................................................ 50
1.10.2 Purification ............................................................................................................... 51
1.10.3 Separation and visualisation ............................................................................. 54
1.10.3.1 Gel-based ................................................................................................................................................................................ 54
1.10.3.2 Non-gel based techniques ............................................................................................................................................... 57
1.10.4 Protein identification ............................................................................................ 58
1.10.4.1 Ion production, (MALDI and ESI) ................................................................................................................................ 58
1.10.4.2 Ion separation and analysis ........................................................................................................................................... 59
1.11 PROTEIN MARKERS IN COLORECTAL CANCER ........................................................................ 60
1.11.1 Carcinoembryonic antigen (CEA) .................................................................... 62
1.11.2 carbohydrate antigen 19-9 (CA19-9) ............................................................. 63
1.11.3 carbohydrate antigen 242 (CA242) ................................................................ 63

Protein expression in colorectal cancer EM Tweedle
xvi
1.11.4 tissue polypeptide antigen (TPA) and Tissue Polypeptide Specific Antigen (TPS) 64
1.11.5 tissue inhibitors of metalloproteinases (TIMP-1) ..................................... 64
1.11.6 Thymidylate synthase (TS) ................................................................................ 65
1.11.7 Microsatellite instability (MSI) ......................................................................... 66
1.11.8 p53 ............................................................................................................................... 66
1.11.9 K-RAS ........................................................................................................................... 67
1.12 AIMS AND OBJECTIVES ............................................................................................................. 69
2. MATERIAL AND METHODS .................................................70
2.1 TISSUE PREPARATION ................................................................................................................. 70
2.2 IDENTIFICATION OF SAMPLES .................................................................................................... 71
2.3 SECTIONING AND STAINING OF SAMPLES .................................................................................. 73
2.4 LASER CAPTURE MICRODISSECTION .......................................................................................... 74
2.5 ESTIMATION OF SAMPLE PROTEIN CONCENTRATIONS ............................................................ 77
2.5.1 Reference sample preparation ............................................................................ 78
2.5.2 Comparison with LCM-derived samples .......................................................... 78
2.6 IEF AND SECOND DIMENSION SDS-PAGE............................................................................... 80
2.6.1 Immobilised pH Gradient (IPG) strip rehydration ...................................... 80
2.6.2 Iso-electric focusing (IEF) ..................................................................................... 81
2.6.3 Equilibration and second dimension separation ......................................... 81
2.7 STAINING OF POLYACRYLAMIDE GELS ....................................................................................... 82
2.7.1 Colloidal Coomassie blue staining ...................................................................... 82

Protein expression in colorectal cancer EM Tweedle
xvii
2.7.2 Silver staining ............................................................................................................. 82
2.7.3 Gallyas Protein Staining of SDS-PAGE Gels ..................................................... 84
2.8 SCANNING AND ANALYSIS OF GELS ............................................................................................. 84
2.9 IDENTIFICATION OF PROTEINS BY LC-MS/MS ....................................................................... 85
2.10 CELL LINES AND WESTERN BLOTTING ................................................................................... 86
2.10.1 Cell lines and cell culture .................................................................................... 86
2.10.2 1D Western blot ..................................................................................................... 87
2.10.3 2D Western blot ..................................................................................................... 87
2.11 VALIDATION OF DIFFERENTIALLY EXPRESSED PROTEINS .................................................... 88
2.11.1 Generation of paraffin-embedded formalin-fixed colorectal cancer tissue 88
2.11.2 Immunohistochemistry and co-immunofluorescence............................. 89
2.11.3 Microarray scoring and analysis ...................................................................... 91
2.11.4 Statistical analysis .................................................................................................. 92
3. RESULTS ....................................................................................93
3.1 SILVER-STAINING OF GELS .......................................................................................................... 93
3.1.1 Comparison of silver-staining protocols ......................................................... 93
3.1.2 Determination of reference protein standard ............................................... 94
3.2 GEL ANALYSIS ............................................................................................................................... 99
3.2 IDENTIFICATION OF PROTEIN SPOTS ...................................................................................... 109
3.3 VALIDATION OF DIFFERENTIALLY-EXPRESSED PROTEINS .................................................... 112
3.4 SH3 DOMAIN-BINDING GLUTAMIC ACID-RICH-LIKE PROTEIN 3 ......................................... 113

Protein expression in colorectal cancer EM Tweedle
xviii
3.4.1 Introduction .............................................................................................................. 113
3.4.2 Validation of SH3BGRPL3 .................................................................................... 114
3.5 PEROXIREDOXINS II AND VI .................................................................................................... 116
3.5.1 Introduction .............................................................................................................. 116
3.5.2 Results of Prx-VI analysis .................................................................................... 120
3.6 HEAT SHOCK PROTEIN 27 ...................................................................................................... 122
3.6.1 Introduction .............................................................................................................. 122
3.6.2 HSP27 is a promising target for validation in colorectal cancer .......... 125
3.6.3 Patient Demographics ........................................................................................... 126
3.6.4 HSP27 intensity more predictive of survival than percentage of stained cells
................................................................................................................................................... 128
3.6.5 HSP27 does not correlate with stage at presentation or metastases . 130
3.6.6 HSP27 status independently predicts survival in rectal cancer ........... 132
3.6.7 Multivariate analysis of survival ....................................................................... 135
3.6.8 Relationship between HSP27 expression and neo-adjuvant treatment137
3.6.9 Neo-adjuvant therapy is not associated with overall survival .............. 138
3.7 COFILIN1 AND COFILIN-PHOSPHO(SER3) ............................................................................. 140
3.7.1 Introduction .............................................................................................................. 140
3.7.2 Cofilin and cofilin-phospho(ser3) expressed in colorectal cancer cell lysate
................................................................................................................................................... 145
3.7.3 Confirmation of spot identity using 2D western blotting in cell lines and tissue
................................................................................................................................................... 147

Protein expression in colorectal cancer EM Tweedle
xix
3.7.4 Detection of cofilin1 and in paraffin-embedded colorectal tissue ....... 150
3.8 S100A8 .................................................................................................................................... 153
3.8.1 Introduction .............................................................................................................. 153
3.8.2 Distribution of S100A8 and S100A9 at immunohistochemistry .......... 156
3.8.3 Quantification of S100A8, S100A9 and Smad4 expression .................... 159
3.8.4 Loss of Smad4 expression is related to stromal levels of S100A8 ...... 160
3.8.5 Relationship of Smad4 tumour expression and S100A8 and S100A9 stromal
expression with clinicopathological parameters .................................................. 162
3.8.6 Association between numbers of stromal S100A8 and S100A9-positive cells and
cancer-specific survival ................................................................................................... 165
3.8.7 Loss of Smad4 expression predicts for poor survival in some patient groups
................................................................................................................................................... 167
4. DISCUSSION ........................................................................... 169
4.1 PROTEINS IDENTIFIED USING LASER CAPTURE AND 2D GEL ANALYSIS .............................. 170
4.2 HEAT SHOCK PROTEIN 27 ...................................................................................................... 171
4.3 COFILIN1 ................................................................................................................................... 175
4.4 S100A8 .................................................................................................................................... 177
4.5 FINAL CONCLUSION ................................................................................................................... 183
4.6 AREAS OF FUTURE RESEARCH ................................................................................................. 184
5. REFERENCES ......................................................................... 186

Protein expression in colorectal cancer EM Tweedle
xx
LIST OF FIGURES
FIGURE 1.1: STAGING OF COLORECTAL CANCER. DEPICTS TUMOUR INFILTRATION THROUGH BOWEL WALL (T-STAGE), LYMPH
NODE METASTASES (N-STAGE) AND DISTANT METASTASES (M-STAGE). IMAGES ADAPTED FROM THE CARVER COLON
CANCER SURGICAL CENTRE (HTTP://WWW.CARVERCLINIC.COM/INDEX.PHP) AND CHICAGO’S NORTHSIDE COLON &
RECTAL CLINIC (HTTP://CNSCRC.COM/COLON_AND_RECTAL_SCREENING). ............................................................... 4
FIGURE 1.2: OVERALL SURVIVAL ACCORDING TO DUKES’ STAGE IN N=662 PATIENTS WITH RESECTABLE COLORECTAL CANCER
OPERATED BETWEEN 1999 AND 2004. ............................................................................................................. 10
FIGURE 1.3: THE ADENOMA-CARCINOMA SEQUENCE. THE TRANSITION FROM NORMAL COLONIC EPITHELIUM THROUGH
ADENOMA TO CARCINOMA. THE INCREASING LOSS OF CELLULAR DIFFERENTIATION AND CAPACITY TO METASTASISE
CORRESPOND TO THE ACCUMULATION OF GENETIC MUTATIONS DESCRIBED BY VOGELSTEIN. IMAGE ADAPTED FROM
FEARON ER, VOGELSTEIN B. CELL, VOL. 61, 759-767......................................................................................... 17
FIGURE 1.4: PUTATIVE PATHWAYS IN THE DEVELOPMENT OF COLORECTAL CANCER. MULTIPLE PATHWAYS OF DEVELOPMENT
ARE SHOWN INCLUDING GERMLINE MUTATION, CHROMOSOMAL INSTABILITY (CIMP-NEGATIVE) AND MICROSATELITE
INSTABILITY (CIMP-POSITIVE) PATHWAYS. IMAGE ADAPTED FROM JASS JR. SURG ONCOL. 2007 DEC;16 SUPPL 1:S7-9.
EPUB 2007 NOV 26. ...................................................................................................................................... 26
FIGURE 1.5: JRSC CLASSIFICATION OF COLORECTAL CANCER MORPHOLOGY. POLYPOID, FLAT AND DEPRESSED CANCER TYPES ARE
DEPICTED IN RELATION TO LEVEL OF NORMAL COLONIC MUCOSA. IMAGE ADAPTED FROM KUDO, S ET AL. WORLD J SURG
21, 694-701 (1997). .................................................................................................................................... 40
FIGURE 1.6: T-STAGE OF SMALL COLORECTAL CANCERS ACCORDING TO MORPHOLOGY. SHOWS NUMBERS OF TUMOURS IN
EACH GROUP AND PROPORTION WITH NODAL OR DISTANT METASTASES. ................................................................. 47
FIGURE 1.8: SCHEMATIC REPRESENTATION OF LASER-CAPTURE MICRODISSECTION (FROM MR ALI SHEKOUH) ....................... 53
FIGURE 2.1: H&E STAINED FROZEN SECTIONS FROM TUMOUR TISSUE ACCORDING TO MORPHOLOGY ................................ 72
FIGURE 2.2: LASER CAPTURE MICRODISSECTION OF COLONIC TUMOUR AND NORMAL COLONIC EPITHELIUM FORM THE SAME
PATIENT ....................................................................................................................................................... 77
FIGURE 2.3: RELATIVE QUANTIFICATION OF LASER CAPTURED MATERIAL. LANES OUTLINED IN RED REPRESENT REFERENCE
STANDARD. LANES OUTLINED IN GREEN CORRESPOND TO MATCHED DILUTION OF LCM MATERIAL ............................... 80
FIGURE 2.4: MATCHED LASER-CAPTURED SILVER-STAINED 2D GEL OF TUMOUR TISSUE LYSATE TO UNDISSECTED COOMASSIE
STAINED 2D GEL OF SAME TUMOUR TISSUE. LINES CONVERGE ON PROTEIN SPOT OF INTEREST (CIRCLED) AND WERE
REFERENCED TO OTHER PROTEIN SPOTS (ARROWED) IN ORDER TO ACCURATELY LOCATE. ........................................... 86

Protein expression in colorectal cancer EM Tweedle
xxi
FIGURE 3.1: REFERENCE PROTEIN SOLUTION PRODUCED FROM WHOLE TUMOUR LYSATE (SECTION 2.5.1) IN SERIAL
DILUTIONS ON SMALL FORMAT SDS GELS. A, C, E STAINED WITH PROTOCOL 2, (BLUM AT EL). B, D, F STAINED WITH
PROTOCOL 1, (YAN ET AL). .............................................................................................................................. 95
FIGURE 3.2: REFERENCE PROTEIN SOLUTION PRODUCED FROM WHOLE TUMOUR LYSATE (SECTION 2.5.1) IN SERIAL DILUTIONS
ON 2D SDS GELS. 1:2 DILUTION; GELS A&B, (A STAINED PROTOCOL 1, B STAINED PROTOCOL 2). 1:4 DILUTION; GELS
C&D, (C STAINED PROTOCOL 1, D STAINED PROTOCOL 2). 1:8 DILUTION; GELS E&F, (E STAINED PROTOCOL 1, F STAINED
PROTOCOL 2). 1:16 DILUTION; GELS G&H, (G STAINED PROTOCOL 1, H STAINED PROTOCOL 2). ................................ 96
FIGURE 3.3: SILVER-STAINED 1D GELS OF REFERENCE PROTEIN SOLUTION IN SERIAL DILUTIONS SUBJECT TO FURTHER STAINING
USING GALLYAS PROTOCOL. GEL A CORRESPONDS TO GEL E (FIGURE 3.1). (I) PRIOR TO GALLYAS STAINING; (II)
FOLLOWING GALLYAS STAINING. GEL B CORRESPONDS TO GEL F (FIGURE 3.1) (I) PRIOR TO GALLYAS STAINING; (II)
FOLLOWING GALLYAS STAINING. GEL C CORRESPONDS TO GEL C (FIGURE 3.1). (I) PRIOR TO GALLYAS STAINING; (II)
FOLLOWING GALLYAS STAINING. GEL D CORRESPONDS TO GEL D (FIGURE 3.1) (I) PRIOR TO GALLYAS STAINING; (II)
FOLLOWING GALLYAS STAINING. ...................................................................................................................... 97
FIGURE 3.4: 2D SDS-PAGE OF REFERENCE STANDARD PRODUCED FROM WHOLE TUMOUR LYSATE (SECTION 2.5.1) AT 1:4
DILUTION. OPTIMIZED STAINING PROTOCOL APPLIED (BLUM ET AL). GREATER THAN 800 PROTEIN SPOTS ARE VISIBLE
WITHOUT OVER-STAINING OF THE BACKGROUND GEL INDICATING THAT THIS CONCENTRATION OF LYSATE IS SUFFICIENT TO
PRODUCE A GOOD QUALITY 2D GEL. ................................................................................................................. 98
FIGURE 3.5: MERGED IMAGES OF SILVER-STAINED GELS CREATED FOR SPOT ANALYSIS BY SAMESPOT SOFTWARE. A: TUMOUR
(N=10) B: NORMAL COLON (N=9) C: DEPRESSED TUMOURS (N=4) D: FLAT TUMOURS (N=3) E: POLYPOID TUMOURS N=3
................................................................................................................................................................. 101
FIGURE 3.6: 2D GEL OF LASER-CAPTURED TUMOUR LYSATE (SAMPLE 233-00T) DEPICTING NINE SPOTS FOUND TO BE
DIFFERENTIALLY EXPRESSED AND SELECTED FOR IDENTIFICATION USING TANDEM MASS SPECTROMETRY. SPOTS WERE
SELECTED AFTER ANALYSIS OF ALL TUMOUR GELS USING SAMESPOTS SOFTWARE AND TWO OBSERVER VISUAL COMPARISON.
TUMOURS WITH DIFFERENT MORPHOLOGIES WERE COMPARED AND THE FINDINGS REFERENCED AGAINST MATCHED
NORMAL GELS. SPOTS CIRCLED IN DASHED LINES WERE ALSO SELECTED FOR IDENTIFICATION AS POST-TRANSLATIONAL
MODIFICATIONS OF PROTEINS ALREADY RINGED ON THE GEL. ............................................................................... 102
FIGURE 3.7: EXPRESSION OF DIFFERENTIALLY EXPRESSED PROTEINS (SPOTS 1 AND 2); EVALUATION IN INDIVIDUAL SAMPLES. A:
TUMOUR GEL (233-00T). BOX MARKS AREA OF GEL SHOWING SPOTS 1 AND 2. B: SECTIONS OF INDIVIDUAL TUMOUR AND
MATCHED NORMAL GELS (BOXED AREA IN A) SHOWING EXPRESSION OF SPOT 1 (RINGED IN RED) AND SPOT 2 (RINGED IN
BLUE) FOR VISUAL COMPARISON. GEL NUMBERS CORRESPOND TO THE FOLLOWING SAMPLES; TUMOURS (T): DEPRESSED-
TYPE (1=104-06T, 2=084-06T, 3=264-05T, 4=149-01T); FLAT-TYPE (5=054-96T, 6=148-01T, 7=108-03T);
POLYPOID-TYPE (8=075-00T, 9=233-00T, 10=259-01T). NORMAL TISSUE (N) (11=104-06N, 13=084-06N,
16=264-05N, 19=149-01N, 15=054-96N, 18=108-03N, 12=075-00N, 14=233-00N, 17=259-01N). C AND D:
VOLUME OF SPOT 1 (CHART C) AND SPOT 2 (CHART D) QUANTIFIED BY SAMESPOTS SOFTWARE IN EACH GEL (NUMBERED
AS IN B). ADDITIONAL BARS (T, D, F AND P) SHOW MEAN SPOT VOLUME ACROSS A NUMBER OF GELS, SHOWN WITH
CORRESPONDING ERROR BARS. T=MEAN SPOT VOLUME ALL TUMOURS (GELS 1-10); D=MEAN SPOT VOLUME IN DEPRESSED
TUMOUR GELS (GELS 1-4), F=MEAN SPOT VOLUME IN FLAT TUMOURS (GELS 5-7), P= MEAN SPOT VOLUME IN POLYPOID

Protein expression in colorectal cancer EM Tweedle
xxii
TUMOURS (GELS 8-10). P VALUES COMPARE MEAN SPOT VOLUME ACROSS GELS D, F AND P. THE FOLD INCREASE FROM
LOWEST TO HIGHEST MEAN SPOT VOLUME IS SHOWN ON EACH CHART. ................................................................. 103
FIGURE 3.8: EXPRESSION OF DIFFERENTIALLY EXPRESSED PROTEINS (SPOT 3); EVALUATION IN INDIVIDUAL SAMPLES. A:
TUMOUR GEL (233-00T). BOX MARKS AREA OF GEL SHOWING SPOT 3. B: SECTIONS OF INDIVIDUAL TUMOUR AND
MATCHED NORMAL GELS (BOXED AREA IN A) SHOWING EXPRESSION OF SPOT 3 (RINGED IN GREEN) FOR VISUAL
COMPARISON. GEL NUMBERS CORRESPOND TO THE FOLLOWING SAMPLES; TUMOURS (T): DEPRESSED-TYPE (1=104-06T,
2=084-06T, 3=264-05T, 4=149-01T); FLAT-TYPE (5=054-96T, 6=148-01T, 7=108-03T); POLYPOID-TYPE (8=075-
00T, 9=233-00T, 10=259-01T). NORMAL TISSUE (N) (11=104-06N, 13=084-06N, 16=264-05N, 19=149-01N,
15=054-96N, 18=108-03N, 12=075-00N, 14=233-00N, 17=259-01N). C: VOLUME OF SPOT 3 QUANTIFIED BY
SAMESPOTS SOFTWARE IN EACH GEL (NUMBERED AS IN B). ADDITIONAL BARS (T, D, F AND P) SHOW MEAN SPOT VOLUME
ACROSS A NUMBER OF GELS, SHOWN WITH CORRESPONDING ERROR BARS. T=MEAN SPOT VOLUME ALL TUMOURS (GELS 1-
10); D=MEAN SPOT VOLUME IN DEPRESSED TUMOUR GELS (GELS 1-4), F=MEAN SPOT VOLUME IN FLAT TUMOURS (GELS 5-
7), P= MEAN SPOT VOLUME IN POLYPOID TUMOURS (GELS 8-10). P VALUES COMPARE MEAN SPOT VOLUME ACROSS GELS
D, F AND P. THE FOLD INCREASE FROM LOWEST TO HIGHEST MEAN SPOT VOLUME IS SHOWN ON THE CHART. ............. 104
FIGURE 3.9: EXPRESSION OF DIFFERENTIALLY EXPRESSED PROTEINS (SPOTS 4A AND 4B); EVALUATION IN INDIVIDUAL SAMPLES.
A: TUMOUR GEL (233-00T). BOX MARKS AREA OF GEL SHOWING SPOTS 4A AND 4B. B: SECTIONS OF INDIVIDUAL
TUMOUR AND MATCHED NORMAL GELS (BOXED AREA IN A) SHOWING EXPRESSION OF SPOT 4A (RINGED IN BLUE) AND SPOT
4B (RINGED IN DASHED BLUE) FOR VISUAL COMPARISON. GEL NUMBERS CORRESPOND TO THE FOLLOWING SAMPLES;
TUMOURS (T): DEPRESSED-TYPE (1=104-06T, 2=084-06T, 3=264-05T, 4=149-01T); FLAT-TYPE (5=054-96T,
6=148-01T, 7=108-03T); POLYPOID-TYPE (8=075-00T, 9=233-00T, 10=259-01T). NORMAL TISSUE (N) (11=104-
06N, 13=084-06N, 16=264-05N, 19=149-01N, 15=054-96N, 18=108-03N, 12=075-00N, 14=233-00N,
17=259-01N). C: VOLUME OF SPOT 4A QUANTIFIED BY SAMESPOTS SOFTWARE IN EACH GEL (NUMBERED AS IN B).
ADDITIONAL BARS (T, D, F AND P) SHOW MEAN SPOT VOLUME ACROSS A NUMBER OF GELS, SHOWN WITH
CORRESPONDING ERROR BARS. T=MEAN SPOT VOLUME ALL TUMOURS (GELS 1-10); D=MEAN SPOT VOLUME IN DEPRESSED
TUMOUR GELS (GELS 1-4), F=MEAN SPOT VOLUME IN FLAT TUMOURS (GELS 5-7), P= MEAN SPOT VOLUME IN POLYPOID
TUMOURS (GELS 8-10). P VALUES COMPARE MEAN SPOT VOLUME ACROSS GELS D, F AND P. THE FOLD INCREASE FROM
LOWEST TO HIGHEST MEAN SPOT VOLUME IS SHOWN ON THE CHART. ................................................................... 105
FIGURE 3.10: EXPRESSION OF DIFFERENTIALLY EXPRESSED PROTEINS (SPOTS 5, 6 AND 7); EVALUATION IN INDIVIDUAL
SAMPLES. A: TUMOUR GEL (233-00T). BOX MARKS AREA OF GEL SHOWING SPOTS 5, 6 AND 7. B: SECTIONS OF
INDIVIDUAL TUMOUR AND MATCHED NORMAL GELS (BOXED AREA IN A) SHOWING EXPRESSION OF SPOT 5 (RINGED IN PINK)
AND SPOT 6 (RINGED IN DASHED PINK) AND SPOT 7 (RINGED IN PURPLE) FOR VISUAL COMPARISON. GEL NUMBERS
CORRESPOND TO THE FOLLOWING SAMPLES; TUMOURS (T): DEPRESSED-TYPE (1=104-06T, 2=084-06T, 3=264-05T,
4=149-01T); FLAT-TYPE (5=054-96T, 6=148-01T, 7=108-03T); POLYPOID-TYPE (8=075-00T, 9=233-00T,
10=259-01T). NORMAL TISSUE (N) (11=104-06N, 13=084-06N, 16=264-05N, 19=149-01N, 15=054-96N,
18=108-03N, 12=075-00N, 14=233-00N, 17=259-01N). C AND D: VOLUME OF SPOT 5 (CHART C) AND SPOT 7
(CHART D) QUANTIFIED BY SAMESPOTS SOFTWARE IN EACH GEL (NUMBERED AS IN B). ADDITIONAL BARS (T, D, F AND P)
SHOW MEAN SPOT VOLUME ACROSS A NUMBER OF GELS, SHOWN WITH CORRESPONDING ERROR BARS. T=MEAN SPOT
VOLUME ALL TUMOURS (GELS 1-10); D=MEAN SPOT VOLUME IN DEPRESSED TUMOUR GELS (GELS 1-4), F=MEAN SPOT
VOLUME IN FLAT TUMOURS (GELS 5-7), P= MEAN SPOT VOLUME IN POLYPOID TUMOURS (GELS 8-10). P VALUES COMPARE

Protein expression in colorectal cancer EM Tweedle
xxiii
MEAN SPOT VOLUME ACROSS GELS D, F AND P. THE FOLD INCREASE FROM LOWEST TO HIGHEST MEAN SPOT VOLUME IS
SHOWN ON EACH CHART. ............................................................................................................................. 106
FIGURE 3.11: EXPRESSION OF DIFFERENTIALLY EXPRESSED PROTEINS (SPOTS 8A AND 8B); EVALUATION IN INDIVIDUAL
SAMPLES. A: TUMOUR GEL (233-00T). BOX MARKS AREA OF GEL SHOWING SPOTS 8A AND 8B. B: SECTIONS OF
INDIVIDUAL TUMOUR AND MATCHED NORMAL GELS (BOXED AREA IN A) SHOWING EXPRESSION OF SPOT 8A (RINGED IN
GREEN) AND SPOT 8B (RINGED IN DASHED GREEN) FOR VISUAL COMPARISON. GEL NUMBERS CORRESPOND TO THE
FOLLOWING SAMPLES; TUMOURS (T): DEPRESSED-TYPE (1=104-06T, 2=084-06T, 3=264-05T, 4=149-01T); FLAT-
TYPE (5=054-96T, 6=148-01T, 7=108-03T); POLYPOID-TYPE (8=075-00T, 9=233-00T, 10=259-01T). NORMAL
TISSUE (N) (11=104-06N, 13=084-06N, 16=264-05N, 19=149-01N, 15=054-96N, 18=108-03N, 12=075-00N,
14=233-00N, 17=259-01N). C: VOLUME OF SPOT 8A QUANTIFIED BY SAMESPOTS SOFTWARE IN EACH GEL (NUMBERED
AS IN B). ADDITIONAL BARS (T, D, F AND P) SHOW MEAN SPOT VOLUME ACROSS A NUMBER OF GELS, SHOWN WITH
CORRESPONDING ERROR BARS. T=MEAN SPOT VOLUME ALL TUMOURS (GELS 1-10); D=MEAN SPOT VOLUME IN DEPRESSED
TUMOUR GELS (GELS 1-4), F=MEAN SPOT VOLUME IN FLAT TUMOURS (GELS 5-7), P= MEAN SPOT VOLUME IN POLYPOID
TUMOURS (GELS 8-10). P VALUES COMPARE MEAN SPOT VOLUME ACROSS GELS D, F AND P. THE FOLD INCREASE FROM
LOWEST TO HIGHEST MEAN SPOT VOLUME IS SHOWN ON THE CHART. ................................................................... 107
FIGURE 3.12: EXPRESSION OF DIFFERENTIALLY EXPRESSED PROTEINS (SPOT 9); EVALUATION IN INDIVIDUAL SAMPLES. A:
TUMOUR GEL (233-00T). BOX MARKS AREA OF GEL SHOWING SPOT 9. B: SECTIONS OF INDIVIDUAL TUMOUR AND
MATCHED NORMAL GELS (BOXED AREA IN A) SHOWING EXPRESSION OF SPOT 9 (RINGED IN YELLOW) FOR VISUAL
COMPARISON. GEL NUMBERS CORRESPOND TO THE FOLLOWING SAMPLES; TUMOURS (T): DEPRESSED-TYPE (1=104-06T,
2=084-06T, 3=264-05T, 4=149-01T); FLAT-TYPE (5=054-96T, 6=148-01T, 7=108-03T); POLYPOID-TYPE (8=075-
00T, 9=233-00T, 10=259-01T). NORMAL TISSUE (N) (11=104-06N, 13=084-06N, 16=264-05N, 19=149-01N,
15=054-96N, 18=108-03N, 12=075-00N, 14=233-00N, 17=259-01N). C: VOLUME OF SPOT 9 QUANTIFIED BY
SAMESPOTS SOFTWARE IN EACH GEL (NUMBERED AS IN B). ADDITIONAL BARS (T, D, F AND P) SHOW MEAN SPOT VOLUME
ACROSS A NUMBER OF GELS, SHOWN WITH CORRESPONDING ERROR BARS. T=MEAN SPOT VOLUME ALL TUMOURS (GELS 1-
10); D=MEAN SPOT VOLUME IN DEPRESSED TUMOUR GELS (GELS 1-4), F=MEAN SPOT VOLUME IN FLAT TUMOURS (GELS 5-
7), P= MEAN SPOT VOLUME IN POLYPOID TUMOURS (GELS 8-10). P VALUES COMPARE MEAN SPOT VOLUME ACROSS GELS
D, F AND P. THE FOLD INCREASE FROM LOWEST TO HIGHEST MEAN SPOT VOLUME IS SHOWN ON THE CHART. ............. 108
FIGURE 3.13A-F: MS/MS SPECTRA FOR IDENTIFIED PROTEIN SPOTS. COMPLETE SEQUENCES ARE SHOWN ON THE RIGHT WITH
PEPTIDE MASSES IDENTIFIED IN THE FIRST CHAMBER SHOWN IN COLOUR. SPECTRA SHOWN CORRESPOND TO UNDERLINED
PEPTIDE SEQUENCED IN SECOND CHAMBER. A: SH3BGRPL3 B: PEROXIREDOXIN 2 C: PEROXIREDOXIN 6 D: HSP27 E:
COFILIN1 F:S100A8 .................................................................................................................................... 111
FIGURE 3.14: WESTERN BLOTTING FOR SH3BGRPL3. A&B: PROTEINS FROM COLORECTAL CANCER CELL LINES HCT116,
HT29, SW620 AND WHOLE TISSUE LYSATE FROM COLORECTAL CANCERS 084-06 AND 259-05 WERE SEPARATED BY 1D
SDS-PAGE, TRANSFERRED TO MEMBRANE AND WESTERN ANALYSIS UNDERTAKEN WITH ANTI-SH3BGRPL3 MOUSE
ASCITES. PRIMARY ANTIBODY CONCENTRATION WAS 1:10 (A) AND 1:100 (B) WITH EXPOSURE TIMES OF 2 AND 40MIN.
NO SPECIFIC PROTEIN BAND WAS DETECTED. C: IN ORDER TO ASCERTAIN WHETHER THE ANTI-SH3BGRPL3 MOUSE ASCITES
CONTAINED ACTIVE ANTIBODY THE ASCITES WAS SPOTTED DIRECTLY ONTO NITROCELLULOSE MEMBRANE WITH TWO
COMMERCIAL ANTIBODY SOLUTIONS, (MOUSE ANTI-HUMAN Β-ACTIN AND RABBIT ANTI-HUMAN 1GG-HRP) IN THE

Protein expression in colorectal cancer EM Tweedle
xxiv
POSITIONS MARKED. THE MEMBRANE WAS INCUBATED WITH ANTI-MOUSE SECONDARY. NO SIGNAL WAS SEEN FROM THE
DONATED ANTI-SH3BGRPL3 MOUSE ASCITES AT 20S OR 2MIN EXPOSURE WHICH CONFIRMED THAT NO ANTIBODY WAS
PRESENT IN THE ASCITES. ............................................................................................................................... 115
FIGURE 3.15: PATHWAYS OF PEROXIREDOXIN METABOLISM. REDUCED PEROXIREDOXIN (PRX-SH) BINDS HYDROGEN PEROXIDE
(H2O2) TO FORM OXIDIZED PEROXIREDOXIN (PRX-SOH). THIS UNSTABLE PROTEIN CAN INTERACT WITH ANOTHER
PEROXIREDOXIN MOLECULE TO FORM A DIMER (PRX-S-S-PRX) WHEN IT IS REDUCED AND RECYCLED BY THIOREDOXIN.
DURING PERIODS OF HIGH HYDROGEN PEROXIDE CONCENTRATIONS PRX-SOH CAN COMBINE WITH ANOTHER H2O2 TO
FORM A STABLE HYPEROXIDISED PEROXIREDOXIN (PRX-SO2H). .......................................................................... 117
FIGURE 3.16: WESTERN BLOT OF PEROXIREDOXIN 6 AND PEROXIREDOXIN 6-SO4 EXPRESSION. PROTEIN LYSATE FROM
COLORECTAL CANCER CELL LINES HCT116, HT29, SW480 AND SW620 WERE SEPARATED BY 1D SDS-PAGE,
TRANSFERRED TO MEMBRANE AND WESTERN ANALYSIS UNDERTAKEN WITH ANTI-PRXVI AND ANTI-PRXVI-SO3, Β-ACTIN
WAS USED AS CONTROL. PRIMARY ANTIBODY CONCENTRATIONS WERE PRX-VI 1:2000 (A), PRX-VI-SO3 1:1000 (C) AND
Β-ACTIN 1:4000 (B&D). A: BLOT PROBED FOR PRX-VI SHOWS A BAND AT THE APPROPRIATE MOLECULAR WEIGHT
(28KDA) BUT ADDITIONAL BANDS AT 40KDA AND 19KDA. B: B-ACTIN CONTROL. UNDERLOADING HCT116. C: BLOT
PROBED FOR PRX-VI-SO3 SHOWS MULTIPLE BANDS AND HEAVY BACKGROUND DESPITE BLOCKING WITH BOTH MILK PROTEIN
AND GOAT SERUM. D: B-ACTIN CONTROL. UNDERLOADING HCT116, OVERLOADING HT29. .................................... 121
FIGURE 3.17: THE REGULATION AND ACTIONS OF HEAT SHOCK PROTEIN 27. HSF1 MIGRATES INTO THE NUCLEUS FOLLOWING A
STRESSOR EVENT. HSF1 INTERACTS WITH THE HSE ON THE PROMOTER REGION OF THE HSP27 GENE CAUSING
TRANSCRIPTION OF THE HSP27 PROTEIN ......................................................................................................... 123
FIGURE 3.18: IMMUNOHISTOCHEMISTRY FOR HSP27. (A) BENIGN CONTROL TISSUE SHOWING ABSENCE OF DETECTABLE
HSP27 IN NORMAL COLONIC EPITHELIUM, WEAK STAINING IN NORMAL LIVER AND INTENSE STAINING OF NORMAL RENAL
TUBULES. (B) COLORECTAL CANCER TISSUE ILLUSTRATING THE RANGE OF INTENSITIES OF HSP27 IMMUNOSTAINING, FROM
0 TO 3. (C) COLORECTAL CANCER TISSUE DEPICTING VARYING PERCENTAGES OF HSP27 STAINING IN DIFFERENT TUMOURS.
................................................................................................................................................................. 129
FIGURE 3.19: KAPLAN-MEIER GRAPHICAL ANALYSIS OF 8-YEAR SURVIVAL IN (A) ALL PATIENTS, (B) COLON CANCER PATIENTS,
(C) RECTAL CANCER PATIENTS, (D) STAGE I/II RECTAL CANCER PATIENTS, (E) STAGE III RECTAL CANCER PATIENTS. (F)
STAGE IIIA/B RECTAL CANCER PATIENTS VERSUS STAGE II HIGH HSP27 EXPRESSORS. .............................................. 133
FIGURE 3.20: KAPLAN-MEIER CURVES OF HSP27 INDEX IN COLON CANCER (A) STGE I/II COLON CANCER; HIGH HSP27-
EXPRESSORS (N=52) SHOWED SIMILAR SURVIVAL TO LOW EXPRESSORS (N=65; LOG-RANK, P=0.8569). (B) STAGE III
COLON CANCER; HIGH HSP27-EXPRESSORS (N=32) SHOWED SIMILAR SURVIVAL TO LOW EXPRESSORS (N=50; LOG-RANK,
P=0.4365). (C) POOR SURVIVAL FOR STAGE IIIA/B COLON CANCER (ALL CASES; N=43) VERSUS STAGE II HIGH HSP27
EXPRESSORS (N=41, LOG-RANK, P=0.0268. .................................................................................................... 134
FIGURE 3.21: (A AND B): HSP27 STAINING IN DIAGNOSTIC BIOPSY MATERIAL (UPPER PANEL) COMPARED TO MATCHED TUMOUR
CORES (LOWER PANEL). (C) KAPLAN-MEIER SURVIVAL CURVES DEMONSTRATING THAT THE LEVEL OF HSP27 REMAINS
PREDICTIVE OF CANCER-SPECIFIC SURVIVAL IN RECTAL CANCER PATIENTS WHO HAVE NOT RECEIVED NEOADJUVANT

Protein expression in colorectal cancer EM Tweedle
xxv
RADIOTHERAPY AND (D) THAT MODE OF NEOADJUVANT RADIOTHERAPY RECEIVED DID NOT CORRELATE WITH CANCER-
SPECIFIC SURVIVAL. ...................................................................................................................................... 139
FIGURE 3.22: REGULATION OF COFILIN ................................................................................................................... 144
FIGURE 3.23: 1D WESTERN BLOTS OF COLORECTAL CANCER CELL LYSATE PROBED FOR COFILIN AND COFILIN-PHOSPHO(SER3).
PROTEIN LYSATE FROM COLORECTAL CANCER CELL LINES HCT116, HT29, SW480 AND SW620 WERE SEPARATED BY 1D
SDS-PAGE, TRANSFERRED TO MEMBRANE AND WESTERN ANALYSIS UNDERTAKEN WITH ANTI-COFILIN1 AND ANTI-
PHOSPHYLATED COFILIN. Β-ACTIN WAS USED AS CONTROL. PRIMARY ANTIBODY CONCENTRATIONS WERE COFILIN1 1:10000
(A), COFILIN-P 1:50 (C) AND Β-ACTIN 1:20000 (B&D). A/B: BLOT PROBED FOR COFILIN1 AND Β-ACTIN SHOWING
GREATER EXPRESSION OF THE PROTEIN IN HCT116 CELLS. C/D: BLOT PROBED FOR COFILIN-PHOSPHO(SER3) AND Β-ACTIN
SHOWING GREATEST EXPRESSION IN HT29 AND LOWEST EXPRESSION IN HCT116 CELLS .......................................... 146
FIGURE 3.24: 2D WESTERN BLOT OF COFILIN AND COFILIN-PHOSPHO(SER3) IN COLORECTAL CANCER CELL LINES. A&B.
COOMASSIE-STAINED GELS C&D: PONCEAU-STAINED MEMBRANE E&F: COFILIN1 BLOT SHOWING STRING OF PROTEINS AT
17KDA, PI 6.5-8.0. RINGED IN GREEN. G&H: COFILIN-PHOSPHO(SER3) BLOT SHOWING ONE SPOT CORRESPONDING TOP
THE MOST ACIDIC FORM OF COFILIN1 WITH VARIABLE EXPRESSION. RINGED IN GREEN. ............................................ 148
FIGURE 3.25: 2D WESTERN BLOT OF COFILIN AND COFILIN-PHOSPHO(SER3) IN FROZEN TUMOUR AND NORMAL COLON. A&B.
COOMASSIE-STAINED GELS C&D: PONCEAU-STAINED MEMBRANE E&F: COFILIN1 BLOT SHOWING STRING OF PROTEINS AT
17KDA, PI 6.5-8.0. RINGED IN GREEN. G&H: COFILIN-PHOSPHO(SER3) BLOT SHOWING ONE SPOT CORRESPONDING TOP
THE MOST ACIDIC FORM OF COFILIN1 WITH VARIABLE EXPRESSION. RINGED IN GREEN. ............................................ 149
FIGURE 3.26A: A: WHOLE TUMOUR GEL WITH AREA OF GEL SHOWN IN B MARKED WITH BOX. B: IMMUNOHISTOCHEMISTRY
FOR COFILIN1 IN NORMAL COLON AND COLORECTAL CANCER TISSUE MATCHED WITH 2D GEL ANALYSIS OF THE SAME TISSUE
(SAMPLES 104-06, 084-06, 264-05, 149-01). GOOD CONCORDANCE DEMONSTRATED BETWEEN EXPRESSION OF
COFILIN1 IN TUMOUR OR EPITHELIAL CELLS ON IHC (BROWN STAINING) AND SILVER-STAINING OF SPOTS ON 2D GEL
ANALYSIS. ................................................................................................................................................... 151
FIGURE 3.26B: A: WHOLE TUMOUR GEL WITH AREA OF GEL SHOWN IN B MARKED WITH BOX. B: IMMUNOHISTOCHEMISTRY FOR
COFILIN1 IN NORMAL COLON AND COLORECTAL CANCER TISSUE MATCHED WITH 2D GEL ANALYSIS OF THE SAME TISSUE
(SAMPLES 054-96, 148-01, 108-03, 075-00, 233-00, 259-01). GOOD CONCORDANCE DEMONSTRATED BETWEEN
EXPRESSION OF COFILIN1 IN TUMOUR OR EPITHELIAL CELLS ON IHC (BROWN STAINING) AND SILVER-STAINING OF SPOTS ON
2D GEL ANALYSIS. ........................................................................................................................................ 152
FIGURE 3.27: IMMUNOHISTOCHEMISTRY IN PARAFFIN-EMBEDDED COLORECTAL CANCER TISSUE. T=TUMOUR, S=STROMA. A:
TUMOUR STAINED FOR S100A8 SHOWING LOW EXPRESSION IN TUMOUR CYTOPLASM BUT NO S100A8 POSITIVE STROMA
CELLS. B: TUMOUR SHOWING HIGHER NUMBERS OF S100A8-POSITIVE STROMAL CELLS IN ADDITION TO SEVERAL INTRA-
TUMOUR INFLAMMATORY CELLS (ARROWED). C: S100A9 STAINING CONFIRMING NO EXPRESSION IN TUMOUR CELLS AND
LOW NUMBERS OF POSITIVE STROMAL CELLS. D: HIGH NUMBERS OF S100A9 POSITIVE STROMAL CELLS. E: TUMOUR
STAINED FOR SMAD4 SHOWING LOSS OF EXPRESSION. F: TUMOUR SHOWING SMAD4 EXPRESSION IN CYTOPLASM. ...... 157
FIGURE 3.28 CO-IMMUNOFLUORESCENCE. S100A9 LABELLED WITH RED FLUORESCENCE, DAPI USED AS NUCLEAR
COUNTERSTAIN (BLUE). (I) CO-LOCALISATION BETWEEN RED/GREEN FLUORESCENCE PLUS BLUE NUCLEAR

Protein expression in colorectal cancer EM Tweedle
xxvi
COUNTERSTAINING. (II) RED FLUORESCENCE ALONE IN SAME TISSUE SECTION. (III) GREEN FLUORESCENCE ALONE IN SAME
TISSUE SECTION. A(I-III): S100A8 LABELLED WITH GREEN FLUORESCENCE AND SHOWS CO-EXPRESSION IN THE SAME
S100A9-POSITIVE STROMAL CELLS. B(I-III): CD68 LABELLED WITH GREEN FLUORESCENCE SHOWING NO CO-LOCALIZATION
BETWEEN CD68+ MACROPHAGES AND S100A9+ CELLS. C(I-III): CD14 LABELLED WITH GREEN FLUORESCENCE SHOWING
CO-EXPRESSION OF S100A9 IN CD14+ MONOCYTES. ........................................................................................ 158
FIGURE 3.29: CORRELATION BETWEEN STROMAL S100A8 AND S100A9 AND SMAD4 IN THE TUMOUR. A: CORRELATION
BETWEEN NUMBER OF STROMAL S100A8 AND S100A9+ CELLS IN THE SAME TUMOUR, B: COMPARISON OF S100A8 AND
S100A9+ STROMAL CELLS, C: NUMBERS OF S100A8+ CELLS IN RELATION TO SMAD4 STATUS OF TUMOUR, D: ROC CURVES
TO PREDICT SMAD4 EXPRESSION USING S100A8+ CELL COUNTS, E: NUMBERS OF S100A9+ CELLS IN RELATION TO SMAD4
STATUS OF TUMOUR, D: ROC CURVES TO PREDICT SMAD4 EXPRESSION USING S100A9+ CELL COUNTS ...................... 161
FIGURE 3.30: CANCER SPECIFIC SURVIVAL ACCORDING TO STROMAL S100A8 AND S100A9+ CELLS. KAPLAN-MEIER CURVES
WITH P-VALUES (MANTEL-COX). A: SURVIVAL ACCORDING TO STROMAL S100A8+ CELLS (I) AND S100A9+ CELLS (II). B:
SMAD4 NEGATIVE TUMOURS; SURVIVAL ACCORDING TO S1008+ CELLS (I) AND S100A9+ CELLS (II), C: SMAD4 POSITIVE
TUMOURS; SURVIVAL ACCORDING TO S1008+ CELLS (I) AND S100A9+ CELLS (II). .................................................. 166
FIGURE 3.31: ASSOCIATION BETWEEN SMAD4 STATUS AND CANCER-SPECIFIC SURVIVAL. KAPLAN-MEIER CURVES WITH P-
VALUES (MANTEL-COX). A: NODAL STATUS, B: SMAD4 EXPRESSION, C: N0 TUMOURS; SURVIVAL ACCORDING TO SMAD4
STATUS, D: N+ TUMOURS; SURVIVAL ACCORDING TO SMAD4 STATUS, E: N0, SMAD4 NEGATIVE TUMORS VERSUS ALL N+
TUMOURS ................................................................................................................................................... 168

Protein expression in colorectal cancer EM Tweedle
xxvii
LIST OF TABLES
TABLE 1.1: 5-YEAR SURVIVAL BY STAGE1,11,12 .............................................................................................................. 5
TABLE 1.2: UNIVARIATE AND MULTIVARIATE ANALYSIS OF OVERALL SURVIVAL IN N=662 RESECTED COLORECTAL CANCERS FROM
THE ROYAL LIVERPOOL UNIVERSITY HOSPITAL BETWEEN 1999-2003 ..................................................................... 11
TABLE 1.3: INHERITED PREDISPOSITION TO COLORECTAL CANCER ................................................................................. 12
TABLE 1.4: MUTATION RATES OF KEY GENES IN THE ADENOMA-CARCINOMA SEQUENCE. A NUMBER OF ADENOMAS AND
CARCINOMAS WERE TESTED FOR MUTATIONS IN APC, K-RAS AND P53. HIGHER RATES OF P53 MUTATION IN CARCINOMA
COMPARED TO ADENOMA SUPPORT THE THEORY THAT MUTATION OF THIS GENE IS A LATE EVENT IN THE ADENOMA-
CARCINOMA SEQUENCE. .................................................................................................................................. 18
TABLE 1.5: COLONOSCOPICALLY DETECTED FLAT COLORECTAL CANCER/ADENOMAS ........................................................ 42
TABLE 1.6: FLAT AND DEPRESSED COLORECTAL CANCERS IN SURGICAL RESECTIONS ......................................................... 42
TABLE 1.7: CLASSIFICATION OF LESIONS ACCORDING TO JRSC. TABLE SHOWS PROPORTION OF SMALL LESIONS WHICH FELL INTO
EACH MORPHOLOGICAL GROUP......................................................................................................................... 45
TABLE 1.8: SMALL CANCERS ACCORDING TO TNM STAGING. PROPORTION OF POLYPOID VERSUS FLAT AND DEPRESSED
TUMOURS BY DEPTH OF INVASION (T-STAGE); SHOWS A GREATER PERCENTAGE OF T1 LESIONS IN POLYPOID GROUP, AND
GREATER PERCENTAGE OF T3 LESION IN FLAT/DEPRESSED GROUP. FOR EACH T-STAGE, THE PERCENTAGE OF TUMOURS WITH
NODAL METASTASES (N-STAGE) AND DISTANT METASTASES (M-STAGE) IS SHOWN. * FISHER’S EXACT TEST .................. 46
TABLE 1.9: SMALL CANCERS ACCORDING TO DUKES STAGING. DEMONSTRATING FEWER DUKE’S A AND MORE DUKE’S D
CANCERS IN THE FLAT/DEPRESSED GROUP. *2 DUKES B TUMOURS WERE NOT CLASSIFIABLE ACCORDING TO MORPHOLOGY
DUE TO LACK OF PARAFFIN-EMBEDDED TISSUE. .................................................................................................... 46
TABLE 1.10: PROTEINS WITH ALTERED REGULATION IN COLORECTAL CANCER DETECTED BY PROTEOMICS(208, 209) ........... 61
TABLE 1.11: EGTM RECOMMENDATIONS FOR THE USE OF COMMON PROTEIN MARKERS DUFFY ET AL. 2007(210) ............ 68
TABLE 2.1: CHARACTERISTICS OF FROZEN TISSUE SAMPLES .......................................................................................... 71
TABLE 2.2: SUMMARY OF LASER CAPTURE MICROSCOPY PROCUREMENT OF MATERIAL FOR PROTEOMIC ANALYSIS ............. 76
TABLE 2.3: PRIMARY ANTIBODIES USED IN WESTERN BLOTTING ................................................................................... 88
TABLE 2.5: PRIMARY ANTIBODIES IN IMMUNOHISTOCHEMISTRY AND CO-IMMUNOFLUORESCENCE ................................... 91
TABLE 3.1: SPOTS IDENTIFIED ON 2D GEL ANALYSIS .................................................................................................. 109

Protein expression in colorectal cancer EM Tweedle
xxviii
TABLE 3.2: CLINICOPATHOLOGICAL DATA FOR N=404 PATIENTS ON THE MICROARRAYS ................................................ 127
TABLE 3.3: UNIVARIATE COX REGRESSION OF HSP27 INTENSITY AND PERCENTAGE ...................................................... 128
TABLE 3.4: CLINICOPATHOLOGICAL FEATURES ASSOCIATED WITH HSP27 EXPRESSION................................................... 131
TABLE 3.5 A: UNIVARIATE AND MULTIVARIATE ANALYSIS OF SURVIVAL IN RECTAL CANCER ............................................. 136
TABLE 3.5 B: UNIVARIATE AND MULTIVARIATE ANALYSIS OF SURVIVAL IN COLON CANCER ............................................. 136
TABLE 3.6: COMPARATIVE HSP27 EXPRESSION BETWEEN DIAGNOSTIC BIOPSY AND TUMOUR ........................................ 138
TABLE 3.7: CHANGE IN HSP27 EXPRESSION ACCORDING TO PRE-OPERATIVE RADIOTHERAPY ......................................... 138
TABLE 3.8: CORRELATION BETWEEN SMAD4 EXPRESSION IN THE TUMOUR AND S100A8 AND S100A9+ CELLS IN THE STROMA
................................................................................................................................................................. 160
TABLE 3.9: CLINICOPATHOLOGICAL CHARACTERISTICS AND CORRELATION WITH S100A8+ AND S100A9+ CELL INFILTRATES IN
THE STROMA. S100A8 AND S100A9 CELL COUNTS WERE DICHOTOMIZED BY MEDIAN COUNTS AND ANALYSED ACCORDING
TO CLINICAL AND PATHOLOGICAL VARIABLES. STATISTICAL ANALYSIS WAS PERFORMED USING CHI-SQUARED TEST ......... 163
TABLE 3.10: ASSOCIATION BETWEEN SMAD4 STATUS AND CLINICOPATHOLOGICAL PARAMETERS. TUMOURS WERE
DICHOTOMIZED BY SMAD4 EXPRESSION INTO NEGATIVE AND POSITIVE TUMOURS AND COMPARED TO CLINICAL AND
PATHOLOGICAL TUMOUR FEATURES. CHI-SQUARED TEST USED FOR STATISTICAL ANALYSIS........................................ 164

Protein expression in colorectal cancer EM Tweedle
1
1. INTRODUCTION
1.1 COLORECTAL ADENOCARCINOMA: INCIDENCE AND SURVIVAL
Colorectal cancer is the second most common cancer in the UK. Worldwide over a million new
cases of colorectal cancer are diagnosed every year, accounting for more than 9% of all new cancer
cases. In the UK there are approximately 16,000 deaths from colorectal cancer per year, of which
5800 (36%) are cancer of the rectum. The incidence of colorectal cancer in the UK is approximately
59 cases per 100,000 persons. It is strongly related to age with 83% of cases arising in people who
are 60 years or older. Rectal cancer is more common in men with 58% diagnosed in males
compared to 42% in females. The incidence of colon cancer is more equal, with 51% diagnosed in
men and 49% women. The lifetime risk of the disease is estimated at 1 in 18 for men and 1 in 20 for
women. Females demonstrate an improved five-year survival compared to men. In the early 1970s,
five-year relative survival for male colon cancer was 22% (23% for women) and this rose to 47%
(48% for women) in the late 1990s. Over the same time period, the five-year survival rates for male
rectal cancer rose from 25% to 47% and from 27% to 51% for female rectal cancer.(1) Despite these
improvements, five-year survival in the UK remains poor in comparison to the rest of Europe, with
age-standardised rates of 45% compared to France and Germany with 50-55%.(2) The USA has
consistently higher five-year survival rates for cancer of the colon and rectum compared to
European countries. Data from nine areas in the USA in the period 1990-1994 showed 5-year

Protein expression in colorectal cancer EM Tweedle
2
survival rates of 59-66%.(2) These results are attributed to the early detection of colorectal cancer
through screening programs funded by private health insurance companies across the USA. (3)
1.2 COLORECTAL ADENOCARCINOMA: PROGNOSIS
The association between pathological stage and prognosis was first documented by Cuthbert Dukes
in his work on rectal cancer in 1950.(4) Other later classification systems, such as the TNM and
Astler-Coller staging are refinements of the principles established by Dukes, namely that depth of
tumour invasion and presence of lymph node or distant metastases is inversely correlated with
patient survival,(5-7) (Figure 1.1). In 2000 the American Joint Committee on Cancer Prognostic
Factors Consensus Conference listed several histopathological parameters in addition to stage
which were associated in prognosis in colorectal cancer which should be documented in pathology
reporting. These were residual tumour at the radial or excision margins, differentiation grade into
high versus low, tumour border configuration, venous and lymphatic invasion and perineural
invasion. Insufficient evidence at that time was available for the routine use of DNA content,
microvessel density and tumour tissue markers such as p53, k-ras, DCC, MSI and p21 for routine
clinical prognostic grading.(8, 9)

Protein expression in colorectal cancer EM Tweedle
3
1.2.1 STAGING
Staging of colorectal cancer is based on the three criteria; invasion through the bowel wall (T),
lymph node metastases (N) and distant metastases (M). The components of the TNM score from
the 7th edition of the American Joint Committee on Cancer staging for colorectal cancer are listed
below.(10)
Primary tumour (T) Lymph node metastases (N) Distant Metastases (M)
TX-Primary tumor cannot be assessed
NX Regional lymph nodes cannot be assessed
M0 No distant metastasis
T0-No evidence of primary tumour N0 No regional lymph node metastasis
M1 Distant metastasis
Tis-Carcinoma in situ: intraepithelial or invasion of lamina propria
N1 Metastasis in 1–3 regional lymph nodes
M1a Metastasis confined to one organ (for example, liver, lung, ovary, nonregional node)
T1-Tumour invades submucosa N1a Metastasis in one regional lymph node
M1b Metastases in more than one organ or the peritoneum
T2-Tumour invades muscularis propria
N1b Metastasis in 2–3 regional lymph nodes
T3-Tumour invades through the muscularis propria into pericolorectal tissues
N1c Tumor deposit(s) in the subserosa, mesentery, or nonperitonealized pericolic or perirectal tissues without regional nodal metastasis
T4a-Tumour penetrates to the surface of the visceral peritoneum
N2 Metastasis in 4 or more regional lymph nodes
T4b-Tumor directly invades or is adherent to other organs or structures
N2a Metastasis in 4–6 regional lymph nodes
N2b Metastasis in 7 or more regional lymph nodes

Protein expression in colorectal cancer EM Tweedle
4
Figure 1.1: Staging of colorectal cancer. Depicts tumour infiltration through bowel wall (T-
stage), Lymph node metastases (N-stage) and distant metastases (M-stage). Images adapted
from The Carver Colon Cancer Surgical Centre (http://www.carverclinic.com/index.php) and
Chicago’s Northside Colon & Rectal Clinic (http://cnscrc.com/colon_and_rectal_screening).
LYMPH
NODES
LUNG
LIVER

Protein expression in colorectal cancer EM Tweedle
5
Colorectal cancer is a curable disease. In the early stages of the disease, adequate resection of a
tumour with no lymph node metastases can result in a five-year survival of 77% for T3-T4 lesion and
93.2% for T1-T2 lesions, (Table 1.1). The presence of lymph nodes metastases is the strongest
prognostic factor for colorectal cancer. Five-year survival for patients with 1-3 positive lymph nodes
(N1 disease) is 35-60%, whereas 4 positive lymph nodes is associated with a 25-27% survival.(11)
Currently, 23.6% of patients with colorectal cancer present with nodal metastases and 9.2% present
with distant metastases in the UK.(1) A further 40-50% of patients will develop distant metastases
following resection of the primary colorectal cancer. The median survival in this group of patients is
8 months without treatment and five-year survival is 0-7%. Patients with liver or lung metastases
amenable to surgical resection have a five-year survival of approximately 25% at five-years.(12)
Table 1.1: 5-year survival by stage1,11,12
Dukes’ Stage
Frequency Astler-Coller stage
TNM stage 5-year survival
A 8.7% I T1-2, N0, M0 80-95%
B 24.2% IIA T3, N0, M0 72-75%
IIB T4, N0, M0 65-66%
C1 23.6% IIIA T1-2, N1, M0 55-60%
IIIB T3-4, N1, M0 35-42%
C2 IIIC Any T, N2, M0 25-27%
D 9.2% IV Any T, Any N, M1 0-7%
Unknown 34.3% - - 35.4%

Protein expression in colorectal cancer EM Tweedle
6
1.2.2 EXCISION MARGINS
The radial margin of a colorectal resection specimen represents the adventitial soft tissue margin of
a nonperitonealized surface. A corresponding adventitial margin also exists for the ascending colon,
descending colon, and rectosigmoid colon, all of which are only partially peritonealized. In those
segments of the colon that are encased completely by a peritonealized (serosal) surface (the
cecum, transverse colon, and sigmoid colon), the only radial margin is the mesenteric resection
margin. The radial margin has been defined fully and studied specifically in rectal cancer,
multivariate analysis has suggested that tumor involvement of this margin may be the single most
critical factor in predicting local recurrence of rectal carcinoma. One such meta-analysis of 17,500
rectal cancer resections demonstrated that involvement of the circumferential resection margin
(CRM) is a powerful predictor of both development of distant metastases (HR = 2.8; 95% CI, 1.9 to
4.3) and survival (HR = 1.7; 95% CI, 1.3 to 2.3). After neoadjuvant therapy (both radiotherapy and
radiochemotherapy), the predictive value of the CRM for local recurrence is significantly higher
than when no preoperative therapy has been applied (hazard ratio [HR] = 6.3 v 2.0, respectively; P <
0.05).(13) Involvement of the retroperitoneal resection margin in right-sided colon cancer has also
been shown as a poor prognostic marker. In this group of patients margin involvement appears to
correlate with the presence of distant metastases and advancing stage at presentation.(14)
1.2.3 HISTOLOGICAL GRADE
Histological grade has been shown repeatedly to be of independent prognostic significance by
multivariate analysis, as long as the grade assigned is reproducible and reflects the most poorly
differentiated area of tumour.(15) One multivariate analysis in n=368 showed that differentiation

Protein expression in colorectal cancer EM Tweedle
7
grade was the only other variable apart from Dukes’ stage and tumour site which remained
independently significant on multivariate analysis with a hazard ratio 0.76 (<0.02) for moderate to
well differentiated and 0.78 (p<0.01) for poor to moderately differentiated.(16)
1.2.4 EXTRAMURAL VASCULAR INVASION AND LYMPHATIC INVASION
Extramural vascular invasion (EVI) by tumour has been demonstrated to have an independent
adverse impact on outcome by multivariate analysis in many studies. A recent review of 5947
resected colorectal cancers in the Yorkshire area showed that 17.8% of tumours are EVI+ and that
the relative five year survival is 0.41(0.37 0.44), P=0.01.(17) Lymphatic invasion was also associated
with poorer overall survival in a study of 462 patients (colon cancer: 57% vs. 84%, P=0.0001; rectal
cancer: 38% vs. 71%, P=0.004). Patients with lymphatic vessel invasion also had a significantly
increased incidence of positive nodes (59% vs. 25%, P=0.0004).(18)
1.2.5 PERINEURAL INVASION
Perineural invasion is closely correlated with extramural vascular invasion, however a number of
studies have suggested that it is independently predictive of survival on multivariate analysis. One
such study found that overall survival was 25% in the presence of neural invasion and 64% without
neural invasion (p<.01).(19)
1.2.6 TUMOUR BORDER CONFIGURATION
For colorectal carcinoma, the growth pattern of the tumour at the advancing edge (tumour border)
has been shown to have prognostic significance that is independent of stage and may predict liver
metastasis. Specifically, an “irregular, infiltrating pattern of growth” as opposed to a “pushing

Protein expression in colorectal cancer EM Tweedle
8
border” has been demonstrated to be an independent adverse prognostic factor by several
univariate and multivariate analyses.(20) Diagnostic criteria recommended for detection of an
infiltrative border are as follows; inability to define limits of invasive border of tumour and/or an
inability to resolve host tissue from malignant tissue, dissection of tumour through the full
thickness of the muscularis propria without stromal response and/or dissection of mesenteric
adipose tissue by small glands or irregular clusters or cords of cells.(8)
1.3 MERSEYSIDE AND THE NORTH WEST
The incidence of colorectal cancer in the North West is above the English average in males (56
versus 51 cases per 100,000 population) and very similar to the UK average in females (34 cases per
100,000 population). The mortality in the North West region however is proportionally greater than
the English average in both sexes and is the highest of all the regions in England. In the UK as a
whole the North West region fares better than Scotland, Ireland and Wales; all of which have a
higher incidence and mortality rate for colorectal cancer.(21) I retrospectively analysed 662
patients who underwent surgical resection for colorectal cancer in the Royal Liverpool University
Hospital between 1999 and 2004. Overall survival data are shown in Figure 1.2. The proportion of
patients with nodal metastases is high compared to the UK average, (40% versus 23.6%) whereas
the proportion of patients presenting with distant metastases is less, (8% versus 9.2%).1 The

Protein expression in colorectal cancer EM Tweedle
9
Liverpool group of patients, however only include those who underwent resection of their primary
tumour.
A univariate and multivariate analysis was conducted of the data using a stepwise forward selection
approach. We confirmed that in our Liverpool cohort of n=662 the usual factors, age, T-stage, N-
stage, differentiation grade, resection margin status and vascular invasion remained independently
significant. In this group, perineural invasion and border configuration did not retain independent
significance.

Protein expression in colorectal cancer EM Tweedle
10
Figure 1.2: Overall survival according to Dukes’ stage in n=662 patients with resectable colorectal
cancer operated between 1999 and 2004.

Protein expression in colorectal cancer EM Tweedle
11
Table 1.2: Univariate and multivariate analysis of overall survival in n=662 resected colorectal
cancers from the Royal Liverpool University Hospital between 1999-2003
Variable Group Cases Univariate Multivariate
n= 662 (%)
HR(95%CI) χ2 p-
value HR(95%CI) χ
2 p-
value
Age (years) 71 years (34-99)
- 1.029 (1.017-1.041) 23.613 0.001
1.037 (1.025-1.050) 34.964 0.001
Diff Grade
Well
Moderate
Poor
Unrecorded
9 (1)
564 (85)
44 (7)
45 (7)
-
0.973 (0.311-3.04)
2.313 (0.208-7.560)
21.259
0.002
1.926
0.001
0.963
0.165
-
0.657 (0.207-2.082)
1.123 (0.337-3.738)
8.098
0.511
0.036
0.017
0.475
0.850
Resection margins
Involved
Clear
Unrecorded
563 (85)
98 (15)
1 (0)
-
0.449 (0.343-0.588)
33.931
0.001
-
0.660 (0.482-0.902)
-
6.771
0.009
Vascular invasion
Yes
No
Unrecorded
189 (17)
439 (66)
44 (7)
0.376 (0.297-0.476)
66.328
0.001
-
0.518 (0.408-0.668)
-
25.626
0.001
Perineural invasion
Yes
No
Unrecorded
54 (8)
564 (85)
44 (7)
-
0.479 (0.387-0.679)
16.993
0.001
-
0.824 (0.566-1.200)
-
1.018
0.313
Border Pushing
Infiltrating
Unrecorded
69 (11)
544 (82)
49 (7)
-
1.666 (1.088-2.550)
5.509
0.019
-
1.213 (0.784-1.876)
-
0.755
0.385
Infiltrate Sparse
Dense
Unrecorded
584 (88)
24 (4)
54 (8)
-
0.527 (0.249-1.117)
2.792
0.095
-
-
-
-
-
T-stage T1
T2
T3
T4
25(4)
78 (12)
403 (61)
156 (23)
-
1.009 (0.449-12.27)
1.832 (0.903-3.716)
12.642 (1.797-7.59)
51.773
0.001
2.817
12.642
0.001
0.982
0.933
0.004
-
1.073 (0.454-2.536)
1.433 (0.667-3.078)
2.157(0.976-4.764)
11.699
0.026
0.852
3.612
0.009
0.872 0.359
0.057
N-stage
N0
N1
N2
354 (53)
187 (28)
121 (19)
-
1.848 (1.433-2.384)
2.914(2.219-3.838)
62.054
22.356
59.082
0.001
0.001
0.001
-
1.619 (1.224-2.242)
2.337 (1.884-3.242)
27.281
11.390
25.812
0.001
0.007
0.001

Protein expression in colorectal cancer EM Tweedle
12
1.4 GENETIC PREDISPOSITION TO COLORECTAL CANCER
Hereditary cancer syndromes account for approximately 10% of colorectal cancer cases. The most
common condition is Lynch syndrome or hereditary nonpolyposis colorectal cancer (HNPCC) with 4-
5% of the total; 1% is attributed to familial adenomatous polyposis (FAP) and less than 1% of cases
are due to hamartomatous polyposis syndromes such as Peutz-Jegher, familial juvenile polyposis
and Cowden’s syndrome. Evidence suggests that the risk of developing colorectal cancer increases
with presence of a first-degree relative with the disease in the absence of an identifiable cancer
syndrome.(22) A list of conditions associated with an increased risk of colorectal cancer is shown in
Table 1.3.(23)
Table 1.3: Inherited predisposition to colorectal cancer (23)
Hereditary condition Genes implicated
Hereditary Non-polyposis Colorectal Cancer hMLH1, hMSH2,hMSH6
Familial Adenomatous Polyposis APC
Peuz-Jeghers syndrome STK11
Familial juvenile polyposis PTEN, SMAD4, BMPR1A

Protein expression in colorectal cancer EM Tweedle
13
1.4.1 HEREDITARY NON-POLYPOSIS COLORECTAL CANCER, HNPCCC
HNPCC sufferers are reported to have a 70% risk of developing colorectal cancer by 70 years.(24)
The tumours associated with the condition have the following characteristics;
1. Lower average age of onset of colorectal cancer than in the general population (45 years in Lynch
syndrome versus 63 years in the general population)
2. Proximal (right-sided) colonic cancer predilection (70%–85% of colorectal cancers in Lynch
syndrome are proximal to the splenic flexure)
3. Accelerated carcinogenesis (tiny adenomas can develop carcinomas within 2–3 years in Lynch
syndrome versus 8–10 years in the general population)
4. High risk of additional colorectal cancers (25%–30% of patients who have surgery for a Lynch
syndrome–associated colorectal cancer have a second primary colorectal cancer within 10 years of
surgical resection if they received a less than subtotal colectomy)
5. Increased risk of malignant disease at certain extracolonic sites; endometrium (40%–60% lifetime
risk for female mutation carriers), ovary (12%–15% lifetime risk for female mutation carriers),
stomach, small bowel, hepatobiliary tract, pancreas, upper uroepithelial tract (transitional cell
carcinoma of the ureter and renal pelvis), brain (in the Turcot syndrome variant of Lynch
syndrome).
The pathology of colorectal cancer is more often poorly differentiated, with an excess of mucoid
and signet-cell features, a Crohns-like reaction and an excess of infiltrating lymphocytes within the
tumour. Survival from this form of colorectal cancer is better than for sporadic cancers of the same
stage.(25) HNPCC is caused by mutations in the mismatch repair genes, most commonly MLH1,

Protein expression in colorectal cancer EM Tweedle
14
MSH2 or MSH6, that segregates in the patient’s family. Individuals at risk in HNPCC kindred are
heterozygous for mutations in the mismatch repair genes and so their normal cells do not have an
elevated mutation rate. The cells lose the ability to correct errors in replication only when a further
somatic mutation occurs in the functioning copy. Certain areas of the genome are vulnerable to
replication error once the mismatch repair mechanism is damaged, in particular, poly-oligo tracts
and base pair repeats known as microsatellites. Microsatellite instability, MSI, is seen in 90% of
colorectal cancers in HNPCC patients and in 15% of sporadic tumours, described in greater detail in
section 1.5.2.
The Revised Bethesda guidelines (2004) are used for detecting those colorectal tumours which
should be tested for microsatellite instability.(26) Detection of MSI in tumour tissue should prompt
further investigations in order to establish whether the patient carries a germline mutation
consistent with HNPCC. Sporadic tumours which display MSI have a more favourable prognosis than
non-MSI tumours, which can guide patient management and follow up. The criteria are as follows;
1. Patients aged less than 50 years with a diagnosis of colorectal cancer.
2. Patients with synchronous or metachronous colorectal or other syndrome-associated tumours,
regardless of age.
3. Patients aged less than 60 years with colorectal cancer with histology suggestive of microsatellite
instability (presence of tumour infiltrating lymphocytes, Crohns disease–like lymphocytic reaction,
mucinous or signet-ring differentiation, or medullary growth pattern).
4. Patients with at least one first-degree relative with a diagnosis of colorectal cancer or a
syndrome-associated tumour under age 50 years.

Protein expression in colorectal cancer EM Tweedle
15
5. Colorectal cancer or syndrome-associated tumour diagnosed at any age in two first- or second-
degree relatives.
1.4.2 FAMILIAL ADENOMATOUS POLYPOSIS, FAP
Familial adenomatous polyposis (FAP) has an incidence at birth of about 1 in 8,300. It manifests
equally in both sexes, and accounts for less than 1% of colorectal cancer (CRC) cases. The disease is
characterised by multiple polyps (>100) in the colon and rectum which have a 100% lifetime risk of
malignancy, usually before the age of 40 years.(27) This autosomal dominant condition is caused by
mutation in the Adenomatous Polyposis Coli (APC) tumour suppressor gene on chromosome 5q21.
Prophylactic colectomy is recommended before the age of 25 years, British Society of
gastroenterology (BSG) guidelines.(28) The conventional prophylactic operation has been subtotal
colectomy and ileorectal anastomosis (IRA). This necessitates surveillance screening of the rectal
stump with rigid or flexible sigmoidoscopy carried out at least every 12 months. There is a
cumulative risk of rectal cancer of 4%, 5.6% 7.9% and 25% at 5, 10, 15 and 20 years.(29)
Approximately 60% of FAP sufferers now undergo proctocolectomy and ileal pouch-anal
anastomosis.(30) FAP may present with some extraintestinal manifestations such as osteomas,
dental abnormalities (unerupted teeth, congenital absence of one or more teeth, supernumerary
teeth, dentigerous cysts and odontomas), congenital hypertrophy of the retinal pigment epithelium
(CHRPE), desmoid tumors, and extracolonic cancers (thyroid, liver, bile ducts and central nervous
system).(27)

Protein expression in colorectal cancer EM Tweedle
16
1.4.3 HAMARTOMATOUS POLYPOSIS SYNDROMES
This spectrum of syndromes include juvenile polyposis, Peutz-Jeghers syndrome, hereditary mixed
polyposis syndrome, the phosphatase and tensin homolog gene (PTEN) hamartoma tumor
syndromes (Cowden and Bannayan-Riley-Ruvalcaba syndromes), which are autosomal-dominantly
inherited and Cronkhite-Canada syndrome, which is acquired.(31) They are characterised by
multiple hamartomatous polyps in the small bowel, colon and rectum. Peutz-Jegher syndrome is
also associated with pigmentation of the peri-oral region, hand and feet and is caused by mutations
in the STK11 gene on chromosome 19p13. Familial Juvenile Polyposis is associated with mutations
in the PTEN, Smad4 and BMPR1A genes.
1.5 DEVELOPMENT OF SPORADIC COLORECTAL CANCER
The vast majority of colorectal cancers, 90%, develop sporadically following a series of genetic
mutations in the epithelial cells of bowel mucosa. Two distinct pathways of development have been
identified, chromosomal instability and microsatellite instability.
1.5.1 CHROMOSOMAL INSTABILITY: THE ADENOMA-CARCINOMA SEQUENCE
The adenoma-carcinoma sequence of colorectal cancer development was first proposed by Morson
et al. who described the similarities in the age and sex of patient, distribution and size of adenomas
and the subsequent development of colorectal cancer.(32) An estimated 5% of benign adenomas
undergo malignant transformation; though the risk of transformation increases with increasing size,

Protein expression in colorectal cancer EM Tweedle
17
grade of dysplasia and villous architecture. In 1988 Fearon and Vogelstein published a seminal
paper that elucidated the sequence of genetic mutations, which underpins the transformation of a
benign adenoma to a malignant lesion.(33) The candidate genes responsible for the various stages
were consequently identified as APC, K-ras, Deleted in colorectal cancer gene (DCC) and p53.
Mutations in these genes were described as occurring sequentially as the phenotype of the lesion
changed from normal mucosa, through small adenoma to adenocarcinoma (Figure 1.3). Rates of
mutation of these key genes in benign and malignant lesions are shown in the Table 1.4.
(34)
Normal colonic
epithelium
Dysplastic aberrant crypt foci
Intermediate adenoma
Late
adenoma Carcinoma
APC K-ras DCC p53
Figure 1.3: The adenoma-carcinoma sequence. The transition from normal colonic epithelium
through adenoma to carcinoma. The increasing loss of cellular differentiation and capacity to
metastasise correspond to the accumulation of genetic mutations described by Vogelstein.
Image adapted from Fearon ER, Vogelstein B. Cell, Vol. 61, 759-767.

Protein expression in colorectal cancer EM Tweedle
18
Table 1.4: Mutation rates of key genes in the adenoma-carcinoma sequence. A number of
adenomas and carcinomas were tested for mutations in APC, k-ras and p53. Higher rates of p53
mutation in carcinoma compared to adenoma support the theory that mutation of this gene is a
late event in the adenoma-carcinoma sequence.
An estimated 60-80% of colorectal cancers are thought to demonstrate chromosomal instability;
however the conventional sequential model of mutation accumulation has been questioned.
Studies have demonstrating that only 6.6% of all colorectal tumours were found to contain
mutations in APC, K-ras and p53, with 38.7% of tumours containing mutations in only one of these
genes.(35) Further work has indicated that this original model may be an over-simplification of
colorectal carcinogenesis. As new genetic mutations have been reported it is clear that there may
be several integrated routes towards the development of colorectal cancer,(36) shown later in
Figure 1.4. Some of the common genetic pathways are discussed below.(37)
1.5.1.1 THE WNT PATHWAY
In the normally functioning colonic epithelial cell, β-catenin is held in a complex in the cytoplasm
which includes the proteins APC and axin2.35 This complex targets β-catenin for phosphorylation by
Glycogen synthase kinase 3-beta (GSK3β). Phosphorylated β-catenin becomes multi-ubiquitinated
% frequency
Mutation Adenoma Adenocarcinoma
APC 59-82 52-60
K-ras 12-34 (<1cm)
44-59 (>1cm)
35-41
p53 2-26 51-74

Protein expression in colorectal cancer EM Tweedle
19
and subsequently degraded in proteasomes. Wnt proteins bind to cell-surface receptors of the
Frizzled family, causing the receptors to activate the membrane-bound Dishevelled (DSH) family of
proteins, inhibiting degradation of β-catenin and ultimately resulting in migration of the protein
into the nucleus. Activation of DSH inhibits the axin/GSK-3/APC complex preventing proteolytic
degradation of the β-catenin intracellular signalling molecule. A pool of cytoplasmic β-catenin
stabilizes, and some β-catenin is able to enter the nucleus and interact with the T-cell factor (TCF)
family of transcription factors to promote specific target genes promoting cell proliferation.
Mutations in components of the ‘β-catenin destruction complex’ lead to aberrant stabilization of β-
catenin and thus to constitutive, Wnt-independent activation of TCF/β-catenin signalling.(38)
The most frequent Wnt pathway mutation is in the APC gene which commonly produces a
truncated form of the protein which is incapable of complexing with β-catenin. APC is an enigmatic
protein which has been implicated in numerous other cellular processes, such as cell migration,
chromosomal stability, cell cycle regulation and cell adhesion. APC is connected to microtubules,
and it plays a role in the correct establishment of the mitotic spindle. Disturbance of APC function
by mutations could lead to chromosomal instability (CIN).(39) Aneuploidy (the abnormal number of
chromosomes both quantitatively and qualitatively) is a sign of CIN and is a common characteristic
of colon cancer cells, occurring in 85% of cancers. A role for APC in regulating the cell cycle has also
been described, both directly and via components of the retinoblastoma, RB pathway.(40)
β-Catenin is mutated in up to 10% of all sporadic colon carcinomas. These mutations result in
stabilization of β-catenin and activation of Wnt signalling. Germline mutations of axin2 have also
been described and sporadic mutations occur in 25% of microsatellite-unstable colorectal tumours.

Protein expression in colorectal cancer EM Tweedle
20
Recent evidence suggests that colorectal cancer cells frequently express Wnt proteins and thus
stimulate the Wnt pathway by autocrine mechanisms.(38)
1.5.1.2 RAS/RAF PATHWAY
K-ras is a member of a group of oncogenes (the others being H- and N-ras) located on chromosome
12p12. The ras proteins are membrane bound guanine nucleotide binding proteins that transduce
growth-receptor signals across the cell membrane to effector molecules. In the resting state they
are bound to GDP. Signalling by the ras proteins is activated by GTP binding and inactivated by
intrinsic GTPase activity which automatically terminates the signal. Mutated K-ras is unable to
hydrolyse GTP resulting in abnormal prolongation of growth signal. This results in increased and
unregulated cell proliferation and growth factor induced differentiation.(41)
The first identified downstream effectors of ras were the RAF serine/threonine kinases. The RAF
family is composed of three members, ARAF, BRAF and RAF1, which exhibit a high degree of
homology within three conserved regions. Each kinase has a ras-binding domain and cysteine-rich
domain that mediate interaction with GTP-bound ras. On ras association, ras is recruited to the
plasma membrane and is phosphorylated. Gene disruption studies in mice have shown that BRAF
interacts with the MEK/ERK pathway causing activation. The higher propensity of BRAF towards
MEK/ERK activation is thought to be a reason that only BRAF mutations, and not comparable
mutations in the other RAF proteins, have been observed to be associated with malignancy.(42)
BRAF mutations have been reported in 4-9% of sporadic colorectal tumours and are associated with
a significantly higher proportion of MSI tumours.(43, 44) Research into BRAF mutations in MSI
tumours has identified that the presence of a BRAF mutation indicates the tumour is not related to

Protein expression in colorectal cancer EM Tweedle
21
HNPCC and that germline testing of MLH1 in that individual is not warranted. It has been suggested
as a rapid and inexpensive method of selecting patients for HNPCC testing.(45)
1.5.1.3 18Q
Chromosomal loss within the region of chromosome 18q has been shown to be associated with
poor prognosis in stage II and III colorectal cancer.(46, 47) This genomic region contains a number
of genes which have been studied for their possible contribution to colorectal cancer, including,
DCC (Deleted in Colorectal Carcinoma),(48) Smad2(49, 50) and Smad4.(50, 51) The Smad proteins
form complexes which migrate into the nucleus causing gene transcription after Transforming
Growth Factor-Beta (TGF-β) ligand signalling.(52) The TGF-β superfamily of ligands include: Bone
morphogenetic proteins (BMPs), Growth and differentiation factors (GDFs), Anti-müllerian
hormone (AMH), Activin, Nodal and TGFβ. Signalling begins with the binding of a TGF-β superfamily
ligand to a TGF-β type II receptor. The type II receptor is a serine/threonine receptor kinase, which
catalyses the phosphorylation of the Type I receptor. Receptor-regulated Smad proteins (R-Smad)
are recruited to the activated membrane-bound receptor-ligand complex and are in turn
phosphorylated on their c-terminus leading to R-Smad activation. R-Smads include Smad2 and
Smad3 from the TGF-ß/Activin/Nodal branch, and Smad1, Smad5 and Smad8 from the BMP branch
of TGF-ß signalling. Cytoplasmic Smad4 forms heteromeric complexes with activated R-Smads
which migrate into the nucleus and interact with transcriptional activators.
There is considerable evidence implicating mutation of the Smad4 gene in the development and
progression of colorectal cancer. Germline mutations of the Smad4 gene are associated with
human familial juvenile polyposis,(53, 54) an autosomal dominant disorder characterized by a

Protein expression in colorectal cancer EM Tweedle
22
predisposition to Smad4-negative gastrointestinal polyps and cancer at a young age. Consistent
with a contributory role for Smad4 in this process, Smad4 (+/-) knock-out mice also develop Smad4-
negative gastrointestinal polyps.(55, 56) In human colorectal cancer, the frequency of mutational
inactivation of Smad4 increases with advancing stage.(57) Smad4 mutations in adenoma or primary
invasive carcinoma without distant metastasis occur in approximately 10% of cases.(58) In contrast,
for patients who have primary invasive carcinoma with distant metastasis, the frequency of Smad4
mutations is 35%, suggesting a strong link between Smad4 loss and disease progression. Our group
reported a connection between the numbers of S100A8 and S100A9-positive monocytes in the
stroma of pancreatic adenocarcinomas and the Smad4 expression in the tumour.(59) A similar
report in colorectal cancer demonstrated a strong relationship between stromal infiltration and
Smad4-loss and concluded that the combination of these features correlated with poor survival.(60)
1.5.1.4 P53
p53 is a tumour suppressor gene with numerous vital functions including prevention of
inappropriate cell division, repair of DNA damage, induction of apoptosis and inhibition of
angiogenesis.(61) In unstressed cells, p53 levels are kept low through a continuous degradation of
p53. The murine double minute 2 protein (Mdm2) binds to p53 preventing its action and transports
it from the nucleus to the cytosol. Mdm2 acts as ubiquitin ligase and covalently attaches ubiquitin
to p53 and thus marks p53 for degradation by the proteasome.(62)
p53 becomes activated in response to a myriad of stress types, which include but are not limited to
DNA damage (induced by ultraviolet light, irradiation, or chemical agents), oxidative stress, osmotic
shock, ribonucleotide depletion and deregulated oncogene expression. This activation is marked by

Protein expression in colorectal cancer EM Tweedle
23
two events; firstly the half-life of p53 increases markedly leading to a rapid accumulation of the
protein in stressed cells. Secondly, phosphorylation of the N-terminal domain of p53 causes a
conformational change, activating the protein as a transcriptional regulator. Activated p53 directly
stimulates p21Waf1/Cip1 expression which in turn inhibits cyclin dependent kinases (CDKs).(63)
CDKs are key regulators of the cell cycle which ensure that DNA replication (S phase) follows on
from the resting phase G1. Down regulation of CDKs inhibits both the G1 to S and the G2 to mitosis
transitions in the cycle, effectively causing cell cycle arrest.
A proportion of cells in which p53 is activated undergo apoptosis rather than cell cycle arrest. There
are a number of mechanisms by which p53 has this affect. p53 is thought to cause translocation of
various apoptosis-inducing proteins from the mitochondria including members of the BCL-2 family,
Bax, Noxa and PUMA.(64) p53 has also been implicated in the membrane death receptor induced
pathway of apoptosis. DR5/KILLER and FAS are two of the death receptors observed to be up-
regulated by p53. Activation of PIDD, a death domain containing protein, by p53, also induces
apoptosis and is likely to function through the death receptor pathway.(65)
p53 participates in DNA damage repair. Ataxia-telangiectasia mutated gene product (ATM) is a
general sensor to DNA damage and phosphorylates p53, breast cancer protein (BRCA), Nijmegen
breakage syndrome 1 (NBS1) and Fanconi-Anemia−related tumor suppressor (FA) activate the DNA
repair process. BRCA and p53 work together in nucleotide excision repair of DNA adducts.(66) p53
also participates in chromosomal recombination and chromosomal segregation.(67)
Mutation in p53 prevents the normal function of the gene which is to prevent replication of cells
with damaged DNA. p53 mutations more often occur late in carcinogenesis, frequently preceding

Protein expression in colorectal cancer EM Tweedle
24
metastasis. It is perhaps unsurprising that these tumours have a worse prognosis than tumours
with functioning p53.(68)
1.5.2 MICROSATELLITE INSTABILITY, MSI
Microsatellites are short, tandem repeats of nucleotide sequences which make up 3% of DNA and
are found throughout the genome. Due to their repetitive nature they are prone to errors in
replication. In normal cells, the mis-match repair (MMR) system is responsible for the correction of
errors which result from DNA polymerase slippage during DNA replication. MMR is accomplished in
eukaryotes by a number of highly conserved proteins including heterodimers of MSH2/MSH3 or
MSH2/MSH6 that are required for the recognition of mismatches or small insertions or deletions,
and a heterodimeric complex of MLH1/PMS2 which links mismatch recognition to the activation of
cleavage and repair. In MMR-deficient cells, microsatellite sequences are highly susceptible to
insertion and deletion mutations due to increased error rates of replicative DNA polymerases at
these loci.(69) Hence, the microsatelite instability (MSI) phenotype represents a surrogate marker
for the detection of MMR deficiency.(70) The National Cancer Institute recommend the testing of
five microsatellite markers for determination of MSI, (BAT-25, BAT-26, D2S123, D5S346 and
D17S250).(71) Two or more positive markers which demonstrate instability is classed as MSI-high
and germline screening for HNPCC is indicated. Approximately 15% of sporadic cancers show high
levels of MSI (MSI-H). Most of these tumours are MMR deficient due to epigenetic silencing of
MLH1. It appears that BRAF mutations are associated with the sporadic form of MSI-H, but not the
hereditary form, (HNPCC).(72) Epigenetic silencing occurs when the promoter region of genes are
methylated, preventing them for being transcribed. CpG-islands are DNA sequences where

Protein expression in colorectal cancer EM Tweedle
25
cytosine, (C) and guanine, (G) lie adjacent to each other. These islands are very susceptible to
methylation and are often found in promoter regions. Patients who display this trait are referred to
as having the CpG-island methylator phenotype, CIMP+.(73)
Tumours have been described with low levels of MSI, termed MSI-L.(74) These tumours are thought
to have a separate pathway of development to MSI-H tumours involving either (i) increased
generation of methylG:T mismatches due to loss of expression of 0-6-Methylguanine DNA
Methyltransferase (MGMT) that would stress the DNA mismatch repair machinery and (ii) partial
methylation and loss of expression of the DNA mismatch repair gene MLH1. Tumours with MGMT
methylation are often associated with K-ras mutation. Increasing interest in serrated adenomas as
precursor lesions for these MSI-L tumours is developing.(37, 75)

Protein expression in colorectal cancer EM Tweedle
26
(72)
Figure 1.5: Alternative pathways in colorectal cancer
Figure 1.4: Putative pathways in the development of colorectal cancer. Multiple pathways of
development are shown including germline mutation, chromosomal instability (CIMP-
negative) and microsatelite instability (CIMP-positive) pathways. Image adapted from Jass JR.
Surg Oncol. 2007 Dec;16 Suppl 1:S7-9. Epub 2007 Nov 26.

Protein expression in colorectal cancer EM Tweedle
27
1.6 DIAGNOSIS: POPULATION-BASED COLORECTAL CANCER SCREENING
Diagnosis of colorectal cancer to date has relied on presentation of the patient to the general
practitioner or local Accident and Emergency department with symptoms or signs suggestive of a
colonic neoplasm. These features include, change in bowel habit (frequently to looser stool), blood
in the stool, weight loss, iron deficiency anaemia or an abdominal mass.(76) The natural history of
colorectal cancer makes it an ideal candidate for population-based screening. The disease is
widespread in the population, readily detected at a pre-neoplastic stage, (adenomatous polyps) and
is easily treated. Population-based screening for colorectal cancer commenced in June 2006 in the
UK and is anticipated to reduce cancer-specific mortality by 15%. The current protocol in the UK
uses the Faecal Occult Blood Test, FOBT, for those aged 60-69 years. Several different modalities
can be used for screening; the evidence-base for these is discussed below. Screening is set to have a
major impact on the management of colorectal cancer.(77) The proportion of patients presenting
with small and early colorectal cancers in the UK is predicted to double promoting a shift towards
local excision and other minimally-invasive surgical techniques. The efficacy of the various methods
used for screening will be vital for the early detection of flat and depressed tumours.(78)
1.6.1 COLONOSCOPY
Colonoscopy is recognized as the ‘gold-standard’ for detection of cancers and polyps. It is the only
modality with the capacity to detect and remove adenomatous polyps from the whole colon in one
session. Most alternative colorectal cancer screening modalities such as FOBT, flexible
sigmoidoscopy and barium enema are utilised as a tool for the selection of patients for colonoscopy

Protein expression in colorectal cancer EM Tweedle
28
and ultimately polypectomy and/or surgery.(77) It is perhaps surprising that there are no
randomised controlled trials that demonstrate the effectiveness of colonoscopy in reducing
mortality from colorectal cancer. One small, randomised trial from Norway showed a 75%
reduction in the number of colorectal cancers that developed in the screened group after 10 years
follow up but no survival information was available.(79) The efficacy of colonoscopy can be
extrapolated from case-control studies of sigmoidoscopy; these demonstrated a risk reduction of
80% for death from colorectal cancer in those with a history of flexible sigmoidoscopy
examination.(80, 81) Evidence from the large cross-sectional study of the US National Polyp
Database reported reductions in the expected number of colorectal cancers following colonoscopy
and polypectomy of 76 – 90% compared to reference populations.(82, 83) There is evidence for
relative risk reduction for colorectal cancer of 70% following negative colonoscopy; this reduces to
55% at 5 years and 28% at ten years.(84) The detection rate for invasive cancer at colonoscopy in
cross-sectional studies is reported as 0.5-1% with 6-12% having high-risk lesions (size ≥10mm,
villous architecture, poorly differentiated histology or invasive cancer).(85) Almost 50% of patients
with a proximal neoplasm have a sentinel lesion in the distal colon. In one such study 64% of all
cancers and polyps ≥10mm were located within reach of a flexible sigmoidoscope and 53% were in
the sigmoid colon or rectum.(86) In the younger age group, 40-49 years, the detection rate for
significant polyps falls to 3.5% and screening below the age of 50 years is not recommended in the
USA.(87)
No perforations have been reported as a result of colonoscopy in the three large US trials although
10 patients (0.3%) had post-polypectomy bleeding.(86) In the UK FOBT trial the overall

Protein expression in colorectal cancer EM Tweedle
29
complication rate following colonoscopy was 0.5%; 5 perforations, 1 major bleed and 1 snare
entrapment in 1474 screened.(88) Missed lesions have been reported after colonoscopy. Miss-rates
have been reported up to 6% for polyps <10mm after back-to-back colonoscopy. One such study
found that 2% of asymptomatic patients undergoing screening had a missed polyp. Almost one-
quarter of these missed lesions were within 10cm of the anal verge, the majority of the remainder
were located on a fold in the colon.(89) Ten-yearly colonoscopy for the over 50-year age group is
the favoured colorectal cancer screening policy by the American College of Gastroenterologists.(3,
90) There is not sufficient evidence at present to determine whether this a cost effective approach
in the UK or other European countries.
1.6.2 FLEXIBLE SIGMOIDOSCOPY
Three large randomised trials of once-only flexible sigmoidoscopy have been performed in the
UK(91), Italy(92) and Norway(93) and reported on neoplasia detection rates. The UK trial has now
reported and found that 727 were died of certified colorectal cancer out of 170038 participants,
(538/112939 in the control group versus 189/57099 in the flexible sigmoidoscopy group). In
intention-to-treat analyses, colorectal cancer incidence in the intervention group was reduced by
23% (hazard ratio 0.77, 95% CI 0.70-0.84) and mortality by 31% (0.69, 0.59-0.82).(94) Two case-
control studies from the US have shown a reduction in colorectal cancer mortality from a
combination of flexible and rigid sigmoidoscopy of 60-80%.(80, 81) Cancer detection rates for
flexible sigmoidoscopy have been reported as 0.3-0.7%. The incidence of distal cancers following
sigmoidoscopy is decreased to 4% of expected in the first year of follow-up and remains 18% of
expected after 4 years.(95) The removal of significant distal adenomas during the initial

Protein expression in colorectal cancer EM Tweedle
30
examination is an attraction of the flexible sigmoidoscopy approach. In direct comparison with
FOBT, flexible sigmoidoscopy has been shown to detect approximately three times as many of
these lesions.(96, 97)
There are disadvantages of using flexible sigmoidoscopy for screening. Referral rates for
colonoscopy varied from 5-19% depending on the protocol used, but were higher than the 1.2-2.1%
referral rates seen in FOBT trials, (unrehydrated tests). Two perforations after flexible
sigmoidoscopy were seen in total during the three trials, a complication rate of 3 per 100,000
examinations. Compliance with flexible sigmoidoscopy screening is lower than that for FOBT
screening. In the UK 55% of the general population expressed an interest in flexible sigmoidoscopy
after letter invitation, of these 71% attended for the examination, an overall compliance rate of
39%.(91) This is lower than the reported 54% compliance rate recorded in the first round of the UK
FOBT trial.
1.6.3 DOUBLE-CONTRAST BARIUM ENEMA, DCBE
No randomised controlled trials are available on either single or double contrast barium enema for
colorectal cancer screening of asymptomatic patients. The sensitivity of DCBE for cancers has been
reported as 80-100%, whereas detection of polyps has been found to be poor.(98) Studies of DCBE
in the average-risk population are rare. One study, of patients with a positive FOBT, compared
DCBE to colonoscopy and found that barium enema detected 100% of cancers but only 27% of
polyps ≥10mm. Polyps in the rectum were particularly poorly diagnosed with none of 7 polyps
<10mm and 2 of 3 polyps ≥10mm detected.(99) One retrospective cross-sectional study of DCBE in
the average-risk population had a detection rate of 0.7% for adenocarcinoma and 4.3% for polyps
Protein expression in colorectal cancer EM Tweedle
31
≥10mm.(100) The low detection rate for polyps makes DCBE an unattractive option for screening
and it is rapidly being superseded by CT colonography.
1.6.4 CT COLONOGRAPHY
CT colonography is a new diagnostic tool for lesions in the colon and very few studies have used
this technology for screening of asymptomatic patients. The initial results of one cross-sectional
study of 1110 asymptomatic adults found the rate of invasive cancer to be 0.3% and of large polyps
(≥10mm) to be 3.9%.(101) Conventional colonoscopy was performed in 40 of these patients and the
polyp was identified in 38 patients (95% concordance). The detection rate for polyps in this study
was vastly improved compared to DCBE but not as high as optical colonoscopy (3.9% vs. 5.4%). No
complications of CT colonography were reported and many authors in the US predict this
examination becoming available via private health insurance schemes as a minimally invasive
alternative to ten-yearly colonoscopy.
1.6.5 GUAIAC FAECAL OCCULT BLOOD TESTING, G-FOBT
The guaiac-based test for faecal blood was first developed in the 1970s as a screening test for
colorectal cancer when endoscopic technology was in its infancy. G-FOBT makes use of the
pseudoperoxidase activity of haemoglobin. Guaiac turns blue after oxidation by oxidants or
peroxidases in the presence of an oxygen donor such as hydrogen peroxide. For the guaiac test to
function, the haemoglobin must be degraded in the GI tract into haem and globin. As a result of the
mechanism of action guaiac-based tests were initially thought to be more sensitive for causes of
upper GI or proximal bleeding, however, they have been found to be better at detecting larger,

Protein expression in colorectal cancer EM Tweedle
32
more distal lesions. The sensitivity of G-FOBT for distal (rectosigmoid) polyps has been reported as
86% compared to 26% for proximal (ascending or transverse colon) polyps.(102)
G-FOBT with follow-up colonoscopy is the only method of colorectal cancer screening which has
been shown to reduce mortality from the disease in several randomised controlled trials. Three
major randomised controlled trials from Minnesota, USA(103, 104), Nottingham, UK(105, 106) and
Funen, Denmark(107) have shown a consistent reduction in colorectal cancer specific mortality of
15-21%. The Minnesota trial had the longest follow up period of 18 years; they also rehydrated the
FOB tests with a drop of distilled water prior to processing in order to increase the test sensitivity.
These differences may explain the higher rate of colonoscopy compared to the Nottingham trial,
38% versus 4%.(108) The detection rate for invasive cancer using G-FOBT with follow-up
colonoscopy is reported as 0.2%, with a 1.8% chance of detecting any high-risk lesion. The main
disadvantage of using G-FOBT is its relatively low sensitivity for polyps and cancer, (30% and 50%
respectively). Unrehydrated G-FOBT detected half of colorectal cancers in the average-risk
population. This may have been affected by compliance rates in the UK and Danish pilot studies,
which, at 57-67% were lower than anticipated.(105-107)
1.6.6 FAECAL DNA TESTING
Faecal DNA testing relies on small amounts of altered DNA being exfoliated into the stool from
colonic adenomas or carcinomas.(109) DNA is stable in stool and can be isolated and specific
human DNA sequences extracted and amplified.(110) The main disadvantage of this technique is
the relatively low frequency in which single genes are mutated in adenomas, (60% APC, 50% K-ras).
This has been overcome by forming a panel of genes which may include APC, K-ras, p53 and BAT-

Protein expression in colorectal cancer EM Tweedle
33
26. Faecal DNA screening in the average risk population has been shown to be more sensitive than
G-FOBT with the same specificity.(111) The detection rate for advanced neoplasia, (carcinoma or
adenoma≥10mm) was 18% for faecal DNA and 11% for G-FOBT which was disappointingly low in
both cases. Currently, the cost of faecal DNA testing prohibits widespread use on a population
basis.(112) Refinements to the marker panel which increase sensitivity and efforts to reduce costs
may see faecal DNA testing ultimately supersede FOBT.
1.7 MANAGEMENT OF COLORECTAL CANCER: THE RATIONALE FOR
TREATMENT
1.7.1 SURGERY
The mainstay of treatment for colorectal cancer is complete surgical excision of the lesion including
the arterial supply, venous drainage and lymph node group for the involved segment of bowel.
Approximately 80% of patients who present with colorectal cancer undergo resection of the
primary lesion. Adequate surgical resection is most vital in anterior resection or abdomino-peroneal
resection for rectal cancer in which the aim is to preserve the mesorectal envelope and thus
minimising the risk of a positive resection margin. The specimen is graded from 1-3 with 3
corresponding to a completely intact specimen; a grade 3 resection is proven to be associated with
lower recurrence rates. (113) Resection of the tumour is deemed to be complete on
histopathological evaluation of the specimen if the tumour is >1mm from the surgical excision

Protein expression in colorectal cancer EM Tweedle
34
margins. The National Cancer Institute also recommends that 12 or more lymph nodes should be
examined in each specimen in order to accurately stage and treat colorectal cancers.(114)
1.7.2 ADJUVANT CHEMOTHERAPY
Adjuvant chemotherapy has been recommended by the National institute for Clinical Excellence,
NICE for all patients with lymph node metastases.(115) A number of large prospective randomised
trials have now beyond doubt recognised the value of 5-fluorouracil (5FU) based chemotherapy in
the adjuvant treatment of stage-III (Dukes C) colon cancer. (116-118) The mechanism of action of
5FU is via incorporation in RNA as fluorouridine triphosphate and inhibition of thymidylate
synthetase by fluorodeoxyuridine monophosphate, often in conjunction with reduced folates for
maximum efficacy to interfere with DNA synthesis. Most studies have demonstrated a reduction of
22-33% in risk of death for this group. There is a large body of evidence that suggests the first line
use of a combination therapy of irinotecan and 5FU/folinic acid (FA) may provide a more efficacious
treatment regime.(119) However, NICE guidelines, produced in 2002, suggest irinotecan be
reserved for use as a single-agent, if 5FU treatment fails. The QUASAR trial reported a very small
benefit of adjuvant treatment for stage-II patients overall, (4-5%).(120) Patients with poor
prognostic indicators on histology, such as poor differentiation, T4 or perforated lesion, may be
offered chemotherapy at the discretion of the treating clinician. In patients with unresectable
disease, 5FU has been shown to improve survival over supportive care alone, (median survival 11.7
versus 8 months and 1-year survival of 50 versus 34%).(121) Oxaliplatin has been recommended as
a first-line treatment in the very few cases where inoperable liver metastases could potentially be

Protein expression in colorectal cancer EM Tweedle
35
made operable with chemotherapy. Potentially 13.5% of these patients could be rendered
resectable with chemotherapy and those resected patients achieved a 39% 5-year survival.(122)
1.7.3 ADJUVANT RADIOTHERAPY
Cells exposed to ionizing radiation acquire multiple sites of bulky DNA lesions and double strand
breaks. The accumulation of damage, specifically double strand breaks or adducts stalling the
replication forks are stimulation signals for a global response to DNA damage. The common
features of global response are induction of multiple genes, cell cycle arrest, and inhibition of cell
division culminating in apoptosis. Radiotherapy is only used in the management of rectal cancer as
the mobility of the colon within the abdomen makes consistent targeting of the lesion difficult.
Small bowel is very sensitive to radiotherapy and irradiation of the abdomen can result in severe
radiation enteritis.(123) Evidence from the CR07 trial suggests that recurrence rates for resectable
rectal cancer are reduced by approximately 15% with the routine administration of short-course
radiotherapy prior to surgery.(124) Some rectal tumours are bulky and appear to infiltrate the
resection margin on pre-operative imaging. Pre-operative chemoradiation therapy for 6 weeks to
‘down-stage’ the tumour doubles the rate of sphincter-sparing operations and lowers the rates of
local recurrence, acute toxicity, and long-term toxicity. No difference in disease-free or overall
survival was observed on comparison of pre or post-operative chemoradiotherapy.(125)
1.7.4 NEW ADJUVANT TREATMENT MODALITIES
Monoclonal antibodies directed against epidermal growth factor receptor, EGFR (cetuximab) and
vascular endothelial growth factor, VEGF (bevacizumab) are new adjuvant therapies. In an initial
Phase II study of 121 patients whose tumours expressed EGFR and were refractory to irinotecan,

Protein expression in colorectal cancer EM Tweedle
36
treatment with the combination of cetuximab and irinotecan resulted in a response rate of 17%.
(126) In a randomized, Phase III trial of 815 previously untreated patients with metastatic disease,
the addition of bevacizumab to irinotecan plus fluorouracil/leucovorin (IFL) led to a statistically
significant improvement in response rate (44.8% versus 34.8%, P = 0.004) and a 4.7-month
prolongation in median overall survival (20.3 months versus 15.6 months, p = 0.001).(127) Sub-
group analysis of metastastic colorectal cancer treated with cetuximab has revealed that response
to the drug is poor in those patients with K-ras mutations in the tumour. Mutant K-ras activates the
MARP/ras cell proliferation pathway downstream of the EGFR, which means that targeting the
receptor with cetuximab is ineffective.(128) Tumour-specific adjuvant chemotherapy treatment is
increasingly possible with the new generations of monoclonal antibodies.
1.8 EARLY COLORECTAL CANCER: MANAGEMENT OPTIONS
As more pre-cancerous adenomatous polyps and early cancers are detected with screening the
scope for local resection of tumours will increase. The impact of tumour morphology on these
treatment options is still controversial with some studies suggesting local resection should be
avoided in depressed tumours, whereas other studies reporting safe and effective treatment in this
group.(129) The accurate staging of all tumours prior to local treatment is imperative and signs
that predict which early tumours are likely to have infiltrated deep into the bowel wall, or have
lymph node metastases are vital. Biomarkers which predict recurrence of tumour after local
resection will be unvaluable in the management of early and small tumours.

Protein expression in colorectal cancer EM Tweedle
37
1.8.1 TRANSANAL ENDOSCOPIC MICROSURGERY (TEM)
TEM is a minimally invasive surgical technique originally designed by Buess et al. in the 1980s.(130)
The anal sphincter is dilated with a large-diameter, (4cm) operating sigmoidoscope to
accommodate optics, suction, and ports for dissecting instruments. Endoscopic surgical instruments
are advanced into the rectum after insufflation. The magnified three-dimensional image allows an
optimal view of the tumour and facilitates precise dissection. The plane of dissection extends
through the muscularis propria into the surrounding adipose tissue; the remaining defect is
typically closed using a continuous suture. TEM is most commonly used to resect large, benign
rectal adenomas. In this group, microscopic involvement of the resection margin is significantly
associated with recurrence; the overall recurrence rate is reported as 2 - 10.5% at 24 months.(131)
No guidelines have been established for following up this patient group, common practise is rigid or
flexible sigmoidoscopy at 4 months then 6-12 monthly thereafter. Three-monthly examinations are
suggested for patients with positive margins. TEM has been used to resect rectal cancers, either
with curative intent (for T1 tumours) or palliative intent in more advanced lesions. The recurrence
rate in the UK has been reported as 20% pT1 (five-year survival of 77%), 25% pT2 (five-year survival
74%) and 59% pT3 (five-year survival 35%).(132) No consensus on follow up for these patients has
been established. Most authors have recommended salvage open surgery for patients with high-
risk lesions, (villous architecture, positive resection margins or poorly differentiated tumour on
histology), initially treated with curative intent.

Protein expression in colorectal cancer EM Tweedle
38
1.8.2 ENDOSCOPIC MUCOSAL RESECTION (EMR) AND SNARE-POLYPECTOMY
EMR was first reported in 1988 by Tada et al. as a method of excising large, sessile polyps not
amenable to conventional snare-polypectomy.(133) The technique describes the injection of fluid,
(typically 1:40,000 adrenaline solution and methylene blue) into the submucosa around a polyp
causing the lesion to ‘lift’ away from the muscularis propria. The lesion is then resected with a
conventional polypectomy snare, piecemeal if necessary. Most authors advocate EMR for benign
polyps. Lesions that are indurated, ulcerated, and/or exceedingly friable at endoscopy, as well as
those that fail to ‘lift’ in response to a submucosal injection of fluid may contain invasive
malignancy and should be avoided.(134) A recurrence rate of 17-21% with a median follow-up of
12-24 months has been reported following resection of benign sessile polyps in the colon and
rectum. The rate of invasive adenocarcinoma in these studies was reported as 12-18%.(134, 135)
The guidelines issued by the British Society of Gastroenterologists for the follow-up of patients
following conventional snare polypectomy are well established.(136) These polyps generally have a
narrow stalk which, when snared, allows for easier, safer removal with a greater chance of
complete excision. The British Gastroenterology Society recommends that those who have
undergone removal of 5 adenomas or 3 adenomas (at least one of which is 10mm) are
categorised as high-risk and should be offered follow-up colonoscopy in 12 months.(136) The
cumulative risk, for these patients, of developing invasive cancer is estimated as 24% at 20 years
without polypectomy.(137) Patients who have undergone removal of 1-2 small adenomas,
(<10mm) are classed as low-risk and given the option of one surveillance colonoscopy in five years,
or no follow up. Intermediate risk patients, 3-4 adenomas or one adenoma >10mm should be
offered a further examination in three years.(136)

Protein expression in colorectal cancer EM Tweedle
39
1.9 FLAT AND DEPRESSED-TYPE COLORECTAL CANCER
Flat and depressed colorectal cancers have been reported in Japan since Muto in 1985.(138, 139) A
series of case reports documented patients with lymph node or distant metastases from colorectal
cancer in which the primary lesion was a diminutive depressed colorectal cancer, often 10-20mm in
diameter. A common feature of these reported lesions was the small size, infiltrative growth
pattern and the presence of early, aggressive metastases. These rare tumours were thought to be a
phenomenon confined to the Japanese population; however colonoscopic studies began to identify
depressed tumours in Western populations. The presence of flat and depressed cancers in
European populations is now firmly established with a succession of papers from the UK, France,
Germany and Sweden.(140-146)
1.9.1 MORPHOLOGICAL CLASSIFICATION OF COLORECTAL LESIONS
In 1997, Kudo devised the Japanese Research Society Classification (JRSC) for the morphology of
colorectal adenomas which he based on the established classification of early gastric cancer. Four
basic groups were described: Type I (polypoid) in which the adenoma protruded into the lumen of
the colon with a height > 2x the depth of the mucosa: Type IIa, (flat), the lesion is elevated but the
height is < 2x the depth of the surrounding mucosa, Type IIb (flat) the lesion lies flush with the
mucosa and Type IIc, (depressed), the lesion is sunken in relation to the surrounding mucosa. The
full classification is shown in Figure 1.5.(147)

Protein expression in colorectal cancer EM Tweedle
40
Figure 1.5: JRSC classification of colorectal cancer morphology. Polypoid, flat and depressed
cancer types are depicted in relation to level of normal colonic mucosa. Image adapted from Kudo,
S et al. World J Surg 21, 694-701 (1997).
1.9.2 FLAT AND DEPRESSED LESIONS: INCIDENCE
Flat and depressed tumours remain rare. Detection rates at routine colonoscopy are similar in
Japanese and Western populations, shown in Table 1.5.(138, 142, 143, 146, 148-154) The most
recent UK study from St Marks’ Hospital found that 71% of T1 lesions detected at colonoscopy were
flat or depressed with 10% of all detected cancers of flat or depressed morphology.(153)
Establishing the incidence of flat and depressed tumours in resected specimens retrospectively is

Protein expression in colorectal cancer EM Tweedle
41
hampered by the difficulties in applying the JRSC classification to large cancers. Large cancers often
show a mixed pattern of growth as they progress with areas of ulceration and distortion of
surrounding tissue.(155) Ishihara (2000) and Nasir (2003) retrospectively compared a number of
surgically resected polypoid and non-polypoid tumours of all sizes. In both papers there were
difficulties in classifying tumours with mixed growth patterns or surface ulceration, leading to a
number of exclusions. This may go some way to explain why a greater variation in incidence of flat
cancers is reported in resected colorectal cancer. Small or diminutive tumours have been studied
with more consistent results. Kubota (1996) reported an incidence of 1% diminutive, (10mm), flat
or depressed colorectal cancer seen in resected colon which approaches that of colonoscopic
studies.156 Ishihara (2000) analyzed small colorectal cancers, (20mm), and demonstrated an
overall incidence of 1.3% with 15/23 (65%) of small cancers having flat or depressed
morphology(156) (Table 1.6). In a retrospective study of small, flat and depressed colorectal
cancers, (20mm) that I undertook with colleagues in the Royal Liverpool University Hospital, we
reported an incidence of 2.2% (39/1763) which concurs well with the Japanese studies.(157) This
suggests that the aetiology and natural history of these lesions is similar between East and West.
The study is described in detail in section 1.9.4.

Protein expression in colorectal cancer EM Tweedle
42
Table 1.5: Colonoscopically detected flat colorectal cancer/adenomas
Main Author Year Country No of patients
No of flat
Carcinomas (%)
Size (mm)
Muto (138) 1985 Japan - 0 1-10
Iiashi (158) 1991 Japan 3872 0 <5
Mitooka (149) 1995 Japan 1152 5* (0.13%) 12-27
Kudo (150) 1995 Japan 17939 53 (0.30%) 5-21
Smith (151) 1999 UK 2198 9 (0.41%) 9-30
Fujii (140) 2000 UK 1000 4 (0.40%) 9**
Tsuda (146) 2002 Sweden 1328 5 (0.43%) 16**
Togashi (152) 2003 Japan 10939 34 (0.31%) < 20
Diebold (142) 2004 France - 2 4-20
Suzuki (159)
Gorgun(160)
2004
2009
UK
USA
1026
2003
5 (0.49%)
23(0.8%)†
8-15
-
*depressed lesions only **median size †adenomas only
Table 1.6: Flat and depressed colorectal cancers in surgical resections
Main Author Year Country No of specimens
No flat carcinomas/ total specimens (%)
Kubota (161) 1996 Japan 300 3/300 (1.0%)
Ishihara (156) 2000 Japan 1140 15/1140(1.3%)
Nasir A (162) 2003 USA 190 22/190 (11%)*
Tweedle EM (157) 2005 UK 1763 39/1763 (2.2%)
*All sized flat and depressed lesions included

Protein expression in colorectal cancer EM Tweedle
43
1.9.3 FLAT AND DEPRESSED LESIONS: DETECTION
The detection of flat and depressed tumours can be challenging. Magnified colonoscopy with the
use of dye spraying has been recognized as the most sensitive method of detection.(163)
Acceptance of the adenoma-carcinoma sequence as the main pathway of development for sporadic
colorectal cancer has reinforced the need to identify and remove adenomas. Increasing awareness
of flat and depressed morphologies has lead to a corresponding increase in detection and
diagnosis.(164)
1.9.4 FLAT AND DEPRESSED TUMOURS: LIVERPOOL EXPERIENCE
1.9.4.1 MATERIALS AND METHODS
From 1st January 1995 to 31st December 2004, 1763 colonic resections were performed for
adenocarcinoma in the Department of Colorectal Surgery, Royal Liverpool and Broadgreen
University Hospitals. I conducted a retrospective review of all the histology reports. Tumours were
selected when their maximum diameter was reported to be 20mm or less, regardless of the
accompanying macroscopic description. Tumours associated with Familial Adenomatous Polyposis,
(FAP), Hereditary Nonpolyposis Colorectal Carcinoma, (HNPCC) or Inflammatory Bowel Disease,
(IBD) were excluded. Patients treated with pre-operative radiotherapy were excluded.
The original histology slides of all 61 patients were reviewed by the same experienced consultant
histopathologist to avoid observer variation.(165) All lesions invaded the submucosa and were at
least pT1 lesions classified according to the Vienna Classification.(166) The morphology of the
tumours was classified according to the Japanese Research Society for Cancer of the Colon (JRSC).

Protein expression in colorectal cancer EM Tweedle
44
Using these criteria, flat colorectal cancer was defined as a tumour in which the carcinomatous
component is not more than twice the thickness of the surrounding non-neoplastic mucosa, all type
II lesions. Fisher’s exact test was used for statistical analysis. Values of p<0.05 were considered
significant.
1.9.4.2 RESULTS
Sixty-one patients fulfilled the criteria. M: F 1:1. Age 69, (42 - 90 years). The lymph node yield,
obtained from the original histology report, was 9 (0 -22). Sixty-four percent (39/61) of our cohort
were flat and depressed tumours compared to thirty-three percent (20/61) polypoid tumours. Two
tumours were unclassifiable due to a lack of preserved tissue. The site of the tumours was caecum
8 (13.1%), ascending colon 6 (9.8%), transverse colon 5 (8.2%), sigmoid colon 23 (36.7%) and
rectum 19 (31.2%). The ratio of tumours found in the right hemicolon compared to the left
hemicolon is 7:13 (35%) for polypoid tumours and 11:28 (28%) for flat and depressed tumours. The
number of tumours with residual adenomatous components on histology was 5/20 (25%) in the
polypoid group and 1/39 (3%) in the flat and depressed group. Seven patients had ten synchronous
adenomas, all of which were polypoid. The low numbers of reported flat lesions in the background
mucosa most likely reflects lack of awareness of this entity at the time of reporting.
The prevalence of small, flat and depressed colorectal cancers in our population of resected
tumours was 2.2% (39/1763), an incidence of 4 resectable cancers per year. Sixty-four percent
(39/61) of our cohort were flat and depressed tumours compared to thirty-three percent (20/61)
polypoid tumours. Two tumours were unclassifiable due to a lack of preserved tissue. Table 1.7
shows the distribution of tumours according to the JRSC classification. All small cancers were staged

Protein expression in colorectal cancer EM Tweedle
45
using both TNM and Dukes staging. The results are shown in Tables 1.8 and 1.9 respectively. The
distribution of tumours according to T stage is shown in Figure 1.6. The proportion of flat versus
polypoid tumours at each T stage was analyzed using Fisher’s exact test. Statistical differences
were found in the proportion of flat or depressed tumours presenting at T1, (P=0.033) and T3,
(P=0.016). T1 lesions were most likely to be polypoid, T3 lesions were most likely to be flat or
depressed. The rate of metastases was high in both groups, (30% polypoid versus 39% flat and
depressed). Flat and depressed tumours showed a trend towards a greater proportion of distant
metastases (0% polypoid v. 8% flat and depressed), this did not reach significance. See published
paper Tweedle et al.(157)
Table 1.7: Classification of lesions according to JRSC. Table shows proportion of small lesions
which fell into each morphological group.
JRSC classification Nos of small cancers(<20mm) Total
Polypoid 20
Peduculated (Ip)
Subpedunculated (Ips)
sessile (Is)
2
4
14
Flat 17
Flat elevated (IIa)
Flat elevated with depression(IIa+IIc)
Flat (IIb)
3
10
4
Depressed 22
Depressed (IIc)
Depressed with rolled edge (IIc + IIa)
9
13

Protein expression in colorectal cancer EM Tweedle
46
Table 1.8: Small cancers according to TNM staging. Proportion of polypoid versus flat and
depressed tumours by depth of invasion (T-stage); shows a greater percentage of T1 lesions in
polypoid group, and greater percentage of T3 lesion in flat/depressed group. For each T-stage, the
percentage of tumours with nodal metastases (N-stage) and distant metastases (M-stage) is shown.
* Fisher’s Exact Test
Table 1.9: Small cancers according to Dukes Staging. Demonstrating fewer Duke’s A and more
Duke’s D cancers in the flat/depressed group. *2 Dukes B tumours were not classifiable according to
morphology due to lack of paraffin-embedded tissue.
TMN Staging Polypoid Flat and Depressed
All small cancers
p-value
T1 6 (30%) 3 (8%) 9 (15%) 0.033*
N+ 1 (17%) 1 (33%) 2 (22%) M+ 0 0 0
T2 4 (20%) 6 (15%) 10 (17%) 0.457
N+ 0 1 (17%) 1 (10%) M+ 0 0 0
T3 4 (20%) 19 (49%) 23 (39%) 0.016*
N+ 2 (50%) 7 (37%) 9 (39%) M+ 0 2 (11%) 2 (9%)
T4 6 (30%) 11 (28%) 17 (29%) 0.676
N+ 3 (50%) 6 (55%) 9 (53%) M+ 0 1 (9%) 1 (6%) Total 20 39 59
A B C D Total
All small cancers 15(25%) 23*(39%) 18 (31%) 3 (5%) 59
Polypoid 9 (45%) 5 (25%) 6 (30%) 0 20
Flat and Depressed 6 (15%) 18 (46%) 12 (31%) 3 (8%) 39

Protein expression in colorectal cancer EM Tweedle
47
1.9.5 FLAT AND DEPRESSED LESIONS: MOLECULAR BIOLOGY
The pathway of development of flat and depressed colorectal cancers is the subject of debate. A
higher frequency of high grade dysplasia and submucosal invasion in flat adenomas compared to
polypoid adenomas has been demonstrated in a number of papers. This may suggest that flat
adenomas are the precursor lesions of flat and depressed carcinomas.(167, 168) An alternative
theory proposes that these cancers arise de novo from the colonic mucosa. The low or absent rates
of residual adenomatous component in flat and depressed cancers support this theory.(148, 169,
170)
= no metastases
= nodal metasases (N+)
= distant metastases (M+)
0
10
20
30
40
50
Polyp Flat Polyp Flat Polyp Flat Polyp Flat
T1 T2 T3 T4
Percent
11
3 6
4
6 6
19
4
5
2 1 1 1 1
6
2
Figure 1.6: T-stage of small colorectal cancers according to morphology. Shows
numbers of tumours in each group and proportion with nodal or distant metastases.
3

Protein expression in colorectal cancer EM Tweedle
48
Many key components of both the chromosomal instability and microsatellite instability pathways
have been assessed in flat and depressed tumours. Reports are conflicting; however differences in
the genetic and epigenetic events which influence carcinogenesis that have been consistently
detected are as discussed below.
There is some evidence that APC mutations occur less frequently in flat and depressed adenomas
than polypoid adenomas with rates as low as 7% in some papers.(171) However, other studies have
found higher rates of APC mutations which approach those seen in polypoid adenomas.(172) β-
catenin, of the Wnt pathway and has been reported to have a higher level of mutation (24%) in flat
adenomas with a central depression compared to polypoid lesions.(173) The K-ras signalling
pathway has been investigated in flat and depressed tumours since the 1990’s. Most studies have
reported lower rates of mutation in early flat and depressed cancers than in polypoid cancers.(174-
176) One study reported a higher rate of K-ras mutation in flat adenomas.(176) Recent
investigations into the BRAF gene, part of the K-ras signalling pathway has found higher rates of
mutation of this gene in flat and depressed tumours.(177) One study reported that BRAF mutations
were only detected in lesions with a flat or depressed morphology.(178) Interestingly, mutations in
the BRAF gene have been found to correlate closely with the presence of microsatellite instability,
MSI. This contrasts with evidence from flat and depressed tumour studies which have reported low
levels of MSI. p53 mutations are a late event in the chromosomal instability pathway and as such
are very infrequently detected in adenomas and early cancers. No difference in rates of p53
mutations have been reported in flat and depressed lesions compared to polypoid lesions.(179,
180)

Protein expression in colorectal cancer EM Tweedle
49
Methylation of CpG islands in the genome, epigenetic silencing, is one pathway by which genes can
be functionally ‘switched-off’ without mutation of the genetic sequence. It is associated with the
development of microsatellite instability, MSI as DNA repair genes are often affected. Two studies
have assessed methylation of the promoter regions of MGMT, CDKN2A (p16) and MLH1 genes.
Lower rates of methylation in flat and depressed adenomas and early cancers have been reported
in both studies; this indicates that epigenetic alterations are not a feature of flat tumour
development.(176, 177) In support of these findings, the panel of five microsatellite markers have
been assessed in two separate studies of flat and depressed adenomas and found to occur very
infrequently compared to polypoid tumours.(181, 182)
The genetic findings lend credence to the theory that these morphologically different tumours have
a separate pathway of development. No proteomic studies have yet been published in relation to
flat and depressed tumours. My research, in part, has attempted to address whether protein
expression between different morphological groups of tumour can be characterised.

Protein expression in colorectal cancer EM Tweedle
50
1.10 OVERVIEW OF PROTEOMICS
The genetic basis of many human cancers has been described and it is apparent that analysis of
genetic material alone is insufficient to understand all of the complex cellular processes involved in
tumorigenesis in many cases. Cellular proteins, (the proteome) are the expressed products of
genes, (the genome), and are responsible for nearly all cellular functions. There are a number of
levels at which the quantity and activity of a given protein can be regulated, including rates of gene
transcription, translation into protein and post-translational modifications. The result of these
complex levels of regulation means that the proteome can consists of several hundred thousand
different proteins and may be a more sensitive indicator of disease. Analysis of cellular proteins,
(proteomics) can offer a unique insight into the molecular mechanisms of cancer development and
enable identification of tumours markers or novel therapeutic targets.(183) The advances in
biotechnology mean that proteomic techniques can be used to quantify and identify proteins in cell
culture, tissue and body fluids, (such as plasma or urine). Proteomics encompasses the study of
proteins in health and disease, characterisation of post-translation modifications and protein-
protein interactions. Investigation of this intricate environment means that there are several
essential steps which must be taken in order to produce a result. These include sample storage and
preparation, purification, separation, visualisation and identification of proteins.(184)
1.10.1 SAMPLE STORAGE
The method of sample preparation used is very dependent on the subject under analysis. Cells in
culture can be very simply prepared by lysing sufficient quantities of cells in lysis buffer. Analysis of

Protein expression in colorectal cancer EM Tweedle
51
tissue is more complex as fresh tissue must be fixed quickly to avoid degradation. Formalin is a
commonly-used fixative and DNA is relatively stable in formalin-fixed material. RNA and protein is
subject to cross-linkage formation by formalin which reduces the quality of material which can be
procured.(185, 186) Snap-freezing in liquid nitrogen is currently the preferred method of storage
for fresh tissue. New alcohol-based fixative agents may prove useful if they are shown to preserve
the quality of RNA and protein in the tissue.
1.10.2 PURIFICATION
The gold-standard of proteomics is the analysis of cells in the context of their native tissue.(187)
The complexity of tissue means that the cells of interest only constitute a small proportion of the
sample. Three main approaches have been taken to address the issue; cultured cell-lines, global
survey and microdissection. The use of cell-lines cultured from fresh tissue is common; it is
particularly useful for investigating the effects of interventions such as drugs on cells. The
disadvantages in terms of cancer research are that the cells are removed from their
microenvironment and this influences their behaviour and protein profile. The global survey
approach utilises the assumption that RNA levels accurately reflect gene expression within a tissue.
The disadvantages are that the cell population of interest is present in different proportions in
whole tissue samples. Microdissection involves the separation of one or more specific cell
populations directly from tissue for analysis. Various methods have been described; all involve
sectioning of tissue and selection of the cells of interest under direct vision. Initial approaches
involved manual dissection of tissue using a microscope and needle. More recently, two laser
assisted techniques have emerged as the methods of choice.(188) Laser-beam microdissection

Protein expression in colorectal cancer EM Tweedle
52
involves excising selected areas of tissue with a laser, then retrieving the material by pressure
catapulting or needle transfer into extraction buffer. Laser-capture microdissection, LCM was
developed at the National Institute of Health, USA. In this technique the tissue section is placed in
contact with a cap coated with a heat-sensitive ethylene vinyl acetate film. On firing of the laser at
the cells of interest, a small area of the film (7.5-30µm in diameter) melts and fuses the cells to the
cap. The cap can then be lifted, removing the selected cells from the tissue. The cap is placed in
extraction buffer which is used to lyse the cells and solubilise the protein or RNA for analysis, figure
1.7.(188) The disadvantages of this technique are that staining and sectioning of the tissue to
render it suitable for laser capture can degrade the protein or RNA content.(189) Strong H&E
staining of sections in our laboratory was found to reduce the quality and quantity of protein
extracted after laser capture. Other stains have been tried, such as methyl green which appear to
have little effect on the extracted protein. One disadvantage of all microdissection techniques is
that a level of expertise is required to examine the tissue and identify the cell population of
interest. Moreover the process is labour intensive and time-consuming. Despite these problems,
microdissection is the only utilised technique which enables comparisons of different cell
population from the same tissue.

Protein expression in colorectal cancer EM Tweedle
53
Figure 1.1: Schematic representation of laser-capture microdissection (from Mr Ali Shekouh)
Fluorescence-activated cell sorting (FACS) is a type of flow cytometry devised and trademarked by
Becton, Dickinson and Company. It provides a method for sorting a heterogeneous mixture of
biological cells into two or more containers, one cell at a time, based upon the specific light
scattering and fluorescent characteristics of each cell. A cellular suspension is generated from blood
or tissue and the cells of interest labelled with an immunofluorescent antibody tag. In the flow
cytometer the suspension is entrained in the center of a narrow, rapidly flowing stream of liquid.
The flow is broken into individual droplets, each one containing a cell. A laser is used to measure
the fluorescent character of each cell as it passes; simultaneously an electrical charge is applied to
the droplet. The droplets then fall through an electrostatic deflection field that diverts them into
containers based upon their charge.(190) Flow cytometry has been in use since the 1960’s, but the
technology to capture in addition to quantifying populations of living cells have seen it recently

Protein expression in colorectal cancer EM Tweedle
54
applied in the proteomic analysis of circulating human leukocytes.(191) It is likely that in the future
this technology will be applied to effectively separate cancer cell populations from tissue for
proteomic analysis.
1.10.3 SEPARATION AND VISUALISATION
There may be several hundred thousand different proteins in any given sample for proteomic
analysis. None of the methods for fractionation and separation of proteins are sensitive enough to
allow detection of the entire proteome. There are two main methods of protein separation, gel-
based and non gel-based techniques.
1.10.3.1 GEL-BASED
Separation of proteins in two dimensions on a SDS-polyacrylamide gel is a technique which was first
described in the 1960’s.(192) Proteins are first separated by charge and pH in the first dimension,
then by molecular weight in the second dimension. Commonly a gel strip with a fixed pH gradient is
used to separate proteins in the first dimension. Once a voltage is applied the protein migrates
along the strip towards the anode until it reaches a pH where the charge is lost (isoelectric point).
Varying the pH gradient can allow different sets of proteins to be visualised. Common variations
include non-linear gradients, with an expanded section from pH 7-9, or reduced pH range.
Following protein separation, gels are stained so that the individual protein spots can be visualised.
A relatively small quantity of protein, (100-200µg) can produce a good quality gel with up to 10,000
spots visible. The most common protein visualization methods utilised are Coomassie blue staining,
silver staining and increasingly, fluorescent staining.(193) Coomassie blue stains in a linear manner

Protein expression in colorectal cancer EM Tweedle
55
and is easily reproducible, however, it is only sensitive for protein levels greater than 2mg per 2D
gel (15x20cm). Silver staining is exponential, meaning that the rate of development of staining
increases as more staining develops. Silver ions bind to protein within the gel and are reduced,
(usually by formaldehyde or gluteraldehyde) to visible silver.(194) Deposits of non-ionic silver
further catalyse the reduction of silver ions in the vicinity. This method is very sensitive (0.1ng per
spot) however, it has a number of disadvantages. The dynamic range is only 10-20 fold and the
complexity of the staining procedure makes reproducibility difficult. Some of the reduction agents,
(such as gluteraldehyde) used for silver staining can cause structural changes in the proteins making
subsequent identification with mass spectrometry impossible. Nevertheless, silver staining is a
sensitive and reproducible method of gel staining, and despite its drawbacks, is frequently utilised.
Difference gel electrophoresis (DIGE) is a staining method in which two protein samples are
separately labelled with different fluorescent dyes and then co-electrophoresed on the same 2DE
gel. There are two fluorescent dyes in common use, propyl-Cy3-NHS and methyl-Cy5-NHS; they
have no net charge and have molecular masses which differ by only 2Da. Two labelling techiques
are available (minimal and saturation labelling) depending on which amino acids residue is
targeted; lysine (average of 30 residues per 50 kDa protein) or cysteine (average of 1-2 residues per
50kDa protein). Minimal labelling targets 1%–2% of all lysines, which results in only a fraction of
each protein species carrying a single dye molecule, while the rest are unlabelled. This creates spot
shift in the lableled versus unlabelled protein population in the molecular mass dimension. This
shift is negligible for proteins >30 kDa; however, proteins <30 kDa are generally shifted by up to one
spot diameter. In practice, the minimal labelling dyes are used when one has >100 μg
Protein expression in colorectal cancer EM Tweedle
56
protein/sample. Saturation labelling targets 100% of cysteine residues and labels the majority of
protein in each sample, therefore this technique does not result in spot shift. It is typically used for
low abundance, precious samples.(195)
DIGE is sensitive, detecting <0.5 fmol protein per spot with minimal labelling and <25 amol per spot
with saturation labelling. Fluorescent dyes have a detection range of about 30-fold under constant
illumination, which is similar to silver staining.(196) This can be increased to 20,000-fold but
requires the use of a scientific-grade, cooled charge-coupled device (CCD) camera. The main
disadvantages with the use of DIGE are that a maximum of three samples can be compared per gel.
In addition gels typical have a limited lifespan in storage, three months at -70 C for minimally-
labelled gels or one month at -70 C for those labelled with saturation dyes.(197)
The advantages of the gel-based method are that a large amount of data can be generated from
each gel as the isoelectric point and molecular weight of thousands of proteins can be calculated.
Post-translational modifications of proteins can often be identified as horizontal or vertical clusters
of proteins.(198) The disadvantage of gel-based techniques is that it is capable of demonstrating
only 10-20% of the entire proteome. It has a particularly low sensitivity for certain types of protein
including membrane-bound proteins, highly acidic or basic proteins, low molecular weight and low
abundance proteins. Often the low abundance proteins are those of interest in terms of protein
markers of disease.(199) Non-gel based protein separation techniques have been developed to
attempt to address some of these problems.

Protein expression in colorectal cancer EM Tweedle
57
1.10.3.2 NON-GEL BASED TECHNIQUES
There are two commonly used non-gel based techniques that allow relative quantification of
proteins in samples; these are isotope-coded affinity tags (ICAT) and isobaric tags for relative and
absolute quantification (iTRAQ). Both techniques use stable isotope labelling (SIL) to ‘tag’ peptides
and allow identification and relative quantification of proteins. ICAT uses two isotope tags; one
contains hydrogen (H), the other deuterium (L) with a mass difference of 8Da. The isotopes bind to
the amino acid cysteine which is a component in an estimated 6 out of 7 of peptides. Two protein
samples are separately labelled with H and L, the samples are then combined and subject to trypsin
digestion.(200) The mixed, labelled peptides are eluted through a column containing a stationary
phase which binds the peptides to the column matrix. The pH of the elution buffer, (mobile phase)
is gradually increased so that the peptides are washed from the column individually in a process
known as liquid chromatography (LC). Mass spectrometry is then used to identify ICAT pairs of
peptides. A search of the database containing peptide fragmentation data results in the
identification of the peptides and hence the original protein.
iTRAQ is based upon tagging the N-terminus of peptides generated from protein digests.(201) Up to
eight protein solutions are subject to trypsin digestion, each peptide solution is then labelled with a
different tag. The tags are all neutral with the same molecular mass so they do not interfere with
the liquid chromatography fractionation. Fragmentation of the tag attached to the peptides in the
mass spectrometer generates a low molecular mass reporter ion that is unique to the tag used to
label each of the digests. The relative intensity of these reporter ions enables relative quantification
of the peptides in each digest and hence the original proteins.(202) iTRAQ is rapidly superseding

Protein expression in colorectal cancer EM Tweedle
58
ICAT for proteomic analysis. It is more sensitive, allows eight samples to be compared and because
the tags bind to the N-terminus rather than cysteine residues all proteins are potentially
represented in the analysis.(203)
1.10.4 PROTEIN IDENTIFICATION
Peptide mass fingerprinting (PMF) is an analytical technique for protein identification that was
developed by John Yates and colleagues.(204) In short, the unknown protein of interest is cleaved
into peptides. Proteolysis using trypsin is most commonly used for this purpose as it has a high
specificity and efficiency. The collection of peptides resulting from this cleavage comprises a unique
identifier of the unknown protein. The absolute masses of the (still unknown) peptides are
accurately measured with a mass spectrometer such as matrix-assisted laser absorption ionisation-
time of flight (MALDI-ToF) or electrospray ionization-time of flight (ESI-ToF). Many proteins can be
identified simply by knowing the mass of each constituent peptide; however the best chance of
identification comes by providing the amino acid sequence of one of the peptides.
1.10.4.1 ION PRODUCTION, (MALDI AND ESI)
MALDI is the most commonly used technique to ionise the peptide molecules within a sample. The
sample is loaded onto and organic matrix and laser energy is transferred to the sample causing
ionisation. ESI is a newer technique where the sample is pushed through a very small, charged and
usually metal, capillary. The buffer in the sample is more volatile than the peptides dissolved in it.
As the sample is forced out of the capillary it forms an aerosol, a mist of small droplets about 10μm
across. As the buffer evaporates, the peptide molecules are forced closer together, repel each
other and break up the droplets further. The process repeats until the peptide is free of buffer and

Protein expression in colorectal cancer EM Tweedle
59
is a lone ion. These lone ions then move to the mass analyzer component of the mass
spectrometer. As technology in the field of proteomics has advanced, liquid chromatography
columns have been coupled directly to ESI mass spectrometers allowing the identification of
peptides as they are eluted from the mixture, a process known as liquid chromatography-mass
spectrometry (LC-MS).(205)
1.10.4.2 ION SEPARATION AND ANALYSIS
Once the peptides have been ionised using MALDI or ESI, they pass into the analyser which uses
ToF to calculate the mass. Essentially, the peptides are accelerated in a vacuum tube towards a
detector. The amount of time it takes for the ion to reach the detector is proportional to the mass
of the peptide. Most analysers now include delayed extraction or reflection tubes which essentially
‘focus’ the cloud of peptides in the field and have a longer flight-time. One method of detecting the
mass of peptides is called the Fourier transform ion cyclotron, (FTICR). This relies on exciting the
peptides in a magnetic field then detecting the sine wave signature released; this sine wave can
then be converted into a mass. The advantages of this technique are that the peptides do not have
to hit the detector, just pass close enough for the wave to be detected. Additionally, it is useful for
complex mixtures of peptides as the specific resolution (narrow peak width) allows the signals of
two ions of similar mass to charge ratio to be detected as distinct ions.(206) The ToF analyser is still
the most commonly ion detection method used in MS.
Tandem mass spectrometry (MS/MS) is the now the preferred technology for many applications in
which mass spectrometry plays a part. Hybrid MS instruments consist of two ToF mass analyzers in
series. After passing through the first detector the ions are subject to collision-induced

Protein expression in colorectal cancer EM Tweedle
60
decomposition (CID) in a second chamber by subjecting them to energetic collisions with inert gas
molecules. These collisions further fragment the peptides which are then passed through the
second ToF detector. In this way fingerprints of component peptides can be produced to aid
identification of the original protein.(207)
1.11 PROTEIN MARKERS IN COLORECTAL CANCER
Vast arrays of proteins have been identified as over-expressed or under-expressed in colorectal
cancer tissue from proteomic analysis. Analyses of differential protein expression between normal
colonic mucosa and colonic adenocarcinoma have identified a list of commonly identified
proteins,(208, 209) listed in Table 1.10. Few of these markers have been verified as prognostic
indicators of disease, and fewer yet are used clinically. A serum marker of colorectal cancer is the
gold standard in terms of diagnosis and screening for the disease. Unfortunately, there is no protein
marker which is sensitive enough for the task. Serum markers can be used to determine response
to treatment and for surveillance. A number of promising serum and tissue biomarkers have been
identified by the European Group on Tumour Markers (EGTM); however the only one currently
recommended for clinical use is carcinoembryonic antigen (CEA).(210, 211) Tissue-based markers
have been investigated for potential prognostic and predictive value. The potential prognostic and
predictive value of the most widely studied tissue markers in colorectal cancer are discussed below.

Protein expression in colorectal cancer EM Tweedle
61
Table 1.10: Proteins with altered regulation in colorectal cancer detected by proteomics (208,
209)
Up-regulated proteins Down-regulated proteins
Annexin IV NCF2
MTA-1 PMM2
SSX5 protein Serpin 1
Dynein heavy chain CNRC
Cytochrome P450 Annexin V
CPT1 APC
Keratin 10 VAV3 protein
Keratin 8 RSP 4
Keratin 19 SPARC like protein 1
Vimentin PDI
β-actin GN6ST
REL1 Cathepsin D
HSP60 Calreticulin
Mortalin SM31
Cytochrome P450 enzymes PDA6 ApoA1 precursor
HSP70 ATP synthase b chain
S100A9 Albumin
S100A8 Liver fatty acid-binding protein
S100A11 Actin-binding protein/smooth muscle
S100A6 protein 22-a
Adenosyl homocysteinase Cyclooxygenase 2
Leukocyte elastase inhibitor, claude B
Puromycin-sensitive aminopeptidase
Macrophage capping protein Cathepsin fragment NADH-ubiquinone oxidoreductase
Biliverdin reductase A Proteasome subunit α type 6 Succinate dehydrogenase subunit A
Annexin 1 fragment Triosephosphate isomerase Aldehyde dehydrogenase, cytosolic,
class I α-tubulin 14-3-3 proteins
Elongation factor 1-d GST-P Selenium-binding protein
Tropomyosin α 1 P13693 translationally controlled tumour protein
Creatin kinase B chain
Tropomyosin α 4 chain Nucleoside diphosphate kinase A Placental thrombin inhibitor
Actin fragment Calgranulin B; S100 A9 Vimentin
Annexin 3, 4 and 5 Desmin
Microtuble-associated protein RP/EB
Tubulin β 5 chain
Pyridoxal kinase Carbonic anhydrase I
Myosin regulatory light chain 2

Protein expression in colorectal cancer EM Tweedle
62
1.11.1 CARCINOEMBRYONIC ANTIGEN (CEA)
The main use of serum CEA in colorectal cancer is in surveillance following curative resection for
primary cancer. It is not recommended for screening or diagnosis because of its low sensitivity for
cancer. A number of independent meta-analyses have compared outcome in patients undergoing
intensive follow-up versus minimal or no follow-up. Although the frequency and modalities of
screening used in the individual studies varied, all meta-analyses concluded that use of an intensive
follow-up regime resulted in a modest but statistically significant improvement in outcome
compared with a minimal follow-up strategy.(212-214) The Cochrane Review concluded that there
was an overall survival benefit at five years of follow-up for patients undergoing more intensive
surveillance (OR = 0.67, 95% confidence interval, 0.53–0.84).(215) Two of these meta-analyses
investigated the specific contribution of CEA to the improved outcome. In the first of these,
Bruinvels et al. concluded that intensive follow-up was associated with an improved outcome, but
only if regular CEA determinations were carried out.(216) Similarly, Figueredo et al. (2003) found
that trials using serial CEA measurements had a significant impact on survival, whereas those not
using CEA failed to impact on outcome.(214) Recent reports suggest that a postchemoradiotherapy
CEA level <5 ng/ml is a favorable prognostic factor for rectal cancer and is associated with increased
rates of earlier disease staging and complete tumor regression.(217) Determination of CEA and
carbohydrate antigen 19-9 (CA19-9) in peritoneal fluid at resection may also predict peritoneal
recurrence in the absence of detectable tumour cells.(218) The EGTM Panel guidelines state that
for stages II and III colorectal cancer patients, CEA should be measured every 2–3 months for at
least 3 years, not only for patients who are suitable candidates for liver resection, but also for
patients who are candidates for receiving systemic therapy.(210)

Protein expression in colorectal cancer EM Tweedle
63
1.11.2 CARBOHYDRATE ANTIGEN 19-9 (CA19-9)
The CA19-9 assay was devised to detect sulfated mucins isolated from normal human colonic
mucosa. It is an antibody which recognizes the sialylated Lewis (a) antigen, fucopentaose II. CA19-9
is the best serum marker for pancreatic adenocarcinoma; however it is less sensitive than CEA for
the detection of colorectal cancer.(219) Elevated preoperative levels of CA19-9 have been found to
correlate with adverse patient outcome.(220) The largest of these studies (n=495 patients), found
the prognostic impact of CA19-9 to be independent of both Dukes’ stage and CEA
concentration.(221) Filella and colleagues compared CEA and CA19-9 in the follow-up of 370
patients with diagnosed colorectal cancer. While CEA was abnormal in 84% of patients with
recurrence and provided a lead-time in 75%, CA19-9 levels were elevated in only 48% and gave a
lead-time in only 25%.(222) Similarly, in monitoring the treatment of metastatic colorectal cancer,
CA 19-9 results yielded no additional information to that provided by CEA. The use of CA19-9 for
diagnosis and surveillance of colorectal cancer is not recommended by the EGTM panel.
1.11.3 CARBOHYDRATE ANTIGEN 242 (CA242)
As with CEA and CA19-9, serum CA242 cannot be used for the detection of early stage colorectal
cancer. Carpelan-Holmstrom and colleagues have shown using multivariate analysis, that high
preoperative levels of CA242 were a significant predictor of outcome when CEA was included in the
analysis, but CEA only became an independent factor if CA242 was excluded.(223) Hall and
colleagues compared CEA and CA242 in the surveillance of 149 patients who had undergone
apparent curative resection for colorectal cancer. For the detection of recurrent disease, CEA alone
had a sensitivity of 76% and a specificity of 86%. The corresponding sensitivity and specificity for

Protein expression in colorectal cancer EM Tweedle
64
CA242 were 60% and 87%, respectively. Combination of the two markers increased the sensitivity
to 88%, but reduced specificity to 78%.(224) The authors concluded that although CA242 alone is
inferior to CEA, it may complement CEA in the follow-up after curative resection for colorectal
cancer.
1.11.4 TISSUE POLYPEPTIDE ANTIGEN (TPA) AND TISSUE POLYPEPTIDE SPECIFIC ANTIGEN (TPS)
TPA is a complex of polypeptide fragments from cytokeratins 8, 18 and 19 and TPS is one epitope
that contains fragments of cytokeratin 18. Both antigens have been subjected to limited evaluation
in colorectal cancer. In a study of 202 newly diagnosed patients, Lindmark and colleagues found
that high levels of CEA, C 19-9, CA242, TPA and TPS were all associated with aggressive
disease.(225) In patients undergoing liver resection or radiofrequency ablation, TPA and TPS but
not CEA, CA19-9 or thimidine kinase (TK), were important predictive markers of overall survival and
disease-free survival.(226)
1.11.5 TISSUE INHIBITORS OF METALLOPROTEINASES (TIMP-1)
TIMP-1 is a multifunctional glycoprotein that inhibits metalloproteinase activity, stimulates cell
growth and inhibits apoptosis.(227) Using a research enzyme-linked immunosorbent assay (ELISA),
Holten-Andersen and colleagues reported that total serum levels of TIMP-1 were significantly
higher in patients with both colonic (n=338) and rectal cancer (n=108) than in either healthy
subjects (n=108) or patients with inflammatory bowel disease (n=50). At 95% specificity, TIMP-1
detected colonic cancer with a sensitivity of 65% and rectal cancer with a sensitivity of 42%.
Combining CEA with TIMP-1 increased sensitivity for colonic cancer from 65% to 75% and rectal
cancer from 42% to 54% (at 95% specificity).(228)

Protein expression in colorectal cancer EM Tweedle
65
1.11.6 THYMIDYLATE SYNTHASE (TS)
TS is the rate limiting enzyme involved in the conversion of deoxyuridine monophosphate (dUMP)
to deoxythymidine monophosphate (dTMP). This reaction provides the only de novo source of
thymidylate which is essential for DNA synthesis.(229) TS expression has been widely investigated
in colorectal cancer tissue as both a prognostic and a therapy predictive marker. The rationale for
using TS as a therapy predictive marker in colorectal cancer is that it acts as the key target for
several cytotoxic agents used to treat this disease such as the fluoropyrimidines, 5-fluorouracil (5-
FU) and 5-fluorodeoxyuridine and the antifolate agent, tomudex.(230) Although widely used to
treat colorectal cancer, only about 20% of patients with advanced disease respond to 5-FU. A
retrospective clinical trial suggests that high TS levels in colorectal cancer tissue are associated with
either relative resistance to 5-FU or poor outcome following treatment.(231) Popat et al.
performed a systematic review of the literature and meta-analysis. For patients with advanced
colorectal cancer, 13 studies containing a total of 887 patients were identified. Of these, 12 were
regarded as suitable for pooling of data. All of the patients in these trials were treated with TS
inhibitors. Following a pooled-analysis, the overall hazard ratio (HR) associated with high levels of
TS for overall survival was 1.74 (95% CI, 1.34–2.26). The HR improved if the assay was performed on
the metastatic lesion to 2.39 (95% CI, 1.43–4.01).(232) The findings of this meta-analysis are
promising in correlating high TS expression with poor outcome in patients with colorectal cancer,
particularly metastatic disease. The disadvantages are that there was evidence of publication bias in
the studies on patients with advanced disease and at present there is no standardised assay for the
measurement of TS. The EGTM do not recommend the use of TS as a prognostic marker at present.

Protein expression in colorectal cancer EM Tweedle
66
1.11.7 MICROSATELLITE INSTABILITY (MSI)
Testing for MSI has a number of potential applications in colorectal cancer including; use as a
surrogate marker for hereditary non-polyposis colorectal cancer (HNPCC), determining prognosis
and predicting response to adjuvant chemotherapy in patients with sporadic colorectal cancer.
Popat et al carried out a systematic review and pooled analysis of published studies relating MSI to
prognosis in patients with colorectal cancer. Following a pooled analysis, patients with MSI had a
15% better outcome compared to those without MSI.(233) The reason for the association between
MSI and favourable prognosis may be related to a protective role provided by functionally active
lymphocytes which infiltrate MSI-positive colorectal cancer.(234) The EGTM Panel recommended
that MSI testing be validated in a clinical trial prior to its use as a general prognostic marker.(210)
1.11.8 P53
The p53 tumour suppressor gene encodes a transcription factor that regulates the expression of
genes involved in apoptosis, angiogenesis, cell cycle and genome maintenance.(235) p53 has been
widely investigated both as a prognostic and as a therapy predictive marker in colorectal
cancer.(236) A multiplicity of methods was used to determine p53 abnormalities, including
immunohistochemistry to detect p53 protein or DNA sequence analysis to detect gene mutations.
Munro et al. carried out a systematic review of published studies that investigated the relationship
between p53 abnormality and outcome in patients with colorectal cancer.(68) In total, 168 eligible
studies comprising survival data on 18,766 patients were identified. The key findings were as
follows:

Protein expression in colorectal cancer EM Tweedle
67
• Patients with abnormal p53 whether detected by immunohistochemistry (IHC) or DNA sequence
analysis had an increased risk of death. The relative risk (RR) with IHC was 1.32 (95% CI, 1.23–1.42)
and with sequence analysis was 1.31 (95% CI, 1.19 1.90).
• p53 had no impact on outcome in patients treated with chemotherapy.
• Abnormal p53 correlated with failure of response to radiotherapy in patients with rectal cancer
(RR, 1.49, 95% CI, 1.25–1.77).
Due to the modest impact on survival described, routine determination of p53 status is not
recommended in colorectal cancer by the EGTM panel. However, new data which combines
estimation of p53 and its downstream activator p21 may be useful in predicting outcome and
response to 5FU chemotherapy.(237)
1.11.9 K-RAS
K-ras is one of the most frequently mutated c-oncogenes in human cancer. It functions as a
guanine nucleotide binding protein involved in signal transduction.(41) Conflicting data exist on the
relationship between the presence of mutant K-ras and prognosis in patients with colorectal
cancer. A recent meta-analysis involving 4268 patients from 42 different institutions concluded that
only a specific type of K-ras mutation predicted poor outcome (patients with a G–T transversion at
codon 12). This specific mutation was detected in less than 10% of tumours and was prognostic in
Duke’s C but not in Duke’s B patients.(238) The EGTM panel do not recommend determination of K-
ras mutation for prediction of prognosis in patients with colorectal cancer. However, recent studies
revealed that the presence of K-ras mutation predicts lack of response to EGFR inhibition in the
treatment of metastatic colorectal cancer.(128)

Protein expression in colorectal cancer EM Tweedle
68
Table 1.11: EGTM recommendations for the use of common protein markers.
Duffy et al. 2007 (210)
Marker Use for test EGTM recommendations
Serum
CEA Determining prognosis May be used in combination with standard prognostic factors
Surveillance following curative resection
Should be used for stages II and III patients who may be candidates for liver resection or systemic treatment, should recurrence develop
Monitoring therapy in advanced disease
Should be used, especially in patients with non-evaluable disease using standard criteria. Measure prior to start of treatment and at 2–3 monthly intervals during therapy; use in combination with imaging.
CA19-9 Determining prognosis Not recommended
Surveillance following curative resection
Not recommended
CA 242 Determining prognosis Not recommended
TIMP-1 Determining prognosis Not recommended
Tissue
TS Determining prognosis Not recommended
Response to chemotherapy Not recommended
MSI Determining prognosis Not recommended
Response to chemotherapy Not recommended
DCC Determining prognosis Not recommended
K-ras Determining prognosis
Predicting response to EGFR inhibition
Not recommended
Should perform Kras-gene testing before prescribing EGFR inhibitors
p53 Determining prognosis Not recommended

Protein expression in colorectal cancer EM Tweedle
69
1.12 AIMS AND OBJECTIVES
Proteomic analysis using 2D electrophoresis is well established for the identification of differentially
expressed proteins in human cancers. The procurement of enough tissue from small colorectal
tumours with low numbers of cancer cells in the specimen is a particular challenge which has been
resolved with laser-capture microdissection. Prognostic markers in small colorectal cancers will be
more crucial in coming years as the National Colorectal Cancer Screening Program detects a higher
frequency of small and early cancers. We have demonstrated an association between increasing
stage at presentation and flat and depressed morphology in small cancers.
In this study I compared dissected adenocarcinoma tissue according to morphology in small cancers
with a view to identifying differential protein expression related to prognosis. Benign matched
epithelial tissue was also dissected for comparison. The aims of the project were as follows;
i. To compare protein profiles of small colorectal tumours with matched normal colonic
epithelium
ii. To compare protein expression profiles of small polypoid and depressed adenocarcinoma
tissue
iii. To identify differentially expressed protein markers between the groups
iv. To verify the protein markers using immunohistochemistry in a large group of up to 404
microarrayed colorectal cancers (199 colon cancer and 205 rectal cancers)

Protein expression in colorectal cancer EM Tweedle
70
2. MATERIAL AND METHODS
The methods utilised in this project were devised following similar work on pancreatic ductal
adenocarcinoma by A Shekouh et al. in 2003 in the Division and Surgery and Oncology, University of
Liverpool.(239)
2.1 TISSUE PREPARATION
Specimens of colon and rectum were obtained following surgery, with full ethical consent, and
examined by a specialist pathologist. Areas of tissue, considered upon macroscopic viewing to
contain malignant or non-malignant colon or rectum were selected. The samples were cryofixed in
liquid isopentane (-160°C), cooled by liquid nitrogen and stored at -160°C in the Liverpool Tissue
Bank, School of Cancer Studies, University of Liverpool. Microscopic examination of the specimens
to verify the presence of malignant tumour was undertaken by a consultant histopathologist after
5µm frozen sections were cut onto slides and stained with haematoxylin and eosin (H&E). Each
tissue sample was assigned an anonymised code on the Liverpool Tissue Bank, database. A
microscopic description of the sample, details of the formal histopathology report of the specimen
and clinical details of the patients were recorded under this code.

Protein expression in colorectal cancer EM Tweedle
71
2.2 IDENTIFICATION OF SAMPLES
Samples for this study were identified by searching the Liverpool Tissue Bank database for tumours
with a maximum diameter of 20mm. Fourteen frozen tumours samples, resected between 1995 –
2006 met the criteria. A consultant histopathologist reviewed the H&E slides of these tumours and
classified them according to morphology using the Japanese Research Society Classification.
Matched normal colonic tissue was available in all cases except one, 148-01T. The morphology and
histopathological characteristics of the samples are documented in Table 2.1. H&E stained sections
of each tumour are presented in Figure 2.1.
Liverpool Tissue Bank No
Morphology Matched normal colon
T-stage
N-stage
Dukes’ stage
Differentiation
104-06T Depressed 3 1 C Moderate
194-00T Depressed 3 1 C Moderate
084-06T Depressed 3 0 B Moderate
149-01T Depressed 4 0 B Moderate
264-05T Depressed 3 0 B Well
097-99T Depressed 1 0 A Moderate
075-00T Polypoid 4 1 C Moderate/poor
233-00T Polypoid 1 0 A Moderate
292-99T Polypoid 1 0 A Moderate
259-01T Polypoid 1 0 A Well
148-01T Flat 3 1 C Moderate
054-96T Flat 3 0 B Moderate
108-03T Flat 2 0 A Moderate
010-03T Flat 2 0 A Moderate
Table 2.1: Characteristics of frozen Tissue samples12

Protein expression in colorectal cancer EM Tweedle
72
Figure 2.1: H&E stained frozen sections from tumour tissue according to morphology2
Depressed Flat Polypoid
1

Protein expression in colorectal cancer EM Tweedle
73
2.3 SECTIONING AND STAINING OF SAMPLES
Sectioning of frozen tissue was performed using a Bright OTF 5000 cryostat, (Huntingdon,
Cambridgeshire, UK), with the chamber temperature set to -20°C. Frozen sections 8µm thick were
cut and immediately transferred to BDH frosted slides which had been pre-cleaned using detergent,
washed with deionised water and oven-dried at 40°C. Sections were fixed immediately in 70%
ethanol for 1 minute and rested in deionised water for no more than 10 minutes. Complete
protease inhibitor cocktail tablets (Roche) were added to all the solutions used for fixing and
staining, except xylene, (one tablet/80 mL solution). Two separate staining protocols were
employed; H&E staining and Methyl green staining (see below). H&E stained sections were viewed
using an inverting microscope (Leica CME microscope) and reference photographs taken with a
Nixon Coolpix 4500. The reference slides and images were used to guide LCM, which was
performed on methyl green stained sections only.
H & E staining protocol
Ehrlich’s haematoxylin (BDH) 30 seconds
Deionised water wash
Acid alcohol 0.3% 5 seconds
Deionised water wash
Scott’s tap water (2% ammonium hydroxide) 5 seconds
Deionised water wash
100% ethanol 15 seconds
Eosin (Shandon Inc.) 15 seconds
100% ethanol 30 seconds x3
Xylene 1 minute x2
Coverslips applied using DPX mountant (VWR Ltd.)

Protein expression in colorectal cancer EM Tweedle
74
Methyl green staining protocol
Violet-free methyl green (2% in deionised water) 30 seconds
Deionised water wash x 2
70% ethanol 30 seconds
95% ethanol 30 seconds
100% ethanol 30 seconds x2
Xylene 5 minutes x 2
Sections air-dried in fume hood for 30-60 minutes
2.4 LASER CAPTURE MICRODISSECTION
Air-dried methyl green stained sections were microdissected using an Arcturus Pixcell II system
(Arcturus, Mountain View, CA, USA) with a 7.5 µm laser beam. Arcturus CapsureTM Macro LCM
Caps were applied to the slides so that the thermoplastic film was in direct contact with the section.
Images of the section at 10x and 100x were viewed on the attached monitor (Sony Triniton) and the
laser beam targeted at the cells of interest. Power and pulse duration were adjusted to generate
melting of the film at the desired point on firing the laser. The conditions were typically 60-80 mW
and 3–4 ms respectively. Two cell types were captured;
Malignant epithelial cells (n=12; 4 depressed, 4 polypoid and 3 flat type)
Normal columnar epithelial cells (n=11, matched to tumour)
An estimated 80,000 cells from each specimen were laser captured using an average of 40,000
pulses. Approximately 7-10 hours of LCM was required to obtain this quantity. Microdissection caps

Protein expression in colorectal cancer EM Tweedle
75
were inserted into 0.5 mL eppendorf tubes containing 50 µL of lysis buffer (7 M urea, 2 M thiourea,
4% CHAPS, 40 mM Tris base) and the cells solubilised by inversion of the tubes for 30 min on ice,
followed by vortex-mixing for 30s and a brief pulse-centrifugation at 16,000 rcf. Five tubes, each
containing 50 µL of lysis buffer were used for each specimen. The lysates from each tube were
pooled once sufficient material had been collected and stored at -80ºC.
Two specimens, 194-00 and 097-99 were sectioned and subjected to laser capture, but insufficient
material was acquired to proceed to SDS-PAGE due to the small volume of tumour in the sample. A
third specimen 292-99 was found to be adipose tissue only on sectioning. All other specimens (n=11
tumours and n=10 normal colon) underwent successful accrual of material by laser capture, with a
minimum of 40,000 pulses. One specimen, 233-00T, underwent laser capture of 70,000 pulses in
order to produce enough material for a second 2D gel. The first 2D gel of the same specimen had
inadequate separation in the first dimension and identification of protein spots on the right hand
side of the gel was impaired. A summary of the results of laser capture and the corresponding SDS-
PAGE gel produced are presented in Table 2.2. An example of the laser capture results obtained
from the dissection of one small colorectal cancer with matching normal colonic tissue from the
same patient is shown in Figure 2.2.

Protein expression in colorectal cancer EM Tweedle
76
Table 2.2: Summary of Laser Capture Microscopy procurement of material for proteomic
analysis13
Liverpool Tissue Bank No
Gel no Gel batch Number of pulses at LCM
Morphology
104-06T A 1 40,000 Depressed tumour
104-06N B 1 40,000 Normal colon
075-00T C 1 40,000 Polypoid tumour
075-00N D 1 40,000 Normal colon
010-03T E 1 40,000 Flat tumour
010-03N F 1 40,000 Normal colon
084-06T G 2 40,000 Depressed tumour
084-06N H 2 40,000 Normal colon
233-00T I 2 and 3 70,000 Polypoid tumour
233-00N J 2 and 3 40,000 Normal colon
054-96T K 2 40,000 Flat tumour
054-06N L 2 40,000 Normal colon
148-01T M 2 40,000 Flat tumour
264-05T N 3 40,000 Depressed tumour
264-05N O 3 40,000 Normal colon
259-01T P 3 40,000 Polypoid tumour
259-01N Q 3 40,000 Normal colon
108-03T R 3 40,000 Flat tumour
108-03N S 3 40,000 Normal colon
149-01T T 3 40,000 Depressed tumour
149-01N U 3 40,000 Normal colon
194-00T - Not run 15,000 (insufficient) Depressed tumour
097-99T - Not run 10,000 (insufficient) Depressed tumour
292-99T - Not run 0 (no tumour) Polypoid tumour

Protein expression in colorectal cancer EM Tweedle
77
2.5 ESTIMATION OF SAMPLE PROTEIN CONCENTRATIONS
Conventional protein assays, such as the Bradford assay were incompatible with the LCM-derived
samples due to the low concentrations of protein present, the small volume of lysate and the
reducing agents present in the lysis buffer. A relative quantification was performed using a
reference sample for comparison in order to ensure good quality gels with equal loading.
Figure 2.2: Laser capture microdissection of colonic tumour and normal colonic
epithelium form the same patient3

Protein expression in colorectal cancer EM Tweedle
78
2.5.1 REFERENCE SAMPLE PREPARATION
A protein lysate was prepared from an undissected polypoid colorectal tumour specimen by the
addition of 32 whole tumour sections to 2mL of lysis buffer. Viscosity was reduced by repeated
passage through a 21 gauge needle. The lysate was centrifuged at 16,100 rcf for 60 minutes at -4ºC
and the resulting supernatant aliquoted into 100µL lots and stored at -80ºC. Serial dilutions of the
lysate were prepared by diluting 100µL of sample with an equal volume of lysis buffer to produce a
1:2 solution. This process was repeated until a range of concentrations from 1:2 to 1:16 was
obtained. Five samples from undiluted to 1:16, each 100 µL in volume, were run on separate two-
dimensional SDS-PAGE gels, as described below. The concentration of reference solution required
to produce a high quality silver-stained gel image with an appropriate number of protein features
(≈800 spots) was determined.
2.5.2 COMPARISON WITH LCM-DERIVED SAMPLES
The concentration of lysate found to produce the best quality 2D SDS-PAGE gel was then used as a
reference against which relative sample protein concentrations of LCM procured material were
estimated. During the two-dimensional phase, 100µL of the reference sample was used in
comparison to 250µL of LCM-procured material. The 2.5 fold difference in sample volume was
maintained during the one-dimension gel phase in order to facilitate a direct comparison. Two-fold
dilution series, from undiluted to a 1:16 dilution, of the LCM-procured samples were prepared to a
volume of 10µL per lane. A similar two-fold dilution series was prepared for the reference sample
to a volume of 4µL per lane. Three µL of sample loading buffer (0.48M Tris- HCl, pH 6.8, 50% w/v
glycerol, 10% w/v SDS, 10% DTT, trace bromophenol blue) was added to each sample. All samples

Protein expression in colorectal cancer EM Tweedle
79
were made up to 15µL per lane with lysis buffer and heated at 100ºC for 10 min. Protein samples
were run on small format Tris-glycine SDS-PAGE gel consisting of a 10% separating gel (10% w/v
acrylamide, 0.375M Tris pH 8.8, 0.1% w/v SDS, 0.1% w/v ammonium persulfate) and 5% stacking gel
(5% w/v acrylamide, 0.125M Tris pH 6.8, 0.1% w/v SDS, 0.1% w/v ammonium persulfate) at 90V for
15 minutes, then 150V until completion. Silver staining was carried out using the same protocol as
the two-dimensional gels, (see silver staining section). The relative protein concentration of the
LCM-procured samples was estimated by comparison to the reference samples. Dilution of the
laser-captured samples was then performed where necessary in order to obtain the optimal
concentration for two-dimensional electrophoresis.
1D small format SDS-PAGE gels were produced for relative protein quantification of all laser
captured samples, (n=21), an example is shown in figure 2.3. On comparison of the protein band
intensity between the reference standard and the laser captured material, all but two laser
captured samples showed a match with the 1 in 2 dilution. In these instances half of the total
sample volume, (125µL) was used for 2D SDS-PAGE. In one case, 010-01T the undiluted sample
showed a match with the reference and therefore the entire 250µL sample was utilised. In the
second case, (sample 233-00T) the staining was too weak at the 1:2 dilution and too strong at the
1:1 dilution to match the reference standard. In this case three-quarters of the sample volume was
utilised, (188µL).

Protein expression in colorectal cancer EM Tweedle
80
2.6 IEF AND SECOND DIMENSION SDS-PAGE
2.6.1 IMMOBILISED PH GRADIENT (IPG) STRIP REHYDRATION
IPG rehydration solution was prepared by adding 2% v/v IPG buffer (containing carrier ampholytes,
pH range 3–10 non-linear; Amersham Biosciences, Uppsala, Sweden) and 2.8% w/v DTT to a stock
solution containing 9 M urea, 2% CHAPS and a trace of bromophenol blue. Protein samples for
analysis were made up to a volume of 350µL using IPG rehydration solution. Each 350µL sample mix
was used to passively rehydrate one IPG focusing strip, (180mm, pH range 3–10, non-linear;
Amersham Biosciences) in an IPG DryStrip reswelling tray at room temperature overnight.
1:2 1:4 1:8 1:16 1:1 1:2 1:4 1:8
Figure 2.3: Relative quantification of laser captured material. Lanes outlined in red represent reference
standard. Lanes outlined in green correspond to matched dilution of LCM material4
1:2 1:4 1:8 1:16 1:1 1:2 1:4 1:8
REFERENCE LCM NORMAL REFERENCE LCM TUMOUR

Protein expression in colorectal cancer EM Tweedle
81
2.6.2 ISO-ELECTRIC FOCUSING ( IEF)
Rehydrated strips were transferred to the Multiphor II system (Amersham Biosciences) for focusing.
A linear gradient of 0–500V was initially applied to the strips over 1 minute, followed by 500-3500V
linearly over 90 minutes and finally 3500V over 5 hour 40 minutes. The total running time was 7
hours 11 minutes, after which the strips were removed and stored in separate sealed tubes at -
80ºC.
2.6.3 EQUILIBRATION AND SECOND DIMENSION SEPARATION
12% acrylamide gels were cast and left to polymerise for at least 5 hours. Gels were then covered
with cling film and refrigerated at 4ºC for no longer than 48 hours prior to use.
Prior to the second dimension separation, strips were equilibrated in two successive buffers, each
consisting of a stock solution comprising 1.5 M Tris-HCl (pH 8.8), 6 M urea, 34.5% v/v glycerol, 2%
w/v SDS and a trace of bromophenol blue. To the first buffer was added 1% w/v DTT, while the
second buffer incorporated 2.5% w/v iodoacetamide. Each rehydrated IPG strip was equilibrated
for 15 minutes in 10mL of buffer 1, then a further 15 minutes in 10mL of buffer 2, with continuous
agitation throughout. Strips were then rinsed in electrophoresis buffer (25mM Tris-base, 192mM
glycine and 0.1% w/v SDS), applied to 12% acrylamide gels and sealed with melted agarose (0.5%
w/v agarose in electrophoresis buffer containing a trace of bromophenol blue). Electrophoresis was
carried out using an Ettan Dalt II apparatus (Amersham Biosciences) at 25ºC, with initial separation
at a constant 5 W per gel for 30 min followed by 20 W per gel until the dye front had migrated
approximately 18 cm. The total run time was typically 4 – 4.5 hours. Once electrophoresed, gels

Protein expression in colorectal cancer EM Tweedle
82
were transferred to polypropylene containers and immersed in 250-300ml fixative solution (50%
ethanol, 12% acetic acid) prior to staining.
2.7 STAINING OF POLYACRYLAMIDE GELS
2.7.1 COLLOIDAL COOMASSIE BLUE STAINING
Coomassie blue staining was performed according to Neuhoff et al. Gels were incubated for three
hours in a 4:1 mixture of staining solution (0.1% w/v Coomassie brilliant blue G250 dye, 2%
orthophosphoric acid, 10% w/v ammonium sulphate, 25% methanol). Gels were washed to remove
excess background staining in a wash solution containing 10% acetic acid and 25% methanol
solution for 4 hours. Gels were scanned as described in scanning and analysis section and stored in
25% methanol at 4°C.
2.7.2 SILVER STAININ G
Two silver-staining protocols were used in order to determine the most sensitive and consistent
method for detecting protein. Protocol 1 was described by Yan et al.(240) and protocol 2 was
described by Blum et al.(241) Both protocols used formaldehyde as the reducing agent and were
compatible with the subsequent use of MALDI-ToF for protein identification. Gels were removed
from fixative solution (50% ethanol, 12% acetic acid) and incubated in a series of staining solutions
as outlined below. Gentle agitation of the gels on a rotary platform was used throughout.

Protein expression in colorectal cancer EM Tweedle
83
Protocol 1 (Yan et al; 2000)
SENSITIZATION SOLUTION 30 MINUTES
(30% ethanol, 0.2% sodium thiosulfate, 0.83M sodium acetate)
DISTILLED WATER 5 MINUTES X 3
SILVER STAINING SOLUTION 20 MINUTES
(0.25% w/v silver nitrate)
DISTILLED WATER 20 SECONDSx2
DEVELOPING SOLUTION 6-10 MINUTES
(2.5% w/v sodium carbonate, 0.04% v/v formalin (37% formaldehyde).
Development was carried out in glass containers until protein spots appeared.
STOP SOLUTION 10 MINUTES
50mL of fixative solution (50% ethanol, 12 % acetic acid) was added to terminate development once background
started to darken.
DISTILLED WATER 5 MINUTES X 3
Protocol 2 (Blum et al; 1987)
WASH 10 MINUTES x 3
(30% ethanol)
SENSITIZING SOLUTION 1 MINUTES
(0.8 mM sodium thiosulfate)
SILVER STAINING SOLUTION 40 MINUTES
(11.8mM silver nitrate, 0.02% formaldehyde)
DISTILLED WATER 20 SECONDSx2
DEVELOPING SOLUTION 6-10 MINUTES
(566 mM Na2CO3, 0.02% formaldehyde, 0.02 mM sodium thiosulfate).
Development was carried out in glass containers until protein spots appeared.
STOP SOLUTION 10 MINUTES
50mL of fixative solution (50% ethanol, 12 % acetic acid) was added to terminate development once background
started to darken.
WASH (30% ethanol) 5 MINUTES x 3

Protein expression in colorectal cancer EM Tweedle
84
2.7.3 GALLYAS PROTEIN STAINING OF SDS-PAGE GELS
This protocol, described by Sorensen et al. was based on procedures used previously for
histochemical intensification of silver staining.(194) The Gallyas staining solution was prepared by
mixing two stock solutions, A (5% w/v sodium carbonate) and B (0.2% ammonium nitrate, 0.2%
silver nitrate, 1% tungstosilicic acid and 0.5% v/v formalin (37% formaldehyde)), in a 1:1 ratio whilst
stirring continuously. Silver-stained gels were washed in distilled water for 3x10 minutes, and then
sensitized with 2% sodium acetate for 2 x15 minutes. Sensitized gels were incubated in freshly
prepared Gallyas solution to intensify silver staining. Development was stopped with 10% acetic
acid once the background began to darken, typically 3-6 minutes.
2.8 SCANNING AND ANALYSIS OF GELS
Gel images were obtained using a GS-800 scanner, at 400 dpi resolution using the green channel for
silver-stained gels and the red channel for Coomassie blue stained gels (Bio-Rad, Hercules, CA,
USA). Data were acquired using PDQuest software (Bio-Rad, V6.2). QuantityOne software was used
to crop the raw gel images to the size 176 x 176mm. The cropped images were saved in TIFF format
at 16 bit and imported into Progenesis SameSpot software (Nonlinear Dynamics, Newcastle, UK) for
analysis. Protein spot identification was performed by careful visual comparisons of the gels and by
using SameSpot spot recognition software.

Protein expression in colorectal cancer EM Tweedle
85
2.9 IDENTIFICATION OF PROTEINS BY LC-MS/MS
Silver-stained gels were matched with well-loaded Coomassie-stained gels of undissected tumour
and normal colonic tissue lysate. Protein spots of interest were identified and referenced to the
correct spot on the Coomassie stained gels (Figure 2.8). Spots were excised and trypsin digested
essentially according to the method of Courchesne and Patterson.(242) Briefly, the excised gel
spots were washed in 50% v/v acetonitrile/ 25 mM w/v ammonium bicarbonate, pH 7.8, and dried
in a SpeedVac. The dried gel spots were rehydrated with 4–10μL digestion buffer (10μg/mL
modified sequencing grade trypsin in 25mM NH4HCO3) and incubated overnight at 37°C. The
resulting peptides were extracted by the addition of 4μL water followed by 7μL 30% v/v
acetonitrile/0.1% v/v TFA with mixing and brief centrifugation. The supernatants were recovered
and liquid chromatography with tandem mass spectrometry, LC-MS/MS was used for analysis. The
tryptic digest was delivered into a QSTAR® Pulsar i hybrid mass spectrometer (Applied Biosystems)
by automated in-line RP-LC (integrated LCPackings System, 5mm C18 μ-precolumn cartridge and
75μm x 15cm C18 column, Dionex, Camberley, UK) via a nano-electrospray source head and a
10mm id PicoTip (New Objective, Woburn, USA). A gradient from 5% ACN/0.05% TFA v/v to 48%
ACN/0.05% TFA v/v in 60 min was applied at a demanded flow rate of 200nL/ min, and MS and
MS/MS spectra were acquired automatically in positive ion mode using information-dependent
acquisition (Analyst® software, Applied Biosystems). Data were submitted to MASCOT and the NCBI
database was searched with the MS tolerance set to 1.2Da and the MS/MS tolerance to 0.6Da, with
carboxamidomethyl as a variable modification.

Protein expression in colorectal cancer EM Tweedle
86
Figure 2.4: Matched laser-captured silver-stained 2D gel of tumour tissue lysate to undissected
Coomassie stained 2D gel of same tumour tissue. Lines converge on protein spot of interest
(circled) and were referenced to other protein spots (arrowed) in order to accurately locate. 5
2.10 CELL LINES AND WESTERN BLOTTING
2.10.1 CELL LINES AND CELL CULTURE
The human colonic adenocarcinoma cell line, SW480 and the human rectal adenocarcinoma cell
line, SW837 were obtained from the European Collection of Cell Cultures (Salisbury, UK). Cells were
maintained in L15 medium supplemented with 10% foetal calf serum, 2mM L-glutamine and
5Ag/mL streptomycin (Sigma, Poole, United Kingdom) at 37°C in a humidified atmosphere of 5%
CO2 (SW480) or 0% CO2 (SW837).

Protein expression in colorectal cancer EM Tweedle
87
2.10.2 1D WESTERN BLOT
Confluent cells were collected and resuspended in buffer containing 0.1M Tris-HCl (ph 6.8), 2% SDS
supplemented with complete protease inhibitors (Roche Diagnostics, Indianapolis, USA) and
sonicated on ice. Protein was quantified using the Bicinchoninic Acid (BCA) method, and an
identical mass of protein was loaded in each lane of a small format SDS-Tris HCl gel (15% separating
and 4% stacking gels) and subject to electrophoresis at a constant voltage of 150V (Pierce
Biotechnology, Rockford, USA). Proteins were electrophoretically transferred to Hybond
nitrocellulose membranes at 100V for 60 minutes (Amersham Biosciences, Buckinghamshire, UK),
and membranes were blocked in 5% milk in PBS for 60 minutes before application of primary
antibodies. Membranes were washed thrice in PBS containing 0.1% Tween20 for 20 minutes
followed by incubation with a horseradish peroxidase–conjugated secondary antibody. After
extensive washing in PBS containing 0.1% Tween20, protein-antibody complexes conjugated with
peroxidase were visualized with Western Lighting chemiluminescence reagent (Perkin-Elmer Life
Sciences, Boston, MA).
2.10.3 2D WESTERN BLOT
Confluent cells were collected and resuspended in lysis buffer as for 1D western blot analysis.
Whole tumour lysate was prepared as per section 2.5.1. Protein was quantified using the BCA
method, and an identical mass (100µg) of protein was loaded onto each gel with two identical gels
run for every sample. Gels were prepared for 2D electrophoresis with the exception that the
second dimension run was stopped at 16cm. Proteins were electrophoretically transferred to
Hybond nitrocellulose membranes at 400V for 2.5 hours (Amersham Biosciences, Buckinghamshire,

Protein expression in colorectal cancer EM Tweedle
88
UK), then blocked in 5% milk in PBS for 60 minutes. Membranes were incubated with primary
antibody for either 1 hour at room temperature or overnight at 4ºC. Protein transfer was verified
using ponceau stain. Membranes were washed thrice in PBS containing 0.1% Tween20 for 20
minutes followed by incubation with a horseradish peroxidase–conjugated secondary antibody.
After extensive washing in PBS containing 0.1% Tween20, protein-antibody complexes conjugated
with peroxidase were visualized with Western Lighting chemiluminescence reagent (Perkin-Elmer
Life Sciences, Boston, MA).
Antibody Indication Dilution Manufacturer
Anti-SH3 binding glutamic acid rich protein like 3
Western blotting 1:10 Gifted from Dr Q Zhang
Anti-peroxiredoxin 6 Western blotting 1:2000 Santa Cruz Biotechnology
Anti-peroxiredoxin 6-SO4 Western blotting 1:1000 Santa Cruz Biotechnology
Cofilin1 Western blotting 1:10,000 Abcam (Cambridge Biosciences)
Cofilin-phospho(ser3) Western blotting 1:50 Abcam (Cambridge Biosciences)
Table 2.3: Primary antibodies used in Western blotting14
2.11 VALIDATION OF DIFFERENTIALLY EXPRESSED PROTEINS
2.11.1 GENERATION OF PARAFFIN-EMBEDDED FORMALIN-FIXED COLORECTAL CANCER TISSUE
Six purpose-built colorectal cancer tissue microarrays (TMAs) were constructed, containing 2-6
cores from 404 independent cases of adenocarcinoma in addition to 36 cores of normal colon and
16 cores each of normal kidney, liver and testes, which served as control tissues. TMAs were
constructed in the Liverpool Tissue Bank, University of Liverpool between 2005 and 2008. All

Protein expression in colorectal cancer EM Tweedle
89
patients on the arrays had a signed consent form for the use of their tissue for research and ethical
approval from the Knowsley and St Helens ethics committee had been given. Clinicopathological
data including age, gender, site of tumour, stage (according to TNM and the American Joint
Committee on Cancer, AJCC guidelines(243)) was obtained from hospital computer records. All data
was recoded on the secure Liverpool Tissue Bank database and was provided courtesy of Mrs Ann
Anderson.
2.11.2 IMMUNOHISTOCHEMISTRY AND CO-IMMUNOFLUORESCENCE
Staining of the colorectal microarray was undertaken as follows; briefly 5µ thick sections of the
array were deparaffinised in xylene and rehydrated through alcohol to distilled water. Peroxidase
block was performed by incubating with 15% methanol for 12 minutes. Antigen retrieval was
perormed by pressure-cooking the slides in 10mmol EDTA solution, (pH 7.0), for 3 min. For
immunohistochemical staining, slides were incubated for 60 min with primary antibodies in
dilutent. These slides were then rinsed in TBS and visualisation achieved by incubating with a
horseradish peroxidase conjugated secondary antibody for 30 min followed by diaminobenzidine
for 10 min. Negative controls were incubated with conjugated secondary antibody only. Slides were
counterstained with haematoxylin for 30s and coverslips mounted with DPX mountant, (BDH).
Detailed protocol outlined in box (page 89) provided courtesy of Mr Andrew Dodson,
Histopathology Department, Royal Liverpool University Hospital.
Co-immunofluorescence was performed on duplicate whole formalin-fixed colorectal tumour
sections. After antigen retrieval with heat treatment as described, the slides were incubated with
primary antibodies overnight at 4°C. Visualisation was achieved using FITC-labelled donkey anti-

Protein expression in colorectal cancer EM Tweedle
90
mouse (30mg/mL; Santa Cruz Biotechnology) and TRITC labelled swine anti-rabbit (25mg/mL;
DakoCytomation) secondary antibodies for 60 min at room temperature. DAPI was used as the
counterstain.(244)
Immunohistochemistry protocol
Slide preparation
De-paraffinisation was carried out in xylene for 15-30 minutes. Rehydration with100% ethanol, 70%
ethanol then distilled water was carried out for 5 minutes each. Peroxidase block was performed by
incubating with 15% methanol for 12 minutes.
Antigen retrieval
Antigen retrieval was performed by pressure-cooking the slides in 10mM EDTA (pH 7.4) for 3
minutes, followed by cooling in distilled water.
Primary antibody
The primary antibody was diluted in ChemoMate (DAKO) at volume of 500l per slide. Slides were
incubated overnight at 40 C then washed with Tris buffered saline x 3.
Secondary Antibodies and Substrate
Pre-diluted anti-mouse horse radish peroxidase conjugated secondary antibody from
DakoCytomation kit K4010 was applied for 1 hour followed by 3 washes with Tris buffered saline.
20µl of liquid DAB + Chromogen were mixed gently with 1ml of buffer provided in the
DakoCytomation kit K4010 to produce the substrate diaminobenzidine in which the slides were
incubated for 10 minutes.
Haematoxylin staining
Counterstaining was performed using Erlich’s haematoxylin for 30 seconds, followed by bluing
agent (2% ammonium hydroxide solution) for 5s. Slides were dehydrated with 100% ethanol for 3 x
1 minute and xylene for 2 x 1 minute. Coverslips were mounted with D.P.X. mountant (BDH).

Protein expression in colorectal cancer EM Tweedle
91
Antibody Indication Dilution Manufacturer
Polyclonal goat anti-S100A8 Immunohistochemistry
Immunofluorescence
1:2000 Santa Cruz Biotechnology
Polyclonal rabbit anti-S100A9 Immunohistochemistry
Immunofluorescence
1:4000 Santa Cruz Biotechnology
Monoclonal anti-SMAD4 antibody Immunohistochemistry 1:50 Santa Cruz Biotechnology
Monoclonal mouse anti-CD68 Immunofluorescence 1:200 Dako
Monoclonal mouse anti-CD14 Immunofluorescence 1:100 Novocastra
Monoclonal mouse anti-HSP27 Immunohistochemistry 1:50 Novocastra
Cofilin1 Immunohistochemistry 1:40,000 Abcam
Cofilin-phospho(ser3) Immunohistochemistry 1:75 Abcam
Table 2.5: Primary antibodies in immunohistochemistry and co-immunofluorescence15
2.11.3 MICROARRAY SCORING AND ANALYSIS
All microarrays were scored by at least two independent scorers, one of whom was a consultant
histopathologist (Dr B Azadeh or Dr M Terlizzo). A scoring system was agreed by both pathologists
after scrutinizing images from the first colorectal cancer tissue microarray. Scores were then
determined independently in separate locations. I compiled and compared the scores from myself
and both pathologists; cores with discrepancies in HSP27 intensity and distribution (approximately
10% of cores) were listed for review of the images and discussion. Dr Terlizzo and I viewed the
slides on a dual-headed microscope linked directly to her computer; this allowed Dr Azadeh to view
emailed images of the cores simultaneously on his office computer. A consensus score for the
discrepent cores was allocated following discussion between Dr Terlizzo and Dr Azadeh by
telephone.
Protein expression in colorectal cancer EM Tweedle
92
Smad4 expression was graded using a 0-3 score for both cytoplasmic and nuclear intensity of
staining. The extent of both S100A8 and S100A9-expressing cellular infiltrate in the stroma was
graded using a similar 0-3 score. In addition, the number of positive S100A8 and S100A9 cells per
field at 40x magnification was also determined in each tumour core. Mean S100A8 and S100A9 cell
counts were obtained by averaging the number of positive stromal cells across all the tumour cores
scored for each patient. HSP27 was scored using intensity of staining (using a 0-3 scale) and the
extent of HSP27 staining (0-3 according to the percentage of positive tumour; 0: <5% positive cells,
1: 5-30%, 2: 30-70% and 3: >70%). A combined score or 0-9 HSP27 index was calculated by
multiplying the intensity by the extent of staining for every patient.
2.11.4 STATISTICAL ANALYSIS
Comparisons were made using the non-parametric Fisher’s exact test (2 groups), or chi-squared test
(>2 groups). Life tables and Kaplan-Meier curves were used to evaluate cancer-specific survival; p-
values were calculated using the log rank test. Survival was measured from date of diagnosis to
date of death, counting death from colorectal cancer as the end point; deaths from other causes
were censored in the analysis. If no event occurred, the date of last follow up was used as the end
point. Multivariate Cox regression analysis was conducted using stepwise forward selection starting
with the most significant variable on univariate analysis and including variables with a P-value of
<0.10. All analyses were performed using Statview Version 5.01 (SAS Institute Inc). A P -value of less
than 0.05 was considered significant.

Protein expression in colorectal cancer EM Tweedle
93
3. RESULTS
3.1 SILVER-STAINING OF GELS
3.1.1 COMPARISON OF SILVER-STAINING PROTOCOLS
Small format Tris-glycine SDS-PAGE gels were prepared as described in section 2.5.2. Reference
protein solution was loaded onto the gels in serial dilutions including undiluted, 1:2, 1:4, 1:8 and
1:16, then repeated on the same gel to give a total of 10 lanes, and gels run as previously described.
After fixing overnight in 50% ethanol and 12% acetic acid solution, the gels were transected to yield
two identical sections each comprising 5 lanes. One gel half was silver-stained using protocol 1, the
other side silver-stained with protocol 2 at the same time, Section 2.7.2. The experiment was
repeated with the two other gels. The six gel-halves were scanned as described in section 2.8 and
the quality and reproducibility of the images compared. Further comparison was made using the
2D-SDS polyacrylamide gels. Serial dilutions of the reference protein sample from 1:2 to 1:16 were
run in duplicate, (as described in section 2.6) giving a total of eight gels. Protocol 1 was used to
stain one set of four gels and protocol 2 used to stain the duplicate set. The stained gels were
scanned as described in section 2.8 and the images compared for sensitivity and reproducibility.
Protocol 2 (Blum et al.) was found to give more consistent results with less background staining
with 1D SDS-PAGE than protocol 1 (Yan et al.); figure 3.1. Following 2D SDS-PAGE, a greater number
of protein spots were seen at each dilution using protocol 2 than protocol 1, figure 3.2. Blum et al.
was judged to be more sensitive for the detection of protein and was the staining protocol adopted

Protein expression in colorectal cancer EM Tweedle
94
for all further silver staining. The Gallyas technique (section 2.7.3) was applied to the previously
silver-stained, small format 1D SDS gels described in the same section, see Figure 3.3. Further
darkening of the protein bands was seen in all cases; however, a disproportionate darkening of the
background rendered the gels difficult to interpret. Furthermore, successive incubations of the gels
in the Gallyas solution caused them to become brittle and easily damaged. No further Gallyas
staining was performed.
3.1.2 DETERMINATION OF REFERENCE PROTEIN STANDARD
The methodology for visualisation of protein spots was optimised by use of protocol 2, (Blum et al)
for silver-staining without Gallyas enhancement. Reference protein gels were produced in serial
dilutions from 1:2 to 1:16 concentration, as described. The reference standard was determined by
the lowest concentration of reference protein solution which gave the optimal number of protein
spots, (>800), without excessive darkening of the background. The 1:4 dilution was adopted as the
reference standard (Figure 3.4).

Protein expression in colorectal cancer EM Tweedle
95
A B
C D
E F
Figure 3.1: Reference protein solution produced from whole tumour lysate (section 2.5.1) in serial dilutions on small format SDS gels. A, C, E stained with protocol 2, (Blum at el). B, D, F
stained with protocol 1, (Yan et al). 6
A
C
E
B
D
F

Protein expression in colorectal cancer EM Tweedle
96
Figure 3.2: Reference protein solution produced from whole tumour lysate (section 2.5.1) in
serial dilutions on 2D SDS gels. 1:2 dilution; gels A&B, (A stained protocol 1, B stained protocol
2). 1:4 dilution; gels C&D, (C stained protocol 1, D stained protocol 2). 1:8 dilution; gels E&F, (E
stained protocol 1, F stained protocol 2). 1:16 dilution; gels G&H, (G stained protocol 1, H
stained protocol 2). 7

Protein expression in colorectal cancer EM Tweedle
97
Figure 3.3: Silver-stained 1D gels of reference protein solution in serial dilutions subject
to further staining using Gallyas protocol. Gel A corresponds to gel E (Figure 3.1). (i) prior
to Gallyas staining; (ii) following Gallyas staining. Gel B corresponds to gel F (Figure 3.1) (i)
prior to Gallyas staining; (ii) following Gallyas staining. Gel C corresponds to gel C (Figure
3.1). (i) prior to Gallyas staining; (ii) following Gallyas staining. Gel D corresponds to gel D
(Figure 3.1) (i) prior to Gallyas staining; (ii) following Gallyas staining. 8
1B
A(i)
C (ii)
C (i)
A(ii) B (ii)
B (i)
D (ii) (ii)
D (i)
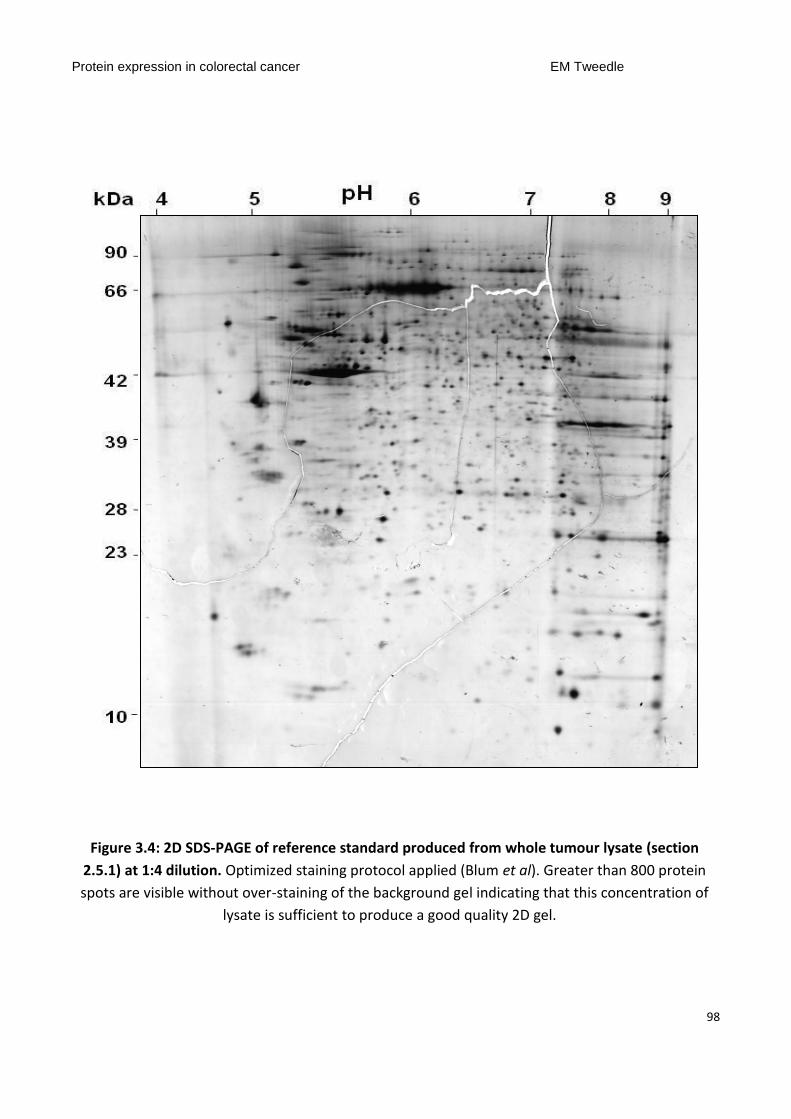
Protein expression in colorectal cancer EM Tweedle
98
Figure 3.4: 2D SDS-PAGE of reference standard produced from whole tumour lysate (section
2.5.1) at 1:4 dilution. Optimized staining protocol applied (Blum et al). Greater than 800 protein
spots are visible without over-staining of the background gel indicating that this concentration of
lysate is sufficient to produce a good quality 2D gel. 9

Protein expression in colorectal cancer EM Tweedle
99
3.2 GEL ANALYSIS
Twenty-one gels were produced from laser-captured frozen tissue, eleven samples of colorectal
tumour and ten matched samples of normal colonic epithelium. One gel, sample 010-01T, (a
morphologically flat, T1/N0 tumour), had insufficient protein loading to produce a good quality gel.
This was in some part due to the small fragment of frozen material available for laser capture; not
enough residual tissue remained for further microdissection. A total of 10 usable small tumours
were compared with matched normal colonic epithelium in 9 cases. Gel images were analysed
using proteomic software Progenesis SameSpots (Nonlinear Dynamics, Newcastle, UK). Samespots
allows the manual mapping on gel images onto other gels thus facilitating comparison of spot
patterns. A merged gel image constructed from the mapped images of each gel in the group was
created; the software then identified differentially expressed spots between the groups of gels. Five
merged images were created from this analysis; tumour (n=11 gels), normal (n=10 gels), depressed
tumour (n=4 gels), flat tumour (n=3 gels), polypoid tumour (n=4 gels), (Figure 3.5). The software
compared morphologically different tumours to produce a list of 30-40 variably-expressed spots
(ringed in blue). Visual comparison of identified spots was performed by two independent
observers (Dr Eithne Costello and myself). Approximately two thirds of spots were short-listed were
excluded due to inaccurate mapping of spots between gels and artifact or background confounding
the analysis. A final list of spots with genuine differential expression was drawn up with priority
given to those proteins which shown variable expression in different morphology tumours and in
tumour compared to normal tissue. Spots of interest after gel comparison are marked on the gel in

Protein expression in colorectal cancer EM Tweedle
100
figure 3.6. Figures 3.7-3.12 illustrates each spot as expressed in individual gels, including
comparison of spot volume determined by Samespots Progenesis software.

Protein expression in colorectal cancer EM Tweedle
101
Figure 3.5: Merged images of silver-stained gels created for spot analysis by Samespot software. A: Tumour (n=10) B: Normal colon (n=9) C: Depressed tumours (n=4) D: Flat tumours (n=3) E: Polypoid tumours n=3 10
A B
C D E
TUMOUR NORMAL
DEPRESSED FLAT POLYPOID

Protein expression in colorectal cancer EM Tweedle
102
Figure 3.6: 2D gel of laser-captured tumour lysate (sample 233-00T) depicting nine spots found to
be differentially expressed and selected for identification using tandem mass spectrometry. Spots
were selected after analysis of all tumour gels using Samespots software and two observer visual
comparison. Tumours with different morphologies were compared and the findings referenced
against matched normal gels. Spots circled in dashed lines were also selected for identification as
post-translational modifications of proteins already ringed on the gel. 11

Protein expression in colorectal cancer EM Tweedle
103
Figure 3.7: Expression of differentially expressed proteins (spots 1 and 2); evaluation in individual samples. A: Tumour gel (233-00T). Box marks area of gel showing spots 1 and 2. B: Sections of individual tumour and matched normal gels (boxed area in A) showing expression of spot 1 (ringed in red) and spot 2 (ringed in blue) for visual comparison. Gel numbers correspond to the following samples; Tumours (T): Depressed-type (1=104-06T, 2=084-06T, 3=264-05T, 4=149-01T); flat-type (5=054-96T, 6=148-01T, 7=108-03T); polypoid-type (8=075-00T, 9=233-00T, 10=259-01T). Normal tissue (N) (11=104-06N, 13=084-06N, 16=264-05N, 19=149-01N, 15=054-96N, 18=108-03N, 12=075-00N, 14=233-00N, 17=259-01N). C and D: Volume of spot 1 (Chart C) and spot 2 (Chart D) quantified by Samespots software in each gel (numbered as in B). Additional bars (T, D, F and P) show mean spot volume across a number of gels, shown with corresponding error bars. T=mean spot volume all tumours (gels 1-10); D=mean spot volume in depressed tumour gels (gels 1-4), F=mean spot volume in flat tumours (gels 5-7), P= mean spot volume in polypoid tumours (gels 8-10). P values compare mean spot volume across gels D, F and P. The fold increase from lowest to highest mean spot volume is shown on each chart.12

Protein expression in colorectal cancer EM Tweedle
104
Figure 3.8: Expression of differentially expressed proteins (spot 3); evaluation in individual samples. A: Tumour gel (233-00T). Box marks area of gel showing spot 3. B: Sections of individual tumour and matched normal gels (boxed area in A) showing expression of spot 3 (ringed in green) for visual comparison. Gel numbers correspond to the following samples; Tumours (T): Depressed-type (1=104-06T, 2=084-06T, 3=264-05T, 4=149-01T); flat-type (5=054-96T, 6=148-01T, 7=108-03T); polypoid-type (8=075-00T, 9=233-00T, 10=259-01T). Normal tissue (N) (11=104-06N, 13=084-06N, 16=264-05N, 19=149-01N, 15=054-96N, 18=108-03N, 12=075-00N, 14=233-00N, 17=259-01N). C: Volume of spot 3 quantified by Samespots software in each gel (numbered as in B). Additional bars (T, D, F and P) show mean spot volume across a number of gels, shown with corresponding error bars. T=mean spot volume all tumours (gels 1-10); D=mean spot volume in depressed tumour gels (gels 1-4), F=mean spot volume in flat tumours (gels 5-7), P= mean spot volume in polypoid tumours (gels 8-10). P values compare mean spot volume across gels D, F and P. The fold increase from lowest to highest mean spot volume is shown on the chart. 13

Protein expression in colorectal cancer EM Tweedle
105
Figure 3.9: Expression of differentially expressed proteins (spots 4A and 4B); evaluation in individual samples. A: Tumour gel (233-00T). Box marks area of gel showing spots 4A and 4B. B: Sections of individual tumour and matched normal gels (boxed area in A) showing expression of spot 4A (ringed in blue) and spot 4B (ringed in dashed blue) for visual comparison. Gel numbers correspond to the following samples; Tumours (T): Depressed-type (1=104-06T, 2=084-06T, 3=264-05T, 4=149-01T); flat-type (5=054-96T, 6=148-01T, 7=108-03T); polypoid-type (8=075-00T, 9=233-00T, 10=259-01T). Normal tissue (N) (11=104-06N, 13=084-06N, 16=264-05N, 19=149-01N, 15=054-96N, 18=108-03N, 12=075-00N, 14=233-00N, 17=259-01N). C: Volume of spot 4A quantified by Samespots software in each gel (numbered as in B). Additional bars (T, D, F and P) show mean spot volume across a number of gels, shown with corresponding error bars. T=mean spot volume all tumours (gels 1-10); D=mean spot volume in depressed tumour gels (gels 1-4), F=mean spot volume in flat tumours (gels 5-7), P= mean spot volume in polypoid tumours (gels 8-10). P values compare mean spot volume across gels D, F and P. The fold increase from lowest to highest mean spot volume is shown on the chart.14

Protein expression in colorectal cancer EM Tweedle
106
Figure 3.10: Expression of differentially expressed proteins (spots 5, 6 and 7); evaluation in individual samples. A: Tumour gel (233-00T). Box marks area of gel showing spots 5, 6 and 7. B: Sections of individual tumour and matched normal gels (boxed area in A) showing expression of spot 5 (ringed in pink) and spot 6 (ringed in dashed pink) and spot 7 (ringed in purple) for visual comparison. Gel numbers correspond to the following samples; Tumours (T): Depressed-type (1=104-06T, 2=084-06T, 3=264-05T, 4=149-01T); flat-type (5=054-96T, 6=148-01T, 7=108-03T); polypoid-type (8=075-00T, 9=233-00T, 10=259-01T). Normal tissue (N) (11=104-06N, 13=084-06N, 16=264-05N, 19=149-01N, 15=054-96N, 18=108-03N, 12=075-00N, 14=233-00N, 17=259-01N). C and D: Volume of spot 5 (Chart C) and spot 7 (Chart D) quantified by Samespots software in each gel (numbered as in B). Additional bars (T, D, F and P) show mean spot volume across a number of gels, shown with corresponding error bars. T=mean spot volume all tumours (gels 1-10); D=mean spot volume in depressed tumour gels (gels 1-4), F=mean spot volume in flat tumours (gels 5-7), P= mean spot volume in polypoid tumours (gels 8-10). P values compare mean spot volume across gels D, F and P. The fold increase from lowest to highest mean spot volume is shown on each chart. 15

Protein expression in colorectal cancer EM Tweedle
107
Figure 3.11: Expression of differentially expressed proteins (spots 8A and 8B); evaluation in individual samples. A: Tumour gel (233-00T). Box marks area of gel showing spots 8A and 8B. B: Sections of individual tumour and matched normal gels (boxed area in A) showing expression of spot 8A (ringed in green) and spot 8B (ringed in dashed green) for visual comparison. Gel numbers correspond to the following samples; Tumours (T): Depressed-type (1=104-06T, 2=084-06T, 3=264-05T, 4=149-01T); flat-type (5=054-96T, 6=148-01T, 7=108-03T); polypoid-type (8=075-00T, 9=233-00T, 10=259-01T). Normal tissue (N) (11=104-06N, 13=084-06N, 16=264-05N, 19=149-01N, 15=054-96N, 18=108-03N, 12=075-00N, 14=233-00N, 17=259-01N). C: Volume of spot 8A quantified by Samespots software in each gel (numbered as in B). Additional bars (T, D, F and P) show mean spot volume across a number of gels, shown with corresponding error bars. T=mean spot volume all tumours (gels 1-10); D=mean spot volume in depressed tumour gels (gels 1-4), F=mean spot volume in flat tumours (gels 5-7), P= mean spot volume in polypoid tumours (gels 8-10). P values compare mean spot volume across gels D, F and P. The fold increase from lowest to highest mean spot volume is shown on the chart.16

Protein expression in colorectal cancer EM Tweedle
108
Figure 3.12: Expression of differentially expressed proteins (spot 9); evaluation in individual samples. A: Tumour gel (233-00T). Box marks area of gel showing spot 9. B: Sections of individual tumour and matched normal gels (boxed area in A) showing expression of spot 9 (ringed in yellow) for visual comparison. Gel numbers correspond to the following samples; Tumours (T): Depressed-type (1=104-06T, 2=084-06T, 3=264-05T, 4=149-01T); flat-type (5=054-96T, 6=148-01T, 7=108-03T); polypoid-type (8=075-00T, 9=233-00T, 10=259-01T). Normal tissue (N) (11=104-06N, 13=084-06N, 16=264-05N, 19=149-01N, 15=054-96N, 18=108-03N, 12=075-00N, 14=233-00N, 17=259-01N). C: Volume of spot 9 quantified by Samespots software in each gel (numbered as in B). Additional bars (T, D, F and P) show mean spot volume across a number of gels, shown with corresponding error bars. T=mean spot volume all tumours (gels 1-10); D=mean spot volume in depressed tumour gels (gels 1-4), F=mean spot volume in flat tumours (gels 5-7), P= mean spot volume in polypoid tumours (gels 8-10). P values compare mean spot volume across gels D, F and P. The fold increase from lowest to highest mean spot volume is shown on the chart.17

Protein expression in colorectal cancer EM Tweedle
109
3.2 IDENTIFICATION OF PROTEIN SPOTS
Silver stained 2D gels were matched with well-loaded undissected Coomassie-stained gels of
tumour and normal tissue lysate. Spots were cut out from gels and subject to tandem mass
spectrometry analysis as described in Section 2.10. Three spots were not identified using this
analysis. Spectra from the remaining spots are shown in Figure 3.13. Identities of each protein spot
are shown in table 3.1 with corresponding average spot volumes calculated by SameSpots analysis
according to tumour morphology. P-values were generated by comparing average spot volume.
Table 3.1: Spots identified on 2D gel analysis16
Spot
no
Spot volume Fold
increase
P-value Identity
Depressed Flat Polypoid
1 34,327 48,372 19,968 2.5x 0.02 No identity
2 60,842 78,045 32,730 2.4x 0.007 No identity
3 25,581 56,291 45,546 1.9x 0.039 SH3 domain-binding glutamic
acid-rich-like protein 3
4A 26,596 19,842 29,709 1.6x 0.545 Peroxiredoxin 2 (Oxidised)
4B Analysed due to proximity to spot 4A Peroxiredoxin 2 (Reduced)
5 6,402 10,690 11,901 1.9x 0.479 Peroxiredoxin 6
6 Analysed due to proximity to spot 5 Heat Shock Protein 27
7 1,929 1,548 7,710 4.7x 0.005 No identity
8A 9,269 19,286 19,419 1.7x 0.744 Cofilin (phosphorylated
serine 3)
8B Identified on western blotting Cofilin
9 22,768 29,968 102,292 3.8x 0.541 S100A8

Protein expression in colorectal cancer EM Tweedle
110

Protein expression in colorectal cancer EM Tweedle
111
Figure 3.13A-F: MS/MS spectra for identified protein spots. Complete sequences are shown on the
right with peptide masses identified in the first chamber shown in colour. Spectra shown
correspond to underlined peptide sequenced in second chamber. A: SH3BGRPL3 B: Peroxiredoxin 2
C: Peroxiredoxin 6 D: HSP27 E: Cofilin1 F:S100A818

Protein expression in colorectal cancer EM Tweedle
112
3.3 VALIDATION OF DIFFERENTIALLY-EXPRESSED PROTEINS
Five identified differentially-expressed proteins were taken forward for validation. Commercial
antibodies for heat shock protein 27 and S100A8 immunohistochemistry were in use in the
Diagnostic Molecular Pathology Department in the Royal Liverpool University Hospital. Staining
protocols for these two antibodies were kindly obtained from the Lead Biomedical Scientist in
Pathology, Mr Andy Dodson. Validation of the expression of these proteins in colorectal
adenocarcinoma is described in sections 3.6 and 3.8 respectively. Commercial antibodies for
Peroxiredoxin 6 and Cofilin1 were purchased and protocols for use were developed as described in
sections 3.5 and 3.7 respectively. No commercial antibody was available for SH3 domain-binding
glutamic acid-rich like protein 3 (SH3BGRLP3). Dr Zhang (University of Sceince and Technology of
China) was contacted and kindly agreed to donate a sample of mouse ascites for investigation,
described in section 3.4. Peroxiredoxin 2 was not selected for investigation as published results in
other tumour types showed no correlation between total protein levels and prognosis or stage. No
antibody was available for the for sulphide (hyperoxidised) form of the protein (section 3.5).

Protein expression in colorectal cancer EM Tweedle
113
3.4 SH3 DOMAIN-BINDING GLUTAMIC ACID-RICH-LIKE PROTEIN 3
3.4.1 INTRODUCTION
The 10.5kDa protein SH3 binding glutamic acid-rich protein-like 3 has an isoelectric point of 5.0
corresponding well with the position of the protein spot identified on 2D gel analysis (figure 3.8).
SH3 binding glutamic acid-rich (SH3BGR) gene is located to human chromosome 21. Two
homologous genes, SH3BGRL and SH3BGRL3 are located to chromosome Xq13.3 and 1p34.3-35,
respectively and code for small proteins similar to the N-terminal region of the SH3BGR
protein.(245) SH3BGRL3 protein shows a significant similarity to Glutaredoxin 1 of Escherichia coli,
and all the three proteins are predicted to belong to Thioredoxin-like protein family. Glutaredoxins
(GRXs) are ubiquitous oxidoreductases, which catalyze the reduction of many intra-cellular protein
disulfides and play an important role in many redox pathways. However, the SH3BGRL3 protein
lacks the enzymatic function of glutaredoxins and may have a role as a regulator of redox
activity.(246) Proteins such as glutaredoxin and thioredoxin are reported as up-regulated in many
cancers such as lung and pancreatic; they have been implicated in increased resistance of cancer
cells to free-radicals. There is little current evidence which directly links SH3GRPL3 with survival in
cancer cells, however the protein has recently been identified as up-regulated in glioblastoma
multiform compared to normal cerebral tissue on proteomic analysis.(247) Studies of acute
promyelocytic leukemia cell line NB4 have also reported up-regulation of the protein.(248)
Conversely, the related protein SH3BGRL is reported to be downregulated in fibroblasts, lymphoid
cells, and splenic tumor cells transformed by the viral oncogene v-Rel. Co-expression of SH3BGRL

Protein expression in colorectal cancer EM Tweedle
114
with v-Rel in primary splenic lymphocytes reduced the number of colonies formed by 76%.(249) Xu
et al. reported SH3BGRPL3 protein as a post-translational modification of the 27kDa tumor necrosis
factor alpha (TNF-α) inhibitory protein, TIP-B1. This protein is potentially involved in resistance of
cells to the apoptosis-inducing affect of TNF-α.(248)
3.4.2 VALIDATION OF SH3BGRPL3
In order to validate both the identity of the protein spot thought to be SH3BGRPL3, and to
determine the relationship of the protein to survival in colorectal cancer we sought an antibody
which could be utilised for immunohistochemistry and western blotting. No antibody was available
commercially; however a kind gift from Dr Q Zhang, University of Science and Technology of China
of mouse ascites was investigated for antibody activity. Unfortunately, no antibody activity was
detected on western blotting in colorectal cancer cell line or tissue lysate; or on direct spotting of
the antibody onto nitrocellulose membrane (Figure 3.14).

Protein expression in colorectal cancer EM Tweedle
115
Figure 3.14: Western blotting for SH3BGRPL3. A&B: Proteins from colorectal cancer cell lines HCT116, HT29,
SW620 and whole tissue lysate from colorectal cancers 084-06 and 259-05 were separated by 1D SDS-PAGE,
transferred to membrane and western analysis undertaken with anti-SH3BGRPL3 mouse ascites. Primary
antibody concentration was 1:10 (A) and 1:100 (B) with exposure times of 2 and 40min. No specific protein
band was detected. C: In order to ascertain whether the anti-SH3BGRPL3 mouse ascites contained active
antibody the ascites was spotted directly onto nitrocellulose membrane with two commercial antibody
solutions, (mouse anti-human β-actin and rabbit anti-human 1gG-HRP) in the positions marked. The
membrane was incubated with anti-mouse secondary. No signal was seen from the donated anti-SH3BGRPL3
mouse ascites at 20s or 2min exposure which confirmed that no antibody was present in the ascites.19

Protein expression in colorectal cancer EM Tweedle
116
3.5 PEROXIREDOXINS II AND VI
3.5.1 INTRODUCTION
Peroxiredoxins, Prx are a highly conserved group of proteins in eukaryotes with six isoforms, I-VI.
Peroxiredoxin II has a molecular weight of 21.8kDa and a theoretical PI of 5.7, whereas
peroxiredoxin VI has a molecular weight of 24kDa and PI of 6.2; both correspond well to the spots
identified following gel analysis (Figure 3.9 and 3.10 respectively). There are 3 forms of the
peroxiredoxin protein, typical 2-Cys (I-IV), atypical 2-Cys (V) and 1-Cys (VI). Specific isoforms occupy
discrete intra-cellular compartments; I and V are located in all compartments, II in cytoplasm and
nucleus, III in mitochondria, IV in lysosomes and VI in cytoplasm.(250)
Peroxiredoxins are responsible for reducing hydrogen peroxide within the cell (Figure 3.15).
Cysteinyl residues in the protein are oxidised to form the short-lived and unstable form Prx-SOH.
The protein can interact with another peroxiredoxin molecule to form a Prx-S-S-Prx disulfide bond.
The disulphide bonded Prx dimers are reduced and recycled in a rapid reaction catalysed by
thioredoxin. Alternatively, an over-oxidised form of peroxiredoxin can be generated at times of high
peroxide concentrations by the formation of sulfenic acid residues, Prx-SO2H. This stable protein
has a more acidic PI then the reduced form of the protein on 2D gel analysis and was thought to be
irreversible. However, evidence suggests that it can be slowly recycled to the reduced form by the
enzyme sulfiredoxin.(251)

Protein expression in colorectal cancer EM Tweedle
117
Figure 3.15: Pathways of Peroxiredoxin metabolism. Reduced Peroxiredoxin (Prx-SH)
binds hydrogen peroxide (H2O2) to form oxidized Peroxiredoxin (Prx-SOH). This
unstable protein can interact with another Peroxiredoxin molecule to form a dimer
(Prx-S-S-Prx) when it is reduced and recycled by thioredoxin. During periods of high
hydrogen peroxide concentrations Prx-SOH can combine with another H2O2 to form a
stable hyperoxidised peroxiredoxin (Prx-SO2H). 20

Protein expression in colorectal cancer EM Tweedle
118
Peroxiredoxins scavenge low level hydrogen peroxide in the cytoplasm generated as by-products of
metabolism. However, peroxiredoxins can be inactivated by hyper-oxidation during periods of high
H2O2 exposure. Evidence is mounting that ROS (reactive oxygen species) such as H2O2 act as
signalling molecules. Growth factors and cytokines applied to cells in vitro generate a pulse of ROS,
and addition of oxidants to cells to induce ROS can activate growth factor signalling pathways.
Hyperoxidation of peroxiredoxins can facilitate ROS-mediated cell signalling pathways by enabling
transient pulses of H2O2 to occur.
Two types of signalling pathways have been shown to utilise ROS such as H2O2: TNF-β1 induced
apoptosis by generation of mitochondrial ROS, and cell growth and proliferation mediated by EGF
and PDGF signalling.(252) Therefore, elevated peroxiredoxin expression may protect cells from
apoptosis, whereas disproportionate elevation of the inactive Prx-sulfide form of peroxiredoxin
could also indicate high levels of cell growth and proliferation.
Total expression of Peroxiredoxin-II has been analysed using immunohistochemistry in many
cancers including colon, lung, breast and renal. No association between stage or five-year survival
has been demonstrated in lung(253) or breast cancer;(254, 255) correlation with good prognosis
was reported in a small series of renal cell carcinoma patients.(256) In a small series of colon
cancers (n=32), Prx II was found to be over-expressed in cancer tissue compared to normal tissue
(n=23/32, 72%). A correlation was described between elevated tumour Prx II levels and incidence of
nodal metastases (P=0.023).(257)
Total PrxVI has been found to be up-regulated in the sera of individuals with both squamous cell
carcinoma of the oesophagus(258) and lung cancer.(259) It is up-regulated in breast cancer cells

Protein expression in colorectal cancer EM Tweedle
119
and is associated with increased invasiveness and pulmonary metastases.(260) In colon cancer
tissue (n=32 cases) Prx VI was over-expressed with a frequency of 18/32, (56%). No association was
seen in this study between expression of Prx VI and stage at presentation or prognosis in colon
cancer.(257)
Inability to distinguish between reduced and oxidised forms of peroxiredoxin using
immunohistochemistry is a disadvantage when assessing their impact on cancer behavior as the
ratio of reduced: oxidised isoforms may be more informative that total levels of the protein.
We identified two isoforms of Peroxiredoxin II on 2D gel analysis. The form that was differentially
expressed was more acidic, suggesting the oxidised Prx-II-sulfide protein.(261) No commercially
available antibody has been generated which is specific for the sulphide form of Prx-II and therefore
this supposition could not be confirmed. Given the lack of association between overall Prx-II levels
in cancer tissue and prognosis, no further analysis of Prx-II was carried out in colorectal cancer
tissue. One isoform of Peroxiredoxin-VI was differentially expressed in our cohort of colorectal
cancer specimens, identified following 2D gel analysis and tandem mass spectrometry. It was not
possible to determine which Prx-VI isoform (reduced or oxidised) was differentially expressed in
silver-stained gels. Antibodies to both proteins were commercially available and were utilised in 1D
and 2D western analysis of colorectal cancer cell lysate with a view to validating our findings on
SDS-PAGE. Immunohistochemical analysis in colorectal cancer tissue could not be performed as the
antibodies proved not to be sensitive or specific (section 3.5.2).

Protein expression in colorectal cancer EM Tweedle
120
3.5.2 RESULTS OF PRX-VI ANALYSIS
Lysate from cell lines HT-29, SW480, HCT116 and SW620 was quantified for protein and equal
quantities loaded onto a series of 1D gels as previously described in section 2.10.2. Protein on
electrophoresed gels was transferred onto nitrocellulose membrane and blots probed for both
Peroxiredoxin-VI and Peroxiredoxin-VI-sulfide using primary antibodies at concentrations
recommended by the manufacturer (see table 2.3). Adjustments were made to the protocol
including alteration of blocking solutions, incubation time of the primary antibody and
concentration of primary antibody utilised. Prx-VI antibody was found to detect a protein band at
the appropriate molecular weight (24 kDa) which was equally expressed in all colorectal cancer cell
lysate (Figure 3.16). However, cross reactivity was seen between the antibody and other proteins
producing two bands at around 19kDa and 35kDa, figure 3.16A. Two-dimensional western blot
analysis for Prx-VI was performed on colorectal cancer cell lysate to better determine the nature of
the cross-reactivity seen on 1D western blot (results not shown). No convincing spot was
highlighted at the expected located of Prx-VI on the 2D gel and cross-reactivity was seen with a
multitude of different spots confirming that the reactivity seen on 1D western blotting was non-
specific in nature. Similarly, 1D analysis of Prx-VI-sulfide showed a faint band at the appropriate
molecular weight (24kDa), but multiple additional bands and a high background reactivity (Figure
3.16C). Alterations to the protocol used were made as outlined above, but cross-reactivity could
not be eliminated and the decision was made that the antibodies were not suitable for further
analysis in tissue.

Protein expression in colorectal cancer EM Tweedle
121
Figure 3.16: Western blot of peroxiredoxin 6 and peroxiredoxin 6-SO4 expression. Protein lysate
from colorectal cancer cell lines HCT116, HT29, SW480 and SW620 were separated by 1D SDS-
PAGE, transferred to membrane and western analysis undertaken with anti-PrxVI and anti-PrxVI-
SO3, β-actin was used as control. Primary antibody concentrations were Prx-VI 1:2000 (A), Prx-VI-
SO3 1:1000 (C) and β-actin 1:4000 (B&D). A: Blot probed for Prx-VI shows a band at the appropriate
molecular weight (28kDa) but additional bands at 40kDa and 19kDa. B: B-actin control.
Underloading HCT116. C: Blot probed for Prx-VI-SO3 shows multiple bands and heavy background
despite blocking with both milk protein and goat serum. D: B-actin control. Underloading HCT116,
overloading HT29. 21

Protein expression in colorectal cancer EM Tweedle
122
3.6 HEAT SHOCK PROTEIN 27
3.6.1 INTRODUCTION
The HSP27 gene encodes a 27kDa mass, 199-amino acid polypeptide which, in unstressed cells
exists predominantly as a single charged isoform (HSP27 A) with a PI of approximately 6.8.(262)
After exposure to heat or chemical shock HSP27 synthesis increases, and the protein accumulates in
the cytoplasm over 12-hours to levels that are approximately 10-fold higher than the basal level
found in unstressed cells. Physiological transcription is mediated by Heat Shock Transcription Factor
1 (HSF1) which translocates to the nucleus after heat shock and interacts with the heat shock
element (HSE) in the promoter region of the HSP27 gene.(263) HSP27 is also subject to more rapid
post-transcriptional modifications after cellular stress. Within minutes of exposure, two acidic
isoforms of HSP27 are generated, (HSP27 B and C), which represent phosphorylation at the serine
78 and 82 residues respectively by S6 kinase.(264) Additional agents which induce phosphorylation,
but not transcription of HSP27 have been identified. These are predominantly mitogenic agents,
such as serum, thrombin, fibroblast growth factor, TNF-α and TGF-β which exert their affect
through p38 MAP kinase.(265)
Up-regulation of HSP27 (and other HSP proteins) has been correlated with the acquisition of
thermotolerance.(266) This state is induced by a spectrum of activity broadly categorised into 1.
Direct inhibition of death pathways and 2. Repair of protein damage and resolution of protein
aggregates. HSP27 inhibits at multiple levels both the intrinsic (mitochondrial death) pathway and
the extrinsic (receptor-mediated) cell death pathways; both of which activate effector caspases to

Protein expression in colorectal cancer EM Tweedle
123
execute cell death.(267) HSP27 prevents loss of mitochondrial membrane potential and release of
mitochondrial proteins. It also prevents the interaction between cytochrome c and pro-caspase-9
thus preventing apoptosome formation. HSP27 targets the extrinsic pathway through Daxx by
inhibiting its binding to both the Fas cell death receptor and apoptosis signal regulating kinase,
Ask1.(268) In conjunction with other members of the HSP family, HSP27 functions as a molecular
chaperon. It forms complexes with damaged proteins preventing their non-specific aggregation,
and then enables refolding in an ATP-dependant process mediated by HSP70.(269) F-actin is one
such crucial protein stabilised by HSP27 during periods of cellular stress. HSP27 binds to denatured
actin monomers dissociated from F-actin and protects them forming large insoluble aggregates
under conditions of cellular stress. This has a potent anti-apoptotic affect by maintaining
compartment integrity and supporting protein trafficking within the cell.(270) An overview of
HSP27 regulation is shown in Figure 3.17.
HSF-1
HSP27
Re-folds
proteins
Stabilises
cytoskeleton
Prevents
apoptosis
Stress
Figure 3.17: The regulation and actions of heat shock protein 27. HSF1 migrates into the nucleus
following a stressor event. HSF1 interacts with the HSE on the promoter region of the HSP27 gene
causing transcription of the HSP27 protein22
Nucleus
Cell membrane
Cytoplasm

Protein expression in colorectal cancer EM Tweedle
124
Given its inhibitory influence on programmed cell death, it is not surprising that HSP27 has been
reported as elevated in a number of human cancers, principally prostate, breast and ovarian.(271)
One putative mechanism for these observations has centred on micro-environmental stress
imposed by tumour hypoxia; however evidence for this hypothesis is lacking. One model of
prostate tumour spheroids cultured with embryoid bodies observed little HSP27 expression during
tumour hypoxia, but an increase after neo-vascularisation and restoration of normal oxygen
tension.(272) Indeed, tumours cells growing as xenografts exhibited inhibition rather than
enhancement of HSP27 expression.(273) There is emerging evidence to suggest that genomic stress
contributes to the up-regulation of HSP27 in cancer through direct activation of the HSE, removal of
transcriptional repression and stabilisation of HSF1.(274) p53 reportedly attaches to the binding
site for the transcription factor NF-Y in the promoter region of HSP genes causing repression of
transcription. Proteomic analysis of p53-null cell lines documented increased expression of both
HSP70 and HSP27 compared to cells with wild-type p53.(275) This is a potentially important
mechanism of regulation in colorectal cancer which has a 50% rate of p53 mutation.(276)
Stabilisation of HSF1, prolonging transcription of HSP27 has been reported following heregulinβ1
activation of the c-erbB receptor,(277) a factor associated with poor survival in colorectal
cancer.(278) In addition, direct transcription of HSP through the HSE can occur via the proto-
oncogene c-Myc, which is also induced by heregulin and HER2.(279)

Protein expression in colorectal cancer EM Tweedle
125
3.6.2 HSP27 IS A PROMISING TARGET FOR VALIDATION IN COLORECTAL CANCER
Spot 6 was picked for analysis due its proximity to spot 5, felt to be a potential isoform of the
previously identified Peroxiredoxin-VI. The identification of the unrelated protein HSP27 was
unexpected, yet interesting. Re-analysis of the gel images suggested that HSP27 was in fact
differentially-expressed between different tumour samples, although not in relation to morphology
(Figure 3.10). A protocol for use of a commercially available anti-HSP27 antibody was already
employed for immunohistochemistry of prostate adenocarcinoma by the Lead Biomedical Scientist
in Pathology, Mr Andy Dodson in the Diagnostic Molecular Pathology Department in the Royal
Liverpool University Hospital. The antibody had previously been validated in our institute in a series
of paraffin-embedded, formalin-fixed prostate cancers and was found to be specific for HSP27,
easily scored and correlated with stage at presentation and prognosis of prostate cancer. Our group
had also found HSP27 to be differentially expressed in a series of 2D gels of undissected Duke’s C
colorectal cancers (work by Mr Ilyas Khattak). Initial staining of 98 cases of formalin-fixed colorectal
cancers had identified an association between HSP27 expression and survival in node-positive
colorectal cancer. Further validation of HSP27 expression in colorectal cancer was we felt merited
by these early results and kind permission to utilise data from the first 98 cases was given by Mr
Khattak and is included in the results discussed in this chapter.

Protein expression in colorectal cancer EM Tweedle
126
3.6.3 PATIENT DEMOGRAPHICS
Formalin-fixed, paraffin-embedded, primary colorectal adenocarcinomas, n=404 (199 colon, 205
rectal) from fully-consented patients, who underwent surgery at the Royal Liverpool University
Hospital, UK between 1993 and 2003, were obtained from the Liverpool Tissue Bank, University of
Liverpool. The tissue was microarrayed in eight separate blocks utilizing between two and six cores
per tumour in addition to normal control tissue from kidney, liver, testes, tonsil and colon. Patient
demographic details are provided in Table 3.2. Thirty percent of patients (121/404) underwent
chemotherapy. In the 103/121 (85%) patients in whom the chemotherapy agents were known, all
received 5-fluorouracil; 4/103 (4%) received an additional agent, (irinotecan or oxaliplatin). Second-
line and third-line chemotherapy was given in 37/103 (36%) and 19/103 (18%) of patients
respectively. Additional agents (irinotecan, oxaliplatin, mitomycin C or levamisole) were
administered in 9/37 (24%) of second-round and 10/19 (53%) of third-round patients. Thirteen
percent of rectal cancer patients underwent short-course radiotherapy as part of the CR07
trial(280) (25 Gray in 5 fractions over 1 week; surgery within 1 week of treatment), while 15%
underwent long-course radiotherapy (offered to patients with bulky tumours and consisting of 45
Gray, administered in 25 daily fractions over 5 weeks followed by surgery after 6–10 weeks). The
median follow-up was 49.5 months (IQR 19.6-74.6 months, range 0.23-146.5 months) and 284
deaths from any cause were reported, including 176 deaths due to colorectal cancer. Seven
patients died within 30 days of surgery and were censored in the survival analysis. Four additional
patients were censored at the point of last follow up as no date of death was recorded.

Protein expression in colorectal cancer EM Tweedle
127
Table 3.2: Clinicopathological data for n=404 patients on the microarrays17
Clinical parameter All cases, n=404 (%) Colon cancer n=199 (%) Rectal cancer n=205 (%)
Gender
Female 153 (38) 95 (48) 58 (28)
Male 251 (62) 104 (52) 147 (72)
Age
<70 years 209 (52) 90 (45) 119 (58)
≥70 years 195 (48) 109 (55) 86 (42)
Tumour size
<40mm 98 (24) 42 (21) 56 (27)
40-59mm 178 (44) 83 (42) 95 (46)
≥60mm 128 (32) 74 (37) 54 (27)
Resection margins
Clear 356 (88) 181 (91) 175 (85)
Involved 47 (12) 17 (9) 30 (15)
Unrecorded 1 1 0
Differentiation
Well 10 (2) 4 (2) 6 (3)
Moderate 359 (89) 181 (91) 181 (88)
Poor 31 (8) 15 (7) 16 (8)
Unrecorded 4 (1) 2 2 (1)
Depth of invasion
T1 20 (5) 12 (6) 8 (4)
T2 60 (15) 19 (9) 41(20)
T3 273 (67) 131 (66) 142 (69)
T4 51 (13) 37 (19) 14 (7)
Nodal status
N0 225 (55) 117 (59) 108 (53)
N1 99 (25) 43 (22) 56 (27)
N2 80 (20) 39 (19) 41 (20)
Adjuvant therapy
None 279 (69) 152 (76) 127 (62)
Chemotherapy
Unrecorded
121 (30)
4 (1)
46 (23)
1 (1)
75 (37)
3 (1)
Neoadjuvant therapy
None - - 147 (72)
Short course
Long course
-
-
-
-
27 (13)
31 (15)

Protein expression in colorectal cancer EM Tweedle
128
3.6.4 HSP27 INTENSITY MORE PREDICTIVE OF SURVIVAL THAN PERCENTAGE OF STAINED CELLS
Scoring of HSP27 expression was performed using a protocol which included intensity of staining
from 0-3 (based on staining of internal benign control tissue) and the percentage of cells staining
grouped into 0: <5%, 1: 5-30%, 2: 30-70%, 3:>70%. The scoring system is illustrated in Figure 3.18
using a selection of variably-staining colorectal adenocarcinomas. A composite value or 0-9 index
was calculated by multiplying the intensity and percentage staining. The median score in each field
was calculated and used to dichotomise the data for analysis; intensity (low≤1.5 versus high>1.5),
percentage (low≤2 versus high>2) and index (low≤3 versus high>3). These factors were subject to
univariate Cox regression to assess which aspects of HSP27 staining were most strongly correlated
with overall survival, table 3.3. Intensity of staining, but not percentage staining was related to
overall survival, P=0.0171 versus P=0.9261 respectively; however, index was most predictive of
survival, P=0.0078 and was utilised in the further construction of Kaplan-Meier curves and life
tables.
Table 3.3: Univariate Cox regression of HSP27 intensity and percentage18
Variable Cases Univariate analysis
n=404 (%) HR(95%CI) χ2 p-value
HSP27 intensity (median score 1.5) ≤1.5
>1.5
232 (57)
172 (43)
-
1.286 (0.957-1.730)
2.780
0.0955
HSP27 percentage (median score 2.0) ≤2.0
>2.0
234 (58)
170 (42)
-
0.944 (0.699-1.274)
0.143
0.7056
HSP27 index (median score 3.0) ≤3.0
>3.0
228 (56)
176 (44)
1.382 (1.028-1.858)
4.600
0.0320

Protein expression in colorectal cancer EM Tweedle
129
Figure 3.18: Immunohistochemistry for HSP27. (A) Benign control tissue showing absence of
detectable HSP27 in normal colonic epithelium, weak staining in normal liver and intense staining
of normal renal tubules. (B) Colorectal cancer tissue illustrating the range of intensities of HSP27
immunostaining, from 0 to 3. (C) Colorectal cancer tissue depicting varying percentages of HSP27
staining in different tumours. 23

Protein expression in colorectal cancer EM Tweedle
130
3.6.5 HSP27 DOES NOT CORRELATE WITH STAGE AT PRESENTATION OR METASTASES
We proceeded to assess the relationship between HSP27 index score and clinicopathological
variables related to the 404 tumours on the tissue microarray. TNM and the American Joint
Committee on Cancer, AJCC guidelines were used to stage tumours.(243) Associations were sought
between HSP27 expression (combined index) and gender, age, anatomical location, size of tumour,
resection margin status, differentiation grade, depth of invasion (T-stage), presence of nodal
metastases (N-stage) and treatment (adjuvant chemotherapy and neoadjuvant radiotherapy). The
entire cohort of 404 patients was examined, in addition to separate analyses of the subgroups of
patients with colon cancer (n=199) and rectal cancer (n=205). No significant correlations were
demonstrated between HSP27 index and these parameters in any of groups analysed, with one
exception (Table 3.4). High HSP27 expression was associated with incomplete resection margins in
rectal cancer patients (P=0.009; Table 3.4).

Protein expression in colorectal cancer EM Tweedle
131
Table 3.4: Clinicopathological features associated with HSP27 expression19
All cases Colon cancers Rectal cancers
Clinical parameter Cases n=404 (%)
HSP27 –ve n=228(%)
HSP27 +ve n=176(%)
P value*
Cases n=199 (%)
HSP27 –ve n=115(%)
HSP27 +ve n=84(%)
P value*
Cases n=205 (%)
HSP27 –ve n=113(%)
HSP27 +ve n=92(%)
P value*
Gender Female 153 (38) 83 (36) 70 (40) 0.489 95 (48) 51 (44) 44 (52) 0.262 58 (28) 32 (28) 26 (28) 0.993 Male 251 (62) 145 (64) 106 (60) 104 (52) 64 (56) 40 (48) 147 (72) 81 (72) 66 (72) Age <70 years 209 (52) 113 (50) 96 (55) 0.320 90 (45) 51 (44) 39 (46) 0.771 119 (58) 62 (55) 57 (62) 0.306 ≥70 years 195 (48) 115 (50) 80 (45) 109 (55) 64 (56) 45 (54) 86 (42) 51 (45) 35 (38) Tumour size <40mm 98 (24) 52 (23) 46 (26) 0.439 42 (21) 25 (22) 17 (20) 0.683 56 (27) 27 (24) 29 (31) 0.391 40-59mm 178 (44) 98(43) 80 (46) 83 (42) 45 (39) 38 (45) 95 (46) 53 (47) 42 (46) ≥60mm 128 (32) 78 (34) 50 (28) 74 (37) 45 (39) 29 (35) 54 (27) 33 (29) 21 (23) Resection margins Clear 356 (88) 207 (91) 149 (84) 0.080 181 (91) 104 (90) 77 (91) 0.563 175 (85) 103 (91) 72 (78) 0.009 Involved 47 (12) 21 (9) 26 (15) 17 (9) 11 (10) 6 (8) 30 (15) 10 (9) 20 (22) Unrecorded 1 0 1 (1) 1 0 1 (1) 0 0 0 Differentiation Well 10 (2) 4 (2) 6 (4) 0.562 4 (2) 1 (1) 3 (4) 0.087 6 (3) 3 (3) 3 (3) 0.316 Moderate 359 (89) 204 (89) 155 (88) 181 (91) 101 (88) 77 (91) 181 (88) 103 (91) 78 (85) Poor 31 (8) 18 (8) 13 (7) 15 (7) 12 (10) 3 (4) 16 (8) 6 (5) 10 (11) Unrecorded 4 (1) 2 (1) 2 (1) 2 1 (1) 1 (1) 2 (1) 1 (1) 1 (1) Depth of invasion T1 20 (5) 11 (5) 9 (5) 0.763 12 (6) 7 (6) 5 (6) 0.964 8 (4) 4 (3) 4 (4) T2 60 (15) 34 (15) 26 (15) 19 (9) 10 (9) 9 (11) 41(20) 24 (21) 17 (19) T3 273 (67) 157 (69) 116 (66) 131 (66) 77 (67) 54 (64) 142 (69) 80 (71) 62 (67) T4 51 (13) 26 (11) 25 (14) 37 (19) 21 (18) 16 (19) 14 (7) 5 (4) 9 (10) Nodal status N0 225 (55) 131 (57) 94 (53) 0.558 117 (59) 65 (56) 52 (62) 0.744 108 (53) 66 (58) 42 (46) 0.095 N1 99 (25) 56 (25) 43 (25) 43 (22) 26 (23) 17 (20) 56 (27) 30 (27) 26 (28) N2 80 (20) 41 (18) 39 (22) 39 (19) 24 (21) 15 (18) 41 (20) 17 (15) 24 (26) Adjuvant therapy None 279 (69) 161 (71) 118 (67) 0.297 152 (76) 89 (77) 63 (75) 0.613 127 (62) 72 (64) 55 (60) 0.406 Chemotherapy Unrecorded
121 (30) 4 (1)
63 (27) 4 (2)
58 (33) 0
46 (23) 1 (1)
25 (22) 1 (1)
21 (25) 0
75 (37) 3 (1)
38 (33) 3 (3)
37 (40) 0
Neoadjuvant therapy None - - - - - - 147 (72) 84 (74) 63 (68) 0.629 Short course Long course
- -
- -
- -
- -
- -
- -
27 (13) 31 (15)
14 (12) 15 (14)
13 (14) 16 (18)
Protein expression in colorectal cancer EM Tweedle
132
3.6.6 HSP27 STATUS INDEPENDENTLY PREDICTS SURVIVAL IN RECTAL CANCE R
Elevated HSP27 was associated with poor survival (P=0.0312) when the entire cohort of 404
patients was examined (Fig. 3.19A). However, when the colon and rectal cancer patients were
analysed separately, HSP27 expression was not associated with survival in the colon cancer group
(P=0.7385; Figure 3.19B), but was significantly associated with poor survival in the rectal cancer
group (P=0.0063; Figure 3.19C). At five-years, rectal cancer-specific survival of high HSP27-
expressers was 63% versus 73% for low HSP27-expressers. Survival was assessed across all stages at
presentation in rectal and colon cancer. Elevated HSP27 predicted poor cancer-specific survival in
rectal cancer patients with early stage I/II tumours (Figure 3.19D). HSP27 however, was not
predictive of poor survival for rectal cancer patients with stage III (N+/M0) disease (P=0.2132,
Figure 3.19E). Kaplan-Meier curves were constructed for stage I/II colon cancer (Figure 3.20A) and
stage III colon cancer (Figure 3.20B). No difference in survival according to HSP27 expression was
noted either group; P=0.8569 and P=0.4365 respectively (Figure 3.20A&B). The benefits of adjuvant
therapy for patients with stage III disease are well established, whilst management of patients with
stage II rectal tumours (T3-4/N0/M0) remains controversial.(281) We next determined whether
high HSP27 expression might be useful in identifying a ‘high-risk’ group of patients with stage II
rectal tumours (T3-4/N0/M0) who might benefit from adjuvant therapy. We found that the overall
survival of patients with stage II (T3-4/N0/M0) disease who had elevated HSP27, n=29 was similar
to that of patients with N1 disease, n=56 (P=0.6523, Fig. 3.19F). This was not observed in colon
cancer, where the overall survival of patients with stage II (T3-4/N0/M0) disease who had elevated
HSP27, n=41 was significantly better than that of patients with N1 disease, n=43 (P=0.0268, Figure
3.20C).

Protein expression in colorectal cancer EM Tweedle
133
Figure 3.19: Kaplan-Meier graphical analysis of 8-year survival in (A) all patients, (B) colon cancer
patients, (C) rectal cancer patients, (D) Stage I/II rectal cancer patients, (E) Stage III rectal cancer
patients. (F) Stage IIIA/B rectal cancer patients versus Stage II high HSP27 expressors.24

Protein expression in colorectal cancer EM Tweedle
134
Figure 3.20: Kaplan-Meier curves of HSP27 index in colon cancer (A) Stge I/II colon cancer; high
HSP27-expressors (n=52) showed similar survival to low expressors (n=65; log-rank, P=0.8569). (B)
Stage III colon cancer; high HSP27-expressors (n=32) showed similar survival to low expressors
(n=50; log-rank, P=0.4365). (C) Poor survival for stage IIIA/B colon cancer (all cases; n=43) versus
Stage II high HSP27 expressors (n=41, log-rank, P=0.0268. 25

Protein expression in colorectal cancer EM Tweedle
135
3.6.7 MULTIVARIATE ANALYSIS OF SURVIVAL
Multivariate Cox proportional hazards regression analysis was performed to derive risk estimates
related to survival for all clinicopathologic characteristics and HSP27 expression. Elements
associated with cancer-specific survival on univariate analysis with a P-value<0.10 were included in
the multivariate model. Univariate analysis of 205 rectal cancer patients revealed that resection
margin status (P=0.0894), N-stage (P=0.0001) and HSP27 expression (P=0.0069) were significantly
associated with survival (Table 3.5A). Only N-stage and HSP27 expression remained independently
predictive of survival in rectal cancer with P-values of 0.0001 and 0.0233 respectively. Univariate
analysis of 199 colon cancers revealed significant factors as differentiation grade (P=0.0278), T-
stage (P=0.0008), resection margin status (P=0.0001) and N-stage (P=0.0001), (Table 3.5B). HSP27
was not associated with survival (P=0.7382). On multivariate analysis only resection margin status
(P=0.0001) and N-stage (P=0.0001) remained independently significant for colon cancer (Table
3.5B).

Protein expression in colorectal cancer EM Tweedle
136
Table 3.5 A: Univariate and multivariate analysis of survival in rectal cancer20
Table 3.5 B: Univariate and multivariate analysis of survival in colon cancer 21
Variables Group Cases Univariate Multivariate
n=205 (%)
HR(95%CI) χ2 p-
value HR(95%CI) χ
2 p-
value
Age (years) 68yrs
(60-74)
- 1.000 (0.981-1.018) 0.001 0.973 - - -
Size (mm) 45mm
(35–60)
- 1.001 (0.998-1.004) 0.115 0.693 - - -
Diff
grade
Well-Mod
Poor
187 (91)
16 (9)
1.355 (0.682-2.693)
0.753
0.386
-
-
-
T-stage T1
T2
T3
8 (4)
41 (20)
156 (76)
-
1.154 (0.336-3.967)
1.708 (0.539-5.416)
2.686
0.052
0.827
0.261
0.820
0.363
-
-
-
-
-
-
-
-
-
Resection margins
Clear
Involved
175 (85)
30 (15)
1.563 (0.933-2.618)
2.884
0.089
0.808 (0.450-1.453)
0.506
0.477
N-stage N0
N1
N2
108 (53)
56 (27)
41 (20)
-
1.557 (0.962-2.521)
3.259 (2.027-5.240)
23.892
3.250
23.766
0.001
0.071
0.001
-
1.539 (0.947-2.500)
3.289 (1.956-5.532)
20.227
3.026
20.150
0.001
0.082
0.001
HSP27 expression
Negative
Positive
113 (55)
92 (45)
1.720 (1.160-2.550)
7.293
0.007
1.607 (1.066-2.422)
5.143
0.023
Variable Group Cases Univariate Multivariate
n=199 (%)
HR(95%CI) χ2 p-
value HR(95%CI) χ
2 p-
value
Age (years) 71 yrs
(64 – 77)
- 1.002 (0.982-1.022) 0.023 0.879
- - -
Size (mm) 50mm
(40 - 60)
- 1.001 (0.998-1.003) 0.246 0.620 - - -
Diff
grade
Well-Mod
Poor
182 (91)
15 (8)
2.192 (1.089-4.412)
4.838
0.028
1.315 (0.605-2.857)
0.478
0.489
T-stage T1
T2
T3
T4
12 (6)
19 (10)
131 (66)
37 (18)
-
1.476 (0.134-16.29)
4.818 (0.665-34.89)
10.56 (1.425-78.29)
16.738
0.101
2.423
5.322
0.001
0.751
0.120
0.021
-
1.905 (0.172-21.15)
3.257 (0.445-23.85)
5.825 (0.771-43.99)
7.181
0.276
1.352
2.918
0.066
0.600 0.245
0.088
Resection margins
Clear
Involved
181 (91)
17 (9)
4.776 (2.532-9.008)
23.326
0.001
4.002 (2.055-7.792)
16.644
0.001
N-stage N0
N1
N2
117 (59)
43 (22)
39 (19)
-
2.622 (1.510-4.555)
4.671 (2.702-8.075)
31.717
11.712
30.466
0.001
0.001
0.001
-
2.021 (1.136-3.597)
3.705 (2.062-6.658)
19.423
5.726
19.191
0.001
0.017
0.001
HSP27 expression
Negative
Positive
115 (58)
84 (42)
0.926 (0.588-1.456)
0.111
0.739
1.354 (0.497-1.290)
0.833
0.361

Protein expression in colorectal cancer EM Tweedle
137
3.6.8 RELATIONSHIP BETWEEN HSP27 EXPRESSION AND NEO-ADJUVANT TREATMENT
The difference in survival observed in the rectal, but not the colon cancer patients, prompted us to
question whether HSP27 expression was related to administration of neo-adjuvant radiotherapy.
Our rectal cancer patients underwent two forms of treatment; long-course and short-course
radiotherapy. Short-course pre-operative radiotherapy was offered as part of the CR07 trial which
recruited patients with operable tumours and administered 25 Gray in five daily fractions over one
week, with surgery within one week of treatment. Long-course radiotherapy was offered to
patients with bulky tumours which, on pre-operative imaging, was felt to compromise the proposed
mesorectal excision margin. The aim was to downsize the tumour rendering it operable, and
45 Gray was administered in 25 daily fractions over five weeks followed by surgery after 6–10
weeks. We analysed a cohort of rectal cancer patients in order to determine whether pre-operative
radiotherapy was associated with a change in HSP27 expression. Data were obtained for 80
patients; 49 (61%) had no neo-adjuvant therapy, 17 (21%) had short-course and 14 (18%) had long-
course radiotherapy. Matched diagnostic biopsy material was obtained for all 80 patients and
analysed for HSP27 expression. In 65/80 (81%) of cases the HSP27 index was the same in the biopsy
and the tumour. Four tumours (6%) showed up-regulation of HSP27 compared to the biopsy and
9/67 (13%) down-regulated HSP27 in the tumour compared to the biopsy, (Figures 3.21A and B,
Table 3.6). Expression of HSP27 in the primary tumour was not correlated with neo-adjuvant
therapy received, P=0.802, neither was there an associated change in HSP27 expression between
the biopsy and tumour specimens following pre-operative therapy, P=0.602, (Table 3.7).

Protein expression in colorectal cancer EM Tweedle
138
3.6.9 NEO-ADJUVANT THERAPY IS NOT ASSOCIATED WITH OVERALL SURVIVAL
Having demonstrated that neo-adjuvant radiotherapy did not influence HSP27 expression, we
sought to determine whether the type of neo-adjuvant radiotherapy received contributed to the
survival difference observed in the rectal cancer group. Survival analysis performed for the 147
rectal cancer patients who did not receive radiotherapy treatment confirmed that high HSP27
expression in this group was associated with poor survival (P=0.0078, Figure 3.21C). No difference
in cancer-specific survival was seen in the rectal cancer group according to type of radiotherapy
received (P=0.4317, Figure 3.21D).
HSP27 expression in
diagnostic biopsies
No of cases,
n=80 (%)
Low HSP27 index, n=42
(%)
High HSP27 index, n=38
(%)
P-value
Low HSP27 in biopsy 37 (46) 32 (76) 5 (14) <0.0001
High HSP27 in biopsy 43 (54) 10 (24) 33 (86)
Table 3.6: Comparative HSP27 expression between diagnostic biopsy and tumour 22
Levels of HSP27 in tumour
compared to biopsy
No of
cases,
n=80(%)
Neo-adjuvant radiotherapy P-value
None,
n=49
Short course,
n=17
Long-course,
n=14
Up-regulated in tumour 5 (6) 3 (6) 2 (12) 0 0.6423
Equal expression 65 (81) 39 (80) 14 (82) 12 (86)
Down-regulated in tumour 10 (13) 7 (14) 1 (6) 2 (14)
Table 3.7: Change in HSP27 expression according to pre-operative radiotherapy 23

Protein expression in colorectal cancer EM Tweedle
139
Figure 3.21: (A and B): HSP27 staining in diagnostic biopsy material (upper panel) compared to
matched tumour cores (lower panel). (C) Kaplan-Meier survival curves demonstrating that the level
of HSP27 remains predictive of cancer-specific survival in rectal cancer patients who have not
received neoadjuvant radiotherapy and (D) that mode of neoadjuvant radiotherapy received did
not correlate with cancer-specific survival. 26

Protein expression in colorectal cancer EM Tweedle
140
3.7 COFILIN1 AND COFILIN-PHOSPHO(SER3)
3.7.1 INTRODUCTION
Cofilin is one of a group of universally-expressed actin-binding proteins which co-operate to control
the structure of the cytoskeleton. The actin-binding region takes the form of a long α-helix which is
highly conserved between isoforms. Cofilin-1 (non-muscle cofilin or n-cofilin) is an 18kDa protein
consisting of 166 amino acids. It is the most abundant and ubiquitously expressed member of the
cofilin family which also incorporates cofilin-2 (muscle cofilin or m-cofilin) and ADF (actin-
depolymerising factor or destrin). Expression of the different forms of the cofilin family varies
according to tissue type; cofilin-1 and ADF are the predominant isoforms in most adult tissues
whereas cofilin-2 is the chief isoform present in skeletal and cardiac muscle.(282) The protein is
subject to a number of post-translational modifications including phosphorylation at residues 3, 25,
41, 68, 140 and 156 and acetylation at 2 and 132. Phosphorylation at the serine 3 residue is the
only known functional modification which prevents cofilin from binding to actin.(283)
Actin filaments (F-actin) are formed by polymerization from actin monomers (G-actin); these helices
intertwine generating actin microfilaments.(284) Filaments are polarised, with polymerisation
taking place at the barbed-end and dissociation at the pointed-end of actin molecules.
Polymerization in vivo is dependent on the formation of free barbed-ends that act as nuclei for
elongation. Rapid nucleation is created by two complementary processes; uncapping or severing of
existing filaments by cofilin and generation of novel nuclei on the body of filaments by the complex
Arp 2/3 producing new branches.(285) Polymerisation proceeds once ATP-G-actin binds to the

Protein expression in colorectal cancer EM Tweedle
141
nucleation point; the ATP is hydrolyzed to ADP releasing the inorganic phosphate. At the pointed-
end, ADP-F-actin dissociates slowly in a process which is catalysed by cofilin. Cofilin releases old
ADP-F-actin into the cytoplasm to enable ADP-to-ATP exchange to take place, re-generating the
cellular pool of ATP-G-actin. In the presence of plentiful G-actin, cofilin facilitates actin
polymerization via its actin-severing activity; providing free barbed ends for further polymerization
and nucleation. When the concentration of G-actin is limited, the net result of severing by cofilin is
depolymerisation, not nucleation.(286)
Cell motility is dependent on synchronised activity of the actin cytoskeleton. The cell initiates a
protrusion at the front, which subsequently attaches to the substratum. This is followed by
contraction of the cell body and tail detachment, resulting in movement in the direction of the
protrusion. The initiating event in this cycle is appears to be activation of cell surface receptors by
chemotactic factors, which establish a signalling cascade culminating in the polymerization of new
actin at the leading edge.(287) The site of signal activation on the cell surface determines the
direction of cell migration. Within 60 seconds of stimulation with a chemoattractant, Arp2/3
complex and cofilin are recruited to the membrane. As described, both factors act synergistically to
generate multiple dendritic actin filaments with free barbed ends. Function-blocking antibodies
directed against either protein significantly decrease barbed-end generation and cell
protrusion.(288) Polymerisation of the actin filaments is dependent on a high concentration of G-
actin to act as substrate. Cofilin depolymerises filaments at the base of membrane protrusions to
replenish G-actin and facilitate polymerisation at the leading edge in a process called
treadmilling.(289)

Protein expression in colorectal cancer EM Tweedle
142
Cofilin activity can be regulated within a cell in a number of ways. Firstly, cofilin can be inactivated
by phosphorylation of the serine 3 residue by the LIM family of kinases. LIM kinase 1 and 2 (LIMK1
and LIMK 2) are regulated by Rho GTPases through their downstream effectors Rho-associated
protein kinase (ROCK) and p21-activated kinases 1 and 4 (PAK1 and PAK4). These activate LIMK1
and LIMK2 by phosphorylation at residues Thr508 and Thr505, respectively. Active cofilin can be
sequestered by phosphatidylinositol (4,5)-bisphosphate, PIP2 forming a pool of the protein close to
the cell membrane unavailable for actin binding. Cofilin is also regulated by pH; the actin binding
efficiency is markedly reduced when the pH drops below 7.0.(290, 291) Activation of cofilin can
take place through increasing pH, dephosphorylation by various phosphatases including Slingshot
(SSH) and chronophin or hydrolysis of PIP2 due to increasing phospholipase C (PLC) activity which
releases cofilin from sequestration.(292) An overview of cofilin regulation is shown in Figure 3.22.
The central position of cofilin in co-ordinating membrane protrusion and directional motility has led
many to investigate its role in cancer cell invasion. Expression of cofilin has been reported as up-
regulated in tumour tissue including oral squamous cell,(293) ovarian(294) and renal cell
carcinoma;(295) and in human cancer cell lines for example breast (MDA-MB435S),(296) pancreatic
(EPP85-181RDB)(297) and lung adenocarcinoma (A549).(298) Phospho(ser3)-cofilin has been
quantified and found at reduced levels in various human cancer cell lines including T-cell lymphoma
(Jurkat), cervical (HeLa), colon (KM12), liver (HepG2) and kidney (COS1). A study of 13 different
colorectal cancer cell lines confirmed universally high levels of cofilin-1 and ADF on Western blot.
SiRNA induced knock-down of both cofilin and ADF was associated with enhanced adhesion to
laminin I and collagen I/IV. Migration of cells through Matrigel was reduced in colorectal cancer cell

Protein expression in colorectal cancer EM Tweedle
143
lines HCT116 and LS174T, but not the Isrecol cell line following reduction of cofilin-1 expression;
whereas Isrecol cell migration was reduced by ADF depletion.(299) However, several studies have
found cofilin to be down-regulated in cancer, specifically hepatocellular carcinoma cell line
(MCHCC97-H),(300) and increasing cofilin expression in H1299 human lung cancer cells reduces
invasion by disrupting the actin cytoskeleton at the leading edge.(301) In breast cancer cells, EGFR
activation results in PLC-mediated hydrolysis of PIP2, releasing cofilin; simultaneously LIM kinase
and phosphorylated cofilin levels are seen to increase.(302) This points to formation of an
equilibrium between active cofilin1 and inactive cofilin-phospho(ser3) within a cell mediated by a
number of different factors including LIM kinase and PLC. Following stimulation of the cell by
chemotactic factors a new equilibrium may be reached.(303)
Cofilin has been linked to cell invasion and an increase in malignant phenotype of breast cancer
cells.(303) Little is known about the expression of cofilin in actual tumours. Only one study
evaluated immunohistochemical levels of cofilin1 in paraffin-embedded cancer tissue. The paper
reports an increase in depth of invasion in neuroendocrine gastrointestinal tumours with increasing
expression of cofilin1, although the number of cases involved was small (n=34).(304) We have
made preliminary investigations of commercially available antibodies to cofilin and cofilin-
phospho(ser3) with a view to conducting the first large scale study of cofilin expression in colorectal
cancer tissue.

Protein expression in colorectal cancer EM Tweedle
144
Figure 3.22: Regulation of cofilin27

Protein expression in colorectal cancer EM Tweedle
145
3.7.2 COFILIN AND COFILIN-PHOSPHO(SER3) EXPRESSED IN COLORECTAL CANCER CELL LYSATE
Colorectal cancer cell lines HCT116, HT29, SW480 and SW620 cell lines were cultivated in L15 in 5%
CO2 to confluence. Cell lysate was prepared as described in Section 2.5.1 from each cell line and
protein quantified using the BCA method. An equal quantity of protein (30µg) was loaded onto
each lane of a small format 1D gel and run as described in section 2.5.1. Anti-cofilin antibody and
anti-cofilin-phospho(ser3) antibodies were used as primaries in concentration 1:10,000 and 1:50
respectively. The secondary antibody was horseradish-conjugated rabbit anti-mouse at 1:4000
concentration. Development of blots revealed a band at the appropriate molecular weight (17kDa)
in all cell lines probed for cofilin. Loading was variable in actin control films with underloading in
HCT116 lane and overloading in SW480 lane. When probed for cofilin-phospho(ser3) only HT-29
(non-metastastic) colorectal cancer cell line showed a band at the appropriate molecular weight at
2 minutes with weaker bands visible at 15 minutes in SW480 and SW620 samples. Anti-cofilin and
cofilin-phospho(ser3) antibodies are capable of detecting protein bands of the relevant size in
tumour cell lysate and show little cross-reactivity with other proteins. Inconsistent gel loading,
evidenced by variable expression of β–actin control, indicated that relative expression of cofilin
between cell lines could not be commented upon (Figure 3.23A&B). Despite inconsistent gel
loading in evidence on β–actin control blot, the expression of cofilin-phospho(ser3) was felt to be
more variable, with highest expression in cell line HT29, followed by SW620 and SW480; lowest
expression was seen in the cell line HCT116 (Figure 3.23C&D).

Protein expression in colorectal cancer EM Tweedle
146
Figure 3.23: 1D Western blots of colorectal cancer cell lysate probed for cofilin and cofilin-
phospho(ser3). Protein lysate from colorectal cancer cell lines HCT116, HT29, SW480 and SW620
were separated by 1D SDS-PAGE, transferred to membrane and western analysis undertaken with
anti-cofilin1 and anti-phosphylated cofilin. β-actin was used as control. Primary antibody
concentrations were cofilin1 1:10000 (A), cofilin-P 1:50 (C) and β-actin 1:20000 (B&D). A/B: Blot
probed for cofilin1 and β-actin showing greater expression of the protein in HCT116 cells. C/D: Blot
probed for cofilin-phospho(ser3) and β-actin showing greatest expression in HT29 and lowest
expression in HCT116 cells28

Protein expression in colorectal cancer EM Tweedle
147
3.7.3 CONFIRMATION OF SPOT IDENTITY USING 2D WESTERN BLOTTING IN CELL LINES AND TISSUE
In order to confirm the identity of cofilin1 on tandem mass spectrometry I sought to validate the
findings on 2D Western blot. Western blot analysis could give a more accurate impression of post-
translational modifications in the protein of interest. Two samples from each of four lysates were
subject to 2D electrophoresis as described in section 2.3; cell lines SW480 and HT29 in addition to
undissected material from patient 264-05 (tumour and normal colon). One gel from each pair was
fixed and stained with coomassie blue as control: proteins on the second gel were electro-
phorectically transferred onto nitrocellulose membrane in preparation for Western blotting as
described in section 2.5. Membranes were stained with Ponceau stain to check adequate transfer
prior to being probed with anti-cofilin-phospho(ser3) at 1:50 overnight at 4°C. Following
development of the blots, membranes were stripped with stripping buffer (20ml SDS 10%, 12.5 ml
0.5 M Tris HCl (pH 6.8), 0.8 ml ß-mercaptoethanol, 67.5 ml ultra pure water) and re-probed with
anti-cofilin1 at 1:10,000 for 1hr at room temperature.
Colorectal cancer cell lysate, undissected tumour and undissected normal colon showed similar
pattern of cofilin1 staining. A string of proteins of similar molecular weight (17kDa) was seen
extending from PI 6.5-8.0. Little non-specific cross-reactivity was seen with other proteins on the
blot. Cofilin-phospho(ser3) showed activity in a single spot at 17kDa, PI 6.5 which corresponded
well with the spot picked as variably-expressed on the silver-stained gels. Staining was more
variable across samples with the metastatic cancer cell line SW480 showing heaviest staining,
frozen tumour tissue and non-metastatic cell line HT29 showing moderate staining and normal
colon showing minimal staining; (Figures 3.24 and 3.25).

Protein expression in colorectal cancer EM Tweedle
148
Figure 3.24: 2D Western blot of cofilin and cofilin-phospho(ser3) in colorectal cancer cell lines.
A&B. Coomassie-stained gels C&D: Ponceau-stained membrane E&F: Cofilin1 blot showing string of
proteins at 17kDa, PI 6.5-8.0. Ringed in green. G&H: cofilin-phospho(ser3) blot showing one spot
corresponding top the most acidic form of cofilin1 with variable expression. Ringed in green. 29

Protein expression in colorectal cancer EM Tweedle
149
Figure 3.25: 2D Western blot of cofilin and cofilin-phospho(ser3) in frozen tumour and normal
colon. A&B. Coomassie-stained gels C&D: Ponceau-stained membrane E&F: Cofilin1 blot showing
string of proteins at 17kDa, PI 6.5-8.0. Ringed in green. G&H: cofilin-phospho(ser3) blot showing
one spot corresponding top the most acidic form of cofilin1 with variable expression. Ringed in
green. 30

Protein expression in colorectal cancer EM Tweedle
150
3.7.4 DETECTION OF COFILIN1 AND IN PARAFFIN-EMBEDDED COLORECTAL TISSUE
Sections of paraffin-embedded colorectal cancer tissue were stained using the protocol outlined in
methods (Section 2.1). Primary antibody was monoclonal rabbit anti-cofilin1 at a concentration
1:40,000. Staining of whole tumour and benign tissue sections was undertaken in order to compare
immunohistochemistry levels with expression in laser-captured 2D gels. Initial results on whole
tumour staining were promising with variable expression seen in tumour cytoplasm; no staining in
tumour nucleus or membranes was identified. In benign tissue strong staining was seen in muscle;
no or light staining at the base and stronger staining at the neck of normal colonic epithelial crypts,
(Figure 3.26).
The second stage of immunohistochemical evaluation was staining of the colorectal cancer tissue
microarray using the same antibody conditions. Unfortunately, staining of a larger number (n=313)
of specimens demonstrated that the antibody utilised was not sensitive enough to detect the small
differences in expression levels between the majority of tumours, images not shown.
Approximately 80-90% of the arrayed specimens had scores of 2 or 3 in the cytoplasm. The array
was assessed by a consultant histopathologist, Dr Bahram Azadeh who felt that the pattern of
staining given by this antibody was not sensitive or specific enough to define different groups of
colorectal adenocarcinomas. Further evaluation of the cofilin pathway is planned using anti-cofilin-
phospho(ser3) antibody in paraffin-embedded tissue.

Protein expression in colorectal cancer EM Tweedle
151
Tumour Normal
Tissue section 2D gel Tissue section 2D gel
Figure 3.26A: Immunohisto-chemistry (IHC) of cofilin1 in
normal colon and depressed-type tumour tissue with
corresponding 2D gel images.
A: Whole tumour gel with area of gel shown in B marked with
box. B: Immunohistochemistry for cofilin1 in normal colon and
colorectal cancer tissue matched with 2D gel analysis of the
same tissue (samples 104-06, 084-06, 264-05, 149-01). Good
concordance demonstrated between expression of cofilin1 in
tumour or epithelial cells on IHC (brown staining) and silver-
staining of spots on 2D gel analysis. 31

Protein expression in colorectal cancer EM Tweedle
152
Tumour Normal
Tissue section 2D gel Tissue section 2D gel
Figure 3.26B: Immunohistochemistry (IHC) of cofilin1 in
normal colon and polypoid and flat-type tumour tissue with
corresponding 2D gels images.
A: Whole tumour gel with area of gel shown in B marked with
box. B: Immunohistochemistry for cofilin1 in normal colon and
colorectal cancer tissue matched with 2D gel analysis of the
same tissue (samples 054-96, 148-01, 108-03, 075-00, 233-00,
259-01). Good concordance demonstrated between expression
of cofilin1 in tumour or epithelial cells on IHC (brown staining)
and silver-staining of spots on 2D gel analysis. 32
Protein expression in colorectal cancer EM Tweedle
153
3.8 S100A8
3.8.1 INTRODUCTION
The calcium-binding proteins S100A8 and S100A9 are expressed on the surface of myeloid cells and
are secreted at the site of inflammation as stable heterodimeric complexes.(305, 306) Monocytes
are found predominantly in the circulation, but can be recruited to areas of inflammation or
tumour whereon they differentiate into macrophages.(307) The factors that promote monocyte
recruitment and differentiation, and the affect this may have on the composition of the tumour-
associated stroma are not yet clear. There is some evidence to suggest that certain subsets of
circulating monocytes can be recruited to the tumour by hypoxia and ligand expression on the
surface of cancer cells; and that they are capable of promoting angiogenesis in the stroma.(308)
S100A8 and S100A9, which are secreted by infiltrating monocytes have demonstrable cytokine-like
properties, acting as a chemotactic factor for other inflammatory cells.(309) More recently, both
proteins have been shown to activate signalling cascades through cell-surface receptors and
promote motility of various cancer cell types in vitro. This affect has been reported to occur
through activation of the multi-ligand receptor RAGE, (receptor for advanced glycation end-
products).(310)
Colorectal cancers show varying degrees of desmoplastic stroma response. The cellular content of
the surrounding stroma principally comprises myofibroblasts, myeloid cells, lymphocytes and
macrophages. The composition of the tumour-associated stroma can affect tumour growth,
metastasis and patient survival.(311, 312) One type of stromal response is characterised by a strong

Protein expression in colorectal cancer EM Tweedle
154
‘cytotoxic’ (CD8+) lymphocytic infiltrate around the tumour margin which is closely associated with
dendritic cells and macrophages. This type of response has been linked to tumour regression,
inhibition of metastases and good prognosis, and is frequently associated with MSI tumours.(313)
Other forms of stromal response have been reported in which myofibroblasts and large numbers of
infiltrating macrophages are associated with nodal metastases and poor prognosis.(314, 315) These
observations have been partially explained by the macrophage balance hypothesis, which proposes
two different macrophage populations; M1 type characterised by potent cytotoxic activity, and M2
type characterised by angiogenesis and matrix remodeling.(316) The role of the cancer cell in
recruitment, differentiation and maintenance of the stroma is not yet fully understood.
In 1990, Fearon and Vogelstein proposed multistage genetic alterations in colorectal carcinogenesis
which underpin the transformation of a benign adenoma to a malignant lesion.(33) The genes
associated with various stages of transformation were identified as the APC (5q), the K-ras gene,
p53 gene (17p) and a gene located on 18q21. In the 18q21 region Smad4 was one of the proposed
candidate genes. Smad4 forms a cytoplasmic complex with other Smad proteins following TGF-β
signalling, causing them to migrate into the nucleus initiating gene transcription. Loss of expression
of the Smad4 protein in colorectal cancers occurs in 10-15% of cases overall,(317) but is reported to
increase in frequency in to 30-35% in those tumours with distant or nodal metastases.(318) The
largest study of prognosis for those with 18q deletions in colorectal cancer noted a reduction in
long-term survival predominantly in node-negative (stage II) tumours.(46) Chromosomal instability,
CIN is the most common abnormality in colorectal cancer, however approximately 15% of sporadic
colorectal cancers show microsatellite instability, MSI as a result of a functional mis-match repair
Protein expression in colorectal cancer EM Tweedle
155
defect (commonly as a result of promoter methylation of the hMSH2, hMLH1, hPMS1 or hPMS2
genes).(71) These tumours generally have a characteristic pattern of increased stromal
inflammatory response and better prognosis than similar tumours displaying chromosomal
instability.(233, 234)
My results in laser-captured colorectal cancer tissue suggest there is low level over-expression of
S100A8 in colorectal cancer tissue compared to normal colonic epithelium in all tumours analysed,
however, over-expression was more pronounced in the polypoid tumour group (Figure 3.11). Our
group has previously identified the proteins S100A8 and S100A9 as abundant in tumour-associated
stroma of pancreatic ductal adenocarcinoma on 2D gel analysis. Immunohistochemical validation of
the findings revealed that the numbers of S100A8 and S100A9-expressing cells in the tumour
stroma were related to the Smad4 status of the tumour. Comparison was made between my n=11
2D gels of laser-captured colorectal tumours and n=12 gels of undissected Duke’s C colorectal
cancer produced in the Division of Surgery and Oncology (work by Mr I Khattack) in which S100A8
was also identified as differentially expressed. S100A8 was more strongly and variably expressed in
the n=12 gels containing tumour plus associated stroma; we postulated therefore that the majority
of S100A8 was expressed in the stroma. We undertook immunohistochemical staining for S100A8,
S100A9 and Smad4 using our pre-existing protocol in n=313 paraffin-embedded colorectal cancer
cases in order to assess expression of these proteins in both tumour and stromal tissue.

Protein expression in colorectal cancer EM Tweedle
156
3.8.2 DISTRIBUTION OF S100A8 AND S100A9 AT IMMUNOHISTOCHEMISTRY
As expected, normal colonic epithelium did not stain positive for either S100A8 or S100A9. There
was universal expression of S100A8 in the cytoplasm of colorectal cancer cells which show low to
moderate staining in all cases (intensity score 1-2). Differences in the S100A8 levels detected in
laser-captured tumour tissue may have been due to the variable presence of inflammatory infiltrate
within tumour glands (rather than stroma) in these cases. S100A9 was not expressed at a
detectable level in cancer cells which corresponds with the pattern of protein expression seen on
2D gel analysis. Similar stroma staining was seen in both colorectal and pancreatic ductal
adenocarcinomas with cells strongly positive for S100A8 and S100A9 scattered throughout the
tumour stroma (Figure 3.27A-D). Co-immunofluorescence was undertaken in colorectal cancer
sections to delineate the nature of these positive stromal cells. Co-immunofluorescence indicated
extensive co-localization of S100A8 and S100A9 in stromal cells (Figure 3.28A). Furthermore, co-
localization of S100A9 was observed in some cells with the monocyte marker CD14 (Figure 3.28B)
but not the macrophage marker CD68 (Figure 3.28C).These images suggest that a population of
tumour-associated monocytes co-express S100A8 and S100A9, but these proteins are not
expressed in tissue-associated macrophages.

Protein expression in colorectal cancer EM Tweedle
157
Figure 3.27: Immunohistochemistry in paraffin-embedded colorectal cancer tissue. T=tumour, S=stroma. A:
Tumour stained for S100A8 showing low expression in tumour cytoplasm but no S100A8 positive stroma
cells. B: Tumour showing higher numbers of S100A8-positive stromal cells in addition to several intra-tumour
inflammatory cells (arrowed). C: S100A9 staining confirming no expression in tumour cells and low numbers
of positive stromal cells. D: High numbers of S100A9 positive stromal cells. E: Tumour stained for Smad4
showing loss of expression. F: Tumour showing Smad4 expression in cytoplasm. 33

Protein expression in colorectal cancer EM Tweedle
158
Figure 3.28 Co-immunofluorescence. S100A9 labelled with red fluorescence, DAPI used as nuclear
counterstain (blue). (i) Co-localisation between red/green fluorescence plus blue nuclear
counterstaining. (ii) Red fluorescence alone in same tissue section. (iii) Green fluorescence alone in
same tissue section. A(i-iii): S100A8 labelled with green fluorescence and shows co-expression in
the same S100A9-positive stromal cells. B(i-iii): CD68 labelled with green fluorescence showing no
co-localization between CD68+ macrophages and S100A9+ cells. C(i-iii): CD14 labelled with green
fluorescence showing co-expression of S100A9 in CD14+ monocytes.34

Protein expression in colorectal cancer EM Tweedle
159
3.8.3 QUANTIFICATION OF S100A8, S100A9 AND SMAD4 EXPRESSION
The S100A8 and S100A9 positive cells present in each tumour on the colorectal microarray were
quantified by counting the number of stained cells in a field at 40x magnification. Tumour cores on
the microarrays were visualized in entirety in one field at 40x magnification making the cell count
per field equivalent to the cell count per core. The mean number of positively stained S100A8 and
S100A9 cells was calculated by averaging the number of positive stromal cells across all the tumour
cores scored for each patient. The number of S100A8-positive or S100A9-positive cells in each of
313 patient tumors (mean of at least 2 TMA cores per tumor case) was determined. Numbers
ranged from 0 (4.5% of cases) to 288, and from 0 (0.65% of cases) to 882 for S100A8 and S100A9
respectively. The median number of stromal S100A8-expressing cells was 23 (IQR 6-70), while the
median number of stromal S100A9-expressing cells was 65 (IQR 27-126) with 284/308 (92%)
tumors showing more S100A9 than S100A8-expressing cells in the stroma. Although tumors
generally contained fewer S100A8-positive than S100A9-positive cells (P<0.0001, Wilcoxon Signed
Rank Test), there was a strong positive relationship between S100A8 and S100A9 counts (n=302
independent tumor cases; R2=0.76, P<0.0001). This is entirely consistent with our observation that
S100A8 co-localized with S100A9. The median S100A9/S100A8 ratio was 2.2 (IQR 1.3-4.4). To
examine whether a relationship existed between the numbers of stromal S100A8-positive or
S100A9-positive cells and the Smad4 tumor status, the expression of Smad4 protein was
determined by immunohistochemistry (Figure 3.27E-F). Forty-two of 304 patients (14%) were
categorized as Smad4-negative based on mean cytoplasmic intensity scores of ≤ 0.5. The remaining
262/304 (86%) were categorized as Smad4 positive.

Protein expression in colorectal cancer EM Tweedle
160
3.8.4 LOSS OF SMAD4 EXPRESSION IS RELATED TO STROMAL LEVELS OF S100A8
We found that loss of Smad4 expression in the primary tumour was associated with significantly
lower median counts of S100A8-positive monocytes in the stroma; 14 (IQR 5-37) in Smad4-negative
group compared to 25 (IQR 6-76) in the Smad4-positive group, P=0.036, Mann-Whitney U Test,
(figure 3.29C). A Receiver Operating Characteristic, ROC curve was constructed to establish
whether stromal S100A8 counts were predictive of Smad4 expression in the tumour, and was found
to be conclusive with a threshold of <42 S100A8+ cells, (Area Under the Curve, AUC=0.602,
P=0.024), figure 3.29D. There was no difference in the S100A9-positive count between Smad4
negative and positive tumours, 48 (IQR 23-96) versus 65 (IQR 27-129), P=0.266, Mann-Whitney U
Test, figure 3.29E. The ROC curve constructed to establish whether stromal S100A9 counts were
predictive of Smad4 expression in the tumour showed no significant relationship between the two
factors, (AUC=0.554, P=0.250), figure 3.29F. The S100A8 and S100A9-positive cell counts were
divided into two groups; S100A8 was divided by the predicted threshold for prediction of Smad4
status (<42 cells versus ≥42 cells) and S100A9 was divided by the median count (≤65 cells versus
>65 cells) as the ROC curve did not predict a significant threshold point. Low numbers of S100A8-
positive cells, but not S100A9-positive cells are linked to loss of Smad4 expression in the primary
tumour, P=0.015, Fisher’s exact test, (Table 3.8).
SMAD4 staining
Cases with S100A8 scoring,
n=300 (%)
No of S100A8 +ve cells p-value Cases with S100A9 scoring,
n=298 (%)
No of S100A9 +ve cells p-value Low <42 (%),
n=190 High ≥42
(%), n=110 Low <52
(%), n=127 High ≥52
(%), n=171
0.015
0.094 Negative , n=42 41 (14) 33 (17) 8 (7) 42 (14) 23 (18) 19 (11)
Positive, n=262 259 (86) 157 (83) 102 (93) 256 (86) 104 (82) 152 (89)
Table 3.8: Correlation between Smad4 expression in the tumour and S100A8 and S100A9+ cells in the
stroma24

Protein expression in colorectal cancer EM Tweedle
161
Figure 3.29: correlation between stromal S100A8 and S100A9 and Smad4 in the tumour. A: Correlation
between number of stromal S100A8 and S100A9+ cells in the same tumour, B: comparison of S100A8 and
S100A9+ stromal cells, C: numbers of S100A8+ cells in relation to Smad4 status of tumour, D: Roc curves to
predict Smad4 expression using S100A8+ cell counts, E: numbers of S100A9+ cells in relation to Smad4 status
of tumour, D: Roc curves to predict Smad4 expression using S100A9+ cell counts 35

Protein expression in colorectal cancer EM Tweedle
162
3.8.5 RELATIONSHIP OF SMAD4 TUMOUR EXPRESSION AND S100A8 AND S100A9 STROMAL
EXPRESSION WITH CLINICOPATHOLOGICAL PARAMETERS
We aimed to establish whether a relationship existed between the various tumour and stromal
proteins identified on the tissue microarray and the clinical and histological parameters of those
tumours, Table 3.9. Patients were categorized as having mean S100A8-positive cell counts that
were low (≤median of 23), n=156 or high (>23), n=153. Similarly, for S100A9, patients were
categorized as having low (≤median of 65), n=159 or high (>65), n=147 cell counts. Smad4
expression was categorised as negative (≤0.5 mean score, n=42) and positive (>0.5 mean score,
n=262). No correlation was demonstrated between degree of stromal S100A8 and S100A9
infiltration with age at surgery, gender, site of tumour, depth of tumour invasion or nodal
metastases (Table 3.9). However, high cell S100A8 and S100A9 counts were associated with larger
tumour size (P=0.01 and 0.0006 respectively; chi-squared test). High S100A9 counts were
associated with poor differentiation grade, P=0.036, (Table 3.9, chi-squared test). Smad4-negative
tumours were significantly associated with greater depth of tumour infiltration than Smad4 positive
tumours; P=0.022, (Table 3.10, Chi-squared test). Loss of Smad4 expression was more frequent in
rectal tumours compared to colonic tumours, 55% versus 37%, P=0.027, (Table 3.10, Chi-squared
test). No relationship between Smad4 expression and differentiation grade, size of tumour or
presence of nodal metastases was established in our patient cohort (Table 3.10).

Protein expression in colorectal cancer EM Tweedle
163
Table 3.9: Clinicopathological characteristics and correlation with S100A8+ and S100A9+ cell
infiltrates in the stroma. S100A8 and S100A9 cell counts were dichotomized by median counts and
analysed according to clinical and pathological variables. Statistical analysis was performed using
chi-squared test. 25
Clinicopathological parameter
All cases,
n=313 (%)
S100A8 +ve cells, n=309 p value*
S100A9 +ve cells, n=306 p value*
Low ≤23 cells (%), n=156
High >23 cells (%), n=153
Low ≤65 cells (%), n=159
High >65 cells (%), n=147
Age 70 (IQR 62-76 years)
Young (<median) 155 (49) 75 (48) 80 (52) 0.459 75 (47) 78 (53) 0.303
Old (> median) 158 (51) 81 (52) 73 (48) 84 (53) 69 (47)
Gender
Male 188 (60) 93 (60) 92 (60) 0.926 97 (61) 85 (58) 0.570
Female 125 (40) 63 (40) 61 (40) 62 (39) 62 (42)
Site of tumour
Colon 188 (60) 89 (57) 96 (63) 0.307 94 (59) 90 (61) 0.707
Rectum 125 (40) 67 (43) 57 (47) 65 (41) 57 (39)
Size 50 (IQR 38-60mm)
Small-Medium (<60mm) 214 (69) 116 (74) 94 (61) 0.014 123 (77) 87 (59) 0.0006
Large (≥60mm) 99 (31) 40 (26) 59 (39) 36 (23) 60 (41)
Differentiation grade
Well 5 (2) 2 (1) 2 (1) 0.819 2 (1) 3 (2) 0.036
Moderate 283 (90) 140 (90) 140 (92) 150 (94) 127 (86)
Poor 21 (7) 12 (8) 9 (6) 5 (4) 15 (11)
Uncategorised 4 (1) 2 (1) 2 (1) 2 (1) 2 (1)
Excision Margin
Clear 270 (86) 130 (83) 138 (90) 0.055 134 (84) 130 (88) 0.199
Involved 39 (13) 25 (16) 12 (8) 24 (15) 14 (10)
Uncategorised 4 (1) 1 (1) 3 (2) 1 (1) 3 (2)
T-stage
T1 13 (4) 8 (5) 5 (3) 0.766 8 (5) 5 (3) 0.356
T2 47 (15) 22 (14) 25 (16) 21 (13) 24 (16)
T3 206 (66) 104 (67) 101 (66) 110 (69) 92 (63)
T4 44 (14) 19 (12) 22 (15) 18 (12) 25 (17)
Uncategorised 3 (1) 3 (2) 0 2 (1) 1 (1)
N-stage
N0 177 (56) 82 (53) 93 (61) 0.446 90 (57) 82 (56) 0.332
N1 71 (23) 38 (24) 32 (21) 40 (25) 30 (20)
N2 62 (20) 33 (21) 28 (18) 27 (17) 34 (23)
Uncategorised 3 (1) 3 (2) 0 2 (1) 1 (1)

Protein expression in colorectal cancer EM Tweedle
164
Table 3.10: Association between Smad4 status and clinicopathological parameters. Tumours were
dichotomized by Smad4 expression into negative and positive tumours and compared to clinical and
pathological tumour features. Chi-squared test used for statistical analysis. 26
Clinicopathological parameter
All cases,
n = 303 (%)
SMAD4 status p value
Negative (%), n=42 Positive (%), n=261
Age (median 70, ranged 33-93)
Young (<median) 148 (49) 23 (55) 125 (48) 0.409
Old (≥ median) 155 (51) 19 (45) 136 (52)
Gender
Male 183 (60) 26 (62) 157 (60) 0.829
Female 120 (40) 16 (38) 104 (40)
Site of tumor
Colon 184 (61) 19 (45) 165 (63) 0.027
Rectum 119 (39) 23 (55) 96 (37)
Size 50 (IQR 38-60mm)
Small (<38mm) 72 (24) 9 (21) 63 (24) 0.863
Medium (38-59mm) 133 (44) 20 (48) 113 (43)
Large (≥60mm) 98 (32) 13 (31) 85 (33)
Differentiation grade
Well 5 (2) 1 (3) 4 (1) 0.848
Moderate 273 (90) 38 (90) 235 (90)
Poor 21 (7) 3 (7) 18 (8)
Uncategorized 4 (1) 0 4 (1)
Excision Margin
Clear 262 (87) 36 (86) 226 (86) 0.848
Involved 37 (12) 5 (12) 32 (13)
Uncategorized 4 (1) 1 (2) 3 (1)
pT
T1 13 (4) 1 (2) 12 (5) 0.022
T2 43 (14) 4 (10) 39 (15)
T3 203 (67) 25 (59) 178 (68)
T4 41 (14) 12 (29) 29 (11)
Uncategorized 3 (1) 0 3 (1)
pN
N0 171 (56) 22 (52) 149 (57) 0.547
N1 70 (23) 13 (31) 57 (22)
N2 59 (20) 7 (17) 52 (20)
Uncategorized 3 (1) 0 3 (1)
Stage (AJCC)
I 37 (12) 4 (9.5) 33 (13) 0.697
II 133 (44) 18 (42.9) 115 (44)
III 128 (42) 20 (47.6) 108 (41)
Uncategorized 5 (2) 0 5 (2)

Protein expression in colorectal cancer EM Tweedle
165
3.8.6 ASSOCIATION BETWEEN NUMBERS OF STROMAL S100A8 AND S100A9-POSITIVE CELLS AND
CANCER-SPECIFIC SURVIVAL
Following the confirmation of an association between stromal S100A8 and S100A9 and tumour size,
we endeavored to determine whether a relationship existed between these proteins and overall
patient survival. Kaplan-Meier curves were constructed of overall 96-month survival for n=302
patients according to stromal S100A8 expression and n=299 according to stromal S100A9
expression. For the purpose of analysis, patients were catagorised as having high or low S100A8
and S100A9 counts based on the median cell count (≤23 versus >23 cells S100A8, ≤65 versus >65
cells S100A9). No survival difference was observed for either protein (Figure 3.30A(i/ii). On analysis
of patients with loss of Smad4 expression in the primary tumour (n=38), high S100A8 counts were
associated with poorer survival at 36 months, (76% versus 39%, p=0.02 Mantel-Cox), but not at 96
months (P=0.29, Mantel-Cox), figure 3.30B(i). A similar pattern was seen for S100A9 counts, high
S100A9 in the stroma corresponded with poor early survival (73% versus 41% P=0.02, Mantel-Cox)
but no difference was seen in the long term (P=0.36, Mantel-Cox), Figure 3.30B(ii). In patients with
Smad4 positive tumours, neither S100A8 nor S100A9 counts in the stroma appeared to predict
overall short, or long-term survival, (P=0.37 and P=0.80 respectively), Figure 3.30C(i/ii).

Protein expression in colorectal cancer EM Tweedle
166
Figure 3.30: Cancer specific survival according to stromal S100A8 and S100A9+ cells. Kaplan-Meier curves
with p-values (Mantel-Cox). A: Survival according to stromal S100A8+ cells (i) and S100A9+ cells (ii). B: Smad4
negative tumours; survival according to S1008+ cells (i) and S100A9+ cells (ii), C: Smad4 positive tumours;
survival according to S1008+ cells (i) and S100A9+ cells (ii). 36

Protein expression in colorectal cancer EM Tweedle
167
3.8.7 LOSS OF SMAD4 EXPRESSION PREDICTS FOR POOR SURVIVAL IN SOME PATIENT GROUPS
Loss of Smad4 expression has been mooted as a poor prognostic marker in colorectal cancer, we
planned to establish whether this was the case in our cohort of patients. Kaplan-Meier curves were
constructed to assess the impact of Smad4 on overall survival in colorectal cancer. Survival analyses
were performed on 259 patients after excluding 37 patients with non-curative tumor resections
(positive tumor resection margins) and 7 patients who died within 30 days of surgery. Patients with
node-negative tumors had significantly better survival compared to those with node-positive
tumors (P<0.0001, Figure 3.31A). Smad4 loss was not associated with survival (P=0.09) when the
entire cohort of 259 patients was examined (Figure 3.31B). However, when the node-negative
(Stage I and Stage II) and node-positive (Stage III) cancer patients were analyzed separately, it was
observed that patients in the node-negative cancer group who had lost Smad4 expression had
poorer survival compared to patients in that group who had retained Smad4 expression (n=156;
P=0.019, Figure 3.31C). In fact, the survival of patients with node-negative tumors who had lost
Smad4 expression was similar to that of patients with nodal metastases (P=0.542, Figure 3.31D).
There was no association between Smad4 expression and survival in the node-positive cancer
group (n=103; P=0.925, Figure 3.31E).

Protein expression in colorectal cancer EM Tweedle
168
Figure 3.31: Association between Smad4 status and cancer-specific survival. Kaplan-Meier curves
with p-values (Mantel-Cox). A: Nodal status, B: Smad4 expression, C: N0 tumours; survival
according to Smad4 status, D: N+ tumours; survival according to Smad4 status, E: N0, Smad4
negative tumors versus all N+ tumours 37

Protein expression in colorectal cancer EM Tweedle
169
4. DISCUSSION
The key findings of this MD are summarized as follows:
1. Laser-capture microdissection of frozen colorectal tissue was successfully performed and
sufficient material generated to produce 19 good quality (10 tumour and 9 normal epithelium),
silver-stained 2D gels using SDS-PAGE.
2. 2D gels were analysed for variations in protein spot pattern between tumours of different
morphologies; depressed-type, flat-type and polypoid-type. Six proteins were successfully
identified using in-gel trypsin digestion and tandem mass spectrometry; these were redox
proteins peroxiredoxin 2, peroxiredoxin 6 and SH3 binding glutamic acid-rich protein-like 3; and
cytoskeletal protein cofilin1. Also identified were the anti-apoptotic protein heat shock protein
27 and inflammatory protein S100A8, which had been previously identified in 2D gel analysis of
undissected colorectal cancer in our Institution (n=12 gels).
3. Heat shock protein 27 expression was evaluated in a large cohort of n=404 paraffin-embedded
colorectal cancer tissue, including n=98 samples previously validated in a small cohort of
paraffin-embedded colorectal cancers in our Institution. High HSP27 levels were strongly
associated with poor cancer-specific survival in rectal cancer (n=205, P=0.0063) but not colon
cancer; (n=199, P=0.7385). Multivariate Cox regression confirmed nodal metastases (P=0.0001)
and HSP27 expression (P=0.0233) as independent markers of survival in rectal cancer.

Protein expression in colorectal cancer EM Tweedle
170
4. S100A8 and related proteins S100A9 and Smad4 were similarly evaluated in a large cohort
(n=313). S100A8 expression co-localised with a subset of S100A9-positive monocytes. S100A9
was co-expressed with CD14 in tumour-associated monocytes, but not with CD68 in tissue
macrophages. Smad4 was expressed in the tumour cytoplasm of 262/304 (14%) tumours. Loss
of Smad4 expression correlated with a reduction in the stromal S100A8-positive, but not
S100A9-positive cell count, (P=0.034, Mann-Whitney U test) and was associated with a poorer
overall survival in patients with stage I-II disease, but not stage III disease.
5. Antibodies to cofilin1 and cofilin-phospho(ser3) were assessed in colorectal cancer cell and
tissue lysate and found to be specific on 1D and 2D western blot. Cofilin antibody did not show
sufficient variability of staining when used for immunohistochemistry in colorectal cancer tissue
to be useful for accurately assessing and scoring expression of the cofilin protein.
Further discussion of these findings is detailed in the following sections.
4.1 PROTEINS IDENTIFIED USING LASER CAPTURE AND 2D GEL ANALYSIS
Laser-capture microdissection and 2D gel electrophoresis for proteomic analysis was first described
in 1999.(319) Numerous groups have successfully combined laser capture with 2D SDS-PAGE,(239,
320-324) DNA analysis,(325-329) and mRNA analysis.(330, 331) The advantage of this methodology
is that it allows specific selection of cell populations from human colorectal cancers in situ, without
resorting to cell line culture. Normal colonic epithelium, not amenable to culture as a cell line, can
be also analysed using this technique.(188, 332) Our results confirm that laser capture

Protein expression in colorectal cancer EM Tweedle
171
microdissection and 2D gel proteomic analysis is feasible in frozen colorectal adenocarcinoma and
benign colonic epithelium. The gels produced are readily amenable to interpretation visually and
electronically to highlight differentially-expressed protein spots, and in this study the technique led
to the identification of proteins that appear to be variably expressed both between different
morphologies of colorectal cancer and between cancer tissue and benign epithelial tissue. A recent
meta-analysis of proteomic analysis in colorectal cancer tissue found 98 proteins reported as
variably regulated in more than one study. They included high abundance proteins (serum albumin,
HLA class I and kerritin type II cytoskeletal 8); cytoskeletal proteins (annexin A5, A4, A3 and A1,
tropomyosin beta chain, actin, coronin 1C, ezrin, vimentin and gelsolin); inflammatory proteins
(S100A9, macrophage capping protein, leukocyte elastase inhibitor); redox proteins
(peroxiredoxin1, glyceraldehydes-3-phosphate dehydrogenase, glutathione s-transferase P,
thiosulfate sulfurtransferase); cellular stress proteins (heat shock protein beta1, heat shock protein
75, endoplasmin, heat shock protein 90); synthesis/degradation proteins (elongation factor 2,
apolipoprotein A1, UDP-glucose dehydrogenase, serpin B6, eukaryotic initiation factor 4A); cell to
cell interaction proteins (thrombospondin 1, lamin-B1).(332)
4.2 HEAT SHOCK PROTEIN 27
We report the identification of the low molecular weight heat shock protein, HSP27 as differentially
expressed in colorectal cancer using proteomic techniques. It is interesting to note that HSP27 has
been reported as over-expressed in approximately 30% of 2DE proteomic studies.(333) It is

Protein expression in colorectal cancer EM Tweedle
172
consistently identified in investigative proteomic studies of colorectal cancer, both tissue and cell
lines.(334, 335) Despite promising initial reports, this study was the first to undertake validation of
the expression of this protein on a large scale in adenocarcinoma of the colon and rectum.
Tissue microarrays are a powerful tool for high-throughput evaluation of putative biomarkers,
although concerns have been raised that lack of tumour heterogeneity could cause misleading
results. Several studies have addressed this issue and reported the concordance between TMA and
tumour sections when assessing one core is in the region of 80% and this increases to 95% when
two cores are included.(336) Our TMAs were constructed using 2-6 cores per tumour and care was
taken to include benign liver, kidney and colon tissue as internal control. Immunohistochemistry
detection of HSP27 has been previously reported in formalin-fixed colorectal cancer using a variety
of antibodies and scoring protocols. The findings have thus far been inconclusive; one group
reported a strong relationship between HSP27 expression in the primary tumour and nodal status
in n=40 patients,(334) whilst a second group found no such association in n=68 patients.(337) We
devised a reproducible method of grading intensity of HSP27 staining by direct comparison to
internal TMA control tissue (colon, liver and kidney); in addition to scoring the percentage
expression in each core. In our cohort of n=404 patients we observed no correlation between any
aspect of HSP27 staining in the primary tumour, (intensity, percentage or combined score) with
histopathological features including nodal status. As we proceeded to analyse the association
between aspects of HSP27 expression and overall survival we found the intensity rather than
percentage staining to be prognostic, however an index which combined both the intensity and
percentage scores was most strongly associated with survival.

Protein expression in colorectal cancer EM Tweedle
173
We report the novel finding that high HSP27 expression is an independent marker of poor
prognosis in patients with rectal cancer, but not colon cancer. This adds to accumulating evidence
that rectal and colon tumours are distinct biologically entities and have a different pattern of
genetic mutations.(338) The link between HSP27 expression and survival has been investigated in a
multitude of human cancers.(271) Poor overall- and cancer-specific survival has been linked to
elevated HSP27 expression in prostate cancer; it also correlates with various histological
parameters including Gleason score and lymph node metastases.(244, 339, 340) Despite initial
promising reports in breast cancer,(341) larger studies of node-positive and negative patients failed
to demonstrate a difference in overall or cancer specific survival according to HSP27
expression.(342, 343) Numerous other small studies have identified high HSP27 as poorly-
prognostic in ovarian cancer,(344) gastric cancer(345) and hepatocellular cancer.(346) We observed
elevated HSP27 as predictive of lower five-year cancer-specific survival across all stages of rectal
cancer, however there was a stronger association with stage III compared to stage I/II disease.
However, utilising elevated HSP27 as a biomarker, we defined a poor prognostic group of stage II
patients with a similar survival to that of stage III patients. This may be an area in which further
work could aid clinical decision making in the management of this patient group. HSP27 expression
was independently associated with survival in rectal cancer patients on multivariate analysis. We
were interested to note that age and resection margin status, approached, but did not reach
significance which was contrary to our expectations. We felt this reflects the lack of standardised
pathological reporting of rectal cancer in our institution. The introduction of standard surgery in the
form of total mesorectal excision (TME) and guidelines on the minimum pathological dataset were
introduced in 1999.

Protein expression in colorectal cancer EM Tweedle
174
We report the novel findings that radiotherapy treatment does not alter the expression of HSP27
between diagnosis and surgical resection of a rectal tumour. Variation, both up and down
regulation, was observed in 19% of diagnostic biopsies compared to the primary tumour. This may
reflect the small, superficial nature of some of the biopsy material or could be indicative of tumour
biology. Our findings concord with the only published prospective study of HSP27 expression in
relation to radiotherapy treatment of rectal cancer, which reported no consistent change in HSP27
expression identified after radiotherapy was administered.(347) We conclude that there is no
evidence to suggest that radiotherapy treatment induces HSP27 expression in rectal cancer.
The mechanism by which HSP27 exerts its effects on survival in cancer is not fully understood.
HSP27 may confer a gain of function for the tumour cell in terms of motility and invasion or
increase tumour cell survival by inhibition of apoptosis and resistance to anti-cancer treatments.
There is emerging in vitro evidence that HSP27 can promote motility and increase cancer cell
invasion, in part by promoting secretion of metalloproteinase MMP2.(348) This is mediated by the
TGFβ/p38 mitogen-activated protein kinase pathway, implying a role for the phosphorylated
isoform of HSP27 in this phenomenon.(349) HSP27 has been associated with inhibition of NF
kappaB in hepatocellular carcinoma cells. Knockdown of HSP27 in these cells resulted in increased
concentrations of NF kappaB in the nucleus, suppressed cell migration and invasion and induced
apoptosis.(350) Reducing the expression of HSP27 by siRNA interference has demonstrated an
increase in apoptosis and cell death via capase-3 in prostate cancer cell lines.(351) A similar study
conducted using human bladder cancer cells in murine models demonstrated that HSP27
knockdown resulted in reduced tumour growth and enhanced sensitivity to chemotherapy.(352)

Protein expression in colorectal cancer EM Tweedle
175
The role of HSP27 in chemoresistance has been intensely studied and the protein has been
implicated in 5-fluorouracil and irinotecan resistance in colorectal cancer(353-355) and more
recently, pancreatic cancer.(321) Of particular interest in rectal cancer, as with prostate and
bladder cancer is the role that HSP27 plays in resistance to radiotherapy; indeed there is in vitro
evidence that HSP27 confers resistance to gamma-radiation in human cancer cell lines.(356)
Combined treatment using anti-sense oligonucleotides against HSP27 and radiotherapy in mice
with SQ20B radioresistant head and neck squamous cell carcinomas resulted in tumour shrinkage,
reduced angiogenesis and increased survival.(357) Further work is required to establish a link
between HSP27 expression, resistance to radiotherapy treatment and prognosis in rectal
adenocarcinoma.
To conclude, elevated HSP27 is an independent marker of poor prognosis in rectal cancer.
Expression of the protein is not altered by neo-adjuvant radiotherapy and further work is necessary
to determine whether HSP27 has a role to play in resistance to adjuvant radiotherapy and
chemotherapy in vivo.
4.3 COFILIN1
In this study an isoform of cofilin1 was identified as potentially differentially expressed on 2D gel
analysis of laser-captured frozen colorectal cancer tissue and benign colonic epithelium. The
colorectal cancers formed three distinct morphological groups, flat, depressed and polypoid types.

Protein expression in colorectal cancer EM Tweedle
176
The protein spot identified appeared to be maximally expressed in polypoid tumours, with
correspondingly lower levels in the matched benign tissue. In the flat and depressed tumours the
level of the protein was lower than polypoid tumours, with correspondingly higher expression in
the matched benign tissue. The small numbers of tumours utilised in this stage of the analysis led
us to investigate the protein expression further using colorectal cancer cell lines and tissue. We
undertook preliminary investigations of two commercially available antibodies to cofilin1 and its
physiologically inactive isoform cofilin-phospho(ser3) in protein lysate and paraffin-embedded
tissue in order to confirm the identity of the protein spot and assess specificity prior to validation.
Using 1D western blotting we established both anti-cofilin1 and anti-cofilin-phospho(ser3)
antibodies to be specific for a protein band of the appropriate molecular weight in colorectal cancer
cell lysate and whole cancer tissue lysate. Cofilin-phospho(ser3) was variably expressed whereas
cofilin1 had a similar expression levels between cell lines. 2D western blot analysis in whole tumour
lysate and colorectal cancer cell lysate confirmed the protein spot of interest to be cofilin-
phospho(ser3).
Immunohistochemistry for cofilin1 was performed using the same antibody in paraffin-embedded
benign and malignant colorectal tissue to assess distribution of staining. We found cofilin1 to be
expressed strongly in smooth muscle and endothelium in addition to normal colonic epithelium
(particularly cells at the neck of crypts). Variation could be detected in the level of staining between
tumours after staining of n=10 tumour sections and n=9 benign sections from the same tumour
material subject to 2D analysis. This is consistent with data from the only paper reporting cofilin1
immunohistochemistry in tumour tissue which found variable expression in n=34 gastrointestinal

Protein expression in colorectal cancer EM Tweedle
177
endocrine tumours.(304) Unfortunately, on increasing the numbers of colorectal adenocarcinomas
stained to n=313, the results showed poor consistency of staining between cores from the same
tumour and insufficient variation in staining between tumours for cofilin1 to be of value as a
prognostic marker. Further cofilin1 staining was therefore abandoned in favour of the more
variably-expressed cofilin-phospho(ser3), although evaluation is not yet complete. Accurate
assessment of phosphorylated proteins is notoriously difficult due to 1. Lack of antibody affinity and
2. Degradation of phosphorylated proteins during tissue fixation. One paper reported that levels of
phospho-proteins were unreliable in formalin-fixed tissue specimens larger than 2cm3 due to time-
dependent de-phosphorylation of proteins following devascularization.(358, 359) Assessment of a
large number of tumours is vital in order to obtain reproducible results.
4.4 S100A8
We have previously demonstrated that the calcium-binding proteins S100A8 and S100A9 are
expressed in tumour-associated monocytes in pancreatic cancer stroma in differing quantities.(59)
A number of other studies have used similar proteomic techniques to detect the differential
expression of the S100 group of proteins in cancer material, including pancreas,(59, 360)
breast,(361) prostate,(362) bladder (363) and colorectal.(364) In this study S100A8 was found
expressed at higher levels in colorectal cancer tissue compared to benign epithelial tissue on 2DE
gel analysis. Verification of our findings using immunohistochemistry demonstrated low-level
expression of S100A8, but not S100A9 in all colorectal cancer tissue. The tumour stroma was found

Protein expression in colorectal cancer EM Tweedle
178
to contain variable numbers of S100A8 and S100A9-positive infiltrating cells. Co-
immunofluorescence indicated that S100A8 is expressed in a subset of S100A9 positive cells which
is consistent with our finding that tumours contained greater numbers of S100A9- than S100A8-
positive cells. S100A8 and S100A9 are reported to be expressed in circulating granulocytes and pro-
inflammatory monocytes but not in tissue resident macrophages.(365, 366) They promote
phagocyte migration by enhancing the polymerisation of microtubules and S100A8/S100A9
heterodimers (also known as calprotectin) are believed to recruit further monocytes to sites of
inflammation. The expression and secretion of these proteins in the tumour microenvironment is
likely to contribute to the host inflammatory response to the tumour.(367) Given that S100A9
positive cells did not co-express CD68, a marker of mature macrophages, but did co-localise with
CD14, a monocyte marker, the cells we have observed are likely to represent tumour-associated
monocytes or immature macrophages, which are characterised by a lack of or low expression of
differentiation-associated macrophage antigens (reviewed in Lewis et al.(316)).
There has been a great deal of work on the influence of tumour-associated macrophages, (TAMs) in
the stroma of colorectal cancer patients. Evidence suggests there is a spectrum of macrophage
phenotypes in the tumour environment ranging from M1, which co-operate with T-cell and
dendritic cells and have potent anti-tumour cytotoxic capacity; to M2, which promote stromal
remodelling, angiogenesis and have immumnosuppressive capabilities.(368) Certainly, a dense
CD86+ macrophage infiltrate around the tumour margin is associated with a good prognosis in
colorectal cancer,(369, 370) conversely high intra-tumoural macrophages, (TAMs) have been found
shown to predict for poor survival.(314) Less is known about the recruitment of monocytes from

Protein expression in colorectal cancer EM Tweedle
179
the circulation into the tumour-associated stroma, the differentiation of these cells or the
prognostic significance of such infiltrates. One recent report centred on the discovery of a subset of
Tie2+ monocytes in the circulation which were attracted to the tumour both by hypoxia, and the
expression of the receptor Angiopoietin-2 of the surface of the cancer cells.(371) These monocytes,
on recruitment, were associated with areas of angiogenesis and high TAM infiltration within the
stroma. We found that in this study, large colorectal tumours (≥60mm) were coupled with a
profound increase in the S100A8 and particularly S100A9-positive cell counts in the stroma. This
may indicate a role for these cells in supporting stromal vascularisation and tumour growth. In
common with other studies and our own findings in pancreatic adenocarcinoma,(59, 372) we did
not observe any differences in overall survival associated with the numbers of infiltrating S100A8 or
S100A9-positive monocytes in the stroma in colorectal cancer patients .
Loss of Smad4 expression is observed in 10-15% of colorectal cancers and is reported to be a
relatively late event in cancer development. We have ascertained the loss of Smad4 expression in
42/304 (14%) cases overall, which is consistent with previous reports.(58, 373) In our patient group
we found no difference in the Smad4 expression according to the presence of lymph node
metastases, but there was a relationship between loss of Smad4 and depth of tumour invasion. This
is in contrast to a number of other studies which have observed that loss of Smad4 expression
occurs with increasing frequency in tumours which have metastased to nodes or distant
organs.(374-376) There is also conflicting evidence for the use of Smad4 as a prognostic marker in
colorectal cancer, however most papers report poor prognosis in association with loss of Smad4
expression or deletion of 18q.(58, 373, 377) There has been recognition that loss of Smad4

Protein expression in colorectal cancer EM Tweedle
180
expression is poorly-prognostic in earlier stage colorectal tumours in some studies.(60, 378) We
found that loss of cytoplasmic Smad4 expression does predict poor survival in those patients with
node-negative disease, whereas in those with node-positive disease there was no detectable
difference.
Smad4 is an intracellular mediator of TGF- signalling. While TGF- functions as a tumour
suppressor in early stages of carcinogenesis by potently inhibiting cell growth, cancer cells
characteristically acquire resistance to this growth inhibition and frequently secrete high levels of
TGF- at later stages.(52) There is mounting evidence to suggest that loss of Smad4 expression and
resistance to TGF- are separate and unrelated events in carcinogenesis.(379) Re-introduction of
Smad4 expression into Smad4-negative colorectal cancer cells did not restore TGF- mediated
growth inhibition, or impede proliferation of tumour cells in vitro. However, these clones showed a
marked restriction of tumour growth in vivo in nude mice which was related to a reduction in
angiogenesis. Smad4-negative clones were found to produce 2-3 fold more of the cytokine Vascular
Endothelial Growth Factor, VEGF than clones which re-expressed Smad4.(380) A recent study has
shown that knock-down of Smad4 rendered cancer cells resistant to TGF- induced cell cycle arrest
and migration but not to TGF- induced epithelial-mesenchymal transition.(381) This indicates that
cancers cells which have lost Smad4 expression respond differently to stimulation from exogenous
cytokines such as TGF- and this may be associated with a fundamental change in the behaviour
and secretion profile of these cells.
Consistent with a recent report in primary pancreatic adenocarcinoma; in this study we observe the
same association in colorectal cancer.(59) There are few reports to date of direct relationships

Protein expression in colorectal cancer EM Tweedle
181
between the genetic status of tumour cells and the expression patterns of surrounding host cells.
Our data thus provide important evidence of a direct relationship between cancer cells and host
stromal response. The Smad4 status of cancer cells has been shown to directly influence the
protein composition of the surrounding stroma; Smad4-negative clones have been shown to
differentially secrete high levels of the matrix proteins SPARC (secreted protein, acidic and rich in
cysteines) compared to clones which re-express Smad4.(382) SPARC has previously been
characterized as an anti-adhesive and invasion-promoting protein which may have a role in
facilitating tumour invasion.(383) Evidence suggests that loss of Smad4 also induces changes in the
cytokine expression profile of the primary tumour which, in turn, changes the stromal
environment.(384) We have postulated that these changes to the tumour microenvironment may
promote recruitment of distinct sets of monocytes from the circulation or influence the rate or
direction of differentiation of these cells. Support for this theory comes from a murine model of
wound healing in which S100A8 expression was induced in fibroblasts by fibroblast growth factor-2
(FGF-2) and reduced by TGF-.(385) More research is required into this area to fully understand the
mechanisms behind this phenomenon.
We found that high levels of infiltrating S100A8 positive cells in the stroma of Smad4-negative
colorectal cancer patients demonstrated poorer short-term survival than those with low levels of
infiltrate, although there was no difference in survival in the longer term. This may indicate that
Smad4-negative tumours have a decreased time to recurrence or distant metastases in the
presence of high numbers of S100A8-positive monocytes. It is possible that Smad4-negative
tumours with high S100A8 infiltrate develop early metastases and are not candidates for curative

Protein expression in colorectal cancer EM Tweedle
182
resection of the primary tumour, which may explain the lower frequency of this phenotype in our
cohort. This is supported by evidence from a murine model in which VEGF and other soluble
chemokines released by the tumour induced production of S100A8 and S100A9 from recruited
myeloid cells in the lung, promoting the subsequent development of metastases at the site,
endorsing the theory that S100A8 and S100A9 are key to priming the pre-metastatic niche for
tumour cells.(386)
Both S100A8 and S100A9 have been reported to have cytotoxic effects at high levels,(387) however
recent reports using a number of human cancer cell lines suggests that S100A8/A9 may trigger
intracellular signalling pathways in cancer cells by activating the multiligand receptor RAGE
(receptor advanced glycation end-products).(310, 388) RAGE signalling induces an inflammatory
signalling cascade inside the cell which activates Nuclear Factor-Kappa-Beta, NF-κ. Several NF-κ-
regulated genes encode adhesion molecules, matrix metalloproteinases (MMP), serine proteases
and chemokines (such as IL-6) which are known to be implicated in tumour invasion and
metastasis.(389) It is clear that interaction between the cancer cell and its environment is one
important factor in determining metastatic behavior.(390, 391) Changes to the tumour
environment induced by loss of Smad4 may allow cancer cells to take advantage of S100A8/A9-
induced signalling in vivo. This may explain the difference in survival observed in Smad4-negative,
but not Smad4-positive tumours in response to high stromal S100A8 positive monocytic infiltrate.
To conclude, we have demonstrated that expression of S100A8 and S100A9 can be detected on
infiltrating CD14+/CD68- monocytes or undifferentiated macrophages in the stroma. Smad4-
negative colorectal cancers are associated with a change in composition of the surrounding stroma

Protein expression in colorectal cancer EM Tweedle
183
demonstrating lower levels of S100A8-positive infiltrating monocytes. Loss of Smad4 expression is
not predictive of overall survival except in those patients with node-negative disease, and those
with high levels of infiltrating S100A8-positive stromal cells. Our findings underpin the importance
of the interaction between cancer cells and their microenvironment to the malignant potential of
colorectal tumours.
4.5 FINAL CONCLUSION
In conclusion, laser-capture microdissection combined with 2D gel analysis and tandem mass
spectrometry allowed me to successfully compare protein-expression between colorectal cancer
and normal tissue, and between different morphologies of colorectal cancer. In this small study it
was not possible to identify all differentially-expressed proteins on the gels; however the most
promising candidate spots according to Samespot software analysis and intra-observer visual
analysis were identified. Validation of five candidate proteins was attempted and succeeded two
proteins, owing to available antibodies with specific and reproducible staining on tissue
immunohistochemistry. At the conclusion of this study, HSP27 as a prognostic marker in rectal
cancer and S100A8 expression in the stroma of colorectal cancer tissue have been characterised
and published. The aims of this study at the outset have not been met in entirety as there remain
other differentially-expressed spots to identify and more proteins to validate; however a sound
platform for further work in the area has been achieved.

Protein expression in colorectal cancer EM Tweedle
184
4.6 AREAS OF FUTURE RESEARCH
Further areas of investigation are outlined as follows:
1. A second cohort of paraffin-embedded specimens was utilized (with kind permission from Dr
Heike Grabsch) to futher validate expression of the HSP27 protein in rectal cancer patients using
the immunohistochemistry protocol described in this thesis. The results were reported in the
following publication; Low Molecular Weight Heat Shock Protein, HSP27 is a prognostic
indicator in rectal cancer, but not colon cancer. Elizabeth Tweedle, Ilyas Khattak, Chin Wee Ang,
Taoufik Nedjadi, Rosalind Jenkins, B. Kevin Park, Helen Kalirai, Andy Dodson, Bahram Azadeh,
Monica Terlizzo, Heike Grabsch, Wolfram Mueller, Arthur Sun Myint, Peter Clark, Helen Wong,
William Greenhalf, John P Neoptolemos, Paul S Rooney, Eithne Costello. Gut. 2010
Nov;59(11):1501-10.
2. The cellular response of colorectal cancer cell lines to S100A8/S100A9 was further investigated
in our Institution on the basis of immunohistochemistry findings included in this thesis. The
findings were reported in the following publication; Smad4 loss is associated with fewer
S100A8-positive monocytes in colorectal tumors and attenuated cellular response to S100A8 in
colorectal and pancreatic cancer cells. Chin W. Ang, Adnan A. Sheikh, Elizabeth M. Tweedle,
Sarah Tonack, Taoufik Nedjadi, Rosalind E. Jenkins, Kevin Park, Irmgard Schwarte-Waldhoff,
Ilyas Khattak, Bahram Azadeh, Andrew Dodson, Helen Kalirai, John P Neoptolemos, Paul S
Rooney, Eithne Costello. Carcinogenesis. 2010 Sep;31(9):1541-51. Epub 2010 Jul 9.

Protein expression in colorectal cancer EM Tweedle
185
3. Elevated HSP27 expression is postulated as a predictive marker for response to chemo-
radiotherapy in rectal cancer patients. Tissue from patients recruited to phase II trials of
chemoradiotherapy in Clatterbridge Centre for Oncology will be collated on a tissue microarray
and HSP27 levels determined using the immunohistochemistry scoring protocol outlined in this
work. Comparison will be made in histopathology features, tumour regression grade and
patient survival.
4. HSP27 has been found at elevated levels in the tumour microenvironment of breast cancers,
where it has been shown to influence phenotypic differentiation and activity of tumour
associated macrophages. Future work will seek to investigate the association between HSP27
levels in the microenvironment of rectal cancers and the numbers and phenotypes of tumour-
associated macrophages in the stroma.
5. Evaluation of oxidized peroxiredoxin 2 and SH3BGRPL3 expression in colorectal cancer tissue is
planned when commercially available antibodies are available for use in immunohistochemistry.

Protein expression in colorectal cancer EM Tweedle
186
5. REFERENCES
1. Cancer Research UK. http://info.cancerresearchuk.org/cancerstats/types/bowel/.
2. Sant M, Aareleid T, Berrino F, Bielska Lasota M, Carli PM, Faivre J, et al. EUROCARE-3:
survival of cancer patients diagnosed 1990-94--results and commentary. Ann Oncol. 2003;14 Suppl
5:v61-118.
3. Rex DK, Johnson DA, Lieberman DA, Burt RW, Sonnenberg A. Colorectal cancer prevention
2000: screening recommendations of the American College of Gastroenterology. American College
of Gastroenterology. Am J Gastroenterol. 2000 Apr;95(4):868-77.
4. Dukes CE. The relation of histology to spread in intestinal cancer. Br J Cancer. 1950
Mar;4(1):59-62.
5. Astler VB, Coller FA. The prognostic significance of direct extension of carcinoma of the
colon and rectum. Ann Surg. 1954 Jun;139(6):846-52.
6. Glimelius B, Oliveira J. Rectal cancer: ESMO clinical recommendations for diagnosis,
treatment and follow-up. Ann Oncol. 2008 May;19 Suppl 2:ii31-2.
7. Van Cutsem EJ, Oliveira J. Colon cancer: ESMO clinical recommendations for diagnosis,
adjuvant treatment and follow-up. Ann Oncol. 2008 May;19 Suppl 2:ii29-30.
8. Compton C, Fenoglio-Preiser CM, Pettigrew N, Fielding LP. American Joint Committee on
Cancer Prognostic Factors Consensus Conference: Colorectal Working Group. Cancer. 2000 Apr
1;88(7):1739-57.
9. Quirke P, Morris E. Reporting colorectal cancer. Histopathology. 2007 Jan;50(1):103-12.

Protein expression in colorectal cancer EM Tweedle
187
10. Edge SB, Compton CC. The American Joint Committee on Cancer: the 7th edition of the AJCC
cancer staging manual and the future of TNM. Ann Surg Oncol. 2010 Jun;17(6):1471-4.
11. O'Connell JB, Maggard MA, Ko CY. Colon cancer survival rates with the new American Joint
Committee on Cancer sixth edition staging. J Natl Cancer Inst. 2004 Oct 6;96(19):1420-5.
12. Garden OJ, Rees M, Poston GJ, Mirza D, Saunders M, Ledermann J, et al. Guidelines for
resection of colorectal cancer liver metastases. Gut. 2006 Aug;55 Suppl 3:iii1-8.
13. Nagtegaal ID, Quirke P. What is the role for the circumferential margin in the modern
treatment of rectal cancer? J Clin Oncol. 2008 Jan 10;26(2):303-12.
14. Scott N, Jamali A, Verbeke C, Ambrose NS, Botterill ID, Jayne DG. Retroperitoneal margin
involvement by adenocarcinoma of the caecum and ascending colon: what does it mean?
Colorectal Dis. 2008 Mar;10(3):289-93.
15. Ueno H, Mochizuki H, Hashiguchi Y, Ishiguro M, Kajiwara Y, Sato T, et al. Histological grading
of colorectal cancer: a simple and objective method. Ann Surg. 2008 May;247(5):811-8.
16. Halvorsen TB, Seim E. Degree of differentiation in colorectal adenocarcinomas: a
multivariate analysis of the influence on survival. J Clin Pathol. 1988 May;41(5):532-7.
17. Maughan NJ, Morris E, Forman D, Quirke P. The validity of the Royal College of Pathologists'
colorectal cancer minimum dataset within a population. Br J Cancer. 2007 Nov 19;97(10):1393-8.
18. Minsky BD, Mies C, Rich TA, Recht A. Lymphatic vessel invasion is an independent prognostic
factor for survival in colorectal cancer. Int J Radiat Oncol Biol Phys. 1989 Aug;17(2):311-8.
19. Durante AP, Bromberg SH, Barreto E, Cappellano G, de Godoy AC. [Prognostic value of
lymphatic vessel and neural invasion in colorectal carcinoma]. Rev Assoc Med Bras. 2004 Jan-
Mar;50(1):21-6.
Protein expression in colorectal cancer EM Tweedle
188
20. Cianchi F, Messerini L, Palomba A, Boddi V, Perigli G, Pucciani F, et al. Character of the
invasive margin in colorectal cancer: does it improve prognostic information of Dukes staging? Dis
Colon Rectum. 1997 Oct;40(10):1170-5; discussion 5-6.
21. Rowan S, Brewster D. Cancer Atlas of the UK and Ireland. 2000.
22. Butterworth AS, Higgins JP, Pharoah P. Relative and absolute risk of colorectal cancer for
individuals with a family history: a meta-analysis. Eur J Cancer. 2006 Jan;42(2):216-27.
23. Fearnhead NS, Wilding JL, Bodmer WF. Genetics of colorectal cancer: hereditary aspects and
overview of colorectal tumorigenesis. Br Med Bull. 2002;64:27-43.
24. Lynch HT, Lynch PM, Lanspa SJ, Snyder CL, Lynch JF, Boland CR. Review of the Lynch
syndrome: history, molecular genetics, screening, differential diagnosis, and medicolegal
ramifications. Clin Genet. 2009 Jul;76(1):1-18.
25. Stigliano V, Assisi D, Cosimelli M, Palmirotta R, Giannarelli D, Mottolese M, et al. Survival of
hereditary non-polyposis colorectal cancer patients compared with sporadic colorectal cancer
patients. J Exp Clin Cancer Res. 2008;27:39.
26. Umar A, Boland CR, Terdiman JP, Syngal S, de la Chapelle A, Ruschoff J, et al. Revised
Bethesda Guidelines for hereditary nonpolyposis colorectal cancer (Lynch syndrome) and
microsatellite instability. J Natl Cancer Inst. 2004 Feb 18;96(4):261-8.
27. Half E, Bercovich D, Rozen P. Familial adenomatous polyposis. Orphanet J Rare Dis.
2009;4:22.
28. Dunlop MG. Guidance on gastrointestinal surveillance for hereditary non-polyposis
colorectal cancer, familial adenomatous polypolis, juvenile polyposis, and Peutz-Jeghers syndrome.
Gut. 2002 Oct;51 Suppl 5:V21-7.
Protein expression in colorectal cancer EM Tweedle
189
29. Heiskanen I, Jarvinen HJ. Fate of the rectal stump after colectomy and ileorectal
anastomosis for familial adenomatous polyposis. Int J Colorectal Dis. 1997;12(1):9-13.
30. Church J, Burke C, McGannon E, Pastean O, Clark B. Risk of rectal cancer in patients after
colectomy and ileorectal anastomosis for familial adenomatous polyposis: a function of available
surgical options. Dis Colon Rectum. 2003 Sep;46(9):1175-81.
31. Calva D, Howe JR. Hamartomatous polyposis syndromes. Surg Clin North Am. 2008
Aug;88(4):779-817, vii.
32. Muto T BH, Morson BC. The evolution of cancer of the colon and rectum. Cancer.
1975;36:2251-70.
33. Vogelstein B, Fearon ER, Hamilton SR, Kern SE, Preisinger AC, Leppert M, et al. Genetic
alterations during colorectal-tumor development. N Engl J Med. 1988 Sep 1;319(9):525-32.
34. Fearon ER, Vogelstein B. A genetic model for colorectal tumorigenesis. Cell. 1990 Jun
1;61(5):759-67.
35. Smith G, Carey FA, Beattie J, Wilkie MJ, Lightfoot TJ, Coxhead J, et al. Mutations in APC,
Kirsten-ras, and p53--alternative genetic pathways to colorectal cancer. Proc Natl Acad Sci U S A.
2002 Jul 9;99(14):9433-8.
36. Wood LD, Parsons DW, Jones S, Lin J, Sjoblom T, Leary RJ, et al. The genomic landscapes of
human breast and colorectal cancers. Science. 2007 Nov 16;318(5853):1108-13.
37. Haydon AM, Jass JR. Emerging pathways in colorectal-cancer development. Lancet Oncol.
2002 Feb;3(2):83-8.
38. Behrens J. The role of the Wnt signalling pathway in colorectal tumorigenesis. Biochem Soc
Trans. 2005 Aug;33(Pt 4):672-5.

Protein expression in colorectal cancer EM Tweedle
190
39. Giaretti W, Venesio T, Prevosto C, Lombardo F, Ceccarelli J, Molinu S, et al. Chromosomal
instability and APC gene mutations in human sporadic colorectal adenomas. J Pathol. 2004
Oct;204(2):193-9.
40. Heinen CD, Goss KH, Cornelius JR, Babcock GF, Knudsen ES, Kowalik T, et al. The APC tumor
suppressor controls entry into S-phase through its ability to regulate the cyclin D/RB pathway.
Gastroenterology. 2002 Sep;123(3):751-63.
41. Castagnola P, Giaretti W. Mutant KRAS, chromosomal instability and prognosis in colorectal
cancer. Biochim Biophys Acta. 2005 Nov 25;1756(2):115-25.
42. Kolch W. Meaningful relationships: the regulation of the Ras/Raf/MEK/ERK pathway by
protein interactions. Biochem J. 2000 Oct 15;351 Pt 2:289-305.
43. Calistri D, Rengucci C, Seymour I, Lattuneddu A, Polifemo AM, Monti F, et al. Mutation
analysis of p53, K-ras, and BRAF genes in colorectal cancer progression. J Cell Physiol. 2005
Aug;204(2):484-8.
44. Nagasaka T, Sasamoto H, Notohara K, Cullings HM, Takeda M, Kimura K, et al. Colorectal
cancer with mutation in BRAF, KRAS, and wild-type with respect to both oncogenes showing
different patterns of DNA methylation. J Clin Oncol. 2004 Nov 15;22(22):4584-94.
45. Kadiyska TK, Konstantinova DV, Atanasov VR, Kremensky IM, Mitev VI. Frequency and
application of the hot spot BRAF gene mutation (p.V600E) in the diagnostic strategy for Hereditary
Nonpolyposis Colorectal Cancer. Cancer Detect Prev. 2007 Jun 11.
46. Jen J, Kim H, Piantadosi S, Liu ZF, Levitt RC, Sistonen P, et al. Allelic loss of chromosome 18q
and prognosis in colorectal cancer. The New England journal of medicine. 1994 Jul 28;331(4):213-
21.

Protein expression in colorectal cancer EM Tweedle
191
47. Ogunbiyi OA, Goodfellow PJ, Herfarth K, Gagliardi G, Swanson PE, Birnbaum EH, et al.
Confirmation that chromosome 18q allelic loss in colon cancer is a prognostic indicator. J Clin Oncol.
1998 Feb;16(2):427-33.
48. Fearon ER, Cho KR, Nigro JM, Kern SE, Simons JW, Ruppert JM, et al. Identification of a
chromosome 18q gene that is altered in colorectal cancers. Science (New York, NY. 1990 Jan
5;247(4938):49-56.
49. Eppert K, Scherer SW, Ozcelik H, Pirone R, Hoodless P, Kim H, et al. MADR2 maps to 18q21
and encodes a TGFbeta-regulated MAD-related protein that is functionally mutated in colorectal
carcinoma. Cell. 1996 Aug 23;86(4):543-52.
50. Thiagalingam S, Lengauer C, Leach FS, Schutte M, Hahn SA, Overhauser J, et al. Evaluation of
candidate tumour suppressor genes on chromosome 18 in colorectal cancers. Nature genetics.
1996 Jul;13(3):343-6.
51. Hahn SA, Schutte M, Hoque AT, Moskaluk CA, da Costa LT, Rozenblum E, et al. DPC4, a
candidate tumor suppressor gene at human chromosome 18q21.1. Science (New York, NY. 1996 Jan
19;271(5247):350-3.
52. Li F, Cao Y, Townsend CM, Ko TC. TGF-beta signalling in colon cancer cells. World J Surg.
2005 Mar;29(3):306-11.
53. Howe JR, Roth S, Ringold JC, Summers RW, Jarvinen HJ, Sistonen P, et al. Mutations in the
SMAD4/DPC4 gene in juvenile polyposis. Science (New York, NY. 1998 May 15;280(5366):1086-8.
54. Woodford-Richens KL, Rowan AJ, Poulsom R, Bevan S, Salovaara R, Aaltonen LA, et al.
Comprehensive analysis of SMAD4 mutations and protein expression in juvenile polyposis: evidence

Protein expression in colorectal cancer EM Tweedle
192
for a distinct genetic pathway and polyp morphology in SMAD4 mutation carriers. Am J Pathol.
2001 Oct;159(4):1293-300.
55. Takaku K, Oshima M, Miyoshi H, Matsui M, Seldin MF, Taketo MM. Intestinal tumorigenesis
in compound mutant mice of both Dpc4 (Smad4) and Apc genes. Cell. 1998 Mar 6;92(5):645-56.
56. Takaku K, Miyoshi H, Matsunaga A, Oshima M, Sasaki N, Taketo MM. Gastric and duodenal
polyps in Smad4 (Dpc4) knockout mice. Cancer research. 1999 Dec 15;59(24):6113-7.
57. Miyaki M, Iijima T, Konishi M, Sakai K, Ishii A, Yasuno M, et al. Higher frequency of Smad4
gene mutation in human colorectal cancer with distant metastasis. Oncogene. 1999 May
20;18(20):3098-103.
58. Alazzouzi H, Alhopuro P, Salovaara R, Sammalkorpi H, Jarvinen H, Mecklin JP, et al. SMAD4
as a prognostic marker in colorectal cancer. Clin Cancer Res. 2005 Apr 1;11(7):2606-11.
59. Sheikh AA, Vimalachandran D, Thompson CC, Jenkins RE, Nedjadi T, Shekouh A, et al. The
expression of S100A8 in pancreatic cancer-associated monocytes is associated with the Smad4
status of pancreatic cancer cells. Proteomics. 2007 Jun;7(11):1929-40.
60. Mesker WE, Liefers GJ, Junggeburt JM, van Pelt GW, Alberici P, Kuppen PJ, et al. Presence of
a high amount of stroma and downregulation of SMAD4 predict for worse survival for stage I-II
colon cancer patients. Cell Oncol. 2009;31(3):169-78.
61. Steele RJ, Thompson AM, Hall PA, Lane DP. The p53 tumour suppressor gene. Br J Surg. 1998
Nov;85(11):1460-7.
62. Stad R, Little NA, Xirodimas DP, Frenk R, van der Eb AJ, Lane DP, et al. Mdmx stabilizes p53
and Mdm2 via two distinct mechanisms. EMBO Rep. 2001 Nov;2(11):1029-34.

Protein expression in colorectal cancer EM Tweedle
193
63. Broude EV, Demidenko ZN, Vivo C, Swift ME, Davis BM, Blagosklonny MV, et al. p21
(CDKN1A) is a Negative Regulator of p53 Stability. Cell Cycle. 2007 Apr 12;6(12).
64. Bundred NJ. Bs24 apoptosis: why surgeons need to understand it. ANZ J Surg. 2007 May;77
Suppl 1:A6.
65. Ghobrial IM, Witzig TE, Adjei AA. Targeting apoptosis pathways in cancer therapy. CA Cancer
J Clin. 2005 May-Jun;55(3):178-94.
66. Sun W, Yang J. Functional mechanisms for human tumor suppressors. J Cancer. 2010;1:136-
40.
67. Hoglund P. DNA damage and tumor surveillance: one trigger for two pathways. Sci STKE.
2006 Jan 10;2006(317):pe2.
68. Munro AJ, Lain S, Lane DP. P53 abnormalities and outcomes in colorectal cancer: a
systematic review. Br J Cancer. 2005 Feb 14;92(3):434-44.
69. Woerner SM, Kloor M, von Knebel Doeberitz M, Gebert JF. Microsatellite instability in the
development of DNA mismatch repair deficient tumors. Cancer Biomark. 2006;2(1-2):69-86.
70. Soreide K, Janssen EA, Soiland H, Korner H, Baak JP. Microsatellite instability in colorectal
cancer. Br J Surg. 2006 Apr;93(4):395-406.
71. Boland CR TS, Hamilton SR, Sidransky D, Eshleman JR, Burt RW, Meltzer SJ, Rodriguez-Bigas
MA, Fodde R, Ranzani GN, Srivastava S. A National Cancer Institute Workshop on Microsatellite
Instability for cancer detection and familial predisposition:development of international criteria for
the determination of microsatellite instability in colorectal cancer. Cancer Res. 1998 Nov
15;58(22):5248-57.

Protein expression in colorectal cancer EM Tweedle
194
72. Jass JR. Classification of colorectal cancer based on correlation of clinical, morphological and
molecular features. Histopathology. 2007 Jan;50(1):113-30.
73. Samowitz WS. The CpG Island Methylator Phenotype in Colorectal Cancer. J Mol Diagn. 2007
Apr 26.
74. Makinen MJ. Colorectal serrated adenocarcinoma. Histopathology. 2007 Jan;50(1):131-50.
75. O'Brien MJ, Yang S, Mack C, Xu H, Huang CS, Mulcahy E, et al. Comparison of microsatellite
instability, CpG island methylation phenotype, BRAF and KRAS status in serrated polyps and
traditional adenomas indicates separate pathways to distinct colorectal carcinoma end points. Am J
Surg Pathol. 2006 Dec;30(12):1491-501.
76. Khattak I, Eardley NJ, Rooney PS. Colorectal cancer--a prospective evaluation of symptom
duration and GP referral patterns in an inner city teaching hospital. Colorectal Dis. 2006
Jul;8(6):518-21.
77. Atkin W. Options for screening for colorectal cancer. Scand J Gastroenterol Suppl.
2003(237):13-6.
78. Hart AR KS, Mackay EH, Mayberry JF, Atkin WS. Flat adenomas exist in asympomatic
people:important implications for colorectal cancer screening programmes. GUT. 1998 Aug
1998;43:229-31.
79. Hoff G, Sauar J, Vatn MH, Larsen S, Langmark F, Moen IE, et al. Polypectomy of adenomas in
the prevention of colorectal cancer: 10 years' follow-up of the Telemark Polyp Study I. A
prospective, controlled population study. Scand J Gastroenterol. 1996 Oct;31(10):1006-10.
80. Newcomb PA, Norfleet RG, Storer BE, Surawicz TS, Marcus PM. Screening sigmoidoscopy
and colorectal cancer mortality. J Natl Cancer Inst. 1992 Oct 21;84(20):1572-5.

Protein expression in colorectal cancer EM Tweedle
195
81. Selby JV, Friedman GD, Quesenberry CP, Jr., Weiss NS. Effect of fecal occult blood testing on
mortality from colorectal cancer. A case-control study. Ann Intern Med. 1993 Jan 1;118(1):1-6.
82. Winawer SJ, Zauber AG, Ho MN, O'Brien MJ, Gottlieb LS, Sternberg SS, et al. Prevention of
colorectal cancer by colonoscopic polypectomy. The National Polyp Study Workgroup. N Engl J
Med. 1993 Dec 30;329(27):1977-81.
83. Muller AD, Sonnenberg A. Prevention of colorectal cancer by flexible endoscopy and
polypectomy. A case-control study of 32,702 veterans. Ann Intern Med. 1995 Dec 15;123(12):904-
10.
84. Singh H, Turner D, Xue L, Targownik LE, Bernstein CN. Risk of developing colorectal cancer
following a negative colonoscopy examination: evidence for a 10-year interval between
colonoscopies. Jama. 2006 May 24;295(20):2366-73.
85. Betes M, Munoz-Navas MA, Duque JM, Angos R, Macias E, Subtil JC, et al. Use of
colonoscopy as a primary screening test for colorectal cancer in average risk people. Am J
Gastroenterol. 2003 Dec;98(12):2648-54.
86. Lieberman DA, Weiss DG, Bond JH, Ahnen DJ, Garewal H, Chejfec G. Use of colonoscopy to
screen asymptomatic adults for colorectal cancer. Veterans Affairs Cooperative Study Group 380. N
Engl J Med. 2000 Jul 20;343(3):162-8.
87. Imperiale TF, Wagner DR, Lin CY, Larkin GN, Rogge JD, Ransohoff DF. Results of screening
colonoscopy among persons 40 to 49 years of age. N Engl J Med. 2002 Jun 6;346(23):1781-5.
88. Robinson MH, Hardcastle JD, Moss SM, Amar SS, Chamberlain JO, Armitage NC, et al. The
risks of screening: data from the Nottingham randomised controlled trial of faecal occult blood
screening for colorectal cancer. Gut. 1999 Oct;45(4):588-92.

Protein expression in colorectal cancer EM Tweedle
196
89. Pickhardt PJ, Nugent PA, Mysliwiec PA, Choi JR, Schindler WR. Location of adenomas missed
by optical colonoscopy. Ann Intern Med. 2004 Sep 7;141(5):352-9.
90. Rex DK. American College of Gastroenterology action plan for colorectal cancer prevention.
Am J Gastroenterol. 2004 Apr;99(4):574-7.
91. Single flexible sigmoidoscopy screening to prevent colorectal cancer: baseline findings of a
UK multicentre randomised trial. Lancet. 2002 Apr 13;359(9314):1291-300.
92. Segnan N, Senore C, Andreoni B, Aste H, Bonelli L, Crosta C, et al. Baseline findings of the
Italian multicenter randomized controlled trial of "once-only sigmoidoscopy"--SCORE. J Natl Cancer
Inst. 2002 Dec 4;94(23):1763-72.
93. Gondal G, Grotmol T, Hofstad B, Bretthauer M, Eide TJ, Hoff G. The Norwegian Colorectal
Cancer Prevention (NORCCAP) screening study: baseline findings and implementations for clinical
work-up in age groups 50-64 years. Scand J Gastroenterol. 2003 Jun;38(6):635-42.
94. Atkin WS, Edwards R, Kralj-Hans I, Wooldrage K, Hart AR, Northover JM, et al. Once-only
flexible sigmoidoscopy screening in prevention of colorectal cancer: a multicentre randomised
controlled trial. Lancet. 2010 May 8;375(9726):1624-33.
95. Doria-Rose VP, Levin TR, Selby JV, Newcomb PA, Richert-Boe KE, Weiss NS. The incidence of
colorectal cancer following a negative screening sigmoidoscopy: implications for screening interval.
Gastroenterology. 2004 Sep;127(3):714-22.
96. Brevinge H, Lindholm E, Buntzen S, Kewenter J. Screening for colorectal neoplasia with
faecal occult blood testing compared with flexible sigmoidoscopy directly in a 55-56 years' old
population. Int J Colorectal Dis. 1997;12(5):291-5.

Protein expression in colorectal cancer EM Tweedle
197
97. Segnan N, Senore C, Andreoni B, Arrigoni A, Bisanti L, Cardelli A, et al. Randomized trial of
different screening strategies for colorectal cancer: patient response and detection rates. J Natl
Cancer Inst. 2005 Mar 2;97(5):347-57.
98. Glick S. Double-contrast barium enema for colorectal cancer screening: a review of the
issues and a comparison with other screening alternatives. AJR Am J Roentgenol. 2000
Jun;174(6):1529-37.
99. Rockey DC, Koch J, Yee J, McQuaid KR, Halvorsen RA. Prospective comparison of air-contrast
barium enema and colonoscopy in patients with fecal occult blood: a pilot study. Gastrointest
Endosc. 2004 Dec;60(6):953-8.
100. Kung JW, Levine MS, Glick SN, Lakhani P, Rubesin SE, Laufer I. Colorectal cancer: screening
double-contrast barium enema examination in average-risk adults older than 50 years. Radiology.
2006 Sep;240(3):725-35.
101. Pickhardt PJ, Taylor AJ, Kim DH, Reichelderfer M, Gopal DV, Pfau PR. Screening for colorectal
neoplasia with CT colonography: initial experience from the 1st year of coverage by third-party
payers. Radiology. 2006 Nov;241(2):417-25.
102. Herzog P, Holtermuller KH, Preiss J, Fischer J, Ewe K, Schreiber HJ, et al. Fecal blood loss in
patients with colonic polyps: a comparison of measurements with 51chromium-labelled
erythrocytes and with the Haemoccult test. Gastroenterology. 1982 Nov;83(5):957-62.
103. Mandel JS, Bond JH, Church TR, Snover DC, Bradley GM, Schuman LM, et al. Reducing
mortality from colorectal cancer by screening for fecal occult blood. Minnesota Colon Cancer
Control Study. N Engl J Med. 1993 May 13;328(19):1365-71.

Protein expression in colorectal cancer EM Tweedle
198
104. Mandel JS, Church TR, Ederer F, Bond JH. Colorectal cancer mortality: effectiveness of
biennial screening for fecal occult blood. J Natl Cancer Inst. 1999 Mar 3;91(5):434-7.
105. Hardcastle JD, Chamberlain JO, Robinson MH, Moss SM, Amar SS, Balfour TW, et al.
Randomised controlled trial of faecal-occult-blood screening for colorectal cancer. Lancet. 1996
Nov 30;348(9040):1472-7.
106. Scholefield JH, Moss S, Sufi F, Mangham CM, Hardcastle JD. Effect of faecal occult blood
screening on mortality from colorectal cancer: results from a randomised controlled trial. Gut. 2002
Jun;50(6):840-4.
107. Kronborg O, Fenger C, Olsen J, Jorgensen OD, Sondergaard O. Randomised study of
screening for colorectal cancer with faecal-occult-blood test. Lancet. 1996 Nov 30;348(9040):1467-
71.
108. Moss SM, Hardcastle JD, Coleman DA, Robinson MH, Rodrigues VC. Interval cancers in a
randomized controlled trial of screening for colorectal cancer using a faecal occult blood test. Int J
Epidemiol. 1999 Jun;28(3):386-90.
109. Brenner DE, Rennert G. Fecal DNA biomarkers for the detection of colorectal neoplasia:
attractive, but is it feasible? J Natl Cancer Inst. 2005 Aug 3;97(15):1107-9.
110. Ahlquist DA, Skoletsky JE, Boynton KA, Harrington JJ, Mahoney DW, Pierceall WE, et al.
Colorectal cancer screening by detection of altered human DNA in stool: feasibility of a multitarget
assay panel. Gastroenterology. 2000 Nov;119(5):1219-27.
111. Imperiale TF, Ransohoff DF, Itzkowitz SH, Turnbull BA, Ross ME. Fecal DNA versus fecal
occult blood for colorectal-cancer screening in an average-risk population. N Engl J Med. 2004 Dec
23;351(26):2704-14.

Protein expression in colorectal cancer EM Tweedle
199
112. Wu GH, Wang YM, Yen AM, Wong JM, Lai HC, Warwick J, et al. Cost-effectiveness analysis of
colorectal cancer screening with stool DNA testing in intermediate-incidence countries. BMC
Cancer. 2006;6:136.
113. Quirke P, Steele R, Monson J, Grieve R, Khanna S, Couture J, et al. Effect of the plane of
surgery achieved on local recurrence in patients with operable rectal cancer: a prospective study
using data from the MRC CR07 and NCIC-CTG CO16 randomised clinical trial. Lancet. 2009 Mar
7;373(9666):821-8.
114. Nelson H, Petrelli N, Carlin A, Couture J, Fleshman J, Guillem J, et al. Guidelines 2000 for
colon and rectal cancer surgery. J Natl Cancer Inst. 2001 Apr 18;93(8):583-96.
115. Improving Outcomes in Colorectal Cancer. National Institute for Clinical Excellence.
116. Efficacy of adjuvant fluorouracil and folinic acid in colon cancer. International Multicentre
Pooled Analysis of Colon Cancer Trials (IMPACT) investigators. Lancet. 1995 Apr 15;345(8955):939-
44.
117. Wolmark N, Fisher B, Rockette H, Redmond C, Wickerham DL, Fisher ER, et al. Postoperative
adjuvant chemotherapy or BCG for colon cancer: results from NSABP protocol C-01. J Natl Cancer
Inst. 1988 Mar 2;80(1):30-6.
118. O'Connell MJ, Laurie JA, Kahn M, Fitzgibbons RJ, Jr., Erlichman C, Shepherd L, et al.
Prospectively randomized trial of postoperative adjuvant chemotherapy in patients with high-risk
colon cancer. J Clin Oncol. 1998 Jan;16(1):295-300.
119. Douillard JY, Cunningham D, Roth AD, Navarro M, James RD, Karasek P, et al. Irinotecan
combined with fluorouracil compared with fluorouracil alone as first-line treatment for metastatic
colorectal cancer: a multicentre randomised trial. Lancet. 2000 Mar 25;355(9209):1041-7.

Protein expression in colorectal cancer EM Tweedle
200
120. Kerr DJ, Gray R, McConkey C, Barnwell J. Adjuvant chemotherapy with 5-fluorouracil, L-
folinic acid and levamisole for patients with colorectal cancer: non-randomised comparison of
weekly versus four-weekly schedules--less pain, same gain. QUASAR Colorectal Cancer Study Group.
Ann Oncol. 2000 Aug;11(8):947-55.
121. Simmonds PC. Palliative chemotherapy for advanced colorectal cancer: systematic review
and meta-analysis. Colorectal Cancer Collaborative Group. Bmj. 2000 Sep 2;321(7260):531-5.
122. Adam R, Avisar E, Ariche A, Giachetti S, Azoulay D, Castaing D, et al. Five-year survival
following hepatic resection after neoadjuvant therapy for nonresectable colorectal. Ann Surg Oncol.
2001 May;8(4):347-53.
123. Bismar MM, Sinicrope FA. Radiation enteritis. Curr Gastroenterol Rep. 2002 Oct;4(5):361-5.
124. Quirke P, Sebag-Montefiore D, Steele R, S. K, Monson J, Holliday A, et al. Local recurrence
after rectal cancer resection is strongly related to the plane of surgical dissection and is further
reduced by pre-operative short course radiotherapy. Preliminary results of the Medical Research
Council (MRC) CR07 trial. Journal of Clinical Oncology, 2006 ASCO Annual Meeting Proceedings
(Post-Meeting Edition). 2006;Vol 24, No 18S (June 20 Supplement), 2006:3512.
125. Pasetto LM. Preoperative versus postoperative treatment for locally advanced rectal
carcinoma. Future Oncol. 2005 Apr;1(2):209-20.
126. Cunningham D, Humblet Y, Siena S, Khayat D, Bleiberg H, Santoro A, et al. Cetuximab
monotherapy and cetuximab plus irinotecan in irinotecan-refractory metastatic colorectal cancer. N
Engl J Med. 2004 Jul 22;351(4):337-45.

Protein expression in colorectal cancer EM Tweedle
201
127. Hurwitz H, Fehrenbacher L, Novotny W, Cartwright T, Hainsworth J, Heim W, et al.
Bevacizumab plus irinotecan, fluorouracil, and leucovorin for metastatic colorectal cancer. N Engl J
Med. 2004 Jun 3;350(23):2335-42.
128. Lievre A, Bachet JB, Boige V, Cayre A, Le Corre D, Buc E, et al. KRAS mutations as an
independent prognostic factor in patients with advanced colorectal cancer treated with cetuximab.
J Clin Oncol. 2008 Jan 20;26(3):374-9.
129. Fukami N, Lee JH. Endoscopic treatment of large sessile and flat colorectal lesions. Curr Opin
Gastroenterol. 2006 Jan;22(1):54-9.
130. Buess G. Review: transanal endoscopic microsurgery (TEM). J R Coll Surg Edinb. 1993
Aug;38(4):239-45.
131. Whitehouse PA, Tilney HS, Armitage JN, Simson JN. Transanal endoscopic microsurgery: risk
factors for local recurrence of benign rectal adenomas. Colorectal Dis. 2006 Nov;8(9):795-9.
132. Bach S, Mortensen N. Analysis of national database for TEM resected rectal cancer.
Colorectal Dis. 2006 Nov;8(9):815.
133. Tada M, Karita M, Yanai H, Takemoto T. [Endoscopic therapy of early gastric cancer by strip
biopsy]. Gan To Kagaku Ryoho. 1988 Apr;15(4 Pt 2-3):1460-5.
134. Conio M, Repici A, Demarquay JF, Blanchi S, Dumas R, Filiberti R. EMR of large sessile
colorectal polyps. Gastrointest Endosc. 2004 Aug;60(2):234-41.
135. Hurlstone DP, Sanders DS, Cross SS, Adam I, Shorthouse AJ, Brown S, et al. Colonoscopic
resection of lateral spreading tumours: a prospective analysis of endoscopic mucosal resection.
Gut. 2004 Sep;53(9):1334-9.

Protein expression in colorectal cancer EM Tweedle
202
136. Atkin WS, Saunders BP. Surveillance guidelines after removal of colorectal adenomatous
polyps. Gut. 2002 Oct;51 Suppl 5:V6-9.
137. Stryker SJ, Wolff BG, Culp CE, Libbe SD, Ilstrup DM, MacCarty RL. Natural history of
untreated colonic polyps. Gastroenterology. 1987 Nov;93(5):1009-13.
138. Muto T KJ, sawada T, Konishi F, Sugihara K, Kubota Y, adachi M, Agawa S, Saito Y, Morioka Y.
Small 'flat adenoma' of the large bowel with special reference to its clinicopathologic features. Dis
Colon Rectum. 1985;28(11):847-51.
139. Adachi M MT, Morioka Y, Ikenaga T, Hara M. Flat adenoma and flat mucosal carcinoma (IIb
type) - a new precursor of colorectal carcinoma? Dis Colon Rectum. 1987;31(3):236-43.
140. Fujii T RB, dixon MF, Yoshida S, Axon ATR. Flat adenomas in the United Kingdom:are
treatable cancers being missed? Endoscopy. 1998;30:437-43.
141. Hurlstone DP CS, Adam I, Shorthouse AJ, Brown S, Sanders DS, Lobo AJ. A prospective
clinicopathological and endoscopic evaluation of flat and depressed colorectal lesions in the United
kingdom. Am J Gastroenterol. 2003;98(11):2543-9.
142. Diebold M-D SE, Merle C, Bouche O, Higuero T, Jolly D, Ramaholimihaso F, Renard P, Yaziji N,
Theifin G, Cadiot G. Colonic flat neoplasia:frequency and concordance between endoscopic
appearance and histological diagnosis in a French prospective series. Am J Gastroenterol.
2004;99:1795-800.
143. Rembacken BJ FT, Cairns A, Dixon MF, Yoshida S, Chalmers DM, Axon ATR. Flat and
depressed colonic neoplasms: a prospective study of 1000 colonoscopies in the UK. Lancet. 2000
April 8;355:1211-4.

Protein expression in colorectal cancer EM Tweedle
203
144. Ross AS WI. Flat and depressed neoplasms of the colon in Western populations. Am J
Gastroenterol. 2006;101:172-80.
145. Stolte M BB. Colorectal mini-de novo carcinoma: a reality in Germany too. Endoscopy.
1995;27:286-90.
146. Tsuda S VB, Toth E, Fork F-T. Flat and depressed colorectal tumours in a Southern Swedish
population: a prospective chromoendoscopic and histopathological study. GUT. 2002;51:550-5.
147. Kudo S, Kashida H, Nakajima T, Tamura S, Nakajo K. Endoscopic diagnosis and treatment of
early colorectal cancer. World J Surg. 1997 Sep;21(7):694-701.
148. Iishi H TM, Tsutsui S, Imanishi K, Otani T, Okuda S, Ishiguro S, Tanuguchi H. Early depressed
adenocarcinomas of the large intestine. Cancer. 1992;69(10):2406-10.
149. Mitooka H FT, Maeda S, Nagasako K. Minute flat depressed neoplastic lesions of the colon
detected by contrast chromosopy using an indigo carmine capsule. Gastrointest Endosc.
1995;41(5):453-9.
150. Kudo S TT, Nakajima T, Hirota S, Asano M, Ito O, Kusaka H. Depressed type of colorectal
cancer. Endoscopy. 1995;27:54-7.
151. Smith GA OK, O'Dwyer PJ. Frequency of early colorectal cancer in patients undergoing
colonoscopy. Br J surg. 1999 October 1999;86(10):1328-31.
152. Togashi K KF, Koinuma K, Ishitsuka T, Kojima M, Okada M, Nagai H. Flat and depressed
lesions of the colon and rectum: pathogenesis and clinical management. Ann Acad Med Singapore.
2003;32:152-8.
153. Suzuki N TI, Saunders BP. The prevalence of small, flat colorectal cancers in a Western
population. Colorectal Dis. 2004 Jan 2004;6(1):15-20.

Protein expression in colorectal cancer EM Tweedle
204
154. S K. Endoscopic mucosal resection of flat and depressed types of early colorectal cancer.
Endoscopy. 1993;25:455-61.
155. Kudo S KH, Tamura T, Kogure E, Imai Y, Yamano H, Hart A. Colonoscopic diagnosis and
management of nonpolypoid early colorectal cancer. World J Surg. 2000;24:1081-90.
156. Ishihara S WT, Umetani N, Yamagata S, Masaki T, Nagawa H, Muto T. Small advanced
colorectal cancers:clinicopathological characteristics and pathogenic origin. Jpn J Clin Oncology.
2000;30:504-9.
157. Tweedle EM, Chaudhri S, Azadeh B, Rooney PS. Small, flat colorectal cancers in the UK
population: an analysis of resected specimens. Colorectal Dis. 2007 Sep;9(7):641-6.
158. Iiashi H TM, Tsutsui S, Imanishi K, Otani T, Okuda S, Ishiguro S, Taniguchi H. Early, depressed
adenocarcinomas of the large intestine. cancer. 1992 May 15, 1992;69(10):2406-10.
159. Suzuki N TI, Saunders BP. The prevalence of small, flat colorectal cancers in a western
population. Colorectal Diseases. 2004;6(1):15-20.
160. Gorgun E, Church J. Flat adenomas of the large bowel: a single endoscopist study. Dis Colon
Rectum. 2009 May;52(5):972-7.
161. Kubota O KI, Kimura T, Harada Y. Nonpolypoid adenomas and adenocarcinomas found in
background mucosa of surgically resected colons. Cancer. 1996 Feb 15;77(4):621-6.
162. Nasir A BD, Kaiser H, Bodey B, Diegel S, Crawley, Yeatmen T, Marcet J, Coppola D. Flat and
polypoid adenomacarcinomas of the colorectum: a comparative histomorphologic analysis of 47
cases. Hum Pathol. 2003;35(5):604-11.

Protein expression in colorectal cancer EM Tweedle
205
163. Chiu HM, Chang CY, Chen CC, Lee YC, Wu MS, Lin JT, et al. A prospective comparative study
of narrow-band imaging, chromoendoscopy, and conventional colonoscopy in the diagnosis of
colorectal neoplasia. Gut. 2006 Sep 27.
164. Kashida H, Kudo SE. Early colorectal cancer: concept, diagnosis, and management. Int J Clin
Oncol. 2006 Feb;11(1):1-8.
165. Uno Y MA, Tanaka M. The discrepancy of histologic diagnosis between flat early colon
cancers and flat adenomas. Gastrointest Endosc. 1994;40(1):1-6.
166. Schlemper RJ KT, et al. The Vienna Classification of gastrointestinal epithelial neoplasia.
GUT. 2000;47:251-5.
167. Adachi M MT, Okinaga K, Morioka Y. Clinicopathologic features of the flat adenoma. Dis
Colon Rectum. 1991;34(11):981-6.
168. Kaneko K KT, Makino R, Konishi K, Katagiri A, Kumekawa Y, HirayamaY, Yoneyama K,
Kushima M, Kusano M, Tajiri H, Rembacken BJ, Mitamura K, Imawari M. Pathological features and
genetic alterations in colorectal carcinomas with characteristics of nonpolypoid growth. B J Cancer.
2004;91:312-8.
169. JR J. Pathogenesis of colorectal cancer. Surg Clin North Am. 2002 Oct 2002;82(5):891-904.
170. Kasumi A KG, Takeda M. Observations of aggressive, small, flat and depressed colon cancer.
Report of three cases. Surg Endosc. 1994;9:690-4.
171. Umetani N SS, Masaki T, Watanabe T, Matsuda K, Muto T. Involvement of APC and K-ras
mutation in non-polypoid colorectal tumorigenesis. Br J Cancer. 1999;82(1):9-15.

Protein expression in colorectal cancer EM Tweedle
206
172. van Wyk R, Slezak P, Hayes VM, Buys CH, Kotze MJ, de Jong G, et al. Somatic mutations of
the APC, KRAS, and TP53 genes in nonpolypoid colorectal adenomas. Genes Chromosomes Cancer.
2000 Feb;27(2):202-8.
173. Mikami M, Nosho K, Yamamoto H, Takahashi T, Maehata T, Taniguchi H, et al. Mutational
analysis of beta-catenin and the RAS-RAF signalling pathway in early flat-type colorectal tumours.
Eur J Cancer. 2006 Nov;42(17):3065-72.
174. Yamagata S MT, Uchida Y, Masaki T, Higuchi Y, Sawada T, Hirooka T. Polypoid growth and k-
ras codon 12 mutation in colorectal cancer. Cancer. 1995 Feb 15;75(4):953-7.
175. Yamagata S MT, Uchida Y, Masaki T, Sawada T, Tsuno N, Hirooka T. Lower incidence of k-ras
codon 12 mutations in flat colorectal adenomas than in polypoid adenomas. Jpn J Cancer Res.
1994;85(2):147-51.
176. Takahashi T, Nosho K, Yamamoto H, Mikami M, Taniguchi H, Miyamoto N, et al. Flat-type
colorectal advanced adenomas (laterally spreading tumors) have different genetic and epigenetic
alterations from protruded-type advanced adenomas. Mod Pathol. 2007 Jan;20(1):139-47.
177. Nosho K, Yamamoto H, Takahashi T, Mikami M, Taniguchi H, Miyamoto N, et al. Genetic and
epigenetic profiling in early colorectal tumors and prediction of invasive potential in pT1 (early
invasive) colorectal cancers. Carcinogenesis. 2007 Jun;28(6):1364-70.
178. Noda H, Kato Y, Yoshikawa H, Arai M, Togashi K, Nagai H, et al. Frequent involvement of ras-
signalling pathways in both polypoid-type and flat-type early-stage colorectal cancers. J Exp Clin
Cancer Res. 2006 Jun;25(2):235-42.
179. Rubio CA RM. Mutation of p53 tumor suppressor gene in flat neoplastic lesions of the
colorectal mucosa. Dis Colon Rectum. 1996 Feb 1996;39(2):143-7.

Protein expression in colorectal cancer EM Tweedle
207
180. Yukawa M FT, Maeda S, Tabuchi M, Nagasako K. Comparative clinicopathological and
immunohistochemical study of ras and p53 in flat and polypoid type colorectal tumours. GUT. 1994
Sept;35(9):1258-61.
181. Postma C HM, Coffa J, Baak JPA, Muellar JD, Muellar E, Bethke B, Schouten JP, Stolte M,
Meijer GA. Chromosomal instability in flat adenomas and carcinomas of the colon. J Pathol.
2005;205:514-21.
182. Kinney T MN, Hart J, Joseph L, Waxman I. Microsatellite analysis of sporadic flat and
depressed lesions of the colon. Dig Dis and Sciences. 2005 Feb 2005;50(2):327-30.
183. Bradbury J. Proteomics: the next step after genomics? Lancet. 2000 Jul 1;356(9223):50.
184. Seliger B, Kellner R. Design of proteome-based studies in combination with serology for the
identification of biomarkers and novel targets. Proteomics. 2002;2:1641-51.
185. Goldsworthy SM, Stockton PS, Trempus CS, Foley JF, Maronpot RR, et al. Effects of fixation
on RNA extraction and amplification from laser microdissected tissue. Mol Carcinog. 1999;25:86-91.
186. Sgroi DC, Teng S, Robinson G, LeVangie R, Hudson JR Jr, Elkahloun AG. In vivo gene
expression profiling analysis. Canc Res. 1999;59:5656-61.
187. Gutstein HB, Morris JS. Laser capture sampling and analytical issues in proteomics. Expert
Rev Proteomics. 2007 Oct;4(5):627-37.
188. Lawrie LC, Curran S. Laser capture microdissection and colorectal cancer proteomics.
Methods Mol Biol. 2005;293:245-53.
189. Wang H, Owens JD, Shih JH, Li MC, Bonner RF, Mushinski JF. Histological staining methods
preparatory to laser capture microdissection significantly affect the integrity of the cellular RNA.
BMC Genomics. 2006;7:97.

Protein expression in colorectal cancer EM Tweedle
208
190. Herzenberg LA, Parks D, Sahaf B, Perez O, Roederer M. The history and future of the
fluorescence activated cell sorter and flow cytometry: a view from Stanford. Clin Chem. 2002
Oct;48(10):1819-27.
191. Hofmann A, Gerrits B, Schmidt A, Bock T, Bausch-Fluck D, Aebersold R, et al. Proteomic cell
surface phenotyping of differentiating acute myeloid leukemia cells. Blood. 2010 Sep
30;116(13):e26-34.
192. Dale G, Latner AL. Isoelectric focusing in polyacrylamide gels. Lancet. 1968 Apr
20;1(7547):847-8.
193. Steinberg TH. Protein gel staining methods: an introduction and overview. Methods
Enzymol. 2009;463:541-63.
194. Sorensen BK, Hojrup P, Ostergard E, Jorgensen CS, Enghild J, Ryder LR, et al. Silver staining of
proteins on electroblotting membranes and intensification of silver staining of proteins separated
by polyacrylamide gel electrophoresis. Anal Biochem. 2002 May 1;304(1):33-41.
195. Minden J. Comparative proteomics and difference gel electrophoresis. Biotechniques. 2007
Dec;43(6):739, 41, 43 passim.
196. Gharbi S, Gaffney P, Yang A, Zvelebil MJ, Cramer R, Waterfield MD, et al. Evaluation of two-
dimensional differential gel electrophoresis for proteomic expression analysis of a model breast
cancer cell system. Mol Cell Proteomics. 2002 Feb;1(2):91-8.
197. /Content/AA8BC1C492CE43D8C1257628001D34FD/$file/IPGPhor3_manual.pdf
GHEIIUMwgcaun. 2009.
198. Lopez JL. Two-dimensional electrophoresis in proteome expression analysis. J Chromatogr B
Analyt Technol Biomed Life Sci. 2007 Apr 15;849(1-2):190-202.

Protein expression in colorectal cancer EM Tweedle
209
199. Corthals GL, Wasinger VC, Hochstrasser DF, Sanchez JC. The dynamic range of protein
expression: a challenge for proteomic research. Electrophoresis. 2000 Apr;21(6):1104-15.
200. Gygi SP, Rist B, Gerber SA, Turecek F, Gelb MH, Aebersold R. Quantitative analysis of
complex protein mixtures using isotope-coded affinity tags. Nat Biotechnol. 1999 Oct;17(10):994-9.
201. Chen X, Sun L, Yu Y, Xue Y, Yang P. Amino acid-coded tagging approaches in quantitative
proteomics. Expert Rev Proteomics. 2007 Feb;4(1):25-37.
202. Boehm AM, Puetz S, Altenhofer D, Sickmann A, Falk M. Precise protein quantification based
on peptide quantification using iTRAQ. BMC Bioinformatics. 2007 Jun 21;8(1):214.
203. Wu WW, Wang G, Baek SJ, Shen RF. Comparative Study of Three Proteomic Quantitative
Methods, DIGE, cICAT, and iTRAQ, Using 2D Gel- or LC-MALDI TOF/TOF. J Proteome Res.
2006;5(3):651-8.
204. Yates JR, 3rd, Speicher S, Griffin PR, Hunkapiller T. Peptide mass maps: a highly informative
approach to protein identification. Anal Biochem. 1993 Nov 1;214(2):397-408.
205. Schuchardt S, Sickmann A. Protein identification using mass spectrometry: a method
overview. Exs. 2007;97:141-70.
206. Barrow MP, Burkitt WI, Derrick PJ. Principles of Fourier transform ion cyclotron resonance
mass spectrometry and its application in structural biology. Analyst. 2005 Jan;130(1):18-28.
207. Payne AH, Glish GL. Tandem mass spectrometry in quadrupole ion trap and ion cyclotron
resonance mass spectrometers. Methods Enzymol. 2005;402:109-48.
208. Kuramitsu Y, Nakamura K. Proteomic analysis of cancer tissues: shedding light on
carcinogenesis and possible biomarkers. Proteomics. 2006 Oct;6(20):5650-61.

Protein expression in colorectal cancer EM Tweedle
210
209. Bitarte N, Bandres E, Zarate R, Ramirez N, Garcia-Foncillas J. Moving forward in colorectal
cancer research, what proteomics has to tell. World J Gastroenterol. 2007 Nov 28;13(44):5813-21.
210. Duffy MJ, van Dalen A, Haglund C, Hansson L, Holinski-Feder E, Klapdor R, et al. Tumour
markers in colorectal cancer: European Group on Tumour Markers (EGTM) guidelines for clinical
use. Eur J Cancer. 2007 Jun;43(9):1348-60.
211. Duffy MJ, van Dalen A, Haglund C, Hansson L, Klapdor R, Lamerz R, et al. Clinical utility of
biochemical markers in colorectal cancer: European Group on Tumour Markers (EGTM) guidelines.
Eur J Cancer. 2003 Apr;39(6):718-27.
212. Renehan AG, Egger M, Saunders MP, O'Dwyer ST. Impact on survival of intensive follow up
after curative resection for colorectal cancer: systematic review and meta-analysis of randomised
trials. Bmj. 2002 Apr 6;324(7341):813.
213. Rosen M, Chan L, Beart RW, Jr., Vukasin P, Anthone G. Follow-up of colorectal cancer: a
meta-analysis. Dis Colon Rectum. 1998 Sep;41(9):1116-26.
214. Figueredo A, Rumble RB, Maroun J, Earle CC, Cummings B, McLeod R, et al. Follow-up of
patients with curatively resected colorectal cancer: a practice guideline. BMC Cancer. 2003 Oct
6;3:26.
215. Jeffery GM, Hickey BE, Hider P. Follow-up strategies for patients treated for non-metastatic
colorectal cancer. Cochrane Database Syst Rev. 2002(1):CD002200.
216. Bruinvels DJ, Stiggelbout AM, Klaassen MP, Kievit J, Dik J, Habbema F, et al. Follow-up after
colorectal cancer: current practice in The Netherlands. Eur J Surg. 1995 Nov;161(11):827-31.

Protein expression in colorectal cancer EM Tweedle
211
217. Perez RO, Sao Juliao GP, Habr-Gama A, Kiss D, Proscurshim I, Campos FG, et al. The role of
carcinoembriogenic antigen in predicting response and survival to neoadjuvant chemoradiotherapy
for distal rectal cancer. Dis Colon Rectum. 2009 Jun;52(6):1137-43.
218. Lee IK, Kim do H, Gorden DL, Lee YS, Sung NY, Park GS, et al. Prognostic value of CEA and CA
19-9 tumor markers combined with cytology from peritoneal fluid in colorectal cancer. Ann Surg
Oncol. 2009 Apr;16(4):861-70.
219. Duffy MJ. CA 19-9 as a marker for gastrointestinal cancers: a review. Ann Clin Biochem. 1998
May;35 ( Pt 3):364-70.
220. Nakayama T, Watanabe M, Teramoto T, Kitajima M. CA19-9 as a predictor of recurrence in
patients with colorectal cancer. J Surg Oncol. 1997 Dec;66(4):238-43.
221. Reiter W, Stieber P, Reuter C, Nagel D, Lau-Werner U, Lamerz R. Multivariate analysis of the
prognostic value of CEA and CA 19-9 serum levels in colorectal cancer. Anticancer Res. 2000 Nov-
Dec;20(6D):5195-8.
222. Filella X, Molina R, Pique JM, Garcia-Valdecasas JC, Grau JJ, Novell F, et al. Use of CA 19-9 in
the early detection of recurrences in colorectal cancer: comparison with CEA. Tumour Biol.
1994;15(1):1-6.
223. Carpelan-Holmstrom M, Haglund C, Lundin J, Jarvinen H, Roberts P. Pre-operative serum
levels of CA 242 and CEA predict outcome in colorectal cancer. Eur J Cancer. 1996 Jun;32A(7):1156-
61.
224. Hall NR, Finan PJ, Stephenson BM, Purves DA, Cooper EH. The role of CA-242 and CEA in
surveillance following curative resection for colorectal cancer. Br J Cancer. 1994 Sep;70(3):549-53.

Protein expression in colorectal cancer EM Tweedle
212
225. Lindmark G, Bergstrom R, Pahlman L, Glimelius B. The association of preoperative serum
tumour markers with Dukes' stage and survival in colorectal cancer. Br J Cancer. 1995
May;71(5):1090-4.
226. Treska V, Topolcan O, Stanislav K, Liska V, Holubec L. Preoperative tumor markers as
prognostic factors of colorectal liver metastases. Hepatogastroenterology. 2009 Mar-
Apr;56(90):317-20.
227. Chambers AF, Matrisian LM. Changing views of the role of matrix metalloproteinases in
metastasis. J Natl Cancer Inst. 1997 Sep 3;89(17):1260-70.
228. Holten-Andersen MN, Christensen IJ, Nielsen HJ, Stephens RW, Jensen V, Nielsen OH, et al.
Total levels of tissue inhibitor of metalloproteinases 1 in plasma yield high diagnostic sensitivity and
specificity in patients with colon cancer. Clin Cancer Res. 2002 Jan;8(1):156-64.
229. Longley DB, Harkin DP, Johnston PG. 5-fluorouracil: mechanisms of action and clinical
strategies. Nat Rev Cancer. 2003 May;3(5):330-8.
230. van Triest B, Pinedo HM, van Hensbergen Y, Smid K, Telleman F, Schoenmakers PS, et al.
Thymidylate synthase level as the main predictive parameter for sensitivity to 5-fluorouracil, but
not for folate-based thymidylate synthase inhibitors, in 13 nonselected colon cancer cell lines. Clin
Cancer Res. 1999 Mar;5(3):643-54.
231. Banerjee D, Mayer-Kuckuk P, Capiaux G, Budak-Alpdogan T, Gorlick R, Bertino JR. Novel
aspects of resistance to drugs targeted to dihydrofolate reductase and thymidylate synthase.
Biochim Biophys Acta. 2002 Jul 18;1587(2-3):164-73.
232. Popat S, Matakidou A, Houlston RS. Thymidylate synthase expression and prognosis in
colorectal cancer: a systematic review and meta-analysis. J Clin Oncol. 2004 Feb 1;22(3):529-36.

Protein expression in colorectal cancer EM Tweedle
213
233. Popat S, Hubner R, Houlston RS. Systematic review of microsatellite instability and
colorectal cancer prognosis. J Clin Oncol. 2005 Jan 20;23(3):609-18.
234. Buckowitz A, Knaebel HP, Benner A, Blaker H, Gebert J, Kienle P, et al. Microsatellite
instability in colorectal cancer is associated with local lymphocyte infiltration and low frequency of
distant metastases. Br J Cancer. 2005 May 9;92(9):1746-53.
235. Vogelstein B, Lane D, Levine AJ. Surfing the p53 network. Nature. 2000 Nov
16;408(6810):307-10.
236. Russo A, Bazan V, Iacopetta B, Kerr D, Soussi T, Gebbia N. The TP53 colorectal cancer
international collaborative study on the prognostic and predictive significance of p53 mutation:
influence of tumor site, type of mutation, and adjuvant treatment. J Clin Oncol. 2005 Oct
20;23(30):7518-28.
237. Noske A, Lipka S, Budczies J, Muller K, Loddenkemper C, Buhr HJ, et al. Combination of p53
expression and p21 loss has an independent prognostic impact on sporadic colorectal cancer. Oncol
Rep. 2009 Jul;22(1):3-9.
238. Andreyev HJ, Norman AR, Cunningham D, Oates J, Dix BR, Iacopetta BJ, et al. Kirsten ras
mutations in patients with colorectal cancer: the 'RASCAL II' study. Br J Cancer. 2001 Sep
1;85(5):692-6.
239. Shekouh AR, Thompson CC, Prime W, Campbell F, Hamlett J, Herrington CS, et al.
Application of laser capture microdissection combined with two-dimensional electrophoresis for
the discovery of differentially regulated proteins in pancreatic ductal adenocarcinoma. Proteomics.
2003 Oct;3(10):1988-2001.

Protein expression in colorectal cancer EM Tweedle
214
240. Yan JX, Wait R, Berkelman T, Harry RA, Westbrook JA, Wheeler CH, et al. A modified silver
staining protocol for visualization of proteins compatible with matrix-assisted laser
desorption/ionization and electrospray ionization-mass spectrometry. Electrophoresis. 2000
Nov;21(17):3666-72.
241. Blum H, Beier H, Grass H. Improved silver staining of plant proteins, RNA and DNA in
polyacrylamide gels. Electrophoresis. 1987;8:93-9.
242. Courchesne PL, Patterson SD. Identification of proteins by matrix-assisted laser
desorption/ionization mass spectrometry using peptide and fragment ion masses. Methods Mol
Biol. 1999;112:487-511.
243. Compton CC, Fielding LP, Burgart LJ, Conley B, Cooper HS, Hamilton SR, et al. Prognostic
factors in colorectal cancer. College of American Pathologists Consensus Statement 1999. Arch
Pathol Lab Med. 2000 Jul;124(7):979-94.
244. Cornford PA, Dodson AR, Parsons KF, Desmond AD, Woolfenden A, Fordham M, et al. Heat
shock protein expression independently predicts clinical outcome in prostate cancer. Cancer Res.
2000 Dec 15;60(24):7099-105.
245. Egeo A, Mazzocco M, Arrigo P, Vidal-Taboada JM, Oliva R, Pirola B, et al. Identification and
characterization of a new human gene encoding a small protein with high homology to the proline-
rich region of the SH3BGR gene. Biochem Biophys Res Commun. 1998 Jun 18;247(2):302-6.
246. Mazzocco M, Maffei M, Egeo A, Vergano A, Arrigo P, Di Lisi R, et al. The identification of a
novel human homologue of the SH3 binding glutamic acid-rich (SH3BGR) gene establishes a new
family of highly conserved small proteins related to Thioredoxin Superfamily. Gene. 2002 May
29;291(1-2):233-9.

Protein expression in colorectal cancer EM Tweedle
215
247. Khalil AA. Biomarker discovery: a proteomic approach for brain cancer profiling. Cancer Sci.
2007 Feb;98(2):201-13.
248. Xu C, Zheng P, Shen S, Xu Y, Wei L, Gao H, et al. NMR structure and regulated expression in
APL cell of human SH3BGRL3. FEBS Lett. 2005 May 23;579(13):2788-94.
249. Majid SM, Liss AS, You M, Bose HR. The suppression of SH3BGRL is important for v-Rel-
mediated transformation. Oncogene. 2006 Feb 2;25(5):756-68.
250. Immenschuh S, Baumgart-Vogt E. Peroxiredoxins, oxidative stress, and cell proliferation.
Antioxid Redox Signal. 2005 May-Jun;7(5-6):768-77.
251. Kalinina EV, Chernov NN, Saprin AN. Involvement of thio-, peroxi-, and glutaredoxins in
cellular redox-dependent processes. Biochemistry (Mosc). 2008 Dec;73(13):1493-510.
252. Fourquet S, Huang ME, D'Autreaux B, Toledano MB. The dual functions of thiol-based
peroxidases in H2O2 scavenging and signalling. Antioxid Redox Signal. 2008 Sep;10(9):1565-76.
253. Kim JH, Bogner PN, Baek SH, Ramnath N, Liang P, Kim HR, et al. Up-regulation of
peroxiredoxin 1 in lung cancer and its implication as a prognostic and therapeutic target. Clin
Cancer Res. 2008 Apr 15;14(8):2326-33.
254. Karihtala P, Mantyniemi A, Kang SW, Kinnula VL, Soini Y. Peroxiredoxins in breast carcinoma.
Clin Cancer Res. 2003 Aug 15;9(9):3418-24.
255. Noh DY, Ahn SJ, Lee RA, Kim SW, Park IA, Chae HZ. Overexpression of peroxiredoxin in
human breast cancer. Anticancer Res. 2001 May-Jun;21(3B):2085-90.
256. Soini Y, Kallio JP, Hirvikoski P, Helin H, Kellokumpu-Lehtinen P, Kang SW, et al.
Oxidative/nitrosative stress and peroxiredoxin 2 are associated with grade and prognosis of human
renal carcinoma. APMIS. 2006 May;114(5):329-37.

Protein expression in colorectal cancer EM Tweedle
216
257. Wu XY, Fu ZX, Wang XH. Peroxiredoxins in colorectal neoplasms. Histol Histopathol.
Oct;25(10):1297-303.
258. Fujita Y, Nakanishi T, Hiramatsu M, Mabuchi H, Miyamoto Y, Miyamoto A, et al. Proteomics-
based approach identifying autoantibody against peroxiredoxin VI as a novel serum marker in
esophageal squamous cell carcinoma. Clin Cancer Res. 2006 Nov 1;12(21):6415-20.
259. Schremmer B, Manevich Y, Feinstein SI, Fisher AB. Peroxiredoxins in the lung with emphasis
on peroxiredoxin VI. Subcell Biochem. 2007;44:317-44.
260. Chang XZ, Li DQ, Hou YF, Wu J, Lu JS, Di GH, et al. Identification of the functional role of
peroxiredoxin 6 in the progression of breast cancer. Breast Cancer Res. 2007;9(6):R76.
261. Baty JW, Hampton MB, Winterbourn CC. Proteomic detection of hydrogen peroxide-
sensitive thiol proteins in Jurkat cells. The Biochemical journal. 2005 Aug 1;389(Pt 3):785-95.
262. Taylor RP, Benjamin IJ. Small heat shock proteins: a new classification scheme in mammals. J
Mol Cell Cardiol. 2005 Mar;38(3):433-44.
263. Baler R, Dahl G, Voellmy R. Activation of human heat shock genes is accompanied by
oligomerization, modification, and rapid translocation of heat shock transcription factor HSF1. Mol
Cell Biol. 1993 Apr;13(4):2486-96.
264. Landry J, Lambert H, Zhou M, Lavoie JN, Hickey E, Weber LA, et al. Human HSP27 is
phosphorylated at serines 78 and 82 by heat shock and mitogen-activated kinases that recognize
the same amino acid motif as S6 kinase II. J Biol Chem. 1992 Jan 15;267(2):794-803.
265. Dorion S, Landry J. Activation of the mitogen-activated protein kinase pathways by heat
shock. Cell Stress Chaperones. 2002 Apr;7(2):200-6.

Protein expression in colorectal cancer EM Tweedle
217
266. Kampinga HH, Brunsting JF, Stege GJ, Burgman PW, Konings AW. Thermal protein
denaturation and protein aggregation in cells made thermotolerant by various chemicals: role of
heat shock proteins. Exp Cell Res. 1995 Aug;219(2):536-46.
267. Arya R, Mallik M, Lakhotia SC. Heat shock genes - integrating cell survival and death. J Biosci.
2007 Apr;32(3):595-610.
268. Charette SJ, Lavoie JN, Lambert H, Landry J. Inhibition of Daxx-mediated apoptosis by heat
shock protein 27. Mol Cell Biol. 2000 Oct;20(20):7602-12.
269. Bryantsev AL, Kurchashova SY, Golyshev SA, Polyakov VY, Wunderink HF, Kanon B, et al.
Regulation of stress-induced intracellular sorting and chaperone function of Hsp27 (HspB1) in
mammalian cells. Biochem J. 2007 Nov 1;407(3):407-17.
270. Pivovarova AV, Chebotareva NA, Chernik IS, Gusev NB, Levitsky DI. Small heat shock protein
Hsp27 prevents heat-induced aggregation of F-actin by forming soluble complexes with denatured
actin. Febs J. 2007 Nov;274(22):5937-48.
271. Ciocca DR, Calderwood SK. Heat shock proteins in cancer: diagnostic, prognostic, predictive,
and treatment implications. Cell Stress Chaperones. 2005 Summer;10(2):86-103.
272. Wartenberg M, Donmez F, Ling FC, Acker H, Hescheler J, Sauer H. Tumor-induced
angiogenesis studied in confrontation cultures of multicellular tumor spheroids and embryoid
bodies grown from pluripotent embryonic stem cells. Faseb J. 2001 Apr;15(6):995-1005.
273. Tang D, Khaleque MA, Jones EL, Theriault JR, Li C, Wong WH, et al. Expression of heat shock
proteins and heat shock protein messenger ribonucleic acid in human prostate carcinoma in vitro
and in tumors in vivo. Cell Stress Chaperones. 2005 Spring;10(1):46-58.

Protein expression in colorectal cancer EM Tweedle
218
274. Calderwood SK, Khaleque MA, Sawyer DB, Ciocca DR. Heat shock proteins in cancer:
chaperones of tumorigenesis. Trends Biochem Sci. 2006 Mar;31(3):164-72.
275. Wu G, Osada M, Guo Z, Fomenkov A, Begum S, Zhao M, et al. DeltaNp63alpha up-regulates
the Hsp70 gene in human cancer. Cancer Res. 2005 Feb 1;65(3):758-66.
276. Locker GY, Hamilton S, Harris J, Jessup JM, Kemeny N, Macdonald JS, et al. ASCO 2006
Update of Recommendations for the Use of Tumor Markers in Gastrointestinal Cancer. J Clin Oncol.
2006 November 20, 2006;24(33):5313-27.
277. Khaleque MA, Bharti A, Sawyer D, Gong J, Benjamin IJ, Stevenson MA, et al. Induction of
heat shock proteins by heregulin beta1 leads to protection from apoptosis and anchorage-
independent growth. Oncogene. 2005 Sep 29;24(43):6564-73.
278. Tsigris C, Karayiannakis AJ, Zbar A, Syrigos KN, Baibas N, Diamantis T, et al. Clinical
significance of serum and urinary c-erbB-2 levels in colorectal cancer. Cancer Lett. 2002 Oct
28;184(2):215-22.
279. Taira T, Sawai M, Ikeda M, Tamai K, Iguchi-Ariga SM, Ariga H. Cell cycle-dependent switch of
up-and down-regulation of human hsp70 gene expression by interaction between c-Myc and
CBF/NF-Y. J Biol Chem. 1999 Aug 20;274(34):24270-9.
280. Medical Research Council Preliminary results of CRO7 trial. J Clin Oncol. 2003;6((Suppl.
18)):S3511.
281. Carrato A. Adjuvant treatment of colorectal cancer. Gastrointest Cancer Res. 2008 Jul;2(4
Suppl):S42-6.

Protein expression in colorectal cancer EM Tweedle
219
282. Gillett GT, Fox MF, Rowe PS, Casimir CM, Povey S. Mapping of human non-muscle type
cofilin (CFL1) to chromosome 11q13 and muscle-type cofilin (CFL2) to chromosome 14. Annals of
human genetics. 1996 May;60(Pt 3):201-11.
283. Moriyama K, Iida K, Yahara I. Phosphorylation of Ser-3 of cofilin regulates its essential
function on actin. Genes Cells. 1996 Jan;1(1):73-86.
284. Kueh HY, Brieher WM, Mitchison TJ. Dynamic stabilization of actin filaments. Proceedings of
the National Academy of Sciences of the United States of America. 2008 Oct 28;105(43):16531-6.
285. Bamburg JR, McGough A, Ono S. Putting a new twist on actin: ADF/cofilins modulate actin
dynamics. Trends in cell biology. 1999 Sep;9(9):364-70.
286. Moon A, Drubin DG. The ADF/cofilin proteins: stimulus-responsive modulators of actin
dynamics. Molecular biology of the cell. 1995 Nov;6(11):1423-31.
287. Van Troys M, Huyck L, Leyman S, Dhaese S, Vandekerkhove J, Ampe C. Ins and outs of
ADF/cofilin activity and regulation. European journal of cell biology. 2008 Sep;87(8-9):649-67.
288. DesMarais V, Macaluso F, Condeelis J, Bailly M. Synergistic interaction between the Arp2/3
complex and cofilin drives stimulated lamellipod extension. Journal of cell science. 2004 Jul
15;117(Pt 16):3499-510.
289. Theriot JA. Accelerating on a treadmill: ADF/cofilin promotes rapid actin filament turnover in
the dynamic cytoskeleton. The Journal of cell biology. 1997 Mar 24;136(6):1165-8.
290. Song X, Chen X, Yamaguchi H, Mouneimne G, Condeelis JS, Eddy RJ. Initiation of cofilin
activity in response to EGF is uncoupled from cofilin phosphorylation and dephosphorylation in
carcinoma cells. Journal of cell science. 2006 Jul 15;119(Pt 14):2871-81.

Protein expression in colorectal cancer EM Tweedle
220
291. van Rheenen J, Condeelis J, Glogauer M. A common cofilin activity cycle in invasive tumor
cells and inflammatory cells. Journal of cell science. 2009 Feb 1;122(Pt 3):305-11.
292. Jovceva E, Larsen MR, Waterfield MD, Baum B, Timms JF. Dynamic cofilin phosphorylation in
the control of lamellipodial actin homeostasis. Journal of cell science. 2007 Jun 1;120(Pt 11):1888-
97.
293. Turhani D, Krapfenbauer K, Thurnher D, Langen H, Fountoulakis M. Identification of
differentially expressed, tumor-associated proteins in oral squamous cell carcinoma by proteomic
analysis. Electrophoresis. 2006 Apr;27(7):1417-23.
294. Smith-Beckerman DM, Fung KW, Williams KE, Auersperg N, Godwin AK, Burlingame AL.
Proteome changes in ovarian epithelial cells derived from women with BRCA1 mutations and family
histories of cancer. Mol Cell Proteomics. 2005 Feb;4(2):156-68.
295. Unwin RD, Craven RA, Harnden P, Hanrahan S, Totty N, Knowles M, et al. Proteomic changes
in renal cancer and co-ordinate demonstration of both the glycolytic and mitochondrial aspects of
the Warburg effect. Proteomics. 2003 Aug;3(8):1620-32.
296. Dowling P, Meleady P, Dowd A, Henry M, Glynn S, Clynes M. Proteomic analysis of isolated
membrane fractions from superinvasive cancer cells. Biochimica et biophysica acta. 2007
Jan;1774(1):93-101.
297. Sinha P, Hutter G, Kottgen E, Dietel M, Schadendorf D, Lage H. Increased expression of
epidermal fatty acid binding protein, cofilin, and 14-3-3-sigma (stratifin) detected by two-
dimensional gel electrophoresis, mass spectrometry and microsequencing of drug-resistant human
adenocarcinoma of the pancreas. Electrophoresis. 1999 Oct;20(14):2952-60.

Protein expression in colorectal cancer EM Tweedle
221
298. Keshamouni VG, Michailidis G, Grasso CS, Anthwal S, Strahler JR, Walker A, et al. Differential
protein expression profiling by iTRAQ-2DLC-MS/MS of lung cancer cells undergoing epithelial-
mesenchymal transition reveals a migratory/invasive phenotype. Journal of proteome research.
2006 May;5(5):1143-54.
299. Estornes Y, Gay F, Gevrey JC, Navoizat S, Nejjari M, Scoazec JY, et al. Differential
involvement of destrin and cofilin-1 in the control of invasive properties of Isreco1 human colon
cancer cells. International journal of cancer. 2007 Nov 15;121(10):2162-71.
300. Ding SJ, Li Y, Shao XX, Zhou H, Zeng R, Tang ZY, et al. Proteome analysis of hepatocellular
carcinoma cell strains, MHCC97-H and MHCC97-L, with different metastasis potentials. Proteomics.
2004 Apr;4(4):982-94.
301. Lee YJ, Mazzatti DJ, Yun Z, Keng PC. Inhibition of invasiveness of human lung cancer cell line
H1299 by over-expression of cofilin. Cell biology international. 2005 Nov;29(11):877-83.
302. van Rheenen J, Song X, van Roosmalen W, Cammer M, Chen X, Desmarais V, et al. EGF-
induced PIP2 hydrolysis releases and activates cofilin locally in carcinoma cells. The Journal of cell
biology. 2007 Dec 17;179(6):1247-59.
303. Wang W, Eddy R, Condeelis J. The cofilin pathway in breast cancer invasion and metastasis.
Nature reviews. 2007 Jun;7(6):429-40.
304. Yan B, Yap CT, Wang S, Lee CK, Koh S, Omar MF, et al. Cofilin immunolabelling correlates
with depth of invasion in gastrointestinal endocrine cell tumors. Acta histochemica. 2008 Nov 10.
305. Roth J, Vogl T, Sorg C, Sunderkotter C. Phagocyte-specific S100 proteins: a novel group of
proinflammatory molecules. Trends Immunol. 2003 Apr;24(4):155-8.

Protein expression in colorectal cancer EM Tweedle
222
306. Nacken W, Roth J, Sorg C, Kerkhoff C. S100A9/S100A8: Myeloid representatives of the S100
protein family as prominent players in innate immunity. Microsc Res Tech. 2003 Apr 15;60(6):569-
80.
307. Coussens LM, Werb Z. Inflammation and cancer. Nature. 2002 Dec 19-26;420(6917):860-7.
308. De Palma M, Venneri MA, Galli R, Sergi Sergi L, Politi LS, Sampaolesi M, et al. Tie2 identifies
a hematopoietic lineage of proangiogenic monocytes required for tumor vessel formation and a
mesenchymal population of pericyte progenitors. Cancer Cell. 2005 Sep;8(3):211-26.
309. Zwadlo G, Bruggen J, Gerhards G, Schlegel R, Sorg C. Two calcium-binding proteins
associated with specific stages of myeloid cell differentiation are expressed by subsets of
macrophages in inflammatory tissues. Clin Exp Immunol. 1988 Jun;72(3):510-5.
310. Ghavami S, Rashedi I, Dattilo BM, Eshraghi M, Chazin WJ, Hashemi M, et al. S100A8/A9 at
low concentration promotes tumor cell growth via RAGE ligation and MAP kinase-dependent
pathway. J Leukoc Biol. 2008 Mar 13.
311. Ueno H, Jones AM, Wilkinson KH, Jass JR, Talbot IC. Histological categorisation of fibrotic
cancer stroma in advanced rectal cancer. Gut. 2004 Apr;53(4):581-6.
312. Sica A, Allavena P, Mantovani A. Cancer related inflammation: The macrophage connection.
Cancer Lett. 2008 Apr 28.
313. Forssell J, Oberg A, Henriksson ML, Stenling R, Jung A, Palmqvist R. High macrophage
infiltration along the tumor front correlates with improved survival in colon cancer. Clin Cancer Res.
2007 Mar 1;13(5):1472-9.
314. Bacman D, Merkel S, Croner R, Papadopoulos T, Brueckl W, Dimmler A. TGF-beta receptor 2
downregulation in tumour-associated stroma worsens prognosis and high-grade tumours show

Protein expression in colorectal cancer EM Tweedle
223
more tumour-associated macrophages and lower TGF-beta1 expression in colon carcinoma: a
retrospective study. BMC Cancer. 2007;7:156.
315. Tsujino T, Seshimo I, Yamamoto H, Ngan CY, Ezumi K, Takemasa I, et al. Stromal
myofibroblasts predict disease recurrence for colorectal cancer. Clin Cancer Res. 2007 Apr
1;13(7):2082-90.
316. Lewis CE, Pollard JW. Distinct role of macrophages in different tumor microenvironments.
Cancer Res. 2006 Jan 15;66(2):605-12.
317. Xie W, Rimm DL, Lin Y, Shih WJ, Reiss M. Loss of Smad signalling in human colorectal cancer
is associated with advanced disease and poor prognosis. Cancer J. 2003 Jul-Aug;9(4):302-12.
318. Tanaka T, Watanabe T, Kazama Y, Tanaka J, Kanazawa T, Kazama S, et al. Chromosome 18q
deletion and Smad4 protein inactivation correlate with liver metastasis: A study matched for T- and
N- classification. Br J Cancer. 2006 Dec 4;95(11):1562-7.
319. Banks RE, Dunn MJ, Forbes MA, Stanley A, Pappin D, Naven T, et al. The potential use of
laser capture microdissection to selectively obtain distinct populations of cells for proteomic
analysis--preliminary findings. Electrophoresis. 1999 Apr-May;20(4-5):689-700.
320. Deng G, Li D, Xiao Z, Li C, Yao H, Peng F, et al. [Comparative proteome analysis of laser
capture microdissection for purified primary tumor and lymph node metastatic tumor in human
lung squamous carcinoma]. Zhong Nan Da Xue Xue Bao Yi Xue Ban. 2009 Dec;34(12):1182-8.
321. Li XM, Huang WG, Yi H, Cheng AL, Xiao ZQ. Proteomic analysis to identify cytokeratin 18 as a
novel biomarker of nasopharyngeal carcinoma. J Cancer Res Clin Oncol. 2009 Dec;135(12):1763-75.

Protein expression in colorectal cancer EM Tweedle
224
322. Li Q, Li YL, Yang XY, Zhang HY, Li HM. [Two-dimensional gel electrophoresis profiles of
human normal prostate cells successfully established by 2-DE coupled with laser capture
microdissection]. Zhonghua Nan Ke Xue. 2007 Dec;13(12):1064-7.
323. Cheng Y, Zhang J, Li Y, Wang Y, Gong J. Proteome analysis of human gastric cardia
adenocarcinoma by laser capture microdissection. BMC Cancer. 2007;7:191.
324. Neubauer H, Clare SE, Kurek R, Fehm T, Wallwiener D, Sotlar K, et al. Breast cancer
proteomics by laser capture microdissection, sample pooling, 54-cm IPG IEF, and differential iodine
radioisotope detection. Electrophoresis. 2006 May;27(9):1840-52.
325. Wang Y, Antonopoulos DA, Zhu X, Harrell L, Hanan I, Alverdy JC, et al. Laser capture
microdissection and metagenomic analysis of intact mucosa-associated microbial communities of
human colon. Appl Microbiol Biotechnol. Dec;88(6):1333-42.
326. Marselli L, Thorne J, Dahiya S, Sgroi DC, Sharma A, Bonner-Weir S, et al. Gene expression
profiles of Beta-cell enriched tissue obtained by laser capture microdissection from subjects with
type 2 diabetes. PLoS One.5(7):e11499.
327. Hodges KB, Cummings OW, Saxena R, Wang M, Zhang S, Lopez-Beltran A, et al. Clonal origin
of multifocal hepatocellular carcinoma. Cancer. Sep 1;116(17):4078-85.
328. Spisak S, Kalmar A, Galamb O, Sipos F, Wichmann B, Molnar B, et al. [Identification of
methylation related genes from laser capture microdissected colon samples during investigation of
adenoma-carcinoma sequence]. Orv Hetil. May 16;151(20):805-14.
329. Lee HJ, Nam KT, Park HS, Kim MA, Lafleur BJ, Aburatani H, et al. Gene expression profiling of
metaplastic lineages identifies CDH17 as a prognostic marker in early stage gastric cancer.
Gastroenterology. Jul;139(1):213-25 e3.

Protein expression in colorectal cancer EM Tweedle
225
330. Risk MC, Knudsen BS, Coleman I, Dumpit RF, Kristal AR, Lemeur N, et al. Differential gene
expression in benign prostate epithelium of men with and without prostate cancer: evidence for a
prostate cancer field effect. Clin Cancer Res. Nov 15;16(22):5414-23.
331. Miki Y, Suzuki T, Abe K, Suzuki S, Niikawa H, Iida S, et al. Intratumoral localization of
aromatase and interaction between stromal and parenchymal cells in the non-small cell lung
carcinoma microenvironment. Cancer Res. Aug 15;70(16):6659-69.
332. Jimenez CR, Knol JC, Meijer GA, Fijneman RJ. Proteomics of colorectal cancer: overview of
discovery studies and identification of commonly identified cancer-associated proteins and
candidate CRC serum markers. J Proteomics. Sep 10;73(10):1873-95.
333. Petrak J, Ivanek R, Toman O, Cmejla R, Cmejlova J, Vyoral D, et al. Deja vu in proteomics. A
hit parade of repeatedly identified differentially expressed proteins. Proteomics. 2008
May;8(9):1744-9.
334. Pei H, Zhu H, Zeng S, Li Y, Yang H, Shen L, et al. Proteome analysis and tissue microarray for
profiling protein markers associated with lymph node metastasis in colorectal cancer. J Proteome
Res. 2007 Jul;6(7):2495-501.
335. Ying-Tao Z, Yi-Ping G, Lu-Sheng S, Yi-Li W. Proteomic analysis of differentially expressed
proteins between metastatic and non-metastatic human colorectal carcinoma cell lines. Eur J
Gastroenterol Hepatol. 2005 Jul;17(7):725-32.
336. Tzankov A, Went P, Zimpfer A, Dirnhofer S. Tissue microarray technology: principles, pitfalls
and perspectives--lessons learned from hematological malignancies. Exp Gerontol. 2005 Aug-
Sep;40(8-9):737-44.

Protein expression in colorectal cancer EM Tweedle
226
337. Zhao L, Liu L, Wang S, Zhang YF, Yu L, Ding YQ. Differential proteomic analysis of human
colorectal carcinoma cell lines metastasis-associated proteins. J Cancer Res Clin Oncol. 2007
Oct;133(10):771-82.
338. Frattini M, Balestra D, Suardi S, Oggionni M, Alberici P, Radice P, et al. Different genetic
features associated with colon and rectal carcinogenesis. Clin Cancer Res. 2004 Jun 15;10(12 Pt
1):4015-21.
339. Kurahashi T, Miyake H, Hara I, Fujisawa M. Expression of major heat shock proteins in
prostate cancer: correlation with clinicopathological outcomes in patients undergoing radical
prostatectomy. J Urol. 2007 Feb;177(2):757-61.
340. Foster CS, Dodson AR, Ambroisine L, Fisher G, Moller H, Clark J, et al. Hsp-27 expression at
diagnosis predicts poor clinical outcome in prostate cancer independent of ETS-gene
rearrangement. Br J Cancer. 2009 Oct 6;101(7):1137-44.
341. Thor A, Benz C, Moore D, 2nd, Goldman E, Edgerton S, Landry J, et al. Stress response
protein (srp-27) determination in primary human breast carcinomas: clinical, histologic, and
prognostic correlations. J Natl Cancer Inst. 1991 Feb 6;83(3):170-8.
342. Oesterreich S, Hilsenbeck SG, Ciocca DR, Allred DC, Clark GM, Chamness GC, et al. The small
heat shock protein HSP27 is not an independent prognostic marker in axillary lymph node-negative
breast cancer patients. Clin Cancer Res. 1996 Jul;2(7):1199-206.
343. Tetu B, Brisson J, Landry J, Huot J. Prognostic significance of heat-shock protein-27 in node-
positive breast carcinoma: an immunohistochemical study. Breast Cancer Res Treat. 1995;36(1):93-
7.

Protein expression in colorectal cancer EM Tweedle
227
344. Langdon SP, Rabiasz GJ, Hirst GL, King RJ, Hawkins RA, Smyth JF, et al. Expression of the heat
shock protein HSP27 in human ovarian cancer. Clin Cancer Res. 1995 Dec;1(12):1603-9.
345. Kapranos N, Kominea A, Konstantinopoulos PA, Savva S, Artelaris S, Vandoros G, et al.
Expression of the 27-kDa heat shock protein (HSP27) in gastric carcinomas and adjacent normal,
metaplastic, and dysplastic gastric mucosa, and its prognostic significance. J Cancer Res Clin Oncol.
2002 Aug;128(8):426-32.
346. King KL, Li AF, Chau GY, Chi CW, Wu CW, Huang CL, et al. Prognostic significance of heat
shock protein-27 expression in hepatocellular carcinoma and its relation to histologic grading and
survival. Cancer. 2000 Jun 1;88(11):2464-70.
347. Rau B, Gaestel M, Wust P, Stahl J, Mansmann U, Schlag PM, et al. Preoperative treatment of
rectal cancer with radiation, chemotherapy and hyperthermia: analysis of treatment efficacy and
heat-shock response. Radiat Res. 1999 Apr;151(4):479-88.
348. Xu L, Chen S, Bergan RC. MAPKAPK2 and HSP27 are downstream effectors of p38 MAP
kinase-mediated matrix metalloproteinase type 2 activation and cell invasion in human prostate
cancer. Oncogene. 2006 May 18;25(21):2987-98.
349. Tak H, Jang E, Kim SB, Park J, Suk J, Yoon YS, et al. 14-3-3epsilon inhibits MK5-mediated cell
migration by disrupting F-actin polymerization. Cell Signal. 2007 Nov;19(11):2379-87.
350. Guo K, Kang NX, Li Y, Sun L, Gan L, Cui FJ, et al. Regulation of HSP27 on NF-kappaB pathway
activation may be involved in metastatic hepatocellular carcinoma cells apoptosis. BMC cancer.
2009;9:100.

Protein expression in colorectal cancer EM Tweedle
228
351. Rocchi P, Jugpal P, So A, Sinneman S, Ettinger S, Fazli L, et al. Small interference RNA
targeting heat-shock protein 27 inhibits the growth of prostatic cell lines and induces apoptosis via
caspase-3 activation in vitro. BJU Int. 2006 Nov;98(5):1082-9.
352. Kamada M, So A, Muramaki M, Rocchi P, Beraldi E, Gleave M. Hsp27 knockdown using
nucleotide-based therapies inhibit tumor growth and enhance chemotherapy in human bladder
cancer cells. Mol Cancer Ther. 2007 Jan;6(1):299-308.
353. Wong CS, Wong VW, Chan CM, Ma BB, Hui EP, Wong MC, et al. Identification of 5-
fluorouracil response proteins in colorectal carcinoma cell line SW480 by two-dimensional
electrophoresis and MALDI-TOF mass spectrometry. Oncol Rep. 2008 Jul;20(1):89-98.
354. Choi DH, Ha JS, Lee WH, Song JK, Kim GY, Park JH, et al. Heat shock protein 27 is associated
with irinotecan resistance in human colorectal cancer cells. FEBS Lett. 2007 Apr 17;581(8):1649-56.
355. Tsuruta M, Nishibori H, Hasegawa H, Ishii Y, Endo T, Kubota T, et al. Heat shock protein 27, a
novel regulator of 5-fluorouracil resistance in colon cancer. Oncol Rep. 2008 Nov;20(5):1165-72.
356. Aloy MT, Hadchity E, Bionda C, Diaz-Latoud C, Claude L, Rousson R, et al. Protective role of
Hsp27 protein against gamma radiation-induced apoptosis and radiosensitization effects of Hsp27
gene silencing in different human tumor cells. Int J Radiat Oncol Biol Phys. 2008 Feb 1;70(2):543-53.
357. Hadchity E, Aloy MT, Paulin C, Armandy E, Watkin E, Rousson R, et al. Heat shock protein 27
as a new therapeutic target for radiation sensitization of head and neck squamous cell carcinoma.
Mol Ther. 2009 Aug;17(8):1387-94.
358. Baker AF, Dragovich T, Ihle NT, Williams R, Fenoglio-Preiser C, Powis G. Stability of
phosphoprotein as a biological marker of tumor signalling. Clin Cancer Res. 2005 Jun
15;11(12):4338-40.

Protein expression in colorectal cancer EM Tweedle
229
359. Burns JA, Li Y, Cheney CA, Ou Y, Franlin-Pfeifer LL, Kuklin N, et al. Choice of fixative is crucial
to successful immunohistochemical detection of phosphoproteins in paraffin-embedded tumor
tissues. J Histochem Cytochem. 2009 Mar;57(3):257-64.
360. Shen J, Person MD, Zhu J, Abbruzzese JL, Li D. Protein expression profiles in pancreatic
adenocarcinoma compared with normal pancreatic tissue and tissue affected by pancreatitis as
detected by two-dimensional gel electrophoresis and mass spectrometry. Cancer Res. 2004 Dec
15;64(24):9018-26.
361. Cross SS, Hamdy FC, Deloulme JC, Rehman I. Expression of S100 proteins in normal human
tissues and common cancers using tissue microarrays: S100A6, S100A8, S100A9 and S100A11 are all
overexpressed in common cancers. Histopathology. 2005 Mar;46(3):256-69.
362. Hermani A, Hess J, De Servi B, Medunjanin S, Grobholz R, Trojan L, et al. Calcium-binding
proteins S100A8 and S100A9 as novel diagnostic markers in human prostate cancer. Clin Cancer
Res. 2005 Jul 15;11(14):5146-52.
363. Tolson JP, Flad T, Gnau V, Dihazi H, Hennenlotter J, Beck A, et al. Differential detection of
S100A8 in transitional cell carcinoma of the bladder by pair wise tissue proteomic and
immunohistochemical analysis. Proteomics. 2006;6(2):697-708.
364. Stulik J, Osterreicher J, Koupilova K, Knizek J, Macela A, Bures J, et al. The analysis of S100A9
and S100A8 expression in matched sets of macroscopically normal colon mucosa and colorectal
carcinoma: The S100A9 and S100A8 positive cells underlie and invade tumour mass.
Electrophoresis. 1999;20:1047-54.
365. Foell D, Frosch M, Sorg C, Roth J. Phagocyte-specific calcium-binding S100 proteins as
clinical laboratory markers of inflammation. Clin Chim Acta. 2004 Jun;344(1-2):37-51.

Protein expression in colorectal cancer EM Tweedle
230
366. Kerkhoff C, Klempt M, Sorg C. Novel insights into structure and function of MRP8 (S100A8)
and MRP14 (S100A9). Biochim Biophys Acta. 1998 Dec 10;1448(2):200-11.
367. Gebhardt C, Nemeth J, Angel P, Hess J. S100A8 and S100A9 in inflammation and cancer.
Biochem Pharmacol. 2006 Nov 30;72(11):1622-31.
368. Bingle L, Brown NJ, Lewis CE. The role of tumour-associated macrophages in tumour
progression: implications for new anticancer therapies. J Pathol. 2002 Mar;196(3):254-65.
369. Atreya I, Neurath MF. Immune cells in colorectal cancer: prognostic relevance and
therapeutic strategies. Expert Rev Anticancer Ther. 2008 Apr;8(4):561-72.
370. Nagorsen D, Voigt S, Berg E, Stein H, Thiel E, Loddenkemper C. Tumor-infiltrating
macrophages and dendritic cells in human colorectal cancer: relation to local regulatory T cells,
systemic T-cell response against tumor-associated antigens and survival. J Transl Med. 2007;5:62.
371. Lewis CE, De Palma M, Naldini L. Tie2-expressing monocytes and tumor angiogenesis:
regulation by hypoxia and angiopoietin-2. Cancer Res. 2007 Sep 15;67(18):8429-32.
372. Ludwig S, Stephan C, Lein M, Loening SA, Jung K. S100A8, S100A9, and the S100A8/A9
complex in circulating blood are not associated with prostate cancer risk-A re-evaluation study.
Prostate. 2007 Sep 1;67(12):1301-7.
373. Isaksson-Mettavainio M, Palmqvist R, Forssell J, Stenling R, Oberg A. SMAD4/DPC4
expression and prognosis in human colorectal cancer. Anticancer Res. 2006 Jan-Feb;26(1B):507-10.
374. Tanaka T, Watanabe T, Kazama Y, Tanaka J, Kanazawa T, Kazama S, et al. Loss of Smad4
protein expression and 18qLOH as molecular markers indicating lymph node metastasis in
colorectal cancer--a study matched for tumor depth and pathology. J Surg Oncol. 2008 Jan
1;97(1):69-73.

Protein expression in colorectal cancer EM Tweedle
231
375. Kawakami M, Yamaguchi T, Takahashi K, Matsumoto H, Yasutome M, Horiguchi S, et al.
Assessment of SMAD4, p53, and Ki-67 alterations as a predictor of liver metastasis in human
colorectal cancer. Surg Today. Mar;40(3):245-50.
376. Losi L, Bouzourene H, Benhattar J. Loss of Smad4 expression predicts liver metastasis in
human colorectal cancer. Oncol Rep. 2007 May;17(5):1095-9.
377. Popat S, Houlston RS. A systematic review and meta-analysis of the relationship between
chromosome 18q genotype, DCC status and colorectal cancer prognosis. Eur J Cancer. 2005
Sep;41(14):2060-70.
378. Zhou W, Goodman SN, Galizia G, Lieto E, Ferraraccio F, Pignatelli C, et al. Counting alleles to
predict recurrence of early-stage colorectal cancers. Lancet. 2002 Jan 19;359(9302):219-25.
379. Schwarte-Waldhoff I, Volpert OV, Bouck NP, Sipos B, Hahn SA, Klein-Scory S, et al.
Smad4/DPC4-mediated tumor suppression through suppression of angiogenesis. Proc Natl Acad Sci
U S A. 2000 Aug 15;97(17):9624-9.
380. Schwarte-Waldhoff I, Schmiegel W. Smad4 transcriptional pathways and angiogenesis. Int J
Gastrointest Cancer. 2002;31(1-3):47-59.
381. Levy L, Hill CS. Smad4 dependency defines two classes of transforming growth factor {beta}
(TGF-{beta}) target genes and distinguishes TGF-{beta}-induced epithelial-mesenchymal transition
from its antiproliferative and migratory responses. Mol Cell Biol. 2005 Sep;25(18):8108-25.
382. Volmer MW, Radacz Y, Hahn SA, Klein-Scory S, Stuhler K, Zapatka M, et al. Tumor suppressor
Smad4 mediates downregulation of the anti-adhesive invasion-promoting matricellular protein
SPARC: Landscaping activity of Smad4 as revealed by a "secretome" analysis. Proteomics. 2004
May;4(5):1324-34.

Protein expression in colorectal cancer EM Tweedle
232
383. Podhajcer OL, Benedetti L, Girotti MR, Prada F, Salvatierra E, Llera AS. The role of the
matricellular protein SPARC in the dynamic interaction between the tumor and the host. Cancer
Metastasis Rev. 2008 May 6.
384. Volmer MW, Stuhler K, Zapatka M, Schoneck A, Klein-Scory S, Schmiegel W, et al.
Differential proteome analysis of conditioned media to detect Smad4 regulated secreted
biomarkers in colon cancer. Proteomics. 2005 Jul;5(10):2587-601.
385. Rahimi F, Hsu K, Endoh Y, Geczy CL. FGF-2, IL-1beta and TGF-beta regulate fibroblast
expression of S100A8. Febs J. 2005 Jun;272(11):2811-27.
386. Hiratsuka S, Watanabe A, Aburatani H, Maru Y. Tumour-mediated upregulation of
chemoattractants and recruitment of myeloid cells predetermines lung metastasis. Nat Cell Biol.
2006 Dec;8(12):1369-75.
387. Ghavami S, Kerkhoff C, Los M, Hashemi M, Sorg C, Karami-Tehrani F. Mechanism of
apoptosis induced by S100A8/A9 in colon cancer cell lines: the role of ROS and the effect of metal
ions. J Leukoc Biol. 2004 Jul;76(1):169-75.
388. Hermani A, De Servi B, Medunjanin S, Tessier PA, Mayer D. S100A8 and S100A9 activate
MAP kinase and NF-[kappa]B signalling pathways and trigger translocation of RAGE in human
prostate cancer cells. Experimental Cell Research. 2006;312(2):184-97.
389. Karin M, Greten FR. NF-kappaB: linking inflammation and immunity to cancer development
and progression. Nat Rev Immunol. 2005 Oct;5(10):749-59.
390. Salama P, Platell C. Host response to colorectal cancer. ANZ J Surg. 2008 Sep;78(9):745-53.
391. Galon J, Fridman WH, Pages F. The adaptive immunologic microenvironment in colorectal
cancer: a novel perspective. Cancer Res. 2007 Mar 1;67(5):1883-6.

Protein expression in colorectal cancer EM Tweedle
233


![[Script Excerpts] - WordPress.com Cast Cheshire Cat Small Alice Alice Tall Alice Teacher Rabbit Caterpillar Mad Hatter Hare Rose Lily Violet Tweedle Dum Tweedle Dee Queen of Arts King](https://static.fdocuments.in/doc/165x107/5aae6c487f8b9a5d0a8c1b39/script-excerpts-cast-cheshire-cat-small-alice-alice-tall-alice-teacher-rabbit.jpg)