Plasma protein expression differs between colorectal ...
14
Cancer Medicine. 2020;9:5221–5234. | 5221 wileyonlinelibrary.com/journal/cam4 Received: 27 January 2020 | Revised: 7 May 2020 | Accepted: 9 May 2020 DOI: 10.1002/cam4.3178 ORIGINAL RESEARCH Plasma protein expression differs between colorectal cancer patients depending on primary tumor location Matilda Holm 1,2,3,4 | Sakari Joenväärä 5,6 | Mayank Saraswat 7 | Tiialotta Tohmola 5,6,8 | Ari Ristimäki 2,4,6 | Risto Renkonen 5,6 | Caj Haglund 1,3,6 1 Department of Surgery, Faculty of Medicine, University of Helsinki and Helsinki University Hospital, University of Helsinki, Helsinki, Finland 2 Department of Pathology, Faculty of Medicine, University of Helsinki and Helsinki University Hospital, University of Helsinki, Helsinki, Finland 3 Translational Cancer Medicine Research Program, Faculty of Medicine, University of Helsinki, Helsinki, Finland 4 Applied Tumor Genomics Research Program, Faculty of Medicine, University of Helsinki, Helsinki, Finland 5 Transplantation Laboratory, Haartman Institute, University of Helsinki, Helsinki, Finland 6 HUSLAB, Helsinki University Hospital, Helsinki, Finland 7 Department of Laboratory Medicine and Pathology, Mayo Clinic, Rochester, Minnesota, USA 8 Department of Biosciences, Faculty of Biological and Environmental Sciences, University of Helsinki, Helsinki, Finland This is an open access article under the terms of the Creative Commons Attribution License, which permits use, distribution and reproduction in any medium, provided the original work is properly cited. © 2020 The Authors. Cancer Medicine published by John Wiley & Sons Ltd. Renkonen and Caj Haglund contributed equally to this work Correspondence Matilda Holm, Department of Surgery, Faculty of Medicine, University of Helsinki and Helsinki University Hospital, Haartmaninkatu 8, 00290 Helsinki, Finland. Email: [email protected] Funding information This work was supported by grants from the University of Helsinki, Helsinki University Hospital and HUSLAB, Helsinki University Hospital, The Sigrid Jusélius Foundation, Helsinki University Central Hospital Research Funds, The Finnish Cancer Foundation, and Finska Läkaresällskapet. The funders had no role in the design of the study, data collection and analysis, interpretation of the data, manuscript writing or in the decision to submit this manuscript for publication. Abstract Colorectal cancer (CRC) includes tumors in the right colon, left colon, and rectum, although they differ significantly from each other in aspects such as prognosis and treatment. Few previous mass spectrometry-based studies have analyzed differences in protein expression depending on the tumor location. In this study, we have used mass spectrometry-based proteomics to analyze plasma samples from 83 CRC pa- tients to study if differences in plasma protein expression can be seen depending on primary tumor location (right colon, left colon, or rectum). Differences were stud- ied between the groups both regardless of and according to tumor stage (II or III). Large differences in plasma protein expression were seen, and we found that plasma samples from patients with rectal cancer separated from samples from patients with colon cancer when analyzed by principal component analysis and hierarchical clus- tering. Samples from patients with cancer in the right and left colon also tended to separate from each other. Pathway analysis discovered canonical pathways involved in lipid metabolism and inflammation to be enriched. This study will help to further define CRC as distinct entities depending on tumor location, as shown by the wide- spread differences in plasma protein profile and dysregulated pathways. KEYWORDS colorectal cancer, left colon, mass spectrometry, plasma proteomics, rectum, right colon
Transcript of Plasma protein expression differs between colorectal ...

Cancer Medicine. 2020;9:5221–5234. | 5221wileyonlinelibrary.com/journal/cam4
Received: 27 January 2020 | Revised: 7 May 2020 | Accepted: 9 May 2020
DOI: 10.1002/cam4.3178
O R I G I N A L R E S E A R C H
Plasma protein expression differs between colorectal cancer patients depending on primary tumor location
Matilda Holm1,2,3,4 | Sakari Joenväärä5,6 | Mayank Saraswat7 | Tiialotta Tohmola5,6,8 | Ari Ristimäki2,4,6 | Risto Renkonen5,6 | Caj Haglund1,3,6
1Department of Surgery, Faculty of Medicine, University of Helsinki and Helsinki University Hospital, University of Helsinki, Helsinki, Finland2Department of Pathology, Faculty of Medicine, University of Helsinki and Helsinki University Hospital, University of Helsinki, Helsinki, Finland3Translational Cancer Medicine Research Program, Faculty of Medicine, University of Helsinki, Helsinki, Finland4Applied Tumor Genomics Research Program, Faculty of Medicine, University of Helsinki, Helsinki, Finland5Transplantation Laboratory, Haartman Institute, University of Helsinki, Helsinki, Finland6HUSLAB, Helsinki University Hospital, Helsinki, Finland7Department of Laboratory Medicine and Pathology, Mayo Clinic, Rochester, Minnesota, USA8Department of Biosciences, Faculty of Biological and Environmental Sciences, University of Helsinki, Helsinki, Finland
This is an open access article under the terms of the Creative Commons Attribution License, which permits use, distribution and reproduction in any medium, provided the original work is properly cited.© 2020 The Authors. Cancer Medicine published by John Wiley & Sons Ltd.
Renkonen and Caj Haglund contributed equally to this work
CorrespondenceMatilda Holm, Department of Surgery, Faculty of Medicine, University of Helsinki and Helsinki University Hospital, Haartmaninkatu 8, 00290 Helsinki, Finland.Email: [email protected]
Funding informationThis work was supported by grants from the University of Helsinki, Helsinki University Hospital and HUSLAB, Helsinki University Hospital, The Sigrid Jusélius Foundation, Helsinki University Central Hospital Research Funds, The Finnish Cancer Foundation, and Finska Läkaresällskapet. The funders had no role in the design of the study, data collection and analysis, interpretation of the data, manuscript writing or in the decision to submit this manuscript for publication.
AbstractColorectal cancer (CRC) includes tumors in the right colon, left colon, and rectum, although they differ significantly from each other in aspects such as prognosis and treatment. Few previous mass spectrometry-based studies have analyzed differences in protein expression depending on the tumor location. In this study, we have used mass spectrometry-based proteomics to analyze plasma samples from 83 CRC pa-tients to study if differences in plasma protein expression can be seen depending on primary tumor location (right colon, left colon, or rectum). Differences were stud-ied between the groups both regardless of and according to tumor stage (II or III). Large differences in plasma protein expression were seen, and we found that plasma samples from patients with rectal cancer separated from samples from patients with colon cancer when analyzed by principal component analysis and hierarchical clus-tering. Samples from patients with cancer in the right and left colon also tended to separate from each other. Pathway analysis discovered canonical pathways involved in lipid metabolism and inflammation to be enriched. This study will help to further define CRC as distinct entities depending on tumor location, as shown by the wide-spread differences in plasma protein profile and dysregulated pathways.
K E Y W O R D S
colorectal cancer, left colon, mass spectrometry, plasma proteomics, rectum, right colon

5222 | HOLM et aL.
1 | BACKGROUND
Colorectal cancer (CRC) is the third most common cancer worldwide and the second most common cause of cancer death, with over 1.8 million new cases and closer to 900 000 deaths estimated to have occurred in 2018. CRC therefore accounts for 10% of the global cancer burden, and the bur-den is expected to increase by 60% to more than 2.2 million new cases and 1.1 million deaths by 2030.1,2 CRC includes cancer in the colon, which is further divided into the right and left colon, and the rectum. Cancer in the right colon dif-fers from cancer in the left colon, and rectal cancer differs from colon cancer in multiple ways.3 The boundary between the right and left colon, which is defined by embryological
origin, is the distal transverse colon. Seeing as this is dif-ficult to use in retrospective analyses, most studies use the splenic flexure as the boundary between cancer in the right colon and left colon, with tumors arising proximal to the splenic flexure being classified as right-sided and tu-mors arising distal to the splenic flexure being classified as left-sided.4,5
Cancer in the right and left colon differ in multiple ways, with some proposing that they should be regarded as different entities.6,7 Right-sided colon cancer is more often seen in older people and women, and patients tend to present with more advanced tumor stage and more subtle symptoms.8,9 Several studies have also shown that right-sided colon cancer has a worse prognosis than left-sided
T A B L E 1 Top 20 plasma proteins with a Bonferroni-corrected P-value of less than .01 when all samples were compared
AccessionPeptide count
Unique peptides
Confidence score
ANOVA (P)
Bonferroni-corrected P-values
Max fold change Power
Highest mean condition
Lowest mean condition
AUC (right colon/left colon)
AUC (right colon/rectum)
AUC (left colon/rectum) Protein name Gene name
Q92496 6 2 35.6 <.0001 <.0001 13.0 1.00 Right colon Rectum 0.67 0.97 0.94 Complement factor H-related protein 4
CFHR4
P08779;P02533 3 2 15.5 1.33E-15 2.98E-13 11.4 1.00 Right colon Rectum 0.72 0.98 0.95 Keratin_ type I cytoskeletal 16 KRT16
P35527 6 5 28.7 <.0001 <.0001 10.1 1.00 Right colon Rectum 0.73 1.00 0.98 Keratin_ type I cytoskeletal 9 KRT9
P13645;Q7Z3Y7;Q7Z3Y8;Q7Z3Y9;Q7Z3Z0
6 5 36.0 <.0001 <.0001 7.8 1.00 Right colon Rectum 0.61 0.99 0.98 Keratin_ type I cytoskeletal 10 KRT10
Q9ULC5 5 3 23.0 <.0001 <.0001 6.3 1.00 Right colon Rectum 0.85 1.00 0.98 Long-chain-fatty-acid--CoA ligase 5
ACSL5
Q03591 15 2 131.6 3.69E-12 8.27E-10 6.2 1.00 Right colon Rectum 0.62 0.94 0.90 Complement factor H-related protein 1
CFHR1
P04264 7 2 39.0 2.98E-09 6.68E-07 5.3 1.00 Left colon Rectum 0.54 0.90 0.88 Keratin_ type II cytoskeletal 1 KRT1
Q9UIF8 4 2 19.5 <0.0001 <0.0001 4.6 1.00 Right colon Rectum 0.68 0.95 0.91 Bromodomain adjacent to zinc finger domain protein 2B
BAZ2B
Q3V6T2 15 6 70.1 <0.0001 <0.0001 4.3 1.00 Right colon Rectum 0.64 1.00 0.99 Girdin CCDC88A
A6NMZ7;P51570;Q13158;Q6NT55 5 2 24.3 <.0001 <.0001 4.3 1.00 Right colon Rectum 0.80 1.00 0.97 Collagen alpha-6(VI) chain COL6A6
H3BMM5 3 2 13.7 <.0001 <.0001 4.2 1.00 Right colon Rectum 0.60 0.98 0.97 Uncharacterized protein
P00746 3 2 12.0 <.0001 <.0001 3.8 1.00 Right colon Rectum 0.61 0.97 0.97 Complement factor D CFD
Q86UX7 7 2 37.3 8.29E-11 1.86E-08 3.8 1.00 Right colon Rectum 0.71 0.94 0.86 Fermitin family homolog 3 FERMT3
Q12805 9 8 51.7 <.0001 <.0001 3.4 1.00 Right colon Rectum 0.79 1.00 0.96 EGF-containing fibulin-like extracellular matrix protein 1
EFEMP1
O43866 7 5 38.1 <.0001 <.0001 3.4 1.00 Right colon Rectum 0.63 0.99 0.95 CD5 antigen-like CD5L
B1AJZ9 10 3 49.0 3.89E-15 8.70E-13 3.4 1.00 Right colon Rectum 0.71 0.96 0.92 Forkhead-associated domain-containing protein 1
FHAD1
O75038 5 3 20.9 1.11E-16 2.49E-14 3.3 1.00 Right colon Rectum 0.72 0.97 0.90 1-phosphatidylinositol 4_5-bisphosphate phosphodiesterase eta-2
PLCH2
Q9P2E3 9 2 55.8 4.80E-09 1.07E-06 3.1 1.00 Right colon Rectum 0.50 0.85 0.90 NFX1-type zinc finger-containing protein 1
ZNFX1
Q6UB98 6 2 36.6 <.0001 <.0001 3.0 1.00 Right colon Rectum 0.72 0.98 0.95 Ankyrin repeat domain-containing protein 12
ANKRD12
Q9Y4C1 4 3 21.0 <.0001 <.0001 2.9 1.00 Right colon Rectum 0.78 0.99 0.96 Lysine-specific demethylase 3A
KDM3A
Note: The list with all significantly different proteins can be found in Table S3A.

| 5223HOLM et aL.
colon cancer, although the reason for this is unclear.10-12 Rectal cancer has a greater risk of local recurrence as re-section is harder due to anatomical constraints. It also has a greater risk of metastasizing to the lungs than colon can-cer.13,14 However, the 5-year survival rates for colon and rectal cancer are similar, with rectal cancer actually having a slightly higher 5-year survival rate (66.6%) than colon cancer (63.6%).15 Differences between rectal and colon cancer are also apparent at the molecular level. Rectal tumors more often display mutations in genes such as tumor protein p53 (TP53), while colon tumors more often have mutations in genes including B-Raf proto-oncogene (BRAF).14,16 The consensus molecular subtypes (CMS) are a recent classification of CRC into four subtypes with
distinguishing features considered the most robust clas-sification system currently available for CRC. CMS1 tu-mors, which are characterized by microsatellite instability (MSI), the CpG island methylator phenotype (CIMP), and hypermutation, were frequently right-sided. CMS2 tumors, which display higher chromosomal instability than CMS1 and upregulation of WNT and MYC downstream targets, were mainly left-sided.17
Few previous mass spectrometry-based studies have analyzed differences in protein expression depending on tumor location.18 One study used mass spectrometry to analyze tissue samples from patients with cancer in the right and left colon and discovered that the expression of proteins involved in cellular energy metabolism, protein
T A B L E 1 Top 20 plasma proteins with a Bonferroni-corrected P-value of less than .01 when all samples were compared
AccessionPeptide count
Unique peptides
Confidence score
ANOVA (P)
Bonferroni-corrected P-values
Max fold change Power
Highest mean condition
Lowest mean condition
AUC (right colon/left colon)
AUC (right colon/rectum)
AUC (left colon/rectum) Protein name Gene name
Q92496 6 2 35.6 <.0001 <.0001 13.0 1.00 Right colon Rectum 0.67 0.97 0.94 Complement factor H-related protein 4
CFHR4
P08779;P02533 3 2 15.5 1.33E-15 2.98E-13 11.4 1.00 Right colon Rectum 0.72 0.98 0.95 Keratin_ type I cytoskeletal 16 KRT16
P35527 6 5 28.7 <.0001 <.0001 10.1 1.00 Right colon Rectum 0.73 1.00 0.98 Keratin_ type I cytoskeletal 9 KRT9
P13645;Q7Z3Y7;Q7Z3Y8;Q7Z3Y9;Q7Z3Z0
6 5 36.0 <.0001 <.0001 7.8 1.00 Right colon Rectum 0.61 0.99 0.98 Keratin_ type I cytoskeletal 10 KRT10
Q9ULC5 5 3 23.0 <.0001 <.0001 6.3 1.00 Right colon Rectum 0.85 1.00 0.98 Long-chain-fatty-acid--CoA ligase 5
ACSL5
Q03591 15 2 131.6 3.69E-12 8.27E-10 6.2 1.00 Right colon Rectum 0.62 0.94 0.90 Complement factor H-related protein 1
CFHR1
P04264 7 2 39.0 2.98E-09 6.68E-07 5.3 1.00 Left colon Rectum 0.54 0.90 0.88 Keratin_ type II cytoskeletal 1 KRT1
Q9UIF8 4 2 19.5 <0.0001 <0.0001 4.6 1.00 Right colon Rectum 0.68 0.95 0.91 Bromodomain adjacent to zinc finger domain protein 2B
BAZ2B
Q3V6T2 15 6 70.1 <0.0001 <0.0001 4.3 1.00 Right colon Rectum 0.64 1.00 0.99 Girdin CCDC88A
A6NMZ7;P51570;Q13158;Q6NT55 5 2 24.3 <.0001 <.0001 4.3 1.00 Right colon Rectum 0.80 1.00 0.97 Collagen alpha-6(VI) chain COL6A6
H3BMM5 3 2 13.7 <.0001 <.0001 4.2 1.00 Right colon Rectum 0.60 0.98 0.97 Uncharacterized protein
P00746 3 2 12.0 <.0001 <.0001 3.8 1.00 Right colon Rectum 0.61 0.97 0.97 Complement factor D CFD
Q86UX7 7 2 37.3 8.29E-11 1.86E-08 3.8 1.00 Right colon Rectum 0.71 0.94 0.86 Fermitin family homolog 3 FERMT3
Q12805 9 8 51.7 <.0001 <.0001 3.4 1.00 Right colon Rectum 0.79 1.00 0.96 EGF-containing fibulin-like extracellular matrix protein 1
EFEMP1
O43866 7 5 38.1 <.0001 <.0001 3.4 1.00 Right colon Rectum 0.63 0.99 0.95 CD5 antigen-like CD5L
B1AJZ9 10 3 49.0 3.89E-15 8.70E-13 3.4 1.00 Right colon Rectum 0.71 0.96 0.92 Forkhead-associated domain-containing protein 1
FHAD1
O75038 5 3 20.9 1.11E-16 2.49E-14 3.3 1.00 Right colon Rectum 0.72 0.97 0.90 1-phosphatidylinositol 4_5-bisphosphate phosphodiesterase eta-2
PLCH2
Q9P2E3 9 2 55.8 4.80E-09 1.07E-06 3.1 1.00 Right colon Rectum 0.50 0.85 0.90 NFX1-type zinc finger-containing protein 1
ZNFX1
Q6UB98 6 2 36.6 <.0001 <.0001 3.0 1.00 Right colon Rectum 0.72 0.98 0.95 Ankyrin repeat domain-containing protein 12
ANKRD12
Q9Y4C1 4 3 21.0 <.0001 <.0001 2.9 1.00 Right colon Rectum 0.78 0.99 0.96 Lysine-specific demethylase 3A
KDM3A
Note: The list with all significantly different proteins can be found in Table S3A.

5224 | HOLM et aL.
folding, and oxidative stress varied between samples from the two locations.19 Another study revealed distinct pro-tein expression between right- and left-sided colon can-cer and identified several proteins that could be of use in predicting relapse in right- or left-sided colon cancer.20 In this study, we have used the Ultra Performance Liquid Chromatography-Ultra Definition Mass Spectrometry (UPLC-UDMSE)-based proteomics to analyze plasma sam-ples from 83 CRC patients who were divided into groups based on if they had tumors in the right colon, left colon, or rectum. The samples were compared between primary tumor locations, both regardless of and according to tumor stage (II or III), and plasma protein expression was ana-lyzed. The aim of this study was to investigate whether dif-ferences were seen in plasma protein expression between patients with tumors in the right colon, left colon, or rec-tum. While a previous study has investigated how plasma protein expression changes during stage II and III CRC,21 both depending on and regardless of tumor location, as far as we are aware, this study is the first to show that plasma
protein profiles differ significantly between CRC patients depending on tumor location.
2 | MATERIALS AND METHODS
2.1 | Patient samples
This study used preoperative plasma samples from a total of 83 CRC patients with stage II or III cancer in the right colon, left colon, or rectum. Cancer staging was performed accord-ing to the TNM staging system. Stage II cancer was defined as cases with a pT3-4 primary tumor but no regional lymph node or distant metastasis, while stage III cancer was defined as cases with regional lymph node metastasis but no distant metastasis. The patients underwent surgical resection with curative intent between 2000 and 2007. The patients included in this study were all newly diagnosed with stage II or III cancer. Patients with conditions including other types of can-cer, a previous history of hereditary nonpolyposis colorectal
T A B L E 2 Top 20 plasma proteins with a Bonferroni-corrected P-value of less than .01 when only stage II samples were compared
AccessionPeptide count
Unique peptides
Confidence score ANOVA (P) Bonferroni-corrected P-values
Max fold change Power
Highest mean condition
Lowest mean condition Protein name Gene name
P35527 6 5 28.7 7.95E-08 1.78E-05 10.7 1.00 Left colon stage II Rectum stage II Keratin_ type I cytoskeletal 9 KRT9
Q92496 6 2 35.6 7.17E-06 1.61E-03 8.4 1.00 Right colon stage II Rectum stage II Complement factor H-related protein 4 CFHR4
P08779;P02533 3 2 15.5 9.54E-06 2.14E-03 6.1 1.00 Right colon stage II Rectum stage II Keratin_ type I cytoskeletal 16 KRT16
P13645;Q7Z3Y7;Q7Z3Y8;Q7Z3Y9;Q7Z3Z0 6 5 36.0 8.28E-09 1.86E-06 5.6 1.00 Left colon stage II Rectum stage II Keratin_ type I cytoskeletal 10 KRT10
Q3V6T2 15 6 70.1 2.01E-10 4.50E-08 4.6 1.00 Right colon stage II Rectum stage II Girdin CCDC88A
Q9ULC5 5 3 23.0 9.65E-14 2.16E-11 4.6 1.00 Right colon stage II Rectum stage II Long-chain-fatty-acid--CoA ligase 5 ACSL5
P00746 3 2 12.0 3.12E-09 6.98E-07 4.3 1.00 Right colon stage II Rectum stage II Complement factor D CFD
O43866 7 5 38.1 1.97E-10 4.42E-08 4.0 1.00 Right colon stage II Rectum stage II CD5 antigen-like CD5L
A6NMZ7;P51570;Q13158;Q6NT55 5 2 24.3 1.94E-11 4.33E-09 4.0 1.00 Right colon stage II Rectum stage II Collagen alpha-6(VI) chain COL6A6
Q9UIF8 4 2 19.5 2.24E-06 5.01E-04 3.8 1.00 Right colon stage II Rectum stage II Bromodomain adjacent to zinc finger domain protein 2B
BAZ2B
Q92777 5 3 27.1 2.41E-05 5.40E-03 3.5 1.00 Right colon stage II Rectum stage II Synapsin-2 SYN2
H3BMM5 3 2 13.7 5.10E-08 1.14E-05 3.5 1.00 Right colon stage II Rectum stage II Uncharacterized protein
Q96PZ0 3 2 21.0 2.54E-05 5.70E-03 3.2 1.00 Right colon stage II Rectum stage II Pseudouridylate synthase 7 homolog PUS7
Q12805 9 8 51.7 1.81E-11 4.04E-09 3.2 1.00 Right colon stage II Rectum stage II EGF-containing fibulin-like extracellular matrix protein 1
EFEMP1
B1AJZ9 10 3 49.0 1.06E-06 2.38E-04 3.1 1.00 Right colon stage II Rectum stage II Forkhead-associated domain-containing protein 1
FHAD1
Q9Y4C1 4 3 21.0 6.88E-09 1.54E-06 3.0 1.00 Right colon stage II Rectum stage II Lysine-specific demethylase 3A KDM3A
O75038 5 3 20.9 1.99E-07 4.46E-05 2.9 1.00 Right colon stage II Rectum stage II 1-phosphatidylinositol 4_5-bisphosphate phosphodiesterase eta-2
PLCH2
Q9UK55 22 13 125.8 3.53E-05 7.92E-03 2.9 1.00 Right colon stage II Rectum stage II Protein Z-dependent protease inhibitor SERPINA10
Q8IV77 3 2 14.4 4.37E-07 9.78E-05 2.9 1.00 Right colon stage II Rectum stage II Cyclic nucleotide-gated cation channel alpha-4
CNGA4
P04070 6 4 29.2 4.30E-07 9.63E-05 2.7 1.00 Right colon stage II Rectum stage II Vitamin K-dependent protein C PROC
Note: The list with all significantly different proteins can be found in Table S3B.

| 5225HOLM et aL.
cancer (HNPCC), familial adenomatous polyposis (FAP), ulcerative colitis, Crohn's disease, or mucinous tumors were also excluded from this study. Plasma samples were stored at −80°C until processed as described below. The clinical data were obtained from patient records, the survival data from the Population Register Centre of Finland, and the cause of death for all the deceased from Statistics Finland. Written informed consent was obtained from all patients prior to collecting samples. This study was approved by the local Surgical Ethics Committee and carried out in accordance with the Declaration of Helsinki.
2.2 | Sample processing and digestion
The plasma samples were processed as described previ-ously21,22 and as follows. All samples were thawed and top 12 protein depletion was performed with TOP12 protein depletion spin columns (85 165, Pierce) accord-ing to the manufacturer's instructions. After the total
protein concentration was determined, plasma equivalent to 100 µg protein was aliquoted and dried. The samples were dissolved in 35 µL Tris buffer (50 mmol/L, pH 7.8, T1503, Sigma) containing 6M urea (51 459, Fluka), after which 1.8 µL of dithiothreitol (DTT, 200 mmol/L, V315B, Promega) was added. After the samples were shaken for 1 hour at room temperature, 7 µL of iodoacetamide (200 mmol/L, 57 670, Fluka) was added to each sample and they were returned to the shaker for another hour. After this, 7 µL of DTT (200 mmol/L) was added to each sample and the samples were again put on the shaker for 1 hour. The samples were subsequently diluted with 270 µL mQ water per sample. Trypsin (V5280, Promega) was added at a ratio of 1:50 trypsin to protein. Digestion was carried out at 37°C overnight, and the next day C18 spin columns (89 870, Pierce) were used to clean 30 µg of tryptic peptides per sample. These peptides were dissolved in 86 µL of 0.1% formic acid that contained 12.5 fmol/µL of Hi3 spike-in standard peptides (186 006 012, Waters) for quantification.
T A B L E 2 Top 20 plasma proteins with a Bonferroni-corrected P-value of less than .01 when only stage II samples were compared
AccessionPeptide count
Unique peptides
Confidence score ANOVA (P) Bonferroni-corrected P-values
Max fold change Power
Highest mean condition
Lowest mean condition Protein name Gene name
P35527 6 5 28.7 7.95E-08 1.78E-05 10.7 1.00 Left colon stage II Rectum stage II Keratin_ type I cytoskeletal 9 KRT9
Q92496 6 2 35.6 7.17E-06 1.61E-03 8.4 1.00 Right colon stage II Rectum stage II Complement factor H-related protein 4 CFHR4
P08779;P02533 3 2 15.5 9.54E-06 2.14E-03 6.1 1.00 Right colon stage II Rectum stage II Keratin_ type I cytoskeletal 16 KRT16
P13645;Q7Z3Y7;Q7Z3Y8;Q7Z3Y9;Q7Z3Z0 6 5 36.0 8.28E-09 1.86E-06 5.6 1.00 Left colon stage II Rectum stage II Keratin_ type I cytoskeletal 10 KRT10
Q3V6T2 15 6 70.1 2.01E-10 4.50E-08 4.6 1.00 Right colon stage II Rectum stage II Girdin CCDC88A
Q9ULC5 5 3 23.0 9.65E-14 2.16E-11 4.6 1.00 Right colon stage II Rectum stage II Long-chain-fatty-acid--CoA ligase 5 ACSL5
P00746 3 2 12.0 3.12E-09 6.98E-07 4.3 1.00 Right colon stage II Rectum stage II Complement factor D CFD
O43866 7 5 38.1 1.97E-10 4.42E-08 4.0 1.00 Right colon stage II Rectum stage II CD5 antigen-like CD5L
A6NMZ7;P51570;Q13158;Q6NT55 5 2 24.3 1.94E-11 4.33E-09 4.0 1.00 Right colon stage II Rectum stage II Collagen alpha-6(VI) chain COL6A6
Q9UIF8 4 2 19.5 2.24E-06 5.01E-04 3.8 1.00 Right colon stage II Rectum stage II Bromodomain adjacent to zinc finger domain protein 2B
BAZ2B
Q92777 5 3 27.1 2.41E-05 5.40E-03 3.5 1.00 Right colon stage II Rectum stage II Synapsin-2 SYN2
H3BMM5 3 2 13.7 5.10E-08 1.14E-05 3.5 1.00 Right colon stage II Rectum stage II Uncharacterized protein
Q96PZ0 3 2 21.0 2.54E-05 5.70E-03 3.2 1.00 Right colon stage II Rectum stage II Pseudouridylate synthase 7 homolog PUS7
Q12805 9 8 51.7 1.81E-11 4.04E-09 3.2 1.00 Right colon stage II Rectum stage II EGF-containing fibulin-like extracellular matrix protein 1
EFEMP1
B1AJZ9 10 3 49.0 1.06E-06 2.38E-04 3.1 1.00 Right colon stage II Rectum stage II Forkhead-associated domain-containing protein 1
FHAD1
Q9Y4C1 4 3 21.0 6.88E-09 1.54E-06 3.0 1.00 Right colon stage II Rectum stage II Lysine-specific demethylase 3A KDM3A
O75038 5 3 20.9 1.99E-07 4.46E-05 2.9 1.00 Right colon stage II Rectum stage II 1-phosphatidylinositol 4_5-bisphosphate phosphodiesterase eta-2
PLCH2
Q9UK55 22 13 125.8 3.53E-05 7.92E-03 2.9 1.00 Right colon stage II Rectum stage II Protein Z-dependent protease inhibitor SERPINA10
Q8IV77 3 2 14.4 4.37E-07 9.78E-05 2.9 1.00 Right colon stage II Rectum stage II Cyclic nucleotide-gated cation channel alpha-4
CNGA4
P04070 6 4 29.2 4.30E-07 9.63E-05 2.7 1.00 Right colon stage II Rectum stage II Vitamin K-dependent protein C PROC
Note: The list with all significantly different proteins can be found in Table S3B.

5226 | HOLM et aL.
2.3 | Ultra performance liquid chromatography-ultra definition mass spectrometry and quantification UPLC-UDMSE
UPLC was performed as described previously21,22 and as follows. Four microliter of each sample (the equivalent to ~1.4 µg total protein) was injected to a nanoACQUITY UPLC system (Waters Corporation,) and TRIZAIC nano-Tile 85 μm × 100 mm HSS-T3u wTRAP was used as a sepa-ration device. As mentioned in Holm et al21: “Samples were loaded, trapped, and washed for two minutes with 8.0 µL 1% B and the analytical gradient used was as follows: 0-1 min-utes 1% B, at 2 minutes 5% B, at 65 minutes 30% B, at 78 minutes 50% B, at 80 minutes 85% B, at 83 minutes 85% B, at 84 minutes 1% B, and at 90 minutes 1% B with 450 nL/min. Buffer A was 0.1% formic acid in water while buffer B was 0.1% formic acid in acetonitrile. Data were acquired in data-independent acquisition fashion using UDMSE mode with a Synapt G2-S HDMS (Waters Corporation).”
UDMSE data acquisition mode was used in this study to optimize the collision energies, which has previously been described by Distler et al.23 Briefly, in classical HDMSE, one fixed collision energy is applied to each individual ion mobil-ity separation cycle, which results in under- or over-fragmen-tation of precursor ions. Distler et al23 devised a strategy for using linear regression to specify drift-time specific collision energies for every drift-time bin of the IMS cycle, resulting in optimized energies for all precursors. Calibration was performed with sodium iodide clusters over a mass range of 50-2500 m/z. A solution of 2 µg/µL sodium iodide in 50/50 2-propanol/water was infused into the mass spectrometer. 10% of the samples were run in triplicate and the median co-efficient of variation (%CV) of the dataset was 4.36%.
2.4 | Data analysis
Data analysis and label-free quantification were performed as described previously.21,22,24 The raw files were imported to Progenesis QI for proteomics, version 4.1 (Nonlinear Dynamics).25 Post-acquisition mass correction was per-formed when the raw data were imported, using a lock mass ion of M + H+ 556.2771 m/z, with leucine enkepha-lin (C25H37O7, 1 ng/µL in 50:50 acetonitrile:water + 0,1% formic acid) having been previously infused into the refer-ence sprayer at 300 nL/min for this. The default parameters were used for peak picking and alignment. The peptide iden-tification was performed against Uniprot human FASTA se-quences (release 2018_04). A chaperone protein ClpB (ClpB) protein sequence (CLPB_ECOLI (P63285)) was inserted for label-free quantification. “Fixed modification” at cysteine (carbamidomethyl) and “variable” at methionine (oxidation)
were used. One missed cleavage for trypsin was allowed. The automatic settings for the fragment and peptide error toler-ances were used, while the false discovery rate (FDR) was set to less than 2%. The default parameters for ion matching were used, which are as follows: one or more ion fragments per peptide, three or more fragments per protein, and one or more peptides per protein.
The proteins were grouped according to the parsimony principle, although it is known that due to over-stringency, Progenesis QI for proteomics does not follow a strict parsi-monious approach.26 Therefore, if two proteins are found that share common peptides, the protein with fewer peptides will be subsumed into the protein with more peptides. If the cov-erages of two or more proteins are equal, all the relevant pro-teins will be listed under the lead protein that has the highest coverage/score. In this study, quantification was performed using the data of the lead identity peptide. For further details, see Nonlinear Dynamics’ website (www.nonli near.com).
2.5 | Further analysis
The differences between the groups were analyzed using the ANOVA test and p-values were corrected using the Bonferroni correction. Bonferroni-corrected ANOVA-passing p-values of less than 0.01 were considered signifi-cant to ensure stringent analysis. Data were normalized by Pareto scaling, and hierarchical clustering and principal component analysis were performed using Metaboanalyst, version 4.0.27,28 The feature “autoscaling” was further used during hierarchical clustering to generate heatmaps. Pathway analysis was performed with Ingenuity Pathway Analysis (IPA, build version 486068M, content version 46 901 286, QIAGEN Bioinformatics).29 All proteins that passed the cutoff of an ANOVA P-value of less than .05 were used for pathway analysis. Pathway analysis was per-formed separately for all ANOVA-passing proteins for all samples, stage II samples, and stage III samples between two tumor locations at a time (right colon/left colon, right colon/rectum, and left colon/rectum), as IPA cannot perform comparisons between three groups simultaneously. The mass spectrometry proteomics data have been deposited to the ProteomeXchange Consortium via the PRIDE30,31 part-ner repository with the dataset identifier PXD013150 and 10.6019/PXD013150.
3 | RESULTS
3.1 | Protein identification and analysis
In this study, we analyzed plasma samples from 83 CRC patients that were divided into groups based on primary
| 5227HOLM et aL.
tumor location (right colon, left colon, rectum). Detailed patient characteristics are given in Table S1. The samples were also divided into groups based on location and tumor stage (II or III). Twenty-seven patients had tumors in the right colon, 26 in the left colon, and 30 in the rectum. We quantified 224 proteins that contained two or more unique peptides and these 224 proteins were used for further analysis. These proteins with relevant data are given in Table S2.
3.2 | All samples
When all plasma samples regardless of tumor stage were compared according to tumor location, 125 proteins passed the cut-off of a Bonferroni-corrected ANOVA P-value of less than .01. The top 20 proteins according to fold change are given in Table 1, and all 125 proteins are given in Table S3A. The largest differences were seen between plasma protein expression in samples from patients with cancer in the right
F I G U R E 1 Hierarchical clustering heatmap of Pareto-scaled proteins using only those proteins that passed the cutoff of Bonferroni-corrected ANOVA P-value of less than .01 when only stage II samples were compared. The heatmap shows that plasma samples from patients with colon and rectal cancer form distinct clusters. Additionally, samples from patients with tumors in the right or left colon also showed a tendency to cluster together, although with some overlap between these colon tumors
5228 | HOLM et aL.
colon and rectum. Levels of keratins, type I cytoskeletal 16 (KRT16), 9 (KRT9), and 10 (KRT10), as well as comple-ment factor H-related protein 4 (CFHR4) and 1 (CFHR1), had higher levels in plasma samples from patients with can-cer in the right colon (with fold changes between 6.2-13.0). The plasma levels of long-chain-fatty-acid--CoA ligase 5 (ACSL5, fold change of 6.3), an enzyme, were also higher in plasma samples from patients with cancer in the right colon.
The area under the curve (AUC) values was also calcu-lated for the 125 proteins passing the cutoff of a Bonferroni-corrected ANOVA P-value of less than .01 when all samples were compared. This was done by comparing the proteins be-tween two tumor locations at a time (right colon/left colon, right colon/rectum, and left colon/rectum). The results are given in Table S3A and further strengthen our findings that plasma protein expression is significantly different between patients with cancer in the colon and rectum, with multiple proteins reaching AUC values of > 0.9, increasing their confidence.
The fold changes for all proteins between two tumor locations only (right colon/left colon, right colon/rectum, and left colon/rectum) are given for reference in Table S4A.
Pareto scaling was performed and principal component analysis (PCA) biplots and hierarchical clustering heatmaps were generated. The PCA when all proteins were consid-ered is given in Figure S1. The heatmap when only proteins that passed the cutoff of a Bonferroni-corrected ANOVA P-value of less than .01 were considered is given in Figure S2. Figure S2 shows that samples from patients with rectal cancer cluster together, although a few of these samples clustered to-gether with samples from patients with cancer in the left colon.
3.3 | Stage II samples
The samples from patients with stage II CRC only were also analyzed according to tumor location, and 46 proteins passed
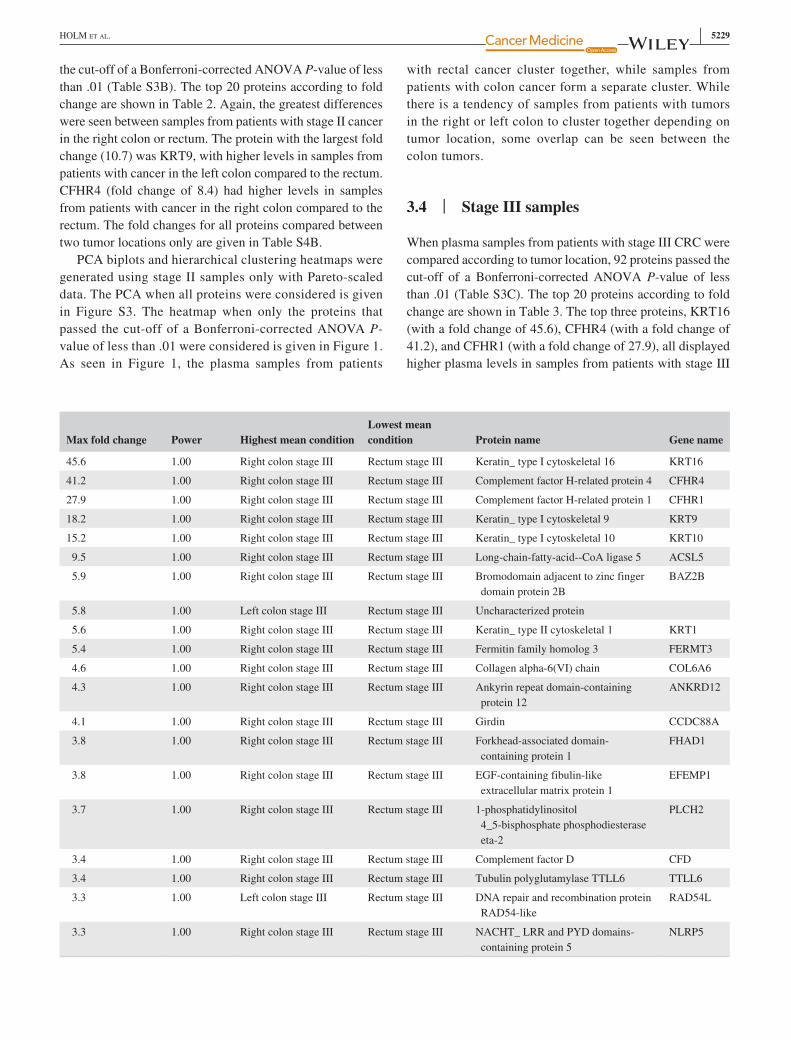
T A B L E 3 Top 20 plasma proteins with a Bonferroni-corrected P-value of less than .01 when only stage III samples were compared
AccessionPeptide count
Unique peptides
Confidence score ANOVA (P)
Bonferroni-corrected P-values Max fold change Power Highest mean condition
Lowest mean condition Protein name Gene name
P08779;P02533 3 2 15.5 1.83E-14 4.10E-12 45.6 1.00 Right colon stage III Rectum stage III Keratin_ type I cytoskeletal 16 KRT16
Q92496 6 2 35.6 1.52E-14 3.41E-12 41.2 1.00 Right colon stage III Rectum stage III Complement factor H-related protein 4 CFHR4
Q03591 15 2 131.6 1.67E-12 3.73E-10 27.9 1.00 Right colon stage III Rectum stage III Complement factor H-related protein 1 CFHR1
P35527 6 5 28.7 5.55E-14 1.24E-11 18.2 1.00 Right colon stage III Rectum stage III Keratin_ type I cytoskeletal 9 KRT9
P13645;Q7Z3Y7;Q7Z3Y8;Q7Z3Y9;Q7Z3Z0 6 5 36.0 <.0001 <.0001 15.2 1.00 Right colon stage III Rectum stage III Keratin_ type I cytoskeletal 10 KRT10
Q9ULC5 5 3 23.0 <.0001 <.0001 9.5 1.00 Right colon stage III Rectum stage III Long-chain-fatty-acid--CoA ligase 5 ACSL5
Q9UIF8 4 2 19.5 1.18E-12 2.64E-10 5.9 1.00 Right colon stage III Rectum stage III Bromodomain adjacent to zinc finger domain protein 2B
BAZ2B
H3BMM5 3 2 13.7 <.0001 <.0001 5.8 1.00 Left colon stage III Rectum stage III Uncharacterized protein
P04264 7 2 39.0 1.04E-07 2.33E-05 5.6 1.00 Right colon stage III Rectum stage III Keratin_ type II cytoskeletal 1 KRT1
Q86UX7 7 2 37.3 1.05E-08 2.36E-06 5.4 1.00 Right colon stage III Rectum stage III Fermitin family homolog 3 FERMT3
A6NMZ7;P51570;Q13158;Q6NT55 5 2 24.3 1.11E-16 2.49E-14 4.6 1.00 Right colon stage III Rectum stage III Collagen alpha-6(VI) chain COL6A6
Q6UB98 6 2 36.6 <.0001 <.0001 4.3 1.00 Right colon stage III Rectum stage III Ankyrin repeat domain-containing protein 12
ANKRD12
Q3V6T2 15 6 70.1 1.01E-13 2.25E-11 4.1 1.00 Right colon stage III Rectum stage III Girdin CCDC88A
B1AJZ9 10 3 49.0 3.69E-11 8.27E-09 3.8 1.00 Right colon stage III Rectum stage III Forkhead-associated domain-containing protein 1
FHAD1
Q12805 9 8 51.7 4.45E-14 9.97E-12 3.8 1.00 Right colon stage III Rectum stage III EGF-containing fibulin-like extracellular matrix protein 1
EFEMP1
O75038 5 3 20.9 2.17E-10 4.86E-08 3.7 1.00 Right colon stage III Rectum stage III 1-phosphatidylinositol 4_5-bisphosphate phosphodiesterase eta-2
PLCH2
P00746 3 2 12.0 2.38E-09 5.32E-07 3.4 1.00 Right colon stage III Rectum stage III Complement factor D CFD
Q8N841 6 2 26.9 3.14E-06 7.02E-04 3.4 1.00 Right colon stage III Rectum stage III Tubulin polyglutamylase TTLL6 TTLL6
Q92698 3 2 16.5 3.93E-09 8.81E-07 3.3 1.00 Left colon stage III Rectum stage III DNA repair and recombination protein RAD54-like
RAD54L
P59047 4 3 21.8 5.08E-06 1.14E-03 3.3 1.00 Right colon stage III Rectum stage III NACHT_ LRR and PYD domains-containing protein 5
NLRP5
Note: The list with all significantly different proteins can be found in Table S3C.
| 5229HOLM et aL.
the cut-off of a Bonferroni-corrected ANOVA P-value of less than .01 (Table S3B). The top 20 proteins according to fold change are shown in Table 2. Again, the greatest differences were seen between samples from patients with stage II cancer in the right colon or rectum. The protein with the largest fold change (10.7) was KRT9, with higher levels in samples from patients with cancer in the left colon compared to the rectum. CFHR4 (fold change of 8.4) had higher levels in samples from patients with cancer in the right colon compared to the rectum. The fold changes for all proteins compared between two tumor locations only are given in Table S4B.
PCA biplots and hierarchical clustering heatmaps were generated using stage II samples only with Pareto-scaled data. The PCA when all proteins were considered is given in Figure S3. The heatmap when only the proteins that passed the cut-off of a Bonferroni-corrected ANOVA P-value of less than .01 were considered is given in Figure 1. As seen in Figure 1, the plasma samples from patients
with rectal cancer cluster together, while samples from patients with colon cancer form a separate cluster. While there is a tendency of samples from patients with tumors in the right or left colon to cluster together depending on tumor location, some overlap can be seen between the colon tumors.
3.4 | Stage III samples
When plasma samples from patients with stage III CRC were compared according to tumor location, 92 proteins passed the cut-off of a Bonferroni-corrected ANOVA P-value of less than .01 (Table S3C). The top 20 proteins according to fold change are shown in Table 3. The top three proteins, KRT16 (with a fold change of 45.6), CFHR4 (with a fold change of 41.2), and CFHR1 (with a fold change of 27.9), all displayed higher plasma levels in samples from patients with stage III
T A B L E 3 Top 20 plasma proteins with a Bonferroni-corrected P-value of less than .01 when only stage III samples were compared
AccessionPeptide count
Unique peptides
Confidence score ANOVA (P)
Bonferroni-corrected P-values Max fold change Power Highest mean condition
Lowest mean condition Protein name Gene name
P08779;P02533 3 2 15.5 1.83E-14 4.10E-12 45.6 1.00 Right colon stage III Rectum stage III Keratin_ type I cytoskeletal 16 KRT16
Q92496 6 2 35.6 1.52E-14 3.41E-12 41.2 1.00 Right colon stage III Rectum stage III Complement factor H-related protein 4 CFHR4
Q03591 15 2 131.6 1.67E-12 3.73E-10 27.9 1.00 Right colon stage III Rectum stage III Complement factor H-related protein 1 CFHR1
P35527 6 5 28.7 5.55E-14 1.24E-11 18.2 1.00 Right colon stage III Rectum stage III Keratin_ type I cytoskeletal 9 KRT9
P13645;Q7Z3Y7;Q7Z3Y8;Q7Z3Y9;Q7Z3Z0 6 5 36.0 <.0001 <.0001 15.2 1.00 Right colon stage III Rectum stage III Keratin_ type I cytoskeletal 10 KRT10
Q9ULC5 5 3 23.0 <.0001 <.0001 9.5 1.00 Right colon stage III Rectum stage III Long-chain-fatty-acid--CoA ligase 5 ACSL5
Q9UIF8 4 2 19.5 1.18E-12 2.64E-10 5.9 1.00 Right colon stage III Rectum stage III Bromodomain adjacent to zinc finger domain protein 2B
BAZ2B
H3BMM5 3 2 13.7 <.0001 <.0001 5.8 1.00 Left colon stage III Rectum stage III Uncharacterized protein
P04264 7 2 39.0 1.04E-07 2.33E-05 5.6 1.00 Right colon stage III Rectum stage III Keratin_ type II cytoskeletal 1 KRT1
Q86UX7 7 2 37.3 1.05E-08 2.36E-06 5.4 1.00 Right colon stage III Rectum stage III Fermitin family homolog 3 FERMT3
A6NMZ7;P51570;Q13158;Q6NT55 5 2 24.3 1.11E-16 2.49E-14 4.6 1.00 Right colon stage III Rectum stage III Collagen alpha-6(VI) chain COL6A6
Q6UB98 6 2 36.6 <.0001 <.0001 4.3 1.00 Right colon stage III Rectum stage III Ankyrin repeat domain-containing protein 12
ANKRD12
Q3V6T2 15 6 70.1 1.01E-13 2.25E-11 4.1 1.00 Right colon stage III Rectum stage III Girdin CCDC88A
B1AJZ9 10 3 49.0 3.69E-11 8.27E-09 3.8 1.00 Right colon stage III Rectum stage III Forkhead-associated domain-containing protein 1
FHAD1
Q12805 9 8 51.7 4.45E-14 9.97E-12 3.8 1.00 Right colon stage III Rectum stage III EGF-containing fibulin-like extracellular matrix protein 1
EFEMP1
O75038 5 3 20.9 2.17E-10 4.86E-08 3.7 1.00 Right colon stage III Rectum stage III 1-phosphatidylinositol 4_5-bisphosphate phosphodiesterase eta-2
PLCH2
P00746 3 2 12.0 2.38E-09 5.32E-07 3.4 1.00 Right colon stage III Rectum stage III Complement factor D CFD
Q8N841 6 2 26.9 3.14E-06 7.02E-04 3.4 1.00 Right colon stage III Rectum stage III Tubulin polyglutamylase TTLL6 TTLL6
Q92698 3 2 16.5 3.93E-09 8.81E-07 3.3 1.00 Left colon stage III Rectum stage III DNA repair and recombination protein RAD54-like
RAD54L
P59047 4 3 21.8 5.08E-06 1.14E-03 3.3 1.00 Right colon stage III Rectum stage III NACHT_ LRR and PYD domains-containing protein 5
NLRP5
Note: The list with all significantly different proteins can be found in Table S3C.
5230 | HOLM et aL.
cancer in the right colon than the rectum. The fold changes for all proteins between two tumor locations only are given in Table S4C.
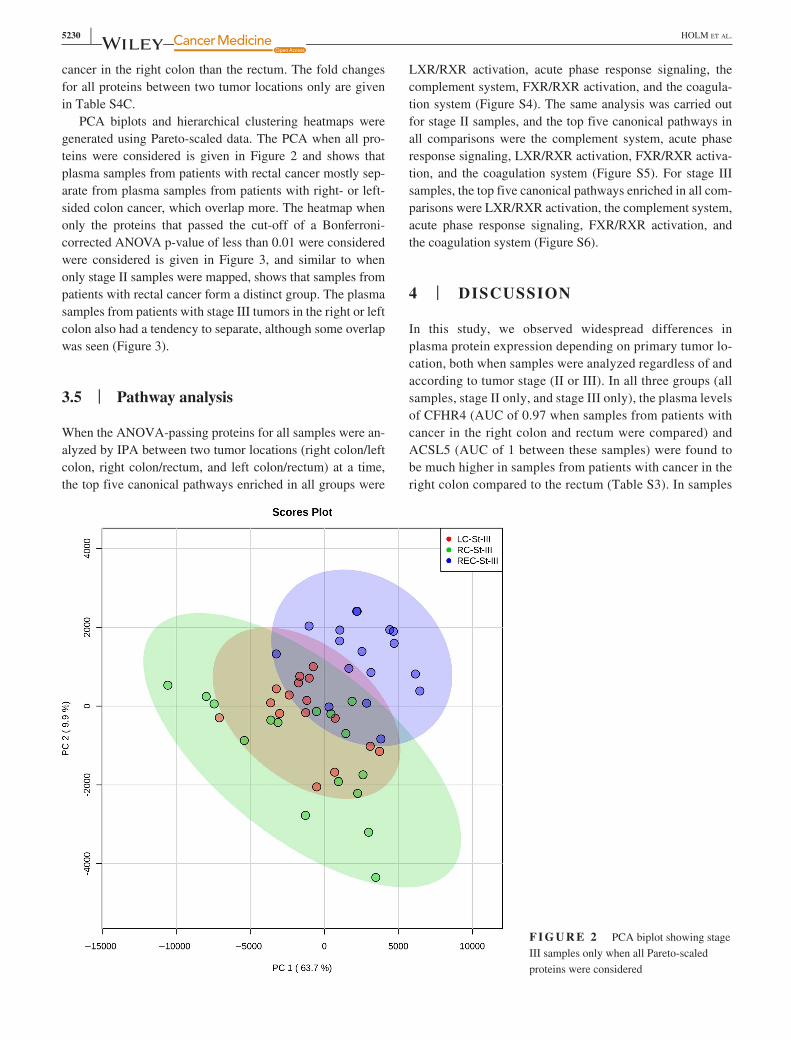
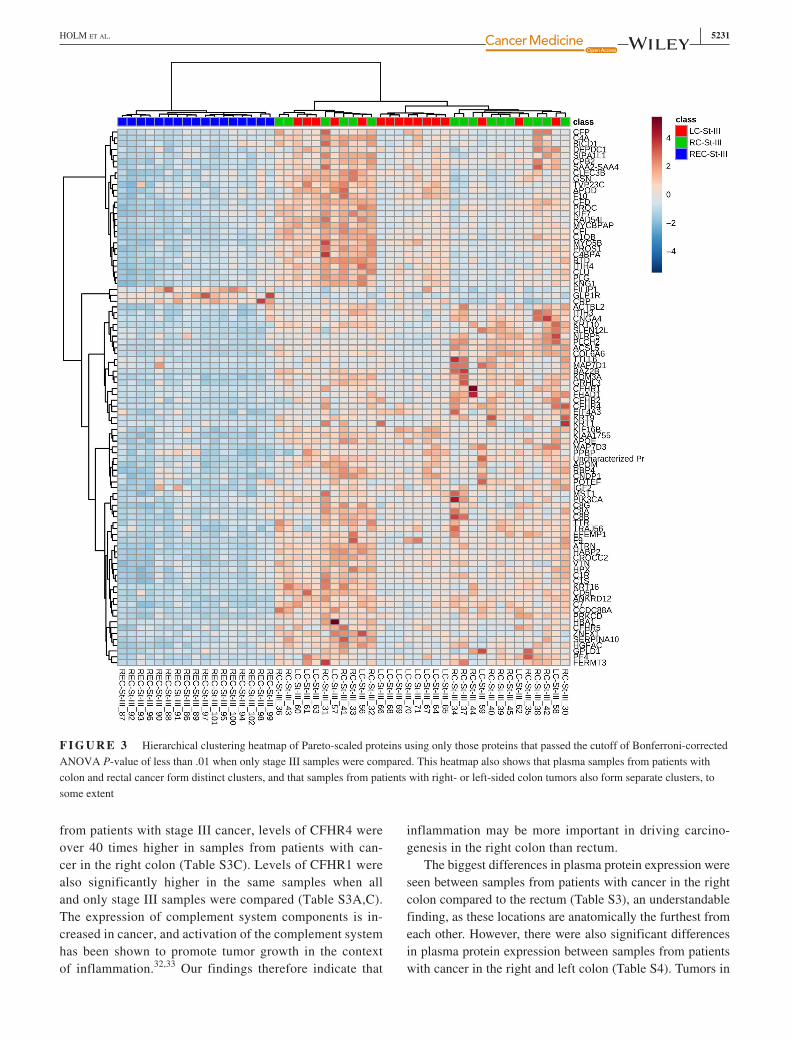
PCA biplots and hierarchical clustering heatmaps were generated using Pareto-scaled data. The PCA when all pro-teins were considered is given in Figure 2 and shows that plasma samples from patients with rectal cancer mostly sep-arate from plasma samples from patients with right- or left-sided colon cancer, which overlap more. The heatmap when only the proteins that passed the cut-off of a Bonferroni-corrected ANOVA p-value of less than 0.01 were considered were considered is given in Figure 3, and similar to when only stage II samples were mapped, shows that samples from patients with rectal cancer form a distinct group. The plasma samples from patients with stage III tumors in the right or left colon also had a tendency to separate, although some overlap was seen (Figure 3).
3.5 | Pathway analysis
When the ANOVA-passing proteins for all samples were an-alyzed by IPA between two tumor locations (right colon/left colon, right colon/rectum, and left colon/rectum) at a time, the top five canonical pathways enriched in all groups were
LXR/RXR activation, acute phase response signaling, the complement system, FXR/RXR activation, and the coagula-tion system (Figure S4). The same analysis was carried out for stage II samples, and the top five canonical pathways in all comparisons were the complement system, acute phase response signaling, LXR/RXR activation, FXR/RXR activa-tion, and the coagulation system (Figure S5). For stage III samples, the top five canonical pathways enriched in all com-parisons were LXR/RXR activation, the complement system, acute phase response signaling, FXR/RXR activation, and the coagulation system (Figure S6).
4 | DISCUSSION
In this study, we observed widespread differences in plasma protein expression depending on primary tumor lo-cation, both when samples were analyzed regardless of and according to tumor stage (II or III). In all three groups (all samples, stage II only, and stage III only), the plasma levels of CFHR4 (AUC of 0.97 when samples from patients with cancer in the right colon and rectum were compared) and ACSL5 (AUC of 1 between these samples) were found to be much higher in samples from patients with cancer in the right colon compared to the rectum (Table S3). In samples
F I G U R E 2 PCA biplot showing stage III samples only when all Pareto-scaled proteins were considered
| 5231HOLM et aL.
from patients with stage III cancer, levels of CFHR4 were over 40 times higher in samples from patients with can-cer in the right colon (Table S3C). Levels of CFHR1 were also significantly higher in the same samples when all and only stage III samples were compared (Table S3A,C). The expression of complement system components is in-creased in cancer, and activation of the complement system has been shown to promote tumor growth in the context of inflammation.32,33 Our findings therefore indicate that
inflammation may be more important in driving carcino-genesis in the right colon than rectum.
The biggest differences in plasma protein expression were seen between samples from patients with cancer in the right colon compared to the rectum (Table S3), an understandable finding, as these locations are anatomically the furthest from each other. However, there were also significant differences in plasma protein expression between samples from patients with cancer in the right and left colon (Table S4). Tumors in
F I G U R E 3 Hierarchical clustering heatmap of Pareto-scaled proteins using only those proteins that passed the cutoff of Bonferroni-corrected ANOVA P-value of less than .01 when only stage III samples were compared. This heatmap also shows that plasma samples from patients with colon and rectal cancer form distinct clusters, and that samples from patients with right- or left-sided colon tumors also form separate clusters, to some extent

5232 | HOLM et aL.
the right and left colon follow separate pathways of carcino-genesis as they display different molecular features. Right-sided tumors more frequently display MSI and CIMP, while left-sided tumors are more often characterized by chromo-somal instability and mutations in genes such as TP53.4,34 Additionally, tumors in the right colon also tend to display an increased infiltration of immune cells compared to tumors in the left colon, something which may have contributed to the differences in plasma protein expression, such as between complement components, observed in this study (Table S3).35
Pathway analysis by IPA found multiple canonical path-ways to be enriched in this dataset, with the top five path-ways enriched being the same regardless of tumor location or stage (Figures S4-S6). The enrichment of pathways such as LXR/RXR and FXR/RXR activation point to altered lipid metabolism, as LXR/RXR and FXR/RXR heterodimers have important roles in lipid and bile acid metabolism.36-38 The observed enrichment of pathways involved in lipid metabo-lism may be affected by factors such as bile acid concentra-tion, which differs between the right and left colon.39 Higher levels of ACSL5 were seen in samples from patients with cancer in the right colon compared to the rectum when all samples were analyzed (AUC of 1; Table 1). ACSL5 is an enzyme involved in lipid metabolism,40 and the differences in ACSL5 levels may have contributed to the enrichment of pathways such as LXR/RXR and FXR/RXR activation seen (Fig. S4B). The enrichment of pathways such as acute phase response signaling and the complement system indicate in-flammation as having different roles in CRC depending on tumor location, something that is further supported by our findings that plasma levels of proteins such as complement differ depending on tumor location (Table S3).
In this study, the plasma proteomic profiles of patients with rectal cancer were found to be significantly different from those of patients with colon cancer. It has been sug-gested that colon and rectal tumors follow separate pathways of carcinogenesis due to the different mutations commonly seen in colon and rectal cancer, indicating that they select for mutations in distinct signaling pathways.14 The results of a study by Kapiteijn et al16 indicated that the p53 path-way is more important in rectal than colon cancer. Their study also found that rectal tumors were more often positive for nuclear ß-catenin than colon tumors, although this find-ing was not associated with the presence of a mutation in the adenomatous polyposis coli (APC) gene. Another study found that mutations in the KRAS proto-oncogene (KRAS) were more commonly detected in colon tumors than rec-tal tumors, and that the number of mutations detected was higher in colon tumors when compared to rectal tumors, further strengthening the theory that the pathways to car-cinogenesis differ for colon and rectal tumors.41 Different pathways to carcinogenesis and the presence of different mutations in colon and rectal tumors likely affects plasma
protein expression. This may help explain the differences in plasma protein profiles between samples from patients with cancer in the colon and rectum seen in the current study.
Previous mass spectrometric studies have mainly focused on identifying new proteins of use for the diagnosis and early detection of CRC and have focused on comparing samples from CRC patients and healthy controls.42-44 Several studies have investigated differences in protein expression between CRC in different locations and studied the expression of spe-cific proteins in tissue samples using immunohistochemis-try.45-49 In this study, we chose to analyze plasma samples from CRC patients only, without the inclusion of healthy controls, due to the paucity of such studies. A couple of recent studies have further investigated the differences between right- and left-sided colon cancer. One study using plasma metabolomic profiling found significant differences between right- and left-sided colon cancer, with six metabolites identified as potential biomarkers for tumor location.50 A comparative proteog-enomic study found distinct mutations and proteins between right-sided colon cancer, left-sided colon cancer, and rectal cancer.51 Another study investigated plasma protein expres-sion during CRC progression from stage II to III and showed that there are both differences and overlap in plasma protein expression during cancer progression.21 However, this study did not compare plasma protein profiles depending solely on primary tumor location, which is the focus of the current study.
The aim of this study was to establish if plasma protein expression differed in a tumor location-specific manner. This pilot study did not aim to identify candidates for new bio-markers for the diagnosis of CRC, as the current methods of diagnosis, involving colonoscopy and biopsy, are more spe-cific than measuring the levels of plasma proteins. The plasma proteins identified in this study were also not tumor-derived and are therefore non-specific for CRC, as their concentra-tions can be elevated due to other factors and conditions than CRC. This decreases their value as diagnostic markers, and their diagnostic value has subsequently not been validated.
The results of this study show that plasma protein ex-pression is distinct depending on primary tumor location and can clearly classify colon and rectal tumors, and, to a lesser extent, right- and left-sided colon tumors. This study was strengthened by the relatively large number of samples analyzed, although it was limited by the lack of CRC tumor tissues studied simultaneously, which would have enabled the comparison of plasma protein expression with tissue protein expression. In future studies, we aim to analyze and compare protein expression in tumor tissue samples based on location, as well as further investigate the proteins identified here. The findings presented in this study will help to further define colon and rectal tumors (and to a lesser extent, right- and left-sided colon tumors) as separate entities as shown by the widespread differences in plasma protein profile and dysreg-ulated pathways. Additionally, they also provide a basis for
| 5233HOLM et aL.
future studies aiming to continue the investigation of the dis-tinct disease entities that constitute CRC.
ACKNOWLEDGMENTSThe authors thank the mentioned funders.
CONFLICT OF INTERESTThe authors declare no conflict of interest.
AUTHORS’ CONTRIBUTIONSMH, SJ, MS, AR, RR, and CH conceived and designed the study. MH and CH collected the plasma samples as well as the patients’ clinical data. MH, SJ, and TT acquired the mass spectrometric data. MH, SJ, and MS analyzed and interpreted the data. MH wrote the manuscript. All authors revised the manuscript. AR, RR, and CH provided resources.
ETHICS APPROVAL AND CONSENT TO PARTICIPATEWritten informed consent was obtained from all patients prior to sample collection. This study was approved by the Surgical Ethics Committee of Helsinki University Hospital (Dnro HUS 226/E6/06, extension TMK02 §66 17.4.2013). All research was performed in accordance with the Declaration of Helsinki.
DATA AVAILABILITY STATEMENTThe mass spectrometry proteomics data generated dur-ing the current study are available at the ProteomeXchange Consortium via the PRIDE partner repository with the data-set identifier PXD013150 and 10.6019/PXD013150.
ORCIDMatilda Holm https://orcid.org/0000-0001-8453-3936 Mayank Saraswat https://orcid.org/0000-0002-5021-8150
REFERENCES 1. Bray F, Ferlay J, Soerjomataram I, Siegel RL, Torre LA, Jemal
A. Global cancer statistics 2018: GLOBOCAN estimates of inci-dence and mortality worldwide for 36 cancers in 185 countries. CA Cancer J Clin. 2018;68(6):394-424.
2. Arnold M, Sierra MS, Laversanne M, Soerjomataram I, Jemal A, Bray F. Global patterns and trends in colorectal cancer incidence and mortality. Gut. 2017;66(4):683-691.
3. Stewart BWW. C. P. World Cancer Report 2014. Lyon, France: International Agency for Research on Cancer; 2014.
4. Gallois C, Pernot S, Zaanan A, Taieb J. Colorectal cancer: why does side matter? Drugs. 2018;78(8):789-798.
5. Iacopetta B. Are there two sides to colorectal cancer? Int J Cancer. 2002;101(5):403-408.
6. Li FY, Lai MD. Colorectal cancer, one entity or three. J Zhejiang Univ Sci B. 2009;10(3):219-229.
7. Peng J, Li C, Wang F, et al. Right- and left-sided stage III colon cancers present different prognostic outcomes of oxaliplatin-based adjuvant chemotherapy after curative resection. Cancer Manag Res. 2018;10:2095-2103.
8. Nawa T, Kato J, Kawamoto H, et al. Differences between right- and left-sided colon cancer in patient characteristics, cancer morphol-ogy and histology. J Gastroenterol Hepatol. 2008;23(3):418-423.
9. Lee GH, Malietzis G, Askari A, Bernardo D, Al-Hassi HO, Clark SK. Is right-sided colon cancer different to left-sided colorectal can-cer? - a systematic review. Eur J Surg Oncol. 2015;41(3):300-308.
10. Petrelli F, Tomasello G, Borgonovo K, et al. Prognostic survival associated with left-sided vs right-sided colon cancer: a systematic review and meta-analysis. JAMA Oncol. 2017;3(2):211-219.
11. Benedix F, Kube R, Meyer F, et al. Comparison of 17,641 patients with right- and left-sided colon cancer: differences in epidemi-ology, perioperative course, histology, and survival. Dis Colon Rectum. 2010;53(1):57-64.
12. Meguid RA, Slidell MB, Wolfgang CL, Chang DC, Ahuja N. Is there a difference in survival between right- versus left-sided colon cancers? Ann Surg Oncol. 2008;15(9):2388-2394.
13. Bosset J-F, Collette L, Calais G, et al. Chemotherapy with preoperative radiotherapy in rectal cancer. N Engl J Med. 2006;355(11):1114-1123.
14. Hong TS, Clark JW, Haigis KM. Cancers of the colon and rectum: identical or fraternal twins? Cancer Discov. 2012;2(2):117-121.
15. Noone AM, Howlader N, Krapcho M, et al. SEER Cancer Statistics Review, 1975–2015. Bethesda, MD: National Cancer Institute. https://seer.cancer.gov/csr/1975_2015/. based on November 2017 SEER data submission, posted to the SEER web site, April 2018. 2018.
16. Kapiteijn E, Liefers GJ, Los LC, et al. Mechanisms of oncogenesis in colon versus rectal cancer. J Pathol. 2001;195(2):171-178.
17. Guinney J, Dienstmann R, Wang X, et al. The consensus molecular subtypes of colorectal cancer. Nat Med. 2015;21(11):1350-1356.
18. Lim LC, Lim YM. Proteome heterogeneity in colorectal cancer. Proteomics. 2018;18(3-4):3-4.
19. Shen H, Huang J, Pei H, et al. Comparative proteomic study for profiling differentially expressed proteins between Chinese left- and right-sided colon cancers. Cancer Sci. 2013;104(1):135-141.
20. Bauer KM, Watts TN, Buechler S, Hummon AB. Proteomic and functional investigation of the colon cancer relapse-as-sociated genes NOX4 and ITGA3. J Proteome Res. 2014;13(11):4910-4918.
21. Holm M, Joenväärä S, Saraswat M, et al. Differences and overlap in plasma protein expression during colorectal cancer progression. Translational Med Communications. 2019;4(1):14.
22. Holm M, Saraswat M, Joenvaara S, Ristimaki A, Haglund C, Renkonen R. Colorectal cancer patients with different C-reactive protein levels and 5-year survival times can be differentiated with quantitative serum proteomics. PLoS One. 2018;13(4):e0195354.
23. Distler U, Kuharev J, Navarro P, Levin Y, Schild H, Tenzer S. Drift time-specific collision energies enable deep-coverage data-inde-pendent acquisition proteomics. Nat Methods. 2014;11(2):167-170.
24. Silva JC, Gorenstein MV, Li GZ, Vissers JP, Geromanos SJ. Absolute quantification of proteins by LCMSE: a virtue of parallel MS acquisition. Mol Cell Proteomics. 2006;5(1):144-156.
25. Progenesis QI for proteomics. Available from: http://www.nonli near.com/proge nesis /qi-for-prote omics /
26. Serang O, Moruz L, Hoopmann MR, Kall L. Recognizing un-certainty increases robustness and reproducibility of mass spectrometry-based protein inferences. J Proteome Res. 2012;11(12):5586-5591.
27. Xia J, Psychogios N, Young N, Wishart DS. MetaboAnalyst: a web server for metabolomic data analysis and interpretation. Nucleic Acids Res. 2009;37(Web Server):W652-W660.

5234 | HOLM et aL.
28. Chong J, Xia J. MetaboAnalystR: an R package for flexible and reproducible analysis of metabolomics data. Bioinformatics. 2018;34(24):4313-4314.
29. QIAGEN Ingenuity Pathway Analysis. Available from: https://digit alins ights.qiagen.com/produ cts-overv iew/disco very-insig hts-portf olio/analy sis-and-visua lizat ion/qiage n-ipa/?gclid =Cj0KC Qjwpf HzBRC iARIs AHHzy ZoWK-ZtIqI t9erj EArbV vanAY 2XW5q cVWQQ cFhnC bGJJj sPmSO j7p4a Alf9E ALw_wcB
30. Deutsch EW, Csordas A, Sun Z, et al. The ProteomeXchange consortium in 2017: supporting the cultural change in proteom-ics public data deposition. Nucleic Acids Res. 2017;45(D1):D1100-D1106.
31. Vizcaíno JA, Csordas A, del-Toro N, et al. 2016 update of the PRIDE database and its related tools. Nucleic Acids Res. 2016;44(D1):D447-D456.
32. Afshar-Kharghan V. The role of the complement system in cancer. J Clin Invest. 2017;127(3):780-789.
33. Pio R, Corrales L, Lambris JD. The role of complement in tumor growth. Adv Exp Med Biol. 2014;772:229-262.
34. Sugai T, Habano W, Jiao Y-F, et al. Analysis of molecular alter-ations in left- and right-sided colorectal carcinomas reveals distinct pathways of carcinogenesis: proposal for new molecular profile of colorectal carcinomas. J Mol Diagn. 2006;8(2):193-201.
35. Zhang L, Zhao Y, Dai Y, et al. Immune landscape of colorectal cancer tumor microenvironment from different primary tumor lo-cation. Front Immunol. 2018;9:1578.
36. Edwards PA, Kast HR, Anisfeld AM. BAREing it all: the adoption of LXR and FXR and their roles in lipid homeostasis. J Lipid Res. 2002;43(1):2-12.
37. Ulven SM, Dalen KT, Gustafsson JA, Nebb HI. LXR is crucial in lipid metabolism. Prostaglandins Leukot Essent Fatty Acids. 2005;73(1):59-63.
38. Chawla A, Repa JJ, Evans RM, Mangelsdorf DJ. Nuclear re-ceptors and lipid physiology: opening the X-files. Science. 2001;294(5548):1866-1870.
39. Glebov OK, Rodriguez LM, Nakahara K, et al. Distinguishing right from left colon by the pattern of gene expression. Cancer Epidemiol Biomarkers Prev. 2003;12(8):755-762.
40. Yan S, Yang XF, Liu HL, Fu N, Ouyang Y, Qing K. Long-chain acyl-CoA synthetase in fatty acid metabolism involved in liver and other diseases: an update. World J Gastroenterol. 2015;21(12):3492-3498.
41. Frattini M, Balestra D, Suardi S, et al. Different genetic features associated with colon and rectal carcinogenesis. Clin Cancer Res. 2004;10(12 Pt 1):4015-4021.
42. Hundt S, Haug U, Brenner H. Blood markers for early detec-tion of colorectal cancer: a systematic review. Cancer Epidemiol Biomarkers Prev. 2007;16(10):1935-1953.
43. Murakoshi Y, Honda K, Sasazuki S, et al. Plasma biomarker discovery and validation for colorectal cancer by quantitative shotgun mass spectrometry and protein microarray. Cancer Sci. 2011;102(3):630-638.
44. Jimenez CR, Knol JC, Meijer GA, Fijneman RJ. Proteomics of colorectal cancer: overview of discovery studies and identification of commonly identified cancer-associated proteins and candidate CRC serum markers. J Proteomics. 2010;73(10):1873-1895.
45. Nasir A, Lopez A, Boulware D, Malafa M, Coppola D. Correlation between COX-2 and APC expression in left versus right-sided human colon cancer. Anticancer Res. 2011;31(6):2191-2195.
46. Lam AK, Ong K, Giv MJ, Ho YH. p16 expression in colorectal ad-enocarcinoma: marker of aggressiveness and morphological types. Pathology. 2008;40(6):580-585.
47. Aamodt R, Jonsdottir K, Andersen SN, Bondi J, Bukholm G, Bukholm IR. Differences in protein expression and gene ampli-fication of cyclins between colon and rectal adenocarcinomas. Gastroenterol Res Pract. 2009;2009:285830.
48. Aamodt R, Bondi J, Andersen SN, Bakka A, Bukholm G, Bukholm IRK. The prognostic impact of protein expression of E-cadherin-catenin complexes differs between rectal and colon carcinoma. Gastroenterol Res Pract. 2010;2010:1-7.
49. Minoo P, Zlobec I, Peterson M, Terracciano L, Lugli A. Characterization of rectal, proximal and distal colon cancers based on clinicopathological, molecular and protein profiles. Int J Oncol. 2010;37(3):707-718.
50. Deng K, Han P, Song W, et al. Plasma metabolomic profiling distinguishes right-sided from left-sided colon cancer. Clin Chim Acta. 2018;487:357-362.
51. Imperial R, Ahmed Z, Toor OM, et al. Comparative proteogenomic analysis of right-sided colon cancer, left-sided colon cancer and rectal cancer reveals distinct mutational profiles. Mol Cancer. 2018;17(1):177
SUPPORTING INFORMATIONAdditional supporting information may be found online in the Supporting Information section.
How to cite this article: Holm M, Joenväärä S, Saraswat M, et al. Plasma protein expression differs between colorectal cancer patients depending on primary tumor location. Cancer Med. 2020;9:5221–5234. https://doi.org/10.1002/cam4.3178