
Protecting Forward Looking Statements · information in corporate disclosures focuses on the...
59
Protecting Forward Looking Statements Daniela De la Parra Rice University [email protected] K. Ramesh Rice University [email protected] Maclean Gaulin University of Utah [email protected] February, 2020 Abstract We provide the first examination of the determinants of firms’ decision to use a list of keywords in SEC filings to identify forward-looking statements and obtain ‘safe harbor’ protection under the Private Securities Litigation Reform Act. We show that proxies for ex ante litigation risk, disclosure supply, economic uncertainty, and disclosure herding are strongly associated with the decision to include the keyword list. In addition, when we examine the determinants of the number of keywords, we find that both structural variables and proxies for transient forces are statistically significant, with the latter being consistent with lower disclosure costs. Finally, using exploratory factor analysis, we identify five disclosure attributes that capture the most frequent keywords that managers choose. We find that managers use specific keywords that evolve over time, potentially to tailor the language of their forward-looking statements to reflect the economic circumstances they face. Together this evidence provides an important first look at the determinants of firms’ decisions regarding a central feature of ‘safe harbor’ protection. JEL Classification : G14. G32, D83 Keywords : Disclosure, Forward Looking Statements, Litigation Risk Data Availability : Data are available from the public sources cited in the manuscript. Preliminary working draft. Please do not circulate or quote without permission. Prepared for presentation at the 2020 Lone Star Conference. All remaining errors are our own. We thank Allen Huang for providing us with the Liberal Court variable. The internet appendix is available upon request.
Transcript of Protecting Forward Looking Statements · information in corporate disclosures focuses on the...

Protecting Forward Looking Statements
Daniela De la ParraRice [email protected]
K. RameshRice University
Maclean GaulinUniversity of Utah
February, 2020
Abstract
We provide the first examination of the determinants of firms’ decision to use a list ofkeywords in SEC filings to identify forward-looking statements and obtain ‘safe harbor’protection under the Private Securities Litigation Reform Act. We show that proxies forex ante litigation risk, disclosure supply, economic uncertainty, and disclosure herdingare strongly associated with the decision to include the keyword list. In addition, whenwe examine the determinants of the number of keywords, we find that both structuralvariables and proxies for transient forces are statistically significant, with the latterbeing consistent with lower disclosure costs. Finally, using exploratory factor analysis,we identify five disclosure attributes that capture the most frequent keywords thatmanagers choose. We find that managers use specific keywords that evolve over time,potentially to tailor the language of their forward-looking statements to reflect theeconomic circumstances they face. Together this evidence provides an important firstlook at the determinants of firms’ decisions regarding a central feature of ‘safe harbor’protection.
JEL Classification: G14. G32, D83Keywords: Disclosure, Forward Looking Statements, Litigation RiskData Availability : Data are available from the public sources cited in the manuscript.
Preliminary working draft. Please do not circulate or quote without permission. Prepared forpresentation at the 2020 Lone Star Conference. All remaining errors are our own. We thankAllen Huang for providing us with the Liberal Court variable. The internet appendix is availableupon request.

I. INTRODUCTION
The Private Securities Litigation Reform Act (PSLRA) of 1995 affords firms protection for
disclosures they make about uncertain future events. These legal protections are contingent
upon identifying which statements are forward-looking, and including clear cautionary lan-
guage that the forward-looking statements (FLS) made by the firm are subject to uncertainty.1
Johnson, Kasznik, and Nelson (2001) find that the passage of PSLRA led to increases in
voluntary and credible disclosures of forward-looking information by high technology firms,
especially so when firms faced higher ex-ante risk prior to PSLRA. In addition, extant
literature shows that firms disclose FLS to convey private information to markets and that
the capital markets find such information to be value relevant (see Section II). However, the
question of how firms identify FLS in order to be eligible for ‘safe harbor’ protection has not
been explored, and without a clear identification of FLS, courts have held that protection for
FLS is not guaranteed.
We study an increasingly prevalent managerial disclosure practice of listing specific
keywords in SEC filings that firms assert will be used in constructing forward-looking
statements, thereby clearly identifying FLS to support their claim for ‘safe harbor’ protection.
Firms decide whether to have a list of keywords, and if so, which specific keywords to
include. Moreover, both decisions can potentially change from year to year depending on the
cost-benefit calculus. The purpose of our study is to explore the factors underlying these
disclosure decisions, and thereby, provide evidence on an important precursor to receiving
legal protection to safely convey valuable forward-looking information to the marketplace.
We do not expect the demand for forward-looking information to directly shift in response
to PSLRA, so we focus on supply-side factors to explain managerial choice regarding keyword
inclusion. Moreover, given that firms may face significant disclosure costs from abandoning a
keyword list (Einhorn and Ziv 2008), the decision to include the list is likely determined by
structural factors rather than transitory issues. Specifically, we predict that ex ante litigation
1Pub. L. 104-67, 109 Stat. 737
1

risk (Johnson et al. 2001), disclosure propensity, economic uncertainty, and disclosure herding
or bandwagon effects (Hirshleifer and Teoh 2003) are associated with the decision to include a
keyword list. However, firms may change keywords from year to year to respond to changing
economic circumstances affecting the forward-looking information disclosed. As a result,
we predict that both structural and time-series effects are likely to explain the variations
in the number of keywords. Finally, using exploratory factor analysis, we identify different
combinations of words that managers chose to represent different disclosure attributes that
they would like to include when conveying FLS.
We parse the text in the 10-Ks of every SEC registrant from 1996 to 2017 and extract the
list of FLS keywords when present. Our filtering procedure results in a sample of 132,303
annual reports, of which 66% contain FLS keywords. We find considerable variation in the
cautionary narrative, both across firms, across economic conditions, and across time. The
adoption of these FLS keyword lists increases drastically from 13% to 91% over the two
decades since the passage of the PSLRA.
As suggested by the litigation risk argument, we find that firms located in federal circuits
with more liberal judges (Huang, Hui, and Li 2019) have a higher probability of including
FLS keywords in their 10-K reports. In terms of disclosure supply, firms that issue guidance
and provide more disclosures in their 10-K reports are more likely to have a keyword list.
Consistent with the predicted influence of uncertainty, we find that younger firms, firms with
R&D investments, firms facing losses, and those engaged in significant M&As are more likely
to include keyword lists and thereby gain ‘safe harbor’ for their forward-looking disclosures
intended to mitigate investor concerns. The inter-temporal increase in the adoption of a
keyword list is at least partially driven by firms learning from the disclosure practices of
industry peers, consistent with herding or bandwagon effects.
We obtain additional insight from examining sub-samples based on firms’ disclosure
practices. In firms that are persistent adopters (always or never disclose a keyword list), our
regressions have much higher explanatory power, and firms subject 10b-5 lawsuits and those
2

with legal expertise in senior management tend to include keywords more often. For those
firms that made a structural decision to switch (only once during our sample), none of the
litigation-related variables are significant, consistent with other structural shifts post-PSLRA
effecting the switch. To shed light on the inter-temporal trend in adoption, we re-run our
regressions by dividing the sample into three sequential time periods. A key finding is that
all of the disclosure herding behavior occurs in the first seven years (of our 22-year sample),
which provides some preliminary evidence on the speed with which firms in the economy
achieved equilibrium in response to a new disclosure regulation.
When we examine the determinants of the number of keywords in the list, we find both
structural variables and proxies for transient forces are statistically significant, with the
latter being consistent with our expectation that the disclosure costs of changing specific
keywords is not prohibitive. Specifically, firms with more left skewed returns, those that
recently entered the capital market, or those experiencing an executive turnover include more
keywords.
We next conduct an exploratory factor analysis to identify the different disclosure attributes
that firms may employ to prepare forward-looking statements. By analyzing the top-20 most
used keywords, we identify five disclosure attributes that substantially capture the variations
in the overall choice of the keyword list in our sample. We call these attributes future state,
modal verbs, likelihood, quantitative, and future action. We find that firms consistently use
words describing the likelihood of events or actions since the passage of the PSLRA, while
the use of words capturing other disclosure attributes contribute to the inter-temporally
increasing use of keywords.
We obtain several insights from separating the bag of keywords into specific disclosure
attributes. Consistent with higher litigation risk, firms in liberal courts include keywords that
can be used to describe future state or provide quantitative information, thereby limiting
any shareholder lawsuits from unmet expectations. Managers that frequently guide may be
expected to also explain their plans, so they include keywords that convey future action and
3

quantitative information. Younger firms use all disclosure attributes, except quantitative
information, to mitigate investor concerns regarding uncertainty. In addition, firms with
high stock return volatility avoid keywords that convey potentially uncertain quantitative
information, but rely more on words that can help qualitatively convey information regarding
future action or future state. Taken together, we find that managers selectively choose words
that capture different disclosure attributes to obtain legal protection under varying economic
circumstances.
Our study contributes to the literature on forward-looking statements by highlighting an
important aspect of forward-looking statements, namely the requirement under the PSLRA
that they be clearly identified. We also demonstrate that managers choose their cautionary
language in a non-random or boilerplate fashion. Prior research studying forward-looking
information in corporate disclosures focuses on the determinants of FLS, the quantity and
quality of these voluntary disclosures, and the channels through which firms convey their
FLS. To our knowledge, we are the first to empirically explore the aspect of identifying
forward-looking information as required under the PSLRA.
Our study also contributes to the broader accounting literature focusing on textual
disclosures. Our findings that managers selectively choose the language with which they
convey information to markets suggests that a careful approach to linguistic analysis in
general may be warranted. Traditional bag of word dictionary approaches, while providing
important information about broader disclosure trends, may not always be suited to the
study of idiosyncratic firm behavior. Our results suggest that a ‘one size fits all’ methodology
may overlook important firm and managerial decisions, which could apply broadly to how
the research community evaluates textual disclosures.
4

II. LITERATURE AND RESEARCH DEVELOPMENT
Background and Literature
To meet the information demand from various stakeholders, firms convey their forward-looking
information through voluntary disclosures. One potential cost of these disclosures is that
they are inimically tied to legal liability from 10b-5 securities litigation. On the one hand,
managers may believe that by voluntarily disclosing adverse information in a timely fashion,
they can lessen any negative impact on stock prices—which could otherwise trigger a securities
litigation (Skinner 1994, 1997; Field, Lowry, and Shu 2005).2 Consistent with this theory,
Naughton, Rusticus, Wang, and Yeung (2019) find that after a plausibly exogenous reduction
in litigation risk, firms reduce their overall level of voluntary forecast disclosures. On the
other hand, a 10b-5 litigation can be triggered by a misleading or fraudulent disclosure.3
Managers may thus see voluntary disclosure as a potential catalyst for litigation risk (Rogers
and Van Buskirk 2009).
The question of how forward-looking disclosures affect firm’s risk is relatively new,
because for the first 40 years of its existence, the SEC prohibited firms from voluntarily
disclosing: forward-looking information about financial projections, management plans and
future operations, or expected future economic performance. In 1973, the SEC provided an
interpretative release that lifted this prohibition, allowing reporting companies to disclose
projected sales and earnings information. The new rules required that firms disclose updates
to any material changes in forecasts, and file with the SEC any projections disclosed through
other channels.
Despite the SEC’s intent to promote disclosure of FLS, their proposed safe-harbor
protections were rarely pleaded in securities litigation. Instead, courts developed the ‘bespeaks
caution doctrine,’ which held that forward-looking statements would not be considered
misleading if accompanied by adequate risk disclosure cautioning readers about specific risks
2We assume incentive alignment between the firm and the manager, and use the terms firms and managersinterchangeably throughout the paper.
3Specifically, U.S.C §240.10b-5 states that, “It shall be unlawful for any person [...] To make any untruestatement of a material fact”
5

that could materially impact forecasts and predictions. Over the years, numerous cases were
litigated over misleading FLS without adequate cautionary language (e.g. Inst. Investors
Group v. Avaya, Inc. 564 F.3d 242, 256; 3d Cir. 2009), and numerous were dismissed as
the cautionary language was found to be sufficient (e.g. Convergent Technologies Security
Litigation, 948 F.2d 507, 515; 9th Cir. 1991). The disparate application of the bespeaks
caution doctrine created significant uncertainty regarding liability stemming from FLS.
In an effort to ameliorate this uncertainty, the Private Securities Litigation Reform Act was
passed in 1995. The PSLRA provides an avenue for managers to disclose valuable, forward-
looking information without fearing the financial and managerial costs of unmeritorious
lawsuits. However, there are three requirements to receive protection under PSLRA: first,
firms must clearly identify statements that are forward-looking, second, they must ensure
that FLS are not made with the knowledge that they are false or misleading, and third, FLS
must be accompanied by cautionary language. Nelson and Pritchard (2016) examine the
impact of the changes in cautionary language after the passage of the PSLRA, and find that
firms’ equilibrium level of voluntary disclosure is increasing in the protections afforded. In
addition, extant research focuses on the incentives of firms to disclose FLS to convey their
private information to markets, and the market reaction to these disclosures.4 These studies
presume protection of the forward-looking disclosures, but they do not explicitly address the
issue empirically.
Our study focuses specifically on the PSLRA requirement that firms must identify
forward-looking statements to gain the ‘safe harbor’ protection. We identify the increasingly
prevalent managerial disclosure practice of listing specific keywords that are meant to signal
forward-looking statements, to obtain ‘safe harbor’ protection (see Appendix C for examples).
Keyword-lists are suggested in contemporary practitioner literature (Chivers and Quinn
2009), as well as in complaints and court cases. However, managers might believe that a
4See, e.g., Johnson et al. (2001); Kimbrough and Louis (2011); Muslu, Radhakrishnan, Subramanyam, and Lim(2015); Bochkay, Chychyla, and Nanda (2016); Bozanic, Dietrich, and Johnson (2017); Bozanic, Roulstone,and Van Buskirk (2018); Hutton, Miller, and Skinner (2003); Li (2010); Hassanein and Hussainey (2015);Bozanic and Kraft (2018); Bozanic et al. (2018)
6

boilerplate list of keywords would be sufficient to gain protection. For example, McClane
(2019) suggests that “the skill [lawyers entering corporate securities practice] employ most
is the ability to cut and paste.” Consistent with this, Dyer, Lang, and Stice-Lawrence
(2017) demonstrate that over the past two decades, the use of boilerplate language has been
increasing. To derive keywords lists, lawyers could easily utilize generic word-lists such as
those used in Bozanic et al. (2018).
Given the focus and significance that courts have placed on identifying forward-looking
statements, the argument that boilerplate disclosure garners sufficient protection appears
unlikely. In Southland Securities v. INSpire Insurance Solutions Inc. (365 F.3d 353, 2004),
the Fifth Circuit US Court of Appeals emphasized the importance of identifying FLS: “the
defendants have not shown that these statements were identified as forward-looking statements.
Accordingly, the plaintiffs may properly allege a claim based on these statements...” Similarly,
In re Griffin v. GK Intelligent Systems, Inc. (87 F. Supp. 2d 684, 1999): “the challenged
statements do not fall within the ‘safe-harbor’ provision because they were also not clearly
identified as ‘forward looking.”’ Most notably, in Slayton v. American Express Company
(604 F.3d 758, 2010), the Second Circuit US Court of Appeals specifically mentioned the
inclusion of a list of words is sufficient to identify FLS: “The Company wrote, “[t]he words
‘believe’, ‘expect’, [...] are intended to identify such forward-looking statements.” [...] The
May 15 statement is plainly forward-looking—it projects results in the future. It is also
accompanied by a statement of the common-sense proposition that words such as ‘expect’
identify forward-looking statements.” This evidence suggests that FLS keyword lists are an
important part of gaining PSLRA protection. We seek to add to the literature by providing
novel evidence on the determinants of FLS keyword disclosures.
Key Determinants of Protecting Forward-Looking Statements
Given that the legal protection standards were altered by a change in securities laws, we
focus largely on supply-side considerations in explaining managerial choice to include a list of
keywords. We do not expect the demand for forward-looking information to directly shift in
7

response to PSLRA.5 In addition, we view the decision to include a keyword list as more of a
structural decision rather than being transitory in nature. Once included, firms may face
significant disclosure costs from abandoning a keyword list (Einhorn and Ziv 2008) although
structural shifts in economic conditions could more easily justify the creation of a list.
We view litigation risk as a key determinant of including a list of keywords. Previous
research has largely focused on the relationship between voluntary disclosures and litigation
risk, with mixed evidence on whether disclosures deter or trigger shareholder litigation. In
our setting, we focus on the specific decision to garner legal protection through FLS keyword
disclosure that is designed to meet the legal standards. Thus our prediction regarding
litigation risk is more unambiguous than those for disclosures in general. We expect firms to
be more likely to seek ‘safe harbor’ when their ex-ante litigation risk is increasing (Johnson
et al. 2001). If disclosure mitigates litigation risk, then firms’ use of disclosure will increase
in litigation risk, and therefore, the value and use of a keyword list should increase. If, on
the other hand, disclosure exacerbates litigation risk, then protections of that disclosure are
even more valuable. Thus, we expect the relationship between ex-ante litigation risk and
FLS keyword disclosure to be unconditionally positive.
To the extent PSLRA reduced disclosure costs, firms are bound to disclose more quan-
titative and qualitative FLS at the margin. If managers did not have private and credible
forward-looking information in the first place, a new statute’s ability to offer protection for
such statements is unlikely to lead to more disclosures. As a result, we predict a positive
association between the supply of disclosures and the propensity to include a keyword list
given the expected reduction in disclosure costs.
Firms with uncertain future outlook may be hesitant to provide FLS for fear of shareholder
litigation. The uncertainty may arise from risky growth opportunities, financial distress,
5We do not rule out indirect demand-side effects. For instance, analysts who abandoned firms that could notprovide forward-looking information due to litigation uncertainty could gravitate towards such firms postPSLRA and demand more forward-looking information. In our empirical specifications we include controlsfor analyst following and institutional ownership, but we are agnostic about the nature of these economiceffects.
8

or strategic long-term investments that could cause information fractions and limit the
ability of the firm to convey value-relevant information. Alternatively, firms could respond to
uncertainty by reducing or maintaining their disclosure levels, for example if the uncertainty
implies positive skewness in expected cash flows (Heinle, Smith, and Verrecchia 2018). Ceteris
paribus, to the extent PSLRA reduces the cost of sharing information on potentially risky
outcomes, managers facing uncertain environments are, at the margin, more likely to include
a keyword list to facilitate their disclosure strategy.
A potential alternative rationale for adoption of FLS keyword disclosure is herding or
bandwagon effects. Informational cascades require some coarseness to the signal, such that
there is not a continuous correlation between private information and outcome (Hirshleifer
and Teoh 2003). Given our signals are quite coarse (a binary disclosure decision and keyword
counts), it is plausible that herding might occur, whereby firms adopt a legal disclosure
strategy based on the public observation of other firm disclosure (Bikhchandani, Hirshleifer,
and Welch 1998). We are agnostic as to whether this herding may arise due to rational or
irrational agents, as it is difficult to disentangle the empirical predictions (Hirshleifer and
Teoh 2003). Given the ability of firms to observe both disclosure decisions and litigation
outcomes of their peer firms, it is plausibly beneficial for firms to adopt the legal protection
strategies that appear to be successful for other firms. This is consistent with prior findings
on herding in other managerial disclosures (e.g. Tse and Tucker 2010; Jung 2013; Armstrong,
Glaeser, and Kepler 2019). As discussed in Section IV, we find that while less than 20 percent
of the firms included a keyword immediately after the passage of the PSLRA, more than 90
percent do so 20 years later. To the extent herding behavior can explain this trend, it could
provide new insights regarding the long-term evolution of corporate disclosure strategy.6
We distinguish between the decision to disclose FLS keywords and the decision of how
many or which words to include. Unlike the inclusion of a dictionary, the potential disclosure
6Such inter-temporal trends are not uncommon in the disclosure area (e.g., the sharp decline in the number offirms announcing earnings during regular trading hours over the last three decades). However, only limitedevidence is available on the economic forces at work that contributed to such trends.
9

costs of adding or excluding some of the keywords are not expected to be as prohibitive. In
fact, the investors may view such changes as an indication of managerial efforts to convey
contextual forward-looking information.7 As a result, both structural and time-series effects
are likely to explain the variations in the number of keywords. Consistent with this expectation,
empirically there is no inter-temporal convergence in the number of keywords across firms
(the standard deviation in number of keywords increases from 2 to 4.6 over the course of
our sample period). In other words, there are economically meaningful cross-sectional and
time-series variations in the number of keywords used to identify FLS. We, therefore, predict
that the decision as to which keywords to include or exclude is likely influenced by economic
events firms are likely to discuss in their FLS when they enter the capital market, when they
experience executive turnover, when the current market perceptions of risk are high, etc.
III. DATA AND METHODOLOGY
Sample Selection
We begin with the intersection of firm-years from Compustat and EDGAR. As in Dyer et al.
(2017), we focus on 10-K reports, especially given the substantial variations in the type and
extent of disclosures between quarterly and annual reports, with more extensive disclosures
in the 10-K reports. We use the CIK from CRSP’s Comphist file to match these firm-years
to their appropriate 10-K filing from EDGAR. This match results in 158,744 firm-years with
EDGAR data. Given that we parse the text to extract any FLS keyword lists, we then
exclude filings that are unavailable for scraping or whose HTML format is either missing
or broken. For a small sample of firm-years (564), we fill in missing keywords information
using the FLS keyword lists from the two adjoining years (only when they are identical). To
maintain a consistent legal environment for the disclosures we study, we also exclude 10-Ks
filed before the PSLRA became effective on December 22, 1995. We drop firms with one or
more gaps in their EDGAR data (that we can not interpolate in the previous step) and then
7Our discussions with the Chief Accounting Officer of a large publicly-traded bank suggest that the bankmade a conscious decision to include or exclude certain keywords when engaged in an acquisition andfollowing implementation of the Dodd-Frank Act.
10

we drop firms with fewer than two years of EDGAR data. Lastly, we drop firm-years with
fiscal year end before 1996, when the EDGAR system started gaining widespread adoption.
Our resulting sample includes 132,303 firm-years from 14,722 firms, spanning the fiscal years
from 1995 to 2017. The sample selection is detailed in Table I.
[Table I about here.]
Computation of Disclosure Measures
We use regular expressions to parse the text from 10-K filings and extract the list of keywords
used by firms to identify forward-looking statements. The FLS keyword list is often found in
one of three places in the 10-K filing: at the beginning or end of the Management’s Discussion
and Analysis section, immediately preceding the Risk Factor section, or at the beginning of
the 10-K under a subsection called “Forward-Looking Statements” (or similar). We search
for quoted lists of words near forward-looking phrases (e.g. “forward-looking,” “cautionary
statements,” and “safe harbor”) and extract the FLS keyword list when present. We use a
similar procedure to extract the FLS keyword list from the fourth-quarter earnings press
releases submitted as Item 2.02 in 8-K filings. Appendix B provides a detailed description of
the text extraction procedure.
From the extracted data, we measure FLS Keywords Inclusion as an indicator variable,
which is equal to one if the 10-K report for a given fiscal year includes an FLS keyword list.
We then measure # Keywords as the number of keywords included in the list. To verify the
quality and accuracy of our extraction technique, we hand-verified several random samples.
In the rare case our methodology resulted in errors, it was typically due to technical issues
such as filing encoding or significant English or gramatical errors.
Research Design
We estimate the following probit regression (baseline regression) to test our predictions
regarding the firm, industry, and macro characteristics that are associated with the decision
11

to include a list of FLS keywords:
FLS Keywords Inclusionit = α + β1Liberal Courtit + β210b-5 Firm it
+ β3FPSit + β4Legalit + β5Guidanceit + β6Log(10-K Size)it−1
+ β7Log(Age + 1)it + β8R&Dit + β9Loss Y earit + β10Acquisition Sales Ratioit
+ β11Industry Adoptionit−1 + ΣδjControlsit + εit
See Appendix A for variable definitions. We consider three proxies for litigation risk
(Liberal Court, 10b-5 Firm, FPS ), and one measure of legal expertise at the top management
level (Legal). Liberal Court, from Huang et al. (2019), measures the probability that the
three-judge panel assigned to a case in a circuit court is composed by at least two judges
appointed by Democratic presidents. The higher the measure, the higher the probability that
the case will be decided in favor of shareholders; thus, the higher the plausibly exogenous
ex-ante litigation risk. Using data from the Stanford Law School’s Securities Class Action
Clearinghouse, we construct the indicator variable 10b-5 Firm as a firm-level measure of
litigation propensity, which is set equal to one if the firm is sued at least once during our
sample period. Following Francis, Philbrick, and Schipper (1994), FPS is an indicator for high
litigation industries.8 We expect positive coefficients on the litigation risk proxies, consistent
with firms with higher litigation risk including a list of FLS keywords to garner protection
under PSLRA. Lastly, Legal is an indicator variable that takes a value of one when one of
the officers identified under Item 401 of Regulation S-K is a lawyer or a corporate secretary
(using data from the BoardEx database). We expect that this legal expertise will increase
the propensity for disclosure preferences which are more legally risk averse, thus a higher
likelihood of FLS keyword list inclusion.9
8These industries are defined using SIC codes, and they include biotechnology (2833-2836, 8731-8734),computers (3570-3577, 7370-7374), electronics (3600-3674), and retailing (5200-5961).
9The tenor of our results holds when we limit Legal to only lawyers in senior management.
12

We consider two measures of disclosure which we predict are positively associated with
the likelihood of FLS keywords inclusion. The first, Guidance, is an indicator variable equal
to one if management issues any guidance during the fiscal year. As the primary intent of
cautionary language is to protect forward-looking disclosures such as financial projections,
we expect guiding managers to derive more value from the PSLRA, consistent with Johnson
et al. (2001). The second, Log (10-K Size), is the length (logged) of the previous year’s
10-K, which is a proxy for the overall amount of disclosure. We expect that as the amount of
disclosure increases, the exposure to litigation risk increases commensurately, and so to the
value of “safe harbor.”
We consider four measures related to idiosyncratic firm uncertainty. Following Li (2010),
we use firm age (Log(Age + 1)) as an inverse proxy for uncertainty. If younger firms are more
hesitant to discuss future outlook, they are more likely to rely on a keyword list to obtain
litigation immunity. We use an R&D indicator consistent with Kothari, Laguerre, and Leone
(2002), who argue that the benefits from R&D investments are much more uncertain than
those from PP&E. Similarly, mergers and acquisitions (Acquisition Sales Ratio) potentially
induce both uncertainty and litigation risk, thus managers would have heightened incentives
to discuss future prospects. Bloomfield (2008) suggests that loss firms (Loss) may require
greater amount of disclosures to better “describe” the economic circumstances, and as a
result, we expect a greater need for forward-looking statements. Our proxy for disclosure
herding is Industry Adoptiont−1, which is the percentage of firms within a GICS industry
group that adopted a FLS keyword list in their 10-K during the fiscal year t− 1.
The focus of our study is on the change in disclosure costs and benefits due to a change
in securities laws. We, therefore, focus largely on supply side factors to explain the disclosure
choice. However, some of our additional control variables could be viewed, at the margin, as
capturing the demand-side response. Specifically, we include an indicator for whether the
firm has any analyst following, and the percentage of stock owned by institutional investors
(Inst Own) as potential demand-side controls. Although the marginal effect of a Big-N
13

auditor on the inclusion of a keyword list is unclear, we include the Big N Auditor indicator
variable as a control as well.
We then expand our base regression specification to include transient institutional owner-
ship and the change in the 10-K size. Because our proxies for uncertainty reflect a parsimonious
set of firm economic conditions, we include additional indicators for firm life-cycle stages
(Dickinson (2011)), with the indicator for mature stage being the omitted base-stage.
We view the decision to include of a list of FLS keywords as a structural decision, which is
unlikely to change periodically. However, firms may decide to include or eliminate keywords in
response to structural changes in economic circumstances, despite the fact that theory suggests
the cost of abandoning a keyword list may be higher (Einhorn and Ziv 2008). Regardless, we
expect stickiness in the decision to include a list. As a result, our probit regression results
are more likely to reflect the structural decisions rather than any time-varying changes. To
address this, we exploit the structural choice argument in our empirical analysis by examining
the disclosure behavior of different sub-groups of firms.
We acknowledge that our models are not designed to necessarily identify a causal relation-
ship. Variables such as Liberal Court and lagged industry adoption are plausibly exogenous
(or at least pre-determined), so identification issues such as reverse causality are unlikely.
Similarly, without an economic incentive to supply forward-looking information in the first
place, management is unlikely to provide guidance solely due to the inclusion of a list of FLS
keywords. We do not directly test for time-series variations in the consequences of firms’
decision regarding the inclusion of a keyword list. For instance, it is possible that analyst
following and institutional ownership change in predictable ways following the inclusion or
elimination of a keyword list. We hope to explore such possibilities and other plausible causal
effects in future revisions.
Conditional on including a list of keywords, we estimate the following Poisson regres-
sion (baseline regression) to test our predictions regarding the firm, industry, and macro
characteristics that are associated with the number of keywords to identify forward-looking
14

statements:10
# Keywordsit = α + β1Liberal Courtit + β2Legalit + β3∆ Log(10-K Size)it
+ β4Log(10-K Size)it−1 + β5Log(Age+ 1)it + β6R&Dit + β7Loss Y earit
+ β8Acquisition Sales Ratioit + β9ROA Decilesit + +β10IPOed within 3yrsit
+ β11Industry Avg. # KWit−1 + β12Big N Auditorit + β13CEO Changeit
+ β14CFO Changeit + ΣδjControlsit + εit
We retain many of the variables from the probit specification. We substitute the average
number of keywords within the firm’s industry (Industry Avg. # KWt−1) as the disclosure
herding proxy. Unlike the decision regarding the inclusion of an FLS keyword list, it is rational
to expect that managers could update the list of FLS keywords depending on informational
demand and supply consideration or other changes in their FLS disclosures. As a result, we
include a series of additional explanatory variables to reflect such time-varying considerations.
To capture any differential demand for forward-looking information of firms that are new to
the equity market, we include an indicator variable for firms that had an IPO within the last
three years (IPOed within 3yrs).We include two executive turnover variables (CEO Change
and CFO Change) and two returns-based metrics (Return Volatility and Return Skewness) to
capture short-term demand effects of shocks to business conditions. We consider regression
specifications with (market) and without (baseline) the market-based metrics as the inclusion
of the two variables significantly restricts our sample size. Managers’ reliance on the number
of keywords to convey forward-looking information could vary with firm performance, so we
include ROA Deciles as a final control.
10We do not believe this is a case of self-selection, which requires well-defined counterfactual outcomes inthe two states. Without a list of keywords, the choice of the number of keywords is moot. Given that thedecision to have a list of keywords and the number of words to include are made by the same economicagent, we could estimate a single Tobit regression by including zeroes for the number of keywords forfirm-years without a list. The results of this Tobit regression are available upon request. While the Tobitresults are comparable to our probit/Poission regression results, they cannot provide differential insightsregarding the two dimensions of the decision: inclusion of the list and the choice of the number of keywords.
15

IV. RESULTS
Descriptive Statistics
Table II presents descriptive statistics on our sample. Panel A shows the rate of FLS
keyword list adoption over time, distinguishing between the three sub-periods that we
examine separately in our analyses below. For each fiscal year, we report the number and
row percentage of firms that include an FLS keyword list in their 10-K filing. The portion of
firms with an FLS keyword list has been steadily increasing, starting with only 13% of the
firms one year after the passage of the PSLRA, and reaching 91% by 2017.
Panel B presents the portion of firms with FLS keywords by industry (based on the Global
Industry Classification Standard codes, or GICS).11 The heading “All Years” reports the
number (Obs) and percentage of observations (Obs % ) for each of the twenty four industry
groups in our sample period. Each of the remaining headings shows the rate of FLS keyword
adoption during a subperiod, with Obs % representing the number of firm-years within each
industry group during a given subsample as a percentage of the total number of firm-years
for that subperiod. Column KW % shows the percentage of firm-years within each industry
group that has an FLS keyword list during the subperiod. The distribution of industries is
generally stable across the sub-periods, although there are some inter-temporal variations.
Pharma and Energy sectors represent a larger proportion of the sample in the last sub-period,
with consumer durables and technology equipment declining by more than two percentage
points.
The dispersion in FLS keyword adoption has decreased dramatically from the first sub-
period (29.9 to 52.6) to the last (82.7 to 92.8). Consistent with this result, although all
industry sectors experience a large increase in the rate of inclusion of a keyword list, there
are notable differences. While the inclusion rate increased by more than 60 percentage points
11We first collect GICS codes from CRSP’s Comphist dataset. We substitute the missing codes with backand forwardfilled missing GICS codes from Compustat’s Co hgic dataset. We make sure that the fiscal yearend of the firm is between the effective dates of the dataset GICS codes (indfrom and indthru). Lastly, wesubstitute the remaining missing codes with back and forwardfilled GICS codes from Compustat’s Companydataset.
16

in the Materials sector, it was less than 40 percentage points in semiconductors. Although
there is an increase in KW % across all three sub-periods, the inter-industry variation has
declined substantially in the second sub-period, with a coefficient of variation of 0.053 that is
much closer to that of the third sub-period than the first.
Panel C provides the average number of keywords (# KW ) by industry group for each of
the subperiods, for the subsample of firms that include FLS keywords. Overall, the number
of keywords has increased from an average of 7 words to almost 12 words by the end of
our sample period, with comparable increases across all industry sectors. This is further
substantiated by a comparable coefficient of variation in inter-industry means of number of
keywords across the three sub-periods. In other words, the inter-temporal increase in the
number of keywords has not altered its cross-industry variation.
[Table II about here.]
Table III Panel A provides univariate statistics for our main explanatory variables by FLS
keyword list inclusion. The t-statistics on the differences are calculated with standard errors
clustered by firm. The differences between firms with and without FLS keywords are largely
in the expected directions (with the exception of ∆ Log(10−K Size) and Acquisition Sales
Ratio). Firms with FLS keyword lists are more likely to have analyst following and larger
institutional ownership. Mature firms are less likely to have a keyword list. Panel B reports
the Pearson correlation matrix of the explanatory variables.
[Table III about here.]
FLS Keywords Inclusion Determinants
Table IV provides results of probit regressions for the baseline and expanded models. Given
that the inferences are largely identical, we focus on the expanded regression and highlight
circumstances when the results differ. Among the litigation variables, only Liberal Court
is statistically significant, consistent with firms in liberal circuits facing increased risk of
17

class-action lawsuits, and therefore seeking safe harbor protection by using a keyword list
to explicitly identify FLS. Variables proxying for disclosure supply, firm uncertainty, and
disclosure herding are all statistically significant in the predicted directions. Firms providing
forward-looking guidance and with large volume of disclosure choose to have a keyword list,
likely to facilitate their equilibrium disclosure strategy. The behavior of R&D intensive firms,
firms engaged in larger acquisitions, and those experiencing losses is consistent with the need
for FLS to help investors resolve uncertainty. A firm’s propensity to adopt a list is strongly
associated with that of its industry peers, providing support for the posited herding behavior.
We find a significant positive relation between analyst following and the inclusion of FLS
keywords, but an insignificant association with the overall level of institutional ownership.
However, when we decompose the institutional ownership by types, we find that firms with
larger transient ownership specifically are more likely to seek increased legal protection for
their forward-looking information.12 To the extent that FLS improve price efficiency and
mitigate trading costs, transient institutions are more likely to gravitate towards such stocks
(Bushee and Noe 2000). Firms at the end of the life cycle spectrum show a need for protecting
FLS, consistent with the investors’ concerns about residual value.
As we discussed above, the choice of including a list of keywords is a structural decision.
To better understand its determinants, we divide the sample into firms that have one keyword
disclosure policy throughout their inclusion in our sample period (persistent adopters) and
those that switched their policy at least once (switchers). We further subdivide the latter
group into those who switch only once in our sample period (structural switchers) and those
who switch more than once (transient switchers). The sub-sample regression results are
provided in columns (3) through (6) of Table IV.13
12For sake of parsimony, we include only transient ownership in our regression, although none of the othercategories of institutional ownership (dedicated, quasi indexers, and other) significantly loads in theexpanded regression.
13The propensity to switch to include a keyword list likely increases over time, and by definition, firms ageover time. To avoid any spurious effects, we exclude Log(Age + 1) from the switchers regressions (columns(4) through (6) of Table IV). Given that the focus is on inter-temporal switching, we also exclude 10b-5Firm and FPS from these regressions as they are time invariant. None of the three variables is significantfor the structural or the transient switchers. When we include the three time invariant indicators, R&D
18

The amount and growth of disclosure is significantly associated with the inclusion of the
keyword list in all sub-samples. Whether the reasons for the disclosure policy are structural
or transient, firms that disclose more are prone to obtain explicit legal protection for FLS.
Among the sub-samples, the Pseudo R-squared increases by roughly 80% when we focus
only on the persistent adopters (19.6% to 35.2%). Unlike the results for the overall sample,
persistent adopters with litigation exposure (10b-5 Firm) or with legal expertise in the senior
management (Legal) are keen to protect their FLS from frivolous shareholder litigation. The
latter is consistent with the finding in Kwak, Ro, and Suk (2012) that legal expertise in top
management increases the likelihood of management forecasts, thereby supporting the need
for their legal protection. However, the existence of the transitory measures: losses, M&A
intensity, and disclosure herding do not explain the disclosure policy choice of persistent
adopters, which is expected. For these firms, litigation risk, disclosure supply, firm age, and
innovation uncertainty are factors that influence their decision to include a keyword list
initially.
In contrast, structural switchers are likely to be swayed by the propensity of their industry
peers to obtain legal protection. In addition, occurrence of losses and increased M&A intensity
further contributes to their desire to adopt a keyword list. Among the control variables, the
significance of Analyst Following in the overall sample is largely due to its effect among the
sample of structural switchers. Taken together, by subdividing our sample, we show that while
fundamental firm characteristics and litigation risk influence the behavior of unitary adopters,
disclosure herding and changing business conditions influence the structural switchers.14
[Table IV about here.]
Given the steep inter-temporal trend in the adoption behavior, we re-estimate our expanded
regressions for each of the three sub-periods; the results are reported in Table V. The purpose
becomes significant at the 0.10 level with a negative coefficient for transient switchers, i.e., R&D firms areless likely to be stopgap adopters.
14We have not fully explored the disclosure behavior of transient adopters, but we find that these firms aremore likely to be in the declining stage of their life cycle.
19

of this analysis is to test for varying effects of the disclosure policy determinants over
time to better understand the steep increase in the adoption behavior over our sample
period. Disclosure supply and firm age are significant in all sub-periods.15 More importantly,
disclosure herding documented in Table IV is confined to the first sub-period. In other
words, any equilibrium adjustments in response to peer behavior occurred in the early years
after the passage of PSLRA, as reflected in the structural switchers sample in Table IV. In
Table II Panel B we show that inter-industry variations in the adoption behavior reached
“steady state” by the second sub-period, consistent with the disclosure herding behavior being
limited to the first sub-period. Overall, the sub-period analysis sheds additional light on the
determinants of the inter-temporal adoption behavior.
[Table V about here.]
Determinants of Number of Keywords
After investigating the determinants of the decision to include an FLS keyword list, we then
turn to the determinants of how many keywords to include. The distribution of keywords
varies widely across firms, as demonstrated in Figure I.
[Figure I about here.]
Table VI reports results of the determinants model for the number of keywords. The
Poisson regressions are limited to those firm-years with an FLS keyword list. Specifications
(1) and (2) include the full sample of firm-years, and specifications (3) and (4) re-estimate
the same models on the sub-sample of firms that consistently have keywords every year
they appear in our sample (i.e. those firms from the Persistent sample from Table IV that
always disclose an FLS list). Given litigation risk can plausibly influence both the inclusion
of a keyword list and the number of keywords, we include two of the litigation variables in
15The one exception is the lack of significance for management guidance in the first sub-period, whichcould be due to the higher likelihood of measurement error in the guidance database in early years (Chuk,Matsumoto, and Miller 2013).
20
Table VI regressions that were significant in the keywords inclusion model. We exclude a
number of variables that are more likely to be associated with the structural decision to
include a keyword list.16
In the full-sample, measures of court ideology, disclosure supply, uncertainty, and disclosure
herding are significantly associated with the number of keywords, with court ideology losing
significance in the sub-set of firms that always have keywords. In other words, while the
decision to always have a list of keywords was driven by court liberalism, the choice of the
number of keywords is not. However, while the keywords inclusion decision is unrelated to
auditor choice, clients of Big-N firms include a greater number of keywords. We include
several proxies for business circumstances that could impact the need for altering the number
of keywords. Firms that are new entrants to the capital markets face heightened uncertainty
(Lang (1991)), and therefore, have increased incentives to convey forward-looking information
to mitigate information frictions. Executive turnover likely occurs when firms experience
business volatility, and may require management to provide a clearer picture of the business
prospects. Consistent with these expectations, firms that had a recent IPO or a change
in CFO have a larger keyword list, although we observe no effect for a CEO turnover in
specifications (2) and (4).
We also consider several accounting and stock return measures as proxies for the level
and volatility of current performance. Specifically, the number of keywords increases with
the negative skewness of stock returns and with accounting rate of return. Moreover, return
volatility explains the variations in the number of keywords of firms that persistently have a
list. Taken together, in addition to some of the structural factors that explain the inclusion of
a keyword list, several circumstantial factors significantly influence the managerial choice of
how many keywords will optimally convey forward-looking information to market participants.
Overall, neither the inclusion of the list nor the choice of the number of keywords is boilerplate
nor ad hoc. Our analysis identifies a set of firm, industry, and macro characteristics that help
16Specifically, we do not include 10b-5 Firm, FPS, Guidance, Analyst Following, and Trans Own. If we doinclude all these variables, none have significant coefficients.
21

explain one key aspect of managerial disclosure strategy for communicating value relevant
information to help investors assess the firm’s future prospects.
[Table VI about here.]
Factor Analysis of FLS Keywords
So far our analysis has focused on the number of keywords used by firms with the intent of
obtaining legal protection for forward-looking information. We next turn to understanding
the choice of keywords that firms include in their list. Table VII Panel A reports the top 20
stemmed words used by firms in their keyword lists. We limit it to 20 words as that captures
more than 90% of the total words in our population, and no other words are included in
more than five percent of the 10-K reports in our sample. While our research design is meant
to isolate the determinants of the most popular keywords, it does not help us understand
unique words that firms may use in unique circumstances. We plan to study the properties
of sporadically used words in future versions of the manuscript.
To study the determinants of keyword choice, we create 20 indicator variables equal to one
if the firm includes the given word in its FLS keyword list. We then conduct an exploratory
factor analysis to potentially identify underlying disclosure attributes these different words
convey. Because we model the words as indicator variables, we use tetrachoric correlations as
input to the factor analysis. We report the top-ten Eigenvalues in Panel B and, limiting to
values greater than one, consider five factors that together account for roughly 77% of the
total variance.
Panel C reports the factor loadings based on a varimax rotation. We find the factor
loadings to be quite intuitive, and label the five factors as follows. Using an ad hoc rule,
we focus on keywords with factor loadings of at least 0.60 to label the underlying disclosure
attributes. The disclosure attributes that we identify are “future state” (factor 1), “likelihood”
(factor 3), “quantitative” (factor 4), and “future action” (factor 5). In Panel C we provide
the appropriate definitions from the Merriam-Webster online dictionary as a basis for the
22
chosen labels. Factor 2 represents modal verbs, which are usually used with another verb to
express different ideas such as possibility (might or may), probability or necessity (must),
promise or willingness (will), preferences or desires (would), ability (can), possibility (could),
and uncertain prediction (should).
Before we study the determinants of the identified disclosure attributes, in Panel D we
provide the inter-temporal incidence of the use of the top-20 keywords. Given that the average
number of keywords in 10-K reports has increased from less than six to over 12 in our sample
(see Figure IV), Table VII Panel D shows which keywords and disclosure attributes contribute
to this increase. The three words that capture the disclosure attribute of likelihood (“expect,”
“anticipate,” and “believe”) are the most highly used words in the keyword list throughout the
sample period. Managers seem most concerned with legal risk when expressing the likelihood
of economic activities or events, and therefore, have taken efforts to protect such FLS since
the inception of the PSLRA.
To discuss future state, firms largely rely on “estimate” throughout the sample period,
with increasing tendency to use other words representing the disclosure attribute (“predict,”
“potential,” and “continue”). In terms of words that facilitate description of future actions,
firms have dramatically increased the use of the words “intend” (37.4% to 87.5%) and “plan”
(29.6% to 82.4%) with limited use of “seek.” Apart from a meaningful increase in the use of
the word “project,” firms are using other words that could convey quantitative information
much less frequently. The use of modal verbs has substantially increased over time, indicating
a desire to identify potential uncertain FLS for legal protection. Overall, while firms have
always used keywords to convey the likelihood of economic activities or events, they have
increased reliance on words that can convey future state, future actions, and the uncertain
nature of FLS.17
17Our analysis is based on keywords from 10-K reports. Given earnings releases are more likely to includequantitative FLS, we might see an increased incidence of those keywords. We provide some preliminaryevidence in Table IX on the commonality of keywords in 10-K reports and Q4 earnings releases (filed in aForm 8-K). We intend to conduct additional analysis on the two sets of keywords and the reasons why theymay differ.
23

[Table VII about here.]
We next examine the association between the disclosure attributes and the determinants
of the overall number of keywords from Table VI. We expect that the segregation of keywords
by disclosure attribute can shed light on opposite forces that may be in effect at times. For
instance, circumstances that may require quantitative FLS may be orthogonal to cases when
firms may discuss more qualitative plans. We measure each of the disclosure attributes as the
number of keywords with factor loading of at least 0.6 in the list of keywords. For instance,
we measure the disclosure attribute “Future Action” as the sum of the indicator variables
intend, plan, and seek.
The results of Poisson regressions of each of the disclosure attributes on the determinants
from Table VI are presented in Table VIII Panel A, with column (1) reporting the results
for the total number of keywords.18 Consistent with a lack of inter-temporal variation in
the words that describe the likelihood of events or activities, the pseudo R-squared for
specification (4) is 0.1 %. Only when managers issue guidance, or experience loss, do they
more often include such words.
For the remaining attributes, we focus on key empirical regularities that shed light on the
incentives to include the related words. When firms face higher ex-ante litigation risk due
to court ideology, they include a list of keywords that can protect them from FLS used to
describe future state or provide quantitative information. Obviously, such statements are
more likely to trigger a class-action lawsuit if the expectation is not realized. Managers that
frequently provide quantitative guidance may be compelled to explain future actions that
could help achieve the guidance. Consistent with this intuition, we find Guidance Intensity to
be significantly associated with the keywords that convey quantitative information or future
action.
18We do include Guidance in these regressions, which was omitted from Table VI as we did not expect it toexplain the number of keywords. Our column (1) result confirms that belief. In addition, we also includeGuidance Intensity to capture the number of different guidance forecasts provided by managers during afiscal year.
24

Older firms with longer histories should have better forecasting ability, which is consistent
with firm age having a positive loading only when explaining the choice of quantitative
words. Firms facing higher stock return volatility are less likely to include quantitative
words in their keyword list due to the uncertain environment that may deter the disclosure
of quantitative FLS. Consistent with a desire to fall back on qualitative disclosures, they
instead include keywords that can describe future state or future action, thereby conveying
relevant forward-looking information. Interestingly, several of the determinants that are not
significantly related to the total number of keywords (e.g., Guidance, Guidance Intensity, and
Return Volatility) are associated with some of the disclosure attributes in meaningful ways.
Taken together, our analysis provides compelling evidence on the selective choice of different
disclosure attribute keywords that managers use to obtain legal protection under different
economic circumstances.19
[Table VIII about here.]
Comparison of 10-K vs. 8-K FLS Keyword Lists
Although firms can use multiple disclosure channels to convey forward-looking information,
our analysis so far focused on protection of FLS in 10-K reports. Prior research finds that
managers use earnings press releases to convey value-relevant forward-looking statements
(Bozanic et al. 2018). Beginning March 28, 2003, SEC registrants must file all publicly-issued
earnings press releases in a form 8-K.20 Given the importance of earnings press releases, we
19Our measures are derived from the managerial perspective of choosing what specific disclosure attributes toinclude in the list of keywords. The outcome of the managerial decision is a set of binary variables thatcaptures the decision to include or exclude a list of keywords. In contrast, the purpose of an exploratoryfactor analysis is to reduce the dimensionality by identifying several factors that are linear combinationsof a large set of variables, but with the objective of explaining as much of the variance in the system aspossible. Although our measures are designed to reflect managerial decision making, we also rerun ourregressions using the factor scores as the dependent variables and report the results in Table VIII Panel B.The results in the two panels lead to similar inferences in most cases. The exception is Return Volatilitywhich has the correct signs in the Quantitative and Future Action regressions, but is insignificant in both.
20See SEC Release Nos. 33-8176; 34-47226; FR-65.
25

next examine firms’ disclosure of an FLS keyword list in earnings press releases and report
the results of our preliminary analysis.21
Using the same scrapping strategy as that for 10-K reports, we identify and download
all 8-K reports that include an earnings press release, and extract any keyword list included
therein. Given that earnings releases are generally filed with the SEC only after March 27,
2003, this results in a much smaller sample size for our analysis. Untabulated data shows that
we have 59,241 firm-years with 10-K reports and the corresponding earnings release. When
earnings release includes a list of keywords (n=22,497), roughly 95% of the corresponding
10-Ks include a list as well. However, when the 10-K includes a keyword list (n=48,776), only
44% of the earnings releases contain a list.
Our analysis is based on 21,346 firm-year observations that contain FLS keyword lists in
both the 10-K and Q4 8-K earnings release. Figure II provides the distribution of the number
of keywords contained in each report. Although the distributions are reasonably similar,
the 10-K pdf is slightly shifted to the right. Figure III plots the cdf of the number of 10-K
keywords minus the number of 8-K keywords. About 40% of the observations have the same
number of keywords, 40% have more keywords in the 10-K, and the remaining 20% have
fewer. The distributions of the FLS list adoption and the mean number of FLS keywords
in the lists of 10-Ks vs. 8-Ks are shown in Figure IV. While the mean number of keywords
in 10-Ks vs. 8-ks follow a similar trend over the years, the 8-K mean is consistently lower
and does not appear to converge to the 10-K mean over time. This suggests that there are
persistent systematic differences in the disclosures. The graph also shows that the adoption
rate of 8-Ks has a more linear pattern than for 10-Ks. Figure V plots the mean of the number
of 10-K and 8-K keywords by year, as well as the number of keywords that overlap in the
two sets. All three means increase almost monotonically over time with parallel trends.
[Figures II–V about here.]
21Because 8-K earnings releases are usually “furnished,” not “filed” with the SEC, they are not subject toliability under Section 18 of the Exchange Act, though they still face liability under Rule 10b-5.
26
We next provide preliminary evidence on the determinants of the similarity and differences
between the two lists of keywords. We consider three measures: (1) Jaccard similarity index;
(2) absolute value of the difference between the number of keywords; and (3) number of 10-K
minus number 8-K keywords. In Figure VI we provide inter-temporal descriptive statistics
for the Jaccard similarity index. At least a quarter of the firms have identical word lists, with
mean (median) of the similarity index consistently above 0.7 (0.8). In addition, we find little
time-series variations in the distribution of the Jaccard index.
[Figure VI about here.]
In our regressions, we consider a limited set of variables from our list of determinants
that we expect would explain the variations in these three measures. In addition, we include
the ratio of the length in characters of earnings release to 10-K release as an additional
explanatory variable.
[Table IX about here.]
Results in Table IX indicate that firms with greater ex-ante litigation risk tend to use
the same set of words in the two disclosure channels. Consistent use of FLS keywords could
avoid the potential for litigation risk increasing due to ambiguity. Older firms, firms with
a Big-N auditor, or firms that issue longer earnings press releases tend to use more similar
words and have similar number of words in the two lists. In contrast, when firms face
an uncertain environment (R&D, Loss Year, and Acquisition Sales Ratio), there is more
divergence in both length and word choice between the two keyword lists. Overall, our
preliminary analysis provides some insight into the managerial decision when choosing the
list of keywords in two important disclosure channels. It also provides further evidence to the
claim that these keyword lists, both the inclusion decision and composition, are not mere
boilerplate disclosures.
27

V. CONCLUSION
This study provides evidence on the determinants of one aspect of voluntary disclosures,
namely the identification of forward-looking statements. Firms have increasingly adopted
the practice of listing keywords which they use to signal forward-looking statements, and
thereby afford them protection under the PSLRA’s ‘safe harbor’ provision. We study the
determinants of including an FLS keyword list, as well as the linguistic contents of this
disclosure. Our findings generally support the claim that these lists and their content are
chosen based on economic factors, firm characteristics, and macro forces, providing little
credence to the claim that this is a boilerplate disclosure.
We find that the inclusion of an FLS keyword list has increased from 13% to 91% over
the past 22 years. Most of that adoption occurred in the earlier years, and has since seemed
to reach steady state. This adoption is associated with ex-ante litigation risk, the extent
of mandatory and voluntary disclosure, firm-specific uncertainty, and bandwagon effects.
Further, litigation risk and bandwagon effects are concentrated in the early years of adoption,
suggesting that the forces underlying the disclosure decision evolved over time.
Investigation into the content of the list reveals that similar but distinct forces are
associated with the two decisions of whether to include a list, and what to include in the list.
We find that ex-ante litigation risk is strongly associated with the adoption of more keywords,
and the length of the keyword list is increasing in firm-specific uncertainty and performance.
Again we find evidence of potential bandwagon effects at play. A content analysis of what
words managers choose reveals variation in the language used. We find that in general, the
choice of language firms employ varies systematically with firms’ economic circumstances.
We currently plan on extending the project to include more in-depth linguistic contextual
analysis of forward-looking statements, as defined by the inclusion of one or more forward-
looking words. Prior literature has studied, among other things, the tone and sentiment of
these sentences. However, it is still unclear the extent to which specific word usage choices
reflect informational differences in the signal being conveyed by managers. We also intend
28

to extend our study to include other disclosures which are afforded protection under the
PSLRA, specifically earnings announcements and other press releases. By comparing these
two sources of disclosure, one significantly less discretionary than the other, we hope to gain
insight into the specific linguistic choices managers make as a function of the regulatory
burden.
29
References
Armstrong, C. S., S. Glaeser, and J. D. Kepler. 2019. Strategic Reactions in Corporate TaxPlanning. Journal of Accounting and Economics 68 (1): 101232.
Bikhchandani, S., D. Hirshleifer, and I. Welch. 1998. Learning from the Behavior of Others:Conformity, Fads, and Informational Cascades. The Journal of Economic Perspectives12 (3): 151–170.
Bloomfield, R. 2008. Discussion of “Annual Report Readability, Current Earnings, andEarnings Persistence”. Journal of Accounting and Economics 45 (2–3): 248–252.
Bochkay, K., R. Chychyla, and D. Nanda. 2016. Dynamics of CEO Communication Style.Working Paper 57.
Bozanic, Z., J. R. Dietrich, and B. A. Johnson. 2017. SEC Comment Letters and FirmDisclosure. Journal of Accounting and Public Policy 36 (5): 337–357.
Bozanic, Z. and P. Kraft. 2018. Qualitative Corporate Disclosure and Credit Analysts’ SoftRating Adjustments. Working Paper .
Bozanic, Z., D. T. Roulstone, and A. Van Buskirk. 2018. Management Earnings Forecastsand Other Forward-Looking Statements. Journal of Accounting and Economics 65 (1):1–20.
Bushee, B. J. 1998. The Influence of Institutional Investors on Myopic R&D InvestmentBehavior. The Accounting Review 73 (3): 305–333.
Bushee, B. J. and C. F. Noe. 2000. Corporate Disclosure Practices, Institutional Investors,and Stock Return Volatility. Journal of Accounting Research 38: 171–202.
Chivers, C. and G. Quinn. 2009. Recent Court Case Confirms the Importance of Well DraftedForward-Looking Statement Disclosures. Finance Digest 1–9.
Chuk, E., D. Matsumoto, and G. S. Miller. 2013. Assessing methods of identifying managementforecasts: CIG vs. researcher collected. Journal of Accounting and Economics 55 (1): 23 –42.
Dickinson, V. 2011. Cash Flow Patterns as a Proxy for Firm Life Cycle. The AccountingReview 86 (6): 1969–1994.
Dyer, T., M. Lang, and L. Stice-Lawrence. 2017. The Evolution of 10-K Textual Disclosure:Evidence from Latent Dirichlet Allocation. Journal of Accounting and Economics 64 (2):221–245.
Einhorn, E. and A. Ziv. 2008. Intertemporal Dynamics of Corporate Voluntary Disclosures.Journal of Accounting Research 46 (3): 567–589.
Field, L., M. Lowry, and S. Shu. 2005. Does Disclosure Deter or Trigger Litigation? Journalof Accounting and Economics 39 (3): 487–507.
30

Francis, J., D. Philbrick, and K. Schipper. 1994. Shareholder Litigation and CorporateDisclosures. Journal of Accounting Research 32 (2): 137–164.
Hassanein, A. and K. Hussainey. 2015. Is Forward-Looking Financial Disclosure ReallyInformative? Evidence from UK Narrative Statements. International Review of FinancialAnalysis 41: 52–61.
Heinle, M. S., K. C. Smith, and R. E. Verrecchia. 2018. Risk-Factor Disclosure and AssetPrices. The Accounting Review 93 (2): 191–208.
Hirshleifer, D. and S. H. Teoh. 2003. Herd Behaviour and Cascading in Capital Markets: AReview and Synthesis. European Financial Management 9 (1): 25–66.
Huang, A., K. W. Hui, and R. Z. Li. 2019. Federal Judge Ideology: A New Measure of ExAnte Litigation Risk. Journal of Accounting Research 57 (2): 431–489.
Hutton, A. P., G. S. Miller, and D. J. Skinner. 2003. The Role of Supplementary Statementswith Management Earnings Forecasts. Journal of Accounting Research 41 (5): 867–890.
Johnson, M. F., R. Kasznik, and K. K. Nelson. 2001. The Impact of Securities LitigationReform on the Disclosure of Forward-Looking Information By High Technology Firms.Journal of Accounting Research 39 (2): 297–327.
Jung, M. J. 2013. Investor Overlap and Diffusion of Disclosure Practices. Review of AccountingStudies 18 (1): 167–206.
Kimbrough, M. D. and H. Louis. 2011. Voluntary Disclosure to Influence Investor Reactionsto Merger Announcements: An Examination of Conference Calls. The Accounting Review86 (2): 637–667.
Kothari, S. P., T. E. Laguerre, and A. J. Leone. 2002. Capitalization versus Expensing:Evidence on the Uncertainty of Future Earnings from Capital Expenditures versus R&DOutlays. Review of Accounting Studies 7 (4): 355–382.
Kwak, B., B. T. Ro, and I. Suk. 2012. The Composition of Top Management with GeneralCounsel and Voluntary Information Disclosure. Journal of Accounting and Economics54 (1): 19–41.
Lang, M. 1991. Time-Varying Stock Price Response to Earnings Induced by Uncertainty aboutthe Time-Series Process of Earnings. Journal of Accounting Research 29 (2): 229–257.
Li, F. 2010. The Information Content of Forward-Looking Statements in Corporate Filings—ANaıve Bayesian Machine Learning Approach. Journal of Accounting Research 48 (5): 1049–1102.
McClane, J. 2019. Boilerplate and the Impact of Disclosure in Securities Dealmaking.Vanderbilt Law Review 72 (1): 191–295.
31

Muslu, V., S. Radhakrishnan, K. R. Subramanyam, and D. Lim. 2015. Forward-LookingMD&A Disclosures and the Information Environment. Management Science 61 (5): 931–948.
Naughton, J. P., T. O. Rusticus, C. Wang, and I. Yeung. 2019. Private Litigation Costs andVoluntary Disclosure: Evidence from the Morrison Ruling. The Accounting Review 94 (3):303–327.
Nelson, K. and A. C. Pritchard. 2016. Carrot or Stick? The Shift from Voluntary toMandatory Disclosure of Risk Factors. Journal of Empirical Legal Studies 13 (2): 266–297.
Rogers, J. L. and A. Van Buskirk. 2009. Shareholder Litigation and Changes in DisclosureBehavior. Journal of Accounting and Economics 47 (1–2): 136–156.
Skinner, D. J. 1994. Why Firms Voluntarily Disclose Bad News. Journal of AccountingResearch 32 (1): 38–60.
Skinner, D. J. 1997. Earnings Disclosures and Stockholder Lawsuits. Journal of Accountingand Economics 23 (3): 249–282.
Tse, S. and J. W. Tucker. 2010. Within-Industry Timing of Earnings Warnings: Do ManagersHerd? Review of Accounting Studies 15 (4): 879–914.
32

Appendix A Variable Descriptions
The following table defines the variables used in this paper. Variable names and calculationsprovided in brackets correspond to source database. For the regressions presented in thetables, the continuous variables are winsorized at the 1st and 99th percentiles.
Variable Description
Textual Disclosure Variables
FLS Keywords Inclusion A dummy variable equal to one if a firm has a FLS keyword list included inthe 10-K during the fiscal year
# Keywords The number of FLS terms included in the firm’s FLS keyword list in the10-K for that fiscal year. Some FLS terms may include more than one word(e.g. “will likely result,” “may affect,” “is likely”). For these cases, we donot separately count the words in the term, instead we treat the wholeexpression as one FLS term/keyword
#10K–#8K The difference between the number of keywords in the 10-K FLS list andthe number of keywords in the 8-K list
8-K/10-K Length Ratio The ratio of the length of the 8-K to the length of the 10-K in characters
Industry Adoption Percentage of firms within a GICS industry group that include a FLSkeywords list in their 10-K during a fiscal year. We measure this variable foreach firm-year, excluding the focal firm from the calculation
Industry Avg. # KW Average number of keywords in the 10-K FLS list of firms within a GICSindustry group during a fiscal year. We measure this variable for eachfirm-year, excluding the focal firm from the calculation
Jaccard Index Intersection of the sets of stemmed words in the 10-K and 8-K FLS listsdivided by the union of the sets
Log(10-K Size) Natural logarithm of the length of the 10-K filing text, in characters (bytes)
Accounting Variables
Acquisition Sales Ratio The sales contribution of an acquisition divided by total sales{AQS/SALE}
Analyst Following An indicator variable equal to one if the firm is covered by at least oneanalyst during the fiscal year
Big N Auditor An indicator equal to one if the firm engages the services of a Big-N auditor{AU ∈ (1, 4, 5, 6, 7)}
CEO Change An indicator variable equal to one if there was a change of CEO during thecurrent fiscal year
CFO Change An indicator variable equal to one if there was a change of CFO during thecurrent fiscal year
Decline A dummy variable equal to one if the firm’s life cycle is in the Decline stage,as defined by Dickinson (2011)
Age The age of the firm in years, calculated as the number of years since thefirm first appeared in Compustat {(datadate−MIN(datadate))/365.25}
Growth A dummy variable equal to one if the firm’s life cycle is in the Growth stage,as defined by Dickinson (2011)
Guidance An indicator variable equal to one if the firm issued at least one quarterly orannual management forecast during the fiscal year
Continued on next page...
33
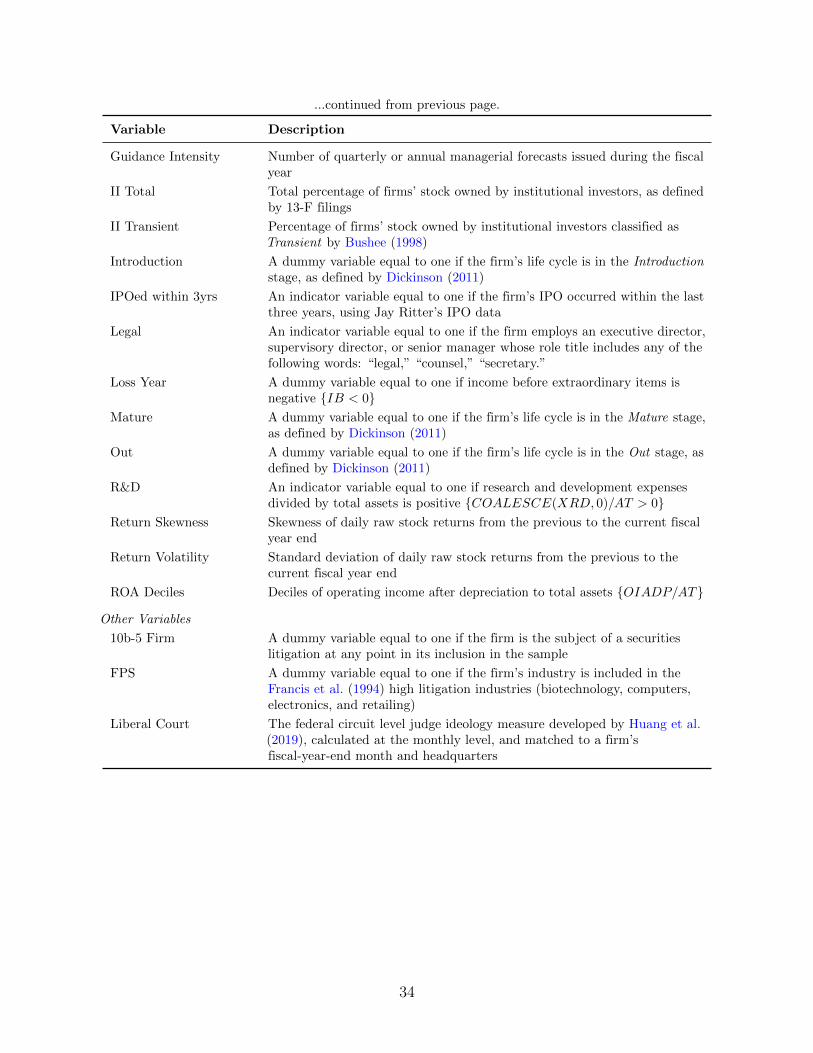
...continued from previous page.
Variable Description
Guidance Intensity Number of quarterly or annual managerial forecasts issued during the fiscalyear
II Total Total percentage of firms’ stock owned by institutional investors, as definedby 13-F filings
II Transient Percentage of firms’ stock owned by institutional investors classified asTransient by Bushee (1998)
Introduction A dummy variable equal to one if the firm’s life cycle is in the Introductionstage, as defined by Dickinson (2011)
IPOed within 3yrs An indicator variable equal to one if the firm’s IPO occurred within the lastthree years, using Jay Ritter’s IPO data
Legal An indicator variable equal to one if the firm employs an executive director,supervisory director, or senior manager whose role title includes any of thefollowing words: “legal,” “counsel,” “secretary.”
Loss Year A dummy variable equal to one if income before extraordinary items isnegative {IB < 0}
Mature A dummy variable equal to one if the firm’s life cycle is in the Mature stage,as defined by Dickinson (2011)
Out A dummy variable equal to one if the firm’s life cycle is in the Out stage, asdefined by Dickinson (2011)
R&D An indicator variable equal to one if research and development expensesdivided by total assets is positive {COALESCE(XRD, 0)/AT > 0}
Return Skewness Skewness of daily raw stock returns from the previous to the current fiscalyear end
Return Volatility Standard deviation of daily raw stock returns from the previous to thecurrent fiscal year end
ROA Deciles Deciles of operating income after depreciation to total assets {OIADP/AT}
Other Variables
10b-5 Firm A dummy variable equal to one if the firm is the subject of a securitieslitigation at any point in its inclusion in the sample
FPS A dummy variable equal to one if the firm’s industry is included in theFrancis et al. (1994) high litigation industries (biotechnology, computers,electronics, and retailing)
Liberal Court The federal circuit level judge ideology measure developed by Huang et al.(2019), calculated at the monthly level, and matched to a firm’sfiscal-year-end month and headquarters
34

Appendix B Textual Data Collection
Our sample of forward-looking statement keyword lists was gathered from firms’ 10-K filings,
which we downloaded from the SEC’s EDGAR website. Both the primary 10-K exhibit, as
well as any exhibit 13s were searched for a match to the following regular expression (here, in
Python syntax):
# all possible quotes , equivalent to \p{Pi} and \p{Pf} in PERL
quotes = (" ‘’\"\u00ab\u2018\u201b\u201c\u201f\u2039"
"\u2e02\u2e04\u2e09\u2e0c\u2e1c\u00bb\u2019"
"\u201d\u203a\u2e03\u2e05\u2e0a\u2e0d\u2e1d")
# Python regular expression for finding quoted word lists:
quote_regex = (
r"(" # begin word capture group , to capture each word in the list
r"((?<!\w)["+quotes+r"]{1 ,3})" # opening quote , not following a word
r"(?P<word >[\w ()\[\] < >. ,:;~/\\|!?@#$%^&*_=+\ -]{1 ,100})" # the word
r"\s*(["+quotes+r"]{1 ,3}(?!\w))" # closing quote mark
r"\s*,?\s*(and/or|and|or)?\s*,?\s*" # maybe comma/and/or delimited
r"){2,}" # close word capture , requiring at least two words
)
# compiled with re.I flag
We then require that this quoted list includes one of the following words: “expect,”
“expects,” “anticipate,” “anticipates,” “intend,” “intends,” “estimate,” “estimates,” “may,” or
“should.” Further, if such a quoted list is not found, we remove the quotation requirement
from the regular expression, and re-search for unquoted lists which occur within 1000 bytes
before or 2000 after a forward-looking statement phrase. Forward-looking statements were
defined as the following phrases: “forward-looking,” “cautionary statements,” “safe harbor,”
“private securities litigation reform act,” “PSLRA,” “similar expressions,” or “not historical
in nature.”
35

Appendix C FLS Keyword List Examples
This appendix shows examples of FLS keyword disclosures from 10-K and 8-K filings.
Teleflex Inc. 10-K. CIK: 96943, Filing Date: 2016-02-25.
All statements made in this Annual Report on Form 10-K, other than statementsof historical fact, are forward-looking statements. The words “anticipate,” “be-lieve,” “estimate,” “expect,” “intend,” “may,” “plan,” “will,” “would,” “should,”“guidance,” “potential,” “continue,” “project,” “forecast,” “confident,” “prospects”and similar expressions typically are used to identify forward-looking statements.Forward-looking statements are based on the then-current expectations, beliefs,assumptions, estimates and forecasts about our business and the industry andmarkets in which we operate. These statements are not guarantees of futureperformance and are subject to risks, uncertainties and assumptions which aredifficult to predict. Therefore, actual outcomes and results may differ materiallyfrom what is expressed or implied by these forward-looking statements due to anumber of factors...
Seachange International Inc 10-K. CIK: 1019671, Filing Date: 2003-05-01.
Any statements contained in this Form 10-K that do not describe historical factsmay constitute forward-looking statements as that term is defined in the PrivateSecurities Litigation Reform Act of 1995. These statements relate to futureevents or our future financial performance and are identified by words such as“may,” “will,” “could,” “should,” “expect,” “plan,” “intend,” “seek,” “anticipate,”“believe,” “estimate,” “potential,” or “continue” or other comparable terms orthe negative of those terms. Forward-looking statements in this Form 10-Kinclude certain statements regarding the effect of certain accounting standardson our financial position and results of operations, the effect of certain legalclaims against us, projected changes in our revenues, earnings and expenses,exchange rate sensitivity, interest rate sensitivity, liquidity, product introductionsand general market conditions. Our actual future results may differ significantlyfrom those stated in any forward-looking statements. Any such forward-lookingstatements contained herein are based on current expectations, but are subjectto a number of risks and uncertainties that may cause actual results to differmaterially from expectations. Factors that may cause such differences include,but are not limited to, the factors discussed below. Each of these factors, andothers, are discussed from time to time in our filings with the SEC.
Regions Financial Corp 8-K. CIK: 1281761, Filing Date: 2014-07-22.
This release may include forward-looking statements as defined in the PrivateSecurities Litigation Reform Act of 1995, which reflect Regions current views withrespect to future events and financial performance. Forward-looking statementsare not based on historical information, but rather are related to future operations,strategies, financial results or other developments. Forward-looking statements are
36
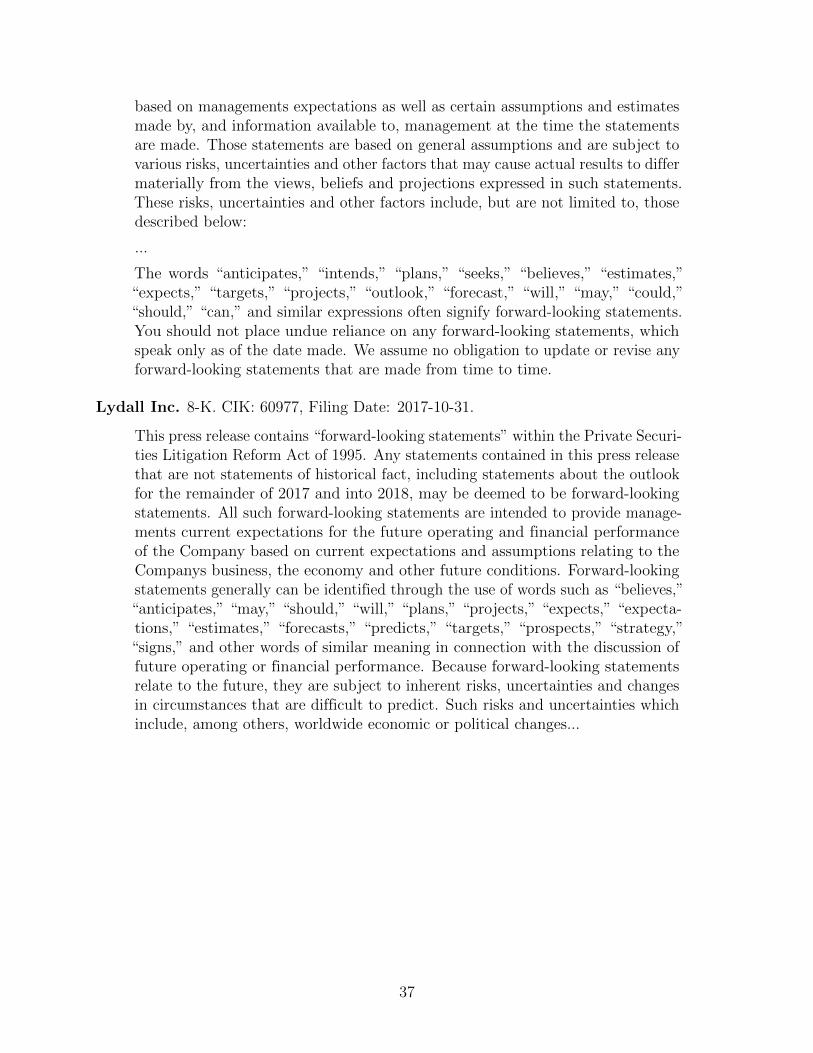
based on managements expectations as well as certain assumptions and estimatesmade by, and information available to, management at the time the statementsare made. Those statements are based on general assumptions and are subject tovarious risks, uncertainties and other factors that may cause actual results to differmaterially from the views, beliefs and projections expressed in such statements.These risks, uncertainties and other factors include, but are not limited to, thosedescribed below:
...
The words “anticipates,” “intends,” “plans,” “seeks,” “believes,” “estimates,”“expects,” “targets,” “projects,” “outlook,” “forecast,” “will,” “may,” “could,”“should,” “can,” and similar expressions often signify forward-looking statements.You should not place undue reliance on any forward-looking statements, whichspeak only as of the date made. We assume no obligation to update or revise anyforward-looking statements that are made from time to time.
Lydall Inc. 8-K. CIK: 60977, Filing Date: 2017-10-31.
This press release contains “forward-looking statements” within the Private Securi-ties Litigation Reform Act of 1995. Any statements contained in this press releasethat are not statements of historical fact, including statements about the outlookfor the remainder of 2017 and into 2018, may be deemed to be forward-lookingstatements. All such forward-looking statements are intended to provide manage-ments current expectations for the future operating and financial performanceof the Company based on current expectations and assumptions relating to theCompanys business, the economy and other future conditions. Forward-lookingstatements generally can be identified through the use of words such as “believes,”“anticipates,” “may,” “should,” “will,” “plans,” “projects,” “expects,” “expecta-tions,” “estimates,” “forecasts,” “predicts,” “targets,” “prospects,” “strategy,”“signs,” and other words of similar meaning in connection with the discussion offuture operating or financial performance. Because forward-looking statementsrelate to the future, they are subject to inherent risks, uncertainties and changesin circumstances that are difficult to predict. Such risks and uncertainties whichinclude, among others, worldwide economic or political changes...
37

Figure I: Number of 10-K Keywords Distribution
0
2,000
4,000
6,000
8,000
10,000
# 1
0−
K F
ilings
0 5 10 15 20 25 30 35 40 45 50 55
# Keywords
This figure shows the distribution of number of FLS keywords in the 87,079 10-Ks filingswith a nonempty FLS keyword list throughout our sample period.
38

Figure II: Number of Keywords Distribution in 10-Ks and 8-Ks
0
500
1,000
1,500
2,000
# F
ilings
0 5 10 15 20 25 30 35 40 45 50 55 60
# Keywords
# 10−K Filings # 8−K Filings
This figure shows the distribution of number of FLS keywords in 10-Ks and 8-Ks for theobservations in our sample where filing 10-K was successfully matched to its corresponding8-K filing. The graph shows only the 21,341 observations where both 10-K and 8-K had anFLS keyword list, and it covers the fiscal years from 2003 to 2017. We exclude fiscal year2002 because there are only five matched 10-K/8-K pairs with nonempty FLS lists duringthis year.
39

Figure III: Cumulative Distribution Function of the Difference inNumber of Keywords
0
.2
.4
.6
.8
1
Cum
ula
tive P
robabili
ty
−35 −30 −25 −20 −15 −10 −5 0 5 10 15 20 25
# Keywords
This figure shows the cumulative distribution function of number of FLS keywords in the 10-Kfiling minus the number of keywords in the 8-K filing for 21,341 of the matched 10-K/8-Kpairs where both filings include a FLS keyword list. Since we only have five observationsthat meet this condition in 2002, we exclude this year. The graph thus covers the sampleperiod from 2003 to 2017.
40

Figure IV: Distribution of FLS Keywords Inclusion and Numberof Keywords by Year
0
2
4
6
8
10
12
# K
eyw
ord
s
0
.1
.2
.3
.4
.5
.6
.7
.8
.9
1
% o
f F
irm
s
1996 1998 2000 2002 2004 2006 2008 2010 2012 2014 2016
Fiscal Year
10−K FLS Keywords Inclusion 8−K FLS Keywords Inclusion
10−K Mean # Keywords 8−K Mean # Keywords
This figure shows the distribution of FLS keywords inclusion and number of keywords in10-K and 8-K filings throughout our sample period. The percentages of 10-K and 8-K FLSKeywords Inclusion are calculated over our sample of 132,303 10-Ks and 59,241 matched8-Ks, respectively. The 10-K Mean # Keywords is calculated over the 87,079 10-K filingswith a FLS keyword list, while the 8-K Mean # Keywords is calculated over 22,491 8-Kswith a nonempty list. We do not show 8-K statistics for fiscal year 2002 because there areonly twenty six 8-K filings matched to 10-K filings during this year.
41
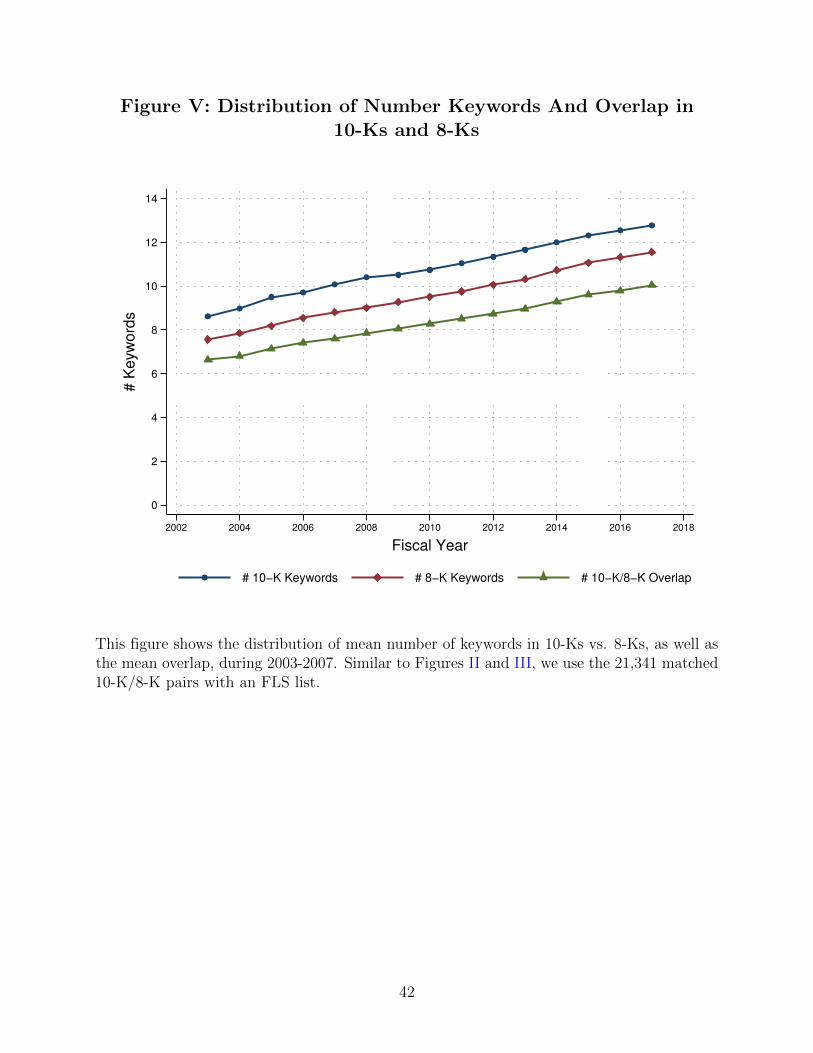
Figure V: Distribution of Number Keywords And Overlap in10-Ks and 8-Ks
0
2
4
6
8
10
12
14
# K
eyw
ord
s
2002 2004 2006 2008 2010 2012 2014 2016 2018
Fiscal Year
# 10−K Keywords # 8−K Keywords # 10−K/8−K Overlap
This figure shows the distribution of mean number of keywords in 10-Ks vs. 8-Ks, as well asthe mean overlap, during 2003-2007. Similar to Figures II and III, we use the 21,341 matched10-K/8-K pairs with an FLS list.
42

Figure VI: Comparison of 10-K vs. 8-K FLS Keyword Lists
0
.1
.2
.3
.4
.5
.6
.7
.8
.9
1
2002 2004 2006 2008 2010 2012 2014 2016 2018
Fiscal Year
Jaccard − Mean Jaccard − Median
Jaccard − Q1 Jaccard − Q3
% 10−K == 8−K
This figure compares the content of the FLS keyword list in 10-K vs. 8-K filings during 2003to 2017 for the sample of 21,341 annual reports that have a matched 8-K filing, and whereboth filings have an FLS list. The lines show the time series variation in the mean, median,and inter-quartiles of the Jaccard similarity index of the 10-K/8-K pairs, calculated as thenumber of FLS keywords that appear in both 10-K’s and 8-K’s (stemmed) lists divided bythe number of keywords in the union of the lists. The teal bar chart indicates the percentageof 10-K/8-K pairs where the stemmed FLS keywords in the 10-K are the same as those inthe 8-K. We use NLTK’s PorterStemmer to find the stem of each FLS keyword.
43

Table I: Sample Selection
Table I reports the sample selection statistics. Our final sample includes 132,303 observations from 14,722firms, and extends from 1996 to 2017.
Initial sample of firm-years from Compustat merged with EDGAR CIKs 158, 744
Less: firm-years with 10-K unavailable for scraping (10, 521)
Plus: firm-years with 10-K FLS keywords list filled 564
Less: firm-years with 10-K filed before December 22, 1995 (549)
Less: firms with years of missing data (12, 541)
Less: firms with less than 2 years of data (1, 295)
Less: firm-years with fiscal year before 1996 (2, 099)
Final Sample Size 132, 303
44

Table II: FLS Keywords Inclusion Tabulations
This table presents descriptive statistics on FLS Keywords. Panel A presents the FLS keywords inclusion byfiscal year. The horizontal lines delineate the sub-periods used in subsequent analyses. Panel B presentsa tabulation of FLS keywords inclusion by industry (using the GICS industry definitions). The first twocolumns under the “All Years” heading report the total number of observations for each industry (Obs), andthe column percentage (Obs %). The remaining columns show FLS keywords inclusion by industry duringthree sub-periods. Each sub-period reports the number of observations in each industry as a percentage ofthe total number of observations during that sub-period (Obs %), and the percentage of observations withineach industry that included an FLS keyword list in their 10-K during that sub-period (KW %). Panel Cpresents descriptive statistics on the number of words included in the FLS keyword list by industry. Thefirst two columns under the “All Years” heading report the number of 10-K filings with an FLS keyword list(Obs), and the average number of words in the list (# KW) by industry. Each sub-period column includesthe percentage of observations with an FLS keyword list within each industry (Obs %), and the averagenumber of words in the lists of that industry (KW %).
Panel A: FLS Keywords Inclusion by Fiscal Year
Has Keywords No Keywords
Fiscal Year Obs Row % Obs Row %
1996 868 13 5,849 87
1997 1,858 24 5,735 76
1998 2,674 35 4,865 65
1999 3,336 44 4,314 56
2000 3,769 50 3,702 50
2001 4,028 56 3,200 44
2002 4,217 62 2,636 38
2003 4,333 67 2,173 33
2004 4,458 71 1,865 29
2005 4,554 74 1,585 26
2006 4,592 77 1,398 23
2007 4,608 79 1,229 21
2008 4,438 81 1,064 19
2009 4,386 82 948 18
2010 4,420 84 826 16
2011 4,508 86 744 14
2012 4,567 87 662 13
2013 4,640 88 611 12
2014 4,637 89 569 11
2015 4,494 90 488 10
2016 4,300 91 426 9
2017 3,394 91 335 9
Total 87,079 66 45,224 34
45

Panel B: FLS Keywords Inclusion by Industry
All Years 1996-2002 2003-2010 2011-2017N = 132,303 N = 51,051 N = 46,877 N = 34,375
Industry Obs Obs % Obs % KW % Obs % KW % Obs % KW %
Automobiles & Components 1,583 1.2 1.3 39.2 1.1 75.9 1.1 82.7Banks 12,848 9.7 9.1 42.5 10.5 75.1 9.5 88.8Capital Goods 9,549 7.2 7.2 35.1 7.2 70.9 7.3 85.0Commercial & Professional Services 5,275 4.0 4.9 38.5 3.6 75.7 3.1 85.8Consumer Durables & Apparel 5,224 3.9 5.0 35.5 3.7 71.7 2.8 86.7Consumer Services 4,770 3.6 3.8 38.7 3.5 75.5 3.4 90.0Diversified Financials 4,774 3.6 3.2 37.7 3.4 74.3 4.5 88.0Energy 8,034 6.1 4.5 41.4 6.3 77.5 8.0 89.5Food & Staples Retailing 955 0.7 0.8 37.7 0.7 68.8 0.6 89.8Food, Beverage & Tobacco 2,854 2.2 2.2 29.9 2.0 68.8 2.3 88.1Health Care Equipment & Services 8,836 6.7 7.0 43.5 6.7 77.6 6.2 89.6Household & Personal Products 1,359 1.0 0.9 38.9 1.0 72.8 1.2 89.2Insurance 3,254 2.5 2.4 37.1 2.6 75.1 2.4 88.9Materials 6,878 5.2 5.1 31.6 5.1 76.5 5.4 92.3Media 3,726 2.8 3.1 42.3 2.8 73.8 2.4 83.0Pharmaceuticals, Biotechnology & Life Sciences 9,272 7.0 5.1 43.8 7.2 80.2 9.5 92.8Real Estate 5,446 4.1 3.5 40.5 3.9 77.7 5.3 90.7Retailing 5,165 3.9 4.5 41.9 3.7 76.5 3.3 83.5Semiconductors & Semiconductor Equipment 2,692 2.0 1.5 52.6 2.5 85.8 2.2 89.7Software & Services 11,285 8.5 9.3 51.0 8.3 80.9 7.8 92.2Technology Hardware & Equipment 9,256 7.0 8.4 41.0 6.8 78.1 5.1 86.9Telecommunication Services 2,189 1.7 2.0 49.8 1.7 81.2 1.1 89.3Transportation 2,170 1.6 1.6 36.8 1.7 79.5 1.5 91.2Utilities 4,909 3.7 3.4 35.2 3.9 71.4 4.0 85.1
Mean 40.1 75.9 88.3Std 5.5 4.0 2.9
Coefficient of Variation 0.1371 0.0533 0.0326
46
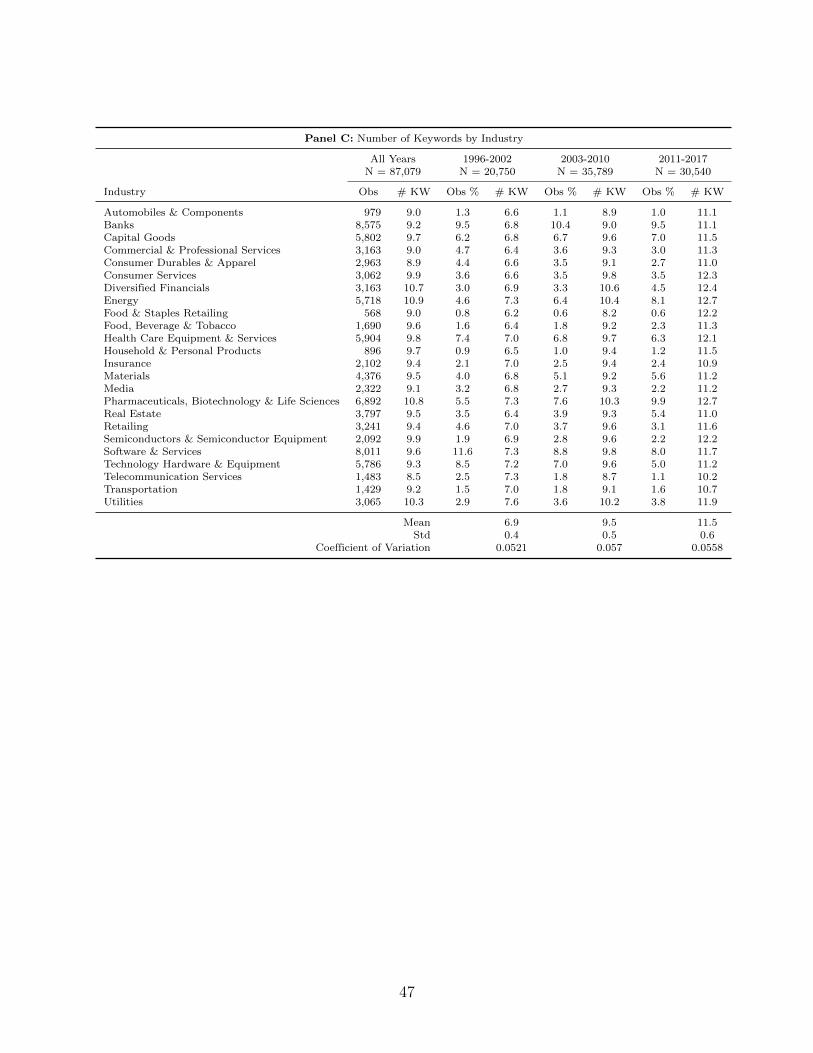
Panel C: Number of Keywords by Industry
All Years 1996-2002 2003-2010 2011-2017N = 87,079 N = 20,750 N = 35,789 N = 30,540
Industry Obs # KW Obs % # KW Obs % # KW Obs % # KW
Automobiles & Components 979 9.0 1.3 6.6 1.1 8.9 1.0 11.1Banks 8,575 9.2 9.5 6.8 10.4 9.0 9.5 11.1Capital Goods 5,802 9.7 6.2 6.8 6.7 9.6 7.0 11.5Commercial & Professional Services 3,163 9.0 4.7 6.4 3.6 9.3 3.0 11.3Consumer Durables & Apparel 2,963 8.9 4.4 6.6 3.5 9.1 2.7 11.0Consumer Services 3,062 9.9 3.6 6.6 3.5 9.8 3.5 12.3Diversified Financials 3,163 10.7 3.0 6.9 3.3 10.6 4.5 12.4Energy 5,718 10.9 4.6 7.3 6.4 10.4 8.1 12.7Food & Staples Retailing 568 9.0 0.8 6.2 0.6 8.2 0.6 12.2Food, Beverage & Tobacco 1,690 9.6 1.6 6.4 1.8 9.2 2.3 11.3Health Care Equipment & Services 5,904 9.8 7.4 7.0 6.8 9.7 6.3 12.1Household & Personal Products 896 9.7 0.9 6.5 1.0 9.4 1.2 11.5Insurance 2,102 9.4 2.1 7.0 2.5 9.4 2.4 10.9Materials 4,376 9.5 4.0 6.8 5.1 9.2 5.6 11.2Media 2,322 9.1 3.2 6.8 2.7 9.3 2.2 11.2Pharmaceuticals, Biotechnology & Life Sciences 6,892 10.8 5.5 7.3 7.6 10.3 9.9 12.7Real Estate 3,797 9.5 3.5 6.4 3.9 9.3 5.4 11.0Retailing 3,241 9.4 4.6 7.0 3.7 9.6 3.1 11.6Semiconductors & Semiconductor Equipment 2,092 9.9 1.9 6.9 2.8 9.6 2.2 12.2Software & Services 8,011 9.6 11.6 7.3 8.8 9.8 8.0 11.7Technology Hardware & Equipment 5,786 9.3 8.5 7.2 7.0 9.6 5.0 11.2Telecommunication Services 1,483 8.5 2.5 7.3 1.8 8.7 1.1 10.2Transportation 1,429 9.2 1.5 7.0 1.8 9.1 1.6 10.7Utilities 3,065 10.3 2.9 7.6 3.6 10.2 3.8 11.9
Mean 6.9 9.5 11.5Std 0.4 0.5 0.6
Coefficient of Variation 0.0521 0.057 0.0558
47

Table III: Descriptive Statistics
This table reports descriptive statistics for the variables used in our analyses. Panel A presents univariatestatistics for the sample of 10-K filings with vs. without FLS keywords. The difference is calculated as (HasKeywords - No Keywords), and the t-statstics are calculated using clustered standard errors. Panel B presentsPearson correlations. Variables are defined in Appendix A. For Panel A, ***, **, and * indicate significanceat the 1%, 5%, and 10% level, respectively. In Panel B, for brevity, significance is limited to bold font, whichindicates significance at the 1% level.
Panel A: Univariate Statistics by FLS Keywords Inclusion
Has Keywords No Keywords
Obs. Mean Std. Dev. Obs. Mean Std. Dev. Difference
Liberal Court 83,189 0.410 0.190 44,238 0.387 0.157 0.02∗∗∗
10b-5 Firm 87,079 0.167 0.373 45,224 0.112 0.316 0.05∗∗∗
FPS 87,079 0.266 0.442 45,224 0.236 0.425 0.03∗∗∗
Legal 87,079 0.429 0.495 45,224 0.205 0.403 0.22∗∗∗
Guidance 87,079 0.333 0.471 45,224 0.185 0.389 0.15∗∗∗
∆ Log(10-K Size) 80,817 0.049 0.223 38,863 0.053 0.316 −0.00∗
Log(10-K Size)t−1 80,817 12.436 0.546 38,863 12.036 0.616 0.40∗∗∗
Age 87,079 16.716 14.265 45,224 17.354 14.237 −0.64∗∗
R&D 87,079 0.382 0.486 45,224 0.336 0.472 0.05∗∗∗
Loss Year 85,605 0.410 0.492 44,631 0.362 0.481 0.05∗∗∗
Acquisition Sales Ratio 85,604 0.022 0.110 44,631 0.024 0.114 −0.00∗∗
Industry Adoptiont−1 80,817 0.716 0.197 38,862 0.475 0.262 0.24∗∗∗
Analyst Following 87,079 0.511 0.500 45,224 0.420 0.494 0.09∗∗∗
Inst Own 87,079 0.286 0.352 45,224 0.194 0.286 0.09∗∗∗
Trans Own 87,079 0.068 0.101 45,224 0.048 0.087 0.02∗∗∗
Big N Auditor 87,079 0.614 0.487 45,224 0.626 0.484 −0.01Introduction 87,079 0.176 0.381 45,224 0.167 0.373 0.01∗
Growth 87,079 0.278 0.448 45,224 0.257 0.437 0.02∗∗∗
Mature 87,079 0.291 0.454 45,224 0.300 0.458 −0.01Out 87,079 0.099 0.299 45,224 0.096 0.294 0.00Decline 87,079 0.109 0.312 45,224 0.098 0.297 0.01∗∗∗
48

Panel B: Pearson Correlations
(1) (2) (3) (4) (5) (6) (7) (8) (9) (10)
( 1) Liberal Court 1.00( 2) 10b-5 Firm 0.05 1.00( 3) FPS 0.11 0.14 1.00( 4) Legal -0.02 0.19 -0.02 1.00( 5) Guidance -0.02 0.25 0.08 0.41 1.00( 6) Log(10-K Size) 0.02 0.18 -0.05 0.43 0.29 1.00( 7) Age -0.11 0.09 -0.11 0.23 0.22 0.15 1.00( 8) R&D 0.09 0.13 0.37 -0.00 0.13 -0.03 0.00 1.00( 9) Loss Year 0.12 -0.03 0.19 -0.17 -0.19 -0.09 -0.24 0.21 1.00(10) Acquisition Sales Ratio 0.01 0.01 0.01 -0.01 0.01 0.01 -0.05 0.02 0.04 1.00(11) Industry Adoption t− 1 0.07 0.11 0.06 0.43 0.28 0.49 0.11 0.05 0.06 -0.04(12) Analyst Following -0.01 0.21 0.05 0.34 0.44 0.28 0.13 0.09 -0.25 0.00(13) Inst Own -0.00 0.21 -0.01 0.40 0.47 0.32 0.19 0.10 -0.25 -0.00(14) Trans Own 0.03 0.19 0.04 0.27 0.36 0.22 0.07 0.12 -0.17 0.02(15) Big N Auditor -0.03 0.17 0.06 0.22 0.32 0.23 0.20 0.09 -0.17 0.03(16) Introduction 0.09 -0.03 0.13 -0.15 -0.16 -0.09 -0.19 0.17 0.41 0.05(17) Growth -0.03 0.02 -0.06 0.09 0.08 0.12 0.00 -0.09 -0.21 0.10(18) Mature -0.09 0.05 -0.05 0.15 0.20 0.03 0.26 -0.03 -0.28 -0.09(19) Out 0.00 -0.01 -0.02 0.02 -0.02 0.01 0.01 -0.02 0.02 -0.03(20) Decline 0.09 -0.02 0.11 -0.12 -0.14 -0.11 -0.11 0.10 0.33 -0.01
(11) (12) (13) (14) (15) (16) (17) (18) (19) (20)
(11) Industry Adoption t− 1 1.00(12) Analyst Following 0.11 1.00(13) Inst Own 0.22 0.68 1.00(14) Trans Own 0.12 0.57 0.80 1.00(15) Big N Auditor -0.09 0.31 0.32 0.28 1.00(16) Introduction -0.01 -0.17 -0.18 -0.13 -0.16 1.00(17) Growth 0.01 0.12 0.13 0.12 0.11 -0.27 1.00(18) Mature 0.03 0.13 0.16 0.09 0.22 -0.30 -0.42 1.00(19) Out 0.04 -0.03 -0.01 -0.01 -0.01 -0.15 -0.21 -0.23 1.00(20) Decline 0.04 -0.15 -0.15 -0.11 -0.13 -0.15 -0.21 -0.23 -0.12 1.00
49

Table IV: FLS Keywords Inclusion Determinants Model
This table reports results from cross-sectional probit models at the firm-year level. The dependent variablein all specifications is FLS Keywords Inclusion. Our base and expanded models (specifications (1) and (2)respectively) include the full sample of firms. Specification (3) includes only “Persistent” firms—those whoconsistently either do, or do not provide FLS keywords during our sample. Specifications (4)–(6) include only“Switchers”—those firms who both do, and do not provide FLS keywords during our sample. Specification (4)includes all firms that switch at least one time during our sample period, while specification (5) includes firmsthat switch only once, and specification (6) includes those firms that switch multiple times. All models includefederal circuit and year fixed effects. We report average marginal effects with the coefficient z-statistics inparenthesis. Standard errors are clustered at the firm level. Variables are defined in Appendix A. ***, **,and * indicate significance at the 1%, 5%, and 10% level, respectively.
Dependent Variable = FLS Keywords Inclusion
Switchers
(1) (2) (3) (4) (5) (6)Base Expanded Persistent All Structural Transient
Liberal Court 0.096∗∗∗ 0.076∗∗ 0.091∗∗ 0.061 0.051 0.116(3.03) (2.38) (2.30) (1.37) (1.11) (0.96)
10b-5 Firm 0.009 0.004 0.052∗∗∗
(0.77) (0.32) (2.69)FPS 0.006 0.006 0.001
(0.73) (0.73) (0.05)Legal 0.007 0.006 0.023∗∗ -0.010 -0.009 -0.029
(0.93) (0.77) (1.99) (-1.04) (-0.93) (-1.21)Guidance 0.015∗∗ 0.015∗∗ 0.028∗∗∗ 0.009 0.005 0.029
(2.06) (2.11) (2.59) (0.99) (0.58) (1.27)∆ Log(10-K Size) 0.074∗∗∗ 0.061∗∗∗ 0.065∗∗∗ 0.055∗∗∗ 0.108∗∗∗
(13.39) (7.86) (9.16) (7.62) (5.44)Log(10-K Size) t− 1 0.087∗∗∗ 0.100∗∗∗ 0.127∗∗∗ 0.061∗∗∗ 0.060∗∗∗ 0.075∗∗∗
(13.04) (12.88) (10.51) (6.74) (6.16) (3.51)Log(Age + 1) -0.067∗∗∗ -0.066∗∗∗ -0.195∗∗∗
(-15.07) (-14.37) (-24.42)R&D 0.027∗∗∗ 0.025∗∗∗ 0.041∗∗∗ 0.003 0.006 -0.034
(3.43) (3.16) (3.41) (0.34) (0.66) (-1.41)Loss Year 0.017∗∗∗ 0.010∗ 0.003 0.015∗∗ 0.018∗∗∗ 0.017
(3.29) (1.90) (0.37) (2.39) (2.74) (0.93)Acquisition Sales Ratio 0.054∗∗∗ 0.033∗∗ -0.013 0.053∗∗∗ 0.054∗∗∗ 0.017
(4.08) (2.54) (-0.74) (3.04) (2.99) (0.36)Industry Adoption t− 1 0.155∗∗ 0.153∗∗ 0.132 0.181∗∗ 0.199∗∗ 0.061
(2.26) (2.24) (1.28) (2.23) (2.34) (0.29)Analyst Following 0.017∗∗ 0.015∗∗ -0.006 0.037∗∗∗ 0.036∗∗∗ 0.030
(2.23) (2.00) (-0.52) (4.21) (3.83) (1.30)Inst Own 0.008
(0.53)Trans Own 0.065∗ 0.125∗∗∗ -0.003 0.026 -0.137
(1.95) (2.58) (-0.07) (0.60) (-1.27)Big N Auditor 0.006 -0.001 0.004 -0.008 0.001 -0.024
(0.89) (-0.10) (0.42) (-0.87) (0.12) (-0.94)Introduction 0.019∗∗∗ 0.017∗ 0.009 0.014∗ 0.021
(2.79) (1.72) (1.04) (1.66) (0.87)Growth 0.012∗∗ 0.020∗∗∗ -0.003 -0.003 0.005
(2.31) (2.64) (-0.45) (-0.39) (0.27)Out -0.000 0.010 -0.007 0.001 -0.018
(-0.02) (1.11) (-0.85) (0.11) (-0.81)Decline 0.013∗ 0.023∗∗ 0.000 -0.007 0.055∗∗
(1.72) (2.12) (0.01) (-0.62) (2.03)
Federal Court F.E Y Y Y Y Y YFiscal Year F.E. Y Y Y Y Y Y
Pseudo R2 0.193 0.196 0.352 0.167 0.219 0.047Observations 114,607 109,777 47,339 62,438 52,308 10,130
50

Table V: FLS Keywords Inclusion by Sub-periods
This table presents regression results by sub-periods based on the expanded probit model from Table IV.The dependent variable in all specifications is FLS Keywords Inclusion. We report average marginal effectswith the coefficient z-statistics in parenthesis. Standard errors are clustered at the firm level. Variables aredefined in Appendix A. ***, **, and * indicate significance at the 1%, 5%, and 10% level, respectively.
Dependent Variable = FLS Keywords Inclusion
(1) (2) (3) (4)All Years 1996-2002 2003-2010 2011-2017
Liberal Court 0.076∗∗ 0.011 0.019 0.006(2.38) (0.27) (0.30) (0.15)
10b-5 Firm 0.004 0.015 0.006 -0.008(0.32) (0.99) (0.45) (-0.67)
FPS 0.006 -0.011 0.019 0.012(0.73) (-1.00) (1.53) (1.09)
Legal 0.006 0.016 0.008 0.006(0.77) (1.28) (0.82) (0.63)
Guidance 0.015∗∗ 0.008 0.026∗∗∗ 0.020∗∗
(2.11) (0.88) (2.63) (2.15)∆ Log(10-K Size) 0.074∗∗∗ 0.093∗∗∗ 0.076∗∗∗ 0.041∗∗
(13.39) (13.87) (5.96) (2.55)Log(10-K Size)t−1 0.100∗∗∗ 0.133∗∗∗ 0.091∗∗∗ 0.072∗∗∗
(12.88) (13.76) (8.30) (7.08)Log(Age + 1) -0.066∗∗∗ -0.066∗∗∗ -0.070∗∗∗ -0.057∗∗∗
(-14.37) (-10.94) (-10.46) (-10.22)R&D 0.025∗∗∗ 0.039∗∗∗ 0.021∗∗ 0.010
(3.16) (3.94) (1.98) (1.09)Loss Year 0.010∗ 0.006 0.011 0.013∗
(1.90) (0.82) (1.42) (1.66)Acquisition Sales Ratio 0.033∗∗ 0.055∗∗∗ 0.022 0.009
(2.54) (2.68) (0.93) (0.41)Industry Adoptiont−1 0.153∗∗ 0.283∗∗∗ 0.110 0.034
(2.24) (3.31) (1.04) (0.25)Analyst Following 0.015∗∗ 0.029∗∗∗ 0.007 0.007
(2.00) (2.85) (0.64) (0.69)Trans Own 0.065∗ 0.046 0.055 0.063
(1.95) (1.03) (1.08) (1.38)Big N Auditor -0.001 0.030∗∗∗ -0.002 -0.025∗∗
(-0.10) (2.76) (-0.14) (-2.50)Introduction 0.019∗∗∗ 0.029∗∗∗ 0.027∗∗ -0.007
(2.79) (3.02) (2.53) (-0.64)Growth 0.012∗∗ 0.013∗ 0.023∗∗∗ -0.006
(2.31) (1.71) (3.00) (-0.81)Out -0.000 -0.011 0.003 0.008
(-0.02) (-1.10) (0.35) (0.95)Decline 0.013∗ 0.020∗ 0.019 -0.006
(1.72) (1.77) (1.56) (-0.54)
Federal Court F.E Y Y Y YFiscal Year F.E. Y Y Y Y
Pseudo R2 0.196 0.105 0.049 0.058Observations 109,777 37,735 41,730 30,312
51

Table VI: Number of Keywords Determinants Model
This table reports results from Poisson regressions of # Keywords. Specification (1) is our baseline model.Specification (2) adds Return Volatility and Return Skewness. Specifications (3) and (4) re-estimate theseregressions for the sub-sample of firms that always include an FLS keyword list in their 10-K filing. Allmodels include federal circuit and year fixed effects. We report average marginal effects with the coefficientz-statistics in parenthesis. Standard errors are clustered at the firm level. Variables are defined in AppendixA. ***, **, and * indicate significance at the 1%, 5%, and 10% level, respectively.
Dependent Variable = # Keywords
Always
(1) (2) (3) (4)Baseline Market Baseline Market
Liberal Court 1.191∗∗∗ 1.238∗∗∗ 0.929 1.102(2.95) (2.70) (1.50) (1.55)
Legal -0.003 -0.009 0.174 0.044(-0.04) (-0.10) (1.48) (0.32)
∆ Log(10-K Size) 0.967∗∗∗ 0.878∗∗∗ 0.913∗∗∗ 0.755∗∗∗
(12.02) (8.83) (7.08) (4.85)Log(10-K Size)t−1 1.206∗∗∗ 1.341∗∗∗ 1.275∗∗∗ 1.373∗∗∗
(13.72) (10.92) (8.95) (6.48)Log(Age + 1) -0.335∗∗∗ -0.444∗∗∗ -0.595∗∗∗ -0.793∗∗∗
(-5.29) (-5.56) (-5.36) (-5.46)R&D 0.164∗ 0.155 0.347∗∗∗ 0.325∗∗
(1.84) (1.45) (2.65) (1.99)Loss Year 0.238∗∗∗ 0.227∗∗∗ 0.361∗∗∗ 0.294∗∗
(3.17) (2.69) (3.10) (2.19)Acquisition Sales Ratio 0.382∗∗∗ 0.361∗∗ 0.454∗∗ 0.311
(2.78) (2.27) (2.23) (1.31)ROA Deciles 0.047∗∗∗ 0.052∗∗ 0.058∗∗ 0.065∗∗
(2.66) (2.52) (2.16) (2.06)Return Volatility 1.686 5.193∗∗∗
(1.34) (3.05)Return Skewness -0.043∗∗∗ -0.067∗∗∗
(-3.53) (-3.76)IPOed within 3yrs 0.600∗∗∗ 0.560∗∗∗ 0.478∗∗∗ 0.345∗∗∗
(8.31) (6.55) (5.33) (3.14)Industry Avg. # KWt−1 0.255∗∗∗ 0.239∗∗∗ 0.393∗∗∗ 0.362∗∗∗
(4.25) (3.37) (4.82) (3.67)Big N Auditor 0.292∗∗∗ 0.267∗∗∗ 0.511∗∗∗ 0.452∗∗∗
(3.33) (2.67) (3.99) (3.12)CEO Change 0.093∗ 0.061 0.158∗ 0.132
(1.75) (1.07) (1.95) (1.49)CFO Change 0.177∗∗∗ 0.171∗∗∗ 0.224∗∗∗ 0.230∗∗∗
(3.54) (3.32) (2.93) (2.87)Introduction 0.376∗∗∗ 0.330∗∗∗ 0.455∗∗∗ 0.423∗∗∗
(4.60) (3.51) (3.52) (2.81)Growth 0.038 -0.019 -0.099 -0.147
(0.70) (-0.33) (-1.14) (-1.50)Out -0.035 -0.045 -0.089 -0.095
(-0.47) (-0.53) (-0.71) (-0.65)Decline 0.113 0.048 0.059 -0.016
(1.18) (0.42) (0.39) (-0.09)
Federal Court F.E Y Y Y YFiscal Year F.E. Y Y Y Y
Pseudo R2 0.073 0.073 0.084 0.085Observations 74,198 58,114 31,428 23,797
52

Table VII: Factor Analysis of the Most Frequent Words
This table reports the results from a factor analysis of the top words in the FLS keyword lists from 10-Kfilings. Panel A presents the frequencies and cumulative frequencies in percentage of the 20 most frequentkeywords. The last column shows the percentage of 10-K filings in which each word appears. Panel B reportsthe eigenvalues and the variance explained from the first 10 factors. Based on these results, we furtherexamine factors 1 through 5 and present the loadings and their uniqueness from a varimax rotation in PanelC. Lastly, Panel D presents the inter-temporal means of the most frequent 20 words in the 10-K FLS list.These means capture the percentage of 10-Ks where each word has appeared throughout our sample period.The keywords used in these analyses have been stemmed using the Porter Stemming algorithm from theNLTK Python package. The factor analysis was performed on tetrachoric correlations, due to the binarynature of FLS keyword inclusion.
Panel A: Keyword Frequency in 10-K Filings
Keyword Frequency Cumulative % % of 10-Ks
expect 84,095 10.1 96.6anticip 82,598 20.0 94.8believ 81,280 29.8 93.3estim 71,617 38.4 82.2intend 65,209 46.2 74.9plan 58,929 53.3 67.7may 50,499 59.3 58.0will 44,797 64.7 51.4should 39,149 69.4 44.9project 36,228 73.7 41.6could 27,405 77.0 31.5continu 24,971 80.0 28.7potenti 19,196 82.3 22.0predict 18,288 84.5 21.0would 15,080 86.3 17.3seek 13,174 87.9 15.1forecast 9,187 89.0 10.5target 8,026 90.0 9.2goal 5,421 90.6 6.2might 4,421 91.2 5.1... ... ... ...
Total 833,152 100.0 100.0
Panel B: Eigenvalues and Explained Variance
Factor Eigenvalue Difference Proportion Cumulative
Factor 1 7.639 5.240 0.399 0.399Factor 2 2.399 0.193 0.125 0.524Factor 3 2.205 0.833 0.115 0.639Factor 4 1.372 0.323 0.072 0.711Factor 5 1.049 0.140 0.055 0.766Factor 6 0.908 0.104 0.047 0.813Factor 7 0.804 0.114 0.042 0.855Factor 8 0.690 0.134 0.036 0.891Factor 9 0.556 0.129 0.029 0.920Factor 10 0.427 0.086 0.022 0.942...
53

Panel C: Varimax Rotated Factor Loadings
Factor 1 Factor 2 Factor 3 Factor 4 Factor 5Keyword (Future Statea) (Modalb) (Likelihoodc) (Quantitatived) (Future Actione) Uniqueness
expect 0.20 0.18 0.90 0.01 0.16 0.09anticip 0.25 0.08 0.77 0.02 0.18 0.30believ 0.04 0.15 0.69 0.07 0.30 0.41estim 0.67 0.13 -0.26 0.26 0.50 0.15intend -0.06 0.33 0.35 0.16 0.63 0.34plan 0.38 0.19 0.30 0.24 0.61 0.29may 0.58 0.75 0.16 0.02 -0.03 0.08will 0.45 0.60 0.26 -0.01 -0.11 0.36should 0.48 0.63 0.24 0.16 0.07 0.29project 0.10 0.21 -0.34 0.78 0.17 0.19could 0.28 0.83 0.12 0.22 0.16 0.14continu 0.84 0.24 0.17 -0.04 -0.09 0.21potenti 0.85 0.29 0.20 0.11 0.06 0.14predict 0.85 0.19 0.16 0.09 0.11 0.19would 0.07 0.87 0.07 0.09 0.24 0.17seek 0.02 0.07 0.28 0.05 0.83 0.23forecast 0.12 0.06 0.18 0.81 -0.06 0.29target 0.06 0.18 0.21 0.69 0.23 0.40goal 0.05 0.07 0.11 0.60 0.21 0.58might 0.27 0.64 -0.04 0.15 0.06 0.49
aFrom the Merriam-Webster online dictionary: Estimate: to judge tentatively or approximately thevalue, worth, or significance of. Continue: to maintain without interruption a condition, course, oraction. Potential: existing in possibility: capable of development into actuality. Predict: to declareor indicate in advance
bA modal verb is usually used with another verb to express different ideas such as possibility (mightor may), probability or necessity (must), promise or willingness (will), preferences or desires (would),ability (can), possibility (could), and uncertain prediction (should).
cFrom the Merriam-Webster online dictionary: Anticipate: to look forward to as certain. Expect: toconsider probable or certain. Believe: to consider to be true or honest
dFrom the Merriam-Webster online dictionary: Project: to plan, figure, or estimate for the future.Forecast: to calculate or predict (some future event or condition) usually as a result of study andanalysis of available pertinent data. Target: a goal to be achieved. Goal: the end toward which effortis directed
eFrom the Merriam-Webster online dictionary: Intend: to design for a specified use or future. Plan:to devise or project the realization or achievement of. Seek: to try to acquire or gain
54

Panel D: Inter-temporal Means of Top 20 Words in 10-K FLS Lists
Fiscal Year expect anticip believ estim intend plan may will should project
1996 0.882 0.844 0.781 0.621 0.374 0.296 0.156 0.147 0.085 0.2381997 0.904 0.875 0.826 0.629 0.461 0.343 0.197 0.173 0.113 0.2241998 0.924 0.889 0.847 0.666 0.505 0.392 0.246 0.229 0.155 0.2341999 0.932 0.900 0.868 0.689 0.558 0.448 0.316 0.286 0.195 0.2372000 0.934 0.907 0.880 0.720 0.596 0.496 0.369 0.345 0.243 0.2532001 0.945 0.920 0.898 0.736 0.617 0.529 0.406 0.392 0.274 0.2772002 0.949 0.925 0.907 0.761 0.658 0.563 0.439 0.431 0.311 0.3132003 0.956 0.937 0.922 0.783 0.699 0.603 0.482 0.454 0.350 0.3382004 0.962 0.944 0.926 0.794 0.723 0.626 0.514 0.472 0.372 0.3582005 0.968 0.950 0.932 0.815 0.751 0.665 0.552 0.496 0.413 0.3842006 0.970 0.954 0.940 0.826 0.758 0.689 0.577 0.508 0.437 0.4042007 0.973 0.956 0.944 0.841 0.781 0.713 0.610 0.526 0.462 0.4182008 0.977 0.960 0.951 0.850 0.797 0.729 0.636 0.550 0.493 0.4442009 0.976 0.961 0.951 0.860 0.800 0.738 0.649 0.560 0.510 0.4582010 0.978 0.965 0.956 0.865 0.810 0.755 0.666 0.573 0.531 0.4722011 0.980 0.969 0.957 0.872 0.814 0.768 0.685 0.587 0.556 0.4822012 0.980 0.970 0.960 0.880 0.828 0.780 0.703 0.602 0.572 0.4982013 0.981 0.971 0.963 0.886 0.845 0.793 0.722 0.628 0.589 0.5192014 0.983 0.974 0.966 0.895 0.856 0.805 0.746 0.648 0.613 0.5342015 0.985 0.975 0.971 0.903 0.862 0.815 0.758 0.664 0.629 0.5482016 0.986 0.975 0.973 0.907 0.870 0.821 0.770 0.679 0.642 0.5622017 0.986 0.974 0.973 0.907 0.875 0.824 0.771 0.690 0.652 0.568
Total 0.966 0.948 0.933 0.822 0.749 0.677 0.580 0.514 0.450 0.416
Fiscal Year could continu potenti predict would seek forecast target goal might
1996 0.018 0.082 0.018 0.035 0.005 0.069 0.020 0.008 0.020 0.0001997 0.033 0.096 0.020 0.036 0.011 0.079 0.032 0.016 0.028 0.0031998 0.055 0.111 0.033 0.044 0.021 0.075 0.033 0.016 0.025 0.0041999 0.083 0.148 0.063 0.071 0.032 0.077 0.035 0.019 0.027 0.0062000 0.111 0.175 0.094 0.097 0.048 0.084 0.042 0.021 0.029 0.0112001 0.142 0.193 0.112 0.112 0.063 0.090 0.053 0.024 0.030 0.0162002 0.173 0.212 0.129 0.131 0.079 0.096 0.065 0.033 0.038 0.0222003 0.205 0.225 0.144 0.150 0.098 0.108 0.074 0.043 0.046 0.0262004 0.237 0.243 0.163 0.165 0.115 0.117 0.082 0.052 0.047 0.0292005 0.268 0.266 0.189 0.183 0.132 0.129 0.087 0.065 0.051 0.0372006 0.294 0.281 0.209 0.206 0.149 0.133 0.092 0.072 0.053 0.0432007 0.328 0.306 0.228 0.223 0.170 0.144 0.096 0.082 0.056 0.0542008 0.351 0.313 0.242 0.229 0.189 0.155 0.110 0.094 0.061 0.0592009 0.367 0.314 0.247 0.234 0.192 0.160 0.117 0.102 0.066 0.0582010 0.380 0.321 0.260 0.240 0.203 0.170 0.123 0.113 0.070 0.0572011 0.404 0.338 0.280 0.255 0.223 0.178 0.132 0.125 0.075 0.0632012 0.419 0.353 0.289 0.272 0.238 0.187 0.139 0.129 0.078 0.0672013 0.446 0.370 0.315 0.291 0.261 0.203 0.152 0.142 0.083 0.0792014 0.477 0.382 0.339 0.314 0.287 0.215 0.157 0.159 0.093 0.0882015 0.498 0.390 0.351 0.322 0.305 0.226 0.166 0.170 0.098 0.0942016 0.520 0.397 0.357 0.328 0.321 0.232 0.171 0.185 0.103 0.1002017 0.536 0.396 0.363 0.329 0.341 0.244 0.184 0.197 0.116 0.099
Total 0.315 0.287 0.220 0.210 0.173 0.151 0.106 0.092 0.062 0.051
Future State: estim, continu, potenti, predictModal: may, will, should, could, would, mightLikelihood: expect, anticip, believQuantitative: project, forecast, target, goalFuture Action: intend, plan, seek
55

Table VIII: Regression Results from Factor Analysis Outcomes
This table presents results from regressions of the factors from our factor analysis on the FLS keyword list.Panel A presents results from Poisson regressions of the total number of keywords in column (1), and ofthe number of keywords in each of our factor categories in the subsequent columns. The categories are“Future State” (estim, continu, potenti, predict), “Modal” (may, will, should, could, would, might), “Likelihood”(expect, anticip, believ), “Quantitative” (project, forecast, target, and goal), and “Future Action” (intend, plan,seek). We report average marginal effects and (in parenthesis) the coefficient z-statistics. Panel B reportsOLS regression results using as the dependent variable the # of keywords in column (1), and the predictedfactors scores in columns (2) to (6). Standard errors are clustered at the firm level in both panels. Variablesare defined in Appendix A. ***, **, and * indicate significance at the 1%, 5%, and 10% level, respectively.
Panel A: Count of Words with Large Factor Loading
# Keywords
(1) (2) (3) (4) (5) (6)Total Future State Modal Likelihood Quantitative Future Action
Liberal Court 1.241∗∗∗ 0.498∗∗∗ 0.297 0.082 0.322∗∗∗ 0.116(2.70) (4.05) (1.44) (1.47) (3.24) (1.07)
Legal -0.015 -0.036 -0.014 -0.002 0.030 0.007(-0.17) (-1.40) (-0.36) (-0.22) (1.42) (0.37)
Guidance -0.016 0.013 -0.054 0.026∗∗∗ -0.006 0.048∗∗
(-0.18) (0.47) (-1.38) (2.71) (-0.31) (2.54)Guidance Intensity 0.006 0.001 0.000 0.000 0.004∗∗∗ 0.003∗∗
(0.81) (0.59) (0.01) (0.37) (2.81) (2.09)∆ Log(10-K Size) 0.876∗∗∗ 0.157∗∗∗ 0.323∗∗∗ 0.002 0.150∗∗∗ 0.089∗∗∗
(8.80) (5.19) (6.81) (0.18) (6.06) (4.03)Log(10-K Size)t−1 1.337∗∗∗ 0.252∗∗∗ 0.467∗∗∗ 0.015 0.216∗∗∗ 0.164∗∗∗
(10.87) (6.82) (8.03) (0.98) (7.60) (5.80)Log(Age + 1) -0.445∗∗∗ -0.183∗∗∗ -0.228∗∗∗ -0.030∗∗∗ 0.060∗∗∗ -0.082∗∗∗
(-5.55) (-8.36) (-6.47) (-3.22) (3.43) (-4.61)R&D 0.145 0.067∗∗ 0.132∗∗∗ 0.013 -0.049∗ 0.027
(1.35) (2.18) (2.86) (1.02) (-1.95) (1.18)Loss Year 0.224∗∗∗ 0.089∗∗∗ 0.005 0.019∗ 0.002 0.041∗∗
(2.67) (3.86) (0.13) (1.92) (0.12) (2.33)Acquisition Sales Ratio 0.354∗∗ 0.087∗ 0.127∗ 0.014 0.034 0.053
(2.24) (1.91) (1.84) (0.73) (0.83) (1.50)ROA Deciles 0.049∗∗ 0.011∗ 0.002 0.002 0.009∗∗ 0.005
(2.38) (1.87) (0.28) (0.97) (2.00) (1.23)Return Volatility 1.685 0.752∗∗ 0.819 0.222 -0.823∗∗ 0.793∗∗∗
(1.34) (2.09) (1.49) (1.44) (-2.26) (2.76)Return Skewness -0.042∗∗∗ -0.006∗ -0.017∗∗∗ -0.001 -0.002 -0.008∗∗∗
(-3.45) (-1.86) (-3.46) (-0.43) (-0.71) (-3.32)IPOed within 3yrs 0.564∗∗∗ 0.151∗∗∗ 0.154∗∗∗ 0.019∗ 0.091∗∗∗ 0.070∗∗∗
(6.58) (6.51) (4.29) (1.85) (4.74) (3.72)Industry Avg. # KWt−1 0.239∗∗∗ 0.116∗∗∗ 0.058∗∗ 0.020∗∗∗ 0.014 0.044∗∗∗
(3.36) (5.93) (2.07) (2.70) (0.91) (2.98)Big N Auditor 0.256∗∗ 0.069∗∗ 0.058 0.019∗ 0.036 0.050∗∗
(2.53) (2.33) (1.32) (1.71) (1.51) (2.28)CEO Change 0.061 0.013 0.026 -0.002 0.018 0.010
(1.08) (0.80) (1.13) (-0.29) (1.48) (0.84)CFO Change 0.171∗∗∗ 0.028∗ 0.082∗∗∗ -0.001 0.022∗∗ 0.029∗∗∗
(3.31) (1.90) (3.81) (-0.11) (1.96) (2.68)Introduction 0.336∗∗∗ 0.069∗∗ 0.161∗∗∗ -0.003 0.045∗ 0.035∗
(3.56) (2.51) (3.97) (-0.27) (1.80) (1.72)Growth -0.018 0.005 0.040 0.009 -0.014 -0.000
(-0.30) (0.29) (1.55) (1.41) (-1.06) (-0.03)Out -0.038 -0.009 0.040 -0.004 -0.049∗∗∗ -0.029∗
(-0.46) (-0.42) (1.20) (-0.55) (-2.82) (-1.71)Decline 0.057 0.002 0.088∗ -0.005 -0.043∗ 0.025
(0.50) (0.07) (1.86) (-0.37) (-1.67) (1.08)
Federal Court F.E Y Y Y Y Y YFiscal Year F.E. Y Y Y Y Y Y
Pseudo R2 0.073 0.040 0.078 0.001 0.058 0.023Observations 58,114 58,114 58,114 58,114 58,114 58,114

Panel B: Factor Scores
(1) (2) (3) (4) (5) (6)# Keywords Future State Modal Likelihood Quantitative Future Action
Liberal Court 0.998∗∗ 0.325∗∗∗ -0.030 -0.049 -0.070 0.271∗∗∗
(2.30) (3.77) (-0.32) (-0.52) (-0.69) (2.73)Legal -0.010 -0.022 -0.018 0.012 0.039∗ 0.005
(-0.11) (-1.07) (-0.84) (0.62) (1.79) (0.21)Guidance -0.050 0.018 -0.079∗∗∗ 0.044∗∗ -0.001 0.023
(-0.56) (0.90) (-3.81) (2.40) (-0.03) (1.08)Guidance Intensity 0.006 0.001 -0.003 -0.001 0.007∗∗∗ 0.002
(0.74) (0.73) (-1.31) (-0.54) (3.26) (1.06)∆ Log(10-K Size) 0.826∗∗∗ 0.065∗∗∗ 0.125∗∗∗ -0.050∗∗ 0.077∗∗∗ 0.057∗∗∗
(9.44) (3.13) (6.06) (-2.26) (3.56) (2.65)Log(10-K Size)t−1 1.298∗∗∗ 0.107∗∗∗ 0.178∗∗∗ -0.045 0.130∗∗∗ 0.092∗∗∗
(10.86) (3.85) (5.92) (-1.58) (4.07) (3.05)Log(Age + 1) -0.446∗∗∗ -0.114∗∗∗ -0.098∗∗∗ -0.019 0.137∗∗∗ -0.039∗∗
(-5.67) (-7.04) (-5.25) (-1.11) (6.52) (-2.02)R&D 0.136 0.042∗ 0.076∗∗∗ 0.056∗∗ -0.077∗∗∗ -0.039
(1.29) (1.80) (3.12) (2.35) (-2.88) (-1.55)Loss Year 0.235∗∗∗ 0.087∗∗∗ -0.042∗∗ 0.008 -0.016 0.023
(2.75) (4.77) (-2.00) (0.43) (-0.80) (1.19)Acquisition Sales Ratio 0.316∗∗ 0.085∗∗ -0.017 0.001 0.023 -0.010
(2.01) (2.26) (-0.44) (0.03) (0.56) (-0.26)ROA Deciles 0.052∗∗ 0.012∗∗∗ -0.007 -0.000 0.011∗∗ -0.000
(2.50) (2.63) (-1.46) (-0.00) (2.12) (-0.10)Return Volatility 1.277 0.368 0.011 -0.056 -0.479 0.492
(1.03) (1.21) (0.04) (-0.18) (-1.60) (1.49)Return Skewness -0.043∗∗∗ -0.002 -0.008∗∗∗ 0.002 0.001 -0.006∗
(-3.29) (-0.59) (-2.65) (0.73) (0.47) (-1.93)IPOed within 3yrs 0.593∗∗∗ 0.103∗∗∗ 0.042∗∗ -0.009 0.074∗∗∗ 0.049∗∗
(6.95) (5.63) (2.14) (-0.44) (3.66) (2.33)Industry Avg. # KWt−1 0.281∗∗∗ 0.084∗∗∗ -0.002 0.053∗∗∗ 0.004 0.015
(3.71) (5.21) (-0.11) (3.61) (0.21) (0.84)Big N Auditor 0.275∗∗∗ 0.040∗ 0.018 0.017 0.012 0.038
(2.69) (1.70) (0.71) (0.79) (0.48) (1.52)CEO Change 0.063 0.016 -0.004 -0.000 0.022 -0.004
(1.05) (1.17) (-0.30) (-0.03) (1.47) (-0.25)CFO Change 0.187∗∗∗ 0.003 0.053∗∗∗ -0.003 0.013 0.021
(3.33) (0.28) (3.68) (-0.32) (0.94) (1.58)Introduction 0.333∗∗∗ 0.043∗∗ 0.066∗∗∗ -0.030 -0.003 0.009
(3.61) (2.04) (2.86) (-1.50) (-0.12) (0.39)Growth -0.022 -0.012 0.027∗ 0.026∗∗ -0.021 -0.003
(-0.37) (-0.97) (1.94) (2.16) (-1.34) (-0.20)Out -0.045 -0.014 0.050∗∗∗ 0.005 -0.060∗∗∗ -0.034∗
(-0.54) (-0.82) (2.60) (0.31) (-3.05) (-1.79)Decline 0.044 0.003 0.056∗∗ -0.028 -0.057∗∗ 0.000
(0.39) (0.11) (2.03) (-1.17) (-2.24) (0.01)
Federal Court F.E. Y Y Y Y Y YFiscal Year F.E. Y Y Y Y Y Y
R2 0.216 0.067 0.099 0.010 0.079 0.035Observations 58,114 58,114 58,114 58,114 58,114 58,114
57

Table IX: Comparison of 10-K vs. 8-K FLS Keyword Lists
This table reports results from a comparison of the FLS keyword lists in 10-K filings vs. in 8-K filings.Specification (1) presents results from a fractional regression of the Jaccard similarity index computed as theintersection of the stemmed words in the 10-K and 8-K keyword lists divided by the union of the words inthe lists. Specification (2) shows results from OLS regressions of the absolute difference between the numberof keywords in the 10-K FLS list and the number of keywords in the 8-K list (Abs[# 10-K KWs — # 8-KKWs]). Lastly, specification (3) reports results from OLS regressions of the signed value of this difference.
(1) (2) (3)Jaccard Index ‖#10K–#8K‖ #10K–#8K
Liberal Court 0.289∗ -0.492 -0.013(1.68) (-0.78) (-0.02)
Legal -0.002 0.044 0.143(-0.06) (0.39) (1.09)
8-K/10-K Length Ratio 1.902∗∗∗ -5.415∗∗∗ -5.289∗∗∗
(4.22) (-4.30) (-3.59)Log(Age + 1) 0.155∗∗∗ -0.492∗∗∗ -0.182∗
(6.46) (-6.04) (-1.90)R&D -0.140∗∗∗ 0.601∗∗∗ 0.553∗∗∗
(-4.31) (4.96) (3.77)Loss Year -0.105∗∗∗ 0.338∗∗∗ 0.194
(-3.82) (3.26) (1.50)Acquisition Sales Ratio -0.113∗ 0.711∗∗∗ 0.182
(-1.87) (2.58) (0.53)ROA Deciles -0.011∗ 0.030 0.036
(-1.67) (1.16) (1.18)IPOed within 3yrs 0.009 0.308∗∗∗ 0.039
(0.31) (2.63) (0.27)Big N Auditor 0.212∗∗∗ -0.530∗∗∗ -0.280∗
(6.75) (-4.15) (-1.81)CEO Change -0.005 -0.005 0.056
(-0.24) (-0.06) (0.60)CFO Change -0.035∗ 0.135∗ 0.141
(-1.81) (1.72) (1.49)Introduction -0.031 0.154 0.418∗∗
(-0.94) (1.10) (2.41)Growth -0.004 0.041 0.138
(-0.19) (0.52) (1.44)Out -0.007 0.066 0.125
(-0.27) (0.63) (1.01)Decline -0.067∗ 0.177 0.352∗
(-1.68) (1.08) (1.76)
Federal Court F.E. Y Y YFiscal Year F.E. Y Y Y
Pseudo R2/R2 0.032 0.071 0.025Observations 20,137 20,137 20,137
58