Propulsion System Design and Sizing of an Electric · PDF filePropulsion System Design and...
5
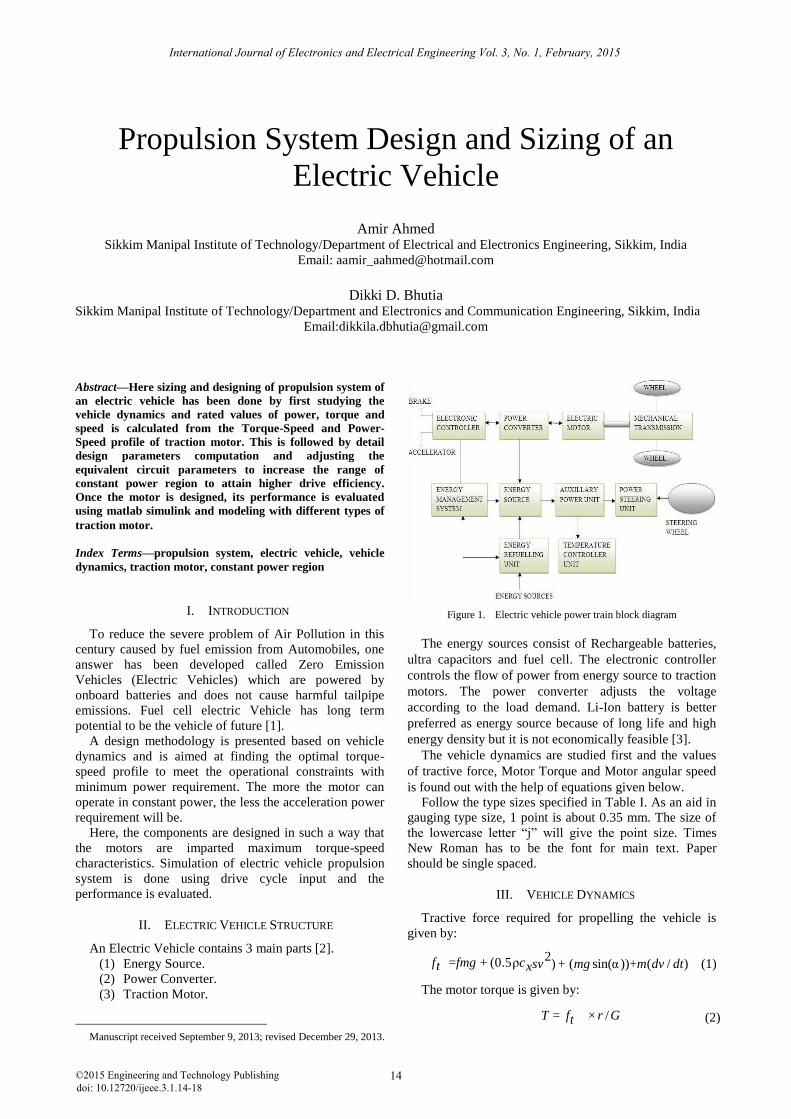
Propulsion System Design and Sizing of an Electric Vehicle Amir Ahmed Sikkim Manipal Institute of Technology/Department of Electrical and Electronics Engineering, Sikkim, India Email: [email protected] Dikki D. Bhutia Sikkim Manipal Institute of Technology/Department and Electronics and Communication Engineering, Sikkim, India Email:[email protected] Abstract—Here sizing and designing of propulsion system of an electric vehicle has been done by first studying the vehicle dynamics and rated values of power, torque and speed is calculated from the Torque-Speed and Power- Speed profile of traction motor. This is followed by detail design parameters computation and adjusting the equivalent circuit parameters to increase the range of constant power region to attain higher drive efficiency. Once the motor is designed, its performance is evaluated using matlab simulink and modeling with different types of traction motor. Index Terms—propulsion system, electric vehicle, vehicle dynamics, traction motor, constant power region I. INTRODUCTION To reduce the severe problem of Air Pollution in this century caused by fuel emission from Automobiles, one answer has been developed called Zero Emission Vehicles (Electric Vehicles) which are powered by onboard batteries and does not cause harmful tailpipe emissions. Fuel cell electric Vehicle has long term potential to be the vehicle of future [1]. A design methodology is presented based on vehicle dynamics and is aimed at finding the optimal torque- speed profile to meet the operational constraints with minimum power requirement. The more the motor can operate in constant power, the less the acceleration power requirement will be. Here, the components are designed in such a way that the motors are imparted maximum torque-speed characteristics. Simulation of electric vehicle propulsion system is done using drive cycle input and the performance is evaluated. II. ELECTRIC VEHICLE STRUCTURE An Electric Vehicle contains 3 main parts [2]. (1) Energy Source. (2) Power Converter. (3) Traction Motor. Manuscript received September 9, 2013; revised December 29, 2013. Figure 1. Electric vehicle power train block diagram The energy sources consist of Rechargeable batteries, ultra capacitors and fuel cell. The electronic controller controls the flow of power from energy source to traction motors. The power converter adjusts the voltage according to the load demand. Li-Ion battery is better preferred as energy source because of long life and high energy density but it is not economically feasible [3]. The vehicle dynamics are studied first and the values of tractive force, Motor Torque and Motor angular speed is found out with the help of equations given below. Follow the type sizes specified in Table I. As an aid in gauging type size, 1 point is about 0.35 mm. The size of the lowercase letter “j” will give the point size. Times New Roman has to be the font for main text. Paper should be single spaced. III. VEHICLE DYNAMICS Tractive force required for propelling the vehicle is given by: f t =fmg + (0.5 ρc x sv 2 ) + (mg sin(α ))+m(dv / dt ) (1) The motor torque is given by: T = f t ×r / G (2) International Journal of Electronics and Electrical Engineering Vol. 3, No. 1, February, 2015 ©2015 Engineering and Technology Publishing 14 doi: 10.12720/ijeee.3.1.14-18
Transcript of Propulsion System Design and Sizing of an Electric · PDF filePropulsion System Design and...
Propulsion System Design and Sizing of an
Electric Vehicle
Amir Ahmed Sikkim Manipal Institute of Technology/Department of Electrical and Electronics Engineering, Sikkim, India
Email: [email protected]
Dikki D. Bhutia
Sikkim Manipal Institute of Technology/Department and Electronics and Communication Engineering, Sikkim, India
Email:[email protected]
Abstract—Here sizing and designing of propulsion system of
an electric vehicle has been done by first studying the
vehicle dynamics and rated values of power, torque and
speed is calculated from the Torque-Speed and Power-
Speed profile of traction motor. This is followed by detail
design parameters computation and adjusting the
equivalent circuit parameters to increase the range of
constant power region to attain higher drive efficiency.
Once the motor is designed, its performance is evaluated
using matlab simulink and modeling with different types of
traction motor.
Index Terms—propulsion system, electric vehicle, vehicle
dynamics, traction motor, constant power region
I. INTRODUCTION
To reduce the severe problem of Air Pollution in this
century caused by fuel emission from Automobiles, one
answer has been developed called Zero Emission
Vehicles (Electric Vehicles) which are powered by
onboard batteries and does not cause harmful tailpipe
emissions. Fuel cell electric Vehicle has long term
potential to be the vehicle of future [1].
A design methodology is presented based on vehicle
dynamics and is aimed at finding the optimal torque-
speed profile to meet the operational constraints with
minimum power requirement. The more the motor can
operate in constant power, the less the acceleration power
requirement will be.
Here, the components are designed in such a way that
the motors are imparted maximum torque-speed
characteristics. Simulation of electric vehicle propulsion
system is done using drive cycle input and the
performance is evaluated.
II. ELECTRIC VEHICLE STRUCTURE
An Electric Vehicle contains 3 main parts [2].
(1) Energy Source.
(2) Power Converter.
(3) Traction Motor.
Manuscript received September 9, 2013; revised December 29, 2013.
Figure 1. Electric vehicle power train block diagram
The energy sources consist of Rechargeable batteries,
ultra capacitors and fuel cell. The electronic controller
controls the flow of power from energy source to traction
motors. The power converter adjusts the voltage
according to the load demand. Li-Ion battery is better
preferred as energy source because of long life and high
energy density but it is not economically feasible [3].
The vehicle dynamics are studied first and the values
of tractive force, Motor Torque and Motor angular speed
is found out with the help of equations given below.
Follow the type sizes specified in Table I. As an aid in
gauging type size, 1 point is about 0.35 mm. The size of
the lowercase letter “j” will give the point size. Times
New Roman has to be the font for main text. Paper
should be single spaced.
III. VEHICLE DYNAMICS
Tractive force required for propelling the vehicle is
given by:
f t =fmg + (0.5ρc xsv 2
) + (mg sin(α ))+m(dv / dt ) (1)
The motor torque is given by:
T = f t × r / G (2)
International Journal of Electronics and Electrical Engineering Vol. 3, No. 1, February, 2015
©2015 Engineering and Technology Publishing 14doi: 10.12720/ijeee.3.1.14-18

The motor Angular speed is given by:
w = G × v / r (3)
Tractive Force (f t ) :
The term tractive force is the pulling or pushing force
exerted by a vehicle on another vehicle or object.
Gear Ratio (G) :
The gear ratio of a gear train is the ratio of the angular
velocity of the input gear to the angular velocity of the
output gear, also known as the speed ratio of the gear
train.
Drag Coefficient (cx ) :
In fluid dynamics, the drag coefficient is a
dimensionless quantity that is used to quantify the drag or
resistance of an object in a fluid environment such as air
or water.
Grade (α) :
The grade (also called slope, incline, gradient, pitch or
rise) of a physical feature, topographic landform or
constructed element, refers to the amount of inclination of
that surface to the horizontal.
We have taken City bus as a source vehicle whose
vehicle parameters are shown below:
TABLE I. VEHICLE PARAMETER DYNAMICS
Parameter Symbol Value
Coefficient of rolling
friction f 0.01
Vehicle mass m 5123 Kg
Air density ρ 1.3 Kg/m3
Grade angle α 0
Frontal area s 5.65m2
Aerodynamic drag
coefficient cx 0.5
Gear ratio G 20
Tyre radius r 0.4m
Gravitational
acceleration g 9.81m/s2
In above table, the parameters of a source vehicle (City
bus) are chosen. The mass of the vehic1e is taken as
5123Kg with inclination of 0 degree angle.
The parameters of city bus shown in above table are
put in all above three equations and the following plots
are obtained.
In the above plot of Power versus speed, at speed of
3000Rpm the power is becoming constant. So, at rated
speed of 3000 Rpm, the rated power will be 60Kw and
maximum motor power will be 80Kw respectively.
Figure 2. Power versus speed
Figure 3. Torque versus speed
Similarly, In Torque versus Speed plot, at rated speed
of 3000 Rpm the rated torque will be 220 Nm.
Figure 4. Speed (rpm) versus time (seconds).
From the vehicle dynamics, the following above plots
are done and the rated values of Power, Torque and speed
is obtained whose values are used as an input for traction
motor sizing. Rated speed, Rated motor Power and Rated
motor torque will be used as an input for designing the
parameters of Induction motor.
IV. TRACTION MOTOR SIZING
From the plots obtained in Fig. 2, Fig. 3 and Fig. 4, the
following motor design data’s are obtained.
International Journal of Electronics and Electrical Engineering Vol. 3, No. 1, February, 2015
©2015 Engineering and Technology Publishing 15
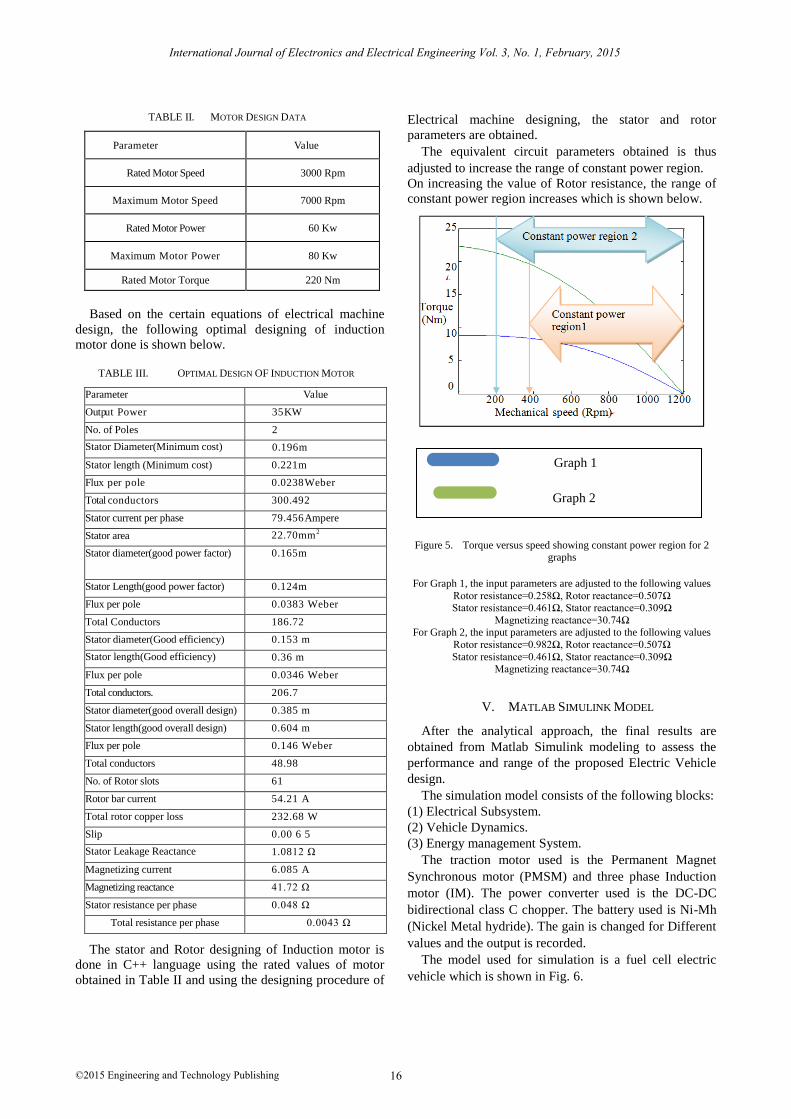
TABLE II. MOTOR DESIGN DATA
Parameter Value
Rated Motor Speed 3000 Rpm
Maximum Motor Speed 7000 Rpm
Rated Motor Power 60 Kw
Maximum Motor Power 80 Kw
Rated Motor Torque 220 Nm
Based on the certain equations of electrical machine
design, the following optimal designing of induction
motor done is shown below.
TABLE III. OPTIMAL DESIGN OF INDUCTION MOTOR
Parameter Value Output Power 35 KW No. of Poles 2 Stator Diameter(Minimum cost) 0.196 m Stator length (Minimum cost) 0.221 m Flux per pole 0.0238 Weber Total conductors 300.49 2 Stator current per phase 79.456 Ampere Stator area 22.70 mm 2 Stator diameter(good power factor) 0.165 m
Stator Length(good power factor) 0.124 m Flux per pole 0.0383 Weber
Total Conductors 186.72
Stator diameter(Good efficiency) 0.153 m
Stator length(Good efficiency) 0.36 m
Flux per pole 0.0346 Weber
Total conductors. 206.7
Stator diameter(good overall design) 0.385 m
Stator length(good overall design) 0.604 m
Flux per pole 0.146 Weber
Total conductors 48.98
No. of Rotor slots 61
Rotor bar current 54.21 A
Total rotor copper loss 232.68 W
Slip 0.00 6 5
Stator Leakage Reactance 1.0812 Ω
Magnetizing current 6.085 A
Magnetizing reactance 41.72 Ω
Stator resistance per phase 0.048 Ω
Total resistance per phase 0.0043 Ω
The stator and Rotor designing of Induction motor is
done in C++ language using the rated values of motor
obtained in Table II and using the designing procedure of
Electrical machine designing, the stator and rotor
parameters are obtained.
The equivalent circuit parameters obtained is thus
adjusted to increase the range of constant power region.
On increasing the value of Rotor resistance, the range of
constant power region increases which is shown below.
Figure 5. Torque versus speed showing constant power region for 2 graphs
For Graph 1, the input parameters are adjusted to the following values
Rotor resistance=0.258Ω, Rotor reactance=0.507Ω Stator resistance=0.461Ω, Stator reactance=0.309Ω
Magnetizing reactance=30.74Ω For Graph 2, the input parameters are adjusted to the following values
Rotor resistance=0.982Ω, Rotor reactance=0.507Ω
Stator resistance=0.461Ω, Stator reactance=0.309Ω Magnetizing reactance=30.74Ω
V. MATLAB SIMULINK MODEL
After the analytical approach, the final results are
obtained from Matlab Simulink modeling to assess the
performance and range of the proposed Electric Vehicle
design.
The simulation model consists of the following blocks:
(1) Electrical Subsystem.
(2) Vehicle Dynamics.
(3) Energy management System.
The traction motor used is the Permanent Magnet
Synchronous motor (PMSM) and three phase Induction
motor (IM). The power converter used is the DC-DC
bidirectional class C chopper. The battery used is Ni-Mh
(Nickel Metal hydride). The gain is changed for Different
values and the output is recorded.
The model used for simulation is a fuel cell electric
vehicle which is shown in Fig. 6.
Graph 1
Graph 2
International Journal of Electronics and Electrical Engineering Vol. 3, No. 1, February, 2015
©2015 Engineering and Technology Publishing 16

Figure 6. Fuel cell electric vehicle model.
Drive Cycle:
A drive cycle is a standardized driving pattern. This
pattern is described by means of a velocity–time table.
Now putting the New York City drive cycle as an input.
Above model is run again and the output graph between
reference and actual speed is plotted under considerable
time period.
Further simulation for PMSM with accelerator and
later with Induction motor is done for 15 seconds for
better understanding of the motor power, Fuel cell power
and battery power which is shown in Fig. 7.
Figure 7. Fuel cell electric vehicle simulation output graph.
Later simulation of the same model is done with New
York City drive cycle for 540 seconds to compare the
efficiency and working of both PMSM and Induction
motor.
Figure 8. Drive cycle output of PMSM electric vehicle for 78 seconds
The drive cycle in Fig. 8 shows that the actual car
speed does not attend the reference speed which is due to
machine inefficiency. The drive cycle shows the clear
difference however, the validation is not there. The
simulation result of the proposed model was satisfactory
and shows correct performance of the system.
Figure 9. Drive cycle output of induction motor electric vehicle for 50 seconds.
From the above two simulation outputs, it is clear that
PMSM gives better simulation results than Induction
Motor. Their advantages are [4].
(1) Since, the magnetic field is excited by high
energy of magnetic fields; it results in high
efficiency and easy speed control.
(2) They have longer operating lives and an
increased reliability and Brushless DC motor has
been recommended for high performance
electric vehicle [5].
Recent research has indicated that the permanent
magnet synchronous motor and brushless dc motor
(BLDC) can compete with Induction motor for electric
vehicle propulsion [6].
Eventually, the simulation results for Rotor speed,
Rotor and Stator current responses and Time response of
Torque of 3 phase Induction motor is obtained.
Fig. 10 shows that the rotor-speed curve of three phase
Induction motor (wound rotor type).With respect to the
above figure, the rotor speed is gradually increased to the
rated speed. The rated speed is 1150rpm and it is reached
at nearly 0.8seconds.
International Journal of Electronics and Electrical Engineering Vol. 3, No. 1, February, 2015
©2015 Engineering and Technology Publishing 17

Figure 10. Rotor speed curve of 3phase induction motor
Figure 11. Rotor and stator current responses of 3phase induction motor
The rotor and stator current responses of the three-
phase induction motor are shown in Fig. 11. The rotor
current fluctuates between 0 and 0.7 second. The stator
current is drawn about 10 A at 0.8 second as shown in the
figure. In Fig. 12, the time response of electromagnetic torque
in the three-phase induction motor is expressed. The
electromagnetic torque of three-phase induction motor is
firstly variable in 0 to 0.4 second. Then the rated torque is
reached at 0.8 second. The rated torque can be seen 10
Nm as shown in the figure below.
Figure 12. Time response of electromagnetic torque in 3phase induction motor
VI. CONCLUSION
Both PMSM and Induction Motor shows good
characteristics for application in Electric Vehicles but
PMSM are more preferred because of higher efficiency,
higher power density and low cost [7]. But the only
disadvantage with PMSM is that they are not self-starting
motors .The range of Constant power region of Traction
motor can be increased by increasing the value of rotor
resistance. The vehicle’s operational constraints can be
met with minimum power if the vehicle is operated
mostly in constant power region[8]. Drive cycle can be
prepared to evaluate the performance of electric vehicle
through simulation and this reduces the time of testing the
road and the fatigue engineers has to take in order to test
the road.
REFERENCES
[1] E. Mehrdadehsani, K. M. Rahman, and H. A. Toliyat, “Propulsion system design of electric and hybrid vehicles,” IEEE Transactions
on Industrial Electronics, vol. 44, no. 1, pp. 19-27, February 1997.
[2] C. C Chan and Y. S Wong, “Electric vehicles charge forward,” IEEE Power and Energy Magazine, pp. 2-12,
November/December 2004. [3] I. Alcala, A. Claudio, and G. V. Guerrero, “Analysis of propulsion
system in electric vehicles,” in Proc. CIE 2005, September 7-9,
2005, pp. 312-313.
[4] P. Lindahl, E. Moog, and S. R. S. Haw, “Simulation design and
validation of an uav sofc propulsion system,” IEEE Transactions on Aerospace and Electronic Systems, vol. 48, no. 3, pp. 2583-
2592, July 2012. [5] A. Tashakori and M. Ektesabi, “Direct torque controlled drive
train for electric vehicle,” in Proc. the World Congress on
Engineering. [6] K. Buhr and P. Vozenilek, “Analysis of an electric vehicle with a
BLDC pm motor in the wheel body,” Transactions on Transport Sciences, vol. 5, no. 1, pp. 1-10, 2012.
[7] J. D. S. Ochoa, “FEM analysis applied to electric machines for
electric vehicles,” Digital Comprehensive Summaries of Uppsala Dissertations from the Faculty of Science and Technology, vol.
845. [8] R. Singh, V. C. D. Roy, and C. K. Dwivedi, IJEEE, vol. 1, no. 3,
pp. 2931-5284, 2012.
Amir Ahmed was born in 04.10.1989,
Chungthang, Sikkim, India. He graduated in
Electrical and Electronics Engineering in 2012 from Sikkim Manipal Institute of
Technology, Sikkim, India and currently working as Assistant Professor Grade II in
Sikkim Manipal Institute of Technology. His
research interests are power electronics, electric vehicles, intelligent system and
robotics.
Dikki D Bhutia was born in 10.02.1990, Gyalshing, Sikkim, India. She graduated in
Electronics and Communication Engineering in 2012 from Sikkim Manipal Institute of
Technology, Sikkim, India and currently
working as a Research trainee in Science and Technology (remote sensing) department in
Sikkim. Her research interests are remote
sensing and Communication engineering.
International Journal of Electronics and Electrical Engineering Vol. 3, No. 1, February, 2015
©2015 Engineering and Technology Publishing 18