
Lake Washington Submarine Cable Alternative Feasibility Study
University of Central Florida University of Central Florida
STARS STARS
Electronic Theses and Dissertations, 2004-2019
2007
Proposing An Alternative Framework For Feasibility Studies For Proposing An Alternative Framework For Feasibility Studies For
Large Public Tourism Investments: A Quantitative Analysis Of The Large Public Tourism Investments: A Quantitative Analysis Of The
Marcelinio Kock University of Central Florida
Part of the Hospitality Administration and Management Commons, and the Tourism and Travel
Commons
Find similar works at: https://stars.library.ucf.edu/etd
University of Central Florida Libraries http://library.ucf.edu
This Masters Thesis (Open Access) is brought to you for free and open access by STARS. It has been accepted for
inclusion in Electronic Theses and Dissertations, 2004-2019 by an authorized administrator of STARS. For more
information, please contact [email protected].
STARS Citation STARS Citation Kock, Marcelinio, "Proposing An Alternative Framework For Feasibility Studies For Large Public Tourism Investments: A Quantitative Analysis Of The" (2007). Electronic Theses and Dissertations, 2004-2019. 3229. https://stars.library.ucf.edu/etd/3229
PROPOSING AN ALTERNATIVE FRAMEWORK FOR FEASIBILITY STUDIES FOR LARGE PUBLIC TOURISM INVESTMENTS: A QUANTITATIVE ANALYSIS OF THE
ORANGE COUNTY CONVENTION CENTER.
by
MARCELINO GERALD KOCK B.S. Christelijke Hogeschool Nederland, 2004
A thesis submitted in partial fulfillment of the requirements for the degree of Master of Science
in the Rosen College of Hospitality Management at the University of Central Florida
Orlando, Florida
Spring Term 2007

ii
© 2007 Marcelino Gerald Kock
iii
ABSTRACT
Numerous studies in the hospitality field have focused on the importance of the
convention industry to the economic well being of the local tourism industry. Because of intense
competition between convention centers, destinations are practicing strategies of expanding their
convention facilities and related infrastructure. Unfortunately, many of these expansions appear
to have been based on feasibility studies that failed to present rigorous reviews and examinations
regarding alleged claims of positive impacts and over-optimistic operational pro-forma
statements. The main objective of this study is to propose an alternative framework for feasibility
studies, which consists of an updated, rigorous methodology to calculate a more comprehensive
picture, on what convention centers can deliver on public and private investment. Data from the
Orange County Convention Center (OCCC) in Orlando, Florida were used for assessing this
proposed framework.

iv
Sometimes it takes courage……… To dream the impossible dream
To fight the unbeatable foe To bear with unbearable sorrow
To ride where the brave dare not to go To right the unrightable wrong
To love pure and chaste from afar To try when your arms are too weary
To reach the unreachable star
This is my quest To follow that star
No matter how hopeless No matter how far
To fight for the right Without question or pause
To be willing to march into hell for a heavenly cause
And I know If I only be true
To this glorious quest that my heart will lie peaceful and calm When I am laid to my rest
And the world will be better for this
That one man, scorned and covered with scars Still strolled, with his last ounce of courage
To reach the unreachable star. (Miguel de Cervantes Saavedra)

v
ACKNOWLEDGMENTS
First of all, I would like to thank the Grand Architect of the Universe for guiding me all
the way through this degree, and putting on my path, all tools necessary for achieving this goal.
Secondly, an enormous word of gratitude goes for my lovely wife and daughters, who for
almost two years have tolerated my absence and melancholic moods. Both their moral and
spiritual belief has contributed to the success of what I consider the second half of my academic
career. To the rest of my family in Aruba, who, from the beginning of this journey has supported
me in achieving this challenging, but yet attainable goal. Regardless of the distance, their moral
support and advice were constantly felt and appreciated. To my dad, this is considered my living
example of being an individual with an enormous faith, motivation and determination.
To my committee chair, Dr. Tadayuki Hara, I would like to provide sincere thanks and
appreciation for his belief in my work. One day didn’t pass by without providing both his
academic and moral support, but also his rigorous requirement of independently comprehending
the complex model of Input-Output Analysis.
To the other committee members, Dr. Deborah Breiter, Dr.Robin DiPietro and Dr.
Bradley Braun, I would like to give thanks and provide my deepest appreciation for all their hard
work in reviewing my thesis. They also provided suggestions on finding some of the scattered
secondary data that was required for this study. A special thank you also goes to Dr. Robin
DiPietro for her detailed reviewing process and her honest advice on transforming ideas into
academic literature. Her prompt responses kept me on track during the process of writing each
chapter. The response time alone was very motivational.

vi
Outside of the committee, I would also like to provide a special thanks to two
representatives of the Orange County Convention Center. They are Mrs. Mary Wood and Mr.
Kristopher Shoemaker. Both provided me with all the necessary secondary data that were
needed, starting from the initial construction of the Orange County Convention Center till the
present date. Also Mr. Daryl Cronk, Research Manager of the Orlando Orange County
Convention and Visitors Bureau went out of his way to provide me with the necessary
expenditure data of convention visitors.
Finally, I wish to extend a special thanks to the rest of the faculty members of the Rosen
College of Hospitality Management for their moral support throughout the thesis process. It will
be too much to mention since each of them provided their support in their own way.
Lastly, to the staff of the University of Aruba, I thank them for their continuous emails
that contained tons of motivation during the rigorous process of writing my thesis.
I thank you all.
vii
TABLE OF CONTENTS
LIST OF FIGURES ....................................................................................................................... ix
LIST OF TABLES.......................................................................................................................... x
LIST OF ACRONYMS/ABBREVIATIONS............................................................................... xii
CHAPTER 1: INTRODUCTION................................................................................................... 1
1.1 Purpose of Study ................................................................................................................... 4
CHAPTER 2: LITERATURE REVIEW........................................................................................ 6
2.1. Convention Centers in North America. ............................................................................... 6
2.1.1 Construction History of Convention Centers................................................................. 6
2.1.2. Purpose of Building Convention Centers ..................................................................... 9
2.1.3. The Case of the Orange County Convention Center (OCCC).................................... 12
2.2 Financing of Convention Centers ....................................................................................... 16
2.2.1. Feasibility Studies for Convention Centers ................................................................ 16
2.2.2. Funding Strategies for Convention Centers................................................................ 19
2.3 Economic Impact of Convention Centers ........................................................................... 22
2.3.1. Dilemma for Novice Researchers ............................................................................... 22
2.3.2. Input-Output Analysis................................................................................................. 24
2.3.3. Multipliers and their Interpretations ........................................................................... 27
CHAPTER 3: METHODOLOGY ................................................................................................ 29
3.1. Description of the Four Phases .......................................................................................... 29
3.2. Review of the Input-Output Analysis. ............................................................................... 30
CHAPTER 4: RESULTS AND FINDINGS................................................................................. 35
viii
4.1. Phase I: Feasibility Studies of the OCCC.......................................................................... 35
4.1.1. The January 1998 report ............................................................................................. 36
4.1.2. The June 1998 Report ................................................................................................. 39
4.2. Phase II: Analyzing OCCC’s Financial Data..................................................................... 42
4.3. Phase III: The Tourist Development Tax (TDT). .............................................................. 46
4.3.1. Refunding Revenue Bonds, Series 2005..................................................................... 48
4.4. Phase IV: Economic Impact Results.................................................................................. 49
4.4.1. Past Projected Economic Impact ................................................................................ 49
4.4.2. Data used for the Economic Impact Analysis............................................................. 51
4.4.3 Results Economic Impact ............................................................................................ 56
4.4.4 Comparison with previous economic impact data ....................................................... 60
CHAPTER 5: CONCLUSIONS, LIMITATIONS AND RECOMMENDATIONS .................... 64
5.1 The Overall Picture ............................................................................................................. 64
5.2. Feasibility Studies.............................................................................................................. 64
5.3. Recommendations for the OCCC. ..................................................................................... 66
5.4. Limitations and Implications ............................................................................................. 67
5.5. Future Research Recommendations................................................................................... 69
REFERENCES ............................................................................................................................. 73
ix
LIST OF FIGURES
Figure 1: Total Exhibit Space in North America. Source: © Tradeshow Week 2006, Major
Exhibit Hall Directory............................................................................................................. 7
Figure 2: Projected Added Exhibit Space. Source: © Tradeshow Week 2006, Major Exhibit Hall
Directory. ................................................................................................................................ 8
Figure 3: Source © OCCC Market Research; Tradeshow Week 2005, Major Exhibit Hall
Directory. .............................................................................................................................. 14
Figure 4: MindMapping Activity Results OCCC (Ernst & Young, 1998a) ................................. 37
x
LIST OF TABLES
Table 1: Average spending of convention delegates related to the classification of the center. .. 11
Table 2: Types of ownership of U.S. Convention Centers. .......................................................... 13
Table 3: Top ten convention centers in the U.S............................................................................ 15
Table 4: Summary of Rating Symbols and Definitions ................................................................ 21
Table 5: Input-Output “T” Accounts ............................................................................................ 26
Table 6: Input-Output Table of Inter-industry Flows of Goods. .................................................. 32
Table 7: Building Program and Phasing. ...................................................................................... 40
Table 8: Phase V Estimated Development Cost. .......................................................................... 42
Table 9: OCCC Statement of Revenues, Expenses and Changes in Net Assets 2004-2005 ........ 44
Table 10: Highly impacted sectors of the economy affected by the OCCC. (unit: $ million) ..... 50
Table 11: Estimated Total Delegate Expenditures in Fiscal Year 2004. ...................................... 53
Table 12: Estimated Event Organizer Expenditures in Fiscal Year 2004. ................................... 54
Table 13: Estimated Total Exhibiting Company Expenditures in Fiscal Year 2004.................... 56
Table 14: Total Output by Effects of Delegate Expenditures on Total Output by Sectors (unit in
$million)................................................................................................................................ 57
Table 15: Total Output by Effects of Event Organizer Expenditures on Total Output by Sectors
(unit in $million). .................................................................................................................. 58
Table 16: Total Output by Effects of Exhibiting Company Expenditures on Total Output by
Sectors (unit in $million). ..................................................................................................... 59
Table 17: Multipliers, Total Jobs Created and Comparison with Previous Studies. .................... 60
Table 18: Total Impact Comparison with Previous Studies. ........................................................ 61

xi
Table 19: Previous Building Program of the OCCC .................................................................... 67
xii
LIST OF ACRONYMS/ABBREVIATIONS
CC: Convention Center. A facility that combines an exhibition space with a substantial number of smaller event spaces. The purpose of these buildings is to host trade shows, public shows, conventions, large food functions, and other functions related to the convention industry. They may be purpose built or converted and municipally or privately owned. (http://conventionindustry.org/glossary) CIC: The Convention Industry Council. The Convention Industry Council's 32 member organizations represent more than 103,500 individuals, as well as, 17,300 firms and properties involved in the meetings, conventions and exhibitions industries in the U.S. Formed in 1949 to provide a forum for member organizations seeking to enhance the industry, the CIC facilitates the exchange of information and develops programs to promote professionalism with the industry and educates the public on its profound economic impact. (http://www.conventionindustry.org/aboutcic/about_cic.htm) CVB: Convention and Visitor Bureaus. A convention and visitor bureau is a not-for- profit organization supported by transient room tax, government budget allocations, private membership or a combination of any or all three A CVB helps meeting planners and visitors learn about the destination and area attractions and make the best possible use of all the services and facilities the destination has to offer (www.iacvb.org). IMPLAN: IMPLAN is a micro-computer based input-output modeling system. With IMPLAN, one can estimate 528 sector I/O models for any region consisting one or more countries. IMPLAN includes procedure for generating multipliers and estimating impacts by applying final demand changes to the model (Minnesota IMPLAN Group, 2004) I/O Model Input-Output model is a practical extension of the classical theory of interdependence which views the whole economy of a region, a country as a single system and sets out to describe and to interpret its operation in terms of directly observable basic structural relationships (Leontief, 1987). I-RIDE: I-Ride is an outcome of cooperation between three district entities, which was created in 1992, called “The International Drive Master Transit and Improvement District”. It is a special taxing district formed under a public-private initiative with Orange County, the City of Orlando, and the businesses of the International Drive Resort Area. They are charged with planning, designing, and operating this transit service exclusively to the International Drive Resort Area businesses that are within the boundaries of the District taxing units. They also make
xiii
recommendations to local and state government agencies to reduce traffic congestion, enhance pedestrian safety and increase overall mobility and security of the entire District. (http://www.iridetrolley.com) MSA: Metropolitan Statistical Area. According to the U.S. Census Bureau, the general concept of a metropolitan area is one of a large population nucleus, together with adjacent communities that have a high degree of economic and social integration with that nucleus. Each metropolitan statistical area must contain either a place with a minimum population of 50,000 or a Census Bureau-defined urbanized area and a total metropolitan statistical area population of at least 100,000. A metropolitan statistical area comprises one or more counties, and may also include one ore more outlying counties that have close economic and social relationships with the central county. An outlying county must have a specified level of communicating to the central counties and also must meet certain standards regarding metropolitan character, such as population density, urban population, and population growth. (Expact2004, Convention Expenditure & Impact Study, IACVB Foundation) NAICS: North American Industry Classification System. The North American Industry Classification System (NAICS, pronounced Nakes) was developed as the standard for use by Federal statistical agencies in classifying business establishments for the collection, analysis, and publication of statistical data related to the business economy of the U.S. NAICS was developed under the auspices of the Office of Management and Budget (OMB), and adopted in 1997 to replace the old Standard Industrial Classification (SIC) system. It was also developed in cooperation with the statistical agencies of Canada and Mexico to establish a 3-country standard that allows for a high level of comparability in business statistics among the three countries. NAICS is the first economic classification system to be constructed based on a single economic concept. To learn more about the background, the development and the difference between NAICS and the SIC (www.census.gov) OCCC: Orange County Convention Center. The OCCC is currently among the top convention and tradeshow destinations in the world. Offering over one million square feet of exhibition space (second largest in the U.S.), the OCCC is well positioned to maintain a leadership position in the industry. (Ernst & Young, 1998a) OCCVB: Orange County Convention and Visitor Bureau. The Orlando/Orange County Convention & Visitors Bureau, Inc. (Orlando CVB) is the only officially recognized sales and marketing organization for the Orlando and Orange County area. Chartered in 1983 as a private not-for-profit organization, they represent more than 1,300 private businesses that make up the area's tourism industry. (http://www.orlandoinfo.com/b2b/cvbhome/)
xiv
TDT: Tourist Development Tax. The TDT is the tax imposed by the Tourist Development Tax Ordinance throughout Orange County, Florida. This is for the total rental charged for every person who rents, leases or lets for considerations any living quarters or accommodations in any hotel, apartment hotel, motel, resort motel, apartment, apartment motel, rooming house, mobile home park, recreational vehicle park or condominium for a term of six months or less.(RBC Dain Rauscher, 2005
1
CHAPTER 1: INTRODUCTION
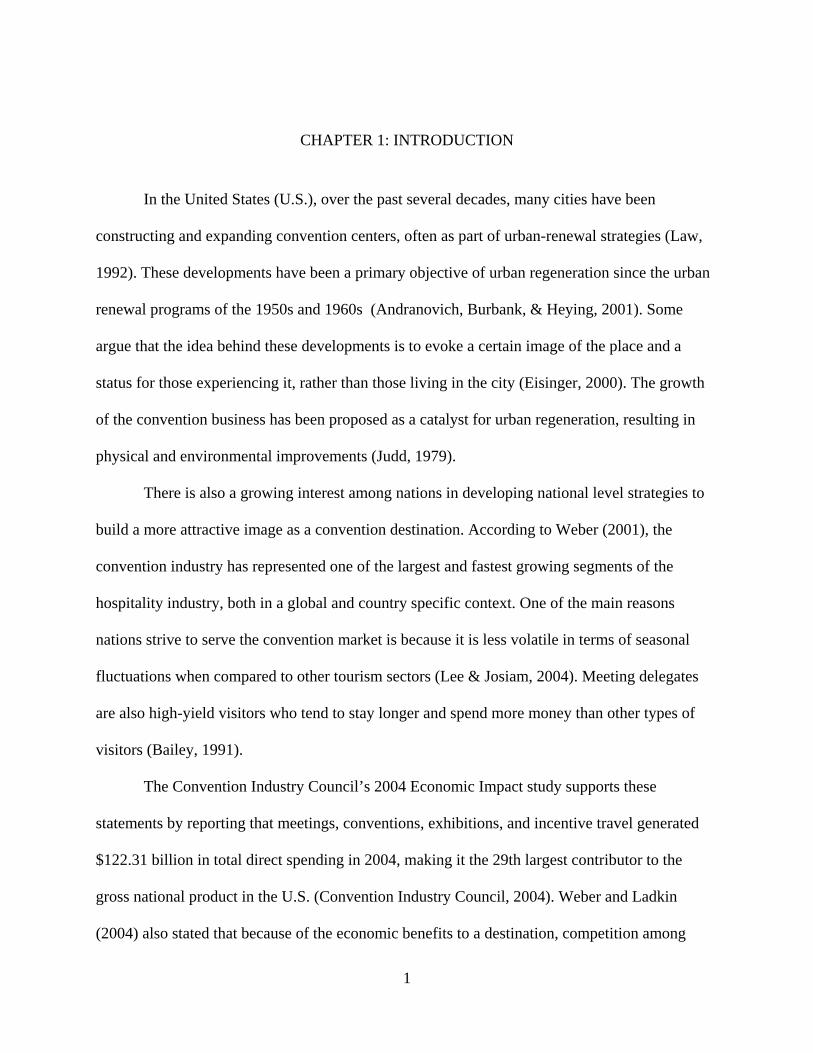
In the United States (U.S.), over the past several decades, many cities have been
constructing and expanding convention centers, often as part of urban-renewal strategies (Law,
1992). These developments have been a primary objective of urban regeneration since the urban
renewal programs of the 1950s and 1960s (Andranovich, Burbank, & Heying, 2001). Some
argue that the idea behind these developments is to evoke a certain image of the place and a
status for those experiencing it, rather than those living in the city (Eisinger, 2000). The growth
of the convention business has been proposed as a catalyst for urban regeneration, resulting in
physical and environmental improvements (Judd, 1979).
There is also a growing interest among nations in developing national level strategies to
build a more attractive image as a convention destination. According to Weber (2001), the
convention industry has represented one of the largest and fastest growing segments of the
hospitality industry, both in a global and country specific context. One of the main reasons
nations strive to serve the convention market is because it is less volatile in terms of seasonal
fluctuations when compared to other tourism sectors (Lee & Josiam, 2004). Meeting delegates
are also high-yield visitors who tend to stay longer and spend more money than other types of
visitors (Bailey, 1991).
The Convention Industry Council’s 2004 Economic Impact study supports these
statements by reporting that meetings, conventions, exhibitions, and incentive travel generated
$122.31 billion in total direct spending in 2004, making it the 29th largest contributor to the
gross national product in the U.S. (Convention Industry Council, 2004). Weber and Ladkin
(2004) also stated that because of the economic benefits to a destination, competition among
2
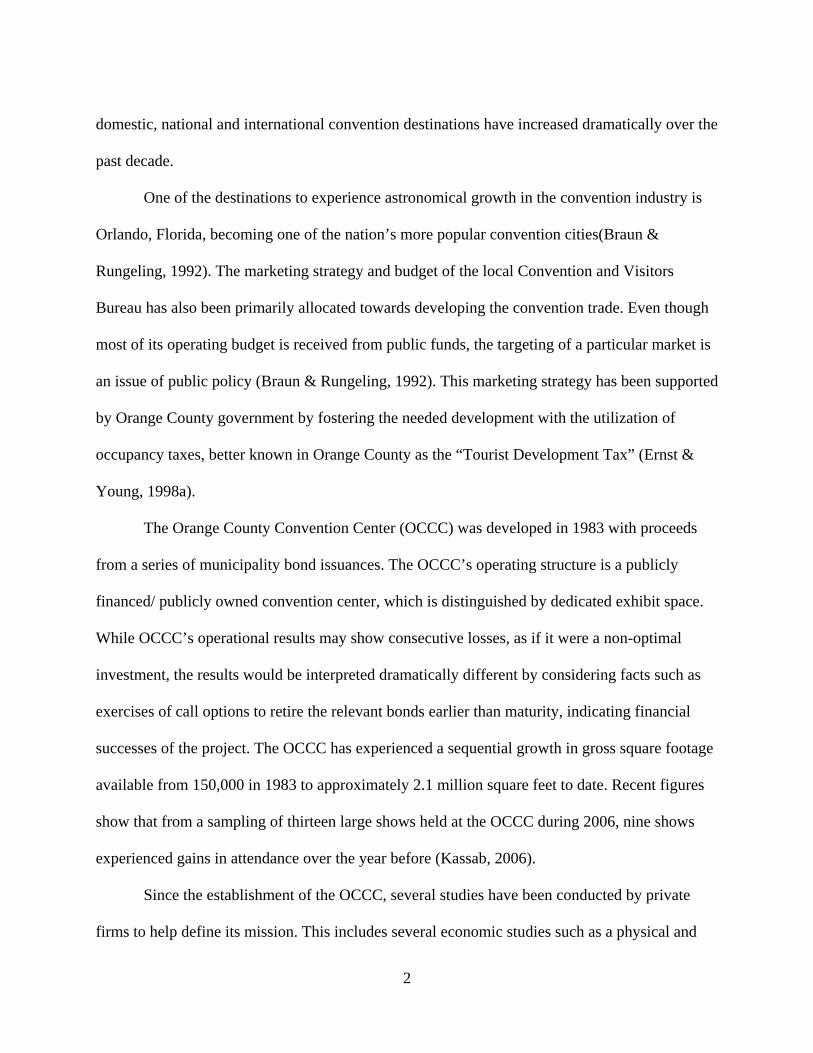
domestic, national and international convention destinations have increased dramatically over the
past decade.
One of the destinations to experience astronomical growth in the convention industry is
Orlando, Florida, becoming one of the nation’s more popular convention cities(Braun &
Rungeling, 1992). The marketing strategy and budget of the local Convention and Visitors
Bureau has also been primarily allocated towards developing the convention trade. Even though
most of its operating budget is received from public funds, the targeting of a particular market is
an issue of public policy (Braun & Rungeling, 1992). This marketing strategy has been supported
by Orange County government by fostering the needed development with the utilization of
occupancy taxes, better known in Orange County as the “Tourist Development Tax” (Ernst &
Young, 1998a).
The Orange County Convention Center (OCCC) was developed in 1983 with proceeds
from a series of municipality bond issuances. The OCCC’s operating structure is a publicly
financed/ publicly owned convention center, which is distinguished by dedicated exhibit space.
While OCCC’s operational results may show consecutive losses, as if it were a non-optimal
investment, the results would be interpreted dramatically different by considering facts such as
exercises of call options to retire the relevant bonds earlier than maturity, indicating financial
successes of the project. The OCCC has experienced a sequential growth in gross square footage
available from 150,000 in 1983 to approximately 2.1 million square feet to date. Recent figures
show that from a sampling of thirteen large shows held at the OCCC during 2006, nine shows
experienced gains in attendance over the year before (Kassab, 2006).
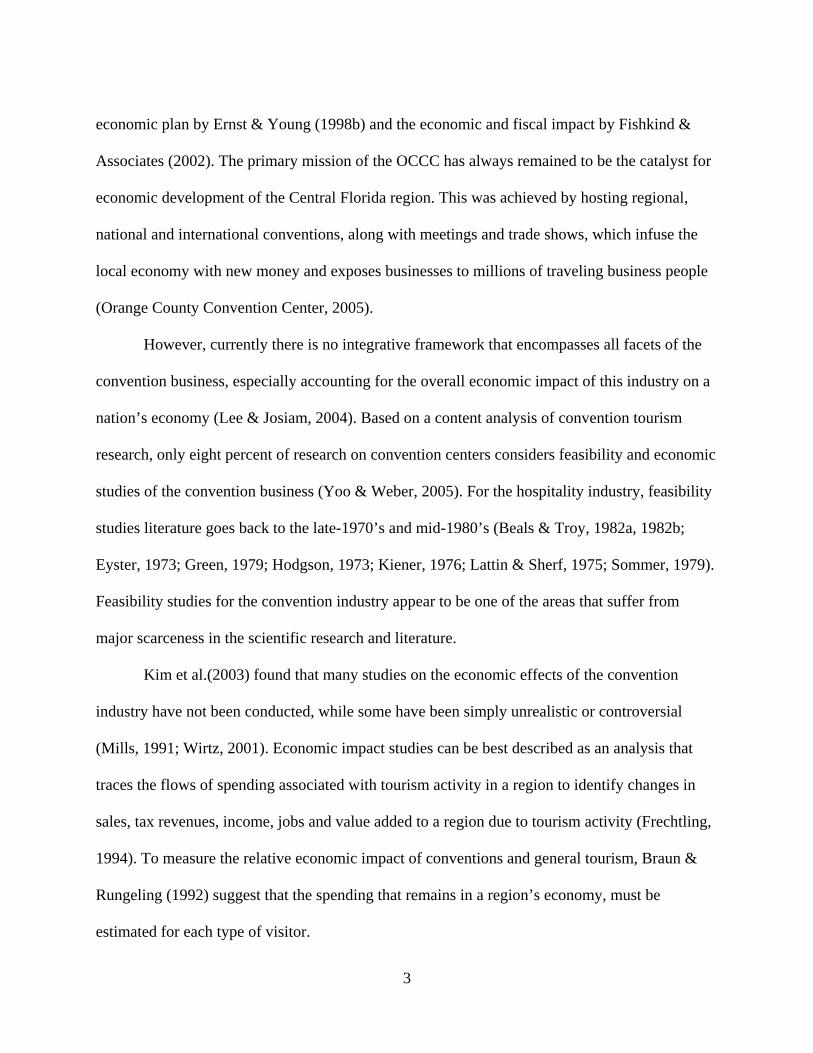
Since the establishment of the OCCC, several studies have been conducted by private
firms to help define its mission. This includes several economic studies such as a physical and
3
economic plan by Ernst & Young (1998b) and the economic and fiscal impact by Fishkind &
Associates (2002). The primary mission of the OCCC has always remained to be the catalyst for
economic development of the Central Florida region. This was achieved by hosting regional,
national and international conventions, along with meetings and trade shows, which infuse the
local economy with new money and exposes businesses to millions of traveling business people
(Orange County Convention Center, 2005).
However, currently there is no integrative framework that encompasses all facets of the
convention business, especially accounting for the overall economic impact of this industry on a
nation’s economy (Lee & Josiam, 2004). Based on a content analysis of convention tourism
research, only eight percent of research on convention centers considers feasibility and economic
studies of the convention business (Yoo & Weber, 2005). For the hospitality industry, feasibility
studies literature goes back to the late-1970’s and mid-1980’s (Beals & Troy, 1982a, 1982b;
Eyster, 1973; Green, 1979; Hodgson, 1973; Kiener, 1976; Lattin & Sherf, 1975; Sommer, 1979).
Feasibility studies for the convention industry appear to be one of the areas that suffer from
major scarceness in the scientific research and literature.
Kim et al.(2003) found that many studies on the economic effects of the convention
industry have not been conducted, while some have been simply unrealistic or controversial
(Mills, 1991; Wirtz, 2001). Economic impact studies can be best described as an analysis that
traces the flows of spending associated with tourism activity in a region to identify changes in
sales, tax revenues, income, jobs and value added to a region due to tourism activity (Frechtling,
1994). To measure the relative economic impact of conventions and general tourism, Braun &
Rungeling (1992) suggest that the spending that remains in a region’s economy, must be
estimated for each type of visitor.
4
Some of the possible reasons for the lack of research in the area and controversies for
economic impact studies for convention centers would include: (1) the difficulty in tracking
categories of convention spending by delegates, sponsors, or exhibitors; (2) the difficulty in
disaggregating industries affected by the convention industry because of its linkage with a
variety of other industries; and, (3) the difficulty in categorizing types of conventions due to the
nature of the convention including the type of sponsor, the number of delegates, the length of a
convention, a convention with or without exhibition or other types of events, scale of budget, and
a convention with or without pre- or post-convention tour program (Chon et al., 2003).
Displacement effect, low value added (i.e. little local production), and the focus on only benefits,
ignoring additional costs are also reasons for the controversy in determining the economic
impact. It is crucial for regions to perform economic impact studies and to determine the
feasibility of a convention center because the long term economic benefits for the region tend to
be overlooked or ignored.
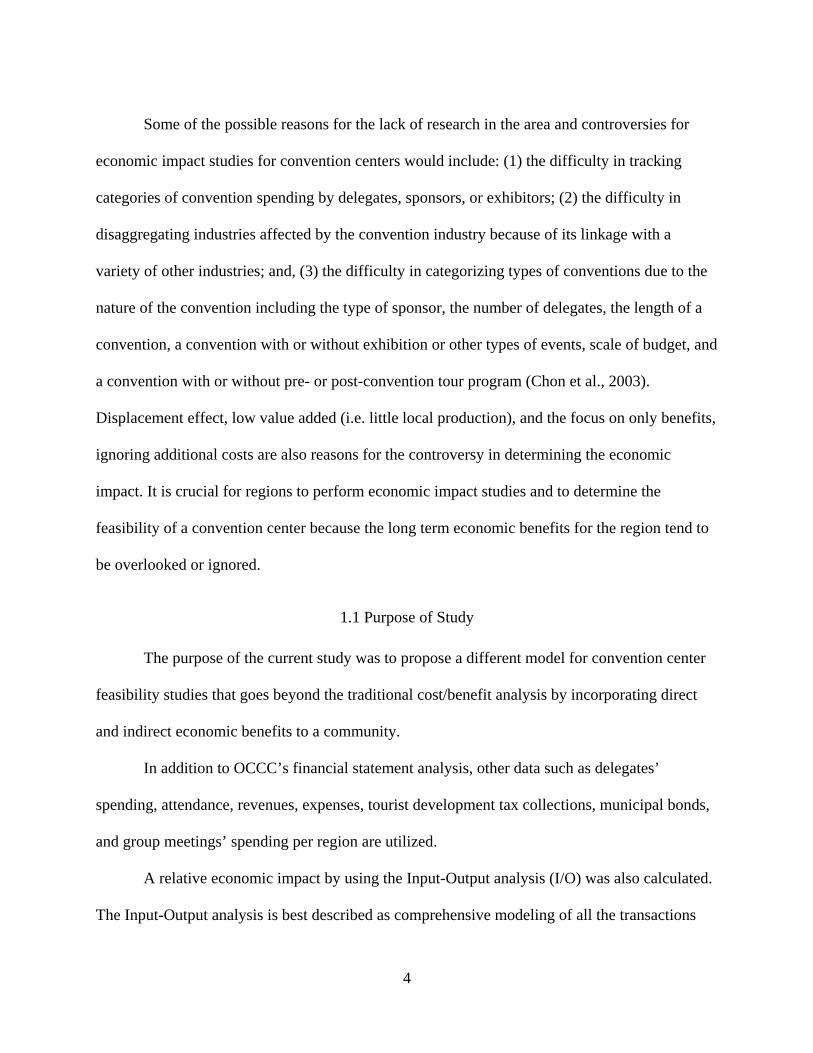
1.1 Purpose of Study
The purpose of the current study was to propose a different model for convention center
feasibility studies that goes beyond the traditional cost/benefit analysis by incorporating direct
and indirect economic benefits to a community.
In addition to OCCC’s financial statement analysis, other data such as delegates’
spending, attendance, revenues, expenses, tourist development tax collections, municipal bonds,
and group meetings’ spending per region are utilized.
A relative economic impact by using the Input-Output analysis (I/O) was also calculated.
The Input-Output analysis is best described as comprehensive modeling of all the transactions
5
among the industries of a country during a particular year (Miller & Blair, 1985). This model is a
means of examining relationships within a company, both between businesses and final
consumers. It also captures all monetary market transactions for consumption in a given time
period (Minnesota IMPLAN Group, 2004).
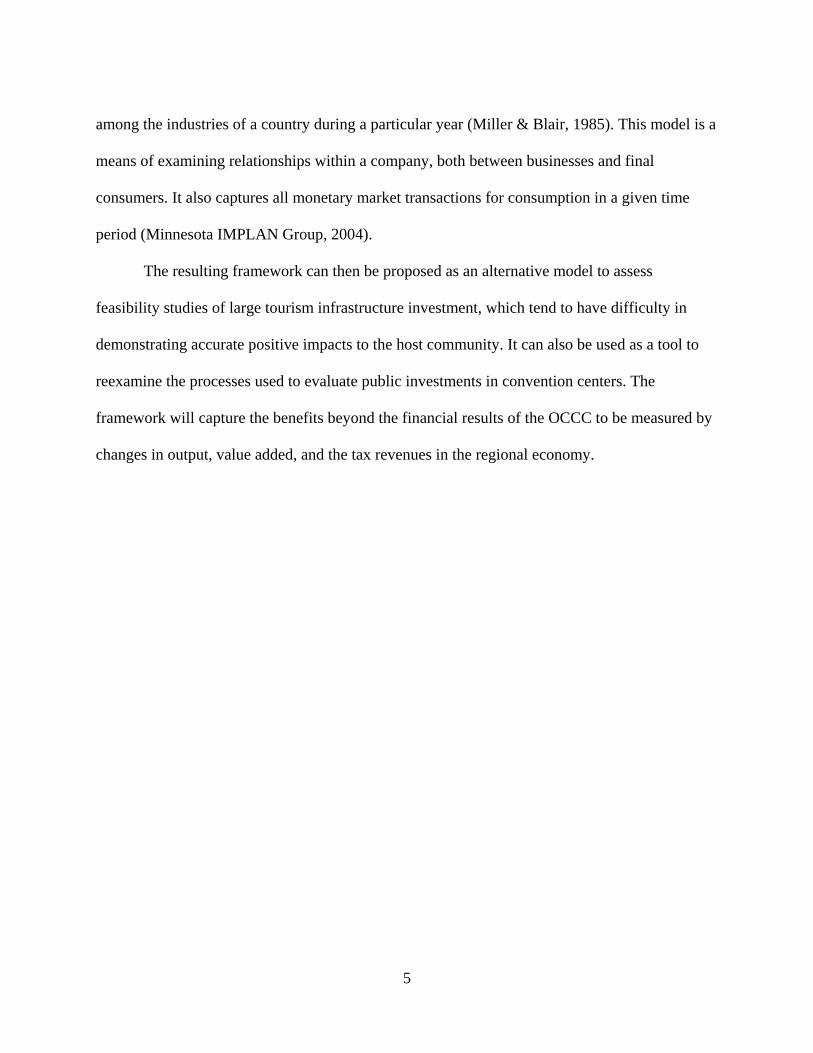
The resulting framework can then be proposed as an alternative model to assess
feasibility studies of large tourism infrastructure investment, which tend to have difficulty in
demonstrating accurate positive impacts to the host community. It can also be used as a tool to
reexamine the processes used to evaluate public investments in convention centers. The
framework will capture the benefits beyond the financial results of the OCCC to be measured by
changes in output, value added, and the tax revenues in the regional economy.
6
CHAPTER 2: LITERATURE REVIEW
2.1. Convention Centers in North America.
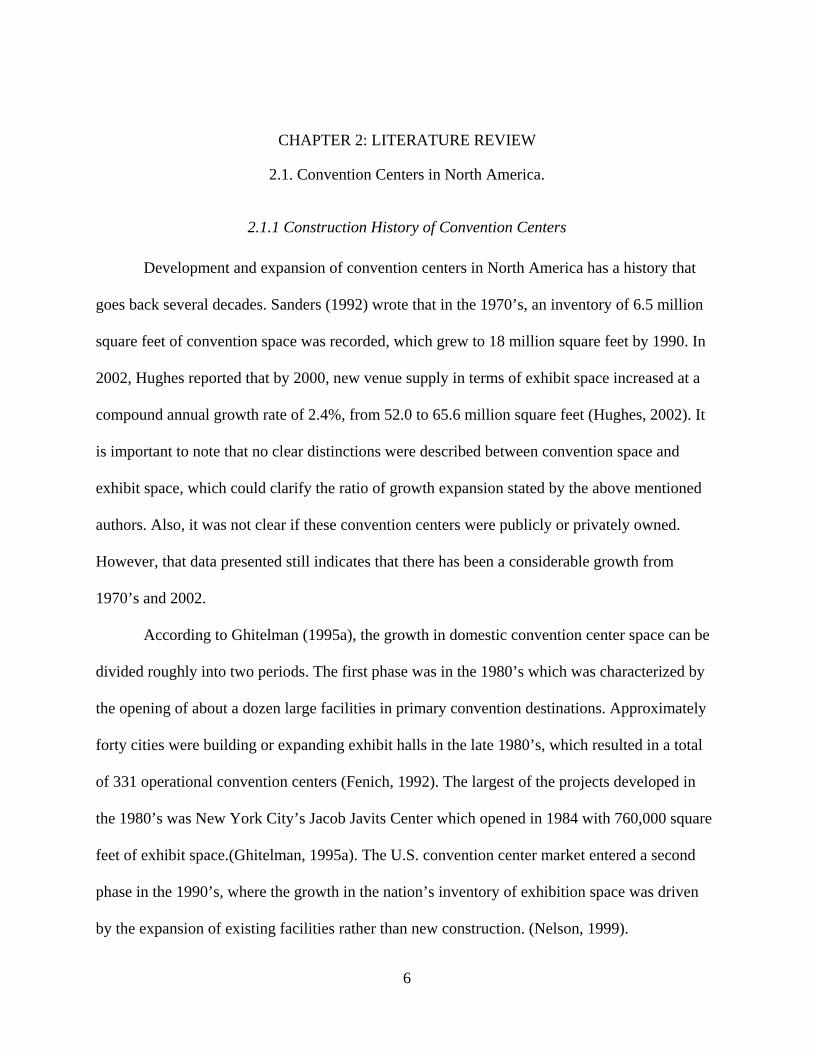
2.1.1 Construction History of Convention Centers
Development and expansion of convention centers in North America has a history that
goes back several decades. Sanders (1992) wrote that in the 1970’s, an inventory of 6.5 million
square feet of convention space was recorded, which grew to 18 million square feet by 1990. In
2002, Hughes reported that by 2000, new venue supply in terms of exhibit space increased at a
compound annual growth rate of 2.4%, from 52.0 to 65.6 million square feet (Hughes, 2002). It
is important to note that no clear distinctions were described between convention space and
exhibit space, which could clarify the ratio of growth expansion stated by the above mentioned
authors. Also, it was not clear if these convention centers were publicly or privately owned.
However, that data presented still indicates that there has been a considerable growth from
1970’s and 2002.
According to Ghitelman (1995a), the growth in domestic convention center space can be
divided roughly into two periods. The first phase was in the 1980’s which was characterized by
the opening of about a dozen large facilities in primary convention destinations. Approximately
forty cities were building or expanding exhibit halls in the late 1980’s, which resulted in a total
of 331 operational convention centers (Fenich, 1992). The largest of the projects developed in
the 1980’s was New York City’s Jacob Javits Center which opened in 1984 with 760,000 square
feet of exhibit space.(Ghitelman, 1995a). The U.S. convention center market entered a second
phase in the 1990’s, where the growth in the nation’s inventory of exhibition space was driven
by the expansion of existing facilities rather than new construction. (Nelson, 1999).
7
Cities that followed this trend included San Francisco, Los Angeles, St. Louis, Kansas
City, Dallas, Salt Lake City, San Diego, New Orleans, Orlando, and Chicago. In 2001, there
were 96 new venues and expansion projects in the planning stages or under construction,
representing an increase of 48% over the 1996 level (Hughes, 2002).
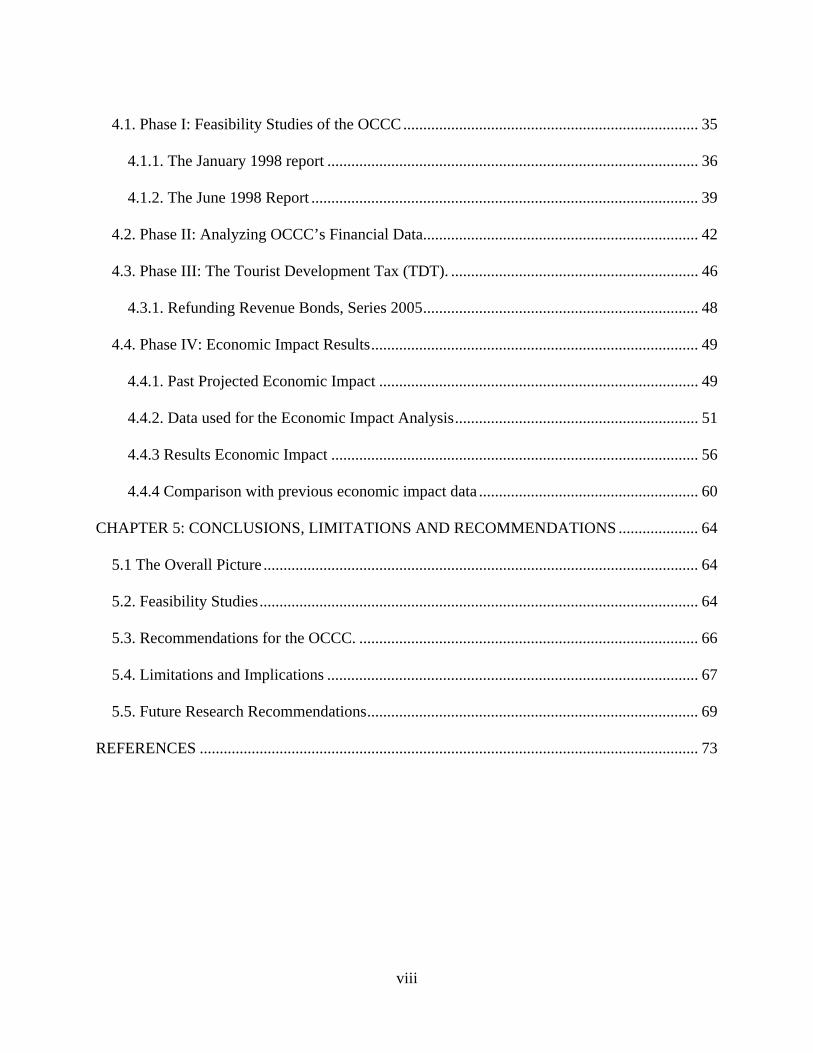
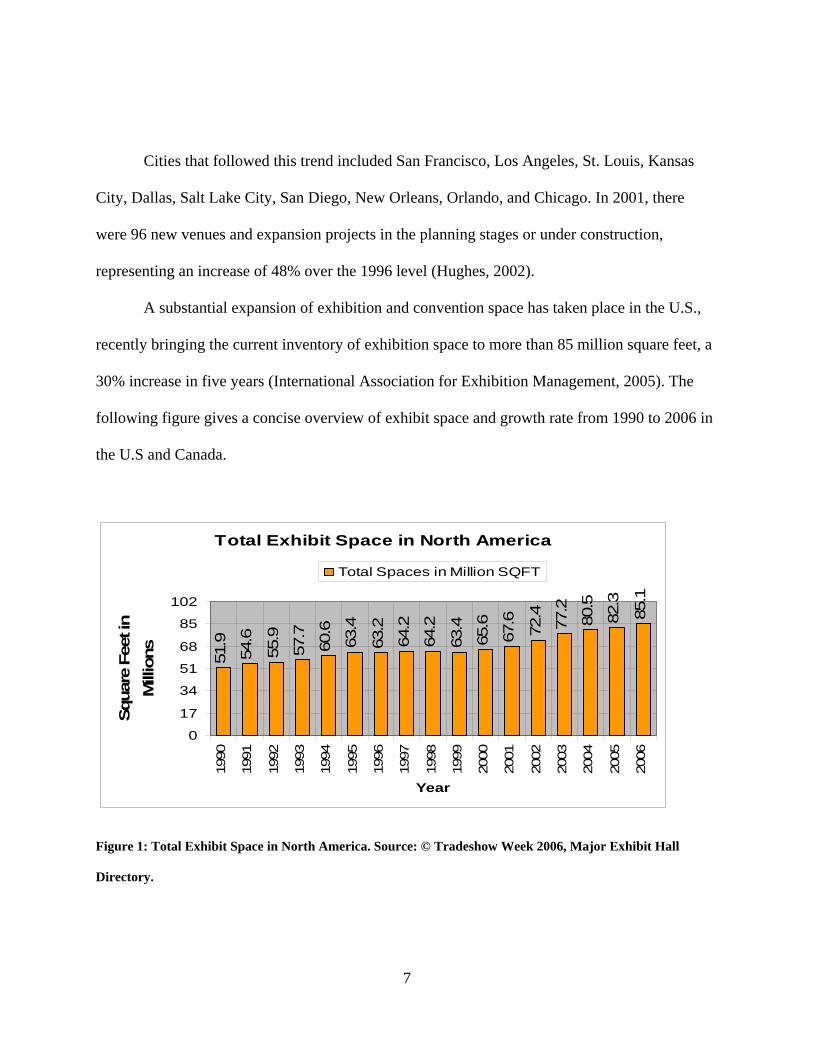
A substantial expansion of exhibition and convention space has taken place in the U.S.,
recently bringing the current inventory of exhibition space to more than 85 million square feet, a
30% increase in five years (International Association for Exhibition Management, 2005). The
following figure gives a concise overview of exhibit space and growth rate from 1990 to 2006 in
the U.S and Canada.
Total Exhibit Space in North America
51.9
54.6
55.9
57.7
60.6
63.4
63.2
64.2
64.2
63.4
65.6
67.6
72.4
77.2
80.5
82.3
85.1
0
17
34
51
68
85
102
1990
1991
1992
1993
1994
1995
1996
1997
1998
1999
2000
2001
2002
2003
2004
2005
2006
Year
Squa
re F
eet i
n M
illio
ns
Total Spaces in Million SQFT
Figure 1: Total Exhibit Space in North America. Source: © Tradeshow Week 2006, Major Exhibit Hall
Directory.
8
The amount of space increase also remained in line with the convention industry growth.
Tradeshows in the combined countries exhibited annual growth of 3.2% for 2005, major exhibit
halls increased exhibit space by 3.4% between August 2005 and July 2006 (Jensen, 2006).
The Convention Industry Council’s 2004 Economic Impact Study also supports these
data by stating that meetings, conventions, exhibitions, and incentive travel generated $122.31
billion in total direct spending in 2004 (Convention Industry Council, 2004). Hughes (2002)
states that the convention and tradeshow industry has grown considerably in part due to the
expansion of the air travel system, as well as the increase in the amount of convention exhibit
space and the number of hotel rooms.
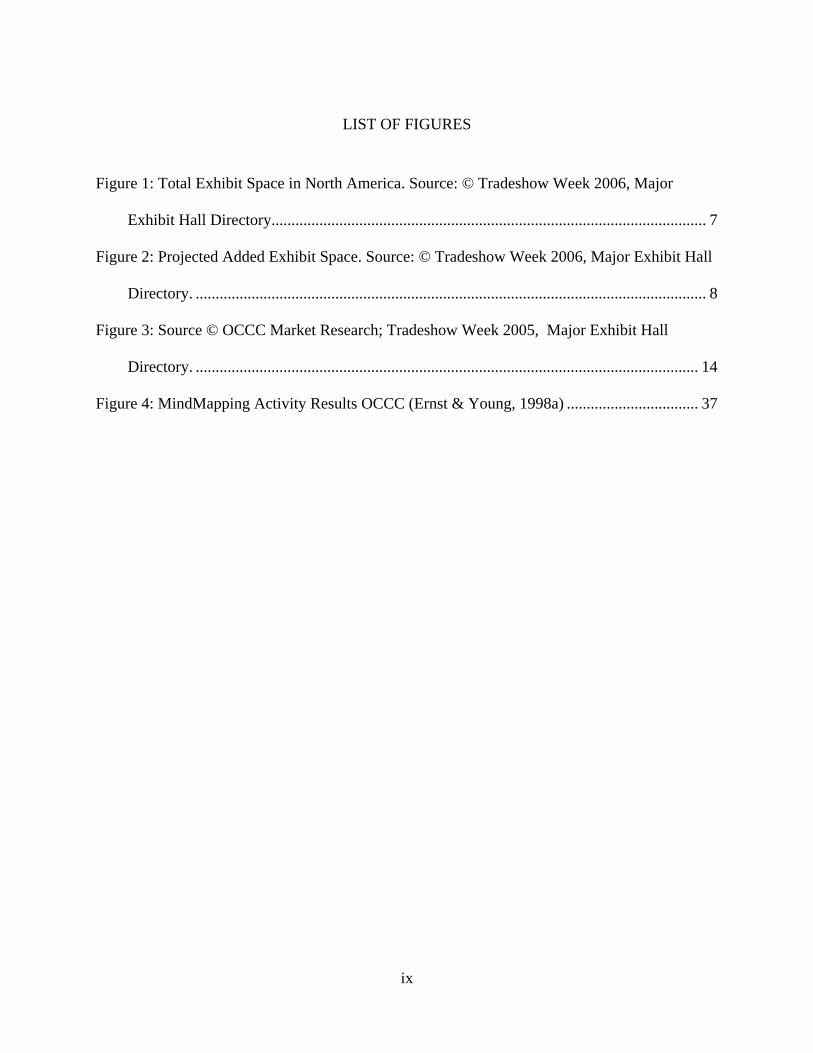
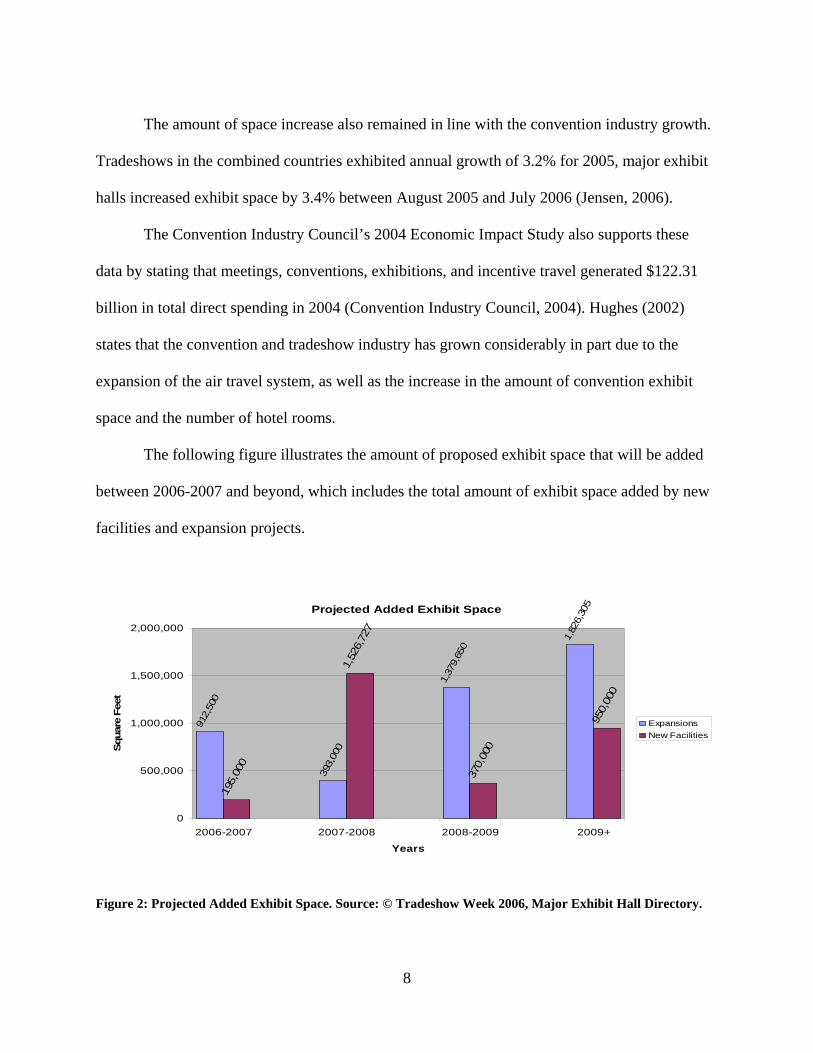
The following figure illustrates the amount of proposed exhibit space that will be added
between 2006-2007 and beyond, which includes the total amount of exhibit space added by new
facilities and expansion projects.
Projected Added Exhibit Space
912,
500
393,
000
1,37
9,65
0
1,82
6,30
5
195,
000
1,52
6,72
7
370,
000
950,
000
0
500,000
1,000,000
1,500,000
2,000,000
2006-2007 2007-2008 2008-2009 2009+
Years
Squa
re F
eet
ExpansionsNew Facilities
Figure 2: Projected Added Exhibit Space. Source: © Tradeshow Week 2006, Major Exhibit Hall Directory.
9
The enormous degree of construction activity also indicates that cities of all sizes are
adding convention center space and hoping to reap the rewards (Fenich, 1992). Also, destinations
that are not major airline hubs or that have little touristic appeal are not likely to draw national
conventions(Nelson, 1999). The trend that many small and medium sized cities are competing
for a share in the business, large cities with their multitude of entertainment, cultural and
commercial attractions remain the primary destinations for conventions (Law, 1993). The focus
on the existence of a convention center should remain based on both the ability to demonstrate a
high rate of return for private and public investors, and to demonstrate a positive economic
impact and added value to the community.
2.1.2. Purpose of Building Convention Centers
Many reasons have been pointed out for building or expansion of convention centers.
Construction of convention centers in the U.S has been primarily part of a catalyst for urban
regeneration resulting in physical and environmental improvements, including hotels, catering
places, shops, and entertainment facilities (Law, 1992). Many recognize that convention centers
attract large numbers of out of town visitors, therefore reaping many fiscal rewards for both the
economy and private investors. These large numbers of out of town visitors also provides access
to new technology, exchange of ideas, establishing and maintaining valuable business and
professional contacts, thus creating a source of continuing education, and other favorable socio-
cultural impacts (Dwyer, Mellor, Mistilis, & Mules, 2000). Besides contributing to the above
mentioned positive impacts, Crouch and Ritchie (1998) highlighted that the meeting and
convention industry worldwide has grown to become a significant economic, political and social
phenomenon. According to Lee & Josiam (2004), the U.S. is currently the leading country with
10
respect to hosting conferences organized by international organizations, followed by France, UK,
Germany, and Italy.
Hughes (2002) mentions several reasons that convention center destinations in the U.S.
are pursuing building or expanding their exhibit space supply. They are:
• Municipalities are building and expanding their convention venues to attract meeting and tradeshow delegates, who generate an economic impact of approximately $1,200 per visit.
• Competitive set expansion trigger new projects throughout a regional area; when one venue expands, competing venues may follow suit.
• After more than ten years of new venue development and expansions, today’s event managers have more venue options with increasingly up-to-date facilities and amenities, thus increasing the level of competition; competition for convention and exposition bookings, especially the largest events, is significant.
• Many new venues and expansions are tied to downtown redevelopment projects and mixed-use facilities.
• Many of the largest venues are expanding to be able to hold multiple events simultaneously- from small local conferences to large “Tradeshow 200” trade exhibitions.
Hughes (2002) further mentions that the U.S remains in a cycle of new venue
development and expansion development fueled by competition among the largest markets and
“me-too” development by smaller and mid-sized cities. This development has led to an
unprecedented amount of space and flexibility for convention centers.
According to Fenich (1992), the list of direct benefits that are part and parcel of
convention center development which supporters regularly point out include: 1) direct spending;
2) increased levels of employment; 3) enhanced urban image; and, 4) redevelopment of less
attractive areas. Perhaps from all of the above mentioned direct benefits, the most critical
information for estimating the success of a convention center is the total amount of spending
generated by group meeting visitors and exhibitors. Direct spending can however, vary according
to the size and location of the center. The following table describes the average spending of
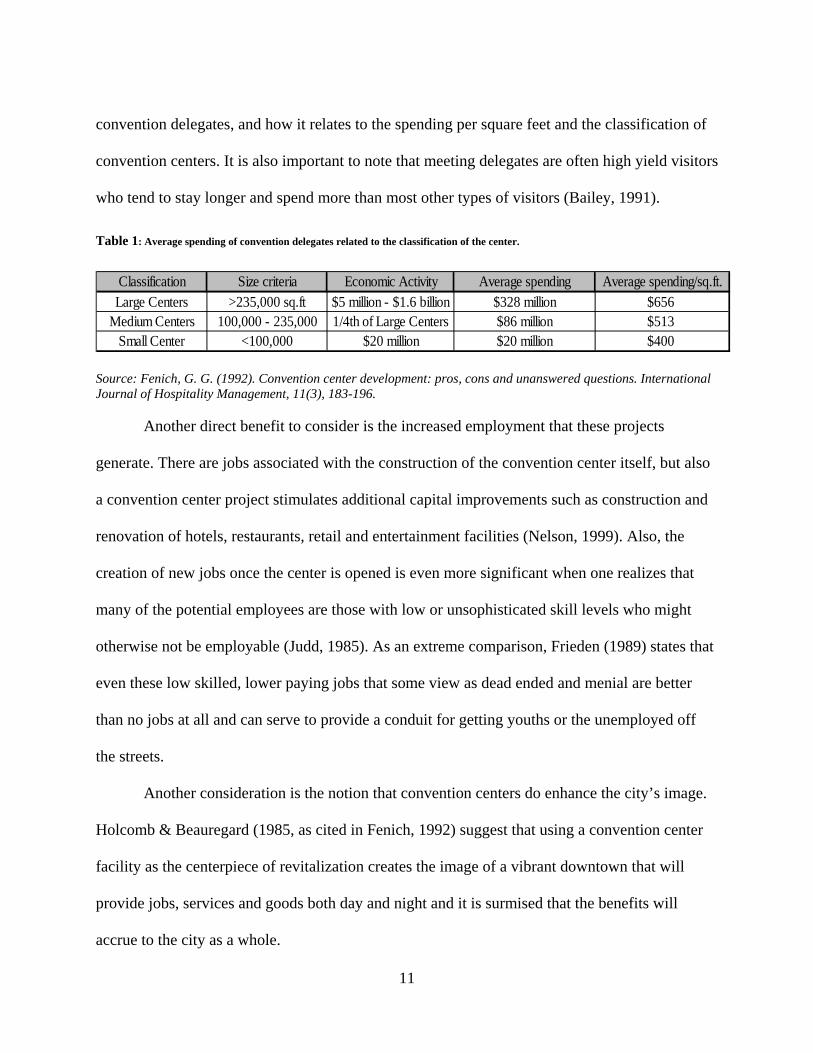
11
convention delegates, and how it relates to the spending per square feet and the classification of
convention centers. It is also important to note that meeting delegates are often high yield visitors
who tend to stay longer and spend more than most other types of visitors (Bailey, 1991).
Table 1: Average spending of convention delegates related to the classification of the center.
Classification Size criteria Economic Activity Average spending Average spending/sq.ft.Large Centers >235,000 sq.ft $5 million - $1.6 billion $328 million $656
Medium Centers 100,000 - 235,000 1/4th of Large Centers $86 million $513Small Center <100,000 $20 million $20 million $400
Source: Fenich, G. G. (1992). Convention center development: pros, cons and unanswered questions. International Journal of Hospitality Management, 11(3), 183-196. Another direct benefit to consider is the increased employment that these projects
generate. There are jobs associated with the construction of the convention center itself, but also
a convention center project stimulates additional capital improvements such as construction and
renovation of hotels, restaurants, retail and entertainment facilities (Nelson, 1999). Also, the
creation of new jobs once the center is opened is even more significant when one realizes that
many of the potential employees are those with low or unsophisticated skill levels who might
otherwise not be employable (Judd, 1985). As an extreme comparison, Frieden (1989) states that
even these low skilled, lower paying jobs that some view as dead ended and menial are better
than no jobs at all and can serve to provide a conduit for getting youths or the unemployed off
the streets.
Another consideration is the notion that convention centers do enhance the city’s image.
Holcomb & Beauregard (1985, as cited in Fenich, 1992) suggest that using a convention center
facility as the centerpiece of revitalization creates the image of a vibrant downtown that will
provide jobs, services and goods both day and night and it is surmised that the benefits will
accrue to the city as a whole.
12
When a location has a convention center, the city gains additional publicity and can
consciously try to remold its image by replacing the perception of the city as a place of
disinvestment, deterioration, crime and poverty. As for the strategy of redevelopment of less
attractive areas, examples range from the Jacob Javits Convention Center in New York City that
was built in an area known as ‘Hell’s Kitchen’, to New Orleans where they utilized an
abandoned dock front as their convention center (Fenich, 1992).
Supporters of the construction of convention centers are leaning more towards the
economic impact that these infrastructures can deliver to a community. The indirect as well as
direct impacts of incremental tourism might generate considerable new income in the region, and
thus stimulate the local economy (Var, Cesario, & Mauser, 1985). According to Feng (2004) the
reasons that the convention industry produces great economic impact can be summarized as: 1)
the number of delegates for one convention is large; 2) the number of nights stayed in a city or
country is longer than pleasure travelers with other purposes; 3) international convention
delegates are large spenders; 4) delegates who attend a convention are likely to take certain
tours; and, 5) conventions bring profits for other related industries like transportation,
accommodation, entertainment, restaurant, advertising and leisure industries. Many proponents
of convention centers highlight the importance of convention centers as a catalyst for economic
development
2.1.3. The Case of the Orange County Convention Center (OCCC)
There are three operating structures for convention centers. They are: 1) publicly owned,
stand alone convention and meeting space; 2) a conference hotel with a convention space or a
hotel with a convention space or a hotel to complement existing convention space; and, 3) a
13
public/private partnership to provide convention facilities. The OCCC’s operating structure falls
under the first category of being publicly owned, which is also the most widely recognized
structure in the U.S. Even though most of the convention centers’ inventory in the U.S. had been
built by the public sector, this was done at a time when the political climate called for a smaller
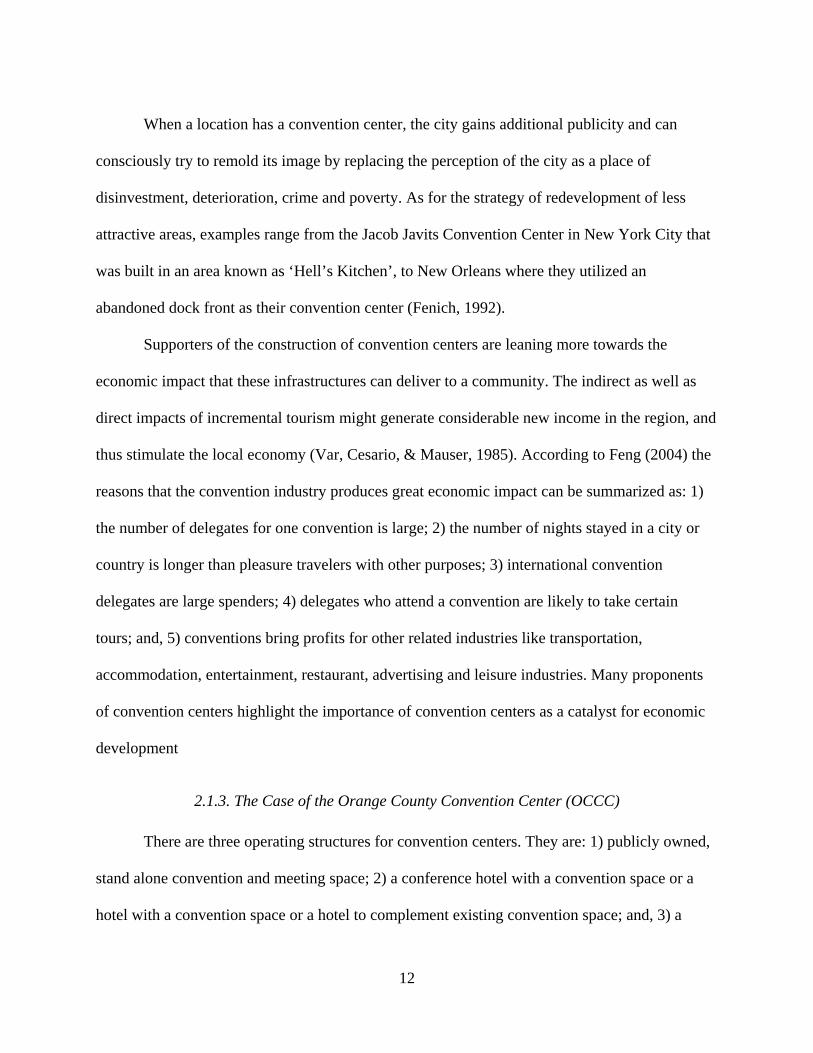
role for government involvement in the process (Nelson, 1999). As shown in Table 4, in the
Tradeshow Week Major Exhibit Hall Directory 2006, about 60% of all U.S. convention centers
with at least 25,000 square feet of prime exhibit space are still owned by a municipality (Jensen,
2006).
Table 2: Types of ownership of U.S. Convention Centers.
Private 38%City 30%County 11%State/Province 9%Combination government 6%Government authority/agency 4%Other 2%
Entity Ownership U.S. 2006
Source: © Tradeshow Week 2006, Major Exhibit Hall Director. In 1983, Orange County opened the doors of the OCCC for the first time offering
150,000 square feet of exhibit space (Ernst & Young, 1998a). In addition to general tourism
growth, Orlando has experienced astronomical growth in the convention industry.
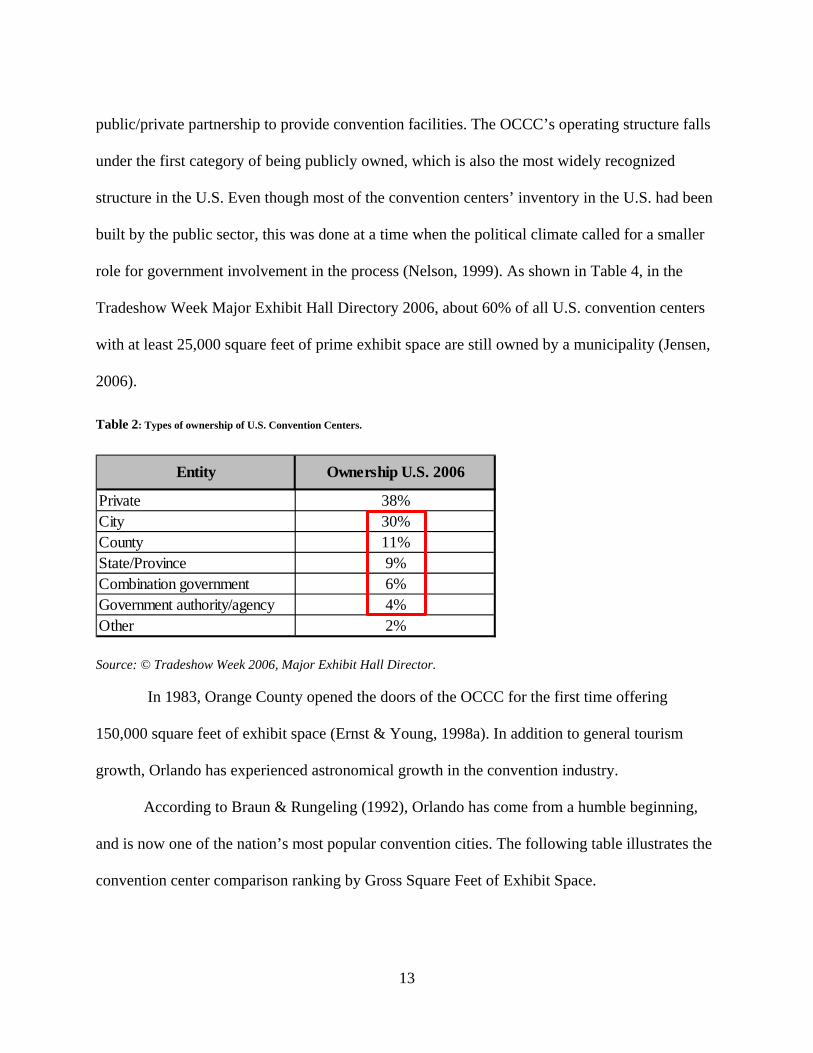
According to Braun & Rungeling (1992), Orlando has come from a humble beginning,
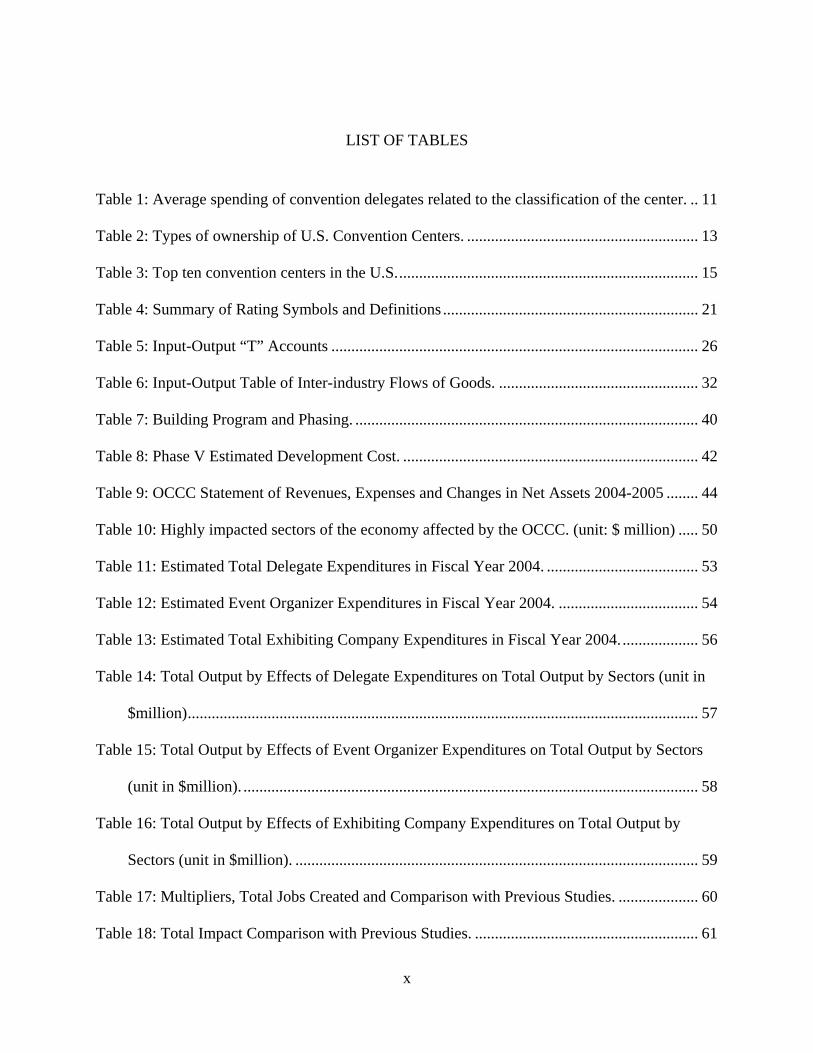
and is now one of the nation’s most popular convention cities. The following table illustrates the
convention center comparison ranking by Gross Square Feet of Exhibit Space.
14
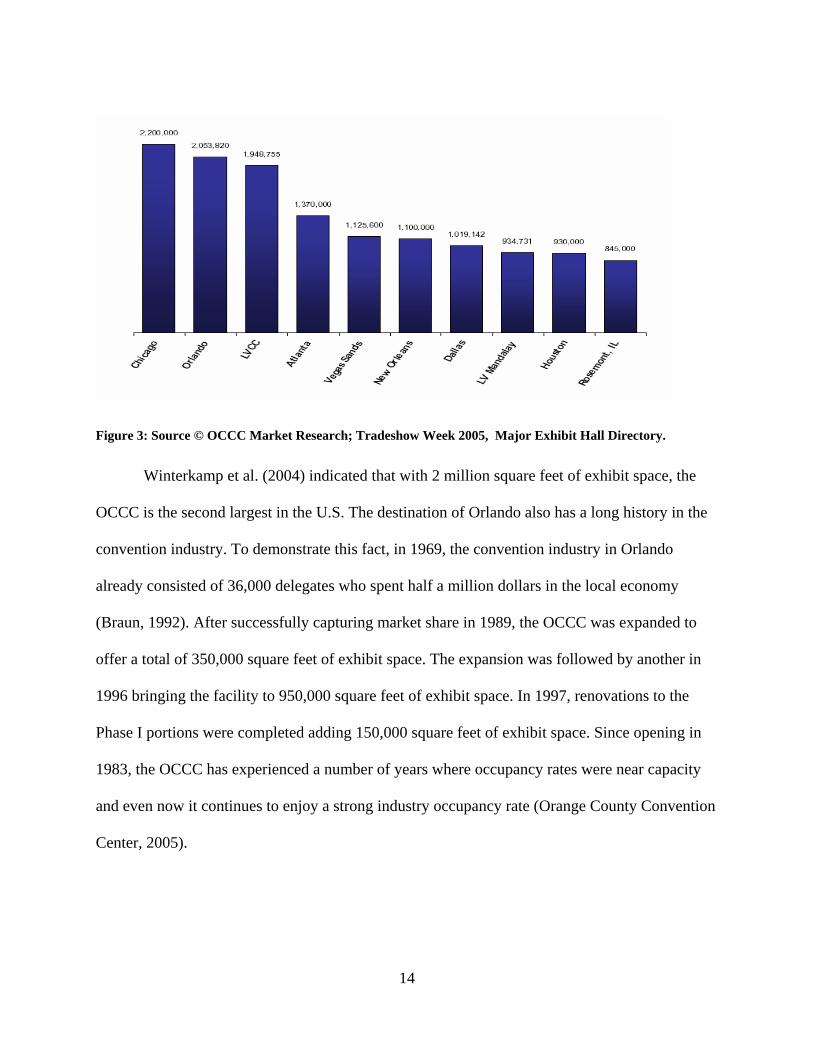
Figure 3: Source © OCCC Market Research; Tradeshow Week 2005, Major Exhibit Hall Directory.
Winterkamp et al. (2004) indicated that with 2 million square feet of exhibit space, the
OCCC is the second largest in the U.S. The destination of Orlando also has a long history in the
convention industry. To demonstrate this fact, in 1969, the convention industry in Orlando
already consisted of 36,000 delegates who spent half a million dollars in the local economy
(Braun, 1992). After successfully capturing market share in 1989, the OCCC was expanded to
offer a total of 350,000 square feet of exhibit space. The expansion was followed by another in
1996 bringing the facility to 950,000 square feet of exhibit space. In 1997, renovations to the
Phase I portions were completed adding 150,000 square feet of exhibit space. Since opening in
1983, the OCCC has experienced a number of years where occupancy rates were near capacity
and even now it continues to enjoy a strong industry occupancy rate (Orange County Convention
Center, 2005).
15
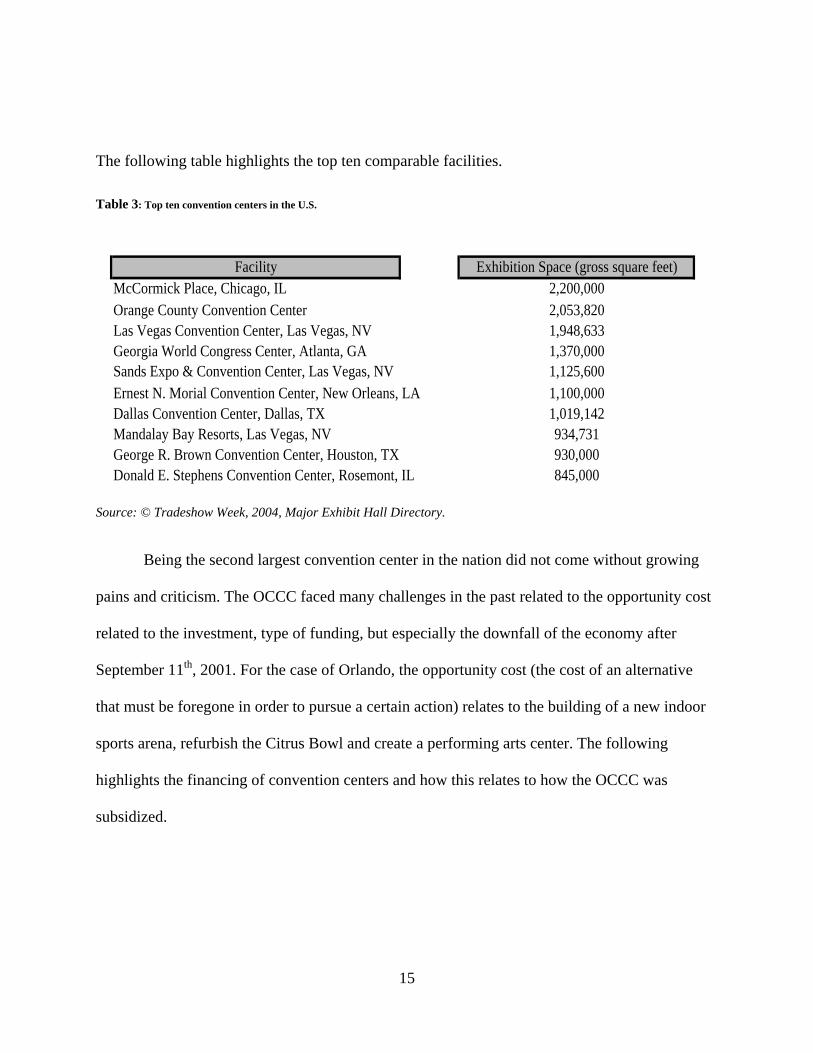
The following table highlights the top ten comparable facilities.
Table 3: Top ten convention centers in the U.S.
FacilityMcCormick Place, Chicago, ILOrange County Convention CenterLas Vegas Convention Center, Las Vegas, NVGeorgia World Congress Center, Atlanta, GASands Expo & Convention Center, Las Vegas, NVErnest N. Morial Convention Center, New Orleans, LADallas Convention Center, Dallas, TXMandalay Bay Resorts, Las Vegas, NVGeorge R. Brown Convention Center, Houston, TXDonald E. Stephens Convention Center, Rosemont, IL
Exhibition Space (gross square feet)2,200,0002,053,8201,948,6331,370,0001,125,6001,100,0001,019,142934,731930,000845,000
Source: © Tradeshow Week, 2004, Major Exhibit Hall Directory. Being the second largest convention center in the nation did not come without growing
pains and criticism. The OCCC faced many challenges in the past related to the opportunity cost
related to the investment, type of funding, but especially the downfall of the economy after
September 11th, 2001. For the case of Orlando, the opportunity cost (the cost of an alternative
that must be foregone in order to pursue a certain action) relates to the building of a new indoor
sports arena, refurbish the Citrus Bowl and create a performing arts center. The following
highlights the financing of convention centers and how this relates to how the OCCC was
subsidized.
16
2.2 Financing of Convention Centers
2.2.1. Feasibility Studies for Convention Centers
Any project that needs to acquire financing by investors or lenders, especially at the
magnitude of convention centers, must undergo a feasibility study prior to launching the project.
Traditional feasibility studies typically consist of eight phases that fall under the following main
categories: 1) site review; 2) market demand qualifications; 3) competitive analysis; 4) facilities
& concept recommendation; 5) estimate of total project cost; 6) forecast of income and expenses;
7) economic value estimate/valuation; and, 8) return on investment analysis (Rushmore, 1986).
For a project to be pronounced economically feasible, the analysis must be brought to the point
of determining a return on investment (Angelo, 1985). In other words, a proposed project is
economically feasible or justifiable when the value of the facility equals or exceeds the total
project cost when completed or operational (Rushmore, 1986). Also, secondary research, which
includes existing data from a particular market, and primary research, which usually consists of a
market survey, must be included in the study (Angelo, 1985).
There are primary challenges when it comes to analyzing feasibility studies conducted for
hospitality and tourism operations, in particular for convention centers. First, research on
feasibility studies lack scientific support and literature. According to Crouch and Ritchie (1998),
only six studies have attempted to measure the economic impact of the domestic meetings and
convention industry. Yoo and Weber (2005) also stated that only eight percent of convention
related research has been conducted for the feasibility and economic study of convention centers.
The second challenge is that the race to develop or extend convention centers in North
America in the 1980’s and 1990’s was driven principally by the optimistic feasibility studies and
17
upward growth forecasts for conventions and expositions (Carlsen, 2004). Many feasibility and
market studies have been conducted to illustrate the need for expansion in infrastructure in order
to remain competitive.
However, these feasibility studies are not routinely re-examined for reliability, and their
data, methodology and substantive conclusions are effectively never subject to comprehensive or
comparative analysis (Sanders, 1999). Sanders has been considered one of the most critical
scholastic researchers reviewing such studies for convention centers across the U.S. His primary
purpose was to provide a frank reality check on the overly optimistic forecasts localities utilize to
justify new public investments in convention facilities (Sanders, 2005). One of his most frequent
comments is that most cities in the quest for convention center success are pursuing an economic
development strategy that has already failed in a handful of other cities and holds little prospect
of succeeding in most.
These feasibility studies had been also labeled as being notorious for their overestimation
of convention attendance and revenue projections which result in unreasonable cash flows
(Winterkamp, 2007). This phenomenon has also created the notion that many convention center
facilities under perform financially, which increase the potential risk of providing a negative
impact on both the revenue sources and the overall economic impact of the facility.
Based on a review of convention center feasibility studies for more than 30 cities in the
U.S., Sanders (2002) concluded that the rhetoric and promise of convention center investments
are built on the foundation of bulky and number-laden feasibility studies, generally developed by
national accounting or economic research firms.
18
These feasibility studies analyze data on demand on the basis of data collection by
Tradeshow Week on conventions and tradeshows.
Sanders (2002) continues stating that:
“The Tradeshow Week data series cover two segments of the exhibition industry. The annual Tradeshow Week 200 (Tradeshow Week, 1989-2000) tracks the attendance and space utilization of the 200 largest shows each year. Unfortunately, the data has a clear upward bias in that they follow the largest and most successful events each year. Tradeshows that lag or fail drop out of the compilation, whereas rapidly growing events are included as they reach appropriate sizes. Location is another issue where these tradeshow are highly concentrated in a handful of cities with large convention centers”. pg.199.
Laslo and Judd (2004) also criticized these feasibility studies stating that consulting
reports establish an asymmetry of information that gives proponents a monopoly over
information, so that opponents appear to be uninformed and biased. Wirtz (2001) also supported
such statements by disclosing that discrepancies are found in these feasibility studies that are
based on wrong assumptions, over-estimates of tourism flows and exaggerated economic
multiplier effects.
Opportunity cost, which is the value of the next best use or opportunity for an economic
good or the value of that sacrificed alternative, is another economic effect overlooked when
analyzing the results of feasibility studies funding. This is especially the case when one relates
the cost of other projects that are foregone in order to build and operate a convention center
(Carlsen, 2004).One particular opportunity cost that occurs to some degree is the loss of property
taxes from a site (Fenich, 1992) This loss happens due to the fact that most centers, are
municipally owned and are therefore tax exempt. However, the public good values of
conventions in terms of increased city pride and image, technology transfer, and trade and
investment that often accompany successful conventions, trade shows, and events are seldom
19
estimated (Carlsen, 2004).
Once this information is calculated and analyzed, proponents of convention centers can
then counter argue these criticisms with support of reliable economic data results. However, this
added value a convention center provides to the community is of essential importance for the
sustainability of that destination.
2.2.2. Funding Strategies for Convention Centers
One of the main issues with a feasibility study is its relationship with the funding
strategy. There are only two sources of funding for convention centers, which are the public or
private types of funding(Carlsen, 2004). According to Hughes (2002), political support had
generally been strong based on a convention center’s capacity to generate regional economic
impact and support downtown revitalization efforts. Private convention venue development is
typically part of a mixed-use commercial or tourism related complex often including a hotel
property, and the primary motivation is to provide support for one or more of the other project
components. For the scope of this paper and how it relates to the OCCC, we will only focus on
the public funding strategy, and how this has been applied to previous convention centers.
Among the common types of debt used by states and municipalities in the U.S. as an
instrument to build or expand convention centers, are: 1) lease financing; 2) debt secured by one
or more special taxes; 3) revenue bonds; and, 4)general obligation bonds (Nelson, 1999).
According to Moody’s (1995, as cited in Nelson, 1999), debts secured by one or more taxes are
the second most common type of financing for public assembly facilities. Governments are well
aware of the substantial income its tourist industry can generate in relationship to the TDT.
20
There is a strong base amongst stakeholders that gives the convention center building
boom a great political momentum. As Nelson (2005) stated, those who are in the best position to
influence the decision of whether or not to use the public funds to subsidize convention center
construction and operations are the same people who have the most to gain from these projects.
The most likely ones to insert a word of caution are the voters whose tax dollars will make up for
the net losses of an unsuccessful project. Kalich (1998), adapts the “rational ignorance model” to
explain why the voting system may produce economically inefficient outcomes. For politicians,
it is also easier to impose taxes on conventioneers who are not members of the community, and
therefore cannot vote the politicians who enact the taxes out of office (Nelson, 1999). This
strategy also has a financial motive behind it, since the debt backed by special taxes have been
developed to keep these investments from coming to a public ballot (Sanders, 1992).
Hotel room taxes, sometimes called transient occupancy or tourist development taxes
(TDT) are the most frequently used special tax to back this type of debt. Hughes (2002)
elaborates on the structure of this type of debt:
“These types of financing mechanisms are secured by specific taxes on revenue streams. It is common for revenue streams to be attached to commercial activities that will be driven partially by the convention facility (e.g., hotel occupancy)”.pg 27
These taxes, which are collected from mainly non-residents, represent exports from
outside the destination which is beneficial from an economic perspective. The Tourist
Development Tax (TDT) collected by the government is then used as a funding source to finance
the construction or expansion of convention centers. However, according to Winterkamp (2007),
pledging large amounts of general tax revenue for multi-year obligations to fund a convention
facility or convention hotel is a very risky proposition and there are many examples of
communities that have not attained projected results and were forced unexpectedly to expand
21
general fund revenues. This is mainly executed to cover the differences in the financial
statements.
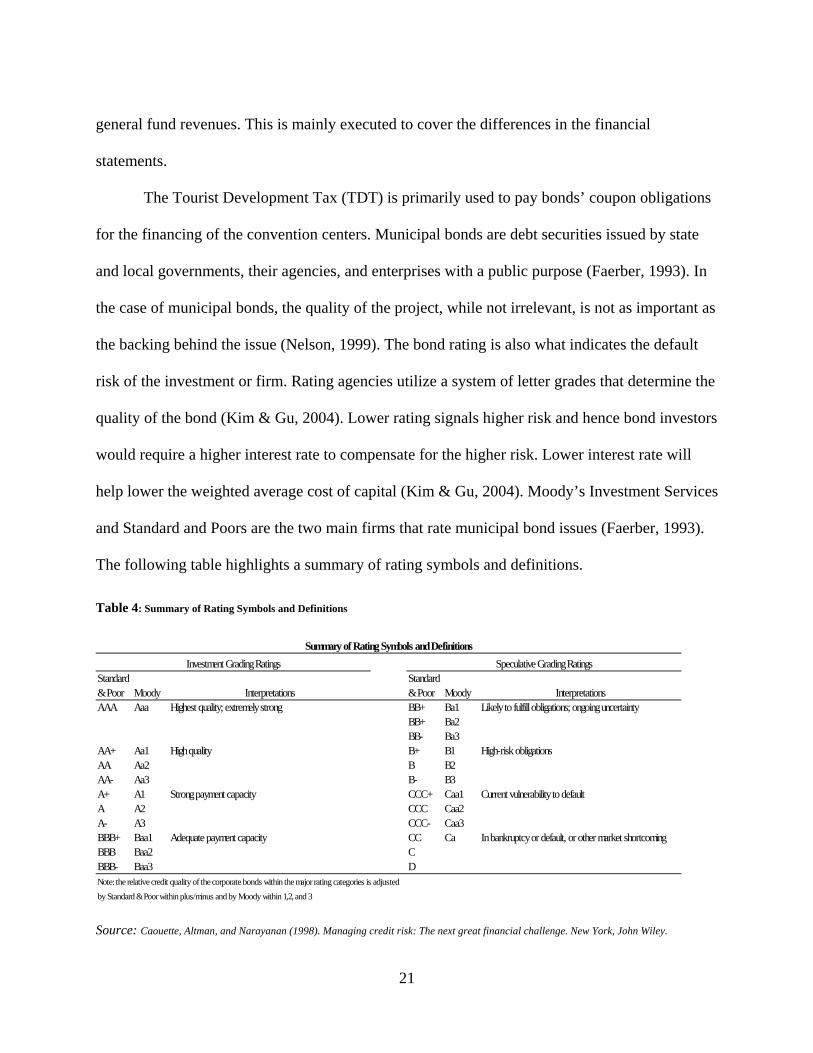
The Tourist Development Tax (TDT) is primarily used to pay bonds’ coupon obligations
for the financing of the convention centers. Municipal bonds are debt securities issued by state
and local governments, their agencies, and enterprises with a public purpose (Faerber, 1993). In
the case of municipal bonds, the quality of the project, while not irrelevant, is not as important as
the backing behind the issue (Nelson, 1999). The bond rating is also what indicates the default
risk of the investment or firm. Rating agencies utilize a system of letter grades that determine the
quality of the bond (Kim & Gu, 2004). Lower rating signals higher risk and hence bond investors
would require a higher interest rate to compensate for the higher risk. Lower interest rate will
help lower the weighted average cost of capital (Kim & Gu, 2004). Moody’s Investment Services
and Standard and Poors are the two main firms that rate municipal bond issues (Faerber, 1993).
The following table highlights a summary of rating symbols and definitions.
Table 4: Summary of Rating Symbols and Definitions
Standard Standard& Poor Moody Interpretations & Poor Moody InterpretationsAAA Aaa Highest quality; extremely strong BB+ Ba1 Likely to fulfill obligations; ongoing uncertainty
BB+ Ba2BB- Ba3
AA+ Aa1 High quality B+ B1 High-risk obligationsAA Aa2 B B2AA- Aa3 B- B3A+ A1 Strong payment capacity CCC+ Caa1 Current vulnerability to defaultA A2 CCC Caa2A- A3 CCC- Caa3BBB+ Baa1 Adequate payment capacity CC Ca In bankruptcy or default, or other market shortcomingBBB Baa2 CBBB- Baa3 DNote: the relative credit quality of the corporate bonds within the major rating categories is adjustedby Standard & Poor within plus/minus and by Moody within 1,2, and 3
Speculative Grading RatingsInvestment Grading RatingsSummary of Rating Symbols and Definitions
Source: Caouette, Altman, and Narayanan (1998). Managing credit risk: The next great financial challenge. New York, John Wiley.
22
Pre-refunded municipal bonds have AAA ratings and usually pay slightly higher
premium coupons (Faerber, 1993). It is assumed that many governments are pursuing the best
possible funding strategy for a convention center, which is without any risks of legal
consequences or criticism from tax payers or even supporters. It would be also beneficial for
governments to develop a framework to assess the “good” or “non-economic” impacts of their
investment in convention centers. Previous literature has shown that these investments have
been supported on a basis of a financial analysis only or on other broader considerations
(Sanders, 2002).
2.3 Economic Impact of Convention Centers
2.3.1. Dilemma for Novice Researchers
Not many academic articles had been written on conducting economic impact analysis for
the convention industry. Based on a content analysis by Yoo and Weber (2005), only eight
percent of convention related academic articles were concentrated on this subject. This scenario
might also put governments under tremendous pressure to provide reliable financial or economic
data in order to obtain support for investments in convention centers. This is related to either
producing a cost benefit analysis (ex ante), or an analysis that will also include an economic
impact analysis (ex post). Determining the role and added value of conventions had been a
tedious task by governments to resolve (Dwyer et al., 2000). According to Crompton (1995)
community officials often commission economic impact analyses in response to increasing
pressures holding them accountable for demonstrating the efficacy of tax dollar allocations. The
government wants to assure the public that government is making a “profit” in return for any
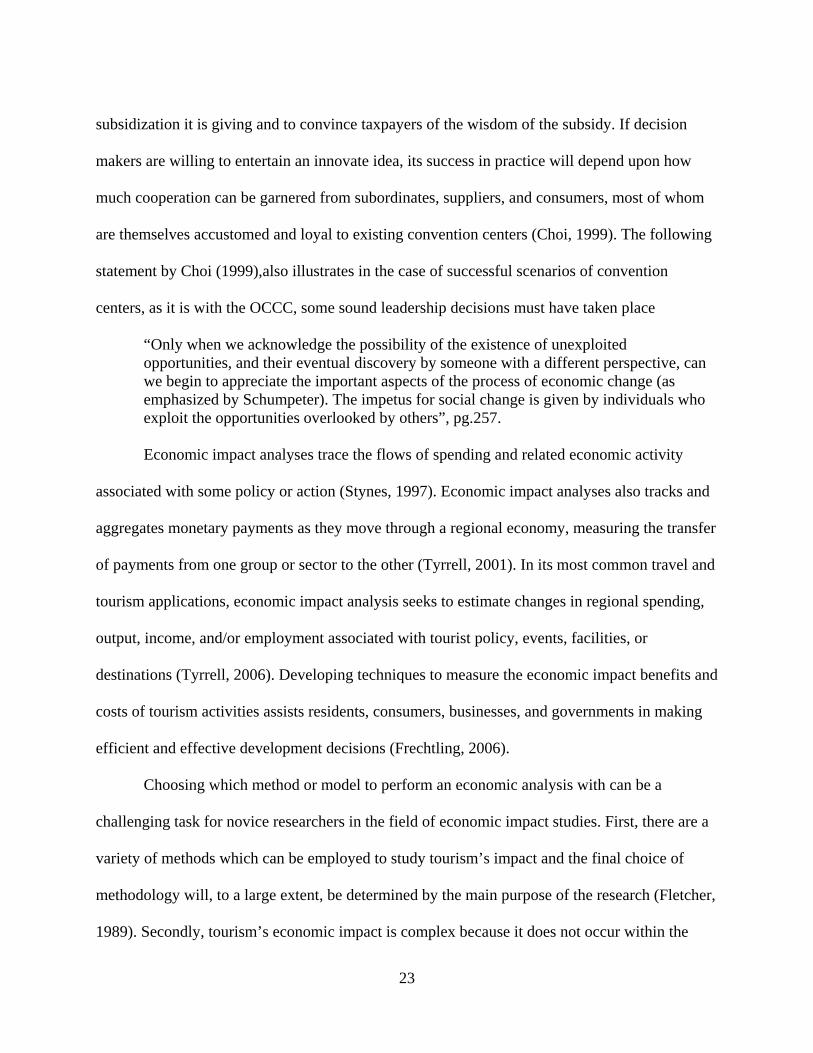
23
subsidization it is giving and to convince taxpayers of the wisdom of the subsidy. If decision
makers are willing to entertain an innovate idea, its success in practice will depend upon how
much cooperation can be garnered from subordinates, suppliers, and consumers, most of whom
are themselves accustomed and loyal to existing convention centers (Choi, 1999). The following
statement by Choi (1999),also illustrates in the case of successful scenarios of convention
centers, as it is with the OCCC, some sound leadership decisions must have taken place
“Only when we acknowledge the possibility of the existence of unexploited opportunities, and their eventual discovery by someone with a different perspective, can we begin to appreciate the important aspects of the process of economic change (as emphasized by Schumpeter). The impetus for social change is given by individuals who exploit the opportunities overlooked by others”, pg.257.
Economic impact analyses trace the flows of spending and related economic activity
associated with some policy or action (Stynes, 1997). Economic impact analyses also tracks and
aggregates monetary payments as they move through a regional economy, measuring the transfer
of payments from one group or sector to the other (Tyrrell, 2001). In its most common travel and
tourism applications, economic impact analysis seeks to estimate changes in regional spending,
output, income, and/or employment associated with tourist policy, events, facilities, or
destinations (Tyrrell, 2006). Developing techniques to measure the economic impact benefits and
costs of tourism activities assists residents, consumers, businesses, and governments in making
efficient and effective development decisions (Frechtling, 2006).
Choosing which method or model to perform an economic analysis with can be a
challenging task for novice researchers in the field of economic impact studies. First, there are a
variety of methods which can be employed to study tourism’s impact and the final choice of
methodology will, to a large extent, be determined by the main purpose of the research (Fletcher,
1989). Secondly, tourism’s economic impact is complex because it does not occur within the
24
framework of a single commonly acknowledged industrial sector (Fletcher, 1989). This has also
been illustrated in a special issue by the Journal of Travel Research (2006) devoted entirely to
the economic impact of tourism. According to Tyrrell (2006), the resulting explosion of
economic impact analyses has provided increasingly sought-after information to travel and
tourism planners but has also caused some to question the appropriateness and validity of many
travel and tourism applications and to point out many critical issues on which appropriate impact
analyses depends. Tyrell (2006) continued stating that many of the differences of opinion do not
concern the fundamental, technical details of economic impact and input-output analysis, but
rather on the extensions of the basic model, the use and misuse of interpretation of economic
impact results and, the empirical details of appropriate analysis. It is therefore essential and
critical for novice researchers not to deviate from their required level of integrity and
transparency. Economic researchers in particular, are under tremendous pressure to provide
accountability for public expenditures, while policy makers are sometimes less interested in
methodological details, and, more interested in the final numbers that support a particular
outlook (Tyrrell, 2006).
2.3.2. Input-Output Analysis
For the current study, the Input-Output analysis (I/O) was chosen to assess the direct and
indirect impacts of the Orange County Convention Center. Input-Output Analysis (I/O) has its
roots in classical economics, which has writings of William Petty, Richard Cantillon, François
Quesnay and the physiocrats, along with English classical economists from Adam Smith to
David Ricardo. Input-Output analysis is the name given to an analytical framework developed by
25
Professor Wassily Leontief in the late 1930s, work for which he received the Nobel Prize in
Economic Science in 1973 (Miller & Blair, 1985).
Leontief (1987, p.860, as cited in (Kurz & Salvadori, 2000), describes input-output
analysis as a “practical extension of the classical theory of general interdependence which views
the whole economy of a region, a country and even the entire world as a single system and sets
out to describe and interpret its operation in terms of directly observable basic structural
relationships” The technique of input-output (I/O) analysis has a number of advantages when
compared with the alternative methodologies. Fletcher (1989) mentions several reasons why one
should choose the input output analysis:
• “It is a general equilibrium approach which provides the policy makers with a comprehensive view of the economy
• It focuses attention upon the sectoral interdependencies which exist in the economy
• The flexibility of the I/O structure enables the researcher to construct a model to suit the purpose in hand.
• The very nature of I-O analysis makes the technique “policy neutral”. Each sector is treated in a uniform manner and the only value judgments that are encountered at the framework stage concerns the aggregation specifications
• I-O analysis enables the researcher to study the impact of tourism at its three levels: direct, indirect and induced effects”, pg. 516.
The necessary data are the flows of products from each of the sectors (as a producer) to
each of the sectors (as a purchaser); these inter-industry flows are measured for a particular time
period (usually a year) and in monetary terms (Miller & Blair, 1985).
Also, an input-output analysis (I/O) is a basic accounting framework that depicts how the
total output of each industry depends on its inter-industry demands and final demands, by
showing all inter-industry transactions in a matrix format (Hara, 2004).
26
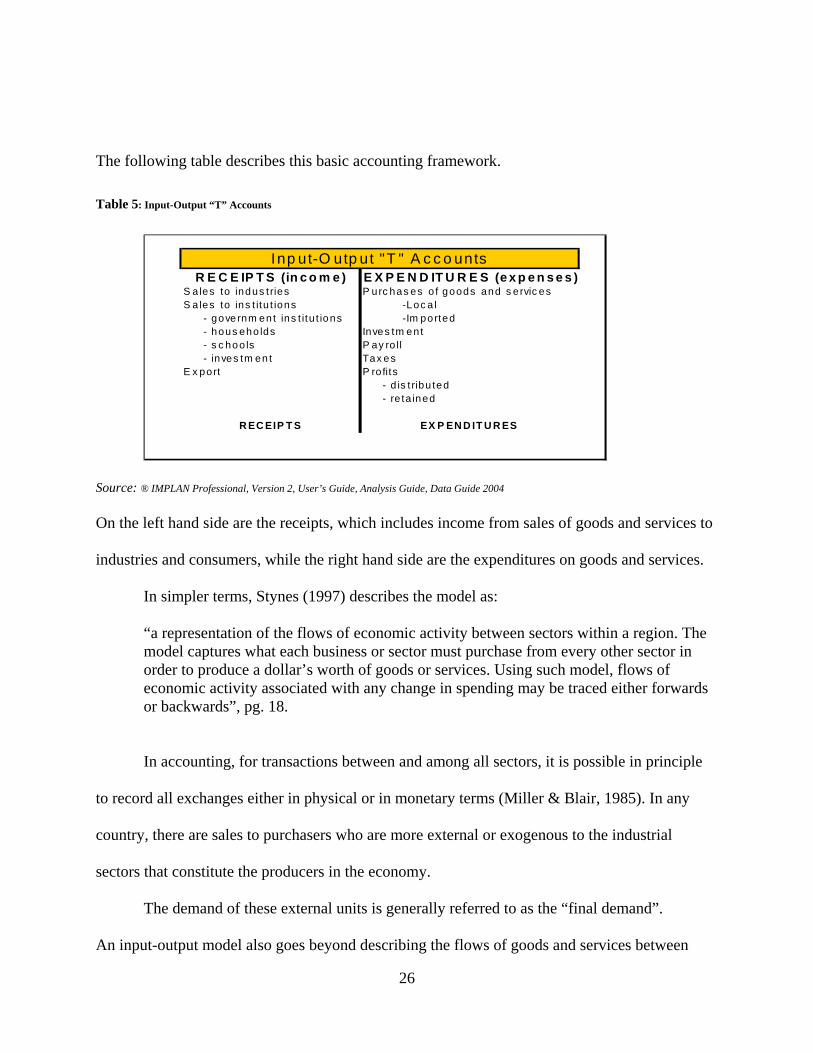
The following table describes this basic accounting framework.
Table 5: Input-Output “T” Accounts
R E C E IP T S (in c o m e ) E X P E N D IT U R E S (e x p e n s e s )S a les to indus t ries P urc has es o f goods and s ervic esS a les to ins t itu t ions -Loc a l - gove rnm en t ins t itu t ions -Im ported - hous eho lds Inves tm ent - s c hoo ls P ay ro ll - inves tm en t Tax esE x port P ro fits
- d is t ribu ted - re ta ined
R EC EIP T S EX P EN D IT U R ES
Inp ut-O utp ut "T " A c c o unts
Source: ® IMPLAN Professional, Version 2, User’s Guide, Analysis Guide, Data Guide 2004
On the left hand side are the receipts, which includes income from sales of goods and services to
industries and consumers, while the right hand side are the expenditures on goods and services.
In simpler terms, Stynes (1997) describes the model as:
“a representation of the flows of economic activity between sectors within a region. The model captures what each business or sector must purchase from every other sector in order to produce a dollar’s worth of goods or services. Using such model, flows of economic activity associated with any change in spending may be traced either forwards or backwards”, pg. 18.
In accounting, for transactions between and among all sectors, it is possible in principle
to record all exchanges either in physical or in monetary terms (Miller & Blair, 1985). In any
country, there are sales to purchasers who are more external or exogenous to the industrial
sectors that constitute the producers in the economy.
The demand of these external units is generally referred to as the “final demand”.
An input-output model also goes beyond describing the flows of goods and services between
27
sectors to this final demand (Coughlin & Mandelbaum, 1991). The I/O analysis will allow
researchers to determine the values of gross output of each industry necessary to meet these final
demands, which is the calculation of regional multipliers.
2.3.3. Multipliers and their Interpretations
Eadington and Redman (1991) highlight that the process of describing and estimating the
extent of secondary income flows (indirect economic impacts) is commonly called “multipliers”.
Each sector has its own unique multiplier since each sector has a different pattern of purchases
from firms in and outside the region. The multiplier measures the impact of extra expenditures
introduced into an economy. It captures the size of the secondary benefits in a given region,
generally as a ratio of the total change in economic activity in the region relative to the direct
change (Stynes, 1997). Multipliers also express the degree of interdependency between sectors in
a region’s economy and therefore vary considerably across the regions and sectors.
In the case of tourism, this extra expenditure in an area can take many forms, which are:
1) spending on goods and services by tourists visiting the area; 2) investment by external
sources; 3) government spending e.g. domestic government spending on infrastructure in a
region or foreign government aid; and, 4) export of goods stimulated by tourism (Horwath
Tourism & Leisure Consulting, 1981). Three of the most frequently used types of multipliers are
those that estimate the effects of exogenous changes on: a) outputs of the sectors in the economy,
named “Output Multipliers”; b) income earned by households because of the new outputs, named
“Income Multipliers”, and c) employment that is expected to be generated because of the new
outputs, named “Employment Multipliers” (Miller & Blair, 1985).
28
Output multipliers take into account inventory changes, such as the increase in stock
levels by hotels, restaurants and shops, because of increased trading activity. (Horwath Tourism
& Leisure Consulting, 1981). Archer (1982) also explains that output multipliers relates a unit of
tourist spending to the resultant increase in the level of output in the economy. On the other
hand, income multipliers measures the income generated by an extra unit of tourist expenditure.
It shows the relationship between an additional unit of tourist spending and the changes which
result in the level of income in the economy (Archer, 1982). Finally, employment multipliers
describe either the ratio of the direct and secondary employment generated by additional tourism
expenditure to the direct employment alone, or the amount of employment generated which was
created by a given amount of tourist spending (Archer, 1982).
Although this paper is mainly concerned with proposing an alternative framework of
feasibility studies, results of the calculated multipliers through the input-output analysis, must be
carefully observed and analyzed. The results will give a clear picture of what contribution the
OCCC has towards the community of Orange County, Florida.
29
CHAPTER 3: METHODOLOGY
In Section 3.1, a brief description of the four phases used for the methodology will be
presented. Section 3.2 provides a more detailed explanation of the input-output framework,
describing the inter-industry relationship and their multipliers.
3.1. Description of the Four Phases
In order to propose an alternative framework for feasibility studies, several sources of
information needs to be evaluated and analyzed. To do so, this study consists of four phases of
data analysis. In the first phase, the feasibility studies performed for the OCCC will be analyzed.
These studies will then be compared to the eight phases suggested by Rushmore (1986).This
section will also provide a brief description of the prognosis provided by those feasibility studies.
The second phase will consist of analyzing the OCCC’s financial statements from 2004-
2005. The reason for including this phase is to analyze if previous criticism of feasibility studies
for convention centers also relate to this case study.
The third phase will include a detailed description of the local “Tourist Development
Tax”, and its relationship to the financial status of the OCCC. Orange County has a track record
of call options for their bond issuances, which is mainly supported by the Tourist Development
Tax. These two components will be explained and then related to the financial statements of the
OCCC.
Finally, phase four will include the economic impact analysis of the OCCC, using the
Input-Output model to portray how the total output of each industry depends on inter-industry
30
supply and final demands. Most scholars agree that the input-output analysis is the most
comprehensive method available for studying the economic impact of tourism activities.
3.2. Review of the Input-Output Analysis.
It is necessary to illustrate that the I-O analysis consists of five tables, which are: 1) the
“I-O transaction table”; 2) the “A-matrix”; 3) the “I-Matrix”; 4) the “I-A matrix”; and, 5) the
“[I-A]^-1” matrix.
The I/O transaction table is based on data collected directly from industries. This table
illustrates the dollar value of goods and services purchased by each industry to use in their
production process. A column is a single industry, and the rows are the commodities and the
units of dollars (hence, the name input-output table) The sales of a specific industry are made to
other producers within the region, which are called “inter-industry” sales, and to external units
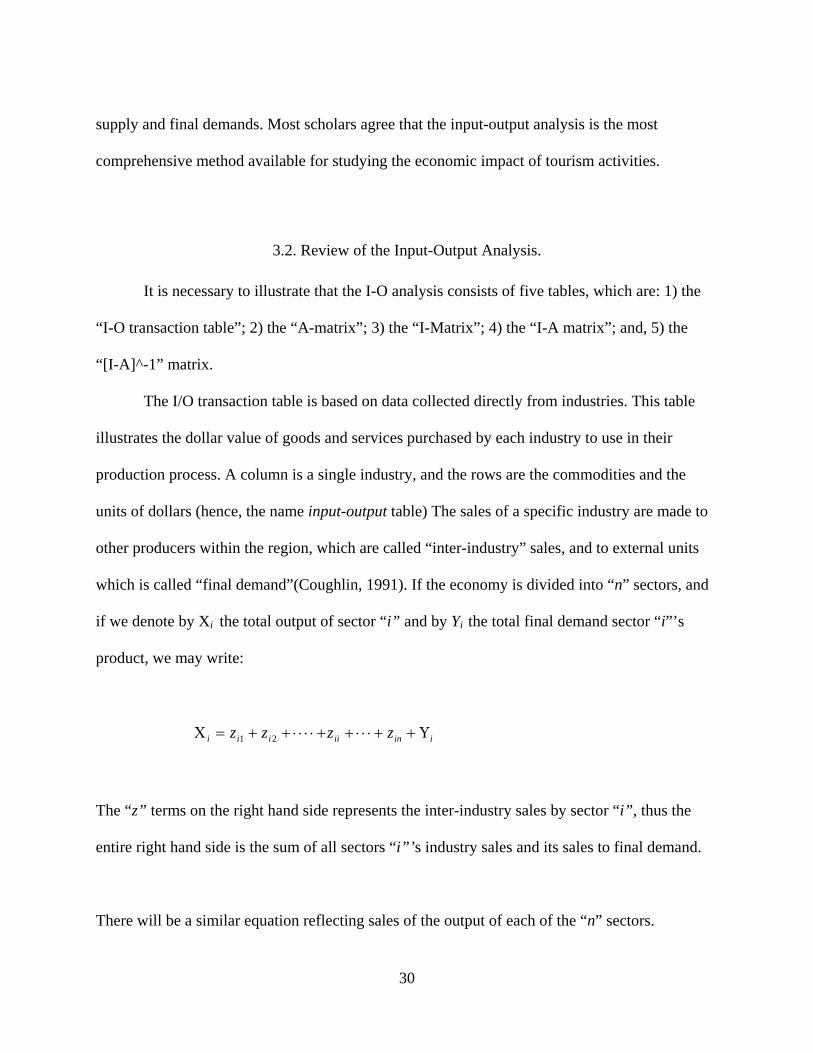
which is called “final demand”(Coughlin, 1991). If the economy is divided into “n” sectors, and
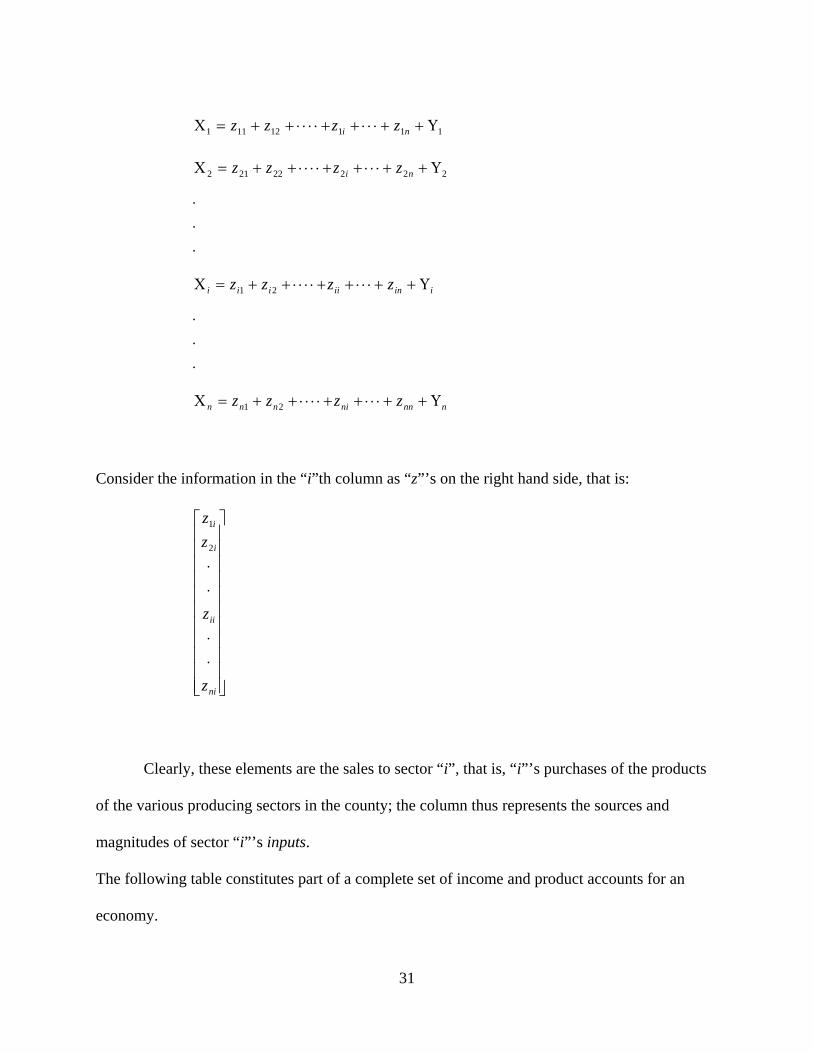
if we denote by Xi the total output of sector “i” and by Yi the total final demand sector “i”’s
product, we may write:
iiniiiii zzzz Υ++⋅⋅⋅++⋅⋅⋅⋅++=Χ 21
The “z” terms on the right hand side represents the inter-industry sales by sector “i”, thus the
entire right hand side is the sum of all sectors “i”’s industry sales and its sales to final demand.
There will be a similar equation reflecting sales of the output of each of the “n” sectors.
31
11112111 Υ++⋅⋅⋅++⋅⋅⋅⋅++=Χ ni zzzz
22222212 Υ++⋅⋅⋅++⋅⋅⋅⋅++=Χ ni zzzz
⋅⋅⋅
iiniiiii zzzz Υ++⋅⋅⋅++⋅⋅⋅⋅++=Χ 21
⋅⋅⋅
nnnninnn zzzz Υ++⋅⋅⋅++⋅⋅⋅⋅++=Χ 21
Consider the information in the “i”th column as “z”’s on the right hand side, that is:
⎥⎥⎥⎥⎥⎥⎥⎥⎥⎥⎥
⎦
⎤
⎢⎢⎢⎢⎢⎢⎢⎢⎢⎢⎢
⎣
⎡
⋅⋅
⋅⋅
ni
ii
i
i
z
z
zz
2
1
Clearly, these elements are the sales to sector “i”, that is, “i”’s purchases of the products
of the various producing sectors in the county; the column thus represents the sources and
magnitudes of sector “i”’s inputs.
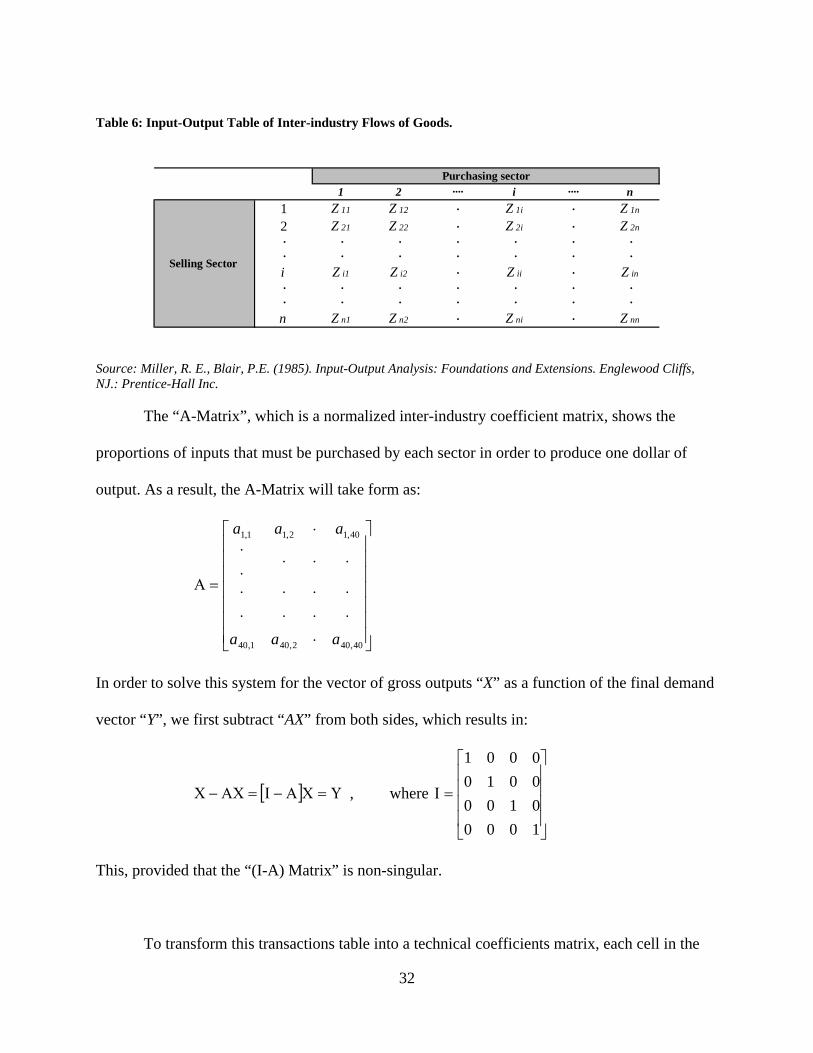
The following table constitutes part of a complete set of income and product accounts for an
economy.
32
Table 6: Input-Output Table of Inter-industry Flows of Goods.
1 2 ···· i ···· n1 Z 11 Z 12 · Z 1i · Z 1n
2 Z 21 Z 22 · Z 2i · Z 2n
· · · · · · ·· · · · · · ·i Z i1 Z i2 · Z ii · Z in
· · · · · · ·· · · · · · ·n Z n1 Z n2 · Z ni · Z nn
Purchasing sector
Selling Sector
Source: Miller, R. E., Blair, P.E. (1985). Input-Output Analysis: Foundations and Extensions. Englewood Cliffs, NJ.: Prentice-Hall Inc. The “A-Matrix”, which is a normalized inter-industry coefficient matrix, shows the
proportions of inputs that must be purchased by each sector in order to produce one dollar of
output. As a result, the A-Matrix will take form as:
⎥⎥⎥⎥⎥⎥⎥
⎦
⎤
⎢⎢⎢⎢⎢⎢⎢
⎣
⎡
⋅⋅⋅⋅⋅⋅⋅⋅⋅
⋅⋅⋅⋅⋅
⋅
=Α
40,402,401,40
40,12,11,1
aaa
aaa
In order to solve this system for the vector of gross outputs “X” as a function of the final demand
vector “Y”, we first subtract “AX” from both sides, which results in:
[ ] Υ=ΧΑ−Ι=ΑΧ−Χ , where
⎥⎥⎥⎥
⎦
⎤
⎢⎢⎢⎢
⎣
⎡
=Ι
1000010000100001
This, provided that the “(I-A) Matrix” is non-singular.
To transform this transactions table into a technical coefficients matrix, each cell in the
33
productive sector quadrant and primary input quadrant must be divided by the total input value
for each corresponding column. Once constructed, the technical coefficients matrix shows the
proportion of inputs that must be purchased by each sector in order to produce one unit of output
(Fletcher, 1989). Then it is possible to calculate the quantity and distribution of intermediate and
primary inputs demanded directly, named “direct effects or the initial impact”. Because of
intersectoral purchases, an increase in the final demand for one sector’s output will cause the
demand for other sector’s output to increase, named “indirect effects”. These two effects can be
summed up and called the “Type I multiplier”.
As Fletcher (1989) stated, the lengthy and tedious task of tracing the secondary effects by
reference to the technical coefficients matrix can be replaced by a much simpler method of
applying a technique known as the “Leontief Inverse”. The Leontief Inverse, is a table which
shows the direct plus the indirect effect of a change in any category of final demand.
Let,
I = the “Identity Matrix” (I-Matrix) A = an “n X n” matrix of technical coefficients X = an “n X 1” matrix of gross output Y = an “n X 1” matrix of final demand.
Then, ( ) Υ=ΧΑ−Ι , which can be written as, ( ) ∆ΥΑ−Ι=∆Χ −1 , where ( ) 1−Α−Ι is the inverted
technology matrix.
One key factor to mention is that the I-O modeling is based on several assumptions.
These are; 1) constants return to scale; 2) no supply constraints; 3) fixed commodity input
structure; 4) homogenous sector output; and, 5) industry technology assumption (Minnesota
IMPLAN Group, 2004).
34
The “constants return to scale” means that the production functions are considered linear;
if additional output is required, all inputs increase proportionally. “No supply constraints” means
supplies are unlimited. An industry has unlimited access to raw materials and its output is limited
only by the demand for its products. A “fixed commodity input structure” implies that price
changes do not cause a firm to buy substitute goods. This structure assumes that changes in the
economy will affect the industry’s output but not the mix of commodities and services it requires
to make its products. The fourth assumption, which is the “homogenous sector output” means
that proportions of all the commodities produced by that industry remain the same, regardless of
total output. An industry will not increase the output of one product without proportionately
increasing the output of all its other products. Finally, the “industry technology assumption”
comes into play when data is collected on an industry-by-commodity basis and then converted to
industry-by-industry matrices. It assumes that an industry uses the same technology to produce
all its products, meaning that an industry has a primary or main product and all other products
are byproducts of the primary product.
For this study, the data for the I-O table were extracted from IMPLAN and further
manipulated in Microsoft Excel to form a 44 x 44 square matrix. By selecting these 44 groups, a
better experiment was formulated by identifying the individual sectors that are related to
Orlando’s tourism industry.
35
CHAPTER 4: RESULTS AND FINDINGS
4.1. Phase I: Feasibility Studies of the OCCC
For this case study, the focus will be directed towards the feasibility studies for the
expansion of the OCCC, that were undertaken in 1998 (Phase V), and not the initial construction
in 1983. Two feasibility studies for the additional building and extension of the center were
obtained. One study was published in January 1998, which was titled “Long-Range Strategic
Plan for the Orange County Convention Center”, and the second one from June 1998, which was
titled “Long-Range Strategic Plan for the Orange County Convention Center, Volume II-
Physical and Economic Plan”.
Market, physical and economic issues were addressed in the two reports. From a market
perspective, the economic environment of the future was envisioned, where the industry,
competition, local infrastructure, the OCCC’s utilization, and users were entered into the
equation. From a physical perspective, the overall convention district was envisioned, addressing
not only the convention center itself, but its relationships to transportation, hotels and
entertainment. From an economic perspective, costs were weighed against the benefits to
understand the value of the undertaking. However, Orange County had decided to release both
studies separately, where the first one addressed the market analysis and the second one the
physical and economic considerations. These reports were not intended for any purpose other
than to assist with the internal planning for the operations and expansions of the OCCC. The
procedures performed by Ernst & Young (1998) were limited in nature and extent and such
36
procedures did not constitute an audit, examination, compilation or review in accordance with
standards established by the American Institute of Certified Public Accountants.
4.1.1. The January 1998 report
The January, 1998 study used a MindMapping process to draw conclusions about the
market and physical environment that the OCCC will be operating in over the next 30 years.
MindMapping was believed by Ernst & Young to be an effective method of relating the
understanding of the current state and the perspectives of the future to draw conclusions about
the environment the OCCC will be operating under.
Buzan (1976, as cited by (Brinkmann, 2003), describes mind mapping as a special
technique for taking notes as briefly as possible while being interesting to the eye as possible.
The author further explains that the method of mind mapping takes into account that the two
halves of the human brain are performing different tasks. While the left side is mainly
responsible for logic, words, arithmetic, linearity, sequences, analysis, lists, the right side of the
brain mainly performs tasks like multidimensionality, imagination, emotion, color, rhythm,
shapes, geometry and synthesis. Mind mapping uses both sides of the brain, letting them work
together and thus increases productivity and memory retention. This is accomplished by
representing logical structures using an artistic spatial image that the individual creates. Thus
mind mapping connects imagination with structure and pictures with logic.
The following figure describes the outcome of the MindMapping process, where
participants were asked to vote on the issues considered most important.
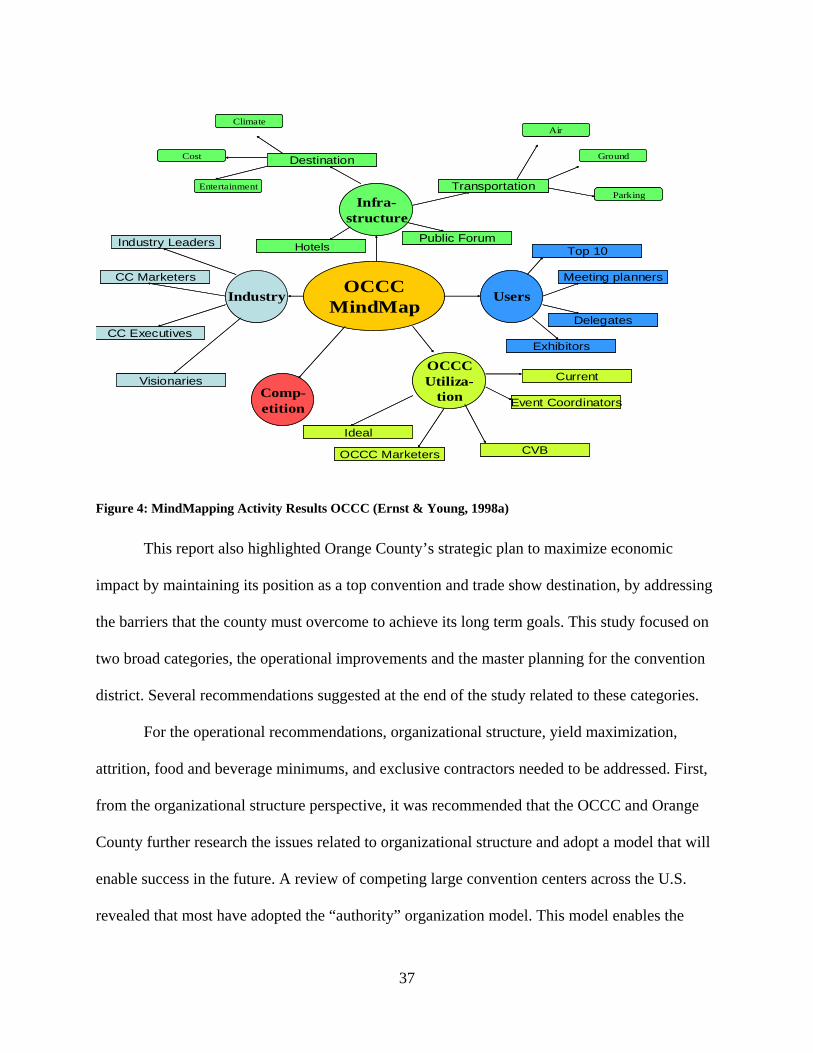
37
Figure 4: MindMapping Activity Results OCCC (Ernst & Young, 1998a)
This report also highlighted Orange County’s strategic plan to maximize economic
impact by maintaining its position as a top convention and trade show destination, by addressing
the barriers that the county must overcome to achieve its long term goals. This study focused on
two broad categories, the operational improvements and the master planning for the convention
district. Several recommendations suggested at the end of the study related to these categories.
For the operational recommendations, organizational structure, yield maximization,
attrition, food and beverage minimums, and exclusive contractors needed to be addressed. First,
from the organizational structure perspective, it was recommended that the OCCC and Orange
County further research the issues related to organizational structure and adopt a model that will
enable success in the future. A review of competing large convention centers across the U.S.
revealed that most have adopted the “authority” organization model. This model enables the
OCCCMindMap
Comp-etition
OCCCUtiliza-
tion
Users
Infra-structure
Industry
Visionaries
Destination
Exhibitors
Delegates
Meeting planners
Top 10Hotels
Transportation
Public Forum
OCCC Marketers
Ideal
Event Coordinators
Current
CC Executives
CC Marketers
Industry Leaders
CVB
Entertainment
Cost
ClimateAir
Ground
Parking
38
centers to operate as private sector businesses with governmental control through a board of
directors.
The second recommendation was to increase yield maximization by increasing the event
days (days where delegates are in town, staying in hotels, spending in restaurants and shops,
renting cars, and attending theme parks). If this was accomplished, OCCC could effectively
create another one million square foot facility without major investment in additional real estate.
It was also recommended that the OCCC forego conventional industry norms and strive for
creative solutions to maximize their current event days.
Making meeting planners responsible for room blocks that are not filled up, and food and
beverage sales minimums in hotels was a very negative growing practice nationwide in 1998.
For the OCCC, its clients had also indicated that hotel attrition clauses and food and beverage
minimums were a problem. To diminish this negative effect, both the OCCC and the Convention
and Visitor’s Bureau recommended involving a team or task force, which includes
representatives from the area’s major convention hotels, to help each client through their
negotiation process. Attrition, which is the difference between the actual number of sleeping
rooms filled up (or food-and-beverage covers or revenue projections) and the number agreed to
in the terms of the facility’s contract, still remains one of the main issues between organizers and
sales representatives of the convention industry.
The fourth recommendation was that a revision of the exclusive service policies of the
OCCC needed to be improved. The OCCC should consider offering themselves as a preferred
provider of services, allowing groups to bring in their own teams when appropriate. Client
satisfaction policies were also mentioned to be a very essential consideration for some of the
convention groups.
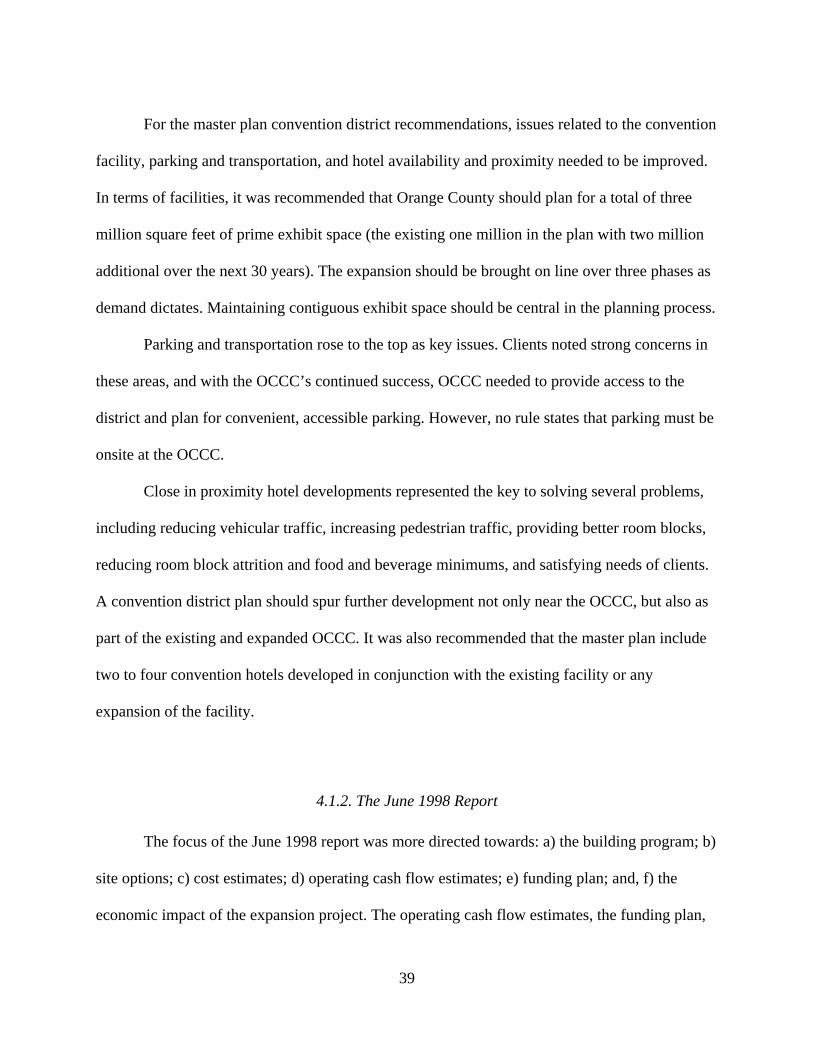
39
For the master plan convention district recommendations, issues related to the convention
facility, parking and transportation, and hotel availability and proximity needed to be improved.
In terms of facilities, it was recommended that Orange County should plan for a total of three
million square feet of prime exhibit space (the existing one million in the plan with two million
additional over the next 30 years). The expansion should be brought on line over three phases as
demand dictates. Maintaining contiguous exhibit space should be central in the planning process.
Parking and transportation rose to the top as key issues. Clients noted strong concerns in
these areas, and with the OCCC’s continued success, OCCC needed to provide access to the
district and plan for convenient, accessible parking. However, no rule states that parking must be
onsite at the OCCC.
Close in proximity hotel developments represented the key to solving several problems,
including reducing vehicular traffic, increasing pedestrian traffic, providing better room blocks,
reducing room block attrition and food and beverage minimums, and satisfying needs of clients.
A convention district plan should spur further development not only near the OCCC, but also as
part of the existing and expanded OCCC. It was also recommended that the master plan include
two to four convention hotels developed in conjunction with the existing facility or any
expansion of the facility.
4.1.2. The June 1998 Report
The focus of the June 1998 report was more directed towards: a) the building program; b)
site options; c) cost estimates; d) operating cash flow estimates; e) funding plan; and, f) the
economic impact of the expansion project. The operating cash flow estimates, the funding plan,
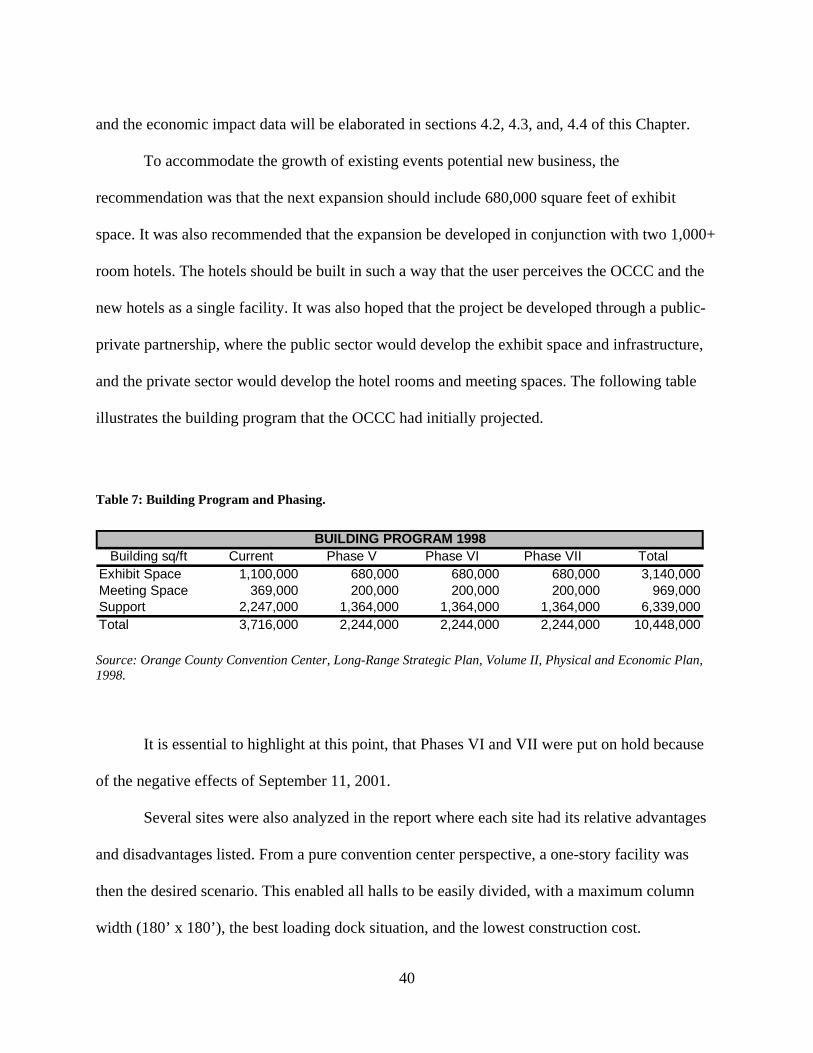
40
and the economic impact data will be elaborated in sections 4.2, 4.3, and, 4.4 of this Chapter.
To accommodate the growth of existing events potential new business, the
recommendation was that the next expansion should include 680,000 square feet of exhibit
space. It was also recommended that the expansion be developed in conjunction with two 1,000+
room hotels. The hotels should be built in such a way that the user perceives the OCCC and the
new hotels as a single facility. It was also hoped that the project be developed through a public-
private partnership, where the public sector would develop the exhibit space and infrastructure,
and the private sector would develop the hotel rooms and meeting spaces. The following table
illustrates the building program that the OCCC had initially projected.
Table 7: Building Program and Phasing.
Building sq/ft Current Phase V Phase VI Phase VII TotalExhibit Space 1,100,000 680,000 680,000 680,000 3,140,000Meeting Space 369,000 200,000 200,000 200,000 969,000Support 2,247,000 1,364,000 1,364,000 1,364,000 6,339,000Total 3,716,000 2,244,000 2,244,000 2,244,000 10,448,000
BUILDING PROGRAM 1998
Source: Orange County Convention Center, Long-Range Strategic Plan, Volume II, Physical and Economic Plan, 1998.
It is essential to highlight at this point, that Phases VI and VII were put on hold because
of the negative effects of September 11, 2001.
Several sites were also analyzed in the report where each site had its relative advantages
and disadvantages listed. From a pure convention center perspective, a one-story facility was
then the desired scenario. This enabled all halls to be easily divided, with a maximum column
width (180’ x 180’), the best loading dock situation, and the lowest construction cost.
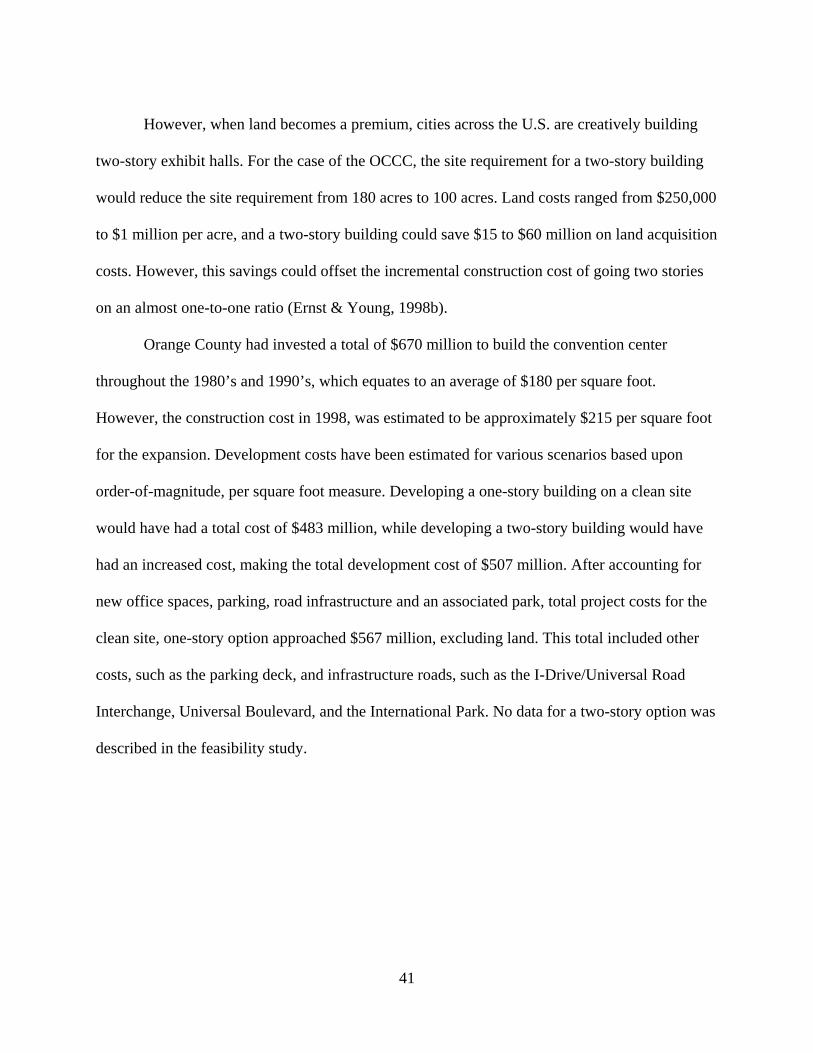
41
However, when land becomes a premium, cities across the U.S. are creatively building
two-story exhibit halls. For the case of the OCCC, the site requirement for a two-story building
would reduce the site requirement from 180 acres to 100 acres. Land costs ranged from $250,000
to $1 million per acre, and a two-story building could save $15 to $60 million on land acquisition
costs. However, this savings could offset the incremental construction cost of going two stories
on an almost one-to-one ratio (Ernst & Young, 1998b).
Orange County had invested a total of $670 million to build the convention center
throughout the 1980’s and 1990’s, which equates to an average of $180 per square foot.
However, the construction cost in 1998, was estimated to be approximately $215 per square foot
for the expansion. Development costs have been estimated for various scenarios based upon
order-of-magnitude, per square foot measure. Developing a one-story building on a clean site
would have had a total cost of $483 million, while developing a two-story building would have
had an increased cost, making the total development cost of $507 million. After accounting for
new office spaces, parking, road infrastructure and an associated park, total project costs for the
clean site, one-story option approached $567 million, excluding land. This total included other
costs, such as the parking deck, and infrastructure roads, such as the I-Drive/Universal Road
Interchange, Universal Boulevard, and the International Park. No data for a two-story option was
described in the feasibility study.
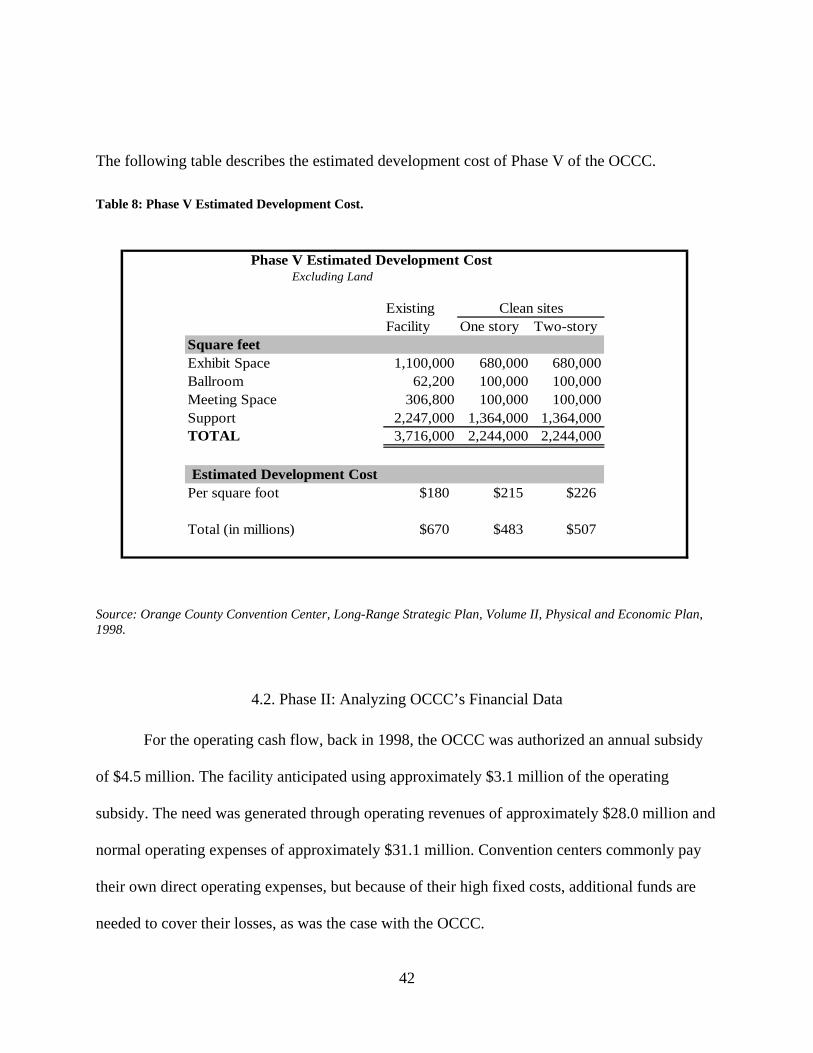
42
The following table describes the estimated development cost of Phase V of the OCCC.
Table 8: Phase V Estimated Development Cost.
Excluding Land
ExistingFacility One story Two-story
Exhibit Space 1,100,000 680,000 680,000Ballroom 62,200 100,000 100,000Meeting Space 306,800 100,000 100,000Support 2,247,000 1,364,000 1,364,000TOTAL 3,716,000 2,244,000 2,244,000
Per square foot $180 $215 $226
Total (in millions) $670 $483 $507
Phase V Estimated Development Cost
Square feet
Estimated Development Cost
Clean sites
Source: Orange County Convention Center, Long-Range Strategic Plan, Volume II, Physical and Economic Plan, 1998.
4.2. Phase II: Analyzing OCCC’s Financial Data
For the operating cash flow, back in 1998, the OCCC was authorized an annual subsidy
of $4.5 million. The facility anticipated using approximately $3.1 million of the operating
subsidy. The need was generated through operating revenues of approximately $28.0 million and
normal operating expenses of approximately $31.1 million. Convention centers commonly pay
their own direct operating expenses, but because of their high fixed costs, additional funds are
needed to cover their losses, as was the case with the OCCC.
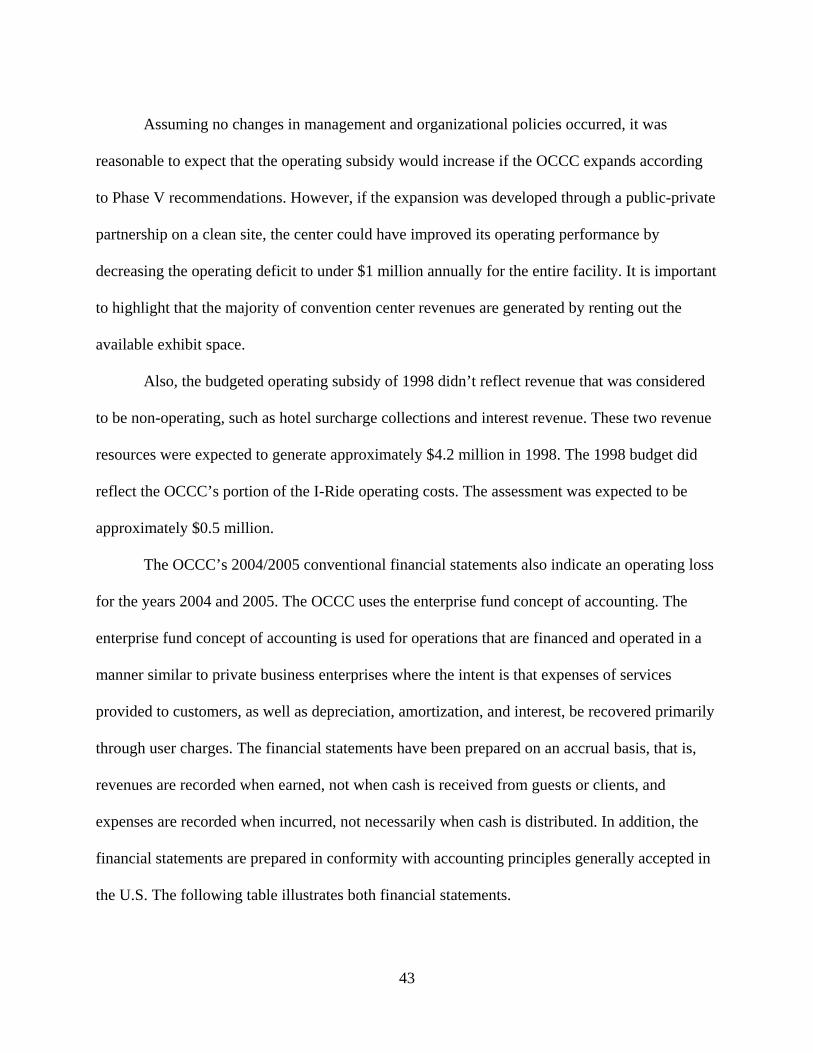
43
Assuming no changes in management and organizational policies occurred, it was
reasonable to expect that the operating subsidy would increase if the OCCC expands according
to Phase V recommendations. However, if the expansion was developed through a public-private
partnership on a clean site, the center could have improved its operating performance by
decreasing the operating deficit to under $1 million annually for the entire facility. It is important
to highlight that the majority of convention center revenues are generated by renting out the
available exhibit space.
Also, the budgeted operating subsidy of 1998 didn’t reflect revenue that was considered
to be non-operating, such as hotel surcharge collections and interest revenue. These two revenue
resources were expected to generate approximately $4.2 million in 1998. The 1998 budget did
reflect the OCCC’s portion of the I-Ride operating costs. The assessment was expected to be
approximately $0.5 million.
The OCCC’s 2004/2005 conventional financial statements also indicate an operating loss
for the years 2004 and 2005. The OCCC uses the enterprise fund concept of accounting. The
enterprise fund concept of accounting is used for operations that are financed and operated in a
manner similar to private business enterprises where the intent is that expenses of services
provided to customers, as well as depreciation, amortization, and interest, be recovered primarily
through user charges. The financial statements have been prepared on an accrual basis, that is,
revenues are recorded when earned, not when cash is received from guests or clients, and
expenses are recorded when incurred, not necessarily when cash is distributed. In addition, the
financial statements are prepared in conformity with accounting principles generally accepted in
the U.S. The following table illustrates both financial statements.
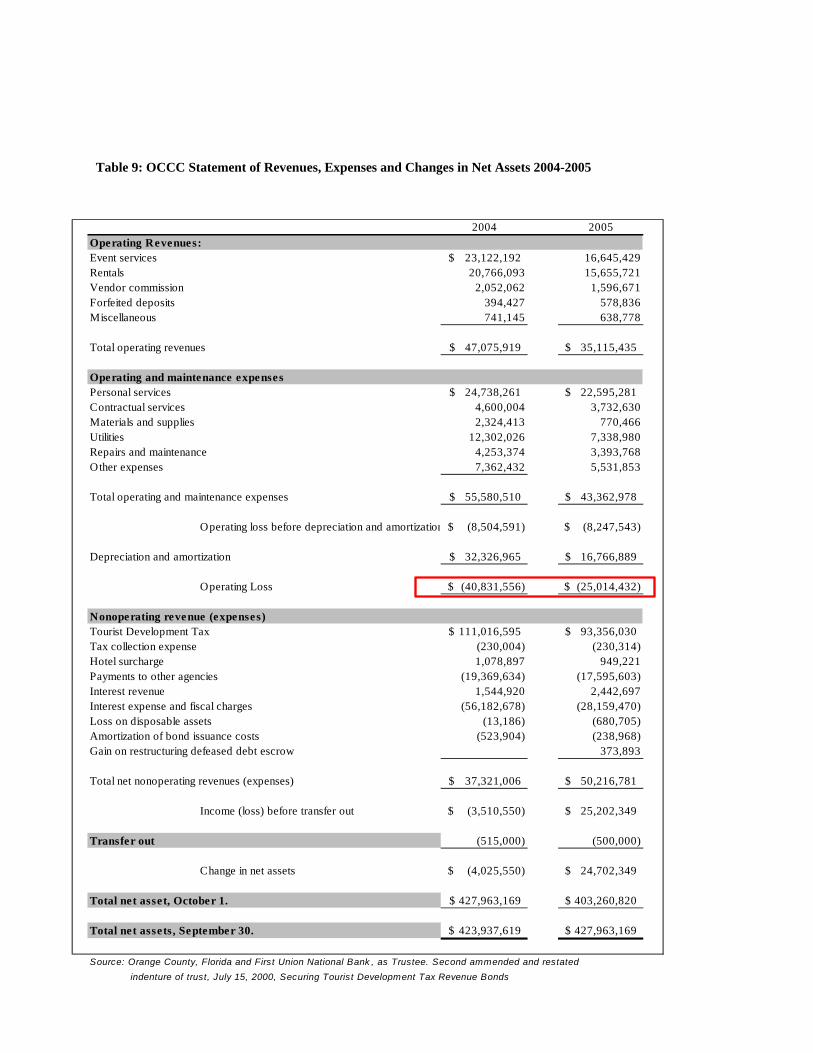
44
2004 2005
Event services 23,122,192$ 16,645,429Rentals 20,766,093 15,655,721Vendor commission 2,052,062 1,596,671Forfeited deposits 394,427 578,836Miscellaneous 741,145 638,778
Total operating revenues 47,075,919$ 35,115,435$
Personal services 24,738,261$ 22,595,281$ Contractual services 4,600,004 3,732,630Materials and supplies 2,324,413 770,466Utilities 12,302,026 7,338,980Repairs and maintenance 4,253,374 3,393,768Other expenses 7,362,432 5,531,853
55,580,510$ 43,362,978$
Operating loss before depreciation and amortization (8,504,591)$ (8,247,543)$
32,326,965$ 16,766,889$
Operating Loss (40,831,556)$ (25,014,432)$
Tourist Development Tax 111,016,595$ 93,356,030$ Tax collection expense (230,004) (230,314)Hotel surcharge 1,078,897 949,221Payments to other agencies (19,369,634) (17,595,603)Interest revenue 1,544,920 2,442,697Interest expense and fiscal charges (56,182,678) (28,159,470)Loss on disposable assets (13,186) (680,705)Amortization of bond issuance costs (523,904) (238,968)Gain on restructuring defeased debt escrow 373,893
Total net nonoperating revenues (expenses) 37,321,006$ 50,216,781$
Income (loss) before transfer out (3,510,550)$ 25,202,349$
(515,000) (500,000)
Change in net assets (4,025,550)$ 24,702,349$
427,963,169$ 403,260,820$
423,937,619$ 427,963,169$
Source: Orange County, Florida and First Union National Bank , as Trustee. Second ammended and restated indenture of trust, July 15, 2000, Securing Tourist Development Tax Revenue Bonds
Total net assets, September 30.
Operating Revenues:
Operating and maintenance expenses
Total operating and maintenance expenses
Nonoperating revenue (expenses)
Total net asset, October 1.
Transfer out
Depreciation and amortization
Table 9: OCCC Statement of Revenues, Expenses and Changes in Net Assets 2004-2005
45
The OCCC reports as operating revenues all charges for services generated through rental
of the facility, including hall and room rentals, fees for support and services associated with
events, and commission from vendors. Other revenues, including tourist development taxes
(TDT), interest revenue, and hotel surcharge revenue, are classified as non-operating.
The “hotel surcharge” revenue, a non-operating revenue restricted in its use to the OCCC
site, is set at the one percent of the hotel’s gross rental revenues and is payable quarterly.
Pursuant to an agreement dated June 12, 1979, between the Board and Orlando Central Park,
Inc., three hotel sites adjacent to the OCCC carry the requirement that any hotel built upon those
sites is obligated to pay to the OCCC a revenue surcharge. All three of the designated sites have
been developed as hotels, and are currently remitting the surcharge to the OCCC.
The “payments to other agencies” includes for example, an additional $3.3 million per
year to the Orlando/Orange County Convention and Visitors Bureau, Inc, a not-for-profit
corporation which is dedicated to promotion of local community tourist activities and facilities.
In 2002, the OCCC adopted a resolution creating the Arts and Cultural Tourism Fund, a
separate special revenue fund for the purpose of supporting tourism-related arts and cultural
events and services. The specified revenue for this fund is derived from a three percent portion of
the first four cents of tourist development tax receipts. This is recorded as “transfer out” on the
statement of revenues and expenses of the OCCC. Details of the remainder of the financial
statement is not directly relevant at this time, as the main purpose of this section was to highlight
the operating loss of the OCCC, and how this is supported with additional revenues such as the
tourist development tax.
46
4.3. Phase III: The Tourist Development Tax (TDT).
Traditionally, convention centers in the U.S., including the OCCC, have been funded
solely from public sector revenues, primarily from the Tourist Development Tax Proceeds,
which is the money received by or on behalf of the County from the Tourist Development Tax.
In 1978, the Orange County Board levied the Tourist Development Tax (TDT) effective
May 1, as amended, and approved by the voters of the County. The County originally imposed
this tax at a rate of one percent (1%) or two percent (2%) of each whole and major fraction of
each dollar of the total rental charged to every person who rents, leases or lets for consideration
any living quarters or accommodations in any hotel, apartment hotel, motel, resort motel,
apartment, apartment motel, rooming house, mobile home park, recreational vehicle park or
condominium for a term of six months or less. Florida Statutes also authorized the imposition of
an additional one percent (1%) of each dollar above the original tourist development tax for high
tourism impact counties.
On August 21, 1989, Orange County adopted this high tourism impact tax and increased
the County’s tourist development tax rate to four percent (4%). On December 13, 1994, the
County levied the Fifth Cent Tax, which also authorizes the County to levy an additional one
percent (1%) in addition to the tourist development tax on tourist rentals in order to pay debt
service on bonds issued to finance certain professional sports franchise facilities or promote and
advertise tourism. This additional one percent (1%) tax is not allowed to be used for convention
center debt, or the Series 2005 Bonds. In other words, Orange County’s Tourist Development
Tax (TDT) does not include the Fifth Cent Tax. However, it is referred by the County to the tax
authorized to be levied, which comprises of the TDT and the Fifth Cent Tax, at the combined
rate of five percent (5%) of each whole and major fraction of each dollar of the total rental
47
charged for Tourist Rentals.
Orange County also has a successful history of refunding their bond issuances. On May
26, 1994, the Board issued Tourist Development Tax Revenue Bonds, Series 1994B, in the
amount of $165,080,000 to pay a portion of the costs of construction of Phase III expansion to
the OCCC and a portion of the design and construction of the Phase IV expansion to the center,
and to pay certain costs and expenses relating to the issuance of the Series 1994B Bonds.
On August 7, 1997, the Board also issued Tourist Development Tax Refunding Revenue
Bonds, Series 1997, in the amount of $193, 490,000 for the purpose of advance refunding
$11,460,000 of the outstanding Tourist Development Tax Revenue Bonds, Series 1990 and
$166,860,000 of the outstanding Tourist Development Tax Revenue Bonds, Series 1992B and to
pay certain costs and expenses relating to the issuance of the Series 1997 Bonds.
On December 14, 1998, the Board issued the Tourist Development Tax Refunding
Revenue Bonds, Series 1998A in part to advance refund $136,155,000 of Series 1994B Bonds
maturing October 1, 2005 and thereafter, except for Term Bonds maturing on October 1, 2019.
On October 8, 2003, the Board issued $17,330,000 Tourist Development Tax Refunding
Revenue Bonds, Series 2003A to refund $15,780,000 of the Series 1994B Term Bonds maturing
on October 1, 2019.
For the expansion and purchase of land for the Phase V of the center, the Board issued
$137, 620,000 of Tourist Development Tax Revenue Bonds, Series 1998B. This was also used
for site improvements, design cost, capital improvements to the OCCC facilities, and to pay
certain costs and expenses relating to the issuance of the Series 1998B Bonds. There are several
other similar examples, but the above mentioned was to briefly illustrate the success of different
call options performed by Orange County.
48
However, the Series 1992B Bonds, the Series 1994A Bonds, the Series 1994B Bonds, the
Series 1997 Bonds, the Series 1998A Bonds, the Series 1998B Bonds, the Series 2000 Bonds,
the Series 2002A Bonds, and the Series 2003A Bonds in particular, are payable on a “senior lien
parity” basis solely from available tourist development taxes, net operating revenues from the
OCCC, investment earnings, pledged fifth cent tax proceeds, naming rights revenues, and monies
held in certain accounts established by the Bond Indenture. The Series 2002 Bonds are payable
on a “junior lien” subordinate basis from these sources. The Bond Indenture specified the order
in which these revenues are to be deposited into these accounts.
4.3.1. Refunding Revenue Bonds, Series 2005
One particular call option of the Orange County Bond Series is the $238,285,000 Tourist
Development Tax Refunding Revenue Bonds, Series 2005. The Series 2005 Bonds were issued
to refund a portion of the County’s Tourist Development Tax Revenue Bonds, Series 2000.
The company RBC Dain Rauscher and the County’s staff had been analyzing a potential
refunding of the Series 2000 Bonds since January 2001. The first call date of the Series 2000
Bonds was not until October 1, 2009. Under Federal tax law, the Series 2000 Bonds are eligible
for one advance refunding (a refunding that occurs more than 90 days prior to the call date)
because they were new money issued for the first construction stage of Phase V of the OCCC.
After 1985, governments are only allowed to advance refund bond issues one time.
The County established a savings threshold of at least 3% net present value savings and the
County and RBC Dain Rauscher continually monitored the market.
As a result of this refunding, the County locked in a significant net present value of
49
$17,116,148, which is 7.16% savings as a percent of Series 2000 Bonds refunded. This was an
excellent level of savings, far exceeding the Government Finance Officer’s Association’s
recommended practice of achieving at least 3-5% savings as a percent of bonds refunded to make
a refunding economically feasible. Due to favorable market conditions and prudent policy, the
County achieved net present value savings which were significantly higher.
The A+ rating on Orange County’s TDT continued in a competitive position, as a result
of increased attendance. In Fiscal 2004, the county did not anticipate full recovery of TDT
revenues to pre-September 11, 2001 levels until fiscal 2006. Growth in pledged revenues is
attributable to the economy’s rebound from the economic downturn, which has led to increased
occupancy rates, hotel room rates, and attendance at the convention center. The County had two
consecutive years of TDT revenue growth, with 2% in fiscal 2003 and 19% in fiscal 2004,
following a 3% and 13% loss in fiscal years 2001 and 2002. Fiscal 2005 revenues are well above
budget, and results through February 2005 were 14% above year-to-date fiscal 2004 figures. As a
result, fiscal 2005 receipts are poised to exceed the 8% annual growth projections.
4.4. Phase IV: Economic Impact Results
4.4.1. Past Projected Economic Impact
In the late 1970s, Orange County visionaries promoted the development of the OCCC. In
1978, a total of $120,000 in property tax was collected from property owners along the projected
area of construction. Since the initial construction of the OCCC, operation had a significant
impact on Orange County and the State of Florida in terms of spending, employment and tax
revenue generation.
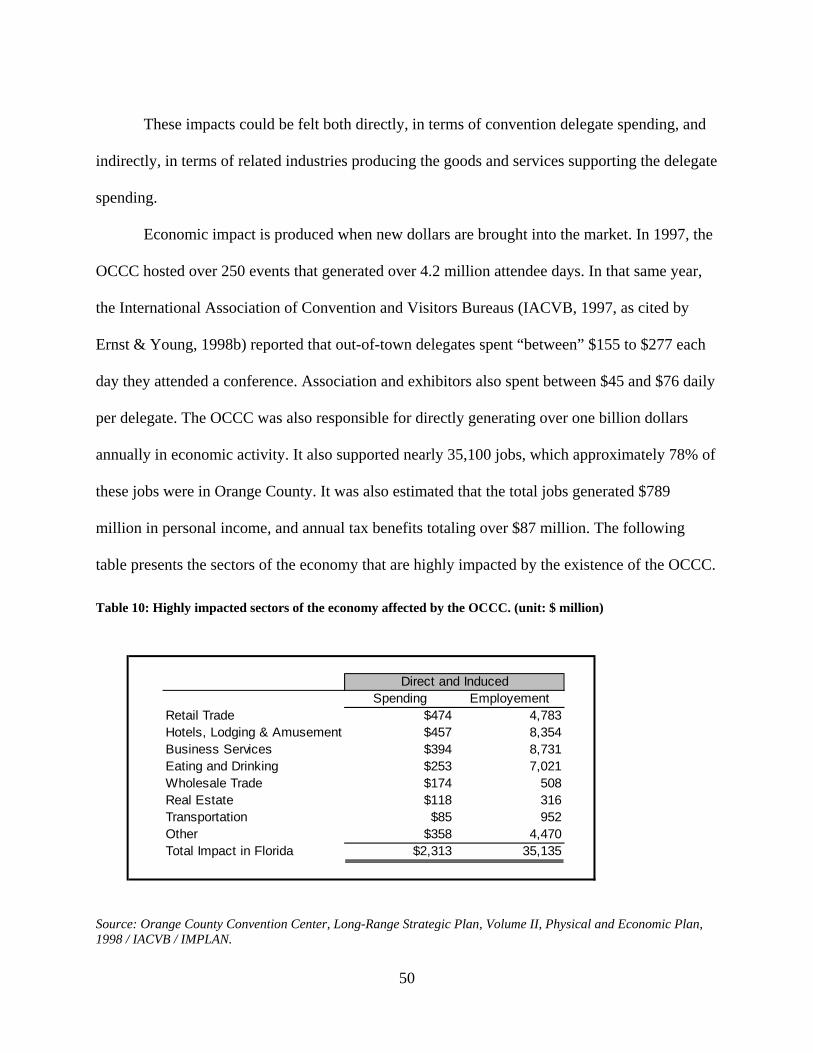
50
These impacts could be felt both directly, in terms of convention delegate spending, and
indirectly, in terms of related industries producing the goods and services supporting the delegate
spending.
Economic impact is produced when new dollars are brought into the market. In 1997, the
OCCC hosted over 250 events that generated over 4.2 million attendee days. In that same year,
the International Association of Convention and Visitors Bureaus (IACVB, 1997, as cited by
Ernst & Young, 1998b) reported that out-of-town delegates spent “between” $155 to $277 each
day they attended a conference. Association and exhibitors also spent between $45 and $76 daily
per delegate. The OCCC was also responsible for directly generating over one billion dollars
annually in economic activity. It also supported nearly 35,100 jobs, which approximately 78% of
these jobs were in Orange County. It was also estimated that the total jobs generated $789
million in personal income, and annual tax benefits totaling over $87 million. The following
table presents the sectors of the economy that are highly impacted by the existence of the OCCC.
Table 10: Highly impacted sectors of the economy affected by the OCCC. (unit: $ million)
Spending EmployementRetail Trade $474 4,783Hotels, Lodging & Amusement $457 8,354Business Services $394 8,731Eating and Drinking $253 7,021Wholesale Trade $174 508Real Estate $118 316Transportation $85 952Other $358 4,470Total Impact in Florida $2,313 35,135
Direct and Induced
Source: Orange County Convention Center, Long-Range Strategic Plan, Volume II, Physical and Economic Plan, 1998 / IACVB / IMPLAN.
51
Several projections were calculated with the expansion project.
• The expansion on a clean site with 680,000 square feet of additional exhibition space was calculated to increase the total attendee days to 2.6 million.
• The increase in hotel room nights was estimated to be approximately 1.9 million. • The resulting increase in direct impact was estimated to be $646 million annually,
with a combined direct and induced annual benefit of $485 million. • Tax collection would have also increased by $53.9 million to a total of $141.2
million annually. • It was also estimated to generate an addition of $1.4 billion in economic activity,
making the OCCC a $3.7 billion driver to the State economy. • Another 21,600 jobs with an additional $55 million in taxes to the state. • The investment in facilities and infrastructure would pay back in 9.5 years from a
total tax perspective, generating an 11% return.
4.4.2. Data used for the Economic Impact Analysis
Several reports, containing data for the calculation of the economic impact were obtained
and utilized. They are: 1) Fiscal Year Analysis 2003-2004, 2004-2005, Orange County
Convention Center; 2) The 2005 Convention/Group Meeting Visitor Profile, Orlando/Orange
County Convention & Visitors Bureau, Inc; and, 3) Expact2004 Convention Expenditure &
Impact Study, International Association and Convention & Visitors Bureaus Foundation.
In order to calculate the direct and indirect impact, using the I/O Model, an annual based
data with the total expenditures of the convention/group meeting profile were needed. The 2005
Convention/Group Meeting Visitor Profile, Orlando/Orange County Convention & Visitors
Bureau, Inc did provide that data, but because of the limited information obtained from the
methodology, such as the response rate for example, a more reliable methodology and data was
desired. The data in this report was collected by D.K. Shifflet & Associates, Ltd (D.K. Shifflet &
Associates, 2005), which utilized a Performance/Index Study to create the comprehensive
52
database of travel behaviors and attributes. This monthly Performance Survey was sent to a
consumer panel of 45,000 households, balanced demographically to match U.S. census data, and
was also designed to be a nationally representative sample. Each month, the Performance Survey
collected data on trips taken during the three previous months.
The second source of information used, was the Expact2004 Convention Expenditure &
Impact Study, performed by the International Association and Convention & Visitors Bureaus
Foundation (Veris Consulting, 2005). In this study, a total of 86 bureaus and event organizers
from over 1,000 events in the U.S. and Canada participated in the study. The event organizers
were asked to take an online survey about their event, with special emphasis on identifying all
local expenditures within the event city. Completed surveys were received from 12,920
delegates, 1,286 exhibiting companies, and 77 event organizers. Also, a complete breakdown of
International, National, and Regional events, for the Large Market Size by Hotel Rooms within
the Metropolitan Statistical Area (MSA) was provided. The MSA is classified by the U.S.
Census Bureau. However, even though this report was explicit when providing the daily
spending and the spending per event and economic impact of conventions, meetings, trade
shows, and exhibitions on the host community, it didn’t provide an annual based data that could
be used for the I/O model.
Based on the two above mentioned reports, several assumptions were made. The first
assumption made was that the OCCC visitor’s profile had a similar breakdown by industry,
attendee scope, and market size as illustrated in the IACVB Expact2004 report. One of the
reasons for making this assumption was that the report had included Orlando, FL in its sample,
and Orlando was also classified as one of the Large Market group categories. By using this
report, an annual based data was still needed.
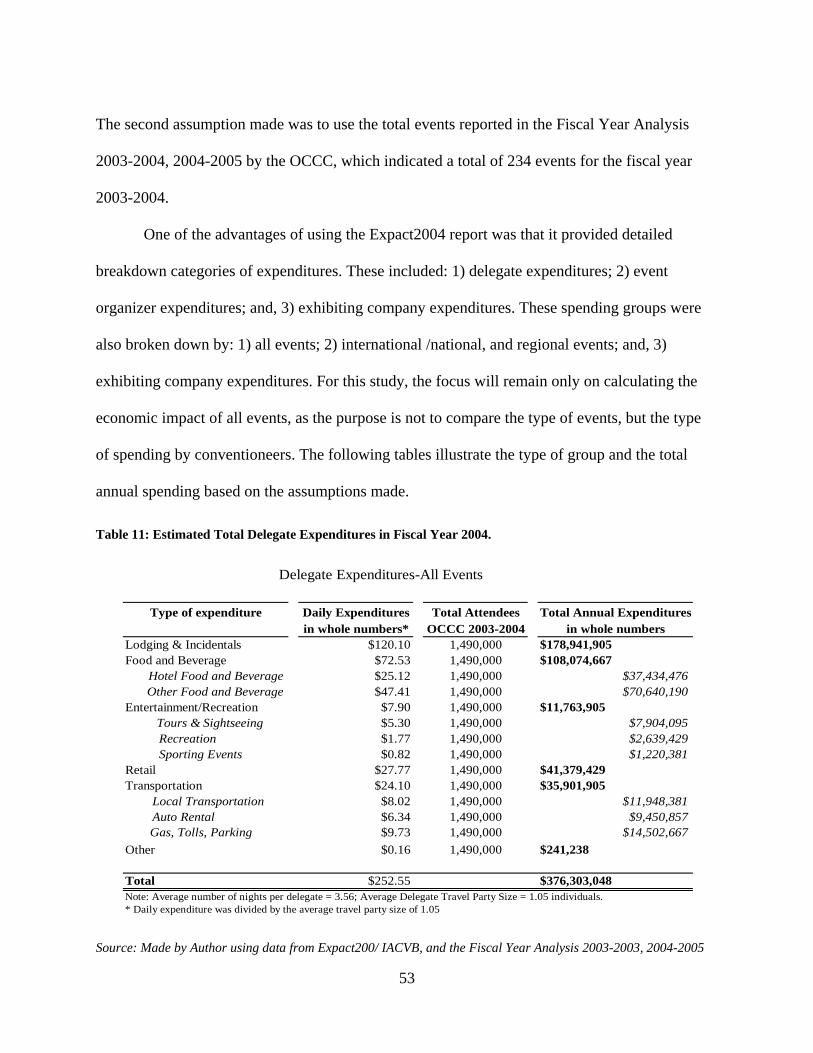
53
The second assumption made was to use the total events reported in the Fiscal Year Analysis
2003-2004, 2004-2005 by the OCCC, which indicated a total of 234 events for the fiscal year
2003-2004.
One of the advantages of using the Expact2004 report was that it provided detailed
breakdown categories of expenditures. These included: 1) delegate expenditures; 2) event
organizer expenditures; and, 3) exhibiting company expenditures. These spending groups were
also broken down by: 1) all events; 2) international /national, and regional events; and, 3)
exhibiting company expenditures. For this study, the focus will remain only on calculating the
economic impact of all events, as the purpose is not to compare the type of events, but the type
of spending by conventioneers. The following tables illustrate the type of group and the total
annual spending based on the assumptions made.
Table 11: Estimated Total Delegate Expenditures in Fiscal Year 2004.
Daily Expenditures Total Attendees Total Annual Expendituresin whole numbers* OCCC 2003-2004 in whole numbers
Lodging & Incidentals $120.10 1,490,000 $178,941,905Food and Beverage $72.53 1,490,000 $108,074,667
$25.12 1,490,000 $37,434,476$47.41 1,490,000 $70,640,190
Entertainment/Recreation $7.90 1,490,000 $11,763,905$5.30 1,490,000 $7,904,095$1.77 1,490,000 $2,639,429$0.82 1,490,000 $1,220,381
Retail $27.77 1,490,000 $41,379,429Transportation $24.10 1,490,000 $35,901,905
$8.02 1,490,000 $11,948,381$6.34 1,490,000 $9,450,857
Gas, Tolls, Parking $9.73 1,490,000 $14,502,667Other $0.16 1,490,000 $241,238
Total $252.55 $376,303,048Note: Average number of nights per delegate = 3.56; Average Delegate Travel Party Size = 1.05 individuals.* Daily expenditure was divided by the average travel party size of 1.05
Recreation Tours & Sightseeing
Delegate Expenditures-All Events
Hotel Food and BeverageOther Food and Beverage
Type of expenditure
Sporting Events
Local Transportation Auto Rental
Source: Made by Author using data from Expact200/ IACVB, and the Fiscal Year Analysis 2003-2003, 2004-2005
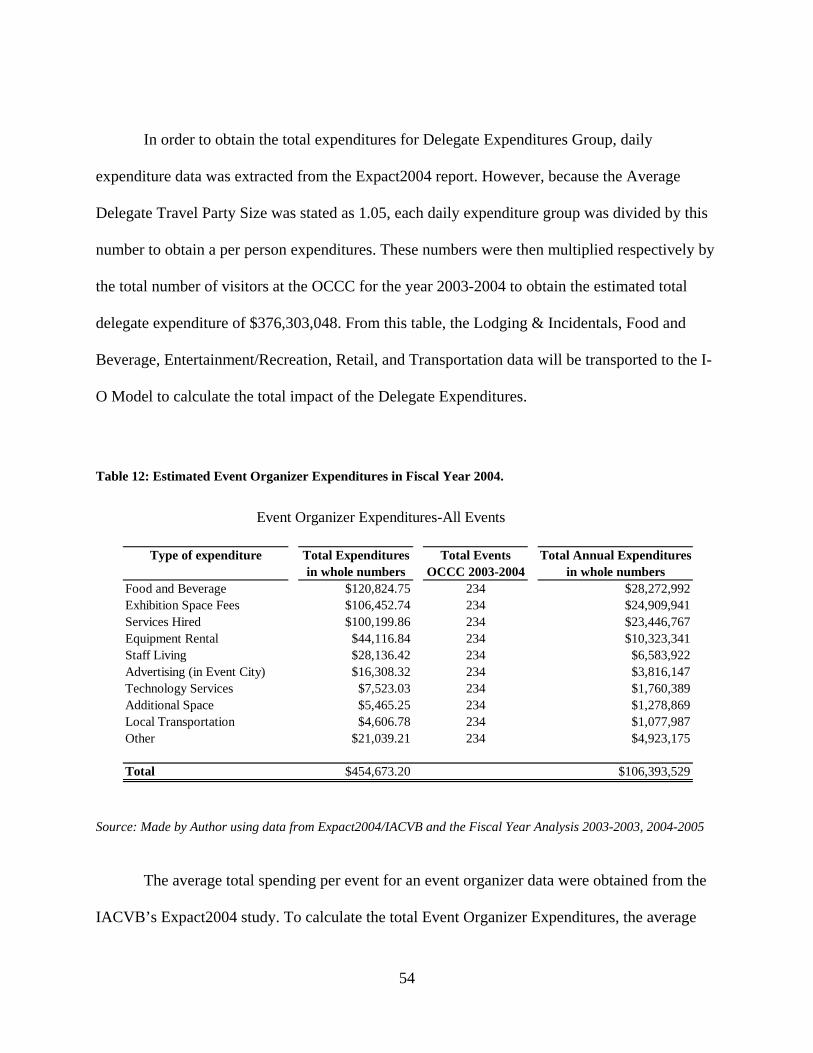
54
In order to obtain the total expenditures for Delegate Expenditures Group, daily
expenditure data was extracted from the Expact2004 report. However, because the Average
Delegate Travel Party Size was stated as 1.05, each daily expenditure group was divided by this
number to obtain a per person expenditures. These numbers were then multiplied respectively by
the total number of visitors at the OCCC for the year 2003-2004 to obtain the estimated total
delegate expenditure of $376,303,048. From this table, the Lodging & Incidentals, Food and
Beverage, Entertainment/Recreation, Retail, and Transportation data will be transported to the I-
O Model to calculate the total impact of the Delegate Expenditures.
Table 12: Estimated Event Organizer Expenditures in Fiscal Year 2004.
Total Expenditures Total Events Total Annual Expendituresin whole numbers OCCC 2003-2004 in whole numbers
Food and Beverage $120,824.75 234 $28,272,992Exhibition Space Fees $106,452.74 234 $24,909,941Services Hired $100,199.86 234 $23,446,767Equipment Rental $44,116.84 234 $10,323,341Staff Living $28,136.42 234 $6,583,922Advertising (in Event City) $16,308.32 234 $3,816,147Technology Services $7,523.03 234 $1,760,389Additional Space $5,465.25 234 $1,278,869Local Transportation $4,606.78 234 $1,077,987Other $21,039.21 234 $4,923,175
Total $454,673.20 $106,393,529
Event Organizer Expenditures-All Events
Type of expenditure
Source: Made by Author using data from Expact2004/IACVB and the Fiscal Year Analysis 2003-2003, 2004-2005
The average total spending per event for an event organizer data were obtained from the
IACVB’s Expact2004 study. To calculate the total Event Organizer Expenditures, the average
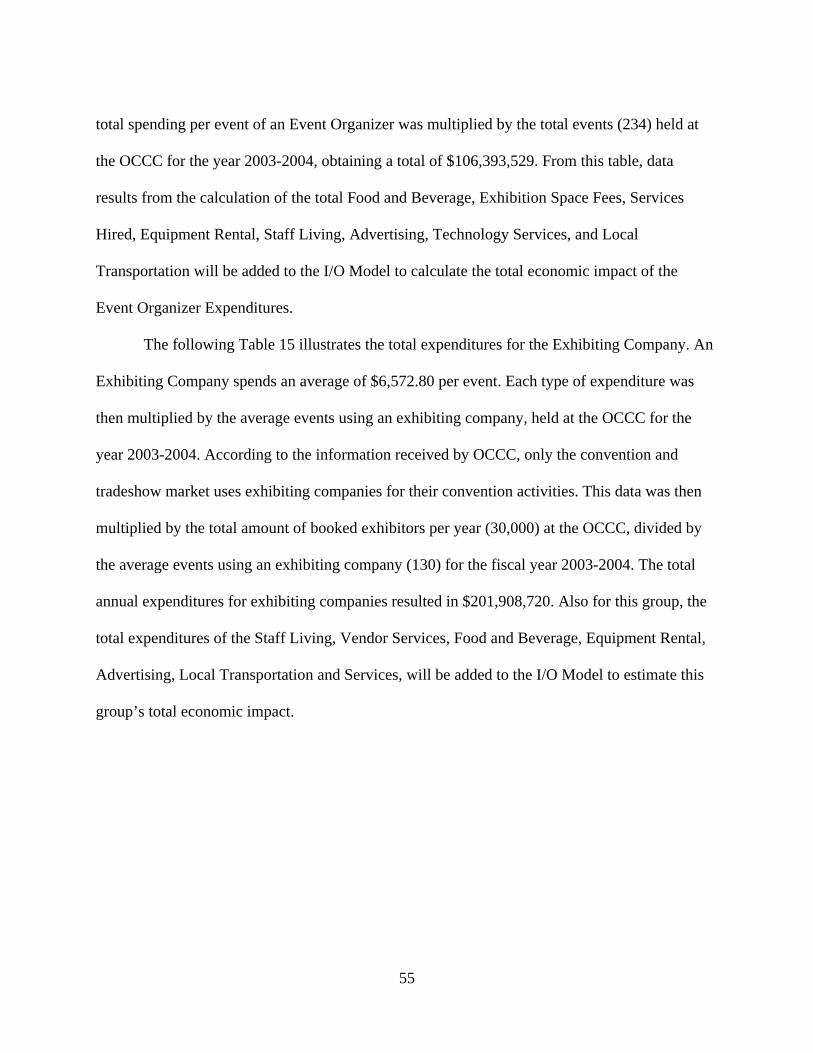
55
total spending per event of an Event Organizer was multiplied by the total events (234) held at
the OCCC for the year 2003-2004, obtaining a total of $106,393,529. From this table, data
results from the calculation of the total Food and Beverage, Exhibition Space Fees, Services
Hired, Equipment Rental, Staff Living, Advertising, Technology Services, and Local
Transportation will be added to the I/O Model to calculate the total economic impact of the
Event Organizer Expenditures.
The following Table 15 illustrates the total expenditures for the Exhibiting Company. An
Exhibiting Company spends an average of $6,572.80 per event. Each type of expenditure was
then multiplied by the average events using an exhibiting company, held at the OCCC for the
year 2003-2004. According to the information received by OCCC, only the convention and
tradeshow market uses exhibiting companies for their convention activities. This data was then
multiplied by the total amount of booked exhibitors per year (30,000) at the OCCC, divided by
the average events using an exhibiting company (130) for the fiscal year 2003-2004. The total
annual expenditures for exhibiting companies resulted in $201,908,720. Also for this group, the
total expenditures of the Staff Living, Vendor Services, Food and Beverage, Equipment Rental,
Advertising, Local Transportation and Services, will be added to the I/O Model to estimate this
group’s total economic impact.
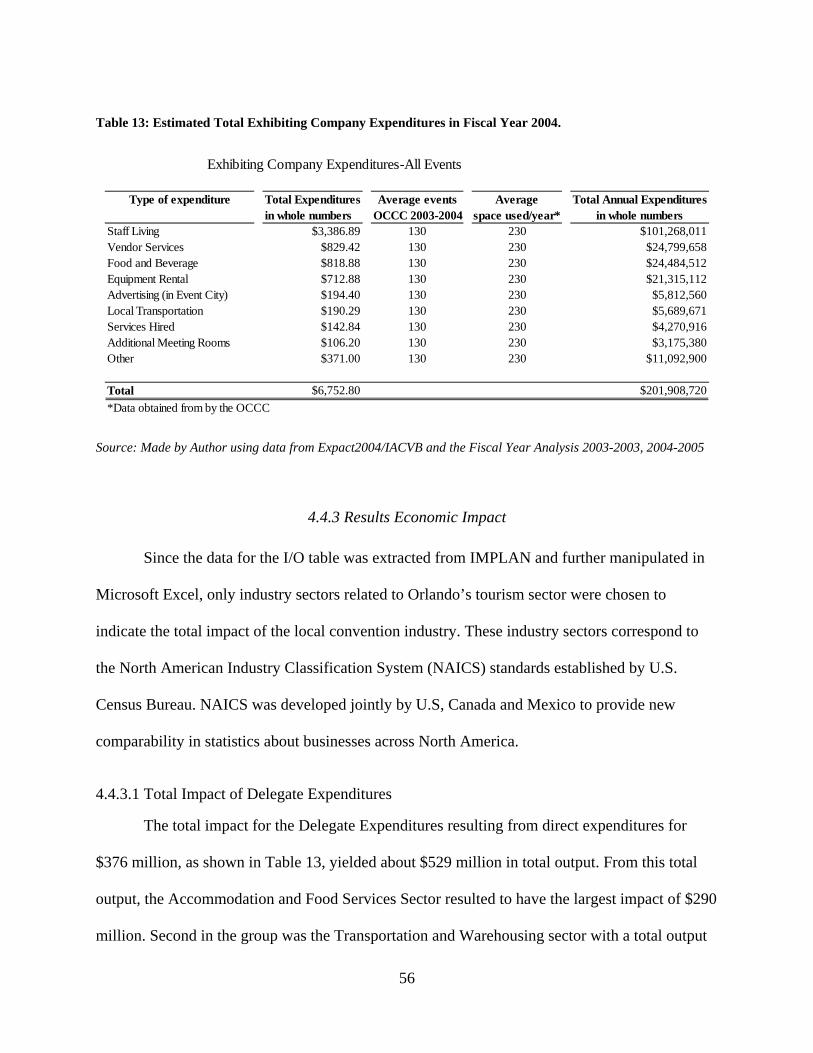
56
Table 13: Estimated Total Exhibiting Company Expenditures in Fiscal Year 2004.
Total Expenditures Average events Average Total Annual Expendituresin whole numbers OCCC 2003-2004 space used/year* in whole numbers
Staff Living $3,386.89 130 230 $101,268,011Vendor Services $829.42 130 230 $24,799,658Food and Beverage $818.88 130 230 $24,484,512Equipment Rental $712.88 130 230 $21,315,112Advertising (in Event City) $194.40 130 230 $5,812,560Local Transportation $190.29 130 230 $5,689,671Services Hired $142.84 130 230 $4,270,916Additional Meeting Rooms $106.20 130 230 $3,175,380Other $371.00 130 230 $11,092,900
Total $6,752.80 $201,908,720*Data obtained from by the OCCC
Exhibiting Company Expenditures-All Events
Type of expenditure
Source: Made by Author using data from Expact2004/IACVB and the Fiscal Year Analysis 2003-2003, 2004-2005
4.4.3 Results Economic Impact
Since the data for the I/O table was extracted from IMPLAN and further manipulated in
Microsoft Excel, only industry sectors related to Orlando’s tourism sector were chosen to
indicate the total impact of the local convention industry. These industry sectors correspond to
the North American Industry Classification System (NAICS) standards established by U.S.
Census Bureau. NAICS was developed jointly by U.S, Canada and Mexico to provide new
comparability in statistics about businesses across North America.
4.4.3.1 Total Impact of Delegate Expenditures
The total impact for the Delegate Expenditures resulting from direct expenditures for
$376 million, as shown in Table 13, yielded about $529 million in total output. From this total
output, the Accommodation and Food Services Sector resulted to have the largest impact of $290
million. Second in the group was the Transportation and Warehousing sector with a total output
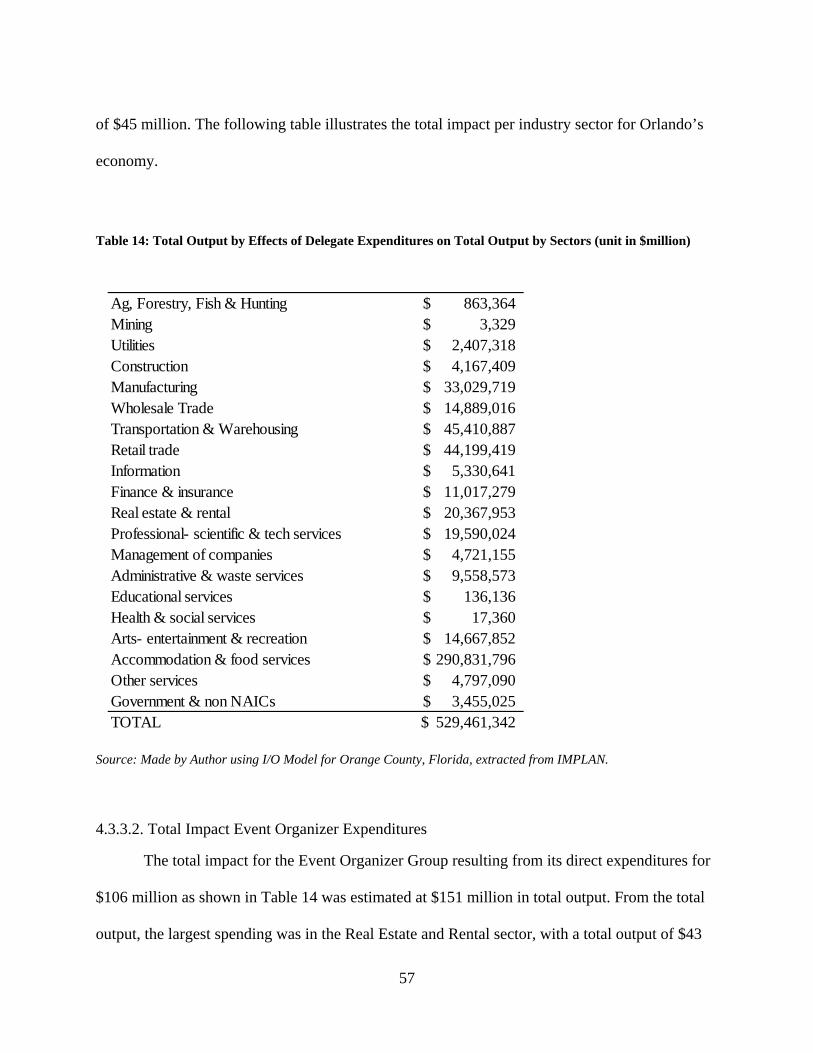
57
of $45 million. The following table illustrates the total impact per industry sector for Orlando’s
economy.
Table 14: Total Output by Effects of Delegate Expenditures on Total Output by Sectors (unit in $million)
Ag, Forestry, Fish & Hunting 863,364$ Mining 3,329$ Utilities 2,407,318$ Construction 4,167,409$ Manufacturing 33,029,719$ Wholesale Trade 14,889,016$ Transportation & Warehousing 45,410,887$ Retail trade 44,199,419$ Information 5,330,641$ Finance & insurance 11,017,279$ Real estate & rental 20,367,953$ Professional- scientific & tech services 19,590,024$ Management of companies 4,721,155$ Administrative & waste services 9,558,573$ Educational services 136,136$ Health & social services 17,360$ Arts- entertainment & recreation 14,667,852$ Accommodation & food services 290,831,796$ Other services 4,797,090$ Government & non NAICs 3,455,025$ TOTAL 529,461,342$
Source: Made by Author using I/O Model for Orange County, Florida, extracted from IMPLAN.
4.3.3.2. Total Impact Event Organizer Expenditures
The total impact for the Event Organizer Group resulting from its direct expenditures for
$106 million as shown in Table 14 was estimated at $151 million in total output. From the total
output, the largest spending was in the Real Estate and Rental sector, with a total output of $43
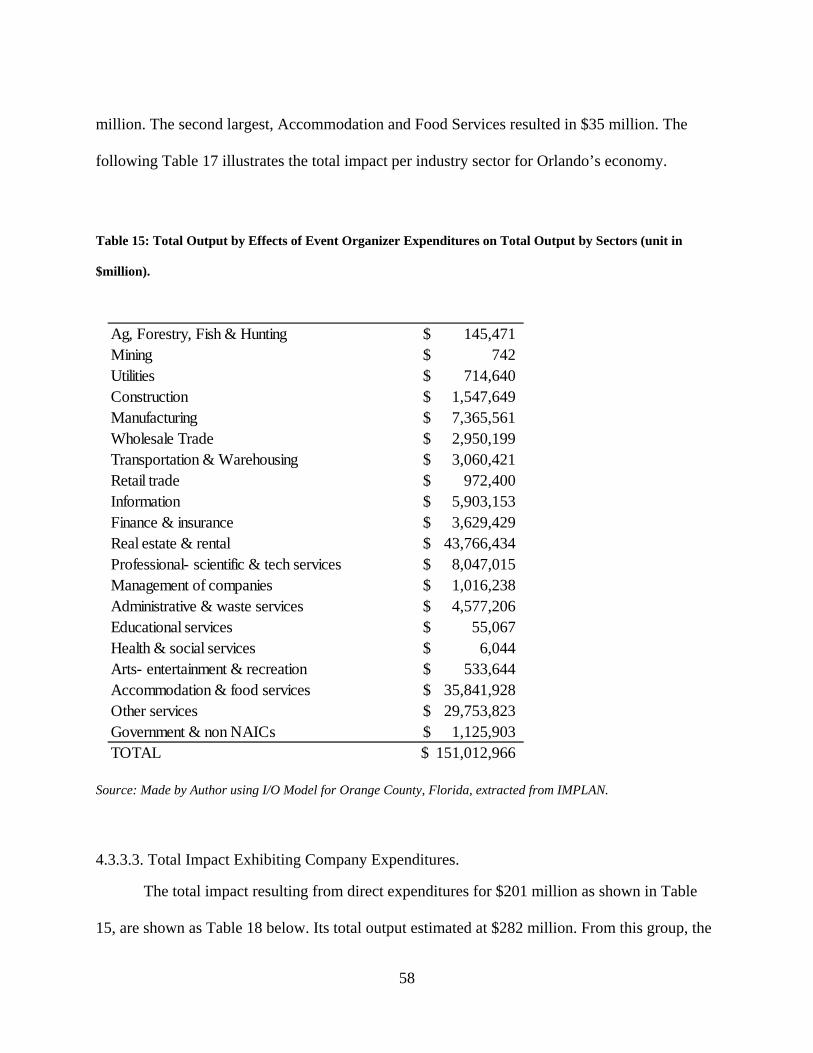
58
million. The second largest, Accommodation and Food Services resulted in $35 million. The
following Table 17 illustrates the total impact per industry sector for Orlando’s economy.
Table 15: Total Output by Effects of Event Organizer Expenditures on Total Output by Sectors (unit in
$million).
Ag, Forestry, Fish & Hunting 145,471$ Mining 742$ Utilities 714,640$ Construction 1,547,649$ Manufacturing 7,365,561$ Wholesale Trade 2,950,199$ Transportation & Warehousing 3,060,421$ Retail trade 972,400$ Information 5,903,153$ Finance & insurance 3,629,429$ Real estate & rental 43,766,434$ Professional- scientific & tech services 8,047,015$ Management of companies 1,016,238$ Administrative & waste services 4,577,206$ Educational services 55,067$ Health & social services 6,044$ Arts- entertainment & recreation 533,644$ Accommodation & food services 35,841,928$ Other services 29,753,823$ Government & non NAICs 1,125,903$ TOTAL 151,012,966$
Source: Made by Author using I/O Model for Orange County, Florida, extracted from IMPLAN.
4.3.3.3. Total Impact Exhibiting Company Expenditures.
The total impact resulting from direct expenditures for $201 million as shown in Table
15, are shown as Table 18 below. Its total output estimated at $282 million. From this group, the
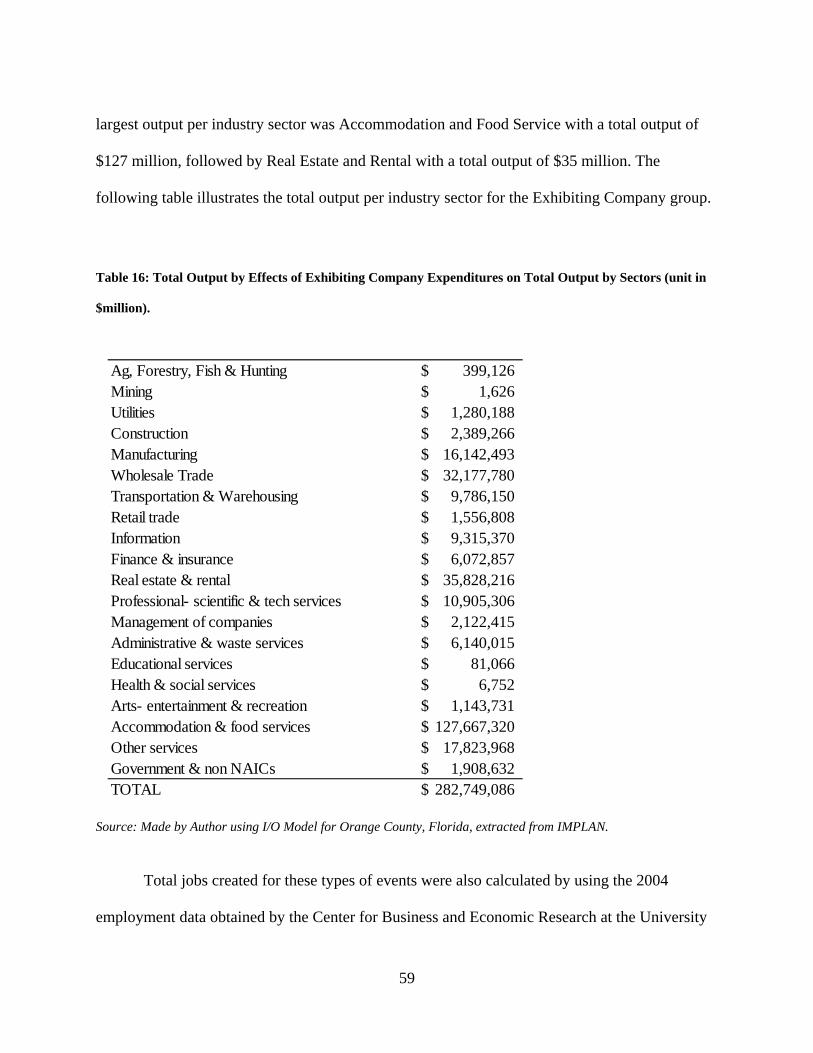
59
largest output per industry sector was Accommodation and Food Service with a total output of
$127 million, followed by Real Estate and Rental with a total output of $35 million. The
following table illustrates the total output per industry sector for the Exhibiting Company group.
Table 16: Total Output by Effects of Exhibiting Company Expenditures on Total Output by Sectors (unit in
$million).
Ag, Forestry, Fish & Hunting 399,126$ Mining 1,626$ Utilities 1,280,188$ Construction 2,389,266$ Manufacturing 16,142,493$ Wholesale Trade 32,177,780$ Transportation & Warehousing 9,786,150$ Retail trade 1,556,808$ Information 9,315,370$ Finance & insurance 6,072,857$ Real estate & rental 35,828,216$ Professional- scientific & tech services 10,905,306$ Management of companies 2,122,415$ Administrative & waste services 6,140,015$ Educational services 81,066$ Health & social services 6,752$ Arts- entertainment & recreation 1,143,731$ Accommodation & food services 127,667,320$ Other services 17,823,968$ Government & non NAICs 1,908,632$ TOTAL 282,749,086$
Source: Made by Author using I/O Model for Orange County, Florida, extracted from IMPLAN.
Total jobs created for these types of events were also calculated by using the 2004
employment data obtained by the Center for Business and Economic Research at the University
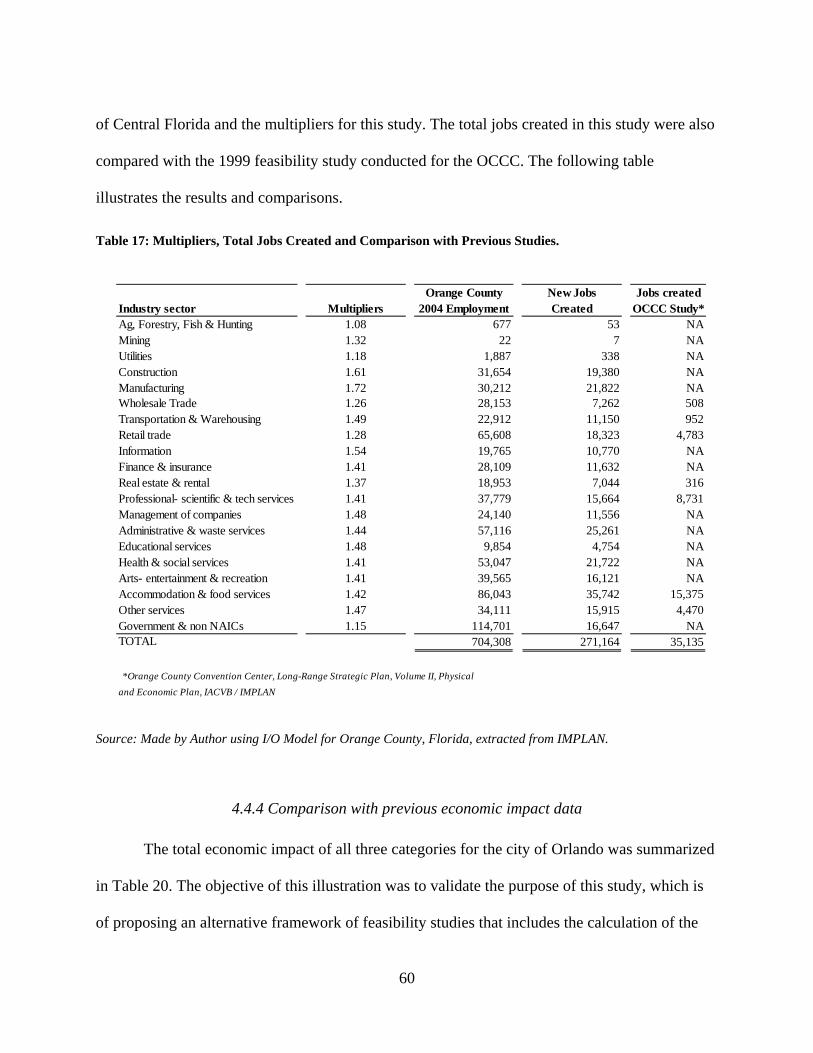
60
of Central Florida and the multipliers for this study. The total jobs created in this study were also
compared with the 1999 feasibility study conducted for the OCCC. The following table
illustrates the results and comparisons.
Table 17: Multipliers, Total Jobs Created and Comparison with Previous Studies.
Orange County New Jobs Jobs createdIndustry sector Multipliers 2004 Employment Created OCCC Study*Ag, Forestry, Fish & Hunting 1.08 677 53 NAMining 1.32 22 7 NAUtilities 1.18 1,887 338 NAConstruction 1.61 31,654 19,380 NAManufacturing 1.72 30,212 21,822 NAWholesale Trade 1.26 28,153 7,262 508Transportation & Warehousing 1.49 22,912 11,150 952Retail trade 1.28 65,608 18,323 4,783Information 1.54 19,765 10,770 NAFinance & insurance 1.41 28,109 11,632 NAReal estate & rental 1.37 18,953 7,044 316Professional- scientific & tech services 1.41 37,779 15,664 8,731Management of companies 1.48 24,140 11,556 NAAdministrative & waste services 1.44 57,116 25,261 NAEducational services 1.48 9,854 4,754 NAHealth & social services 1.41 53,047 21,722 NAArts- entertainment & recreation 1.41 39,565 16,121 NAAccommodation & food services 1.42 86,043 35,742 15,375Other services 1.47 34,111 15,915 4,470Government & non NAICs 1.15 114,701 16,647 NATOTAL 704,308 271,164 35,135
*Orange County Convention Center, Long-Range Strategic Plan, Volume II, Physical and Economic Plan, IACVB / IMPLAN
Source: Made by Author using I/O Model for Orange County, Florida, extracted from IMPLAN.
4.4.4 Comparison with previous economic impact data
The total economic impact of all three categories for the city of Orlando was summarized
in Table 20. The objective of this illustration was to validate the purpose of this study, which is
of proposing an alternative framework of feasibility studies that includes the calculation of the
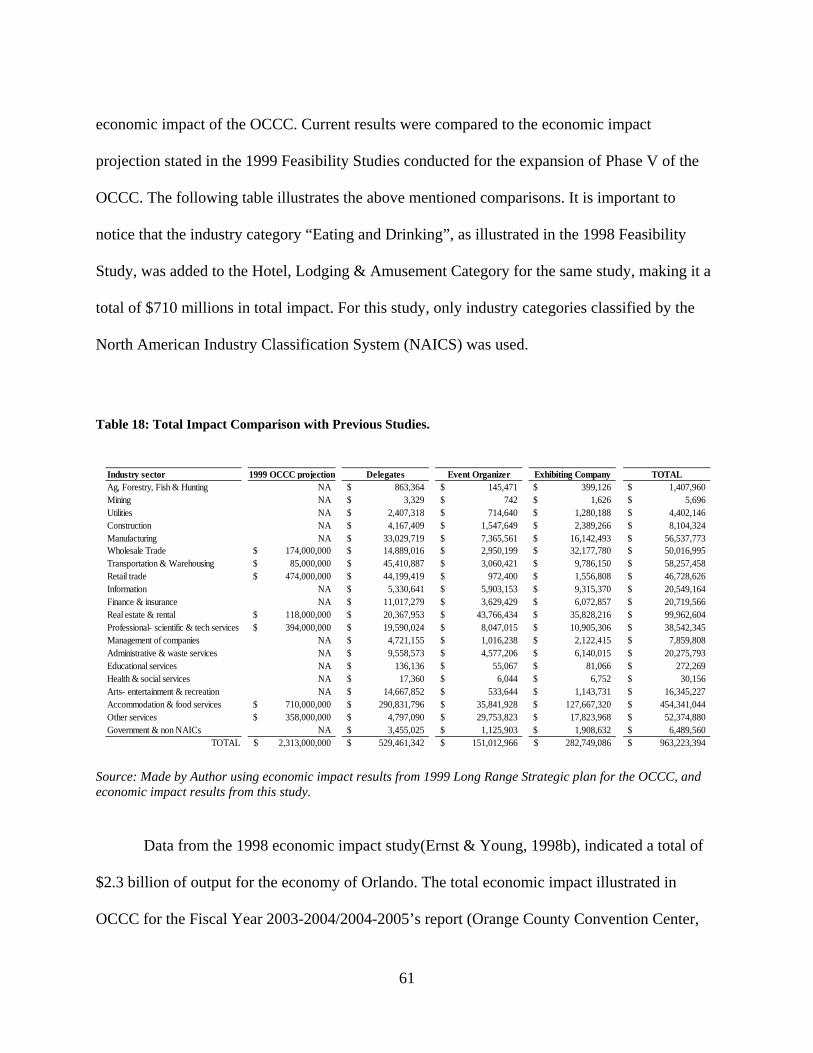
61
economic impact of the OCCC. Current results were compared to the economic impact
projection stated in the 1999 Feasibility Studies conducted for the expansion of Phase V of the
OCCC. The following table illustrates the above mentioned comparisons. It is important to
notice that the industry category “Eating and Drinking”, as illustrated in the 1998 Feasibility
Study, was added to the Hotel, Lodging & Amusement Category for the same study, making it a
total of $710 millions in total impact. For this study, only industry categories classified by the
North American Industry Classification System (NAICS) was used.
Table 18: Total Impact Comparison with Previous Studies.
Industry sector 1999 OCCC projection Delegates Event Organizer Exhibiting Company TOTALAg, Forestry, Fish & Hunting NA 863,364$ 145,471$ 399,126$ 1,407,960$ Mining NA 3,329$ 742$ 1,626$ 5,696$ Utilities NA 2,407,318$ 714,640$ 1,280,188$ 4,402,146$ Construction NA 4,167,409$ 1,547,649$ 2,389,266$ 8,104,324$ Manufacturing NA 33,029,719$ 7,365,561$ 16,142,493$ 56,537,773$ Wholesale Trade 174,000,000$ 14,889,016$ 2,950,199$ 32,177,780$ 50,016,995$ Transportation & Warehousing 85,000,000$ 45,410,887$ 3,060,421$ 9,786,150$ 58,257,458$ Retail trade 474,000,000$ 44,199,419$ 972,400$ 1,556,808$ 46,728,626$ Information NA 5,330,641$ 5,903,153$ 9,315,370$ 20,549,164$ Finance & insurance NA 11,017,279$ 3,629,429$ 6,072,857$ 20,719,566$ Real estate & rental 118,000,000$ 20,367,953$ 43,766,434$ 35,828,216$ 99,962,604$ Professional- scientific & tech services 394,000,000$ 19,590,024$ 8,047,015$ 10,905,306$ 38,542,345$ Management of companies NA 4,721,155$ 1,016,238$ 2,122,415$ 7,859,808$ Administrative & waste services NA 9,558,573$ 4,577,206$ 6,140,015$ 20,275,793$ Educational services NA 136,136$ 55,067$ 81,066$ 272,269$ Health & social services NA 17,360$ 6,044$ 6,752$ 30,156$ Arts- entertainment & recreation NA 14,667,852$ 533,644$ 1,143,731$ 16,345,227$ Accommodation & food services 710,000,000$ 290,831,796$ 35,841,928$ 127,667,320$ 454,341,044$ Other services 358,000,000$ 4,797,090$ 29,753,823$ 17,823,968$ 52,374,880$ Government & non NAICs NA 3,455,025$ 1,125,903$ 1,908,632$ 6,489,560$
TOTAL 2,313,000,000$ 529,461,342$ 151,012,966$ 282,749,086$ 963,223,394$
Source: Made by Author using economic impact results from 1999 Long Range Strategic plan for the OCCC, and economic impact results from this study.
Data from the 1998 economic impact study(Ernst & Young, 1998b), indicated a total of
$2.3 billion of output for the economy of Orlando. The total economic impact illustrated in
OCCC for the Fiscal Year 2003-2004/2004-2005’s report (Orange County Convention Center,
62
2005), indicated an approximately total output of $1.3 billion within the community of Orange
County, Florida. The total economic impact for this study indicated an estimate of $963 million,
which is almost fifty percent (50%) of the total economic impact projected in the 1998 study
conducted for the OCCC, but is relatively close to the results of the OCCC’s fiscal year report.
This created a dilemma, as results were not in direct comparison with the results projected by
previous studies conducted for the OCCC. The reason for this enormous difference in numbers
was then studied to verify any discrepancies.
Data from the 1998 feasibility studies indicated that the average total delegate spending
were approximately $300 per delegate. This total is relatively close if compared to the
Expact2004 delegate spending of $252 per event. However, the only available data the author
believes that might have created this discrepancy would be the total attendee days of 4.2 million,
as illustrated in the study. However, due to the inconsistency of convention terminologies used in
the past, the author is not aware if the 4.2 million was referred to as the total amount of attendees
for 1997. If compared to the total attendees of 1.49 million for 2004, then it is definitely this
number that created the large difference in total output.
The purpose of this study was not to discuss the discrepancies in previous data used, but
to mainly illustrate the importance of involving an economic impact study, using I/O models, as
part of future feasibility studies for the construction or expansions of convention centers.
Economic impact studies not only estimate the economic interactions, but also determine the
relative effect of the OCCC on Orlando’s employment and production amongst industries,
something that cannot be measured with traditional feasibility studies.
However, as suggested by Braun (1992), it is not only the total output that needs to be
considered when analyzing the economic impact of convention centers, but also to measure the

63
added value it provides to the economy and the community in general. Braun (1992) continues
by stating that value added by an organization or industry is revenue less non-labor costs of
inputs. Revenue can be imagined to be the product of price and quantity, and costs are usually
described by capital (structures, equipment, land), materials, energy and purchased goods and
services. Value added is a measure of output that is potentially comparable across economies.
64
CHAPTER 5: CONCLUSIONS, LIMITATIONS AND RECOMMENDATIONS
5.1 The Overall Picture
The main objective of this study was to propose a different model for convention centers
feasibility studies that goes beyond the traditional cost/benefit analysis by incorporating direct
and indirect economic benefits to a community. For this case study, data of the OCCC’s
convention activities was used as an example for the calculation of the total economic impact
and what its contribution and added value was for the economy of Orlando, Florida.
By using the I/O Model for estimating the total economic impact of this center, it will
provide information for the changes in income and employment in Orlando’s economy caused by
an initial injection of spending. The results indicated that spending by convention delegates,
event organizers and exhibiting companies at the OCCC represented the potential direct
economic impact of the convention industry for the Orlando’s economy. The convention
activities not only provide income and jobs, but also produce a ripple effect of broad economic
interactions that produces additional regional income. Based on these results, it can be concluded
that the resulting framework can be used as an alternative model to assess feasibility studies of
large tourism infrastructure investment, such as the OCCC.
5.2. Feasibility Studies
Most publicly owned convention centers, distinguished by dedicated exhibiting space,
tend to have difficulty in demonstrating a positive image to the host community. This is
particularly the case these operations are constantly being criticized for not being able to
65
demonstrate an accurate positive impact on the region’s economy. They also have the challenge
in counter arguing these criticisms, since their operational results clearly indicate their inevitable
high operating costs, which in turn, could provide them with an operating loss. For the case of
the OCCC, the financial statement results presented in this study appeared to validate much of
the criticisms reported by many scholars.
However, for the case of the OCCC, two aspects of the city’s environmental analysis
support the existence of the center. One is the general impression of Orlando as a family oriented
tourist destination, with its large concentration of theme parks, which contributed to a constant
increase in annual visitors. This in turn made Orlando one of the most popular destinations in the
world. This phenomenon had also spurred investors in the hospitality industry for the continuous
building of new hotels, restaurants, time shares, and condo hotels. It is important to note that
other tangible and intangible aspects such as airport infrastructures, entertainment, location of
convention center, cultural activities, safety and security, all contribute to the sustainable
existence of the OCCC as well.
With all these tangible and intangible aspects, Orlando has set a record of collecting more
then $120 million dollars of the Tourist Development Tax for fiscal year 2004-2005. This study
also indicated that these TDT collections had provided Orange County with a successful record
exercising several call options for bond issuances in the past. These bond ratings of “A” from
Standard & Poor’s” and “A+” from Fitch Ratings, had also sent a message that the capital
markets appreciate the County’s Convention Center/TDT plan and strengths of the Orange
County TDT. All these success stories of call options contributed to the overall positive results of
the OCCC’s financial statements, contributing an estimated $111 million dollars.
It is obvious that feasibility studies conducted for the OCCC in the past didn’t capture all
66
these other economic factors illustrated in this study. Therefore, it is again highly suggested to
reexamine the processes used to evaluate public investments in convention centers. This
framework will capture the benefits beyond the financial results of the OCCC to be measured by
changes in output, value added, and tax revenues in the regional economy.
5.3. Recommendations for the OCCC.
As illustrated in their 2003-2004/2004-2005 Fiscal Year Analysis, OCCC remains as the
second largest convention center in the U.S., which is strategically positioned to accommodate
all types and sizes of events with superior customer service. The OCCC continues to be one of
the only 34 facilities in the U.S. that can host events 500,000 square feet or larger.
With a strong economy and historically low interest rates, the venue building boom
continued at a steady rate, with more than seven million square feet of new exhibition space
anticipated by the fall of 2008.
Since the opening in 1983, the OCCC has experienced a number of years where
occupancy rates were at near capacity. In the convention industry, 70% is considered practical
maximum occupancy. With their closest competitors expanding their facilities, the OCCC
continues to enjoy a strong industry occupancy rate. This had motivated the center to construct
an additional 1 million square feet of exhibit space, making it a total of 2.2 million square feet of
exhibit space. However, it is important to highlight that both feasibility studies indicated an
expansion program of exhibit space for Phases VI and VII, totaling an estimate of 10 million
square feet (Table 21).Both Phases VI and VII were cancelled because of the downturn of the
economy after the attacks of September 11, 2001.
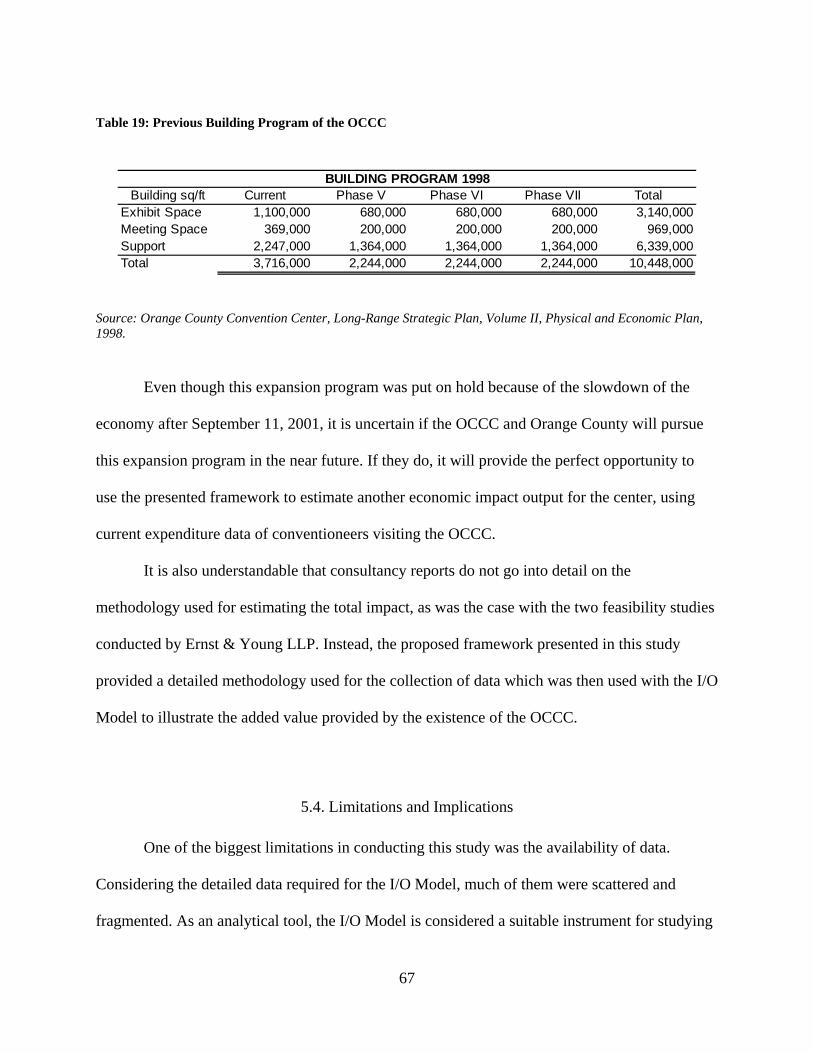
67
Table 19: Previous Building Program of the OCCC
Building sq/ft Current Phase V Phase VI Phase VII TotalExhibit Space 1,100,000 680,000 680,000 680,000 3,140,000Meeting Space 369,000 200,000 200,000 200,000 969,000Support 2,247,000 1,364,000 1,364,000 1,364,000 6,339,000Total 3,716,000 2,244,000 2,244,000 2,244,000 10,448,000
BUILDING PROGRAM 1998
Source: Orange County Convention Center, Long-Range Strategic Plan, Volume II, Physical and Economic Plan, 1998.
Even though this expansion program was put on hold because of the slowdown of the
economy after September 11, 2001, it is uncertain if the OCCC and Orange County will pursue
this expansion program in the near future. If they do, it will provide the perfect opportunity to
use the presented framework to estimate another economic impact output for the center, using
current expenditure data of conventioneers visiting the OCCC.
It is also understandable that consultancy reports do not go into detail on the
methodology used for estimating the total impact, as was the case with the two feasibility studies
conducted by Ernst & Young LLP. Instead, the proposed framework presented in this study
provided a detailed methodology used for the collection of data which was then used with the I/O
Model to illustrate the added value provided by the existence of the OCCC.
5.4. Limitations and Implications
One of the biggest limitations in conducting this study was the availability of data.
Considering the detailed data required for the I/O Model, much of them were scattered and
fragmented. As an analytical tool, the I/O Model is considered a suitable instrument for studying
68
the characteristics of economic development processes in the region. The I/O Model is not a set
of isolated data, but a comprehensive and integrated analytical system, and it requires reliable
data to perform its functions to capture the economy wide effects of certain shocks.
Data from D.K. Shifflet (D.K. Shifflet & Associates, 2005) provided some detailed
breakdown of the total expenditures for the convention/group meeting visitor profile. However,
as mentioned in Chapter 4, there was no detailed information on the methodology section.
Instead, data were collected from the IACVB’s Expact2004 Convention Expenditure & Impact
Study. This study provided a more detailed set of data, including a breakdown for delegate
spending, event organizers and exhibiting companies. The Orange County Convention and
Visitors Bureau was also part of this study when it was conducted, therefore supporting the
assumption made earlier in the study.
Also, total attendees for the fiscal year 2004 were collected from a different source of
data, similar to the total events held at the OCCC for the same year. To estimate the total jobs
created by the OCCC, the total employee rate per industry sector was collected using data
provided by the Center for Business and Economic Research at the University of Central Florida.
The I/O Model can not be left out without mentioning its limitations. However, the
limitations of the I/O Model are simple – it allows for the positive impacts on economic activity
while ignoring the negative social impacts, which are likely to be of a comparable order of
magnitude. According to Fletcher (1989), I/O is a relatively expensive tool of analysis in terms
of both time and financial/manpower resources. Most secondary data is unsuitable for this
method of analysis, because it is rarely accurate at the level of detail needed in I/O Models and,
in most cases, inter-sectoral transaction data is not available at all. This means that much of the
data must be collected by surveys. Furthermore, once the data has been collected and assimilated
69
into an input-output transaction table, a number of restrictive assumptions concerning the
production processes of the various industrial sectors and the consumption function of the
household sector must be made.
5.5. Future Research Recommendations
Future research could provide a quantitative analysis of the different variables presented
in the study. Future research needs to identify if the relationship between the total square feet of
the OCCC, the total hotel rooms in Orange County, the TDT collection, and other tangible
factors can be quantified. Once this is accomplished and validated, it can be then suggested as
future recommendations for destinations that would like to pursue the construction or expansions
of publicly owned convention centers that are larger that 1 million square feet.
In terms of total employment produced by the convention industry, a “shift share
analysis” is also recommended as a future research recommendation. This method is used to
decompose employment changes within an economy over a specific period of time. It also
provides a summary of a region’s key employment potential industries. It also provides a
representation of changes in employment growth or decline, and is useful for targeting industries
that might offer significant employment opportunities, such as the convention industry
(Knudsen, 2000).
The Traditional Financial Statement (Table 11), which captures purely what happens
within the OCCC can only show relatively very small cash flow captured as Total Operating
Revenues. While the estimated total impact of the participants generate direct impact of $963
million which is more than 20 times larger than the OCCC’s total operating revenue, these
70
cannot be captured by the traditional framework of financial statements (Table 20). Direct
expenditures of convention center attendees are only captured by the financial statements of
various stakeholders, which are the legally separate entities from OCCC. Thus OCCC cannot
claim its benefits of existence in full in terms of its financial statements.
Due to the indirect impact caused by the initial direct impacts of attendees, there would
be larger economic transactions to occur within the Orange County that cannot be captured by
the traditional financial statement framework. For example, interest expense and fiscal charges of
$56 million alone is larger than OCCC’s Total Operating revenues, paving possibilities for
misinterpretation by readers of traditional financial statement to conclude that such magnitude of
capital investments were reckless.
Once I/O based transactions is considered in the study region, in which direct
expenditures by attendees in the study region are captured, the benefit to the local businesses and
community would be fairly captured, including the relative generation of the TDT as 15% of the
Total Outputs, or as 22% of the initial expenditures by the attendees.
Also, while the financial statement of the OCCC shows a mere $47 million of annual
total revenues in 2004, the projections made in 1999 for OCCC quotes total impact of $2,313
million, almost 49 times larger than the actual financial statement of OCCC. This underscores
the structural difficulty in dealing with large scale public infrastructure investment, such as a
convention center development, with traditional framework of feasibility studies and financial
statements. Without understanding of the larger picture of how the commercial transactions
beyond the two F/Ss (feasibility study and financial statements) of convention center should be
captured, one can easily be misled to emphasize the apparent vulnerability of convention centers
as a feasible business model for a large capital investment. This neglects any possible
71
relationship of causality between activities initiated by the attendees to the convention center and
benefits captured by financial statements of stakeholders in the local businesses and the host
community.
Apparent interpretation of the financial statements of convention centers can be used by
some readers as a quick proof of catastrophic capital investment project. But that will not enable
the same person to explain why the regional infrastructural investment which was funded by
special purpose bond issuances was rated as AAA. As stated in section 4.3.1., these ratings were
the highest creditworthiness without guarantees from Orange County, which even resulted in
successful early retirements of series of similar bonds before their maturity. This underscores
the apparent limitation of evaluating “convention center investment business model” with the
narrow, traditional framework of the F/Ss.
Feasibility studies occasionally utilize the framework of input-output as a mean to
measure the potential impacts to local community. But as reviews of other impact studies
revealed, lack of full disclosures of all the key assumptions, particularly those for final demand
(=expenditures estimation or measurement in similar locations or the area in question), cannot
make it obvious for readers to understand what the reasonable or questionable assumptions are.
Lack of primer for input-output based analysis for non-economists and tourism practitioners
might be contributing to recycling of previous calculation results, particularly “multipliers”
without critical analysis on assumptions. Inflated numbers would surely help planners and
developers to obtain endorsements of local stakeholders to obtain financing, but it might be
advisable for readers to compare the projections with actual numbers recorded by the project as
time passes by.

72
It is therefore extremely important that destinations assess the potential impact by using
models such as the I/O and include that in information in any feasibility studies performed for
any type of investments related to new construction or expansion of the large public
infrastructures.
73
REFERENCES
Andranovich, G., Burbank, M. J., & Heying, C. H. (2001). Olympic Cities: Lessons learned from Mega-Event Politics. Journal of Urban Affairs, 23(2), 113-131.
Angelo, R. (1985). A practical guide to understanding feasibility studies. East Lansing, Michigan: Educational Institute of the American Hotel & Motel Association.
Archer, B. H. (1982). The value of multipliers and their policy implications. Tourism Management, 3, 236-241.
Bailey, J. S. (1991). Marketing behavior analysis requires different talk. Journal of Applied Behavior Analysis, 24, 445-448.
Beals, P., & Troy, D. A. (1982a). Hotel feasibility analysis, Part I. The Cornell H.R.A. Quarterly, May.
Beals, P., & Troy, D. A. (1982b). Hotel Feasibility Analysis, Part II. The Cornell H.R.A. Quarterly, November.
Braun, B. M. (1992). The Economic Contribution of Conventions: The Case of Orlando, Florida. Journal of Travel Research, 30(3), 32-37.
Braun, B. M., & Rungeling, B. (1992). The relative economic impact of convention and tourist visitor on a regional economy: a case study. International Journal of Hospitality Management, 11(1), 65-71.
Brinkmann, A. (2003). Graphical Knowledge Display-Mind Mapping and Concept Mapping as Efficient Tools in Mathematics Education. Mathematics Education Review, 16, 35-48.
Carlsen, J. (2004). Issues in dedicated convention center development with a Case Study of the Perth Convention and Exhibition Center, Western Australia. Journal of Convention & Event Tourism, 6(1/2), 45-61.
Choi, Y. B. (1999). Conventions and economic change: a contribution toward a theory of political economy. Constitutional Political Economy, 10(3), 245-264.
Chon, K., Chung, K. Y., & Kim, S. S. (2003). Convention industry in South Korea: an economic impact analysis. Tourism Management, 24(5), 533-541.
74
Convention Industry Council. (2004). The Economic Impact of Meetings, Convention, Exhibitions and Incentive Travel. McLean, VA.
Convention Industry Council. (2006). Meetings & Conventions 2006 Meeting Market Report. San Diego, CA.: Northstar Travel Media.
Coughlin, C. C., & Mandelbaum, T. B. (1991). A consumer's guide to regional economic multipliers. St. Louis: Federal Reserve Bank of St. Louis.
Crompton, J. L. (1995). Economic impact analysis of sports facilities and events: eleven sources of misapplications. Journal of Sport Management, 9, 14-34.
Crouch, G. I., & Ritchie, J. R. B. (1998). Convention cite selection research: A review, conceptual model, and propositional framework. Journal of Convention & Exhibition Management, 1(1), 49-69.
D.K. Shifflet & Associates. (2005). Convention/Group Meeting Visitor Profile. Orlando, FL: Orlando/Orange County Convention & Visitor Bureau, Inc.
Dwyer, L., Mellor, R., Mistilis, N., & Mules, T. (2000). A framework for assessing "tangible" and "intangible" impacts of events and conventions. Event Management, 6(3), 175-189.
Eadington, W. R., & Redman, M. (1991). Economics and tourism. Annals of Tourism Research, 18, 41-56.
Eisinger, P. K. (2000). The politics of bread and circusses: Building the city for the visitor class. Urban Affairs Review, 35(3), 316-333.
Ernst & Young. (1998a). Long range strategic plan for the Orange County Convention Center. Orlando, Florida.
Ernst & Young. (1998b). Volume II - Physical and Economic Plan. Orlando, Florida.
Eyster, J. J. (1973). The Hotel-Motel Feasibility Study. The Cornell H.R.A. Quarterly, November.
Faerber, E. (1993). All about bonds and mutual funds: the easy way to get started. Hightstown, NJ.: McGraw-Hill.
Feng, W. (2004). Analysis of China's Convention Industry: Problems and Countermeasures. Chinese Business Review, 3(6), 31-37.
75
Fenich, G. G. (1992). Convention center development: pros, cons and unanswered questions. International Journal of Hospitality Management, 11(3), 183-196.
Fishkind & Associates. (2002). The Economic and Fiscal Impacts of the Orange County Convention Center. Orlando, Florida.
Fletcher, J. E. (1989). Input-Output analysis and tourism impact studies. Annals of Tourism Research, 16, 514-529.
Frechtling, D. C. (1994). Assessing the economic impacts of travel and tourism - measuring economic benefits. In J. R. B. Ritchie, Goeldner, C.R. (Ed.), Travel, Tourism and Hospitality Research (2nd ed.). New York: John Wiley and Sons Inc.
Frechtling, D. C. (2006). An assessment of visitor expenditure methods and models. Journal of Travel Research, 45(1), 26-35.
Frieden, B. J. (1989). The Downtown Job Puzzle. Public Interest(97), 71.
Ghitelman, D. (1995a). Convention center development: Never enough? Meetings & Conventions, 30, 50-58.
Green, E. (1979). New Requirements of the Hotel Feasibility Study. Lodging, March.
Hara, T. (2004). Estimating the immediate effects of an unprecedented event of terrorism. Advances in Hospitality and Leisure, 1, 237-254.
Hodgson, J. N. (1973). The Feasibility Study. The Cornell H.R.A. Quarterly, November.
Horwath Tourism & Leisure Consulting. (1981). Tourism multiplier explained. Madrid, Spain.
Hughes, M. (2002). International convention center development study. New York, NY.: Tradeshow Week Magazine & Custom Research.
International Association for Exhibition Management. (2005). IAEM Research Symposium: Discovering the next Generation of Convention and Exhibition Centers., Cleveland, Ohio.
Jensen, C. (2006). Exhibit space reaches new level. In Tradeshow Week Major Exhibit Hall Directory (Vol. 29th Annual Edition, August 2006). Los Angeles, CA.: Reed Business Information.
76
Judd, D. R. (1979). The politics of American Cities: Private Power and Public Policy. Boston, MA.: Little Brown and Co.
Judd, D. R. (1985). The politics of American Cities. Boston: Little Brown & Co.
Kalich, V. Z. (1998). A public choice perspective on the subsidization of private industry: A case study of three cities and three stadiums. Journal of Urban Affairs, 20(2), 199-219.
Kassab, B. (2006). Convention center says big shows are drawing more people in '06. Orlando Sentinel, pp. B1-B2.
Kiener, R. (1976). Feasibility Studies: Still Feasible. Hospitality, March.
Kim, H., & Gu, Z. (2004). Financial determinants of corporate bond ratings: an examination of hotel and casino firms. Journal of Hospitality & Tourism Research, 28(1), 95-108.
Kurz, H. D., & Salvadori, N. (2000). 'Classical' roots of input-output analysis: A short account of its long prehistory. Economic Systems Research, 12(2), 153-179.
Laslo, D., & Judd, R. D. (2004). Convention center wars and the decline of local democracy. In R. R. Nelson (Ed.), Current Issues in Convention and Exhibition Facility Development (pp. 81-98). Binghamton, NY.: The Haworth Hospitality Press.
Lattin, T. W., & Sherf, D. A. (1975). The Ingredients of a Feasibility Study for a New Motor Inn. Hotel & Motel Management.
Law, C. M. (1992). Urban tourism and its contribution to economic regeneration. Urban Studies, 29(3/4), 599-618.
Law, C. M. (1993). Urban tourism: Attracting visitors to large cities. London: Mansell.
Lee, W. I., & Josiam, B. M. (2004). A framework for assessing national convention tourism competitiveness: an exploratory study. Journal of International Business and Entrepreneurship Development, 2(2), 105-112.
Miller, R. E., & Blair, P. E. (1985). Input-Output Analysis: Foundations and Extensions. Englewood Cliffs, NJ.: Prentice-Hall Inc.
Mills, E. S. (1991). Should governments own convention centers? (No. 33). Chicago, IL.: The Heartland Institute.
77
Minnesota IMPLAN Group. (2004). IMPLAN professional; user's guide, analysis guide, data guide. Stillwater, MN: Minnessota IMPLAN Group, Inc.
Nelson, R. R. (1999). Convention centers as catalyst for local economic development. Unpublished Dissertation, University of Delaware, Newark, Delaware.
Nelson, R. R. (2005). Tourism as a Catalyst for Local Economic Development, www.chep.udel.edu/directions/articles/may05/tourism.htm
Orange County Convention Center. (2005). Fiscal Year Analysis 2004-2005. Orlando, Florida.
Rushmore, S. (1986). How to perform an economic feasibility study of a proposed hotel/motel. Chicago, Illinois: The American Society of Real Estate Counselors.
Sanders, H. T. (1992). Building the convention city: Politics, finance, and public investment in urban America. Journal of Urban Affairs, 14(2), 135-159.
Sanders, H. T. (1999). Flawed forecasts: a critical look at convention center feasibility studies. Boston: Pioneer Institute for Public Policy Research.
Sanders, H. T. (2002). Convention Myths and Markets: A Critical Review of Convention Center Feasibility Studies. Economic Development Quarterly, 16(3), 195-210.
Sanders, H. T. (2005). Space Available: The realities of Convention Centers as Economic Development Strategy. Washington, DC.: The Brookings Institution.
Sommer, W. L. (1979). The Feasibility Study: How to Analyze the Market for Hotel/Motel Rooms. Lodging, May.
Stynes, D. J. (1997). Economic impacts of Tourism: A handbook for tourism professionals. Urbana, IL: University of Illinois, Tourism Research Laboratory.
Tyrrell, T. J., Johnston, R.J. (2001). A theoretical framework for assessing direct economic impacts of tourist events: distinguishing origins, destinations, and causes of expenditures. Journal of Travel Research, 40(1), 94-101.
Tyrrell, T. J., Johnston, R.J. (2006). The economic impacts of tourism: a special issue. Journal of Travel Research, 45(1), 3-7.
Var, T., Cesario, F., & Mauser, G. (1985). Convention tourism modeling. Tourism Management, 6(3), 194-205.
78
Veris Consulting, L. (2005). ExPact2004 Convention Expenditure & Impact Study. Reston, VA.: International Association of Convention and Visitor Bureaus Foundation, IACVB.
Weber, K. (2001). Meeting planners' use and evaluation of convention and visitor bureaus. Tourism Management, 22(2), 599-606.
Weber, K., & Ladkin, A. (2004). Trends affecting the convention industry in the 21st century. Journal of Convention & Event Tourism, 6(4), 47-63.
Winterkamp, F. M. (2007). Capital Project Planning and Evaluation: Expanding the Role of the Finance Officer. Orlando, FL.: Government Finance Officer's Association.
Winterkamp, F. M., Taub, S., Gassman, E., & Donoghue. (2004). Expect the Unexpected: Financing the Orange County Convention Center Expansion in the Wake of Recession and Terrorism. Government Finance Review, 20(4), 23-27.
Wirtz, R. A. (2001). Stadiums and convention centers as community loss leaders. Fedgazette, 13(2), 5-7.
Yoo, J. J. E., & Weber, K. (2005). Progress in convention tourism research. Journal of Hospitality & Tourism Research, 29(2), 194-222.