Department of Energy - Alternative Energy Feasibility ... of Energy – Alternative Energy...
146
1 Department of Energy – Alternative Energy Feasibility Study DOE-EE0002523 Washoe Tribe of Nevada and California Washoe Tribe Alternative Energy Feasibility Study Final Report
Transcript of Department of Energy - Alternative Energy Feasibility ... of Energy – Alternative Energy...

1
Department of Energy – Alternative Energy Feasibility Study
DOE-EE0002523
Washoe Tribe of Nevada and California
Washoe Tribe Alternative Energy Feasibility Study
Final Report

2
Executive Summary The Washoe Tribe of Nevada and California is a federally recognized Indian Tribe organized pursuant to the Indian Reorganization Act of June 18, 1934, as amended. The Tribe’s aboriginal territory extends to the west of Lake Tahoe Basin, north to Honey Lake, east in the Pine Nut Mountains and south to Antelope Valley, California. Tribal members continue to use resources within the aboriginal territory in the same manner as did their ancestors. The Tribe has four federally recognized communities (Stewart, Carson, Dresslerville, and Woodfords), three in Nevada and one in California. The Tribe also has jurisdiction over trust parcels and allotments in both Nevada and California. Each of the communities has a separate governing Community Council; overall, the Washoe Tribal Council governs the Tribe. The Washoe Environmental Protection Department (WEPD) was established in the Tribal government structure in 1998. WEPD is responsible for carrying out protection of natural and cultural resources and management for lands within the traditional territory and over 73,500 acres of trust and fee lands. It is the policy of the Washoe Tribe to protect, maintain, and enhance its natural resources for the benefit of present and future generations. The Washoe Tribe of Nevada and California was awarded funding to complete the Washoe Tribe Alternative Energy Feasibility Study project. The main goal of the project was to complete an alternative energy feasibility study. This study was completed to evaluate “the potential for development of a variety of renewable energy projects and to conduct an alternative energy feasibility study that determines which alternative energy resources have the greatest economic opportunity for the Tribe, while respecting cultural and environmental values” (Baker-Tilly, 2014). The Washoe Tribe selected a contractor to complete the Alternative Energy Comprehensive Feasibility Report. The main activities completed by the contractor in order to complete the report included:
Identifying potential renewable energy resources and development opportunities that could be realized by the Tribe.
Determining energy demand based on export market. Analyzing existing and new data of renewable energy resources on Tribal land including
solar, wind, geothermal, biomass, and biofuel. Identifying Tribal parcels best suited for alternative energy development by overlaying
the renewable energy resource maps with maps of Washoe Tribal lands to identify the best locations for potential projects.
Providing guidance to technical assistance options that will assist in the identification, preparation, financing, and commercialization of renewable energy project opportunities.
The study concluded that distributed generation solar projects are the best option for renewable energy development and asset ownership for the Washoe Tribe. Concentrating solar projects, utility scale wind projects, geothermal, and biomass resource projects were also evaluated during the study and it was determined that these alternatives would not be feasible at this time.

3
Project Overview Tribe: Washoe Tribe of Nevada and California Location: Gardnerville, NV Project Title: Washoe Tribe Alternative Energy Feasibility Study Type of Application: Feasibility DOE Grant Number: DE-EE0002523 Award Amount: DOE: $249,567.00 Awardee: $0.00 Total: $249,567.00 Project Status: Complete Project Period of Performance: April 2010 through July 2014
4
Objectives The Washoe Tribe has a long term energy vision and energy plan. The Washoe Tribe’s Energy Vision is:
To guarantee the availability of affordable and reliable energy to all its members To further the Tribe’s goals for self-sufficiency and self-determination through
empowerment in the Tribe’s energy interests To reduce the environmental impact of the Tribe’s energy consumption To promote conservation and efficient use of energy To produce all of the Tribe’s energy needs through renewable sources by 2025 And to contribute to the Washoe Tribe’s local economy consistent with the Tribe’s
overall mission which is “To achieve and ensure the integrity of an environment and way of life that is one with nature’s elements, community, traditions, and values that promote health and wellness for future generations.”
The long term energy goals of the Tribe include:
Goal 1: To guarantee the availability of affordable and reliable energy to all its members. Goal 2: To reduce the energy bills of tribal members and administration. Goal 3: To further the Tribe’s goals for self-sufficiency and self-determination through
empowerment in the Tribe’s energy interests. Goal 4: To minimize the environmental impact of current and/or future development. Goal 5: To produce all of the Tribe’s energy needs through renewable sources by 2025. Goal 6: To build sustainable homes and make existing buildings more efficient. Goal 7: To contribute to the Washoe Tribe’s local economy consistent with the Tribe’s
cultural values. The objectives of the Alternative Energy Feasibility Study project were to:
Determine the feasibility of a large-scale project by identifying transmission lines, determining possible load capacity demand, and discussing a power-purchase agreement with NV Energy.
Determine energy demand of administrative, commercial and residential buildings on tribal land
Determine energy demand based on export market. Collect and analyze existing and new data of renewable energy resources on Washoe
Tribal land including solar, wind, geothermal, biomass, and biofuels. Identify funding opportunities. Identify Tribal parcels best suited for alternative energy development.
A contractor was selected to complete the Alternative Energy Comprehensive Feasibility Study for the Tribe. The objectives of the alternative energy feasibility study were to:
Identify potential renewable energy resources and development opportunities that could be realized by the Tribe.
Determine energy demand based on export market. Analyze existing and new data of renewable energy resources on Tribal land including
solar, wind, geothermal, biomass, and biofuel.

5
Identify Tribal parcels best suited for alternative energy development by overlaying the renewable energy resource maps with maps of Washoe Tribal lands to identify the best locations for potential projects
Provide guidance to technical assistance options that will assist in the identification, preparation, financing, and commercialization of renewable energy project opportunities.

6
Description of Activities Performed The Washoe Environmental Protection Department (WEPD) completed data review, data analysis and worked closely with the selected contractor to complete the project activities. WEPD completed and reviewed several studies to evaluate potential alternative energy resources and evaluate impacts of potential projects. This included completion of an environmental assessment for installation of an anemometer in the Woodfords Community to evaluate the potential wind resource, review of DOE/BLM Solar Programmatic EIS, review of geothermal chemistry study near Hobo Hot Springs, review of Pyramid Lake Paiute Tribe geothermal well testing, completion of Washoe Tribe Energy Study Report, review of Western Regional Climate Center wind studies for Carson Valley and Alpine County, and review of Geothermal Feasibility Study completed through the Division of Energy and Mineral Development funding. WEPD coordinated and participated in site tours of several alternative energy resource facilities including Ormat Technologies Inc Steamboat complex, Moapa biomass site, Carson City Biomass Plant, and Bently Biofuels. WEPD researched opportunities to work with other organizations, local governments, and agencies regarding renewable energy resource information sharing. Staff collaborated with DOE Tribal Energy Department, NV Energy, local governments, agencies, and organizations throughout the project. Staff conducted several meetings throughout the project in order to accomplish project deliverables including meetings with Nevada State Office of Energy, University of Nevada Reno, Desert Research Institute, EPA, BLM, US Forest Service, and US Geological Service. Meetings provided the opportunity to review existing data, review potential alternative energy resources, discuss alternative energy goals, discuss surveying equipment, and discuss collaboration and funding opportunities. Staff also conducted Alternative Energy Task Force meetings and Nevada Inter-Tribal Energy Consortium meetings throughout the project period. Staff participated in several climate change and renewable energy webinars throughout the project. Staff participated in Western Regional Partnerships Energy and Tribal Relations Committee meetings. Staff coordinated with other Tribal departments and entities throughout the project including the Legal department, Planning department, Tribal Historic Preservation Office, Senior Site Council, and Washoe Cultural Resource Advisory Committee. Staff worked with NV Energy regarding transmission line locations and evaluations. Staff participated in several workshops and conferences throughout the project including the Annual DOE conference, NV Energy NV Focus Energy Efficiency Training and Certification Program 12 week workshop, Annual Renewable Energy Projects in Indian Country Conference, NV Energy Micro-hydro workshop, Tribal Lands and Environmental Forum, Annual Inter-Tribal Energy Tech Tour, and Strategic Energy Planning Workshop. The workshops and conferences provided opportunities for collaboration and information sharing. WEPD worked with web-based tools for potential siting of renewable energy projects including Wind Policy Comparison Tool (NREL), Landscape Assessment Tool (NREL), Ecosmart Landscape (USFS), and Solar Energy Environmental Mapper (BLM). Staff utilized the portfolio
7
manager website for energy data entry and evaluation of energy usage. Staff calculated and evaluated current Tribal energy demand. WEPD completed a request for proposals for a contractor to complete an alternative energy feasibility study for the Tribe. The Tribe selected a contractor and the contractor was approved by DOE. The contractor completed the Alternative Energy Comprehensive Feasibility Report for the Washoe Tribe. The contractor completed the following activities in order to complete the comprehensive report:
Evaluated Washoe Tribe’s renewable energy position. Evaluated State of Nevada and California’s renewable energy market. Evaluated the federal incentives, renewable energy tax credits, and State of Nevada
incentives. Evaluated utility scale renewable projects. Completed individual site suitability analysis of Tribal parcels including: Allotment 231,
Babbit Peak, Carson Community, Parcels A and C, Dresslerville Community/Washoe Ranch, Frank Parcel, Heidtman Purchase, Incline Village, Ladies Canyon, Lower Clear Creek, Mica Parcel, Olympic Valley, Silverado, Skunk Harbor, Stewart Community, Parcels G and H, Stewart Ranch, Uhalde, Upper Clear Creek, Wade Parcels, and Woodfords Community.
Completed review of photovoltaics solar energy, including technical analysis of site characteristics, conclusions on distributed generation solar feasibility, evaluation of utility-scale solar opportunity, completion of financial modeling tool, sensitivity analysis, conclusions on utility scale solar feasibility, and completion of environmental analysis.
Completed introduction and technical analysis of concentrating solar power energy. Completed technical analysis and environmental analysis of wind energy. Completed introduction, review, and technical analysis of geothermal energy. Completed introduction, review, and technical analysis of biomass energy. Completed organization analysis. Completed recommendations and conclusion.
The completed report included identification of Tribal parcels best suited for alternative energy development.

8
Conclusions and Recommendations The Washoe Tribe successfully completed all project activities including program administration, collaboration with DOE Tribal Energy Department, NV Energy, local government agencies, and organizations, review of available energy data, and assessment, analysis, and reporting. The project successfully completed the Alternative Energy Comprehensive Feasibility Report. The Alternative Energy Comprehensive Feasibility Report concluded that distributed generation solar projects are the most viable means of advancing the Washoe Tribe’s position in renewable energy development and asset ownership. The report stated that several of the “Washoe Tribal parcels may be technically suitable for utility-scale solar. However, given the current state of utility-scale solar in Nevada and California, spending internal capital on further development of utility-scale solar would not necessarily be advisable” (Baker Tilly, 2014). The completed report indicated that NV Energy’s Renewable Energy Landscape includes a goal of 25% RPS by 2025 and determined that NV Energy has exceeded requirements every year to this point. The report indicated that California’s Renewable Energy Portfolio Standards includes a goal of 33% RPS by 2020 and that the California utilities are anticipated to hit the targets. The completed report evaluated renewable energy tax credits and determined that credits offset a substantial portion of the cost of renewable projects. Renewable energy projects are difficult to finance without credits. The report evaluated the investment tax credit, tax equity structures, and New Market Tax credits. The report also evaluated other funding sources including IEED/DEMD Feasibility Grants, DOE Tribal Energy Program Funding, BIA Loan Guarantee Program, USDA REAP Program, and State of Nevada Revolving Loan Fund. The contractor provided example project finance schematics utilizing tax credits and/or grant funding. The report evaluated geothermal resources and determined that the existing resource doesn’t support utility scale projects. Direct use applications might be possible but subject to further detailed project review. The wind resource was evaluated and determined that there was limited resource availability on tribal lands. There is currently a minimal demand from a utility level perspective and the resource doesn’t compete well compared to the solar projects. The biomass resource (wood and/or crop residue) was evaluated. The report determined that there was an extremely limited resource available for self-supply. The report indicated that biomass has a very long, risky, and expensive development lifecycle. The completed feasibility report indicated that distributed generation solar project development was the best option for the Tribe. This conclusion was based on the Tribe’s experience with small scale solar projects, the excellent solar resource available on tribal lands, and the long asset life of solar; ensuring power to price stability over time.

9
The recommended next steps for the Washoe Tribe based on the completed Alternative Energy Comprehensive Feasibility Report include pursuit of more small scale solar projects, continued monitoring of future NV Energy RFP possibilities, and continued monitoring of potential direct use applications of geothermal resources.

Alternative Energy Study
Prepared for: Washoe Tribe of Nevada and California
Prepared by: Baker Tilly Virchow Krause, LLP May 2014

ALTERNATIVE ENERGY STUDY
ACKNOWLEDGEMENTS
ACKNOWLDEDGEMENTS
Baker Tilly Virchow Krause LLP (Baker Tilly) would like to acknowledge the assistance of the following individuals and their respective organizations with this project:
> Tara Hess, Washoe Tribe of California and Nevada
> Jennifer Johnson, Washoe Tribe of California and Nevada
> Mike Hardy, Lumos & Associates
> Rick Zehner, Geothermal Development Associates
CONTACT INFORMATION
Washoe Tribe of California and Nevada 919 Hwy 395 South Gardnerville, NV 89410 www.washoetribe.us
Lumos & Associates 800 College Pkwy Carson City, NV, US, 89706 www.lumosengineering.com Geothermal Development Associates 3740 Barron Way Reno, NV, US, 89511 www.gdareno.com

ALTERNATIVE ENERGY STUDY
TABLE OF CONTENTS (cont.)
i
1. EXECUTIVE SUMMARY ....................................................................................... 4
2. INTRODUCTION ................................................................................................... 6
BACKGROUND ..................................................................................................... 6
PURPOSE OF THE STUDY .................................................................................. 6
3. TRIBE’S RENEWABLE ENERGY POSITION ...................................................... 7
4. STATE OF NEVADA AND CALIFORNIA RENEWABLES MARKET ................. 9
NEVADA ................................................................................................................ 9
Energy Efficiency as an Eligible Resource ............................................... 11 350 Megawatt Requirement (NV Energy) ................................................. 12 Contacts .................................................................................................... 12
CALIFORNIA ....................................................................................................... 14
Net Metering (Nevada) .............................................................................. 16 Net Excess Generation ............................................................................. 16
5. FEDERAL AND STATE INCENTIVE OVERVIEW ............................................. 17
FEDERAL INCENTIVES ..................................................................................... 17
RENEWABLE ENERGY TAX CREDIT OVERVIEW ........................................... 17
Production tax credit (PTC) ....................................................................... 17 Investment tax credit (ITC) ........................................................................ 18 “Monetization” of tax credits and recent developments pertaining to tribal-
owned or leased-energy projects and tax credits ................................ 21 New Markets Tax Credits .......................................................................... 23 The Rural Energy for America Program (REAP) ...................................... 25 Office of Indian Energy and Economic Development Programs (IEED) ... 26 DOE Tribal Energy Program Grant Funding ............................................. 27 BIA Loan Guarantee Program ................................................................... 30
STATE OF NEVADA INCENTIVES ..................................................................... 31
Solar PV .................................................................................................... 31 Revolving loan program ............................................................................ 34
6. PROJECT FINANCE 101 – UTILITY SCALE RENEWABLE PROJECTS ........ 36
7. INDIVIDUAL SITE SUITABILITY ANALYSIS .................................................... 38
Allotment #231 .......................................................................................... 40 Babbit Peak ............................................................................................... 41 Carson Community.................................................................................... 42 Parcels A & C ............................................................................................ 43 Dresslerville Community/Washoe Ranch .................................................. 44

ALTERNATIVE ENERGY STUDY
TABLE OF CONTENTS (cont.)
ii
Frank Parcel .............................................................................................. 45 Heidtman Purchase ................................................................................... 46 Incline Village ............................................................................................ 47 Ladies Canyon .......................................................................................... 47 Lower Clear Creek .................................................................................... 48 Mica Parcel ................................................................................................ 49 Olympic Valley ........................................................................................... 50 Silverado ................................................................................................... 51 Skunk Harbor ............................................................................................ 52 Stewart Community ................................................................................... 52 Parcels G & H ............................................................................................ 53 Stewart Ranch ........................................................................................... 53 Uhalde ....................................................................................................... 55 Upper Clear Creek .................................................................................... 56 Wade Parcels (Upper and Lower) ............................................................. 57 Woodfords Community .............................................................................. 58
8. PHOTOVOLTAICS (PV) SOLAR ENERGY........................................................ 59
PV SOLAR OVERVIEW ...................................................................................... 59
TECHNICAL ANALYSIS ...................................................................................... 63
Site Characteristics ................................................................................... 63 Conclusions—Distributed Generation Solar Feasibility ............................ 69 Utility-scale solar opportunity .................................................................... 70
TECHNICAL ANALYSIS ...................................................................................... 71
Financial Modeling Tool; Utility Scale Solar Project .................................. 72 Sensitivity analysis .................................................................................... 73 Conclusions—Utility-Scale Solar Feasibility ............................................. 74
ENVIRONMENTAL ANALYSIS ........................................................................... 74
9. CONCENTRATING SOLAR POWER (CSP) ENERGY ...................................... 76
CSP INTRODUCTION ......................................................................................... 76
Concentrating Solar Power Basics ............................................................ 76 Solar Reserve’s “Crescent Dunes” project in Tonopah, NV, which is
estimated to cost just under $1 billion .................................................. 77
TECHNICAL ANALYSIS ...................................................................................... 78
10. WIND ENERGY ................................................................................................... 79
Figure 48. Estimated Wind Resource Potential for parcels within Washoe
Footprint ............................................................................................... 81
TECHNICAL ANALYSIS ...................................................................................... 81

ALTERNATIVE ENERGY STUDY
TABLE OF CONTENTS (cont.)
iii
ENVIRONMENTAL ANALYSIS ........................................................................... 82
11. GEOTHERMAL ENERGY ................................................................................... 83
GEOTHERMAL INTRODUCTION ....................................................................... 83
GEOTHERMAL HEATING AND COOLING ........................................................ 92
TECHNICAL ANALYSIS ...................................................................................... 94
Conclusions ............................................................................................... 97
12. BIOMASS ENERGY ............................................................................................ 98
BIOMASS INTRODUCTION ................................................................................ 98
Benefits of Using Biomass ........................................................................ 98 Landfill Gas Projects ............................................................................... 102
ENVIRONMENTAL ANALYSIS ......................................................................... 102
Conclusions ............................................................................................. 103
13. ORGANIZATIONAL ANALYSIS ....................................................................... 104
RENEWABLE ENERGY DEVELOPMENT STEPS ........................................... 104
14. CONCLUSIONS AND RECOMMENDATIONS ................................................ 107
ALTERNATIVE ENERGY STUDY
EXECUTIVE SUMMARY
4
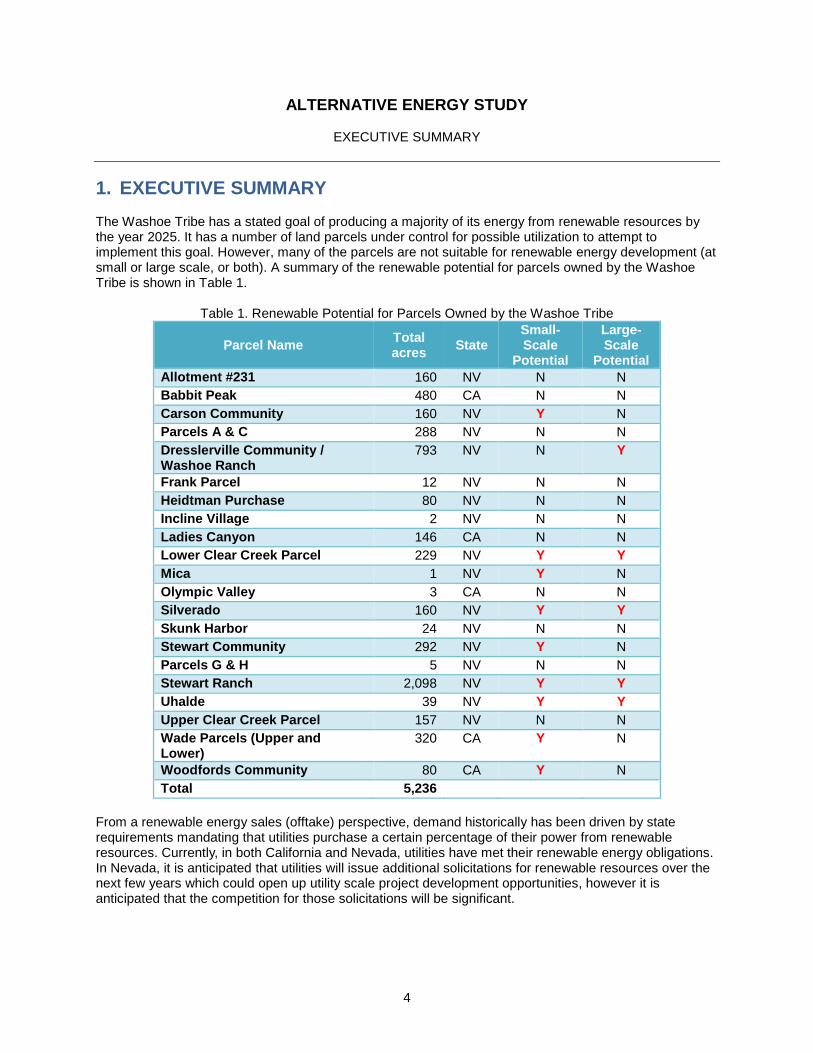
1. EXECUTIVE SUMMARY The Washoe Tribe has a stated goal of producing a majority of its energy from renewable resources by the year 2025. It has a number of land parcels under control for possible utilization to attempt to implement this goal. However, many of the parcels are not suitable for renewable energy development (at small or large scale, or both). A summary of the renewable potential for parcels owned by the Washoe Tribe is shown in Table 1.
Table 1. Renewable Potential for Parcels Owned by the Washoe Tribe
Parcel Name Total acres
State Small-Scale
Potential
Large-Scale
Potential Allotment #231 160 NV N N Babbit Peak 480 CA N N Carson Community 160 NV Y N Parcels A & C 288 NV N N Dresslerville Community / Washoe Ranch
793 NV N Y
Frank Parcel 12 NV N N Heidtman Purchase 80 NV N N Incline Village 2 NV N N Ladies Canyon 146 CA N N Lower Clear Creek Parcel 229 NV Y Y Mica 1 NV Y N Olympic Valley 3 CA N N Silverado 160 NV Y Y Skunk Harbor 24 NV N N Stewart Community 292 NV Y N Parcels G & H 5 NV N N Stewart Ranch 2,098 NV Y Y Uhalde 39 NV Y Y Upper Clear Creek Parcel 157 NV N N Wade Parcels (Upper and Lower)
320 CA Y N
Woodfords Community 80 CA Y N Total 5,236
From a renewable energy sales (offtake) perspective, demand historically has been driven by state requirements mandating that utilities purchase a certain percentage of their power from renewable resources. Currently, in both California and Nevada, utilities have met their renewable energy obligations. In Nevada, it is anticipated that utilities will issue additional solicitations for renewable resources over the next few years which could open up utility scale project development opportunities, however it is anticipated that the competition for those solicitations will be significant.
ALTERNATIVE ENERGY STUDY
EXECUTIVE SUMMARY (cont.)
5
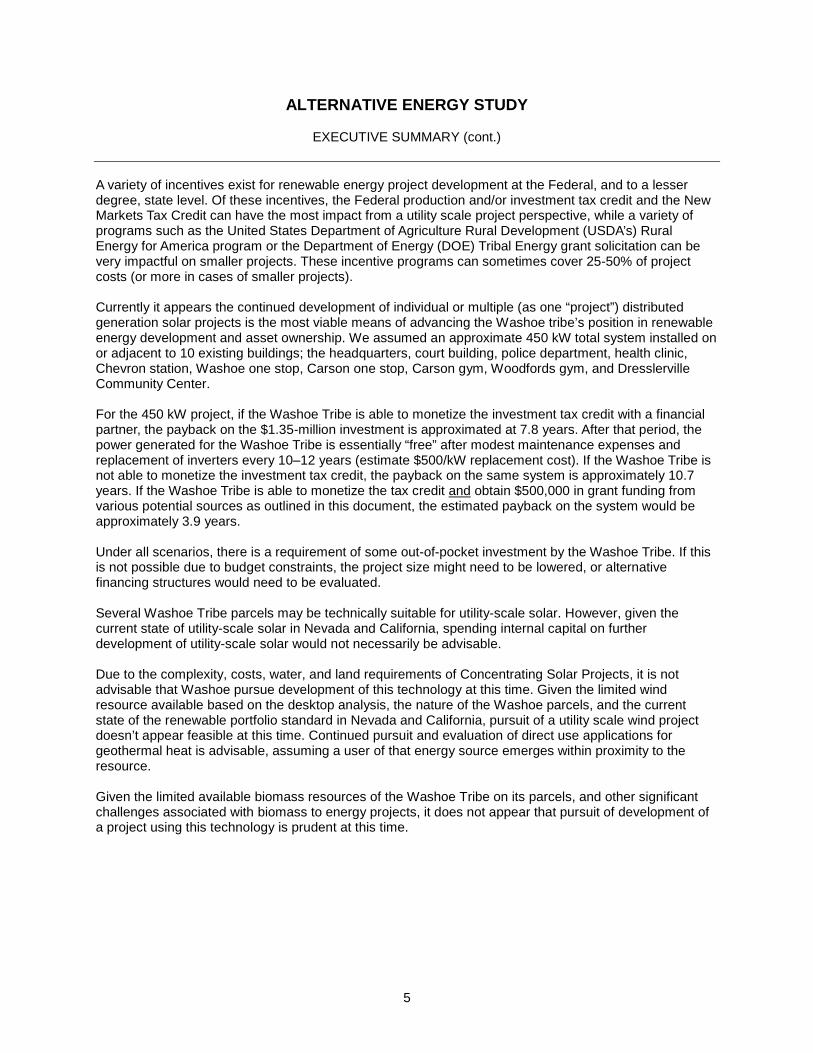
A variety of incentives exist for renewable energy project development at the Federal, and to a lesser degree, state level. Of these incentives, the Federal production and/or investment tax credit and the New Markets Tax Credit can have the most impact from a utility scale project perspective, while a variety of programs such as the United States Department of Agriculture Rural Development (USDA’s) Rural Energy for America program or the Department of Energy (DOE) Tribal Energy grant solicitation can be very impactful on smaller projects. These incentive programs can sometimes cover 25-50% of project costs (or more in cases of smaller projects). Currently it appears the continued development of individual or multiple (as one “project”) distributed generation solar projects is the most viable means of advancing the Washoe tribe’s position in renewable energy development and asset ownership. We assumed an approximate 450 kW total system installed on or adjacent to 10 existing buildings; the headquarters, court building, police department, health clinic, Chevron station, Washoe one stop, Carson one stop, Carson gym, Woodfords gym, and Dresslerville Community Center. For the 450 kW project, if the Washoe Tribe is able to monetize the investment tax credit with a financial partner, the payback on the $1.35-million investment is approximated at 7.8 years. After that period, the power generated for the Washoe Tribe is essentially “free” after modest maintenance expenses and replacement of inverters every 10‒12 years (estimate $500/kW replacement cost). If the Washoe Tribe is not able to monetize the investment tax credit, the payback on the same system is approximately 10.7 years. If the Washoe Tribe is able to monetize the tax credit and obtain $500,000 in grant funding from various potential sources as outlined in this document, the estimated payback on the system would be approximately 3.9 years. Under all scenarios, there is a requirement of some out-of-pocket investment by the Washoe Tribe. If this is not possible due to budget constraints, the project size might need to be lowered, or alternative financing structures would need to be evaluated. Several Washoe Tribe parcels may be technically suitable for utility-scale solar. However, given the current state of utility-scale solar in Nevada and California, spending internal capital on further development of utility-scale solar would not necessarily be advisable. Due to the complexity, costs, water, and land requirements of Concentrating Solar Projects, it is not advisable that Washoe pursue development of this technology at this time. Given the limited wind resource available based on the desktop analysis, the nature of the Washoe parcels, and the current state of the renewable portfolio standard in Nevada and California, pursuit of a utility scale wind project doesn’t appear feasible at this time. Continued pursuit and evaluation of direct use applications for geothermal heat is advisable, assuming a user of that energy source emerges within proximity to the resource. Given the limited available biomass resources of the Washoe Tribe on its parcels, and other significant challenges associated with biomass to energy projects, it does not appear that pursuit of development of a project using this technology is prudent at this time.

ALTERNATIVE ENERGY STUDY
EXECUTIVE SUMMARY (cont.)
6
2. INTRODUCTION BACKGROUND The Washoe Tribe of Nevada and California (Tribe) is a federally recognized tribal government, located at the base of the Sierra Nevada Mountains. Unlike many other tribes, the Tribe does not have a large reservation land base. Rather, it has several disconnected parcels (twenty-five, excluding allotment lands). PURPOSE OF THE STUDY The proposed project is to evaluate and document the potential for development of a variety of renewable energy projects and to conduct an alternative energy feasibility study that determines which alternative energy resources have the greatest economic opportunity for the Tribe, while respecting cultural and environmental values. The main activities of this study included, but were not limited, to: > Identify potential renewable energy resources and development opportunities that could be realized
by the Tribe
> Determine energy demand based on export market
> Analyze existing and new data of renewable energy resources on Tribal land including solar, wind, geothermal, biomass, and biofuel
> Identify Tribal parcels best suited for alternative energy development by overlaying the renewable energy resource maps with maps of Washoe Tribal lands to identify the best locations for potential projects
> Provide guidance to technical assistance options that will assist in the identification, preparation, financing, and commercialization of renewable energy project opportunities

ALTERNATIVE ENERGY STUDY
TRIBE’S RENEWABLE ENERGY POSITION
7
3. TRIBE’S RENEWABLE ENERGY POSITION The Washoe Tribe has a stated goal of producing a majority of its energy from renewable resources by the year 2025. The Washoe Tribe has been proactive in implementing small-scale renewables at various locations since May of 2011. Projects implemented to date are shown in Table 2.
Table 2. Washoe Tribe Renewable Projects Implemented to Date
Project Name Resource Type
Date of Implementation Project Capacity
Dresslerville Community Gym Solar October 2011 55.8 kW AC Stewart Community Center Solar January 2012 14.1 kW AC Stewart Community Headstart Solar January 2012 14.1 kW AC Health Clinic Solar October 2011 27.9 kW AC Dresslerville Community Center
Wind May 2011 1.2 kW AC
Stewart Community Headstart Wind May 2011 1.2 kW AC Continuing on that theme, the Washoe Tribe is primarily interested in pursuit of additional projects that can be both owned and operated by the Tribe. Secondarily, if the local utilities (specifically NV Energy) have an appetite to purchase power from renewable energy projects, the Washoe Tribe is interested in further determining if opportunities exist to develop utility-scale power projects on Tribal lands, whether independently, in a partnership with other developers, or purely as a lessor (akin to being a landlord to an independent asset owner) to a developer that would want to develop a project on Tribal-controlled parcels. Prior to this study performed by Baker Tilly in conjunction with the Tribe, the Tribe completed a preliminary Alternative Energy Feasibility Study around July of 2013 (Mistia Zuckerman). As part of that work and other work related to Tribal energy, the Tribe developed an Energy Vision that consists of the following key initiatives to:
> Guarantee the availability of affordable and reliable energy to all its members
> Further the Tribe’s goals for self-sufficiency and self-determination through empowerment in the Tribe’s energy interests
> Reduce the environmental impact of the Tribe’s energy consumption
> Promote conservation and efficient use of energy
> Contribute to the Washoe Tribe’s local economy consistent with the Tribe’s oval mission which is “To achieve and ensure the integrity of an environment and way of life that is one with nature’s elements, community, traditions, and values that promote health and wellness for future generations”
> Produce a majority of the Tribe’s energy needs through renewable resources by 2025
> Additional prior work efforts by Washoe Tribal staff included but have not been limited to:
> Ongoing meetings of the Alternative Energy Task Force
> Posting of information regarding energy project‒related activities
> Various training activities and seminars
ALTERNATIVE ENERGY STUDY
TRIBE’S RENEWABLE ENERGY POSITION (cont.)
8
> Research of opportunities available to work with other organizations, local governments, and agencies
> Significant geothermal energy research, and preliminary geothermal resource study/assessment performed by third-party consultant
> Work in organizing and collaborating with the Nevada Inter-Tribal Energy Consortium (NITEC) in an effort to:
> Assist in the development of renewable energy projects for Nevada tribes
> Research and coordinate technical assistance in energy-related projects
> Research and provide information on various funding sources and cooperative agreements for potential renewable energy projects
This feasibility is the next step in assisting the Tribe in accomplishing its goals and further providing a development roadmap for the future.

ALTERNATIVE ENERGY STUDY
STATE OF NEVADA AND CALIFORNIA RENEWABLE MARKET
9
4. STATE OF NEVADA AND CALIFORNIA RENEWABLES MARKET As the Tribe has parcels in the states of Nevada and California, evaluating the renewables markets in each state was deemed necessary. However, given the nature of the individual parcels as well as the number of parcels in Nevada versus California 5, emphasis was placed on the Nevada parcels and the overlying prior, current, and future Nevada renewables climate. NEVADA Nevada established a renewable portfolio standard (RPS) as part of its 1997 restructuring legislation. Under the standard, NV Energy (formerly Nevada Power and Sierra Pacific Power) must use eligible renewable energy resources to supply a minimum percentage of the total electricity it sells. In 2001, the state increased the minimum requirement by 2% every two years, culminating in a 15% requirement by 2013. The portfolio requirement has been subsequently revised, most significantly by SB 358 (2009), which increased the requirement to 25% by 2025. The 2009 amendments also raised the solar carve-out, requiring utilities to meet 6% of their portfolio requirement through solar energy beginning in calendar year 2016. The solar carve-out remains at 5% through the end of calendar year 2015. In addition to solar, qualifying renewable energy resources include biomass, geothermal energy, wind, certain hydropower, energy recovery processes, and waste tires. The following schedule is currently in effect: > 6% renewables/efficiency in 2005 and 2006
> 9% renewables/efficiency in 2007 and 2008
> 12% renewables/efficiency in 2009 and 2010
> 15% renewables/efficiency in 2011 and 2012
> 18% renewables/efficiency in 2013 and 2014
> 20% renewables/efficiency in 2015 through 2019
> 22% renewables/efficiency in 2020 through 2024
> 25% renewables/efficiency in 2025 and thereafter
The following figure provided by NV Energy is a graphical representation of the geographical distribution of current renewable energy assets (utility scale) operating in Nevada.

ALTERNATIVE ENERGY STUDY
STATE OF NEVADA AND CALIFORNIA RENEWABLE MARKET (cont.)
10
Figure 1. Map of NV Energy's Current Renewable Energy Assets in Nevada1
1 https://www.nvenergy.com/renewablesenvironment/renewables/images/renewables_map.pdf
ALTERNATIVE ENERGY STUDY
STATE OF NEVADA AND CALIFORNIA RENEWABLE MARKET (cont.)
11
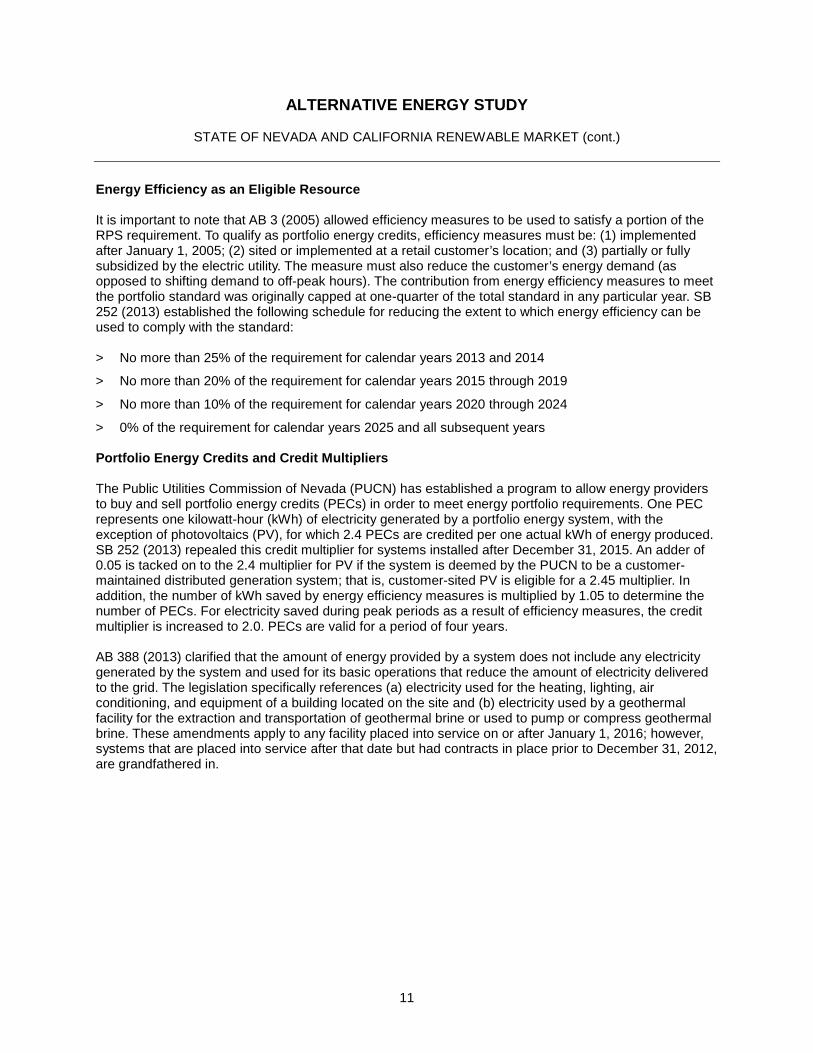
Energy Efficiency as an Eligible Resource It is important to note that AB 3 (2005) allowed efficiency measures to be used to satisfy a portion of the RPS requirement. To qualify as portfolio energy credits, efficiency measures must be: (1) implemented after January 1, 2005; (2) sited or implemented at a retail customer’s location; and (3) partially or fully subsidized by the electric utility. The measure must also reduce the customer’s energy demand (as opposed to shifting demand to off-peak hours). The contribution from energy efficiency measures to meet the portfolio standard was originally capped at one-quarter of the total standard in any particular year. SB 252 (2013) established the following schedule for reducing the extent to which energy efficiency can be used to comply with the standard: > No more than 25% of the requirement for calendar years 2013 and 2014
> No more than 20% of the requirement for calendar years 2015 through 2019
> No more than 10% of the requirement for calendar years 2020 through 2024
> 0% of the requirement for calendar years 2025 and all subsequent years
Portfolio Energy Credits and Credit Multipliers The Public Utilities Commission of Nevada (PUCN) has established a program to allow energy providers to buy and sell portfolio energy credits (PECs) in order to meet energy portfolio requirements. One PEC represents one kilowatt-hour (kWh) of electricity generated by a portfolio energy system, with the exception of photovoltaics (PV), for which 2.4 PECs are credited per one actual kWh of energy produced. SB 252 (2013) repealed this credit multiplier for systems installed after December 31, 2015. An adder of 0.05 is tacked on to the 2.4 multiplier for PV if the system is deemed by the PUCN to be a customer-maintained distributed generation system; that is, customer-sited PV is eligible for a 2.45 multiplier. In addition, the number of kWh saved by energy efficiency measures is multiplied by 1.05 to determine the number of PECs. For electricity saved during peak periods as a result of efficiency measures, the credit multiplier is increased to 2.0. PECs are valid for a period of four years. AB 388 (2013) clarified that the amount of energy provided by a system does not include any electricity generated by the system and used for its basic operations that reduce the amount of electricity delivered to the grid. The legislation specifically references (a) electricity used for the heating, lighting, air conditioning, and equipment of a building located on the site and (b) electricity used by a geothermal facility for the extraction and transportation of geothermal brine or used to pump or compress geothermal brine. These amendments apply to any facility placed into service on or after January 1, 2016; however, systems that are placed into service after that date but had contracts in place prior to December 31, 2012, are grandfathered in.

ALTERNATIVE ENERGY STUDY
STATE OF NEVADA AND CALIFORNIA RENEWABLE MARKET (cont.)
12
350 Megawatt Requirement (NV Energy) Senate Bill 123 (2013) requires NV Energy to retire 800 megawatts (MW) of coal-fired electric generating plants, in phases, by December 31, 2019. To offset these retirements, the legislation requires the utility to purchase, construct, or acquire 900 MW of power, in phases, from cleaner facilities. Of this total, 350 MW must come from new renewable energy facilities. By the end of years 2014, 2015, and 2016, the utility must issue request for proposals for 100 MW of generating capacity from new renewable energy facilities. The final 50 MW of generating capacity from new renewable energy facilities must be owned and operated by the utility, and construction must be completed by December 31, 2021. These requirements are separate from the 25% requirement under the RPS, and the PECs associated with these projects can be used to comply with the RPS. Contacts Contact information for the PUCN elated to the Nevada Renewable Portfolio requirements is as follows:
Mark Harris Public Utilities Commission of Nevada Engineering Division 1150 E. William Street Carson City, NV 89701 Phone: (775) 684-6165 Fax: (775) 684-6120 E-Mail: [email protected] Website: http://www.puc.nv.gov Darci Dalessio Public Utilities Commission of Nevada PEC Administrator Carson City, NV 89701 Phone 2: (775) 684-6171 E-Mail: [email protected] Website: http://www.puc.nv.gov
Nevada Power Company (serving the Las Vegas area) and Sierra Pacific Power Company (serving Northern Nevada) are the only two investor-owned electric utilities in the state of Nevada. Both are subsidiaries of NV Energy, which is wholly owned by MidAmerican Energy Holdings Company. Both investor-owned utilities do business under the NV Energy brand. These utilities serve a combined service territory of 45,592 square miles, all in the state of Nevada, and together they serve approximately 1.19 million customers, broken down as follows: 865,000 electric customers in Southern Nevada, 328,000 electric customers in northern Nevada, as well as 155,000 natural gas customers in Northern Nevada.

ALTERNATIVE ENERGY STUDY
STATE OF NEVADA AND CALIFORNIA RENEWABLE MARKET (cont.)
13
Both Nevada Power Company and Sierra Pacific Power met their 2013 RPS credit requirement, which mandates that 18% of retail sales must have been met with renewable energy resources and credits and 5% of that amount come from solar resources. The RPS is stated in terms of the number of Portfolio Energy Credits required for compliance. A PEC is equal to one kilowatt hour of renewable energy generated or one kilowatt hour of energy saved through an efficiency program. For NV Energy customers, the 2013 RPS required the utility to supply 3,813,192 kPECs, of which 190,660 kPECs were required to be supplied from solar resources. Nevada Power Company exceeded both requirements, supplying 4,317,683 eligible kPECs in total, of which 1,046,088 were solar energy credits. Nevada Power Company has surpassed the standard for four straight years. For Sierra Pacific Power customers, the 2013 RPS required the utility to supply 1,467,278 kPECs, of which 73,364 kPECs were required to be supplied from solar resources. Sierra Pacific Power has exceeded both requirements, supplying 2,825,015 eligible kPECs in total, of which 236,451 were solar energy credits. According to the most recent filings by Nevada Power Company (April 2014), the company plans to continue its past practice of offering to purchase certified PECs from residential properties and schools served by the utility. The terms of the 2014 offers in this regard will remain unchanged from 2013. However, the utility will make significant changes from and after the 2015 offer. Because the growing burden of administration and the declining need for the credits (among other factors), the utility will limit all offers after 2015 to only those customers who received and accepted Nevada Power’s offer in 2014. Relative to potential for future solicitations from Nevada Power Company, the following is an excerpt from its recent filing with the Nevada Public Utilities commission relative to its annual RPS compliance reporting2.
Although the number of pending projects is at a low point since Nevada Power began its annual compliance filings, that number is expected to increase significantly with the release of 2014, 2015, and 2016 renewable request for proposals and the upcoming Emission Reduction and Capacity Replacement filings under SB 123. While Nevada Power has recently experienced a high success rate in its contract renewable projects reaching commercial operations, and has either met or exceeded the RPS requirements in 2010, 2011, 2012, and now 2013, it must prepare for an increase in the Nevada Portfolio Standard. The RPS is schedule to increase by (2 percent) in 2015 to 20 percent. This increase, coupled with a decrease in the percentage of allowable DSM (Demand Side Management) credits from 25 to 20 percent of the total credit requirement, equates to an 18.5 percent increase in the number of non-DSM credits that will be needed to meet the 2015 compliance obligation. Unlike Sierra, Nevada Power does not have a large surplus of non-DSM credits that it can draw upon. Nevada Power must remain diligent and must continue to monitor the renewable portfolio for unexpected events that might hinder completion of remaining projects under development or continued successful operation of existing facilities. In addition, Nevada Power must closely monitor retail sales for any sudden increases that might affect the compliance forecast or any changes in Nevada’s renewable energy laws from potential future legislative action.
Further information regarding the current and future status of NV Energy’s compliance with the RPS can be found in docket numbers are 14-04001 and 14-04002 at http://www.puc.nv.gov.
2 https://www.nvenergy.com/renewablesenvironment/renewables/images/2013ComplianceReport.pdf

ALTERNATIVE ENERGY STUDY
STATE OF NEVADA AND CALIFORNIA RENEWABLE MARKET (cont.)
14
CALIFORNIA California’s largest investor-owned electric utilities are expected to slow the rate at which they procure renewable energy in the near term as they meet or draw near to meeting their regulatory mandates under the State’s renewable portfolio standard. Looking further out, demand could rebound once regulators and legislators define the post-2020 renewable portfolio standards. California’s renewable portfolio standard of 33% renewable power by 2020 has led to a decade-long boom in renewable energy project development. However, the state’s largest utilities—Pacific Gas and Electric Company (PG&E), Southern California Edison Company (SCE), and San Diego Gas and Electric (SDG&E) —have over-procured renewable power for the near term and claim to have enough projects under contract to meet most or all of the 2020 RPS mandate. The utilities’ assessments suggest limited contracting opportunities for renewable projects coming on line before 2020 as shown in Figure 2.

ALTERNATIVE ENERGY STUDY
STATE OF NEVADA AND CALIFORNIA RENEWABLE MARKET (cont.)
15
Figure 2. RPS Forecasts for California's Largest Investor-owned3
3 Source: Chadbourne & Parke Project Finance Newswire, April 2014

ALTERNATIVE ENERGY STUDY
STATE OF NEVADA AND CALIFORNIA RENEWABLE MARKET (cont.)
16
Net Metering (Nevada) Net metering is a service to an electric consumer under which electric energy generated by that electric consumer from an eligible on-site generating facility and delivered to the local distribution facilities may be used to offset electric energy provided by the electric utility to the electric consumer during the applicable billing period. Net metering policies can vary significantly by state. Nevada's original net-metering law for renewable-energy systems was enacted in 1997 and amended in 2001, 2003, 2005, 2007, 2011, and 2013. Systems up to one megawatt (MW) in capacity that generate electricity using solar, wind, geothermal, biomass and certain types of hydropower are generally eligible, although systems greater than 25 kilowatts (kW) in capacity may be subject to certain costs at the utility's discretion. Systems must be designed to offset part or all of a customer-generator's electricity requirements. A system is not eligible for net metering if its generating capacity exceeds the greater of (1) the limit on demand that the class of customer of the customer-generator may place on the utility's system, or (2) 100% of the customer's annual electricity demand. Each investor-owned utility operating in Nevada must offer net metering until the aggregate capacity of all net-metered systems in the state equals 3% of the peak capacity of all utilities operating in the state. For net-metered systems up to 25 kW, utilities must offer the customer-generator a meter capable of registering the flow of electricity in two directions. The utility may not charge these customer-generators any fee that would increase their minimum monthly charges to an amount greater than that of other customers in the same rate class. For net-metered systems greater than 25 kW, the utility may require a customer-generator to install—at its own cost—a meter capable of measuring generation output and customer load. In addition, a utility may require a customer-generator to pay for any upgrades to the utility's system (excluding standby charges) that are required to make the customer's system compatible with the utility's system. Net Excess Generation For all net-metered systems, customer net excess generation (NEG) is carried over to the following month as a kilowatt-hour (kWh) credit indefinitely. If the cost of purchasing and installing a net-metered system is paid for in whole or in part by a utility, then the electricity generated by the system will be considered to be generated by the utility or acquired from a renewable-energy system for the purpose of complying with the state's renewable portfolio standard (RPS). On the other hand, if the cost of purchasing and installing the system was paid for entirely by a customer, the PUC will issue to the customer portfolio energy credits (PECs). If a customer is billed for electricity under a time-of-use schedule, any customer NEG during a given month will be carried forward to the same time-of-use period as the time-of-use period in which it was generated, unless the subsequent billing period lacks a corresponding time-of-use period. If there is no corresponding time-of-use period, then the NEG carried forward must be apportioned evenly among the available time-of-use periods. Excess generation fed to the grid is considered electricity generated or acquired by the utility to comply with Nevada's energy portfolio standard.

ALTERNATIVE ENERGY STUDY
FEDERAL AND STATE INCENTIVE OVERVIEW
17
5. FEDERAL AND STATE INCENTIVE OVERVIEW FEDERAL INCENTIVES Favorable tax and other financial incentives are a significant catalyst to the feasibility and ultimate growth of various renewable energy applications. Financial incentives for renewable energy projects include various tax credits, accelerated depreciation tax benefits, feasibility and/or implementation grants, project development assistance, special utility tariffs to support renewable energy, and other state and utility-driven benefit programs. The ability to identify viable sources of financial assistance can significantly improve project economics and may ultimately determine the success of a renewable energy business plan. A model of nontraditional financing, leveraging as many credits and incentives as possible, is an attractive option more often than not, especially for those entities that do not have the internal capital to make investments of this nature, even if those investments provide reasonable payback periods and other tangible and intangible benefits. These avenues are often underutilized. However, if these avenues can be accessed and properly structured, they can lower financing costs, increase investment returns, and enhance cash flow. A strategic look at financing options, potentially incorporating credits and incentives, simply puts more bottom-line control in a developer’s hands. RENEWABLE ENERGY TAX CREDIT OVERVIEW
Production tax credit (PTC) Originally established by the 1992 Energy Policy Act, the PTC provides tax credits for each megawatt-hour (MWh) of electricity a qualifying project generates. For each MWh produced, the renewable energy project’s owner receives a tax credit that can be applied directly to its tax bill. The PTC incentive is production-based: the more hours a project produces power and the more MWh it produces, the more credits it generates. The credit applies only to the first 10 years of the project’s life, but increases to keep pace with inflation. Today that credit is roughly $23/MWh for wind projects and $11.5/MWh for open-loop biomass or waste-to-energy projects.
ALTERNATIVE ENERGY STUDY
FEDERAL AND STATE INCENTIVE OVERVIEW (cont.)
18
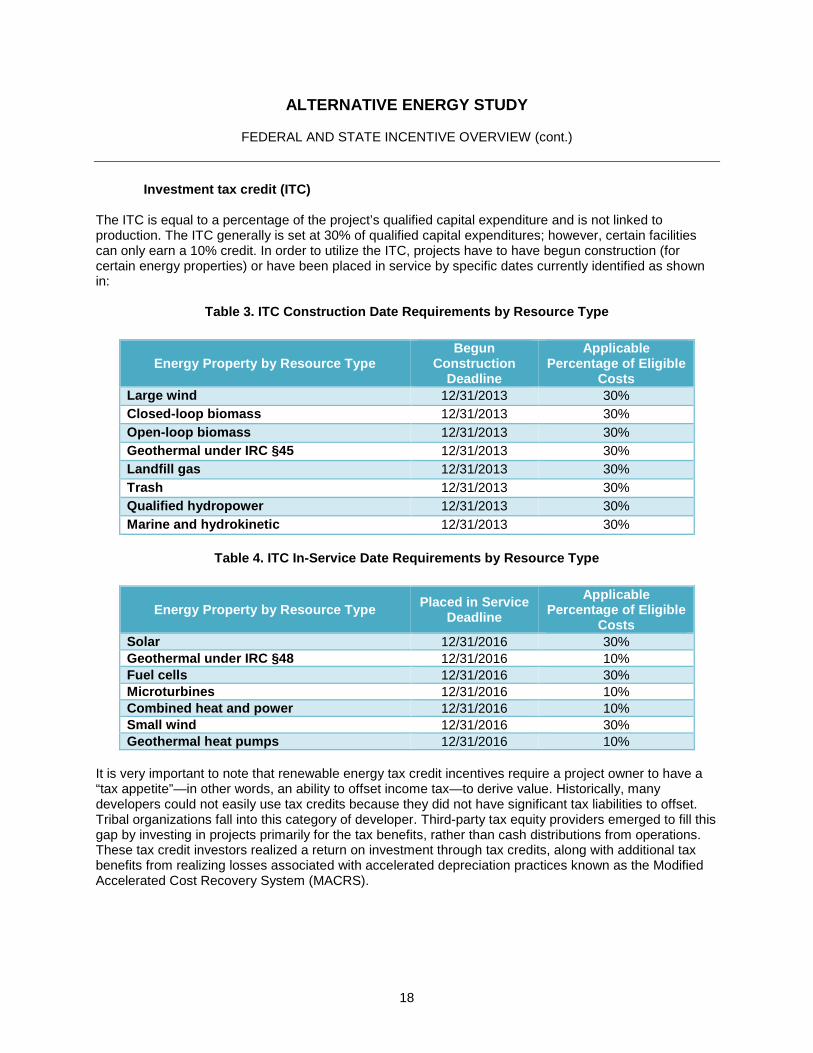
Investment tax credit (ITC) The ITC is equal to a percentage of the project’s qualified capital expenditure and is not linked to production. The ITC generally is set at 30% of qualified capital expenditures; however, certain facilities can only earn a 10% credit. In order to utilize the ITC, projects have to have begun construction (for certain energy properties) or have been placed in service by specific dates currently identified as shown in:
Table 3. ITC Construction Date Requirements by Resource Type
Energy Property by Resource Type Begun
Construction Deadline
Applicable Percentage of Eligible
Costs Large wind 12/31/2013 30% Closed-loop biomass 12/31/2013 30% Open-loop biomass 12/31/2013 30% Geothermal under IRC §45 12/31/2013 30% Landfill gas 12/31/2013 30% Trash 12/31/2013 30% Qualified hydropower 12/31/2013 30% Marine and hydrokinetic 12/31/2013 30%
Table 4. ITC In-Service Date Requirements by Resource Type
Energy Property by Resource Type Placed in Service Deadline
Applicable Percentage of Eligible
Costs Solar 12/31/2016 30% Geothermal under IRC §48 12/31/2016 10% Fuel cells 12/31/2016 30% Microturbines 12/31/2016 10% Combined heat and power 12/31/2016 10% Small wind 12/31/2016 30% Geothermal heat pumps 12/31/2016 10%
It is very important to note that renewable energy tax credit incentives require a project owner to have a “tax appetite”—in other words, an ability to offset income tax—to derive value. Historically, many developers could not easily use tax credits because they did not have significant tax liabilities to offset. Tribal organizations fall into this category of developer. Third-party tax equity providers emerged to fill this gap by investing in projects primarily for the tax benefits, rather than cash distributions from operations. These tax credit investors realized a return on investment through tax credits, along with additional tax benefits from realizing losses associated with accelerated depreciation practices known as the Modified Accelerated Cost Recovery System (MACRS).

ALTERNATIVE ENERGY STUDY
FEDERAL AND STATE INCENTIVE OVERVIEW (cont.)
19
MACRS allows tangible property to be depreciated on an accelerated basis according to a detailed schedule specified by the Internal Revenue Service (IRS). For example, anaerobic digesters are considered seven-year property and depreciated over the course of eight years. The non-cash impact of increased depreciation expenses in the early years of a project allows the project to generate significant losses from a tax standpoint, while remaining healthy from a cash-flow perspective. Such losses, when taken on by an investor with significant profits from other business interests, may derive value by decreasing the company’s overall profitability and subsequent tax liability.
Table 5. MACRS Depreciation Schedule
Yr 1 Yr 2 Yr 3 Yr 4 Yr 5 Yr 6 Yr 7 Yr 8 MACRS 14.29% 24.49% 17.49% 12.49% 8.93% 8.92% 8.93% 4.46%
Most renewable energy projects must seek out tax credit investments as a primary financing strategy. The US Partnership for Renewable Energy Finance (US PREF), a program of the American Council on Renewable Energy (ACORE), conducted its own study on the historical and projected size of the US tax equity market.4 The US PREF analysis concluded that tax equity investment demand for project financing will continue to outweigh supply of available tax equity from established investors. While somewhat dated, excerpts from the US PREF analysis as follows suggests that other potential new tax credit investors could emerge based on substantial tax burdens that exist within their respective organizations. Investor-owned utilities are a key market segment included in the analysis based on substantial tax burdens along with perceived industry understanding and alignment. It remains to be seen if new participants will join the ranks of renewable energy tax credit investors, but logic suggests new participants will emerge.
4 US Partnership for Renewable Energy Finance. ITC Cash Grant Market Observations. http://uspref.org/wp-content/uploads/2011/07/US-PREF-ITC-Grant-Market-Observations-12.1.2011-v2.pdf.

ALTERNATIVE ENERGY STUDY
FEDERAL AND STATE INCENTIVE OVERVIEW (cont.)
20
The following charts were included in the whitepaper, “The Return—and returns—of tax equity for US renewable projects”2 by Bloomberg New Energy Finance as an illustration of tax credit equity need and potential supply.
Figure 3. Bloomberg and US PREF Tax Equity Supply and Demand Charts5
5 The Return-and returns-of tax equity for US renewable projects. Bloomberg New Energy Finance. November 21 2011.
ALTERNATIVE ENERGY STUDY
FEDERAL AND STATE INCENTIVE OVERVIEW (cont.)
21
“Monetization” of tax credits and recent developments pertaining to tribal-owned or leased-energy projects and tax credits
The IRS released a ruling in 2013 that seemingly opens the door to Indian tribes playing a much larger role in renewable power projects. It potentially allows an Indian tribal government to be an owner or lessee of these projects. The rationale: An Indian tribal government is not a governmental unit or tax-exempt organization for purposes of tax subsidies. Industry had generally assumed that, because they do not pay taxes, Indian tribal governments could not effectively participate in renewables projects. Tax-exempt and governmental entities generally do not pay taxes, so the benefits present little value to them. In 1984, the Federal government passed a series of rules—“the Pickle rules”—that make it difficult for non-taxpayers to get the benefit of subsidies, directly or indirectly. The rules do not apply to persons that could be taxpayers if they only had income. These rules essentially disallow certain tax credits for property considered to be used by these non-taxpayers. These rules were designed to prevent tax-exempts from monetizing tax benefits, but never paying the government back through taxes. The IRS reasoned in the recent ruling that the tribal government could join with the lessee to permit the lessee to claim the investment credit. A lessor may let a lessee claim a credit only if the lessor was eligible for the credit itself. The IRS ruled that the tribe was not a “governmental entity,” and, since the income tax rules do not apply to tribes, there was nothing from which the tribe could be exempt. This meant that the Pickle rules described above did not apply to the tribe and it was eligible for the credit. By choosing to rule that the tribe was not subject to the Pickle rules, it appears the IRS made way for increased opportunities for Indian tribes to participate in renewable energy projects. Although Indian tribes cannot take advantage of the tax benefits because they do not pay taxes, it appears that the IRS believes a tribe can own a renewable project without causing it to be considered tax-exempt use property. Like tax-exempt and governmental entities, most developers cannot use tax benefits efficiently, either because they do not have tax liabilities or because they are subject to special rules that make it hard for all but the wealthiest of individuals and large corporations to use them. Large corporations are usually the best users of tax benefits because they have very few limitations on using tax credits. For this reason, developers often barter the tax benefits to someone who can use them immediately as an efficient way to raise capital. Indian tribes may be able to raise capital the same way. There are three common ways to barter tax benefits AND still retain control over the facility: a partnership-flip transaction, a sale-leaseback transaction, or an “inverted” lease. In a partnership flip (for example), an investor either would purchase an interest in a limited liability company (LLC) that owns the facility or make a contribution to the LLC in exchange for an interest in the LLC. For tax purposes, the LLC would turn into a partnership when the investor becomes a member. The economic returns (including the tax credit), except possibly cash, would be allocated 99% to the investor. Once the investor reaches its specified return, its share of the deal would flip down to 5%. Because an Indian tribe is not a tax-exempt entity, its participation in a partnership with shifting profits will not cause the project to be tax-exempt use property, and the tax benefits can potentially be preserved.

ALTERNATIVE ENERGY STUDY
FEDERAL AND STATE INCENTIVE OVERVIEW (cont.)
22
Figure 4. Tax-Equity Structures: Partnership Flip6
An inverted lease passes the tax credit to an investor who leases the facility from the tribe. This is the structure described in the IRS ruling. The tribe generally maintains operating control of the facility. After the five-year tax credit period is over, the lease term ends, and the facility is returned to the tribe.
6 Chadbourne & Parke LLP

ALTERNATIVE ENERGY STUDY
FEDERAL AND STATE INCENTIVE OVERVIEW (cont.)
23
Figure 5. Tax-Equity Structures: Inverted Lease7
New Markets Tax Credits The New Markets Tax Credit (NMTC) program was enacted by the Community Renewal Tax Relief Act of 2000 (P.L. 106-554, 113 Stat. 2763) to provide an incentive to stimulate investment in low-income communities (LIC). The original allocation authority eligible for the NMTC program was $15 billion from 2001 to 2007.8 Subsequently, Congress has increased the total allocation authority to $23 billion and extended the program through 2009. Qualified investment groups apply to the US Department of the Treasury’s Community Development Financial Institutions Fund (CDFI) for an allocation of the NMTC. The investment group, known as a Community Development Entity (CDE), seeks taxpayers to make qualifying equity investments in the CDE. The CDE then makes equity investments in LICs and LIC businesses, all of which must be qualified. After the CDE is awarded a tax credit allocation, the CDE is authorized to offer the tax credits to private equity investors in the CDE. The tax credit value is 39% of the cost of the qualified equity investment and is claimed over a seven-year credit allowance period. In each of the first three years of the investment, the investor receives a credit equal to 5% of the total amount paid for the stock or capital interest at the time of purchase. For the final four years, the value of the credit is 6% annually. Investors must retain their interest in a qualified equity investment throughout the seven-year period.
7 Chadbourne & Parke LLP 8 http://www.hud.gov/offices/cpd/economicdevelopment/lawsandregs/laws/actof2000.pdf

ALTERNATIVE ENERGY STUDY
FEDERAL AND STATE INCENTIVE OVERVIEW (cont.)
24
Table 6. Historical NMTC Placements
Round Year Awards Amount ($ bil)
Avg. Award ($ mil)
1 2001-2002 66 $2.5 $38
2 2003-2004 63 $3.5 $56
3 2005 41 $2.0 $48
4 2006 63 $4.1 $65
5 2007 61 $3.9 $64
6 2008 70 $3.5 $50
7 2009 32 $1.5 $47
8 2009 99 $5.0 $50
9 2010 99 $3.5 $35
10 2011 70 $3.5 $50
11 2012 85 $3.5 $41
Total 664 $36.5 $50 (avg.) The following figure has been included to demonstrate the financial impact of a NMTC allocation to a project from an upfront cash perspective.
Figure 6. Critical NMTC clarification
Several online mapping tools exist to make a determination of whether or not a project lies in an eligible NMTC census tract. One such tool can be found at http://www.bakertilly.com/landing/nmtc-lihtc-mapping-tool.

ALTERNATIVE ENERGY STUDY
FEDERAL AND STATE INCENTIVE OVERVIEW (cont.)
25
Below is an example result of a search for census tract eligibility in the area of Washoe controlled parcels:
Figure 7. Census Tract Eligibility Map of Areas near Washoe Controlled Parcels9
The Rural Energy for America Program (REAP) The USDA Rural Energy for America Program (REAP) provides assistance to agricultural producers and rural small businesses through loan guarantees and grants for renewable energy projects.
9 Source: http://www.bakertilly.com/landing/nmtc-lihtc-mapping-tool
ALTERNATIVE ENERGY STUDY
FEDERAL AND STATE INCENTIVE OVERVIEW (cont.)
26
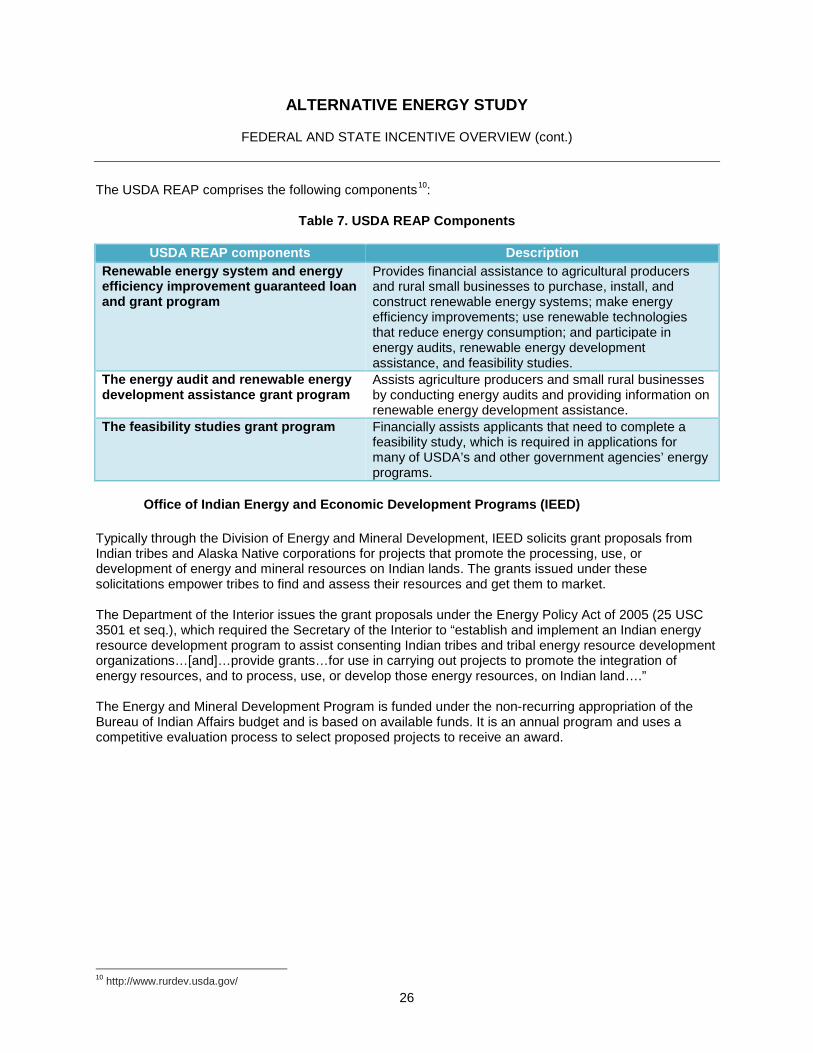
The USDA REAP comprises the following components10:
Table 7. USDA REAP Components
USDA REAP components Description Renewable energy system and energy efficiency improvement guaranteed loan and grant program
Provides financial assistance to agricultural producers and rural small businesses to purchase, install, and construct renewable energy systems; make energy efficiency improvements; use renewable technologies that reduce energy consumption; and participate in energy audits, renewable energy development assistance, and feasibility studies.
The energy audit and renewable energy development assistance grant program
Assists agriculture producers and small rural businesses by conducting energy audits and providing information on renewable energy development assistance.
The feasibility studies grant program Financially assists applicants that need to complete a feasibility study, which is required in applications for many of USDA’s and other government agencies’ energy programs.
Office of Indian Energy and Economic Development Programs (IEED)
Typically through the Division of Energy and Mineral Development, IEED solicits grant proposals from Indian tribes and Alaska Native corporations for projects that promote the processing, use, or development of energy and mineral resources on Indian lands. The grants issued under these solicitations empower tribes to find and assess their resources and get them to market. The Department of the Interior issues the grant proposals under the Energy Policy Act of 2005 (25 USC 3501 et seq.), which required the Secretary of the Interior to “establish and implement an Indian energy resource development program to assist consenting Indian tribes and tribal energy resource development organizations…[and]…provide grants…for use in carrying out projects to promote the integration of energy resources, and to process, use, or develop those energy resources, on Indian land….” The Energy and Mineral Development Program is funded under the non-recurring appropriation of the Bureau of Indian Affairs budget and is based on available funds. It is an annual program and uses a competitive evaluation process to select proposed projects to receive an award.
10 http://www.rurdev.usda.gov/

ALTERNATIVE ENERGY STUDY
FEDERAL AND STATE INCENTIVE OVERVIEW (cont.)
27
An example of recent awards by IEED (March 2014) for predevelopment activities, including feasibility work is shown in Table 8.
Table 8. Recent Awards by IEED for Predevelopment Activities
Indian Tribe Name Resource Type Location Bad River Band of the Lake Superior Tribe of Chippewa
Biomass Odanah, WI
Blue Lake Rancheria Biomass Blue Lake, CA
Blue Lake Rancheria WiSolHy Blue Lake, CA
Bois Forte Band of Chippewa Biomass DH Nett Lake, MN
Crow Tribe Hydro Renewable Crow Agency, MT
Crow Creek Sioux Tribe Wind Fort Thompson, SD
Eastern Band of Cherokee Indians
WTE Cherokee, NC
Fond du Lac Band of Lake Superior Chippewa
Biomass Cloquet, MN
Ho-Chuck Nation WTE Black River Falls, WI
Pueblo de Cochiti Multi Cochiti Pueblo, NM
The Shoshone Bannock Tribes Hydro Fort Hall, ID
Tule River Tribe Hydro Porterville, CA
DOE Tribal Energy Program Grant Funding
The Tribal Energy Program, under the US Department of Energy's (DOE's) Office of Energy Efficiency and Renewable Energy (EERE), promotes tribal energy sufficiency, and fosters economic development and employment on tribal lands through the use of renewable energy and energy efficiency technologies. Table 8 shows an overview of historical program funding from 2002 – 2012 for the Tribal Energy Program.

ALTERNATIVE ENERGY STUDY
FEDERAL AND STATE INCENTIVE OVERVIEW (cont.)
28
Figure 8. DOE Tribal Energy Program Funding History11
11 Source: DOE EERE.

ALTERNATIVE ENERGY STUDY
FEDERAL AND STATE INCENTIVE OVERVIEW (cont.)
29
The most recent round of funding (2013) awarded grants to the following tribes as shown in Table 9.
Table 9. Summary of 2013 Funding Grants awarded to Tribes
ALTERNATIVE ENERGY STUDY
FEDERAL AND STATE INCENTIVE OVERVIEW (cont.)
30
BIA Loan Guarantee Program In an effort to assist Indian tribes and individuals to establish or expand Indian-owned businesses, and to move toward self-sufficiency, Congress passed the Indian Financing Act of 1974. The Act was established to provide reservation businesses with access to investment capital equal to that available to businesses in non-reservation areas. The Program is open to federally recognized American Indian tribes or Alaska Native groups, individually enrolled members of such tribes or groups, or a business organization with no less than 51% ownership by American Indians or Alaska Natives. The borrower’s business must be located on or near a federally recognized Indian reservation, or recognized service area, and must contribute to the economy of the reservation or service area. Any lending institution, including Community Development Financial Institutions, may obtain a guaranty provided that the institution is regularly engaged in making business loans and has a capacity for evaluating and servicing loans that is satisfactory to the program. Here are some of the key points of understanding relative to the Program: > The percentage of a loan that is guaranteed or insured is the minimum necessary to obtain financing,
but may not exceed 90% of the unpaid principal balance and interest.
> Borrower cannot be delinquent on any federal debt obligation.
> Borrower must be projected to have at least 20% equity in the business being financed immediately after the loan is funded.
> Loans may be used for a variety of purposes including operating capital, equipment purchases, business refinance, building construction, and lines of credit.
> The maximum loan that can be guaranteed for individuals is $500,000; however, the Program can guarantee loans of greater amounts for tribes, tribal enterprises, or business entities, subject to Program and policy limitations.
> The maturity of a loan is determined by the lending institution, based upon the use of the loan proceeds and the repayment capacity of the borrower; however, the loan term cannot exceed 30 years.
> Interest rates are determined by the lending institution but are subject to reasonable limitations established by policy.
> The lending institution must pay a one-time premium payment of 2% of the guaranteed portion of a loan; however, the lending institution may charge the premium to the borrower as a one-time fee, or add the premium to the loan amount.

ALTERNATIVE ENERGY STUDY
FEDERAL AND STATE INCENTIVE OVERVIEW (cont.)
31
STATE OF NEVADA INCENTIVES The Nevada Legislature created several programs to encourage the development of renewable energy in Nevada. The programs offer rebates to customers for installing solar and wind systems on residential property, at small businesses, on public buildings or at schools, and waterpower systems for use in agricultural settings and on tribal lands. The PUCN has created regulations that govern these programs; each year, participating utilities request PUCN approval of their annual plans for each program.
Solar PV The Nevada Legislature created the current version of the Solar Energy Systems Incentive Program (Solar Program) during the 2007 legislative session to encourage the development of renewable energy. The Solar Program requires public utilities that supply electricity in Nevada to develop and administer programs that offer rebates to customers who install qualifying solar energy systems on their property. Here are the key points related to the Solar Program: > The Solar Program is defined by the Legislature in NRS 701B.010 - 701B.280.
> The PUCN regulates the Solar Program through regulations adopted in NAC 701B.050 - 701B.185 and through examining the utilities' annual plan filings.
> The Solar Program is subject to changes made by the Nevada Legislature and the PUCN.
> The Solar Program has three categories of participation: 1) school property, 2) public and other property, and 3) private residential and small business property.
> The dollar amounts of incentive payments available to Solar Program participants, based on the categories listed above, are defined in NAC 702B.150. Available incentives decline in value over time.
> A utility may award a total of $255,270,000 in incentive funding for the period beginning July 1, 2010, and ending June 30, 2021.
> The Solar Program is funded by ratepayers of NV Energy through the Renewable Energy Program Rate charge on their monthly bills.
> Customers who receive an incentive payment for a qualifying solar system must assign ownership of the portfolio energy credits (PECs) generated by the system to the electric utility administering the incentive program.

ALTERNATIVE ENERGY STUDY
FEDERAL AND STATE INCENTIVE OVERVIEW (cont.)
32
Maps of solar projects that have taken advantage of this program in nearby Washoe, Douglas, and Lyon counties are shown in Figure 9.
Figure 9. Map of Solar Projects in Washoe, Douglas, and Lyon Counties
12 Washoe County: 513 PV Systems Average Size: 22.2 kW (AC) Average Price: $5.81/Watt (AC) Douglas County: 106 PV Systems Average Size: 11.4 kW (AC) Average Price: $5.81/Watt (AC) Lyon County: 40 PV Systems Average Size: 30.4 kW (AC) Average Price: $4.88/Watt (AC)
12 Source: PowerClerk

ALTERNATIVE ENERGY STUDY
FEDERAL AND STATE INCENTIVE OVERVIEW (cont.)
33
Additional technologies are eligible under essentially the same program rolled up by NV Energy under the program name “Renewable Generations.” To date, most of the incentives available through the Solar Program have been paid out to solar or wind energy projects.
Figure 10. Solar PV Incentives Paid through NV Energy's Renewable Generations Program13
13 Source: PUCN website.
ALTERNATIVE ENERGY STUDY
FEDERAL AND STATE INCENTIVE OVERVIEW (cont.)
34
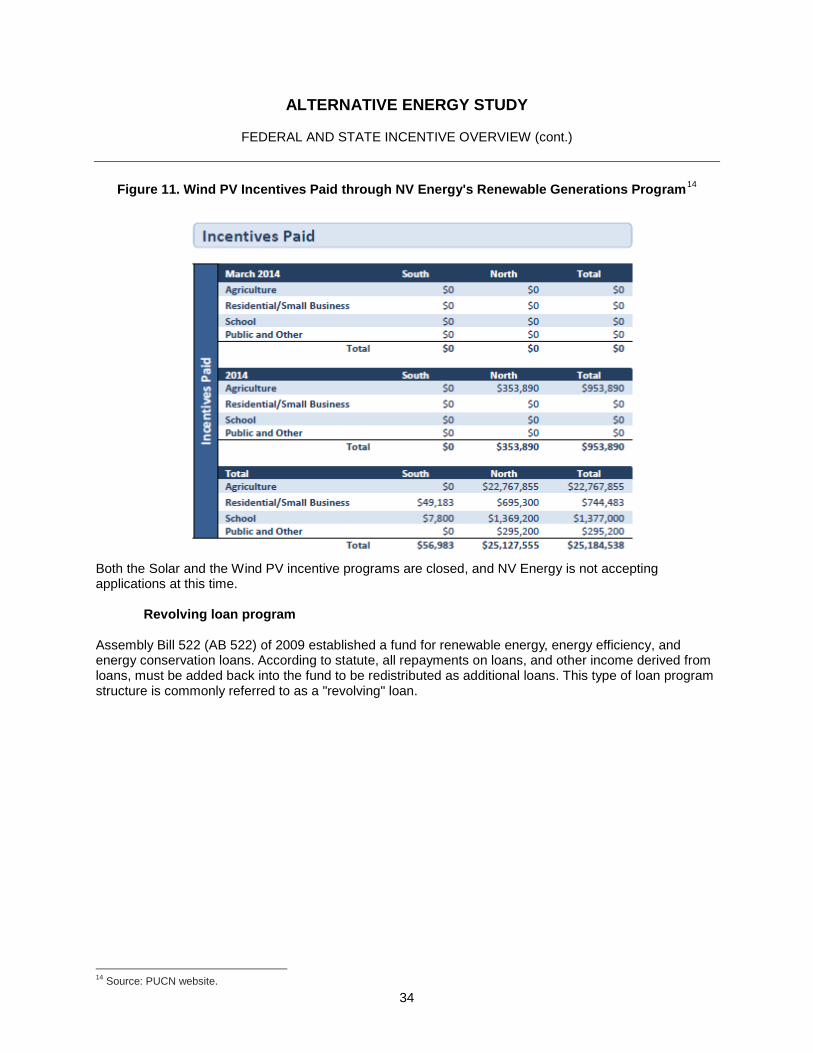
Figure 11. Wind PV Incentives Paid through NV Energy's Renewable Generations Program14
Both the Solar and the Wind PV incentive programs are closed, and NV Energy is not accepting applications at this time.
Revolving loan program
Assembly Bill 522 (AB 522) of 2009 established a fund for renewable energy, energy efficiency, and energy conservation loans. According to statute, all repayments on loans, and other income derived from loans, must be added back into the fund to be redistributed as additional loans. This type of loan program structure is commonly referred to as a "revolving" loan.
14 Source: PUCN website.

ALTERNATIVE ENERGY STUDY
FEDERAL AND STATE INCENTIVE OVERVIEW (cont.)
35
A list of projects funded under this program is shown in Table 10. The overall portfolio consists of more than $15 million in projects. After the first phase of ARRA funding, the State of Nevada has been slow to fund new projects mostly due to market conditions and the limited number of applicants to the program. The State is not presently accepting applications, but recently placed five new projects on a list to go before the funding committee.
Table 10. Project Funding through AB 52215
Project Size Type County Ro Ranch / Truck River Ranch 225 kW Hydro Nye Tim Brown (2) 3.5 kW Wind Washoe Knox (2) 3.5 kW
3.5 kW Wind Wind
Washoe
Madole (2) 3.5 kW 3.5 kW
Wind Wind
Washoe
Young Brothers 175 kW Hydro Lander Avatar Energy 159 kW Anaerobic digester Lyon Avatar Energy – Hill Side 298 kW Anaerobic digester Lyon Avatar – Desert Hills 199 kW Anaerobic digester Lyon Sunburst (6) 58.8 kW
58.8 kW 58.8 kW 58.8 kW 58.8 kW 58.8 kW
PV PV PV PV PV PV
Washoe and Clark
Berken Energy 5,000 kW GeoThermalVoltaic Lyon Berken Energy 252 kW Thermal Voltaic Lyon Enigma Energy 500 kW PV Clark Van Norman Ranches (2) 37 kW
15 kW Hydro Hydro
Elko
Andreola Wind Farm 800 kW 1.2 kW
Wind Wind
Lander
H2 Technologies Hydrogen stations Carson City Board of Regents 437 kW PV Washoe Program contact at Nevada Governor’s Office of Energy:
Suzanne Linfante Nevada Governor's Office of Energy 755 North Roop Street, Suite 202 Carson City, NV 89701 Phone: (775) 687-1850 Ext.7309 Fax: (775) 687-1869 E-Mail: [email protected]
Summar
15 Source: Nevada Governor’s Office of Energy website.

ALTERNATIVE ENERGY STUDY
PROJECT FINANCE 101 – UTILITY SCALE RENEWABLE PROJECTS
36
6. PROJECT FINANCE 101 – UTILITY SCALE RENEWABLE PROJECTS
The question in the “developer’s” mind is, “Can the project stand on its own as a viable business entity?” To understand how we get from that basic question to the answer, we must take a very high-level view of the concept of Project Finance. Standard and Poor’s (2003) defines Project Finance as “… a group of agreements and contracts between lenders, project sponsors, and other interested parties that creates a form of business organization that will issue a finite amount of debt on inception; will operate in a focused line of business; and will ask that lenders look only to a specific asset to generate cash flow as the sole source of principal and interest payments and collateral.” Most entities that don’t have the appropriate resources (primarily a large balance sheet and/or cash reserves) to deploy utility-scale renewable projects attempt to use the project finance approach, which involves non‒ or limited-recourse debt and equity financing. The diagram in Figure 12 below illustrates a typical project finance schematic.
Figure 12. Typical Project Finance Schematic

ALTERNATIVE ENERGY STUDY
PROJECT FINANCE 101 – UTILITY SCALE RENEWABLE PROJECTS (cont.)
37
Key parties in an example project finance structure as identified on the previous page are shown in Table 11:
Table 11. Parties involved in Project Finance Structure
Sponsor The Project Developer or Long-term Owner Tax investor A passive investor with an investment horizon Borrower A pass-through entity that owns the project assets (directly or indirectly) Lender Banks or institutional investors Off-taker Takes the project output (energy/RECs) typically on a take-or-pay basis Landowner/lessor Can be the project entity or a third party; controls underlying land that the
project is situated on O & M provider Third-party equipment provider or sponsor who provides operations and
maintenance, typically under a long-term contract with the project EPC/BOP provider Construction contractor, through turnkey contracts Equipment supplier Provides equipment and warranties; may provide O & M during warranty
period or longer; with EPC contract, equipment is procured through the construction contractor
IRS Internal Revenue Service, allows for election of either a production tax credit or investment tax credit for qualifying property
Of course, there will be other parties to a project than those referenced above. It is important to understand that, with utility-scale renewable energy projects specifically, no two projects are alike. In addition, there are means to finance these types of projects other than the project finance approach. However, regardless of approach, many of the underwriting criteria and economic evaluations will be similar or identical. The key point to understand from an economic evaluation tool perspective is that evaluating the viability of a project goes well beyond numbers and assumptions input into a financial model. The evaluation tool goes to the core of the contractual obligations behind the assumptions being used, and the technical and financial capabilities of the individual parties standing behind those obligations should they not be met and remedies needed. When performing a utility-scale renewable energy project feasibility analysis, we look back to these basic principles to determine a project’s chances for success (or ability to obtain financing).

ALTERNATIVE ENERGY STUDY
INDIVIDUAL SITE SUITABILITY ANALYSIS
38
7. INDIVIDUAL SITE SUITABILITY ANALYSIS The following figures shown in Figure 13 and Figure 14, respectively give a general perspective of the location of Washoe’s parcels analyzed in this study:
Figure 13. Location of Washoe's Parcels near Lake Tahoe

ALTERNATIVE ENERGY STUDY
INDIVIDUAL SITE SUITABILITY ANALYSIS (cont.)
39
Figure 14. Location of Washoe's Parcels across Nevada and California
As the purpose of this study was to evaluate all parcels for general renewable energy development suitability, we have briefly characterized all Washoe-controlled parcels in this section of the report. Much of the site-specific data has been provided by Washoe Tribal staff. This should be viewed as a preliminary “desktop” evaluation only at this stage, and further evaluation beyond this stage would be required prior to proceeding with any detailed and specific project assessments.
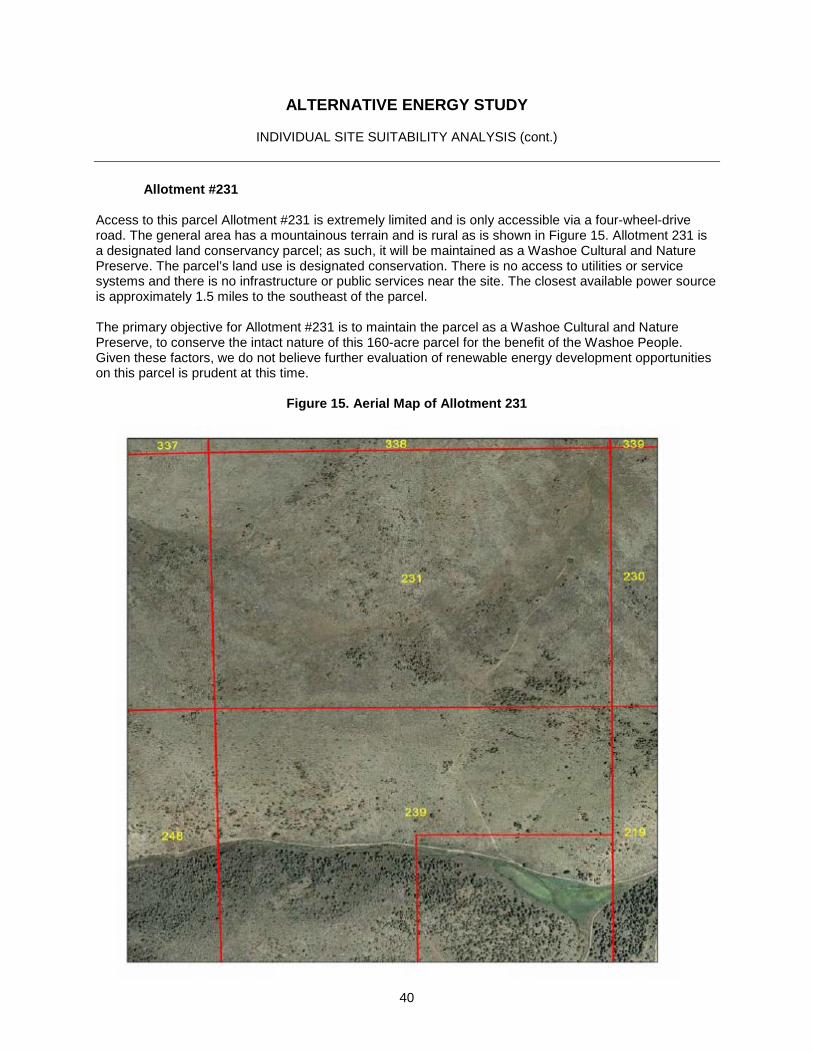
ALTERNATIVE ENERGY STUDY
INDIVIDUAL SITE SUITABILITY ANALYSIS (cont.)
40
Allotment #231 Access to this parcel Allotment #231 is extremely limited and is only accessible via a four-wheel-drive road. The general area has a mountainous terrain and is rural as is shown in Figure 15. Allotment 231 is a designated land conservancy parcel; as such, it will be maintained as a Washoe Cultural and Nature Preserve. The parcel’s land use is designated conservation. There is no access to utilities or service systems and there is no infrastructure or public services near the site. The closest available power source is approximately 1.5 miles to the southeast of the parcel. The primary objective for Allotment #231 is to maintain the parcel as a Washoe Cultural and Nature Preserve, to conserve the intact nature of this 160-acre parcel for the benefit of the Washoe People. Given these factors, we do not believe further evaluation of renewable energy development opportunities on this parcel is prudent at this time.
Figure 15. Aerial Map of Allotment 231

ALTERNATIVE ENERGY STUDY
INDIVIDUAL SITE SUITABILITY ANALYSIS (cont.)
41
Babbit Peak The 480-acre Babbit Peak parcel was acquired by the Washoe Tribe through a property transfer agreement with The Nature Conservancy in 2001. The Tribe granted The Nature Conservancy a conservation easement. The stated purpose of the conservation easement is: “To assure that the property will be retained in perpetuity in its natural, scenic, forested and open space condition. In addition, to preserve, protect, identify, monitor, enhance and restore in perpetuity the conservation values of the property. The grant prohibits use of the property for any purposes that would impair, degrade or interfere with any of the stated conservation purposes.” Figure 16 shows a topographic layout of Babbit Peak parcel.
Figure 16. Topographic Map of Babbit Peak Parcel
The parcel is located in a remote and isolated area. Infrastructure and service systems are miles from the location. Given these factors, we do not believe further evaluation of renewable energy development opportunities on this parcel is prudent at this time.
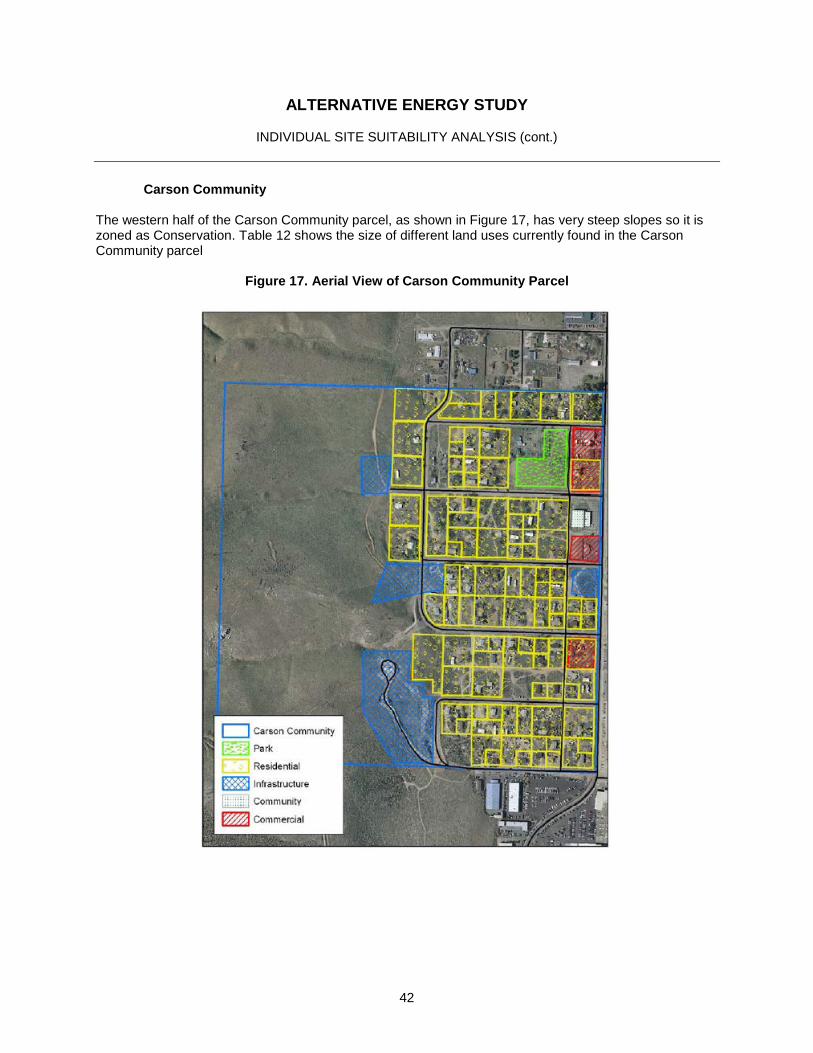
ALTERNATIVE ENERGY STUDY
INDIVIDUAL SITE SUITABILITY ANALYSIS (cont.)
42
Carson Community The western half of the Carson Community parcel, as shown in Figure 17, has very steep slopes so it is zoned as Conservation. Table 12 shows the size of different land uses currently found in the Carson Community parcel
Figure 17. Aerial View of Carson Community Parcel
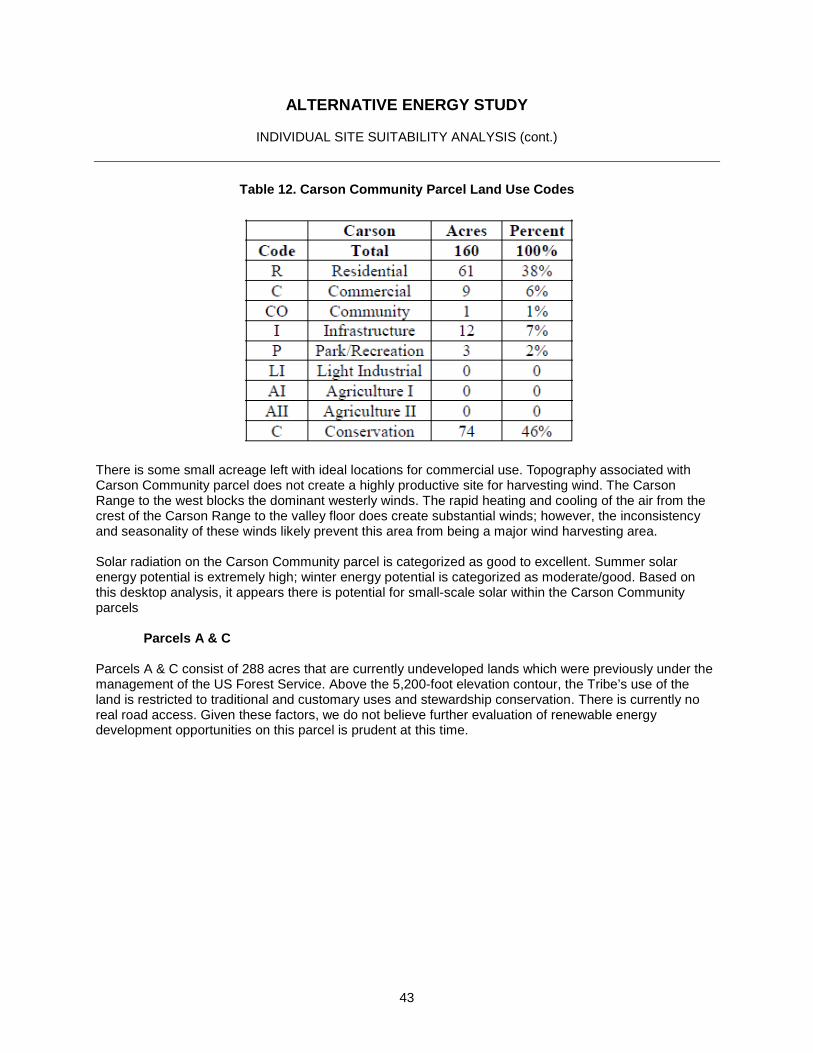
ALTERNATIVE ENERGY STUDY
INDIVIDUAL SITE SUITABILITY ANALYSIS (cont.)
43
Table 12. Carson Community Parcel Land Use Codes
There is some small acreage left with ideal locations for commercial use. Topography associated with Carson Community parcel does not create a highly productive site for harvesting wind. The Carson Range to the west blocks the dominant westerly winds. The rapid heating and cooling of the air from the crest of the Carson Range to the valley floor does create substantial winds; however, the inconsistency and seasonality of these winds likely prevent this area from being a major wind harvesting area. Solar radiation on the Carson Community parcel is categorized as good to excellent. Summer solar energy potential is extremely high; winter energy potential is categorized as moderate/good. Based on this desktop analysis, it appears there is potential for small-scale solar within the Carson Community parcels
Parcels A & C Parcels A & C consist of 288 acres that are currently undeveloped lands which were previously under the management of the US Forest Service. Above the 5,200-foot elevation contour, the Tribe’s use of the land is restricted to traditional and customary uses and stewardship conservation. There is currently no real road access. Given these factors, we do not believe further evaluation of renewable energy development opportunities on this parcel is prudent at this time.

ALTERNATIVE ENERGY STUDY
INDIVIDUAL SITE SUITABILITY ANALYSIS (cont.)
44
Dresslerville Community/Washoe Ranch The Dresslerville Community/ Washoe Ranch parcel consists primarily of agricultural lands. The amount of acres and their percent of the proposed land uses are presented in Figure 18 and Table 13, respectively. The Community is the location for many Tribal programs and Community service offices. Future expansions of these programs can be expected. Available information about wind energy productivity for the Dresslerville Community rates it as poor to marginal (class 0-2). However, proximity to 230 kV transmission lines indicates possible transmission availability. Solar radiation in the Dresslerville Community is characterized as good to excellent. If further commercial expansion takes place, there may be an opportunity to do small-scale distributed generation solar. The site is one of the few parcels where large-scale renewable energy development (likely solar) appears possible.
Figure 18. Aerial Map of Dresslerville Community/Washoe Ranch Parcel
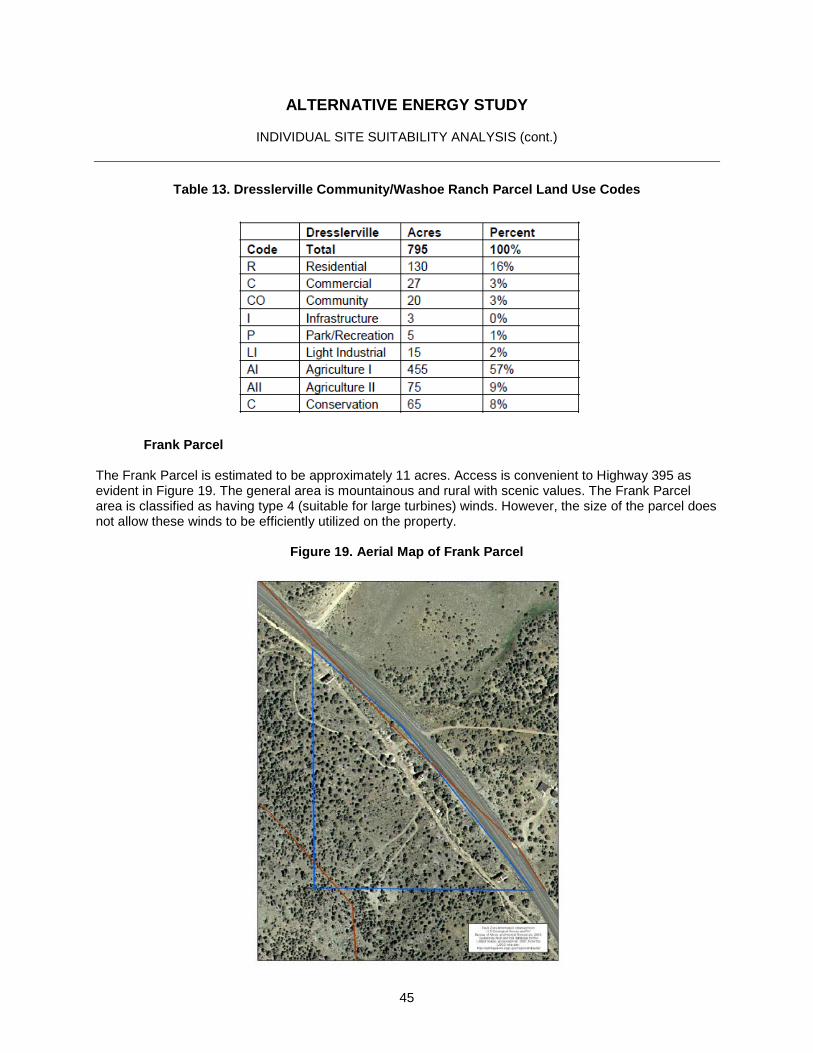
ALTERNATIVE ENERGY STUDY
INDIVIDUAL SITE SUITABILITY ANALYSIS (cont.)
45
Table 13. Dresslerville Community/Washoe Ranch Parcel Land Use Codes
Frank Parcel The Frank Parcel is estimated to be approximately 11 acres. Access is convenient to Highway 395 as evident in Figure 19. The general area is mountainous and rural with scenic values. The Frank Parcel area is classified as having type 4 (suitable for large turbines) winds. However, the size of the parcel does not allow these winds to be efficiently utilized on the property.
Figure 19. Aerial Map of Frank Parcel
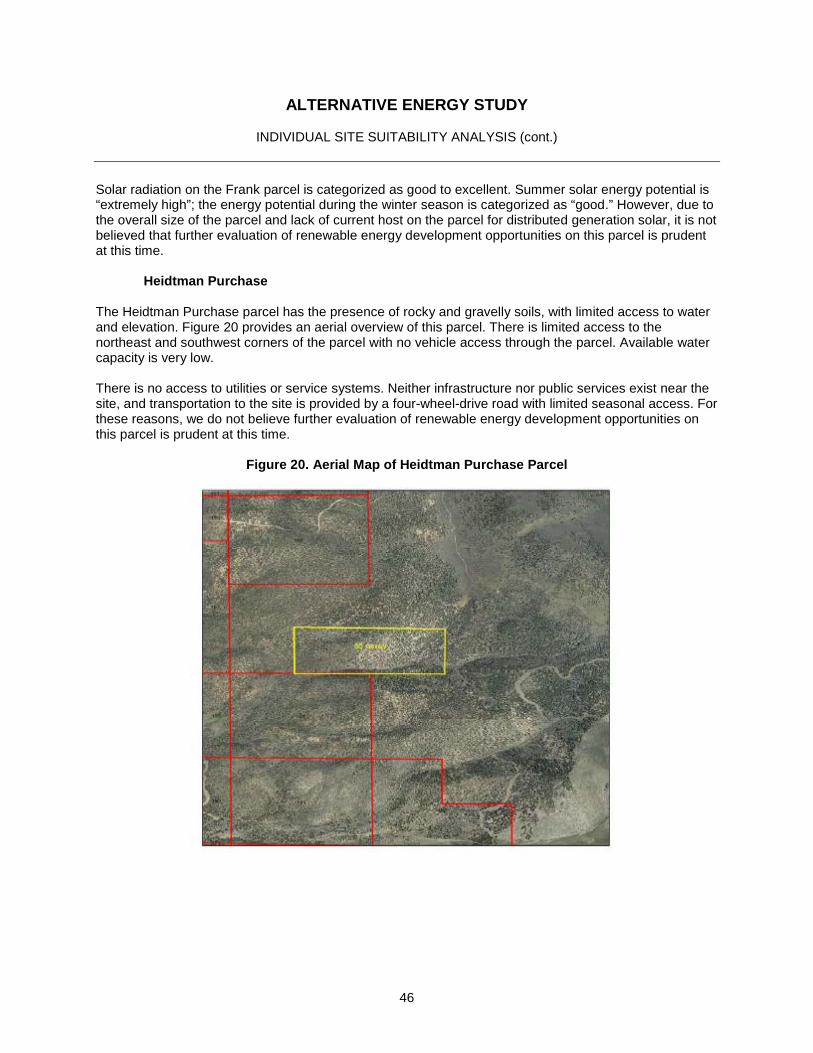
ALTERNATIVE ENERGY STUDY
INDIVIDUAL SITE SUITABILITY ANALYSIS (cont.)
46
Solar radiation on the Frank parcel is categorized as good to excellent. Summer solar energy potential is “extremely high”; the energy potential during the winter season is categorized as “good.” However, due to the overall size of the parcel and lack of current host on the parcel for distributed generation solar, it is not believed that further evaluation of renewable energy development opportunities on this parcel is prudent at this time.
Heidtman Purchase The Heidtman Purchase parcel has the presence of rocky and gravelly soils, with limited access to water and elevation. Figure 20 provides an aerial overview of this parcel. There is limited access to the northeast and southwest corners of the parcel with no vehicle access through the parcel. Available water capacity is very low. There is no access to utilities or service systems. Neither infrastructure nor public services exist near the site, and transportation to the site is provided by a four-wheel-drive road with limited seasonal access. For these reasons, we do not believe further evaluation of renewable energy development opportunities on this parcel is prudent at this time.
Figure 20. Aerial Map of Heidtman Purchase Parcel

ALTERNATIVE ENERGY STUDY
INDIVIDUAL SITE SUITABILITY ANALYSIS (cont.)
47
Incline Village The current and proposed zoning code for the Incline Village parcel is Conservation. This zoning is compatible with the Culture and Nature Preserve Designation. Considering the size of the parcel and the large size and shade of the surrounding trees (Figure 21), solar and wind renewable resources would be more appropriate on other parcels.
Figure 21. Aerial Map of Incline Village Parcel
Ladies Canyon Ladies Canyon parcel is a designated land conservancy parcel. The parcel’s land use is designated as Conservation. In conjunction with rocky gravelly soils, the elevation of the site makes the site unsuitable for crop production. Steep terrain, short growing seasons, and access are contributing factors as well. The agricultural importance of the site is minimal. This parcel’s use is limited by its placement in the Washoe Land Conservancy. Considering these factors, we do not believe further evaluation of renewable energy development opportunities on this parcel is prudent at this time.

ALTERNATIVE ENERGY STUDY
INDIVIDUAL SITE SUITABILITY ANALYSIS (cont.)
48
Lower Clear Creek The Lower Clear Creek Parcel currently remains undeveloped as shown in Figure 22. The parcel does not have a significant wind resource based on previous research, but small wind turbines could be utilized on this parcel. Solar radiation on the Lower Clear Creek parcel is categorized as good to excellent. Summer solar energy potential is “extremely high”; the energy potential during the winter season is categorized as “good.” The site is one of the few parcels where both small- and/or large-scale renewable energy development (likely solar) appears possible.
Figure 22. Aerial Map of Lower Clear Creek Parcel
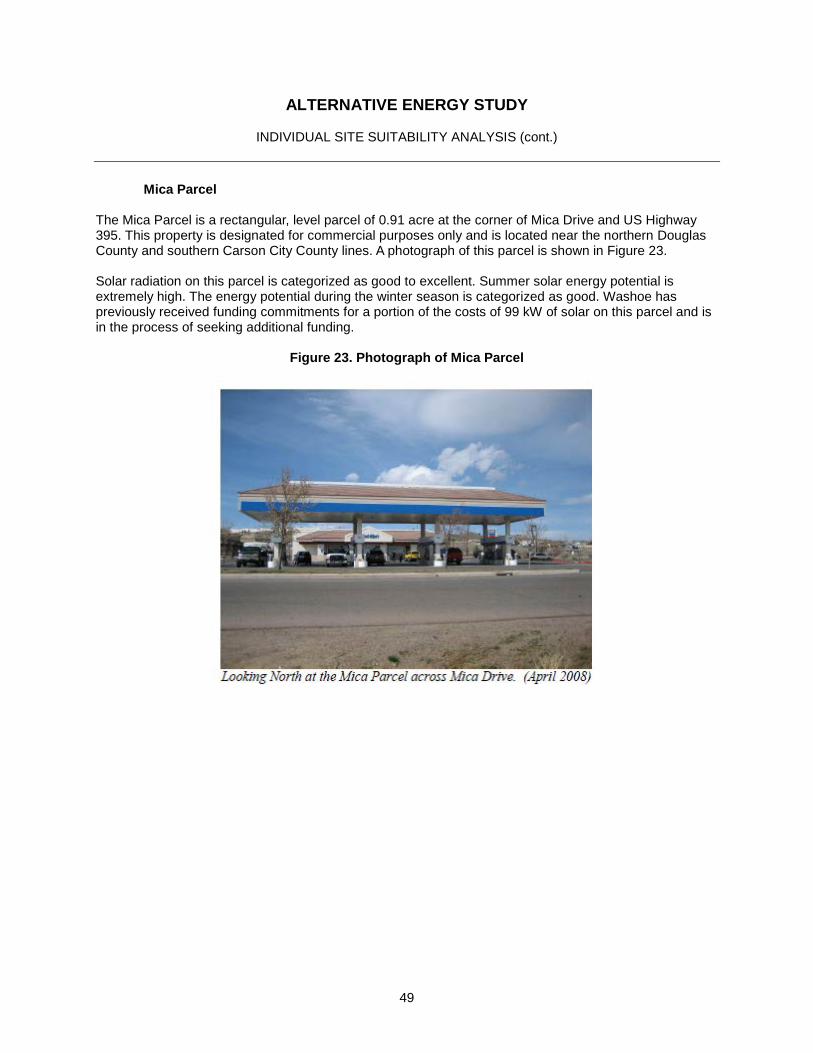
ALTERNATIVE ENERGY STUDY
INDIVIDUAL SITE SUITABILITY ANALYSIS (cont.)
49
Mica Parcel The Mica Parcel is a rectangular, level parcel of 0.91 acre at the corner of Mica Drive and US Highway 395. This property is designated for commercial purposes only and is located near the northern Douglas County and southern Carson City County lines. A photograph of this parcel is shown in Figure 23. Solar radiation on this parcel is categorized as good to excellent. Summer solar energy potential is extremely high. The energy potential during the winter season is categorized as good. Washoe has previously received funding commitments for a portion of the costs of 99 kW of solar on this parcel and is in the process of seeking additional funding.
Figure 23. Photograph of Mica Parcel

ALTERNATIVE ENERGY STUDY
INDIVIDUAL SITE SUITABILITY ANALYSIS (cont.)
50
Olympic Valley The parcel is located within 150 feet of a soccer field and within 350 feet of The Squaw Valley Public Service District (SVPSD) as shown in Figure 24. Therefore, infrastructure, service systems, and transportation are located relatively close to the site. However, the fact that the parcel is designated as the Washoe Nature Conservancy likely limits future energy development opportunities.
Figure 24. Aerial Map of Olympic Valley Parcel

ALTERNATIVE ENERGY STUDY
INDIVIDUAL SITE SUITABILITY ANALYSIS (cont.)
51
Silverado Silverado parcel has high potential for various forms of development because of easy access, excellent site potential, minimal slope, and adjacent growth pattern. Visibility from US Highway 395, as seen in Figure 25, as the “gateway” to Carson Valley is excellent, so this must be kept in mind when looking at energy development opportunities versus other potential projects. This parcel is currently zoned commercial and is ready for development. According to the agreement with the Sunridge Development, sewer and water connections as well as an underground electrical service line are in place. Sierra Pacific Power, Southwest Gas, and Continental Telephone (now Verizon) are located within the NDOT right-of-way on the west side of Highway 395. These utilities were brought across Highway 395 at the Plymouth-Highway 395 intersection during construction by the Sunridge developer. Consequently, these utilities will be easily available for use on the Silverado parcel. The Silverado parcel does not have a significant wind resource based on prior review. Some seasonal and daily winds occur that are above class three; however, these winds are sporadic and do not meet requirements for large-scale wind harvesting. A 234 kV transmission line is relatively close, allowing for potential interconnection. Solar radiation on the Silverado parcel is categorized as good to excellent. Summer solar energy potential is “extremely high”; the energy potential during the winter season is categorized as “good.” Solar energy can be a viable renewable resource on the parcel. Given these factors, further evaluation of renewable energy project opportunity (including large-scale development), would be prudent.
Figure 25. Aerial Map of Silverado Parcel

ALTERNATIVE ENERGY STUDY
INDIVIDUAL SITE SUITABILITY ANALYSIS (cont.)
52
Skunk Harbor The Skunk Harbor 24.3-acre parcel was originally acquired by the US Forest Service as part of a larger purchase using funds authorized by the Land and Water Conservation Fund Act to provide public access to recreational resources in the Lake Tahoe Basin. Use of the parcel is limited to traditional and customary uses and stewardship conservation for the benefit of the Tribe. No permanent residential, recreational development, or commercial use is permitted. For these reasons, development of renewable energy at Skunk Harbor does not appear feasible.
Stewart Community Development in Carson City development has completely surrounded the Stewart Community parcel (Figure 26), and there are very few opportunities for expansion. The Stewart Community faces several challenges with the occupancy of land within the parcel, expansion of adjacent prison facilities, use of open space for unauthorized trash and waste dumping by Carson City residents, encroachment and reduction of access by freeway development, threats to water resources, and unresolved issues related to utility easements.
Figure 26. Aerial Map of Steward Community Parcel

ALTERNATIVE ENERGY STUDY
INDIVIDUAL SITE SUITABILITY ANALYSIS (cont.)
53
The current land use of Stewart Community, shown in Table 14, is classified as follows:
Table 14. Stewart Community Parcel Land Use Codes
Solar radiation on the Stewart Community parcel is categorized as good to excellent. Summer solar energy potential is extremely high; winter solar potential is categorized as moderate/good. Sierra Pacific Power Company has constructed a new 120 kV transmission line in the eastern portion of the Stewart Community Parcel along Bigelow Drive. Given the overall characteristics of Stewart Community, further development of small-scale solar energy appears possible.
Parcels G & H Parcels G&H, a total of 5 acres, is currently undeveloped land that was previously managed by the Bureau of Land Management. It is designated as conversation land use for the next 5 to 10 years and will be revisited by the Steward Community Council following that time-period. Given this factor, we do not believe further evaluation of renewable energy development opportunities on this parcel is prudent at this time.
Stewart Ranch A majority of the land within the Stewart Ranch parcel is well-suited for agriculture as indicated by the land use code in Table 15. Utility infrastructure is available for this parcel. However, studies for water supplies adequate to develop the Ranch’s non-agricultural use have yet to be undertaken. The topography of the area creates intensive heating and cooling of air masses between the mountains and the valley (as can be seen in Figure 27), resulting in poor to marginal wind resources (class 0-3). A 230 kV transmission line is in relatively close proximity, allowing for possible grid connection. Local wind power characterization variations exist. Solar radiation on the Stewart Ranch parcel is categorized as good to excellent. Summer solar energy potential is “extremely high”; the energy potential during the winter season is categorized as “good.”

ALTERNATIVE ENERGY STUDY
INDIVIDUAL SITE SUITABILITY ANALYSIS (cont.)
54
Figure 27. Aerial Map of Stewart Ranch
Table 15. Stewart Ranch parcel land use codes
The Stewart Ranch parcel is a possible candidate for geothermal heat production, as well. Overall, the potential exists at Stewart Ranch for additional large- and small-scale renewable development.
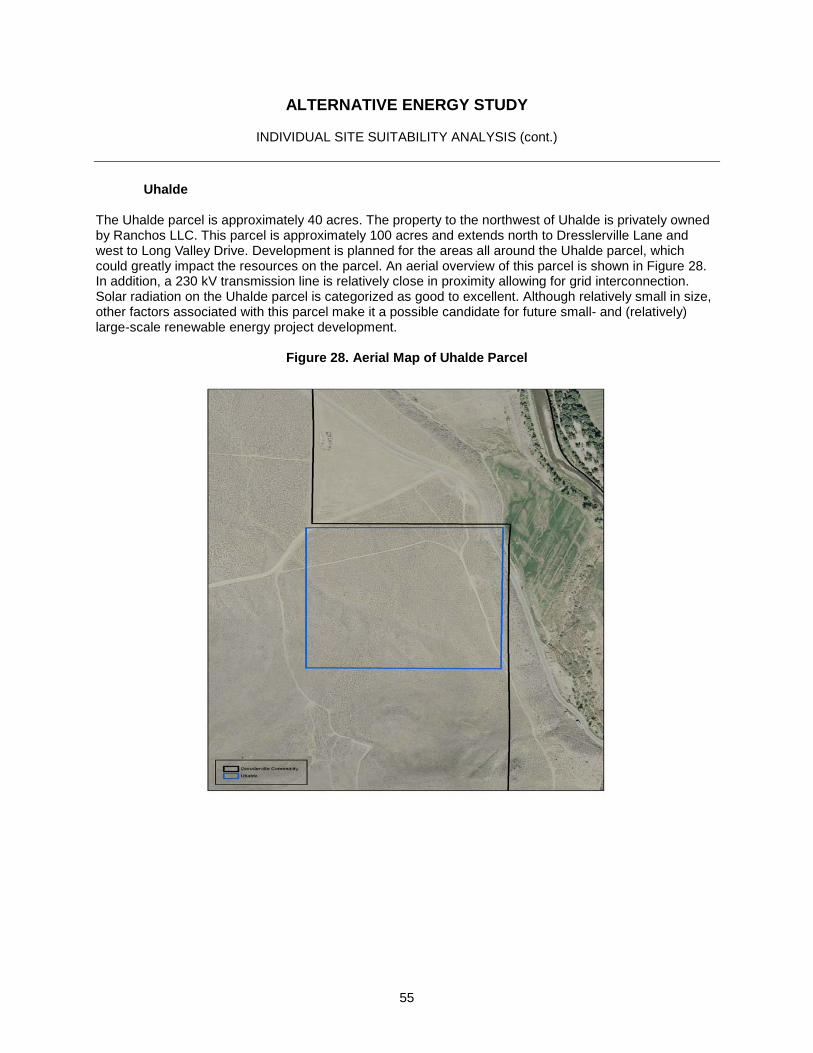
ALTERNATIVE ENERGY STUDY
INDIVIDUAL SITE SUITABILITY ANALYSIS (cont.)
55
Uhalde The Uhalde parcel is approximately 40 acres. The property to the northwest of Uhalde is privately owned by Ranchos LLC. This parcel is approximately 100 acres and extends north to Dresslerville Lane and west to Long Valley Drive. Development is planned for the areas all around the Uhalde parcel, which could greatly impact the resources on the parcel. An aerial overview of this parcel is shown in Figure 28. In addition, a 230 kV transmission line is relatively close in proximity allowing for grid interconnection. Solar radiation on the Uhalde parcel is categorized as good to excellent. Although relatively small in size, other factors associated with this parcel make it a possible candidate for future small- and (relatively) large-scale renewable energy project development.
Figure 28. Aerial Map of Uhalde Parcel

ALTERNATIVE ENERGY STUDY
INDIVIDUAL SITE SUITABILITY ANALYSIS (cont.)
56
Upper Clear Creek The Upper Clear Creek parcel does not have a significant wind resource (i.e., wind energy potential above a 4). Seasonal and daily winds occur that are above class 3; however, these winds are sporadic. On the other hand, solar radiation on the Upper Clear Creek parcel is categorized as good to excellent. Summer solar energy potential is “extremely high”; the energy potential during the winter season is categorized as “good.” A 234 kV transmission line is relatively close. However, due to the terrain issues associated with this parcel (Figure 29, further development of renewables on this parcel does not appear feasible at this time.
Figure 29. Aerial Map of Upper Clear Creek

ALTERNATIVE ENERGY STUDY
INDIVIDUAL SITE SUITABILITY ANALYSIS (cont.)
57
Wade Parcels (Upper and Lower) Wade is a land base for the Tribe and Tribal members that is presently unused but has significant potential for future use. Favorable soils, location, and availability of water resources are examples of advantages found on the Parcels. The western two-thirds of the upper portion of Wade Parcel (Upper Wade Parcel) are too steep for development. There are 18.5 acres of Upper Wade Parcel with less than or equal to 8% slopes. The majority of the lower portion (Lower Wade Parcel), other than the bluff, has gentle slopes. An aerial overview of both Upper and Lower Wade Parcels are shown in Figure 30. The Wade Parcels are close to excellent wind resources. A 234 kV transmission line is relatively close, allowing for possible grid interconnection. Solar radiation on the Wade parcels is categorized as good to excellent. Given the nature of the Wade Parcels and other factors, it appears small-scale renewable energy development may be feasible in the future.
Figure 30. Aerial Map of Wade Parcels

ALTERNATIVE ENERGY STUDY
INDIVIDUAL SITE SUITABILITY ANALYSIS (cont.)
58
Woodfords Community The Woodfords Community parcel is located in California off Diamond Valley Road near Highway 88. It is the most rural of the Washoe communities and its remoteness also poses challenges as shown in Figure 31. Electricity is more expensive, and economic development opportunities are harder to find.
Figure 31. Aerial Map of Woodfords Community
Table 16. Woodfords Community Parcel Land Use Codes
As shown in the land use code in Table 16, half of the 80-acre Woodfords Community has now been developed. Thirty-seven acres are used for single-family residential purposes The community area (14 acres) includes the Community Center, fire station, park, and infrastructure. A 234 kV transmission line is in relative close proximity. Solar radiation on the Woodfords Community is categorized as good to excellent. Summer solar energy potential is “extremely high,” and winter potential is categorized as “good.” Given these factors, further exploration of small-scale renewables, especially solar, would be prudent.

ALTERNATIVE ENERGY STUDY
PHOTOVOLTAICS (PV) SOLAR ENERGY (cont.)
59
8. PHOTOVOLTAICS (PV) SOLAR ENERGY PV SOLAR OVERVIEW Solar cells, also called photovoltaic (PV) cells, convert sunlight directly into electricity. PV gets its name from the process of converting light (photons) to electricity (voltage). Solar panels used to power homes and businesses usually are made from solar cells combined into modules that hold about 40 cells. A typical home will use about 10 to 20 solar panels to power the home. The panels are mounted at a fixed angle facing south, or they can be mounted on a tracking device that follows the sun, allowing them to capture the most sunlight. A solar array is created by combining together many solar panels to create one system. For large electric utility or industrial applications, hundreds of solar arrays are interconnected to form a large utility-scale PV system. Traditional solar cells are made from silicon, are usually flat-plate, and generally are the most efficient. Second-generation solar cells are called thin-film solar cells because they are made from amorphous silicon or non-silicon materials such as cadmium telluride. Thin-film solar cells use layers of semiconductor materials only a few micrometers thick. Because of their flexibility, thin-film solar cells can double as rooftop shingles and tiles, building facades, or the glazing for skylights. Third-generation solar cells are being made from variety of new materials besides silicon, including solar inks using conventional printing press technologies, solar dyes, and conductive plastics. Some new solar cells use plastic lenses or mirrors to concentrate sunlight onto a very small piece of high-efficiency PV material. Because the lenses must be pointed at the sun, the use of concentrating collectors is limited to the sunniest parts of the country. Solar energy has more even distribution across the United States than other forms of renewables such as wind or hydro. Where wind and hydro are available, they are good sources of energy, but only select places get good wind, and hydro can have many impacts. Solar energy is spread across the entire US and has very little environmental impact. PV is very modular. You can install as small or as large a PV system as you need. For example, one can install a PV module on each classroom for lighting, put PV power at a gate to run the motorized gate opener, put PV power on a light pole for street lighting, or put a PV system on a house or building and supply as much energy as wanted. You can start with a small budget this year, and add more modules and batteries later when you are more comfortable with solar, or when loads increase. New PV modules can be added at any time. Typically, PV systems are configured in two ways: (1) Ground Mount and (2) Rooftop as illustrated in Figure 33 and Figure 34, respectively.
Figure 32. Photograph of PV Cells
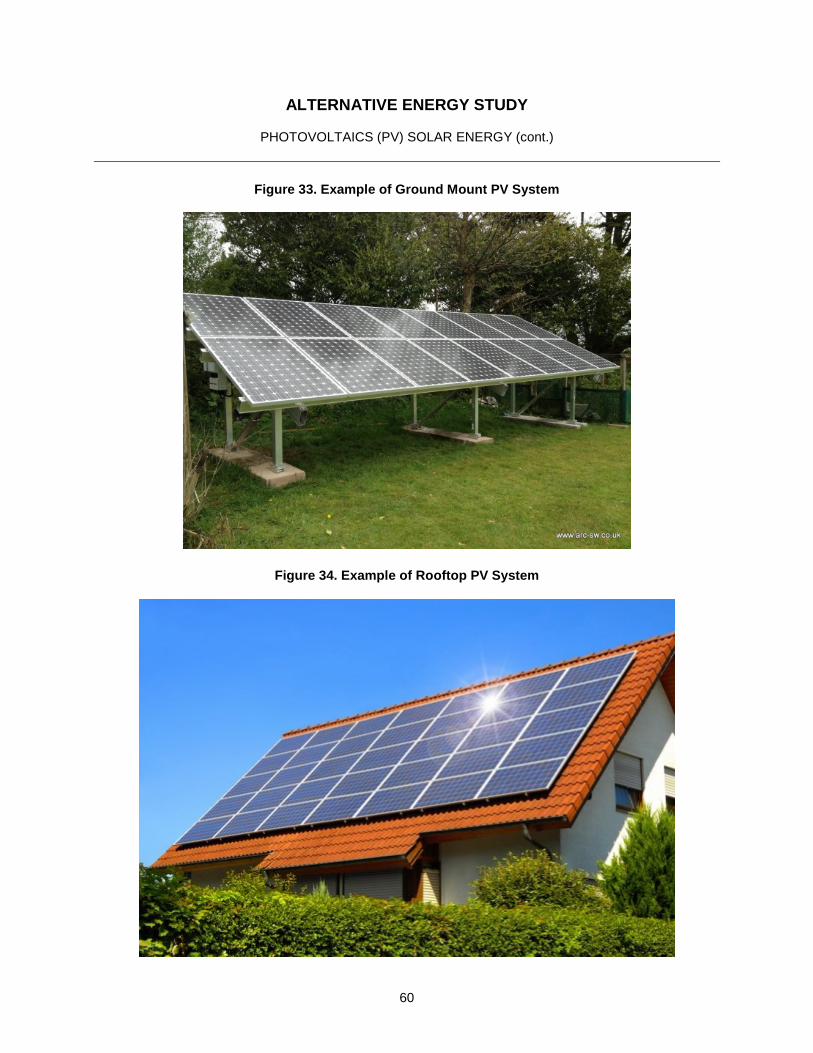
ALTERNATIVE ENERGY STUDY
PHOTOVOLTAICS (PV) SOLAR ENERGY (cont.)
60
Figure 33. Example of Ground Mount PV System
Figure 34. Example of Rooftop PV System

ALTERNATIVE ENERGY STUDY
PHOTOVOLTAICS (PV) SOLAR ENERGY (cont.)
61
As of March 2014, according to the Solar Energy Industries Association, there were 385 MW of operating projects, 768 MW projects under construction, and 4,044 MW of projects under development in the State of Nevada. In the State of California, there were 3,401 MW of projects operating, 2,171 MW of projects under construction, and 13,518 MW of projects under development. Examples of two large utility-scale PV projects located in Nevada are shown in Figure 35 and Figure 35, respectively.
Figure 36. Nevada Solar One Solar Project Figure 35. Nellis Air Force Base Solar Project

ALTERNATIVE ENERGY STUDY
PHOTOVOLTAICS (PV) SOLAR ENERGY (cont.)
62
Figure 37. Major Solar Projects in Northern California and Northern Nevada16
Figure 38. Major Solar Projects in Southern California and Southern Nevada17
16 Source: SEIA 17 Source: SEIA

ALTERNATIVE ENERGY STUDY
PHOTOVOLTAICS (PV) SOLAR ENERGY (cont.)
63
TECHNICAL ANALYSIS
Site Characteristics Based on data from the Washoe Tribe and National Renewable Energy Laboratory (NREL), Figure 39 shows the estimated solar resource for parcels within the Washoe footprint:
Figure 39. Estimated PV Solar Resource Potential for Parcels within Washoe’s Footprint
Note that, given the quality solar resource across the Washoe parcel footprint, the ability to develop small scale solar primarily came down to site topographic, transmission, or overall land availability issues versus solar resource.

ALTERNATIVE ENERGY STUDY
PHOTOVOLTAICS (PV) SOLAR ENERGY (cont.)
64
Based on factors previously discussed in the report regarding the individual parcels, the following assumptions were made relative to small scale solar development potential.
Table 17. Solar Development potential for Washoe’s Parcels
Parcel Name Total Acres State Small Scale
Potential (Y/N) Allotment #231 160 NV N
Babbit Peak 480 CA N
Carson Community 160 NV Y Parcels A & C 2886 NV N
Dresslerville Community/Washoe Ranch 793 NV N
Frank Parcel 12 NV N
Heidtman Purchase 80 NV N
Incline Village 3 NV N
Ladies Canyon 14 CA N
Lower Clear Creek Parcel 229 NV Y Mica 1 NV Y Olympic Valley 3 CA N
Silverado 160 NV Y Skunk Harbor 24 NV N
Stewart Community 292 NV Y Parcels G & H 5 NV N
Stewart Ranch 2,098 NV Y Uhalde 39 NV Y Upper Clear Creek Parcel 157 NV N
Wade Parcels (Upper and Lower) 320 CA Y Woodfords Community 80 CA N
Total 5,236 The sites in bold above indicate some potential for “small-scale” or “distributed-generation” solar generation projects. However, as discussed in this study, for a small-scale project to have the potential to be feasible, it needs to be able to offset the retail cost of electricity, versus selling at a typically much lower wholesale rate. The Washoe Tribe has successfully done this previously with projects at the Dresslerville Gym and Stewart Community Center.

ALTERNATIVE ENERGY STUDY
PHOTOVOLTAICS (PV) SOLAR ENERGY (cont.)
65
Based on data obtained by the Tribe, we analyzed the electrical usage on an annual basis from fifteen different locations across several parcels, and then further determined (based on size) whether or not to include them in the analysis. A summary of this analysis is shown in Table 18.
Table 18. Summary of Annual Energy Usage at Fifteen Locations
Site # Site Name Average Annual
Usage (kWh) Parcel Name
Include in Feasibility Analysis?
(Y/N)
Net Generation to Offset - Feasibility Analysis
1 Headquarters 134,751 Dresslerville Y 134,751
2 Environmental Dept. 8,598 Dresslerville N -
3 Court Bldg. 47,196 Dresslerville Y 47,196
4 Police Dept. 29,663 Dresslerville Y 29,663
5 Health Clinic 160,560 Dresslerville Y 160,560
6 Chevron Station 333,720 Mica Y 333,720
7 Washoe One Stop 50,775 Dresslerville Y 50,775
8 Carson One Stop 73,221 Carson Community
Y 73,221
9 Carson Gym 31,100 Carson Community
Y 31,100
10 *Dresslerville Gym 15,017 Dresslerville N -
11 Woodfords Gym 41,240 Woodfords Y 41,240
12 Woodfords Ed. Center 19,495 Woodfords N -
13 *Stewart Comm. Center
6,136 Stewart Community
N -
14 Woodfords Fire Station
9,045 Woodfords N -
15 Dresslerville Comm. Center
29,770 Dresslerville Y 29,770
Total 990,285
931,995
*Numbers are lower due to solar application assisting with electrical consumption Without detailed engineering evaluation to determine the feasibility to install PV panels on the roofs or adjacent via ground mounts, we have made the assumption that one or the other option would exist at the sites evaluated. Based on an assumed net capacity factor of 27%, for economic modeling purposes, we assumed a 425 kW total system installed on or adjacent to 10 existing buildings; the headquarters, court building, police department, health clinic, Chevron station, Washoe one stop, Carson one stop, Carson gym, Woodfords gym, and Dresslerville Community Center.

ALTERNATIVE ENERGY STUDY
PHOTOVOLTAICS (PV) SOLAR ENERGY (cont.)
66
A basic financial modeling tool for potential use by the Washoe Tribe to assess small solar generation under various scenarios was developed with the following features: 1. The model assesses solar power generation capability and financial viability for up to the 15 sites.
The model analysis is based on site-specific parameters, including load usage data.
2. Users can modify the sites incorporated in the analysis, or add sites later.
> More specifically, the Washoe Solar Financial Model is built to help the Tribe and other stakeholders answer the following questions: – What savings can be realized on a power bill or what revenue can be realized from each site,
based on the current net metering tariff policies established by NV Energy?
– How is project performance impacted based on different tax benefits for different business/ownership structures?
– What returns can be realized, and how is this return impacted by different strategies?
> Important points of understanding relating to what the model is and what the model is not: The model and analysis framework were developed as a strategic tool to understand potential project opportunities and be able to astutely approach developers and enter into more detailed project development discussions.
– It is important to note that this model is not a one-time static look at the potential solar
capabilities for the Washoe Tribe; this model develops an analytical framework and toolset to review project opportunities and enter more detailed planning phases.
Any financial results represented in the model are based on high-level assumptions from industry data and Washoe Tribe of Nevada and California data inputs and cannot be relied upon for investment decisions without additional due diligence on specific project opportunities.
> All financial assumptions included in the model will need additional vetting as project opportunities arise and become more realistic.
> However, the mechanics of the model have been designed to clearly demonstrate individual site viability as well as overall project success through key financial performance metrics.
> As assumptions are confirmed, tariff policies reviewed, and project structures considered, the financial analysis tools developed in the model will provide an efficient basis for additional outreach with project developers.

ALTERNATIVE ENERGY STUDY
PHOTOVOLTAICS (PV) SOLAR ENERGY (cont.)
67
The base case assumptions built into the feasibility model are presented below as a “snapshot” from the actual financial model:
Figure 40. Snapshot of Base Case Feasibility Model Results
Note the assumption of the ability for the Federal Investment Tax Credit to be included as part of the overall “capital stack.” Potential methods to “monetize” such credits are provided in further detail within this report. The following are additional “financial” based assumptions built within the base case of the model. We assume an offset of a future residential retail rate of $0.11/kWh. Actual current rate schedules are provided by NV and can be found at https://www.nvenergy.com/company/rates/nnv/electric/schedules/.
Total project size (kW) 453 Net Capacity Factor (%) 27%Pow er generation (kWh/year) 1,071,794
Degradation rate - Year 1 2.0%Degradation rate - Remaining project life 0.5%
Cost per kW Installed capacity Total3000 453 1,359,455
Cost per kW Installed capacity Total5 453 2,266
Sources of Funds % of Total AmountUp-front cash incentive 0.0% - Federal Investment Tax Credit 28.5% 387,445 Tax equity 0.0% - Equity 71.5% 972,010 Term debt 0.0% - Total sources 100.0% 1,359,455 Investment Tax Credit (ITC) YesEligible basis (%) 95%ITC amount of the eligible costs (%) 30%ITC amount ($) 387,445$ ITC util ization schedule Number of years Yearly percent(used if sponsor has partial tax appetite) 0 0%
Solar Power Generation Estimates
Uses of Funds
Initial project costs
O&M Costs
Sources of Funds
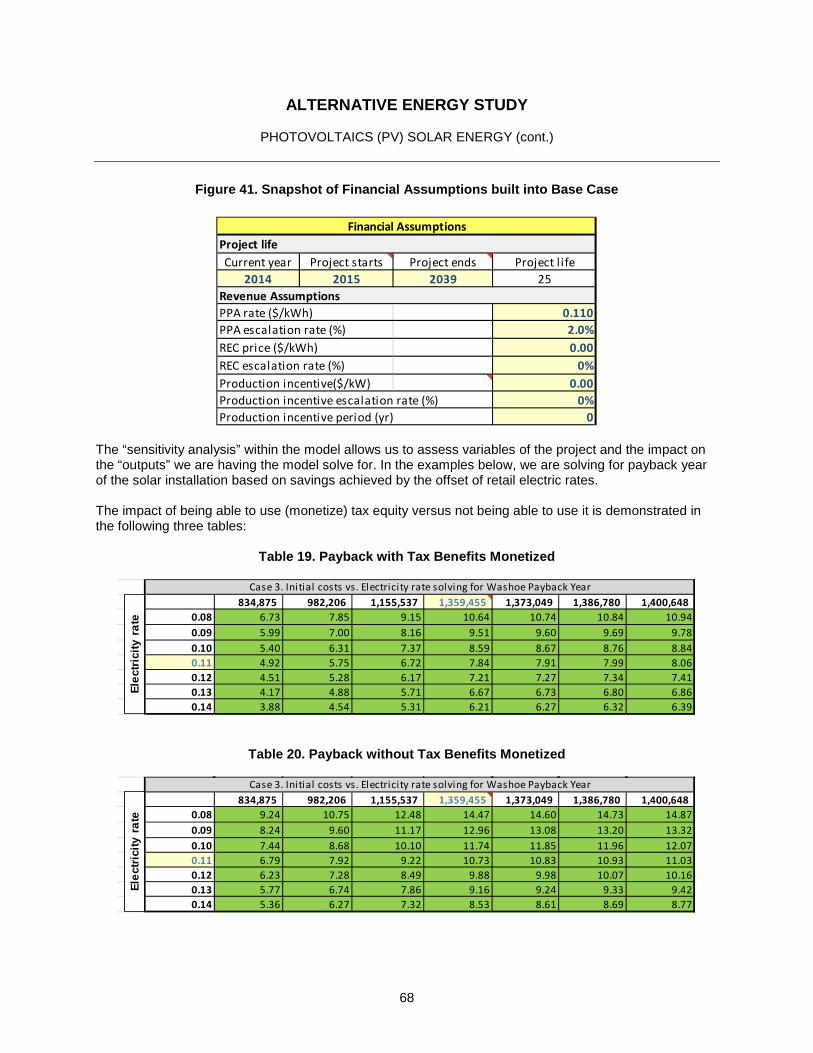
ALTERNATIVE ENERGY STUDY
PHOTOVOLTAICS (PV) SOLAR ENERGY (cont.)
68
Figure 41. Snapshot of Financial Assumptions built into Base Case
The “sensitivity analysis” within the model allows us to assess variables of the project and the impact on the “outputs” we are having the model solve for. In the examples below, we are solving for payback year of the solar installation based on savings achieved by the offset of retail electric rates. The impact of being able to use (monetize) tax equity versus not being able to use it is demonstrated in the following three tables:
Table 19. Payback with Tax Benefits Monetized
Table 20. Payback without Tax Benefits Monetized
Project lifeCurrent year Project starts Project ends Project l ife
2014 2015 2039 25Revenue AssumptionsPPA rate ($/kWh) 0.110PPA escalation rate (%) 2.0%REC price ($/kWh) 0.00REC escalation rate (%) 0%Production incentive($/kW) 0.00Production incentive escalation rate (%) 0%Production incentive period (yr) 0
Financial Assumptions
7.84 834,875 982,206 1,155,537 1,359,455 1,373,049 1,386,780 1,400,648 0.08 6.73 7.85 9.15 10.64 10.74 10.84 10.940.09 5.99 7.00 8.16 9.51 9.60 9.69 9.780.10 5.40 6.31 7.37 8.59 8.67 8.76 8.840.11 4.92 5.75 6.72 7.84 7.91 7.99 8.060.12 4.51 5.28 6.17 7.21 7.27 7.34 7.410.13 4.17 4.88 5.71 6.67 6.73 6.80 6.860.14 3.88 4.54 5.31 6.21 6.27 6.32 6.39
Case 3. Initial costs vs. Electricity rate solving for Washoe Payback Year
Elec
trici
ty r
ate
10.73 834,875 982,206 1,155,537 1,359,455 1,373,049 1,386,780 1,400,648 0.08 9.24 10.75 12.48 14.47 14.60 14.73 14.870.09 8.24 9.60 11.17 12.96 13.08 13.20 13.320.10 7.44 8.68 10.10 11.74 11.85 11.96 12.070.11 6.79 7.92 9.22 10.73 10.83 10.93 11.030.12 6.23 7.28 8.49 9.88 9.98 10.07 10.160.13 5.77 6.74 7.86 9.16 9.24 9.33 9.420.14 5.36 6.27 7.32 8.53 8.61 8.69 8.77
Case 3. Initial costs vs. Electricity rate solving for Washoe Payback Year
Elec
trici
ty r
ate

ALTERNATIVE ENERGY STUDY
PHOTOVOLTAICS (PV) SOLAR ENERGY (cont.)
69
Payback with tax benefit monetization and $500,000 of additional upfront incentives (for example, a Department of Energy grant):
Table 21. Payback with Tax Benefit Monetization and $500,000 of Additional Upfront Incentives (e.g., Department of Energy Grant)
Conclusions—Distributed Generation Solar Feasibility If the Washoe Tribe is able to monetize the investment tax credit with a financial partner, the payback on the $1.35-million investment is approximated at 7.8 years. After that period, the power generated for the Washoe Tribe is essentially “free” after modest maintenance expenses and replacement of inverters every 10‒12 years (estimate $500/kW replacement cost). If the Washoe Tribe is not able to monetize the investment tax credit, the payback on the same system is approximately 10.7 years. If the Washoe Tribe is able to monetize the tax credit and obtain $500,000 in grant funding from various potential sources as outlined in this document, the estimated payback on the system would be approximately 3.9 years. Under all scenarios, there is a requirement of some out-of-pocket investment by the Washoe Tribe. If this is not possible due to budget constraints, the project size might need to be lowered, or alternative financing structures would need to be evaluated.
3.92 834,875 982,206 1,155,537 1,359,455 1,373,049 1,386,780 1,400,648 0.08 3.35 3.92 4.59 5.37 5.42 5.47 5.530.09 2.97 3.49 4.08 4.78 4.83 4.87 4.920.10 2.67 3.14 3.68 4.31 4.35 4.39 4.430.11 2.43 2.85 3.34 3.92 3.96 3.99 4.030.12 2.23 2.61 3.07 3.59 3.63 3.66 3.700.13 2.06 2.41 2.83 3.32 3.35 3.38 3.420.14 1.91 2.24 2.63 3.08 3.11 3.14 3.17
Case 3. Initial costs vs. Electricity rate solving for Washoe Payback Year
Elec
trici
ty r
ate

ALTERNATIVE ENERGY STUDY
PHOTOVOLTAICS (PV) SOLAR ENERGY (cont.)
70
Utility-scale solar opportunity As illustrated in Figure 42, the development of utility-scale solar has three basic phases: development, construction, and operation.
Figure 42. Major Steps to Bring a Utility-Scale Solar Project Online
In addition, for the project owner who doesn’t have access to a large balance sheet for financing, off-balance-sheet or “non-recourse” project financing (discussed further in Section 6) involves significant challenges. According to the Solar Energy Industries Association, as of March 2014, there were 385 MW of utility-scale solar projects in operation, 768 MW of solar under construction, and 4044 MW under development in the State of Nevada. Looking at the history of solar project development in the United States at a utility scale, nearly all projects are ultimately owned by entities with access to large amounts of capital, not unlike owners of other fossil generation assets. These types of entities include publicly traded corporations (primarily investor-owned utilities), municipally owned utilities or cooperatives, and large independent power producers. The returns on equity investment of this nature have historically ranged from 8%‒12%. Without a willingness to make a significant equity investment into a utility-scale solar project, it appears the prospect of the Washoe Tribe owning this type of asset is minimal at this stage. As discussed previously, demand for power from utility-scale renewable projects is arguably at a point of saturation in both California and Nevada. Decreasing costs of all renewables and continued public sentiment toward increasing renewable portfolio standards could point to future increases in renewable targets. As seen in the figure below, a minimal amount of utility-scale solar development has taken place in the proximity to Washoe-controlled parcels, giving some indication of the lack of interest of project development in this region, either from the perspective of a self-developed project or a partnership with a third party. Conversely, a significant amount of solar development has occurred and/or is underway in the area of Las Vegas, likely due to the proximity of demand for energy and available transmission resources, along with a favorable solar resource.

ALTERNATIVE ENERGY STUDY
PHOTOVOLTAICS (PV) SOLAR ENERGY (cont.)
71
TECHNICAL ANALYSIS
Irrespective of the current market conditions, and given the view that, from a utility-scale project perspective, solar appears to be the most favorable opportunity, we ran an analysis of what economics might mean for the Washoe Tribe for a utility-scale project. The first step of this analysis is to determine which existing parcels may have the potential to host a solar project development, which is summarized in Table 22.
Table 22. Solar Project Development Potential for Washoe Parcels
Parcel Name Total Acres State Large Scale
Potential (Y/N) Allotment #231 160 NV N Babbit Peak 480 CA N Carson Community 160 NV N Parcels A & C 288 NV N Dresslerville Community/Washoe Ranch 793 NV Y Frank Parcel 12 NV N Heidtman Purchase 80 NV N Incline Village 2 NV N Ladies Canyon 145 CA N Lower Clear Creek Parcel 229 NV Y Mica 1 NV N Olympic Valley 3 CA N Silverado 160 NV Y Skunk Harbor 24 NV N Stewart Community 292 NV N Parcels G & H 5 NV N Stewart Ranch 2,098 NV Y Uhalde 38 NV N Upper Clear Creek Parcel 157 NV N Wade Parcels (Upper and Lower) 320 CA Y Woodfords Community 80 CA N Total 5,236

ALTERNATIVE ENERGY STUDY
PHOTOVOLTAICS (PV) SOLAR ENERGY (cont.)
72
Financial Modeling Tool; Utility Scale Solar Project We evaluated an example 26-MW utility-scale solar project that would utilize 200 acres of Tribal land. We selected a basic fixed-solar PV technology and assumed a total project cost of $90 million. Additional assumptions can be found within a snapshot from the model as follows:
Figure 43. Snapshot of PV Financial Modeling Assumptions
Washoe Tribe Alternative Energy Study - Solar Business Model
Technology type Select SolarPVTechnology category Select FixedLand available for project (acres) 200 Land requirement (acre per MW) 7.6Total project size (MW) 26Net Capacity Factor (%) 20%Degradation rate - Year 1 2.0%Degradation rate - Remaining project life 0.5%Power generation (MWh/year) 46,105
Site name Site 1Internal load (MWh/year) - System size required to meet the internal load (MW) -
Initial project costs Cost per MW Installed capacity Total3,435,000 26.3 90,394,737
O&M Costs Cost per MW Installed capacity Total20,000 26.3 526,316
Sources of Funds % of Total AmountUp-front cash incentive 0.0% - Federal Investment Tax Credit 28.5% 25,762,500 Tax equity 0.0% - Equity 71.5% 64,632,237 Term debt 0.0% - Total sources 100.0% 90,394,737
Solar Power Generation Estimates
Internal load
Uses of Funds
Sources of Funds
Project lifeCurrent year Project starts Project ends Project l ife
2014 2015 2039 25Revenue AssumptionsDevelopment type Select Third party PPAYearly power generation 46,105 Power rate ($/MWh) 120.00Power escalation rate (%) 2%REC price ($/kWh) 0.015REC escalation rate (%) 0%Production incentive($/kW) 0.00Production incentive escalation rate (%) 0%Production incentive period (yr) 0
Financial Assumptions

ALTERNATIVE ENERGY STUDY
PHOTOVOLTAICS (PV) SOLAR ENERGY (cont.)
73
Sensitivity analysis Case 1: A basic rule of thumb in the utility-scale energy market is that a minimum 8% return on equity is required to solicit third-party investment into a given project. Based on the basic assumptions made as described above, the project would need to be able to sell power for approximately $130/MWH, assuming that there was demand for renewables from the state utilities. In addition, this assumes that all development risk (expense) would be taken by Washoe. Neither of these scenarios seems likely at this juncture. Case 2: Case two evaluates the rate of return for the project as power generation increases as a result of better-than-anticipated solar resource measurements, more efficient technology selection/evolution, or other reasons. Obviously, the more power that can be produced, the larger the rate of return, and the more attractive the investment would be. Case 3: Case 3 assumes a scenario where Washoe develops the project and then partners with a third party investor, and earns a long-term land lease payment for use of a given Washoe parcel. This is a common development model for entities that do not have the funds to deploy into utility-scale projects. This model would likely be the only viable option for Washoe at this stage given our understanding of the Tribe’s available capital. The impact of the price for power able to be solicited is apparent relative to potential land lease payments on an annual basis.
Figure 44. Results of Sensitivity Analysis under 3 Cases
7.17% 77,502,188 81,581,250 85,875,000 90,394,737 94,914,474 99,660,198 104,643,207 90 5.41% 4.98% 4.56% 4.14% 3.75% 3.37% 3.00%
100 6.57% 6.11% 5.66% 5.22% 4.81% 4.41% 4.02%110 7.65% 7.16% 6.69% 6.22% 5.79% 5.37% 4.96%120 8.67% 8.15% 7.66% 7.17% 6.72% 6.28% 5.85%130 9.64% 9.10% 8.58% 8.07% 7.60% 7.13% 6.69%140 10.57% 10.00% 9.46% 8.92% 8.43% 7.95% 7.48%150 11.46% 10.88% 10.30% 9.75% 9.23% 8.73% 8.25%
0 77,502,188 81,581,250 85,875,000 90,394,737 94,914,474 99,660,198 104,643,207 39,529 6.89% 6.42% 5.96% 5.52% 5.10% 4.70% 4.30%41,610 7.47% 6.99% 6.52% 6.06% 5.63% 5.22% 4.81%43,800 8.06% 7.56% 7.08% 6.61% 6.17% 5.74% 5.32%46,105 8.67% 8.15% 7.66% 7.17% 6.72% 6.28% 5.85%48,410 9.25% 8.73% 8.21% 7.71% 7.25% 6.80% 6.36%50,831 9.85% 9.31% 8.78% 8.27% 7.79% 7.33% 6.87%53,372 10.47% 9.91% 9.36% 8.83% 8.34% 7.86% 7.40%
7.17% 50,000 100,000 150,000 200,000 250,000 300,000 350,000 90 4.6% 4.4% 4.3% 4.1% 4.0% 3.8% 3.7%
100 5.6% 5.5% 5.4% 5.2% 5.1% 5.0% 4.8%110 6.6% 6.5% 6.3% 6.2% 6.1% 6.0% 5.8%120 7.5% 7.4% 7.3% 7.2% 7.1% 6.9% 6.8%130 8.4% 8.3% 8.2% 8.1% 8.0% 7.8% 7.7%140 9.2% 9.1% 9.0% 8.9% 8.8% 8.7% 8.6%150 10.0% 9.9% 9.8% 9.7% 9.6% 9.5% 9.4%
Case 1. Initial costs vs. Electricity rate solving for Unlevered After-Tax IRR
Case 2. Initial costs vs. Power generation solving for Unlevered After-Tax IRR
Case 3. Lease Costs Assessed vs. Electricity rate solving for Unlevered After-Tax IRR
Elec
trici
ty r
ate
Pow
er g
ener
atio
nEl
ectri
city
rat
e
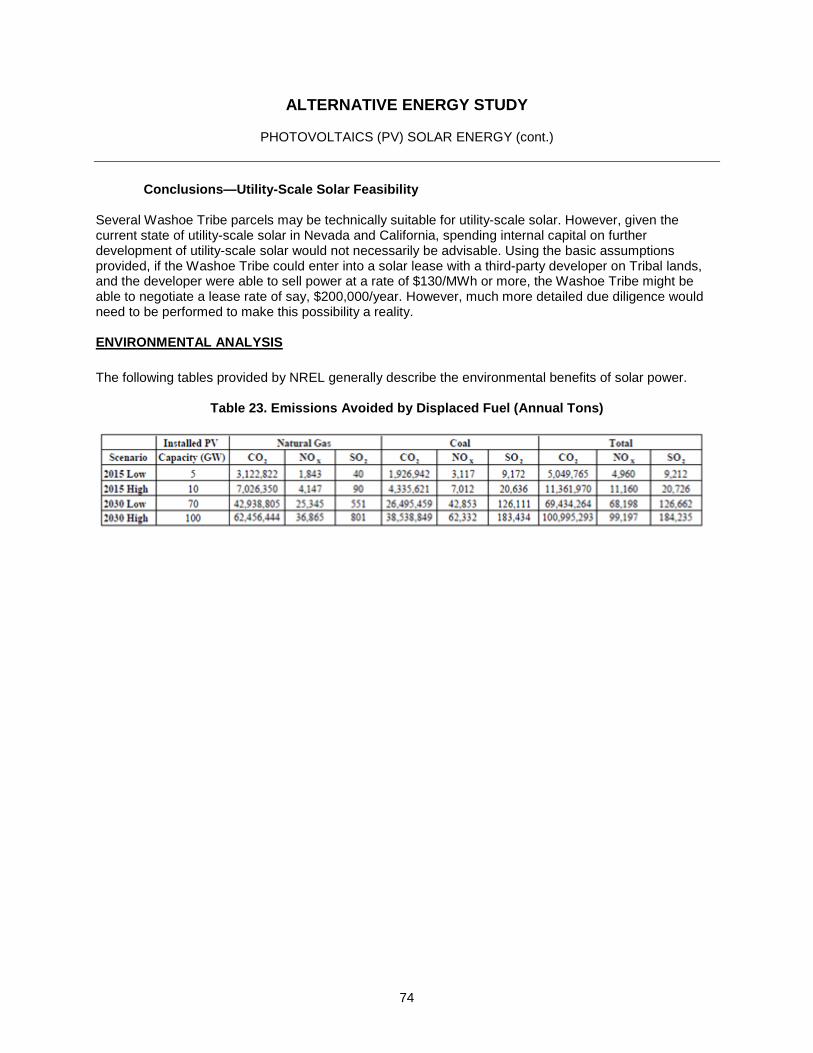
ALTERNATIVE ENERGY STUDY
PHOTOVOLTAICS (PV) SOLAR ENERGY (cont.)
74
Conclusions—Utility-Scale Solar Feasibility Several Washoe Tribe parcels may be technically suitable for utility-scale solar. However, given the current state of utility-scale solar in Nevada and California, spending internal capital on further development of utility-scale solar would not necessarily be advisable. Using the basic assumptions provided, if the Washoe Tribe could enter into a solar lease with a third-party developer on Tribal lands, and the developer were able to sell power at a rate of $130/MWh or more, the Washoe Tribe might be able to negotiate a lease rate of say, $200,000/year. However, much more detailed due diligence would need to be performed to make this possibility a reality. ENVIRONMENTAL ANALYSIS
The following tables provided by NREL generally describe the environmental benefits of solar power.
Table 23. Emissions Avoided by Displaced Fuel (Annual Tons)

ALTERNATIVE ENERGY STUDY
PHOTOVOLTAICS (PV) SOLAR ENERGY (cont.)
75
Table 24. Health Impacts due to Reduced Emissions

ALTERNATIVE ENERGY STUDY
CONCENTRATING SOLAR POWER (CSP) ENERGY
76
9. CONCENTRATING SOLAR POWER (CSP) ENERGY CSP INTRODUCTION
Concentrating Solar Power Basics Many power plants today use fossil fuels as a heat source to boil water. The steam from the boiling water spins a large turbine, which drives a generator to produce electricity. However, a new generation of power plants with concentrating solar power systems uses the sun as a heat source. The three main types of concentrating solar power systems are linear concentrator, dish/engine, and power tower systems. Linear concentrator systems collect the sun's energy using long rectangular, curved (U-shaped) mirrors. The mirrors are tilted toward the sun, focusing sunlight on tubes (or receivers) that run the length of the mirrors. The reflected sunlight heats a fluid flowing through the tubes. The hot fluid is then used to boil water in a conventional steam-turbine generator to produce electricity. The two major types of linear concentrator systems are (1) parabolic trough systems, where receiver tubes are positioned along the focal line of each parabolic mirror, and (2) linear Fresnel reflector systems, where one receiver tube is positioned above several mirrors to allow the mirrors greater mobility in tracking the sun. A dish/engine system uses a mirrored dish similar to a very large satellite dish. To minimize costs, though, the mirrored dish is usually composed of many smaller flat mirrors formed into a dish shape. The dish-shaped surface directs and concentrates sunlight onto a thermal receiver, which absorbs and collects the heat and transfers it to the engine generator. The most common type of heat engine used today in dish/engine systems is the Stirling engine. This system uses the fluid heated by the receiver to move pistons and create mechanical power. The mechanical power then is used to run a generator or alternator to produce electricity. A power tower system uses a large field of flat, sun-tracking mirrors known as heliostats to focus and concentrate sunlight onto a receiver on the top of a tower. A heat-transfer fluid heated in the receiver is used to generate steam, which, in turn, is used in a conventional turbine generator to produce electricity. Some power towers use water/steam as the heat-transfer fluid. Other advanced designs are experimenting with molten nitrate salt because of its superior heat-transfer and energy-storage capabilities. The energy-storage capability, or thermal storage, allows the system to continue to dispatch electricity during cloudy weather or at night.

ALTERNATIVE ENERGY STUDY
CONCENTRATING SOLAR POWER (CSP) ENERGY (cont.)
77
Solar Reserve’s “Crescent Dunes” project in Tonopah, NV, which is estimated to cost just under $1 billion18
While there are many advantages to concentrated solar power, currently the only legitimate developers of CSP projects in the United States are extremely well financed, technically savvy, and are in the exclusive business of developing and building these types of assets. Further, according to the Solar Energy Indus tries Association, CSP plants require: > Financing – The primary barrier to utility-
scale solar power is project financing. The 2008 economic crisis severely restricted the private sector capital that typically is used to finance renewable energy projects. Commercial banks today simply do not have enough appetite for long-term, low-interest debt to finance construction of every project in the queue.
> Areas of high, direct normal solar radiation – In order to concentrate the sun’s energy, it must not be too diffuse. This feature is captured by measuring the direct normal intensity (DNI) of the sun’s energy.
> Contiguous parcels of land with limited cloud cover – A CSP plant operates most efficiently, and thus most cost-effectively, when built in sizes of 100 MW and higher. While land needs will vary by technology, a typical CSP plant requires 5 to 10 acres of land per MW of capacity. The larger acreage accommodates thermal energy storage.
> Access to water resources – Like other thermal power plants (such as natural gas, coal, and nuclear), some systems require access to water for cooling. All require small amounts of water to wash collection and mirror surfaces. CSP plants can utilize wet, dry, and hybrid cooling techniques to maximize efficiency in electricity generation and water conservation.
> Available and proximate transmission access – CSP plants must be sited on land suitable for power generation with adequate access to an increasingly stressed and outdated transmission grid. Access to high-voltage transmission lines is key for the development of utility-scale solar power projects to move electricity from the solar plant to end users. Much of the existing transmission infrastructure is at full capacity and new transmission is urgently needed.
18 ht tp:/ /www.cornerengineering.com/civi l-engineering/the- largest-renewable-energy-projects-in-the-world
Figure 45. Photograph of Solar Reserve's Crescent Dunes Project

ALTERNATIVE ENERGY STUDY
CONCENTRATING SOLAR POWER (CSP) ENERGY (cont.)
78
TECHNICAL ANALYSIS
Based on data from the Washoe Tribe and NREL, Figure 46 below shows the estimated concentrated solar resource for parcels within the Washoe footprint:
Figure 46. Estimated CSP potential for parcels within Washoe Footprint
Despite the quality solar resource within the Washoe parcel for the purposes of concentrated solar power development, given the other factors outlined previously, it is not advisable at this time that the Washoe Tribe pursue CSP projects.
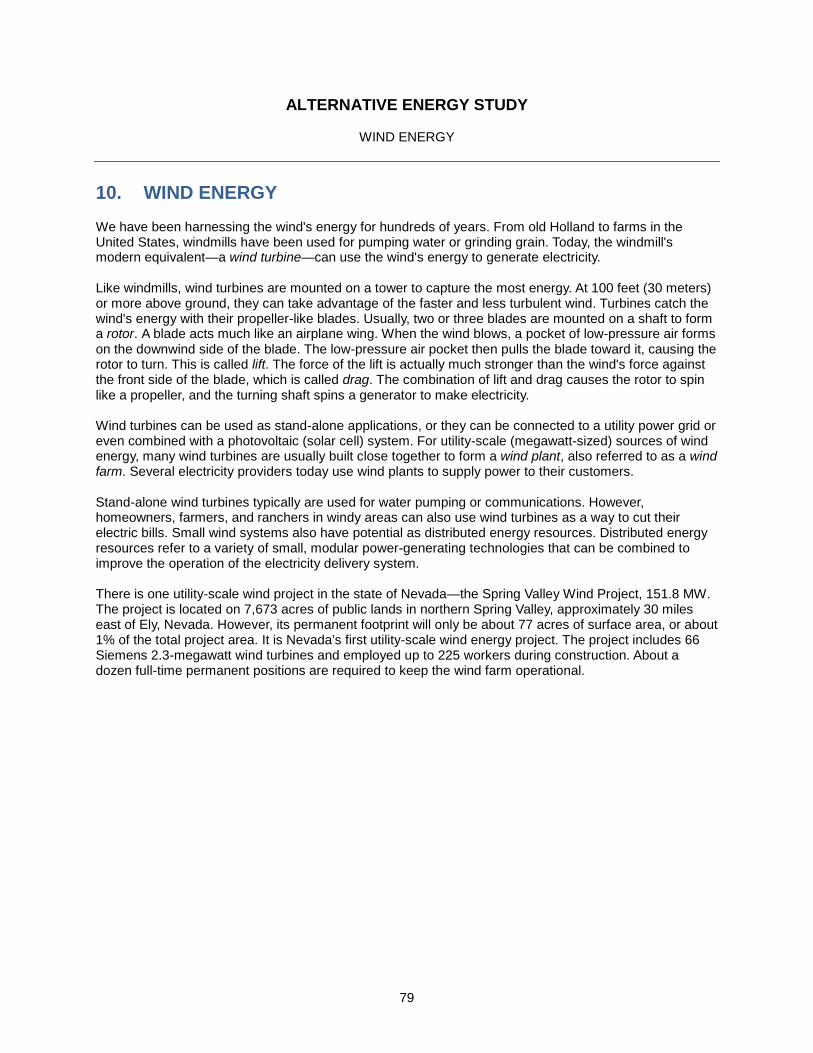
ALTERNATIVE ENERGY STUDY
WIND ENERGY
79
10. WIND ENERGY We have been harnessing the wind's energy for hundreds of years. From old Holland to farms in the United States, windmills have been used for pumping water or grinding grain. Today, the windmill's modern equivalent—a wind turbine—can use the wind's energy to generate electricity. Like windmills, wind turbines are mounted on a tower to capture the most energy. At 100 feet (30 meters) or more above ground, they can take advantage of the faster and less turbulent wind. Turbines catch the wind's energy with their propeller-like blades. Usually, two or three blades are mounted on a shaft to form a rotor. A blade acts much like an airplane wing. When the wind blows, a pocket of low-pressure air forms on the downwind side of the blade. The low-pressure air pocket then pulls the blade toward it, causing the rotor to turn. This is called lift. The force of the lift is actually much stronger than the wind's force against the front side of the blade, which is called drag. The combination of lift and drag causes the rotor to spin like a propeller, and the turning shaft spins a generator to make electricity. Wind turbines can be used as stand-alone applications, or they can be connected to a utility power grid or even combined with a photovoltaic (solar cell) system. For utility-scale (megawatt-sized) sources of wind energy, many wind turbines are usually built close together to form a wind plant, also referred to as a wind farm. Several electricity providers today use wind plants to supply power to their customers. Stand-alone wind turbines typically are used for water pumping or communications. However, homeowners, farmers, and ranchers in windy areas can also use wind turbines as a way to cut their electric bills. Small wind systems also have potential as distributed energy resources. Distributed energy resources refer to a variety of small, modular power-generating technologies that can be combined to improve the operation of the electricity delivery system. There is one utility-scale wind project in the state of Nevada—the Spring Valley Wind Project, 151.8 MW. The project is located on 7,673 acres of public lands in northern Spring Valley, approximately 30 miles east of Ely, Nevada. However, its permanent footprint will only be about 77 acres of surface area, or about 1% of the total project area. It is Nevada’s first utility-scale wind energy project. The project includes 66 Siemens 2.3-megawatt wind turbines and employed up to 225 workers during construction. About a dozen full-time permanent positions are required to keep the wind farm operational.
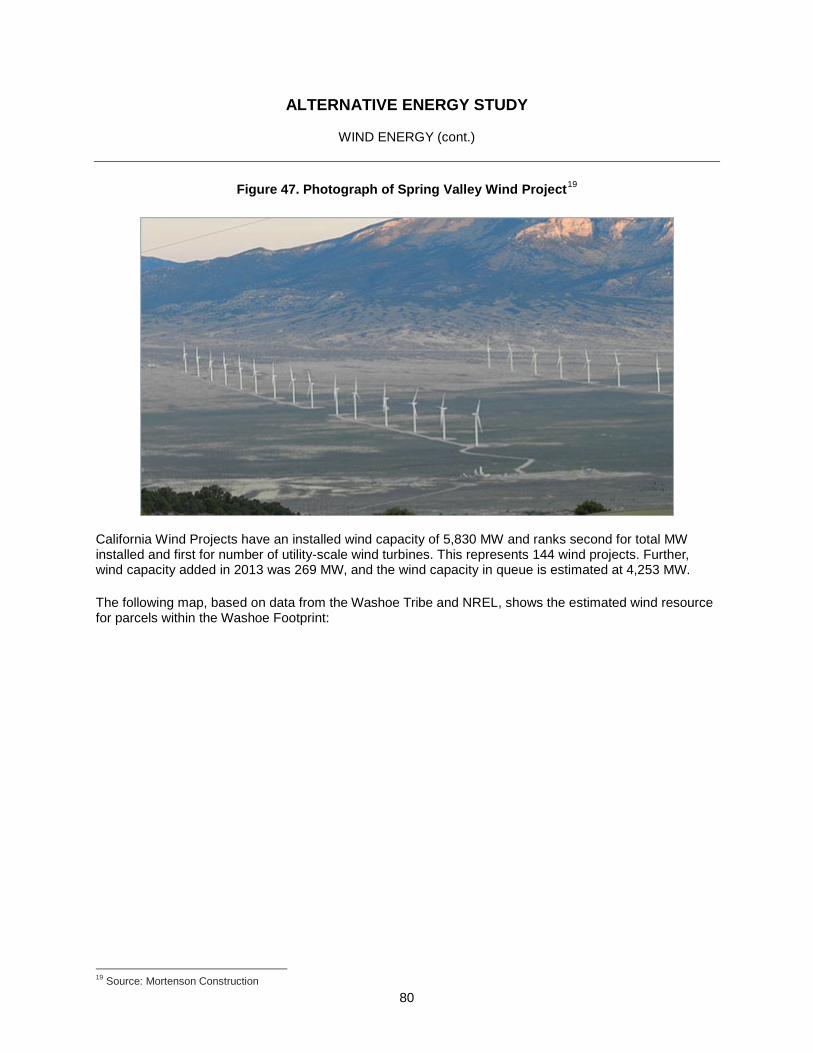
ALTERNATIVE ENERGY STUDY
WIND ENERGY (cont.)
80
Figure 47. Photograph of Spring Valley Wind Project19
California Wind Projects have an installed wind capacity of 5,830 MW and ranks second for total MW installed and first for number of utility-scale wind turbines. This represents 144 wind projects. Further, wind capacity added in 2013 was 269 MW, and the wind capacity in queue is estimated at 4,253 MW. The following map, based on data from the Washoe Tribe and NREL, shows the estimated wind resource for parcels within the Washoe Footprint:
19 Source: Mortenson Construction
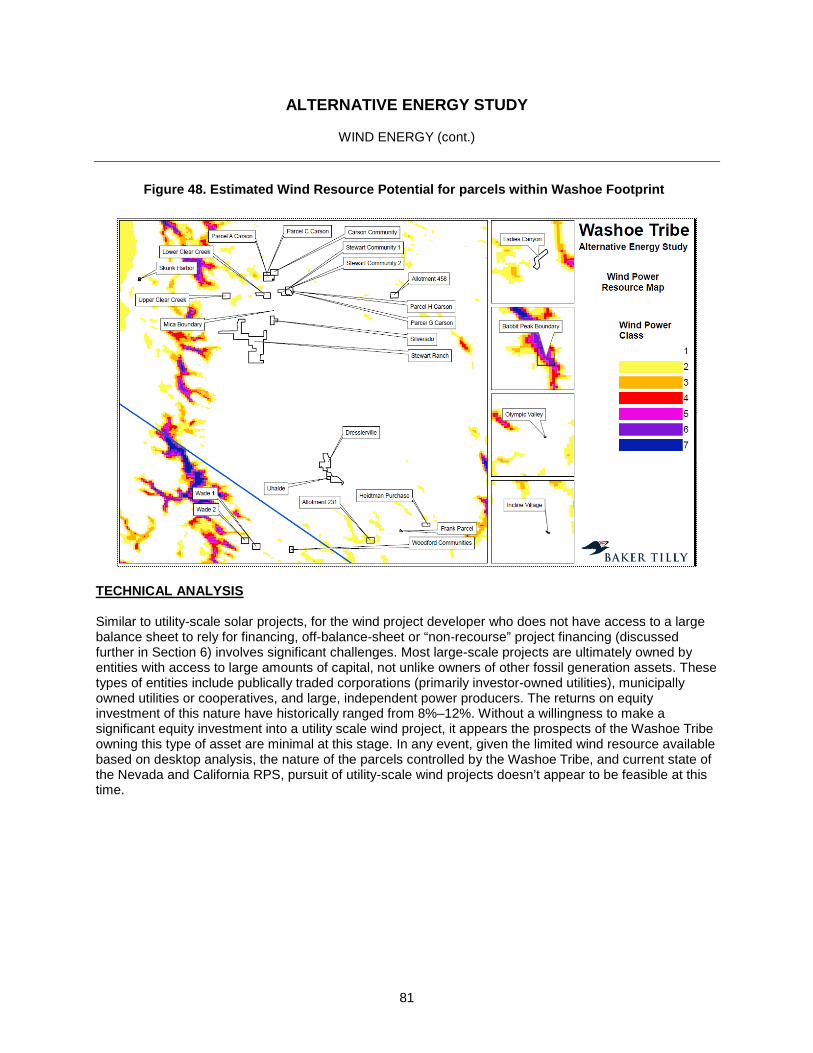
ALTERNATIVE ENERGY STUDY
WIND ENERGY (cont.)
81
Figure 48. Estimated Wind Resource Potential for parcels within Washoe Footprint
TECHNICAL ANALYSIS Similar to utility-scale solar projects, for the wind project developer who does not have access to a large balance sheet to rely for financing, off-balance-sheet or “non-recourse” project financing (discussed further in Section 6) involves significant challenges. Most large-scale projects are ultimately owned by entities with access to large amounts of capital, not unlike owners of other fossil generation assets. These types of entities include publically traded corporations (primarily investor-owned utilities), municipally owned utilities or cooperatives, and large, independent power producers. The returns on equity investment of this nature have historically ranged from 8%‒12%. Without a willingness to make a significant equity investment into a utility scale wind project, it appears the prospects of the Washoe Tribe owning this type of asset are minimal at this stage. In any event, given the limited wind resource available based on desktop analysis, the nature of the parcels controlled by the Washoe Tribe, and current state of the Nevada and California RPS, pursuit of utility-scale wind projects doesn’t appear to be feasible at this time.

ALTERNATIVE ENERGY STUDY
WIND ENERGY (cont.)
82
ENVIRONMENTAL ANALYSIS
A primary benefit of using wind-generated electricity is that it can play an important role in reducing the levels of carbon dioxide (CO2) emitted into the atmosphere. Wind-generated electricity is produced without emitting CO2, the GHG that is the major cause of global climate change. Today, CO2 emissions in the United States approach 6 billion metric tons annually, 39% of which are produced when electricity is generated from fossil fuels (EIA 2006). If the United States obtained 20% of its electricity from wind energy, the country could avoid putting 825 million metric tons of CO2 annually into the atmosphere by 2030, or a cumulative total of 7,600 million metric tons by 2030. A relatively straightforward metric used to understand the carbon benefits of wind energy is that a single 1.5 MW wind turbine displaces 2,700 metric tons of CO2 per year compared with the current U.S. average utility fuel mix, or the equivalent of planting 4 square kilometers of forest every year (AWEA 2007).
The fuel displaced by wind-generated electricity depends on the local grid and the type of generation supply. In most places, natural gas is the primary fuel displaced. Wind energy can displace coal on electric grids with large amounts of coal-fired generation. In the future, wind energy is likely to offset more coal by reducing the need to build new coal plants. Regardless of the actual fuel supplanted, more electricity generated from wind turbines means that other nonrenewable, fossil-based fuels are not being consumed. In New York, for example, a study prepared for the independent system operator (ISO) found that if wind energy provided 10% of the state’s peak electricity demand, 65% of the energy displaced would be from natural gas, followed by coal at 15%, oil at 10%, and electricity imported from out of state at 10% (Piwko et al. 2005). In addition, manufacturing wind turbines and building wind plants together generate only minimal amounts of CO2 emissions. One university study that examined the issue (White and Kulsinski 1998) found that when these emissions are analyzed on a life-cycle basis, wind energy’s CO2 emissions are extremely low—about 1% of those from coal, or 2% of those from natural gas, per unit of electricity generated. In other words, using wind instead of coal reduces CO2 emissions by 99%; using wind instead of gas reduces CO2 emissions by 98%.

ALTERNATIVE ENERGY STUDY
WIND ENERGY (cont.)
83
11. GEOTHERMAL ENERGY GEOTHERMAL INTRODUCTION
Many technologies have been developed to take advantage of geothermal energy—the heat from the earth. This heat can be drawn from several sources: hot water or steam reservoirs deep in the earth that are accessed by drilling; geothermal reservoirs located near the earth's surface, mostly located in the western US, Alaska, and Hawaii; and the shallow ground near the earth's surface that maintains a relatively constant temperature of 50°‒60°F. A basic summary of the advantages and challenges of geothermal power is represented in Figure 49.
Figure 49. The Pros and Cons of Geothermal Power20
This variety of geothermal resources allows them to be used on both large and small scales. A utility can use the hot water and steam from reservoirs to drive generators and produce electricity for its customers. Other applications apply the heat produced from geothermal directly to various uses in buildings, roads, agriculture, and industrial plants. Still others use the heat directly from the ground to provide heating and cooling in homes and other buildings.
20 http://www.esmap.org/sites/esmap.org/files/DocumentLibrary/FINAL_Geothermal%20Handbook_TR002-12_Reduced.pdf

ALTERNATIVE ENERGY STUDY
WIND ENERGY (cont.)
84
Large-scale geothermal plants utilizing deep resource temperatures between ~200˚F and 700˚F have been producing commercial power in the US since the 1960s. After careful exploration and analysis, wells are drilled to access a geothermal reservoir and bring geothermal energy to the surface, where it is converted into electricity. Figures 51-54 depict the three commercial types of conventional geothermal power plants: flash, dry steam, and binary. Figure 53 shows an example of a hybrid plant, a flash/binary combined cycle. In a geothermal flash power plant, high-pressure geothermal water separates into steam and water as it rises from depth and pressure drops. The steam and liquid are separated in a surface vessel, called a steam separator (Figure 50). The steam is delivered to the turbine, and the turbine powers a generator. The liquid is injected back into the reservoir. As of 2012, about 900 MW of the 3,187 MW of installed geothermal capacity in the US comprises steam-flash power plants, with the majority in California.
Figure 50. Flash Power Plant
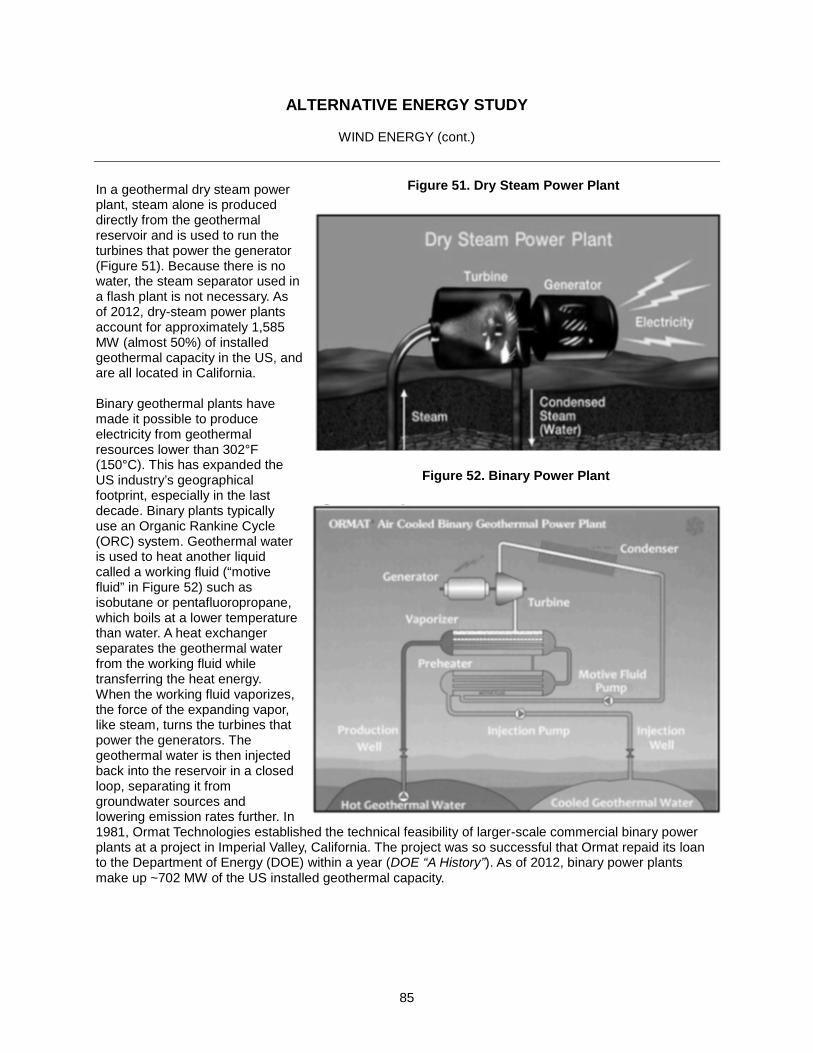
ALTERNATIVE ENERGY STUDY
WIND ENERGY (cont.)
85
In a geothermal dry steam power plant, steam alone is produced directly from the geothermal reservoir and is used to run the turbines that power the generator (Figure 51). Because there is no water, the steam separator used in a flash plant is not necessary. As of 2012, dry-steam power plants account for approximately 1,585 MW (almost 50%) of installed geothermal capacity in the US, and are all located in California. Binary geothermal plants have made it possible to produce electricity from geothermal resources lower than 302°F (150°C). This has expanded the US industry’s geographical footprint, especially in the last decade. Binary plants typically use an Organic Rankine Cycle (ORC) system. Geothermal water is used to heat another liquid called a working fluid (“motive fluid” in Figure 52) such as isobutane or pentafluoropropane, which boils at a lower temperature than water. A heat exchanger separates the geothermal water from the working fluid while transferring the heat energy. When the working fluid vaporizes, the force of the expanding vapor, like steam, turns the turbines that power the generators. The geothermal water is then injected back into the reservoir in a closed loop, separating it from groundwater sources and lowering emission rates further. In 1981, Ormat Technologies established the technical feasibility of larger-scale commercial binary power plants at a project in Imperial Valley, California. The project was so successful that Ormat repaid its loan to the Department of Energy (DOE) within a year (DOE “A History”). As of 2012, binary power plants make up ~702 MW of the US installed geothermal capacity.
Figure 51. Dry Steam Power Plant
Figure 52. Binary Power Plant

ALTERNATIVE ENERGY STUDY
WIND ENERGY (cont.)
86
Hybrid power plants allow for the integration of numerous generating technologies. Geothermal fluid is flashed to a mixture of steam and liquid in a separator. The steam is fed to a turbine as in a flash-steam generator, and the separated liquid is fed to a binary cycle generator (Figure 53).
Another example of a hybrid plant is the Stillwater solar-geothermal plant in Nevada. This technology may help to allow projects that would otherwise have been unfeasible as stand-alone geothermal or solar projects to be more economically and technologically viable.
Figure 53. Flash/Binary Power Plant

ALTERNATIVE ENERGY STUDY
WIND ENERGY (cont.)
87
NV Energy leads the nation in geothermal energy development, having signed its first geothermal energy agreement in 1983, and its customers are now benefiting from more than 385 MW of installed geothermal energy capacity in Nevada, along with new contracts for more than 150 MW of additional geothermal energy that is in the construction or development stage. According to the Geothermal Energy Association, Nevada leads the nation in geothermal energy development. A summary of existing geothermal projects in Nevada is shown in Table 23.
Table 23. Summary of NV Energy's Existing Geothermal Projects
Plant Name, Capacity Location and Description Beowawe Power 17.7 MW
Located in Eureka County, Nev., the Beowawe geothermal power station is owned by Terra-Gen Power and started producing energy in 2006.
Brady 24 MW
Located in Churchill County northeast of Fernley, Nev., the Brady Geothermal Power Plant is owned by Ormat Technologies and started producing energy in 1992.
Desert Peak 25 MW
Located in Churchill County, Nev., the Desert Peak geothermal power station is owned by Ormat Technologies and started producing energy in 2007.
Dixie Meadows 51 MW
Located in Churchill County, Nev., the Dixie Meadows geothermal power station is being developed by Ormat Technologies and expects to be producing electricity by 2015.
Faulkner 1 49.5 MW
Located in Humboldt County near Blue Mountain, Nev., the Faulkner 1 geothermal power station is owned by Nevada Geothermal Power Company. It started producing energy for NV Energy customers in 2009.
Galena 2 13 MW
Located in Washoe County south of Reno near Steamboat, Nev., the Galena 2 geothermal power station is owned by Ormat Technologies and started producing energy in 2007.
Galena 3 26.5 MW
Located in Washoe County south of Reno near Steamboat, Nev., the Galena 3 geothermal power station is owned by Ormat Technologies and started producing energy in 2008.
Homestretch 5.6 MW
Located in Lyon County north of Yerington, Nev., the Homestretch geothermal plants are the oldest geothermal projects providing energy to NV Energy customers. Completed in 1986, the units are owned by Homestretch Geothermal, LLC.
Jersey Valley 22.5 MW
The Jersey Valley geothermal project is owned by Ormat Technologies and is located in a remote area in both the Lander and Pershing Counties of Nevada. The project came on line in 2012.
McGinnis Hills 48 MW
In the construction stage, the McGinniss Hills geothermal project is owned by Ormat Technologies Co. and is located in a remote area in both the Lander and Pershing Counties of Nevada.
Richard Burdette 26 MW
Located in Washoe County near Steamboat, Nev., the Richard Burdette Geothermal Power Plant is owned by Ormat Technologies and went into service in 2006.
Salt Wells 23.6 MW
Located in Churchill County east of Fallon, Nev., the Salt Wells Geothermal Plant is owned by Enel North America and began providing energy for NV Energy customers in 2009.
San Emidio 1.8 MW
Located in northern Washoe County south of Gerlach, Nev., the San Emidio Geothermal Plant is owned by US Geothermal Inc. It has been providing geothermal energy to NV Energy customers since 1987 and was expanded in 2012.
Soda Lake 1 & 2 23.1 MW
Located in Churchill County east of Fallon, Nev., the Soda Lake 1 & 2 Geothermal Plants are owned by Magma Energy Corp. and began providing energy for NV Energy customers in 1987 and 1991 respectively.
Steamboat Hills 14.6 MW
Located in Washoe County, the Steamboat Hills Geothermal Plant is owned by Ormat Technologies and began providing energy for NV Energy customers in 1988.
Steamboat 1A 2 MW
Located in Washoe County, the Steamboat 1A Geothermal Plant is owned by Ormat Technologies and began providing energy for NV Energy customers in 1988.
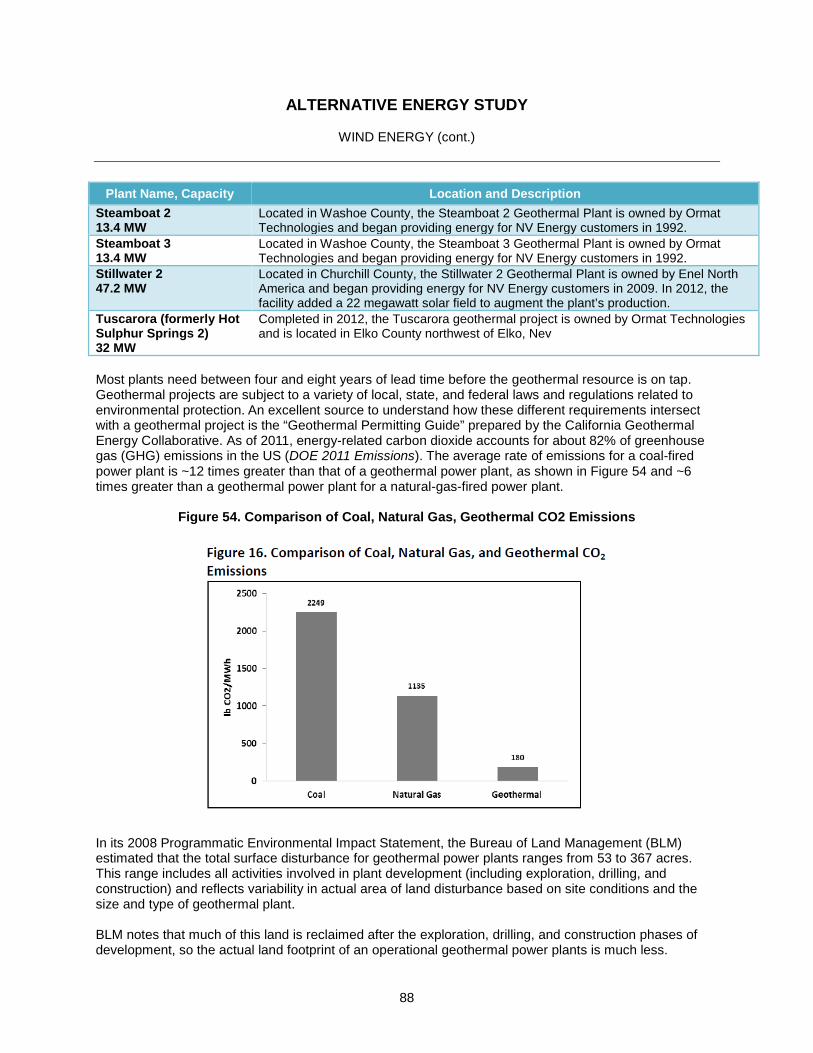
ALTERNATIVE ENERGY STUDY
WIND ENERGY (cont.)
88
Plant Name, Capacity Location and Description Steamboat 2 13.4 MW
Located in Washoe County, the Steamboat 2 Geothermal Plant is owned by Ormat Technologies and began providing energy for NV Energy customers in 1992.
Steamboat 3 13.4 MW
Located in Washoe County, the Steamboat 3 Geothermal Plant is owned by Ormat Technologies and began providing energy for NV Energy customers in 1992.
Stillwater 2 47.2 MW
Located in Churchill County, the Stillwater 2 Geothermal Plant is owned by Enel North America and began providing energy for NV Energy customers in 2009. In 2012, the facility added a 22 megawatt solar field to augment the plant’s production.
Tuscarora (formerly Hot Sulphur Springs 2) 32 MW
Completed in 2012, the Tuscarora geothermal project is owned by Ormat Technologies and is located in Elko County northwest of Elko, Nev
Most plants need between four and eight years of lead time before the geothermal resource is on tap. Geothermal projects are subject to a variety of local, state, and federal laws and regulations related to environmental protection. An excellent source to understand how these different requirements intersect with a geothermal project is the “Geothermal Permitting Guide” prepared by the California Geothermal Energy Collaborative. As of 2011, energy-related carbon dioxide accounts for about 82% of greenhouse gas (GHG) emissions in the US (DOE 2011 Emissions). The average rate of emissions for a coal-fired power plant is ~12 times greater than that of a geothermal power plant, as shown in Figure 54 and ~6 times greater than a geothermal power plant for a natural-gas-fired power plant.
Figure 54. Comparison of Coal, Natural Gas, Geothermal CO2 Emissions
In its 2008 Programmatic Environmental Impact Statement, the Bureau of Land Management (BLM) estimated that the total surface disturbance for geothermal power plants ranges from 53 to 367 acres. This range includes all activities involved in plant development (including exploration, drilling, and construction) and reflects variability in actual area of land disturbance based on site conditions and the size and type of geothermal plant. BLM notes that much of this land is reclaimed after the exploration, drilling, and construction phases of development, so the actual land footprint of an operational geothermal power plants is much less.
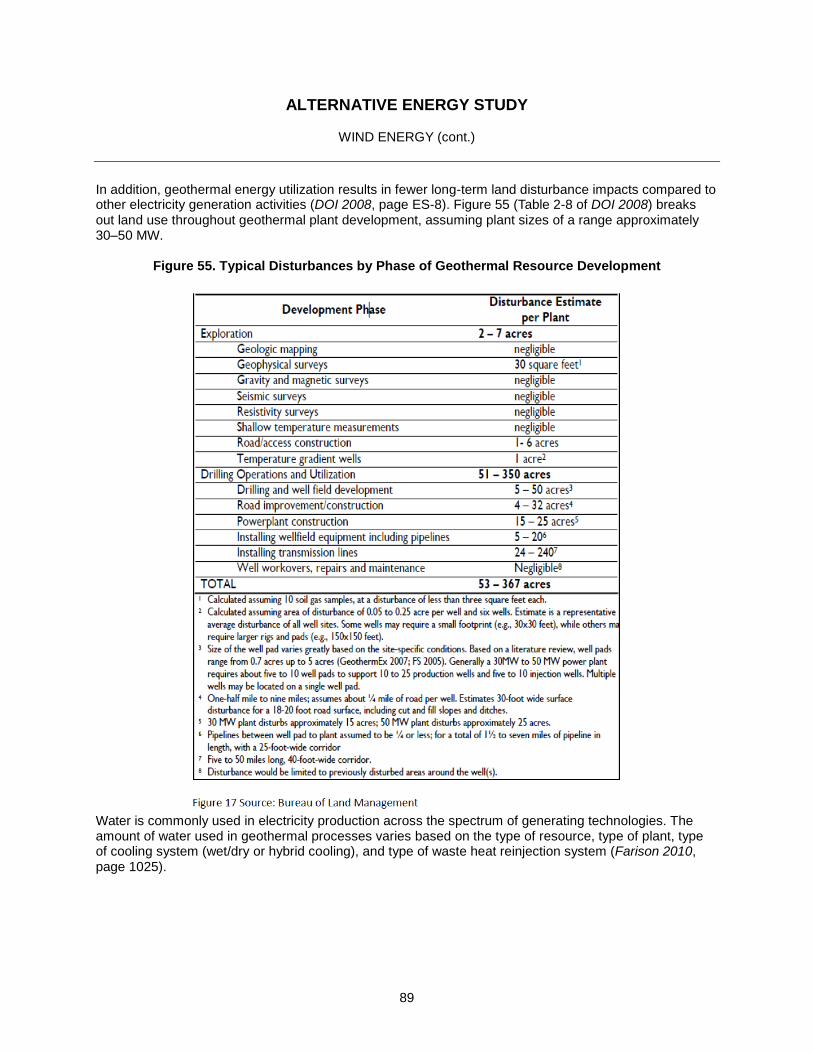
ALTERNATIVE ENERGY STUDY
WIND ENERGY (cont.)
89
In addition, geothermal energy utilization results in fewer long-term land disturbance impacts compared to other electricity generation activities (DOI 2008, page ES-8). Figure 55 (Table 2-8 of DOI 2008) breaks out land use throughout geothermal plant development, assuming plant sizes of a range approximately 30‒50 MW.
Figure 55. Typical Disturbances by Phase of Geothermal Resource Development
Water is commonly used in electricity production across the spectrum of generating technologies. The amount of water used in geothermal processes varies based on the type of resource, type of plant, type of cooling system (wet/dry or hybrid cooling), and type of waste heat reinjection system (Farison 2010, page 1025).
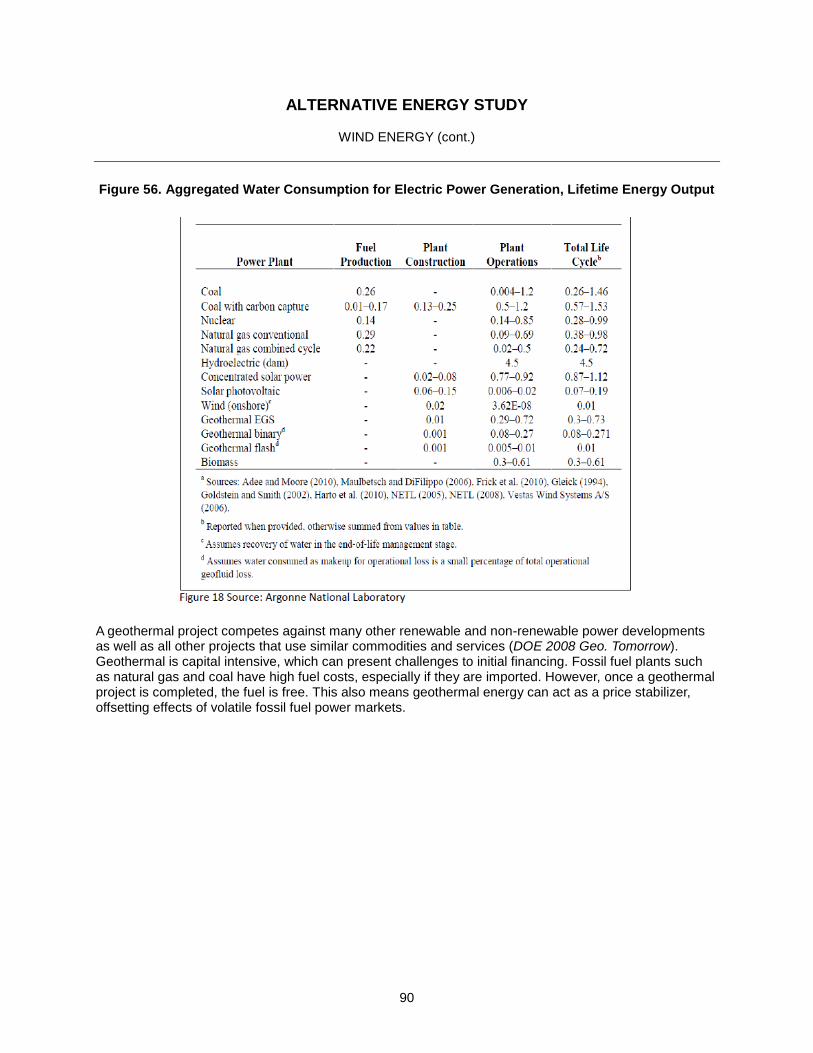
ALTERNATIVE ENERGY STUDY
WIND ENERGY (cont.)
90
Figure 56. Aggregated Water Consumption for Electric Power Generation, Lifetime Energy Output
A geothermal project competes against many other renewable and non-renewable power developments as well as all other projects that use similar commodities and services (DOE 2008 Geo. Tomorrow). Geothermal is capital intensive, which can present challenges to initial financing. Fossil fuel plants such as natural gas and coal have high fuel costs, especially if they are imported. However, once a geothermal project is completed, the fuel is free. This also means geothermal energy can act as a price stabilizer, offsetting effects of volatile fossil fuel power markets.
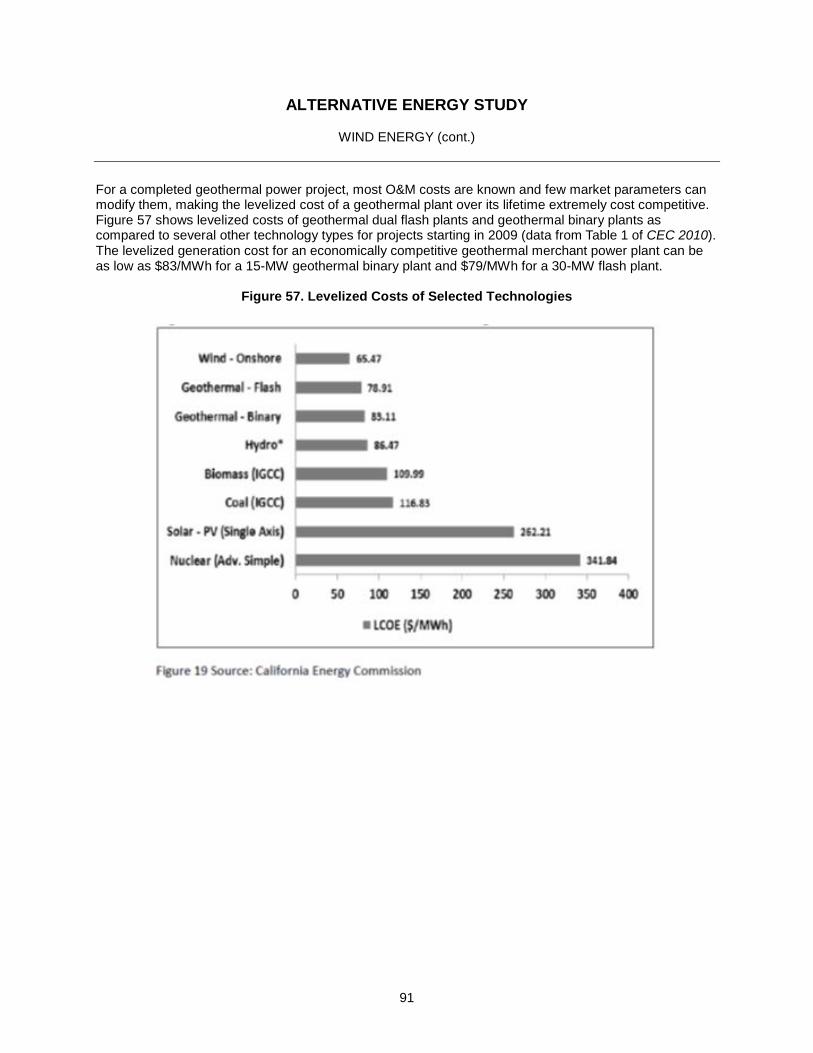
ALTERNATIVE ENERGY STUDY
WIND ENERGY (cont.)
91
For a completed geothermal power project, most O&M costs are known and few market parameters can modify them, making the levelized cost of a geothermal plant over its lifetime extremely cost competitive. Figure 57 shows levelized costs of geothermal dual flash plants and geothermal binary plants as compared to several other technology types for projects starting in 2009 (data from Table 1 of CEC 2010). The levelized generation cost for an economically competitive geothermal merchant power plant can be as low as $83/MWh for a 15-MW geothermal binary plant and $79/MWh for a 30-MW flash plant.
Figure 57. Levelized Costs of Selected Technologies
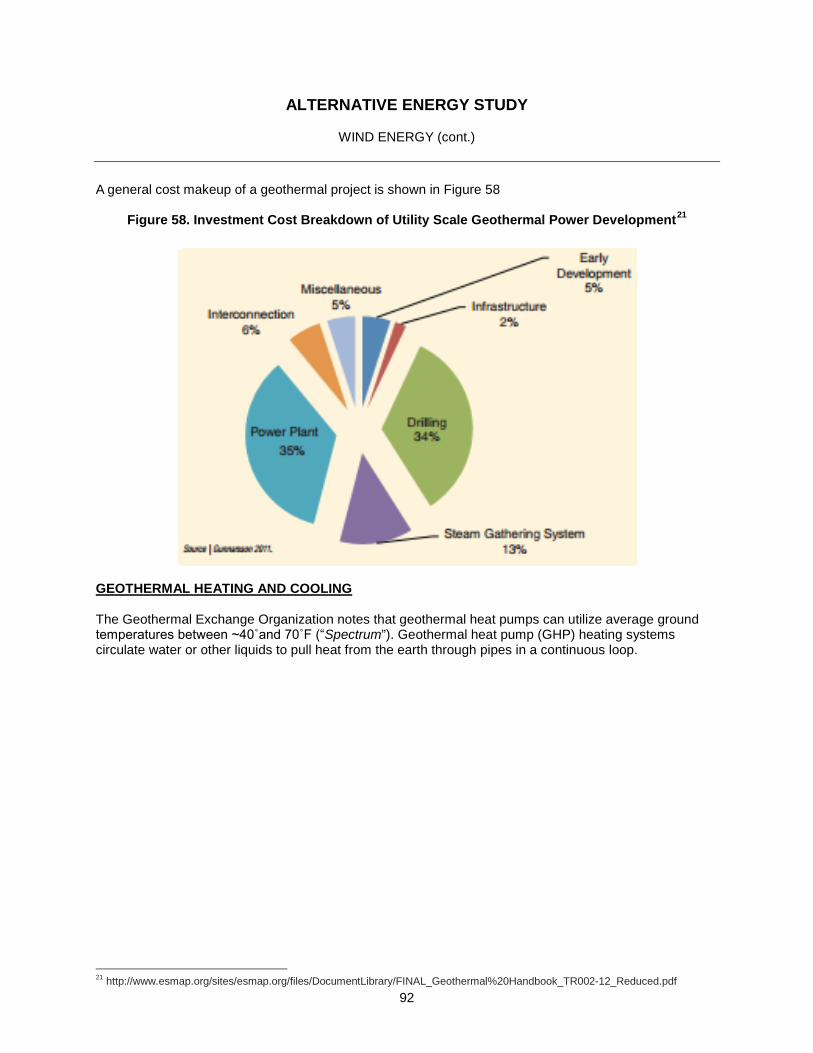
ALTERNATIVE ENERGY STUDY
WIND ENERGY (cont.)
92
A general cost makeup of a geothermal project is shown in Figure 58
Figure 58. Investment Cost Breakdown of Utility Scale Geothermal Power Development21
GEOTHERMAL HEATING AND COOLING The Geothermal Exchange Organization notes that geothermal heat pumps can utilize average ground temperatures between ~40˚and 70˚F (“Spectrum”). Geothermal heat pump (GHP) heating systems circulate water or other liquids to pull heat from the earth through pipes in a continuous loop.
21 http://www.esmap.org/sites/esmap.org/files/DocumentLibrary/FINAL_Geothermal%20Handbook_TR002-12_Reduced.pdf

ALTERNATIVE ENERGY STUDY
WIND ENERGY (cont.)
93
Figure 59. Geothermal Heat Pumps
Electricity is used to boost or cool the temperature and distribute it through a heat pump and conventional duct system. For cooling, the process is reversed; the system extracts heat from the building and moves it back into the earth loop. The loop system can be used almost everywhere in the world, taking advantage of the earth’s relatively constant temperature at depths below about 10 ft. to 300 ft., and can be buried conveniently on a property such as under a landscaped area, parking lot, or pond, either horizontally or vertically (Figure 59). A GHP system can also direct the heat to a water heater unit for hot water use. The U. Environmental Protection Agency (EPA) has said geothermal heating and cooling systems are the most energy-efficient, environmentally clean, and cost-effective space conditioning systems available (EPA 1993). GHPs are used in all 50 states and are more than 45% more energy efficient than standard heating and cooling system options (EPA “Heat Pumps”). Homeowners who install qualified GHPs are eligible for a 30% federal tax credit through December 31, 2016. Modern GHP technology took off in the US in the 1930s and 40s. In 1940, the first residential space heating in Nevada began in Reno; and in 1948, a professor at Ohio State University developed the first ground-source heat pump for use at his residence. A groundwater heat pump came into commercial building use in Portland, Oregon, around the same time (DOE “A History”).

ALTERNATIVE ENERGY STUDY
WIND ENERGY (cont.)
94
TECHNICAL ANALYSIS
The following figure, based on data from the Washoe Tribe and NREL, shows the estimated geothermal resource for parcels within the Washoe footprint:
Figure 60. Estimated Geothermal Resource Potential for parcels within Washoe Footprint
Utility-Scale Development Overview
A geothermal power project can be divided into a series of development phases before the actual operation and maintenance (O&M) phase commences. These include preliminary survey; exploration; test drilling; project review and planning; field development; construction; and start-up and commissioning. Development of a typical utility-size geothermal project will usually take between 5 to 10 years, depending on the geological conditions, information available about the resource, institutional and regulatory climate, access to suitable financing, and other factors. Risks faced by a grid-connected geothermal power project include: resource risk and the related risk of oversizing the power plant; financing risks due to high up-front cost and long lead time; completion/delay risk; operational risks; off-take risk; price risk; and regulatory risk. The upstream phases, and especially the test-drilling phase, are usually seen as the riskiest parts of geothermal project development, reflecting the difficulty of estimating the resource capacity of a geothermal field and the costs associated with its development.

ALTERNATIVE ENERGY STUDY
WIND ENERGY (cont.)
95
Balancing the probability of success against the costs of a failure to reach the best expected outcome can be handled by formal techniques such as the use of a decision tree. The technique allows analyzing and adopting choices that maximize the expected value of geothermal development by applying probabilities to various project outcomes. Local environmental impacts from geothermal power replacing the use of fossil fuels tend to be positive on balance. However, like any infrastructure development, geothermal power has its own social and environmental impacts and risks that have to be managed. It is also crucial to consult and involve all relevant stakeholders, presenting the trade-offs and ways to overcome challenges specific to the project.
Figure 61. Market Structure of Various Segments of Geothermal Industry22
22 http://www.esmap.org/sites/esmap.org/files/DocumentLibrary/FINAL_Geothermal%20Handbook_TR002-12_Reduced.pdf

ALTERNATIVE ENERGY STUDY
WIND ENERGY (cont.)
96
Figure 62. Geothermal Project Development for a Unit of Approximately 50 MW23
23 http://www.esmap.org/sites/esmap.org/files/DocumentLibrary/FINAL_Geothermal%20Handbook_TR002-12_Reduced.pdf

ALTERNATIVE ENERGY STUDY
WIND ENERGY (cont.)
97
Conclusions Based on information provided by Lumos & Associates as well as GDA through their recent geothermal resource analysis provided to the Washoe Tribe, it does not appear that the geothermal resource contained within the Washoe Tribe available parcels will support a utility scale geothermal electrical generation project. Subject to further testing, the resource may be adequate to support a direct use application. However, the best direct use application locations appear to be in areas where there is not currently available use of the resource, so the use would need to be developed (e.g. fish farm, greenhouse) prior to evaluating the feasibility of the source versus alternative energy sources.

ALTERNATIVE ENERGY STUDY
BIOMASS ENERGY
98
12. BIOMASS ENERGY BIOMASS INTRODUCTION
We have used biomass energy, or "bioenergy"—the energy from plants and plant-derived materials—since people began burning wood to cook food and keep warm. Wood is still the largest biomass energy resource today, but other sources of biomass can also be used. These include food crops, grassy and woody plants, residues from agriculture or forestry, and the organic component of municipal and industrial wastes.
Benefits of Using Biomass
Biomass can be used for fuels, power production, and products that would otherwise be made from fossil fuels. In such scenarios, biomass can provide an array of benefits. For example: The use of biomass energy has the potential to greatly reduce greenhouse gas emissions. Burning biomass releases about the same amount of carbon dioxide as burning fossil fuels. However, fossil fuels release carbon dioxide captured by photosynthesis millions of years ago—an essentially "new" greenhouse gas. Biomass, on the other hand, releases carbon dioxide that is largely balanced by the carbon dioxide captured in its own growth (depending how much energy was used to grow, harvest, and process the fuel). However, recent studies have found that clearing forests to grow biomass results in a carbon penalty that takes decades to recoup, so it is best if biomass is grown on previously cleared land, such as underutilized farmland. The use of biomass can reduce US dependence on foreign oil because biofuels are the only renewable liquid transportation fuels available. Biomass energy supports US agricultural and forest-product industries. The main biomass feedstocks for power are paper mill residue, lumber mill scrap, and municipal waste. For biomass fuels, the most common feedstocks used today are corn grain (for ethanol) and soybeans (for biodiesel). In the near future, agricultural residues such as corn stover (the stalks, leaves, and husks of the plant) and wheat straw are likely to be more commonly utilized. The California biomass power industry consists of 31 plants running at this time, and 11 plants that are idle. The idle plants are in various states of disrepair, ranging from essentially operable with minor work to seriously degraded and in need of major investment to restart. The total operating capacity is about 610 MW, and the idle capacity is about 122 MW. Some biomass plants have been dismantled. Most of the biomass plants that have closed did so for economic reasons and the inability to compete on price with fossil-fueled generation. The plants are distributed across 17 California counties.

ALTERNATIVE ENERGY STUDY
BIOMASS ENERGY (cont.)
99
While all renewable energy projects are different, traditional woody biomass power generation is intrinsically much more expensive than natural gas‒fueled generation and most other forms of renewable generation. This high cost of generation is largely due to the costs associated with the biomass fuel, but also to high capital cost and an efficiency only half that of a combined-cycle gas turbine. Biomass fuel costs include costs of collection, processing, quality control, and transportation of the material to the plant; costs of handling, blending, feeding at the plant; costs of emission controls peculiar to wood fuel combustion; and costs of ash disposal. Each of these steps is both labor and equipment intensive. Biomass power plants cannot realize the economies of scale available to a multi-hundred MW gas plant, because the fuel shed limits plant size. Fuel cannot be economically obtained from much more than about 100 miles away, and thus the recurring volume of waste wood within this distance inherently limits the amount of fuel and thus the plant size. Figure 63, courtesy of BBI International, identifies plants using woody biomass in California and Nevada.
Figure 63. Renewable Plants using Woody Biomass in California and Nevada
Minimal biomass to power project development in the local proximity to Washoe-controlled parcels has occurred to date. In addition, the relatively small area of Washoe parcels (just over 5,000 acres) does not suit “self-supply” of biomass for power production. The timeline to develop a biomass project can be extremely long due to the inherent challenges involved. For example, a relatively small (2 MW) project under development in Placer County, California, has been under development for 8 years. Also, this project received local resistance at the chosen initial site (Kings Beach). It should be noted that, from the outset, a primary goal of this project has been wildfire risk reduction via forest thinning, as much as power production. The following figures, based on data from the Washoe Tribe and NREL, display the estimated biomass resource for parcels within the Washoe footprint, looking at both crop residues and forest residues.

ALTERNATIVE ENERGY STUDY
BIOMASS ENERGY (cont.)
100
Figure 64. Estimated Biomass (Crop Residues) Resource Potential for parcels within Washoe Footprint
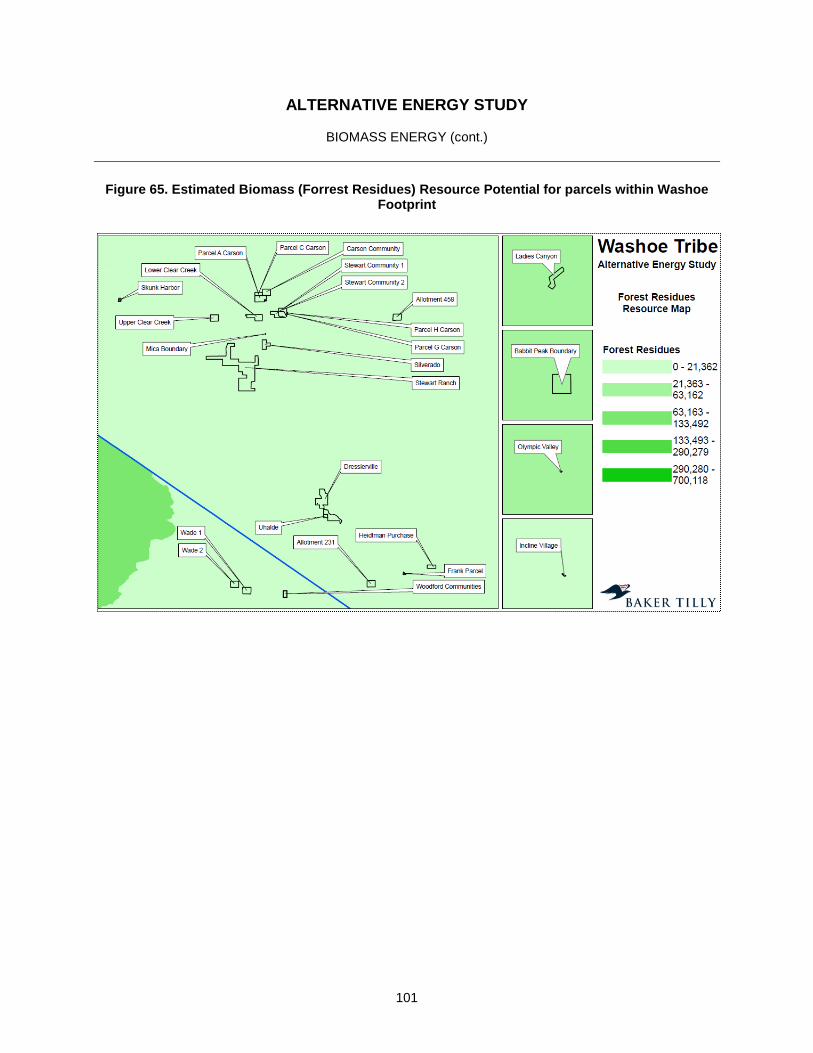
ALTERNATIVE ENERGY STUDY
BIOMASS ENERGY (cont.)
101
Figure 65. Estimated Biomass (Forrest Residues) Resource Potential for parcels within Washoe Footprint

ALTERNATIVE ENERGY STUDY
BIOMASS ENERGY (cont.)
102
Landfill Gas Projects Landfill gas is produced when organic materials (yard waste, food waste, household waste, paper, etc.) are decomposed by bacteria in an absence of oxygen. Rather than allowing this gas to escape into the air, the gas is captured, gathered, cleaned, and sent to turbine generators, where it is burned and used to produce electricity. A few examples of biomass projects in region are as follows:
CC Landfill Energy, LLC – 12.0 megawatts Located at Republic Services' Apex regional landfill north of Las Vegas, this project is Nevada’s largest landfill gas-to-energy facility. It is owned and operated by Energenic and began producing in 2012. Lockwood Renewable Energy Facility – 3.2 megawatts Located southeast of Reno at Waste Management's Lockwood Landfill, this landfill gas-to-energy project began providing renewable energy for NV Energy customers early in 2012. Sierra Pacific Industries – 10.0 megawatts Owned and operated by Sierra Pacific Industries, this wood chip biomass project was first operational in 1989. It is located in California, northwest of Reno, Nevada, in the Tahoe National Forest. Truckee Meadows Water Reclamation Facility – 0.8 megawatts Owned and operated by the City of Sparks, Nevada, this water and sewage recycling facility generates methane gas to power a small generator.
A growing number of biomass projects using anaerobic digestion have appeared in areas where there is a cost to dispose of food waste and/or food processing company waste where there is an existing cost of land application of the given waste stream. In this case, the “tipping fees” can provide a portion of revenue to support the development of a facility. If the Washoe Tribe had control of a site in the Reno vicinity, for example, it may be prudent to explore processing food waste from the local casino industry and converting it to power via anaerobic digestion. ENVIRONMENTAL ANALYSIS
Combustion of biomass fuels in modern power plants leads to many of the same kinds of emissions as the combustion of fossil fuels, including criteria air pollutants, greenhouse gases, and solid wastes (ash). Fuel processing, which in most cases involves some type of grinding operation, produces emissions of dust and particulates. Air emissions and water consumption are usually the principal sources of environmental concern related to biomass facilities. Biomass power plants are required to achieve stringent emissions control levels for the criteria, or regulated, pollutants. These include particulates, NOx, oxides of sulfur (SOx), hydrocarbons, and CO. NOx, hydrocarbons, and CO are usually controlled by using advanced combustion technologies, often including fluidized-bed combustors, staged-combustion, and flue-gas recirculation. Some of the newest biomass power facilities are required to use ammonia injection to further control NOx emissions. SOx emissions generally are not a concern with biomass combustion because biomass, especially woody forms of biomass, has a very low sulfur content. Some facilities that have fluidized-bed combustors inject limestone to capture sulfur, but no biomass facilities are required to have flue-gas scrubbers to control SOx emissions. Particulates are controlled using a variety of technologies. Virtually all biomass power plants use cyclones to remove most large particulates from the flue gas. Most biomass facilities are equipped with electrostatic precipitators for final particulate removal; some facilities use baghouses. Most modern biomass power plants are required to achieve zero visible emissions to meet environmental permit conditions. Their emissions of total and sub-micron particulates are also regulated and controlled to stringent levels, comparable to or better than the emissions levels achieved by the large fossil fuel power plants operated by the electric utility companies.

ALTERNATIVE ENERGY STUDY
BIOMASS ENERGY (cont.)
103
The production of electricity in biomass power plants helps reduce air pollution by displacing the production of power using conventional sources. There is considerable geographic variability, but the marginal generating source displaced by biomass generation in most cases in the United States is either natural gas-fired power generation or coal-fired power generation. The full net emissions reductions associated with biomass power generation can be calculated as the difference between the net emissions associated with the biomass power cycle alone, and those that would be produced by fossil fuel-based generation, which would be used if the biomass-generated power were not available.
Conclusions Given the available resources of the Washoe Tribe at its parcels, and other significant challenges associated with biomass to energy projects, it does not appear that pursuit of development of a project using this technology is prudent at this time. Exploring future opportunities where the opportunity to get paid a tip fee to handle third-party waste could be an option going forward.

ALTERNATIVE ENERGY STUDY
ORGANIZATIONAL ANALYSIS
104
13. ORGANIZATIONAL ANALYSIS RENEWABLE ENERGY DEVELOPMENT STEPS Renewable energy project development especially at a utility scale is typically an extremely challenging endeavour. This is primarily due to a number of factors, such as:
> Time involved > Expertise required (both internal and external) > Development costs (pre-construction) > Implementation costs (capital to build out project) > Operational Risks > Rapidly changing and competitive landscape
Understanding this risks (as well as opportunities) very clearly in the way of a project specific plan upfront can mitigate significant lost capital, time, and resources. A simple decision tree relative to these types of opportunities can be summed up in Figure 66 as follows.
Figure 66. Renewable Energy Project Development Decision Tree

ALTERNATIVE ENERGY STUDY
ORGANIZATIONAL ANALYSIS (cont.)
105
By using this type of decision tool and referring back to it throughout the initial stages of a specific project’s feasibility, a more efficient and meaningful conversation can take place among tribal leaders and stakeholders relative to pursuit of an underlying renewable energy venture. Further, a basic timeline and budget with tasks and associated costs should be developed at the early stages of any project as part of the decision process. An example of such a development matrix (in a very simple form) is below.
Figure 67. Example Renewable Project Development Budget
Example Utility Scale Renewable Energy ProjectExample Development Budget
Q1 Q2 Q3 Q4 Q1 Q2 Q3 Q4
Optional Study to Determine Interconnection Costs $30,000Make Milestone Payment and Deposits $380,000 $20,000
Energy resource estimates
$150,000
Tower Maintenance (if wind) $8,000Data Collection (QC and reports) $250 $250 $250 $250 $250 $250
$40,000
Desktop Feasibility Study $11,000NEPA EA for BIA $32,500 $32,540 $32,540 $32,540Cultural resource coordination $5,000Threatened & Endangered Species Mapping $4,500
$23,020 $23,020$1,500 $1,250 $1,250 $1,250
Army Corp of Engineers Permits / Approvals$8,000
Road Repair Plan $4,500
Public Outreach $2,800FAA Permit File $500
$1,000
Civil Design $9,500Collection System Design $7,000Circuit to Sub Design $25,000Electrical Design GeneralGeotechnical Studies for Towers $30,000
$1,500$1,500
Archeological Studies/work $9,500Survey $12,000
$2,500
$20,000 $20,000 $20,000$20,000
Turbine Supplier Negotiation $12,500 $12,500EPC/Balance of Plant Contract Negotiation $12,500 $12,500
Real EstateDraft Additional Real Estate Documents (done)
Project FinancingFinancing / Loan Document Negotiation and Review (Legal) $80,000Project Level Funding Procurement (plus success fee as part of closing) $20,000 $20,000
Project ManagementOwner Representation $10,000 $10,000 $10,000 $10,000
Total by Quarter $264,750 $114,060 $566,560 $177,840 $45,250 $68,250 $0 $0Running Total $265,000 $379,060 $945,620 $1,123,460 $1,168,710 $1,236,960 $1,236,960 $1,236,960
Other Contract Procurement and Negotiation
Engineering/Site Design
Interconnection Request/Initial Feasibility StudyFund System Impact Study (done)*Substation and collector system design
Negotiate and Execute Interconnection Agreement (s)
Environmental
Fund Definitive Planning Phase (done)
Resource Measurement
DOT Tall Tower Permit (if wind)100 m met tower (if wind)Sodar unit / trailer (if wind)
Pipeline Crossing CoordinationDOT Delivery Route and Transportation Planning
NTIA Review
Staking
Other Studies
Microwave Beam Path Analysis (done)
PPA Procurement Solicitation PPA Legal Execution
Sound StudyShadow Study
Power Purchase Agreement
Utility ROW
State stormwater / Stormwater Discharge PermitDriveway Permits
Interconnection - Grid Studies
Year 2
Geotechnical for met tower (if wind)
Final resource study (for financing purpose)
Bird and Bat Analysis
PermitsCounty building permits
Weekly Conference Calls
Year 1

ALTERNATIVE ENERGY STUDY
ORGANIZATIONAL ANALYSIS (cont.)
106
One of the single most important questions Washoe needs to ask relative to renewable energy development are embedded within the decision tree;
> Does Washoe have funds to invest into renewable energy assets?
> If it doesn’t, is it willing to partner (and possibly give up control) with a third party developer that would have an interest in developing a project on tribal controlled parcels?
If the answer to both of the above questions is “no”, it shifts the strategy to a much smaller scale approach (consistent with practice to date). This type of smaller scale approach eliminates a significant amount of risk and allows the Washoe Tribe to continue to learn about the operation and implementation of renewable energy projects.

ALTERNATIVE ENERGY STUDY
CONCLUSIONS AND RECOMMENDATIONS
107
14. CONCLUSIONS AND RECOMMENDATIONS The Washoe Tribe has a stated goal of producing a majority of its energy from renewable resources by the year 2025. It has a number of parcels under control attempt to implement this goal. However, many of the parcels are not suitable for renewable energy development (at small or large scale, or both) as summarized in Table 256.
Table 25. Renewable Potential for Parcels Owned by the Washoe Tribe
Parcel Name Total acres State Small-Scale
Potential Large-Scale
Potential Allotment #231 160 NV N N Babbit Peak 480 CA N N Carson Community 160 NV Y N Parcels A & C 288.22 NV N N Dresslerville Community / Washoe Ranch
793.32 NV N Y
Frank Parcel 12.23 NV N N Heidtman Purchase 80 NV N N Incline Village 2.445 NV N N Ladies Canyon 145.45 CA N N Lower Clear Creek Parcel 229 NV Y Y Mica 0.91 NV Y N Olympic Valley 2.79 CA N N Silverado 160 NV Y Y Skunk Harbor 24 NV N N Stewart Community 292 NV Y N Parcels G & H 5.0 NV N N Stewart Ranch 2,098 NV Y Y Uhalde 38.948 NV Y Y Upper Clear Creek Parcel 157.14 NV N N Wade Parcels (Upper and Lower) 320 CA Y N Woodfords Community 80 CA Y N Total 5,236.23
From a renewable energy sales (offtake) perspective, the demand historically has been driven by state requirements mandating that utilities purchase a certain percentage of their power from renewable resources. Currently, in both California and Nevada, utilities have met their renewable energy obligations. In Nevada, it is anticipated that utilities will issue additional solicitations for renewable resources over the next few years which could open up utility scale project development opportunities, however it is anticipated that the competition for those solicitations will be extremely competitive.

ALTERNATIVE ENERGY STUDY
CONCLUSIONS AND RECOMMENDATIONS (cont.)
108
A variety of incentives exist for renewable energy project development at the Federal, and to a lesser degree, state level. The federal production and/or investment tax credit and the New Markets Tax Credit can have the most impact from a utility scale project perspective, while a variety of programs such as the USDA’s Rural Energy for America program or the Department of Energy Tribal Energy grant solicitation can be very impactful on smaller projects. These incentive programs can sometimes cover 25-50% of project costs (or more in cases of smaller projects). Currently it appears the continued development of individual or multiple (as one “project”) distributed generation solar projects is the most viable means of advancing the Washoe tribe’s position in renewable energy development and asset ownership. We assumed a 450 kW total system installed on or adjacent to 10 existing buildings; the headquarters, court building, police department, health clinic, Chevron station, Washoe one stop, Carson one stop, Carson gym, Woodfords gym, and Dresslerville Community Center. For the 450 kW project, if the Washoe Tribe is able to monetize the investment tax credit with a financial partner, the payback on the $1.35-million investment is approximated at 7.8 years. After that period, the power generated for the Washoe Tribe is essentially “free” after modest maintenance expenses and replacement of inverters every 10‒12 years (estimate $500/kW replacement cost). If the Washoe Tribe is not able to monetize the investment tax credit, the payback on the same system is approximately 10.7 years. If the Washoe Tribe is able to monetize the tax credit and obtain $500,000 in grant funding from various potential sources as outlined in this document, the estimated payback on the system would be approximately 3.9 years. Under all scenarios, there is a requirement of some out-of-pocket investment by the Washoe Tribe. If this is not possible due to budget constraints, the project size might need to be lowered, or alternative financing structures would need to be evaluated. Several Washoe Tribe parcels may be technically suitable for utility-scale solar. However, given the current state of utility-scale solar in Nevada and California, spending internal capital on further development of utility-scale solar would not necessarily be advisable. Due to the complexity, costs, water, and land requirements of Concentrating Solar Projects, it is not advisable that Washoe pursue development of this technology at this time. Given the limited wind resource available based on the desktop analysis, the nature of the Washoe parcels, and the current state of the renewable portfolio standard in Nevada and California, pursuit of a utility scale wind project doesn’t appear feasible at this time. Continued pursuit and evaluation of direct use applications for geothermal heat is advisable, assuming a user of that energy source emerges within proximity to the resource. Given the available resources of the Washoe Tribe at its parcels, and other significant challenges associated with biomass to energy projects, it does not appear that pursuit of development of a project using this technology is prudent at this time.

Baker Tilly refers to Baker Tilly Virchow Krause, LLP, an independently owned and managed member of Baker Tilly International.
Washoe Tribe of Nevada and California
Alternative Energy Study
Disclosure
Pursuant to the rules of professional conduct set forth in Circular 230, as promulgated by the United States Department of the Treasury, nothing contained in this communication was intended or written to be used by any taxpayer for the purpose of avoiding penalties that may be imposed on the taxpayer by the Internal Revenue Service, and it cannot be used by any taxpayer for such purpose. No one, without our express prior written permission, may use or refer to any tax advice in this communication in promoting, marketing, or recommending a partnership or other entity, investment plan, or arrangement to any other party.
Baker Tilly refers to Baker Tilly Virchow Krause, LLP, an independently owned and managed member of Baker Tilly International. The information provided here is of a general nature and is not intended to address specific circumstances of any individual or entity. In specific circumstances, the services of a professional should be sought. © 2012 Baker Tilly Virchow Krause, LLP
2

Purpose of the study
Main activities
> Identify potential renewable energy resources and development
opportunities that could be realized by the Tribe
> Determine energy demand based on export market
> Analyze existing and new data of renewable energy resources on Tribal land including solar, wind, geothermal, biomass, and biofuel
> Identify Tribal parcels best suited for alternative energy development by overlaying the renewable energy resource maps with maps of Washoe Tribal lands to identify the best locations for potential projects
> Provide guidance to technical assistance options that will assist in the identification, preparation, financing, and commercialization of renewable energy project opportunities
3
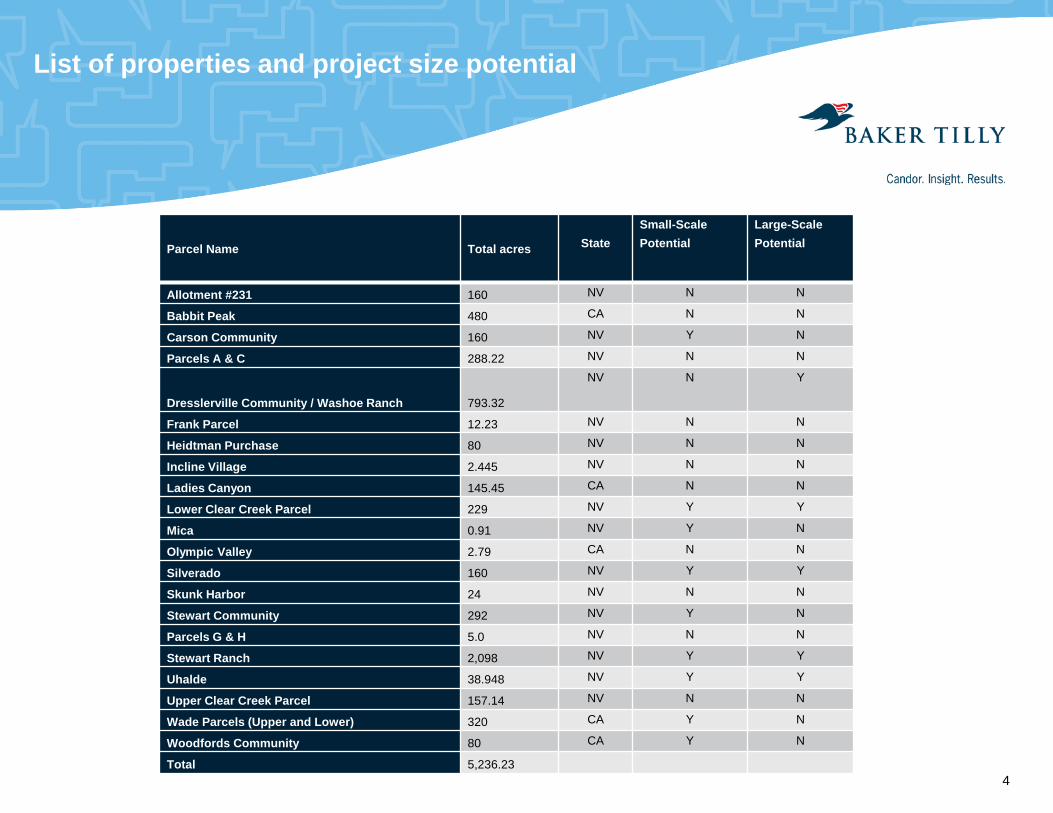
List of properties and project size potential
Parcel Name Total acres
State
Small-Scale Potential
Large-Scale Potential
Allotment #231 160 NV N N
Babbit Peak 480 CA N N
Carson Community 160 NV Y N
Parcels A & C 288.22 NV N N
Dresslerville Community / Washoe Ranch 793.32
NV N Y
Frank Parcel 12.23 NV N N
Heidtman Purchase 80 NV N N
Incline Village 2.445 NV N N
Ladies Canyon 145.45 CA N N
Lower Clear Creek Parcel 229 NV Y Y
Mica 0.91 NV Y N
Olympic Valley 2.79 CA N N
Silverado 160 NV Y Y
Skunk Harbor 24 NV N N
Stewart Community 292 NV Y N
Parcels G & H 5.0 NV N N
Stewart Ranch 2,098 NV Y Y
Uhalde 38.948 NV Y Y
Upper Clear Creek Parcel 157.14 NV N N
Wade Parcels (Upper and Lower) 320 CA Y N
Woodfords Community 80 CA Y N
Total 5,236.23
4

NV Energy’s Renewable Energy Landscape (Utility Scale)
5
> 20 Geothermal Projects > 9 Solar Projects > 4 Biomass/Methane Projects > 6 Hydroelectric Projects > 1 Wind Project
> 25% RPS by 2025 > NV Energy has exceeded
requirements every year so far > Additional solicitations for
renewable power expected from 2014-2016
> Does Washoe have appetite for utility scale development risk and/or third party partnerships?

California Renewable Energy Portfolio Standards
6
> 33% RPS by 2020 > CA utilities anticipated to hit targets > Based on history CA could increase
targets above 33% threshold > Questionable potential for utility scale
development in California parcels

Renewable energy tax credit overview – Investment Tax Credit
7
> Credits offset a substantial portion of the cost of renewable projects
> Projects are very difficult to finance without using them efficiently
> Currently, credits for most of the renewable energy have expired (except solar)
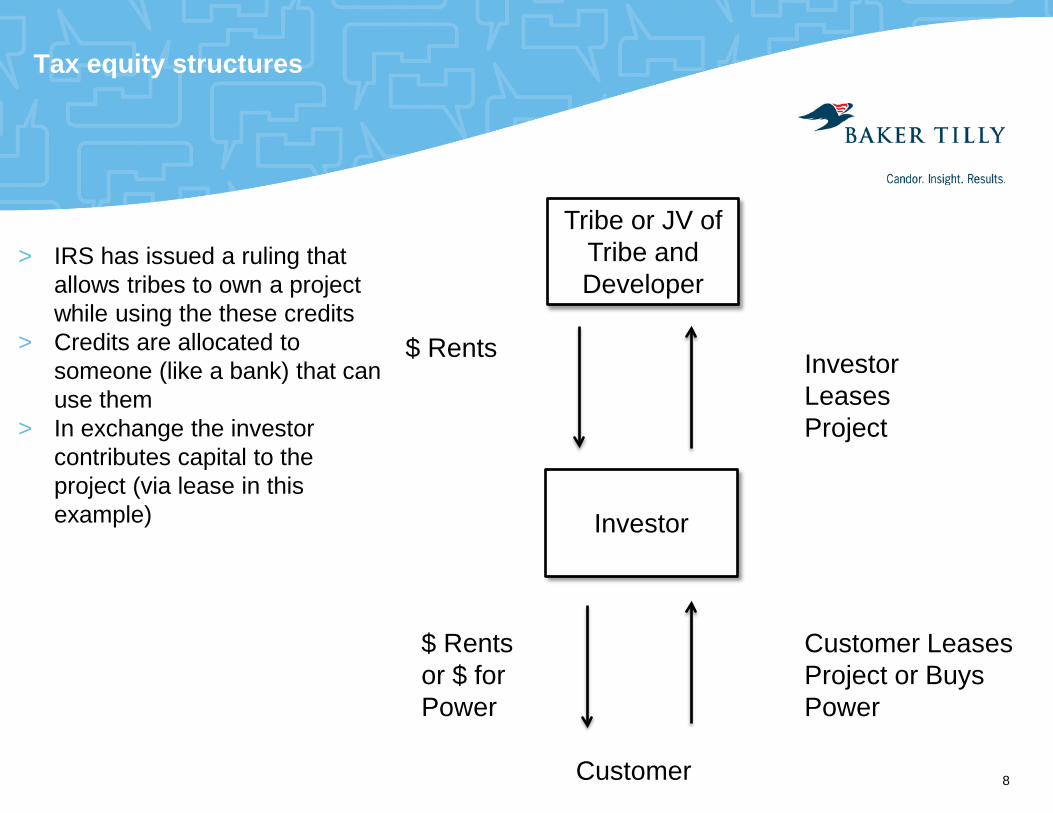
Tax equity structures
8
Tribe or JV of Tribe and Developer
Investor
$ Rents Investor Leases Project
$ Rents or $ for Power
Customer Leases Project or Buys Power
> IRS has issued a ruling that allows tribes to own a project while using the these credits
> Credits are allocated to someone (like a bank) that can use them
> In exchange the investor contributes capital to the project (via lease in this example)
Customer

NMTC opportunity
9
> New Market Tax Credits are available to support funding a variety of projects
> $3.5 billion will be made available in June
> Eligibility depends on location of project, among other factors

Other Funding Sources
10
> IEED/DEMD Feasibility Grants > DOE Tribal Energy Program Funding > BIA Loan Guarantee Program > USDA REAP Program > State of Nevada Revolving Loan Fund
Using these programs, in combination with “Project Finance” principles, can allow for the least amount of out of pocket investment by the Washoe Tribe, assuming Washoe does not want to partner with third party investors for potential renewable energy development.

Example project finance schematic
11

Solar development potential “The lowest hanging fruit”
12
Parcel Name Total acres
State Small Scale Potential (Y/N)
Allotment #231 160 NV N
Babbit Peak 480 CA N
Carson Community 160 NV Y
Parcels A & C 288.22 NV N
Dresslerville Community/Washoe Ranch 793.32 NV N
Frank Parcel 12.23 NV N
Heidtman Purchase 80 NV N
Incline Village 2.445 NV N
Ladies Canyon 145.45 CA N
Lower Clear Creek Parcel 229 NV Y
Mica 0.91 NV Y
Olympic Valley 2.79 CA N
Silverado 160 NV Y
Skunk Harbor 24 NV N
Stewart Community 292 NV Y
Parcels G & H 5.0 NV N
Stewart Ranch 2,098 NV Y
Uhalde 38.948 NV Y
Upper Clear Creek Parcel 157.14 NV N
Wade Parcels (Upper and Lower) 320 CA Y
Woodfords Community 80 CA N
Total 5,236.23

Estimated solar resources
13
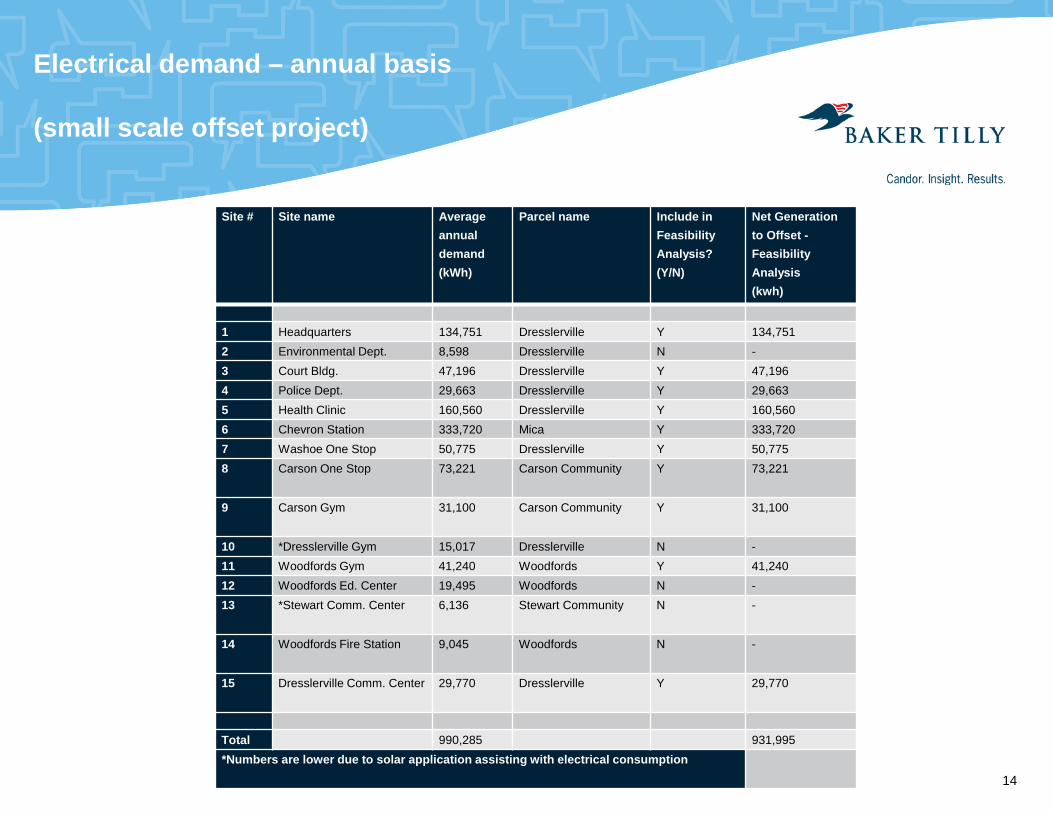
Electrical demand – annual basis (small scale offset project)
Site # Site name Average annual demand (kWh)
Parcel name Include in Feasibility Analysis? (Y/N)
Net Generation to Offset - Feasibility Analysis (kwh)
1 Headquarters 134,751 Dresslerville Y 134,751
2 Environmental Dept. 8,598 Dresslerville N -
3 Court Bldg. 47,196 Dresslerville Y 47,196
4 Police Dept. 29,663 Dresslerville Y 29,663
5 Health Clinic 160,560 Dresslerville Y 160,560
6 Chevron Station 333,720 Mica Y 333,720
7 Washoe One Stop 50,775 Dresslerville Y 50,775
8 Carson One Stop 73,221 Carson Community Y 73,221
9 Carson Gym 31,100 Carson Community Y 31,100
10 *Dresslerville Gym 15,017 Dresslerville N -
11 Woodfords Gym 41,240 Woodfords Y 41,240
12 Woodfords Ed. Center 19,495 Woodfords N -
13 *Stewart Comm. Center 6,136 Stewart Community N -
14 Woodfords Fire Station 9,045 Woodfords N -
15 Dresslerville Comm. Center 29,770 Dresslerville Y 29,770
Total 990,285 931,995
*Numbers are lower due to solar application assisting with electrical consumption
14
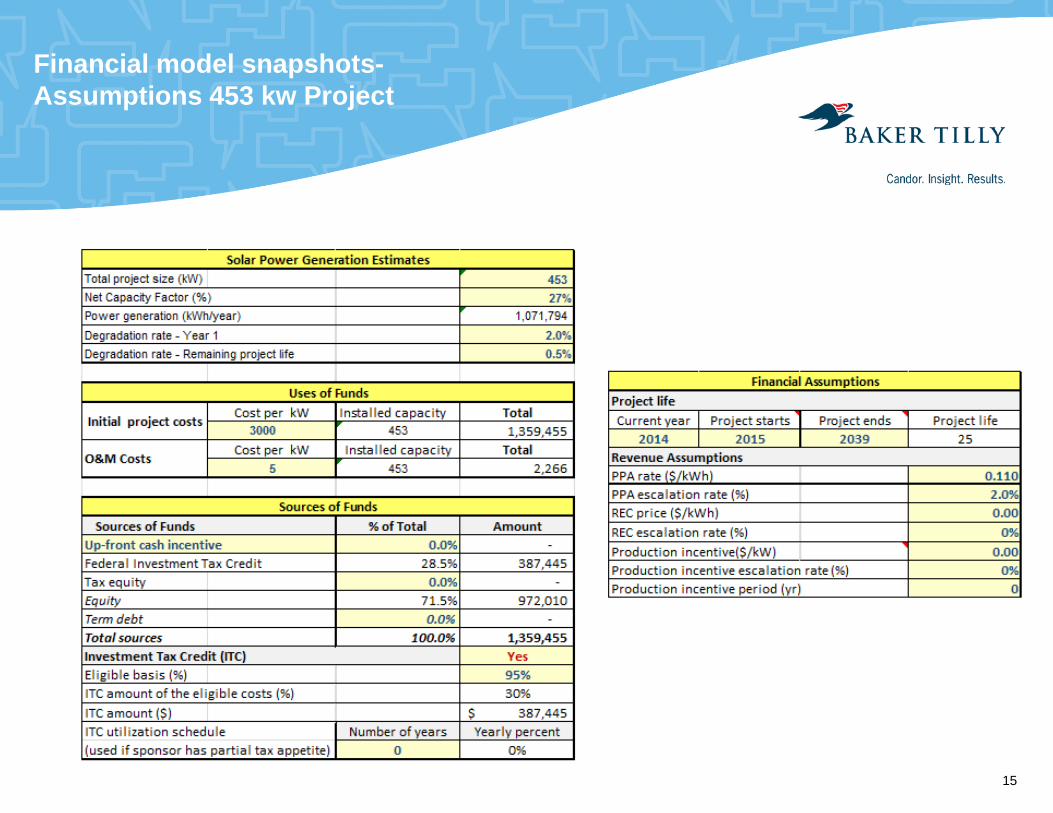
Financial model snapshots- Assumptions 453 kw Project
15
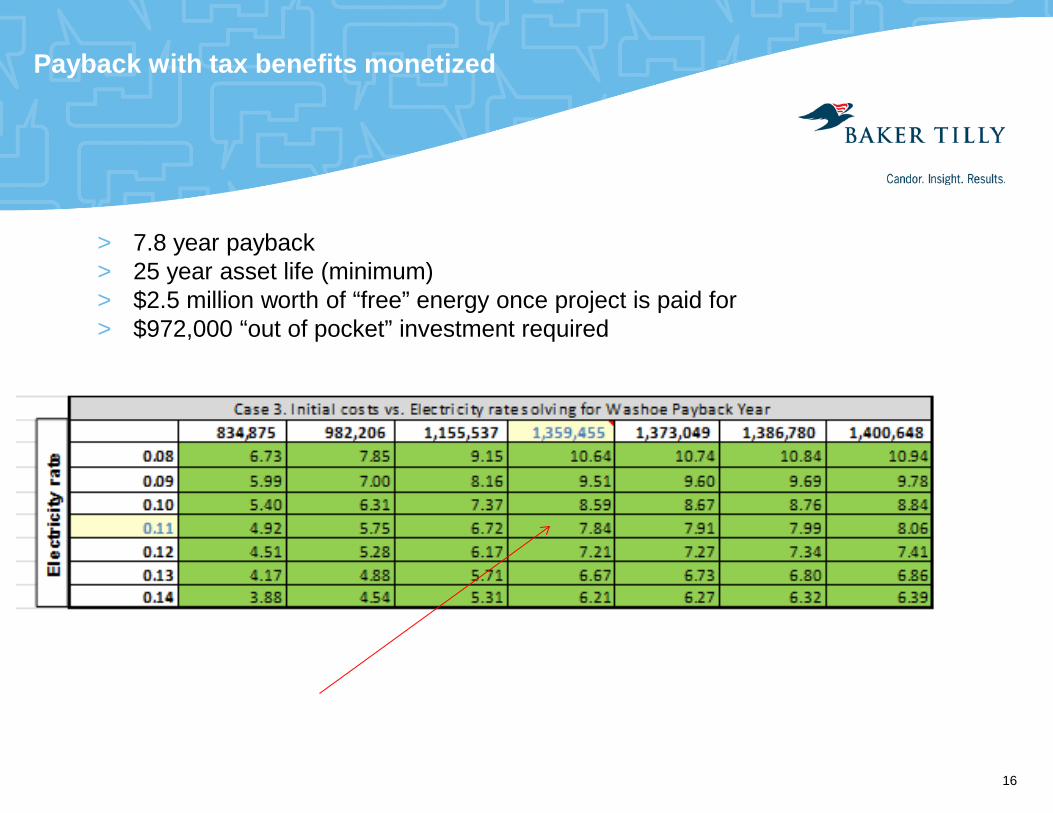
Payback with tax benefits monetized
16
> 7.8 year payback > 25 year asset life (minimum) > $2.5 million worth of “free” energy once project is paid for > $972,000 “out of pocket” investment required

17
Payback without tax benefits monetized
> 10.7 year payback > 25 year asset life (minimum) > $2.1 million worth of “free” energy once project is paid for > $1,300,000 “out of pocket” investment required
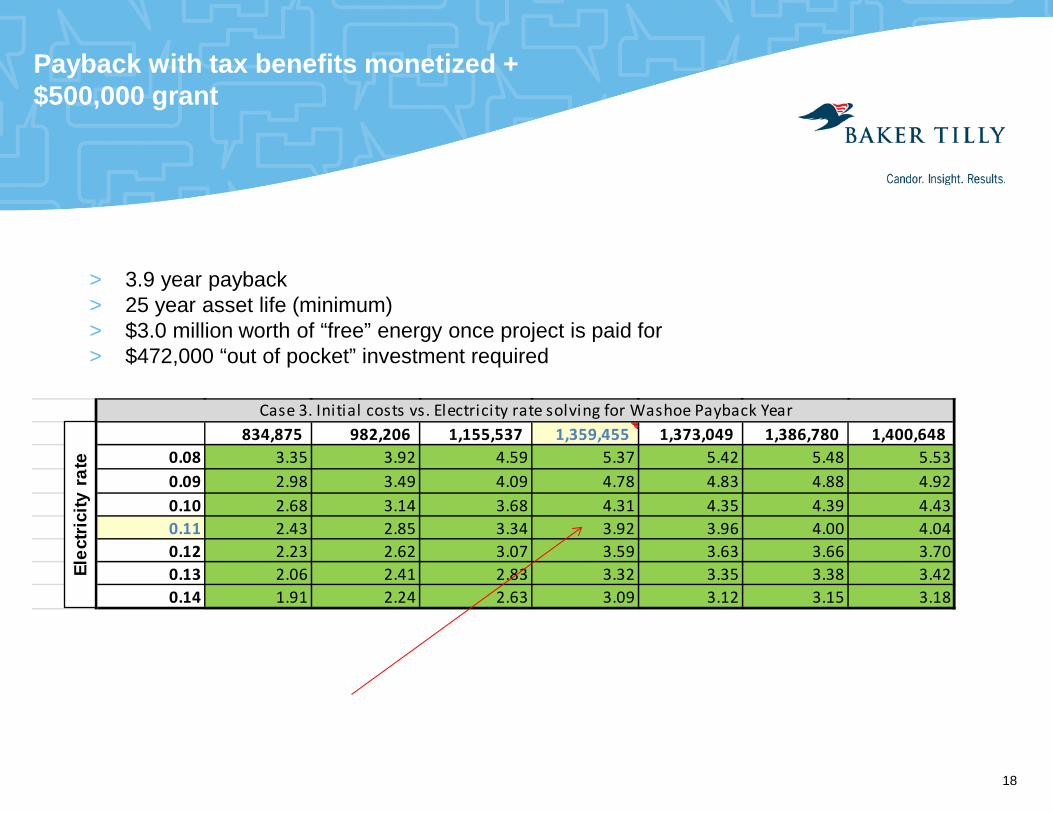
Payback with tax benefits monetized + $500,000 grant
18
3.92 834,875 982,206 1,155,537 1,359,455 1,373,049 1,386,780 1,400,648 0.08 3.35 3.92 4.59 5.37 5.42 5.48 5.530.09 2.98 3.49 4.09 4.78 4.83 4.88 4.920.10 2.68 3.14 3.68 4.31 4.35 4.39 4.430.11 2.43 2.85 3.34 3.92 3.96 4.00 4.040.12 2.23 2.62 3.07 3.59 3.63 3.66 3.700.13 2.06 2.41 2.83 3.32 3.35 3.38 3.420.14 1.91 2.24 2.63 3.09 3.12 3.15 3.18
Case 3. Initial costs vs. Electricity rate solving for Washoe Payback Year
Elec
trici
ty r
ate
> 3.9 year payback > 25 year asset life (minimum) > $3.0 million worth of “free” energy once project is paid for > $472,000 “out of pocket” investment required
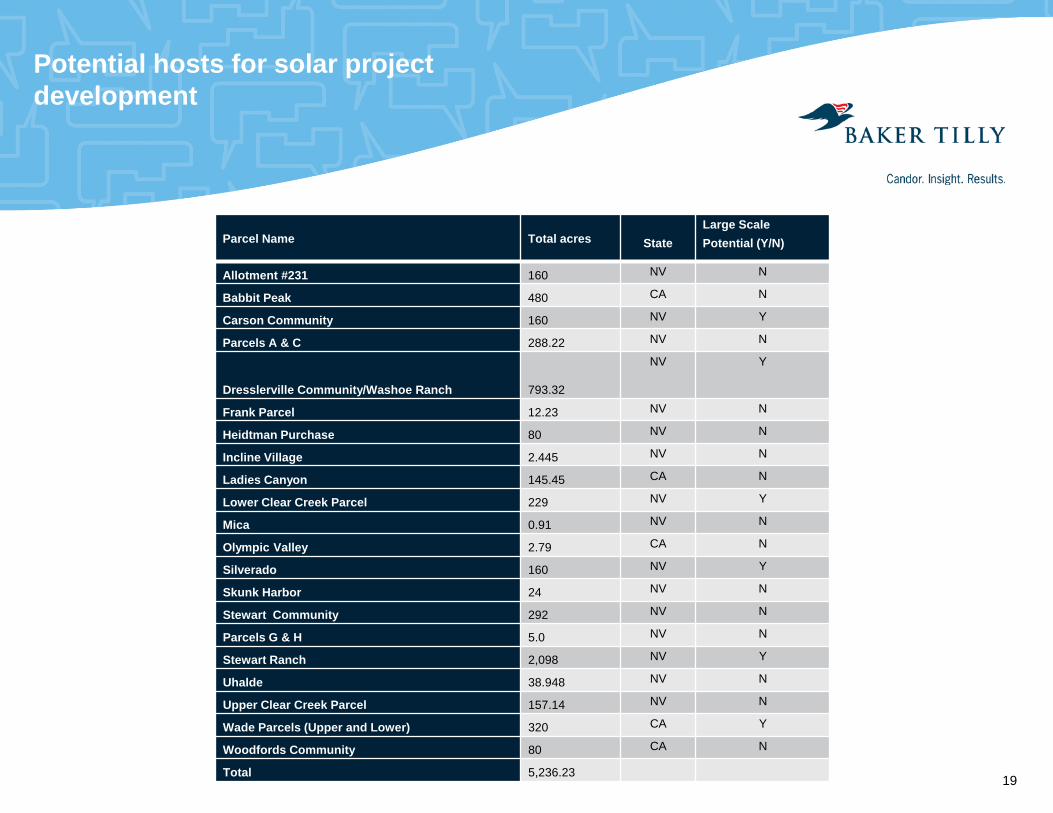
Potential hosts for solar project development
Parcel Name Total acres
State Large Scale Potential (Y/N)
Allotment #231 160 NV N
Babbit Peak 480 CA N
Carson Community 160 NV Y
Parcels A & C 288.22 NV N
Dresslerville Community/Washoe Ranch 793.32
NV Y
Frank Parcel 12.23 NV N
Heidtman Purchase 80 NV N
Incline Village 2.445 NV N
Ladies Canyon 145.45 CA N
Lower Clear Creek Parcel 229 NV Y
Mica 0.91 NV N
Olympic Valley 2.79 CA N
Silverado 160 NV Y
Skunk Harbor 24 NV N
Stewart Community 292 NV N
Parcels G & H 5.0 NV N
Stewart Ranch 2,098 NV Y
Uhalde 38.948 NV N
Upper Clear Creek Parcel 157.14 NV N
Wade Parcels (Upper and Lower) 320 CA Y
Woodfords Community 80 CA N
Total 5,236.23 19

Solar business model Key assumptions
20
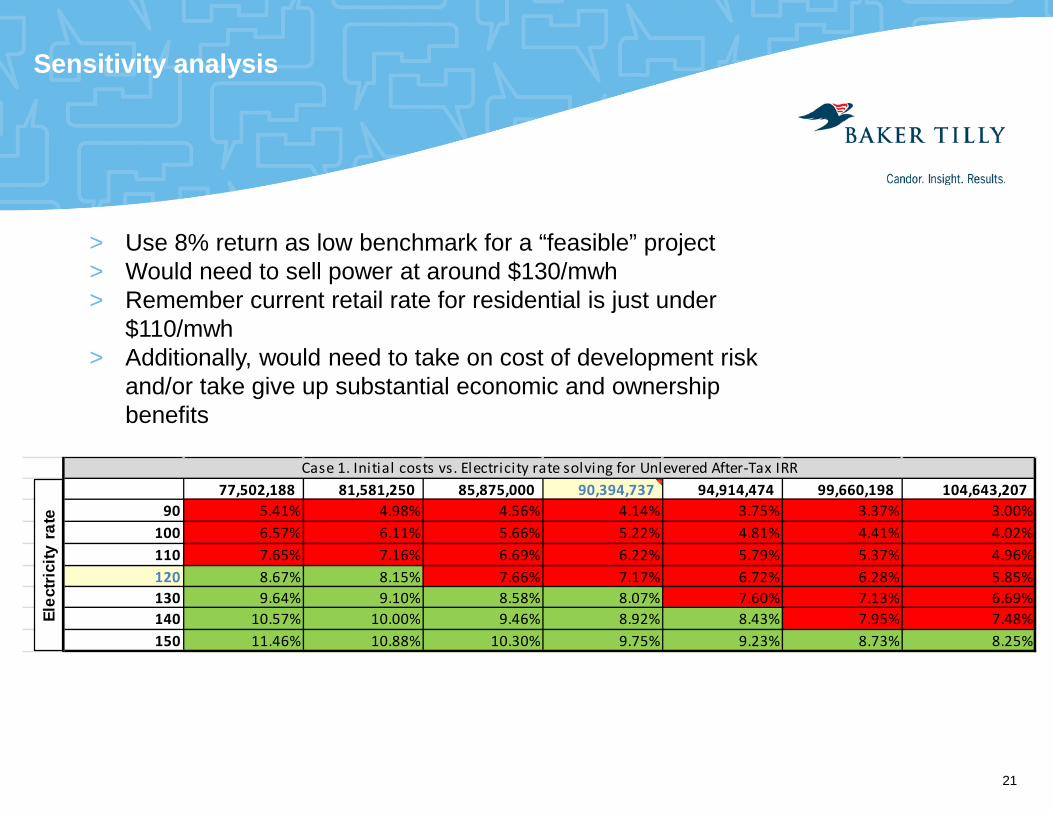
Sensitivity analysis
21
7.17% 77,502,188 81,581,250 85,875,000 90,394,737 94,914,474 99,660,198 104,643,207 90 5.41% 4.98% 4.56% 4.14% 3.75% 3.37% 3.00%
100 6.57% 6.11% 5.66% 5.22% 4.81% 4.41% 4.02%110 7.65% 7.16% 6.69% 6.22% 5.79% 5.37% 4.96%120 8.67% 8.15% 7.66% 7.17% 6.72% 6.28% 5.85%130 9.64% 9.10% 8.58% 8.07% 7.60% 7.13% 6.69%140 10.57% 10.00% 9.46% 8.92% 8.43% 7.95% 7.48%150 11.46% 10.88% 10.30% 9.75% 9.23% 8.73% 8.25%
Case 1. Initial costs vs. Electricity rate solving for Unlevered After-Tax IRR
Elec
trici
ty r
ate
> Use 8% return as low benchmark for a “feasible” project > Would need to sell power at around $130/mwh > Remember current retail rate for residential is just under
$110/mwh > Additionally, would need to take on cost of development risk
and/or take give up substantial economic and ownership benefits

Utility scale solar opportunity Development Budget 2+ years 1+ million of soft costs
22
Q1 Q2 Q3 Q4 Q1 Q2 Q3 Q4
Total by Quarter $264,750 $114,060 $566,560 $177,840 $45,250 $68,250 $0 $0Running Total $265,000 $379,060 $945,620 $1,123,460 $1,168,710 $1,236,960 $1,236,960 $1,236,960
Year 2Year 1
> Current power market saturated (but chance for demand to increase over next 3-5 years in Nevada
> IF continued pursuit of utility scale project is of interest; > Key question to be answered, does Washoe want to own, partner, or lease?
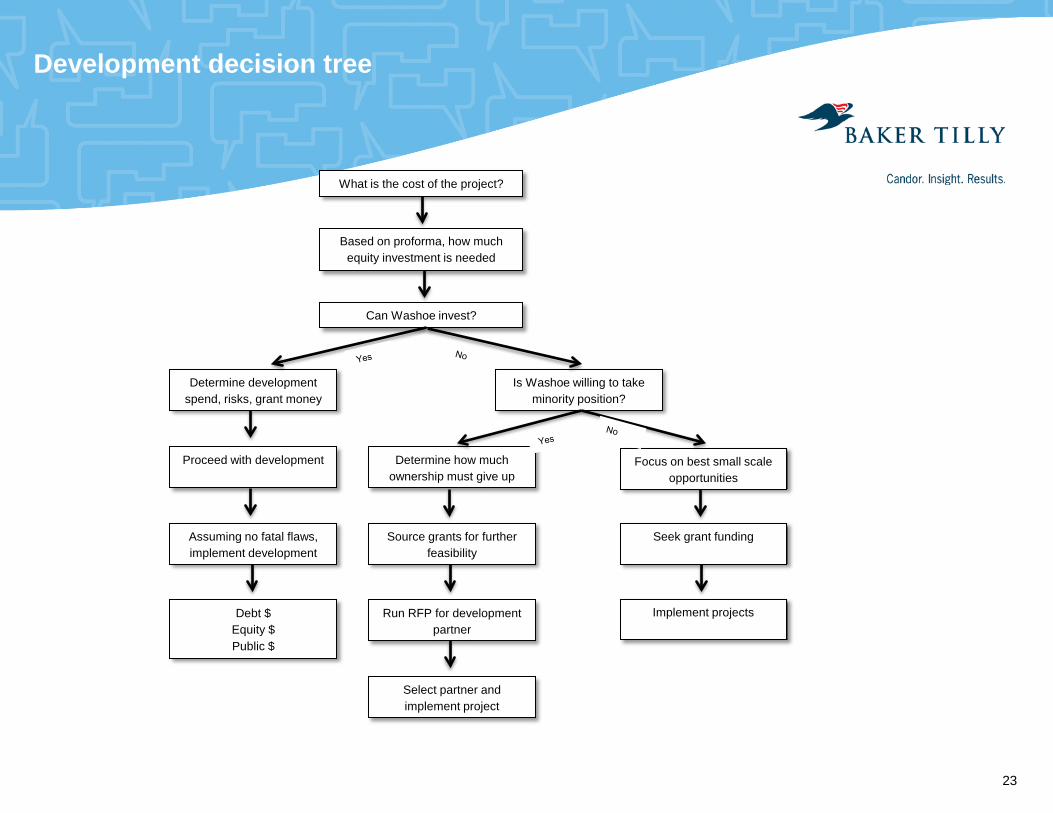
Development decision tree
23
What is the cost of the project?
Based on proforma, how much equity investment is needed
Can Washoe invest?
Determine development spend, risks, grant money
Is Washoe willing to take minority position?
Proceed with development
Assuming no fatal flaws, implement development
Debt $ Equity $ Public $
Determine how much ownership must give up
Focus on best small scale opportunities
Source grants for further feasibility
Seek grant funding
Run RFP for development partner
Implement projects
Select partner and implement project

Geothermal summary -Literature review -Lumos & Associates -GDA
24
> Geothermal resource doesn’t support utility scale project
> Direct use application could be possible subject to final due diligence and Lumos conclusions
> But is there a direct use currently in the project (Hobo Hot Springs) vicinity?

Other technologies and challenges
25
Wind > Limited resource availability
> Doesn’t compete well versus solar from a utility scale perspective in Nevada (only one project to date)
> Currently minimal demand from a utility scale perspective
Biomass (woody and/or crop residue) > Extremely limited resource available for self supply
> Very long, risky and expensive development lifecycle

Conclusions/Next Steps
26
Pursue low hanging fruit – more small solar > Experience with solar at a small scale
> Excellent solar resource available
> Long asset life (25-40 years) ensuring power price stability over time
> Position future project to pursue funding opportunities as they arise
> Understand concept of tax credit monetization and determine if something to pursue for future projects
Continue to monitor > Future Nevada Energy RFP possibilities as RPS increases
> Geothermal – existing direct use?
Put in place formal policy > Using “decision tree” as a guideline
> Take position on interests relative to future “partnership” opportunities with third party developers