
Proposed primary regulation of smart appliances ...
49
1 Title: Proposed primary regulation of smart appliances: consultation stage impact assessment. This IA supports the consultation documentation to present current evidence. IA No: BEIS010(C)-18-ESNM RPC Reference No: RPC-4195(1)-BEIS Lead department or agency: Department for Business Energy and Industrial Strategy Other departments or agencies: N/A Impact Assessment (IA) Date: 16/03/2018 Stage: Development/Options Source of intervention: Domestic Type of measure: Primary legislation Contact for enquiries: [email protected] Summary: Intervention and Options RPC Opinion: Green Cost of Preferred (or more likely) Option Total Net Present Value Business Net Present Value Net cost to business per year (EANDCB, 2014 prices) One-In, Three-Out Business Impact Target Status £112m (see Section 10) (Indicative est. see Section 14) Not applicable To be determined What is the problem under consideration? Why is government intervention necessary? Smart appliances could enable significant demand-side response and in turn significant benefits to consumers and the electricity system if taken up at scale, but current uptake of smart appliances is unlikely to achieve the scale needed to realise these benefits. To ensure a more socially optimal level of deployment Government can act to address the following market imperfections: a) coordination failures which could lead to a ‘first mover disadvantage’ for manufacturers and suppliers; b) risks to the system and to consumers if cyber-security, data privacy and interoperability risks are not managed appropriately; and c) incomplete information e.g. lack of awareness by consumers of the benefits of smart appliances. What are the policy objectives and the intended effects? The main objectives behind voluntary and/or mandatory minimum standards are to: 1. Provide certainty in the sector to help rectify the coordination failure between the availability of smart appliances and smart tariffs, enabling electricity system benefits and consumer rewards. 2. Ensure minimum standards of functionality of smart appliances to protect consumers and the system. 3. Enable the UK marketplace to be at the forefront of an emerging sector. Together these should help drive faster and higher levels of product development and uptake in the sector. What policy options have been considered including any alternatives to regulation? Please justify preferred option (further details in Evidence Base) Option A: Voluntary industry standard and labelling for all ‘relevant’ appliances (cold and wet appliances, heating, ventilation, air conditioning (HVAC) and batteries) which are communications-enabled and able to automatically modulate energy consumption. Option B: Mandatory standards and labelling for all relevant smart appliances. Option C: Mandatory standards and labelling for all relevant appliances to be smart. Option D: Combined option: transition from voluntary to mandatory standards for smart appliances in 2020s, with a review of implementation of mandatory standards for all relevant appliances to be smart thereafter. Option D (the preferred option) has the one of the highest NPVs (along with Option C). Transitioning from voluntary to mandatory standards over the 2020s raises awareness and trust among consumers which enables significant smart appliance uptake and minimises familiarisation and transition costs. A review of the implementation of mandatory standards for all relevant appliances required to be smart creates a signal for industry to promote smart, whilst allowing time for cost reduction, consumer behaviour change and smart tariffs/aggregation services to develop. This is a “low regrets” option, it allows government to adapt the strategy in light of new information, and it is likely to have lower transitional and distributional impacts than Option C. Will the policy be reviewed? Primary legislation will not be reviewed. Does implementation go beyond minimum EU requirements? N/A Are any of these organisations in scope? Micro Yes Small Yes Medium Yes Large Yes What is the CO 2 equivalent change in greenhouse gas emissions? (Million tonnes CO 2 equivalent) Traded: +, Not est. Non-traded: 0 I have read the Impact Assessment and I am satisfied that, given the available evidence, it represents a reasonable view of the likely costs, benefits and impact of the leading options. Signed by the responsible Minister: Date: 16/03/2018
Transcript of Proposed primary regulation of smart appliances ...

1
Title: Proposed primary regulation of smart appliances: consultation stage impact assessment. This IA supports the consultation documentation to present current evidence.
IA No: BEIS010(C)-18-ESNM
RPC Reference No: RPC-4195(1)-BEIS
Lead department or agency: Department for Business Energy and Industrial Strategy
Other departments or agencies: N/A
Impact Assessment (IA)
Date: 16/03/2018
Stage: Development/Options
Source of intervention: Domestic
Type of measure: Primary legislation
Contact for enquiries: [email protected]
Summary: Intervention and Options
RPC Opinion: Green
Cost of Preferred (or more likely) Option
Total Net Present Value
Business Net Present Value
Net cost to business per year (EANDCB, 2014 prices)
One-In, Three-Out
Business Impact Target Status
£112m (see Section 10) (Indicative est. see Section 14)
Not applicable To be determined
What is the problem under consideration? Why is government intervention necessary?
Smart appliances could enable significant demand-side response and in turn significant benefits to consumers and the electricity system if taken up at scale, but current uptake of smart appliances is unlikely to achieve the scale needed to realise these benefits. To ensure a more socially optimal level of deployment Government can act to address the following market imperfections: a) coordination failures which could lead to a ‘first mover disadvantage’ for manufacturers and suppliers; b) risks to the system and to consumers if cyber-security, data privacy and interoperability risks are not managed appropriately; and c) incomplete information e.g. lack of awareness by consumers of the benefits of smart appliances.
What are the policy objectives and the intended effects?
The main objectives behind voluntary and/or mandatory minimum standards are to:
1. Provide certainty in the sector to help rectify the coordination failure between the availability of smart appliances and smart tariffs, enabling electricity system benefits and consumer rewards.
2. Ensure minimum standards of functionality of smart appliances to protect consumers and the system.
3. Enable the UK marketplace to be at the forefront of an emerging sector.
Together these should help drive faster and higher levels of product development and uptake in the sector.
What policy options have been considered including any alternatives to regulation? Please justify preferred option (further details in Evidence Base)
Option A: Voluntary industry standard and labelling for all ‘relevant’ appliances (cold and wet appliances, heating, ventilation, air conditioning (HVAC) and batteries) which are communications-enabled and able to automatically modulate energy consumption.
Option B: Mandatory standards and labelling for all relevant smart appliances.
Option C: Mandatory standards and labelling for all relevant appliances to be smart.
Option D: Combined option: transition from voluntary to mandatory standards for smart appliances in 2020s, with a review of implementation of mandatory standards for all relevant appliances to be smart thereafter. Option D (the preferred option) has the one of the highest NPVs (along with Option C). Transitioning from voluntary to mandatory standards over the 2020s raises awareness and trust among consumers which enables significant smart appliance uptake and minimises familiarisation and transition costs. A review of the implementation of mandatory standards for all relevant appliances required to be smart creates a signal for industry to promote smart, whilst allowing time for cost reduction, consumer behaviour change and smart tariffs/aggregation services to develop. This is a “low regrets” option, it allows government to adapt the strategy in light of new information, and it is likely to have lower transitional and distributional impacts than Option C.
Will the policy be reviewed? Primary legislation will not be reviewed.
Does implementation go beyond minimum EU requirements? N/A
Are any of these organisations in scope? Micro Yes
Small Yes
Medium Yes
Large Yes
What is the CO2 equivalent change in greenhouse gas emissions? (Million tonnes CO2 equivalent)
Traded:
+, Not est. Non-traded:
0
I have read the Impact Assessment and I am satisfied that, given the available evidence, it represents a reasonable view of the likely costs, benefits and impact of the leading options.
Signed by the responsible Minister:
Date: 16/03/2018

2
Summary: Analysis & Evidence Policy Option A Description: Voluntary industry standard and labelling for all ‘relevant’ appliances (cold and wet appliances, HVAC and batteries) which are communications-enabled and able to automatically modulate energy consumption. FULL ECONOMIC ASSESSMENT
Price Base Year 2016
PV Base Year 2017
Time Period Years 26
Net Benefit (Present Value (PV)) (£m)
Low: -8 High: 11 Best Estimate:10
COSTS (£m) Total Transition (Constant Price) Years
Average Annual (excl. Transition) (Constant Price)
Total Cost (Present Value)
Low Not Estimated
Not Estimated 2
High Not Estimated Not Estimated 19
Best Estimate
3
Description and scale of key monetised costs by ‘main affected groups’
Voluntary standards lead to higher uptake of smart appliances (an estimated 10%) over the counterfactual, with higher manufacturing cost to make appliances smart passed onto consumers: cost reduction assumed at 15% every time total sales double, reaching £3.20 per appliance with a market size of 10m. If the UK were not to align with international standards, the UK market may not benefit from international market-driven cost-reduction (ie. high cost sensitivity). The low cost sensitivity represents delayed policy impact.
Other key non-monetised costs by ‘main affected groups’
Business/industry: familiarisation costs and cost of complying with voluntary standards assumed to be very low given, for example, resource already devoted to complying with current Ecodesign product requirements and given gradual increase/ voluntary participation in smart appliance market and low proportion of affected businesses.
Consumers: cost of understanding new technologies; additional energy cost from increased standby.
Wider society: enforcement costs assumed to be negligible, based on the example of resource already devoted to enforcing current Ecodesign product requirements.
BENEFITS (£m) Total Transition (Constant Price) Years
Average Annual (excl. Transition) (Constant Price)
Total Benefit (Present Value)
Low Not Estimated
Not Estimated 11
High Not Estimated Not Estimated 13
Best Estimate
13
Description and scale of key monetised benefits by ‘main affected groups’
Indicative secondary regulation benefits to wider society: electricity system benefits due to some increase in smart appliance uptake above counterfactual, leading to some shift in peak demand, passed on to consumers through lower energy prices. The central scenario reflects a core uptake assumption of 10% above the counterfactual starting the year that standards are created, with a sensitivity where this impact is delayed by four years. Voluntary labels require specific label design and consumer engagement for success.
Other key non-monetised benefits by ‘main affected groups’
Consumers: lower energy bills, assuming using smart appliances to shift demand combined with a ‘smart offer’ including a smart tariff; increased consumer control/ protection.
Wider society: lower electricity prices; carbon savings/air quality improvements from more efficient use of low carbon electricity.
Business/industry: coordination benefits – allowing suppliers and aggregators to develop smart tariffs from the increased demand for smart appliances and creating an opportunity for UK to lead in this emerging sector.
Key assumptions/sensitivities/risks Discount rate (%)
3.5
Limited consumer protection: risk of undercutting or that appropriate protections may not be provided; those who purchase smart appliances can benefit most, others may not benefit.
Sensitivity analysis: a) slower impact on uptake (starting 4 years after standard is put in place); b) slower cost reduction where the UK sets own standards; and c) greater cost reduction where international standards are enforced to make all relevant appliances be smart.
BUSINESS ASSESSMENT (Option A) –No impact as voluntary industry standard
Direct impact on business (Equivalent Annual) £m: Score for Business Impact Target (qualifying provisions only) £m:
Costs: 0 Benefits: 0 Net: 0
N/A [Further details to be provided in Final Stage IA]
3
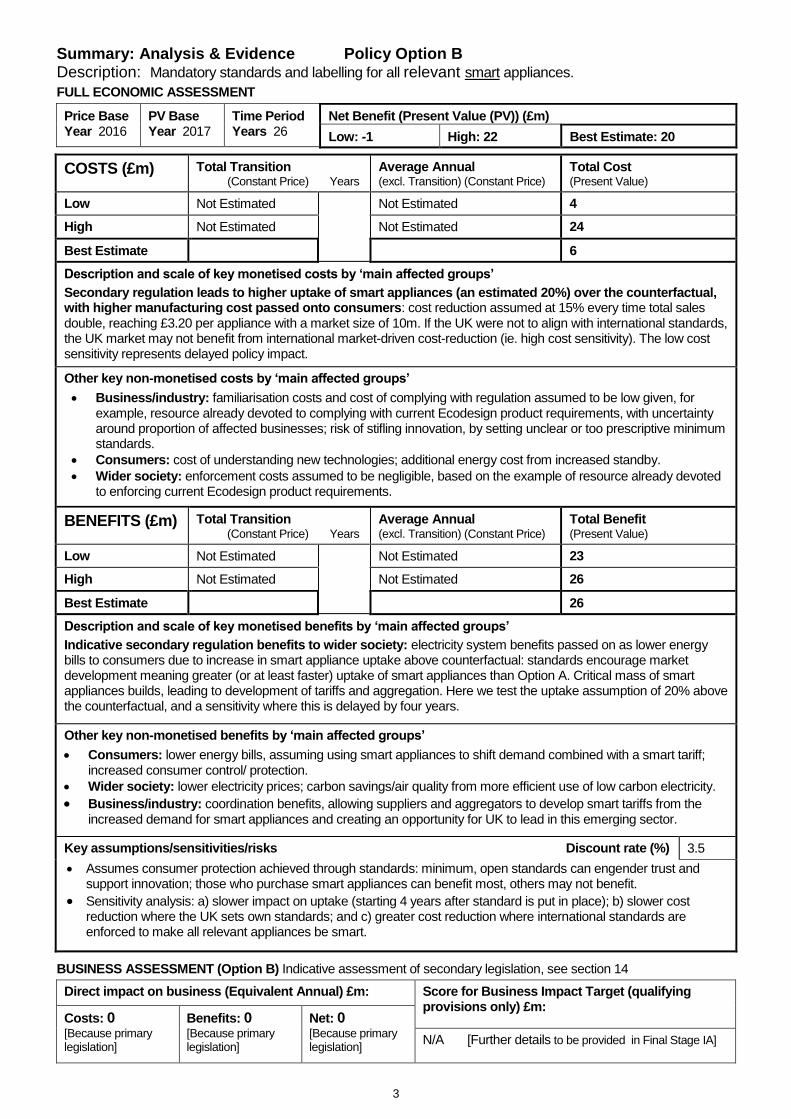
Summary: Analysis & Evidence Policy Option B Description: Mandatory standards and labelling for all relevant smart appliances.
FULL ECONOMIC ASSESSMENT
Price Base Year 2016
PV Base Year 2017
Time Period Years 26
Net Benefit (Present Value (PV)) (£m)
Low: -1 High: 22 Best Estimate: 20
COSTS (£m) Total Transition (Constant Price) Years
Average Annual (excl. Transition) (Constant Price)
Total Cost (Present Value)
Low Not Estimated
Not Estimated 4
High Not Estimated Not Estimated 24
Best Estimate
6
Description and scale of key monetised costs by ‘main affected groups’
Secondary regulation leads to higher uptake of smart appliances (an estimated 20%) over the counterfactual, with higher manufacturing cost passed onto consumers: cost reduction assumed at 15% every time total sales double, reaching £3.20 per appliance with a market size of 10m. If the UK were not to align with international standards, the UK market may not benefit from international market-driven cost-reduction (ie. high cost sensitivity). The low cost sensitivity represents delayed policy impact.
Other key non-monetised costs by ‘main affected groups’
Business/industry: familiarisation costs and cost of complying with regulation assumed to be low given, for example, resource already devoted to complying with current Ecodesign product requirements, with uncertainty around proportion of affected businesses; risk of stifling innovation, by setting unclear or too prescriptive minimum standards.
Consumers: cost of understanding new technologies; additional energy cost from increased standby.
Wider society: enforcement costs assumed to be negligible, based on the example of resource already devoted to enforcing current Ecodesign product requirements.
BENEFITS (£m) Total Transition
(Constant Price) Years
Average Annual (excl. Transition) (Constant Price)
Total Benefit (Present Value)
Low Not Estimated
Not Estimated 23
High Not Estimated Not Estimated 26
Best Estimate
26
Description and scale of key monetised benefits by ‘main affected groups’
Indicative secondary regulation benefits to wider society: electricity system benefits passed on as lower energy bills to consumers due to increase in smart appliance uptake above counterfactual: standards encourage market development meaning greater (or at least faster) uptake of smart appliances than Option A. Critical mass of smart appliances builds, leading to development of tariffs and aggregation. Here we test the uptake assumption of 20% above the counterfactual, and a sensitivity where this is delayed by four years.
Other key non-monetised benefits by ‘main affected groups’
Consumers: lower energy bills, assuming using smart appliances to shift demand combined with a smart tariff; increased consumer control/ protection.
Wider society: lower electricity prices; carbon savings/air quality from more efficient use of low carbon electricity.
Business/industry: coordination benefits, allowing suppliers and aggregators to develop smart tariffs from the increased demand for smart appliances and creating an opportunity for UK to lead in this emerging sector.
Key assumptions/sensitivities/risks Discount rate (%)
3.5
Assumes consumer protection achieved through standards: minimum, open standards can engender trust and support innovation; those who purchase smart appliances can benefit most, others may not benefit.
Sensitivity analysis: a) slower impact on uptake (starting 4 years after standard is put in place); b) slower cost reduction where the UK sets own standards; and c) greater cost reduction where international standards are enforced to make all relevant appliances be smart.
BUSINESS ASSESSMENT (Option B) Indicative assessment of secondary legislation, see section 14
Direct impact on business (Equivalent Annual) £m: Score for Business Impact Target (qualifying provisions only) £m:
Costs: 0 [Because primary legislation]
Benefits: 0 [Because primary legislation]
Net: 0 [Because primary legislation]
N/A [Further details to be provided in Final Stage IA]

4
Summary: Analysis & Evidence Policy Option C Description: Mandatory standards and labelling for all relevant appliances to be smart.
FULL ECONOMIC ASSESSMENT
Price Base Year 2016
PV Base Year 2017
Time Period Years 26
Net Benefit (Present Value (PV)) (£m)
Low: -178 High: 302 Best Estimate: 129
COSTS (£m) Total Transition (Constant Price) Years
Average Annual (excl. Transition) (Constant Price)
Total Cost (Present Value)
Low Not Estimated
Not Estimated 130
High Not Estimated Not Estimated 204
Best Estimate
172
Description and scale of key monetised costs by ‘main affected groups’
Secondary regulation requires all relevant appliances to be smart from 2021, with higher manufacturing cost passed onto consumers: cost reduction assumed at 15% every time total sales double, reaching £3.20 per appliance with a market size of 10m. If the UK were not to align with international standards, the UK market may not benefit from international market-driven cost-reduction (ie. high cost sensitivity). The low cost sensitivity represents delayed policy impact.
Other key non-monetised costs by ‘main affected groups’
Business/industry: familiarisation cost and cost of complying with regulation assumed to be low given, for example, resource already devoted to complying with current Ecodesign product requirements, with uncertainty around proportion of affected businesses; risk of stifling innovation by setting unclear or too prescriptive minimum standards.
Consumers: cost of understanding new technologies; additional energy cost from increased standby.
Wider society: enforcement costs assumed to be negligible, based on the example of resource already devoted to enforcing current Ecodesign product requirements.
BENEFITS (£m) Total Transition (Constant Price) Years
Average Annual (excl. Transition) (Constant Price)
Total Benefit (Present Value)
Low Not Estimated
Not Estimated 26
High Not Estimated Not Estimated 432
Best Estimate
301
Description and scale of key monetised benefits by ‘main affected groups’
Indicative secondary regulation benefits to wider society: electricity system benefits passed on as lower energy bills to consumers due to significant critical mass of smart appliances: 10-15 years after standards are enforced we would expect almost all of the stock of relevant appliances to have turned over and be smart. However, we would expect lower usage of the functionality than under options where consumers choose to buy smart functionality. Here we test the assumption of 50% usage as the core assumption.
Other key non-monetised benefits by ‘main affected groups’
Consumers: lower energy bills, assuming using smart appliances to shift demand combined with a smart tariff; increased consumer control/ protection.
Wider society: lower electricity prices; carbon savings/air quality from more efficient use of low carbon electricity. Business/industry: coordination benefits, allowing suppliers and aggregators to develop smart tariffs from the increased demand for smart appliances and creating an opportunity for UK to lead in this emerging sector.
Key assumptions/sensitivities/risks Discount rate (%)
3.5
Assumes consumer protection achieved through standards, although risk of consumer mistrust of smart appliances or reluctance to use due to lack of choice; some consumers may not be able to be flexible so may lose out.
Sensitivity analysis: a) usage sensitivity (only those who would choose to buy would use functionality; and 100% usage); b) slower cost reduction where the UK sets own technical standards; and c) greater cost reduction where international standards are enforced.
BUSINESS ASSESSMENT (Option C) Indicative assessment of secondary legislation, see section 14
Direct impact on business (Equivalent Annual) £m: Score for Business Impact Target (qualifying provisions only) £m:
[Because primary legislation]
Costs: 0 [Because primary legislation]
Benefits: 0 [Because primary legislation]
Net: 0 [Because primary legislation]
N/A [Further details to be provided in Final Stage IA]

5
Summary: Analysis & Evidence Policy Option D (RECOMMENDED OPTION) Description: Combined option: transition from voluntary to mandatory standards for smart appliances in 2020s, with a review of implementation of mandatory standards for all relevant appliances to be smart thereafter.
FULL ECONOMIC ASSESSMENT
Price Base Year 2016
PV Base Year 2017
Time Period Years 26
Net Benefit (Present Value (PV)) (£m)
Low: 73 High: 119 Best Estimate: 112
COSTS (£m) Total Transition (Constant Price) Years
Average Annual (excl. Transition) (Constant Price)
Total Cost (Present Value)
Low Not Estimated
Not Estimated 28
High Not Estimated Not Estimated 68
Best Estimate
35
Description and scale of key monetised costs by ‘main affected groups’
Voluntary standards followed by secondary regulation leads to higher uptake of smart appliances over the counterfactual over the 2020s and all relevant appliances smart from early 2030s, with higher manufacturing cost passed onto consumers: cost reduction assumed at 15% every time total sales double, reaching £3.20 per appliance with a market size of 10m. If the UK were not to align with international standards, the UK market may not benefit from international market-driven cost-reduction (ie. high cost sensitivity). The low cost sensitivity represents delayed policy impact.
Other key non-monetised costs by ‘main affected groups’
Business/industry: familiarisation costs and cost of complying with regulations, assumed to be low given, for example, resource already devoted to complying with current Ecodesign product requirements, gradual development of smart appliance market and low proportion of affected businesses; transition reduces risk of stifling innovation and setting unclear/too prescriptive standards.
Consumers: cost of understanding new technologies; additional energy cost from increased standby.
Wider society: enforcement costs assumed to be negligible, based on the example of resource already devoted to enforcing current Ecodesign product requirements.
BENEFITS (£m) Total Transition (Constant Price) Years
Average Annual (excl. Transition) (Constant Price)
Total Benefit (Present Value)
Low Not Estimated
Not Estimated 141
High Not Estimated Not Estimated 147
Best Estimate
147
Description and scale of key monetised benefits by ‘main affected groups’
Indicative secondary regulation benefits to wider society: electricity system benefits passed on as lower energy bills to consumers due to significant increase in smart appliance uptake above counterfactual: setting intention to review likely leads to greater uptake than Options A/B during 2020s, leading to significant development of smart tariffs and aggregation. Thereafter smart could be mandated for all relevant appliances (i.e. Option C uptake/usage assumptions). Other key non-monetised benefits by ‘main affected groups’
Option D allows for the government to adapt their strategy in light of new information i.e. a “low regrets” option.
Consumers: lower energy bills, assuming using smart appliances to shift demand combined with a smart tariff; increased consumer control/ protection.
Wider society: lower electricity prices; carbon savings/air quality from more efficient use of low carbon electricity.
Business/industry: coordination benefits, allowing suppliers and aggregators to develop smart tariffs from the increased demand for smart appliances and creating an opportunity for UK to lead in this emerging sector.
Key assumptions/sensitivities/risks Discount rate (%)
3.5
Assumes consumer protection achieved through standards; allows time for behaviour change and tariffs/aggregation services. Lower distributional impacts than Option C.
Sensitivity analysis: a) slower impact on uptake (starting 4 years after standard is put in place); b) slower cost reduction where the UK sets own standards; and c) greater cost reduction where international standards are enforced to make all relevant appliances be smart.
BUSINESS ASSESSMENT (Option D) Indicative assessment of secondary legislation, see section 14
Direct impact on business (Equivalent Annual) £m: Score for Business Impact Target (qualifying provisions only) £m:
[Because primary legislation]
Benefits: 0 [Because primary legislation]
Costs: 0 [Because primary legislation]
Benefits: 0 [Because primary legislation]
Net: 0 [Because primary legislation]
N/A [Further details to be provided in Final Stage IA]
6
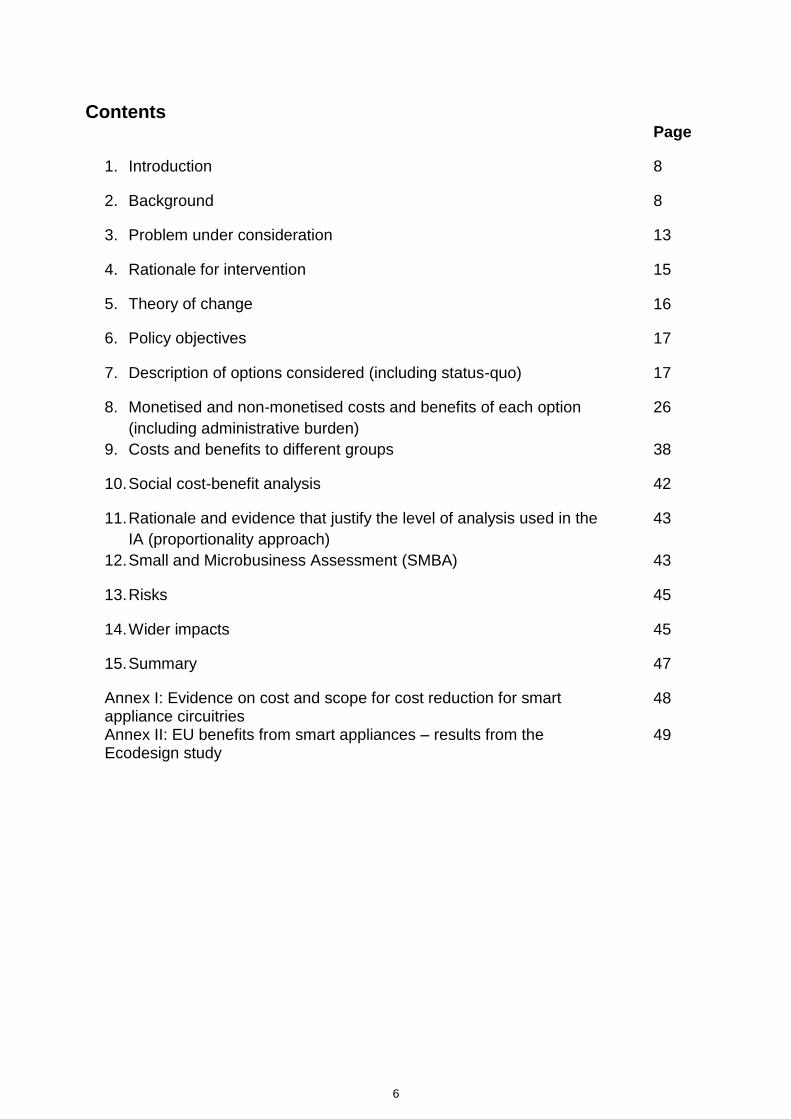
Contents Page
1. Introduction 8
2. Background 8
3. Problem under consideration 13
4. Rationale for intervention 15
5. Theory of change 16
6. Policy objectives 17
7. Description of options considered (including status-quo) 17
8. Monetised and non-monetised costs and benefits of each option
(including administrative burden)
26
9. Costs and benefits to different groups 38
10. Social cost-benefit analysis 42
11. Rationale and evidence that justify the level of analysis used in the
IA (proportionality approach)
43
12. Small and Microbusiness Assessment (SMBA) 43
13. Risks 45
14. Wider impacts 45
15. Summary 47
Annex I: Evidence on cost and scope for cost reduction for smart appliance circuitries
48
Annex II: EU benefits from smart appliances – results from the Ecodesign study
49

7
List of tables
Table 1: Manufacturers of Smart Appliances with Market Presence in the UK 12
Table 2: Initial long list of policy options identified 17
Table 3: Electricity system, market and consumer impacts and risks from each
of the policy options
22
Table 4: Costs and benefits of creating standards for smart appliances 26
Table 5: Percentage of smart enabled appliances per benchmark year under
BAU and 100% uptake scenarios
29
Table 6: Indicative present value additional cost of smart appliances under
policy options (£m)
33
Table 7: Estimated monetary benefits from providing flexibility per smart
appliance per year (EU28 average)
35
Table 8: Indicative present value electricity system benefits for uptake under
policy options (£m)
37
Table 9: Indicative net present value (NPV) benefits 42
Table 10: Indicative and Partial EANCB estimates 46
Table I: Estimates of unit cost of smart appliances 48
Table II: Estimated benefits from allowing smart appliance flexibility across the
EU-28
49
List of figures
Figure 1: UK DSR potential broken down by sector 10
Figure 2: Smart appliance standards theory of change 16
Figure 3: Indicative UK cold and wet smart appliance sales under sensitivities
set out above
29
Figure 4: Implied cost reduction curves from different levels of market
penetration
32
Figure I: Relationship between unit price and market size 49

8
1 Introduction This impact assessment (IA) sets out the existing evidence behind policy options for smart appliance standards. This analysis is intended to be read alongside the consultation document1, which sets out the Government’s proposed approach to smart appliance policy and consults on the case for introducing primary legislation to allow the Government to take powers to set standards for smart appliances. A smart appliance is an appliance which is able to respond automatically to command and control signals by modulating its energy consumption. These changes to the consumption pattern are what we call the ‘flexibility’ of the smart appliance. This IA explores the development of the smart appliance market and standards in the UK, where consumers purchase smart appliances and, either themselves (incentivised by, for example, Time of Use tariffs) or through a business service2, change their pattern of demand to consume energy when it is cheaper (i.e. generally off-peak). For the electricity system, this reduces electricity system costs by making more efficient use of low-carbon energy sources. Changing the timing of energy demand in this way is known as demand-side response services or DSR.3 In July 2017, the Government and Ofgem (Office of Gas and Electricity Markets) published their smart systems and flexibility plan.4 It outlined our response to our November 2016 publication: A smart, flexible energy system: call for evidence,5 known hereafter as the ‘Call for Evidence’. We outlined a package of 29 actions the Government, Ofgem and industry will take to remove barriers to smart technologies; enable smart homes and businesses; and improve access to energy markets for new technologies and business models. These actions are designed to reduce the costs of the energy system, and to help keep energy bills low for consumers. In this plan we set out our intention to work with industry on standards for smart appliances to ensure smart functionality allows consumers to benefit from DSR and provide flexibility to the electricity system, while providing cyber protection and avoiding proprietary standards which could limit interoperability and consumer choice. The next section sets out the background information on smart appliances including the analytical evidence base of electricity system benefits of smart flexibility (DSR and energy storage). Sections 3 and 4 outline the problem with the status quo and the rationale for Government intervention. Section 5 includes flow diagrams to explain the theory of change for Government intervention and strength of evidence. Sections 6 and 7 explain the objectives of the policy and the long-list and short-list of policy options and rationale behind the subsequent choice of the short list of options. Sections 8 – 10 set out the costs and benefits of the policy options and indicative cost-benefit analysis. The following sections (11 – 14) justify the level of analysis as proportionate and detail impacts to small and micro businesses as well as wider impacts. The final section (Section 15) summarises the rationale for the Government’s choice of the preferred option.
2 Background The Government has a challenging and critical set of objectives in the energy sector: ensuring security of energy supply, keeping bills as low as possible for households and businesses, and decarbonising in the most cost-effective way. There are important challenges ahead in delivering these objectives: ● increasing peak demand driven by electrification of transport and greater electrification of heat
(particularly picking up in the 2030s); and
● more decentralised and intermittent low-carbon generation.
1 https://www.gov.uk/government/consultations/proposals-regarding-setting-standards-for-smart-appliances
2 This service can be carried out by businesses such as the consumer’s energy supplier or through a contract with an independent aggregator.
In return for this, it is expected that the business will reward consumers with a payment that reduces the cost of their electricity compared to other consumers who do not purchase smart appliances and take part in this service. A DSR aggregator is a demand service provider that combines multiple short-duration consumer loads for sale or auction in organised energy markets. 3 Demand-Side Response (DSR) is defined by Ofgem as ‘actions taken by consumers to change the amount of electricity they take off the grid
at particular times in response to a signal’ (in Ofgem (2013) Creating the right environment for demand-side response: next steps). In practice DSR means the active reduction in the electricity a user is taking from the grid at a given moment in time. This term is typically used to describe two activities – a) reducing demand for a short period, for example by shifting a process to a different time of the day or turning fridges/air conditioners off for a brief period, or (more commonly) b) using on-site ‘backup’ generators to temporarily meet on-site requirements and/or export energy to the grid (the vast majority of DSR active in the UK currently). This impact assessment is concerned with type a) in the domestic sector. 4 BEIS (2017) Upgrading our energy system: smart systems and flexibility plan
5 BEIS (2016) A smart, flexible energy system: call for evidence
9
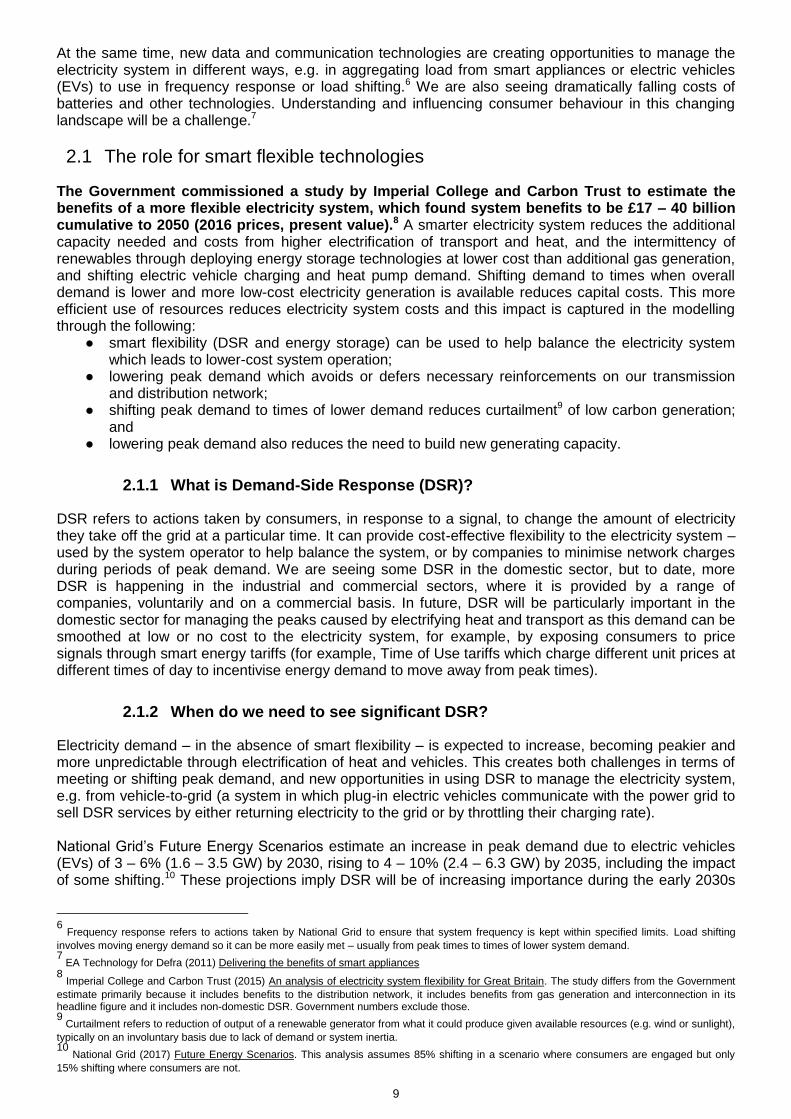
At the same time, new data and communication technologies are creating opportunities to manage the electricity system in different ways, e.g. in aggregating load from smart appliances or electric vehicles (EVs) to use in frequency response or load shifting.6 We are also seeing dramatically falling costs of batteries and other technologies. Understanding and influencing consumer behaviour in this changing landscape will be a challenge.7
2.1 The role for smart flexible technologies
The Government commissioned a study by Imperial College and Carbon Trust to estimate the benefits of a more flexible electricity system, which found system benefits to be £17 – 40 billion cumulative to 2050 (2016 prices, present value).8 A smarter electricity system reduces the additional capacity needed and costs from higher electrification of transport and heat, and the intermittency of renewables through deploying energy storage technologies at lower cost than additional gas generation, and shifting electric vehicle charging and heat pump demand. Shifting demand to times when overall demand is lower and more low-cost electricity generation is available reduces capital costs. This more efficient use of resources reduces electricity system costs and this impact is captured in the modelling through the following:
● smart flexibility (DSR and energy storage) can be used to help balance the electricity system which leads to lower-cost system operation;
● lowering peak demand which avoids or defers necessary reinforcements on our transmission and distribution network;
● shifting peak demand to times of lower demand reduces curtailment9 of low carbon generation; and
● lowering peak demand also reduces the need to build new generating capacity.
2.1.1 What is Demand-Side Response (DSR)?
DSR refers to actions taken by consumers, in response to a signal, to change the amount of electricity they take off the grid at a particular time. It can provide cost-effective flexibility to the electricity system –used by the system operator to help balance the system, or by companies to minimise network charges during periods of peak demand. We are seeing some DSR in the domestic sector, but to date, more DSR is happening in the industrial and commercial sectors, where it is provided by a range of companies, voluntarily and on a commercial basis. In future, DSR will be particularly important in the domestic sector for managing the peaks caused by electrifying heat and transport as this demand can be smoothed at low or no cost to the electricity system, for example, by exposing consumers to price signals through smart energy tariffs (for example, Time of Use tariffs which charge different unit prices at different times of day to incentivise energy demand to move away from peak times).
2.1.2 When do we need to see significant DSR?
Electricity demand – in the absence of smart flexibility – is expected to increase, becoming peakier and more unpredictable through electrification of heat and vehicles. This creates both challenges in terms of meeting or shifting peak demand, and new opportunities in using DSR to manage the electricity system, e.g. from vehicle-to-grid (a system in which plug-in electric vehicles communicate with the power grid to sell DSR services by either returning electricity to the grid or by throttling their charging rate). National Grid’s Future Energy Scenarios estimate an increase in peak demand due to electric vehicles (EVs) of 3 – 6% (1.6 – 3.5 GW) by 2030, rising to 4 – 10% (2.4 – 6.3 GW) by 2035, including the impact of some shifting.10 These projections imply DSR will be of increasing importance during the early 2030s
6 Frequency response refers to actions taken by National Grid to ensure that system frequency is kept within specified limits. Load shifting
involves moving energy demand so it can be more easily met – usually from peak times to times of lower system demand. 7 EA Technology for Defra (2011) Delivering the benefits of smart appliances
8 Imperial College and Carbon Trust (2015) An analysis of electricity system flexibility for Great Britain. The study differs from the Government
estimate primarily because it includes benefits to the distribution network, it includes benefits from gas generation and interconnection in its headline figure and it includes non-domestic DSR. Government numbers exclude those. 9 Curtailment refers to reduction of output of a renewable generator from what it could produce given available resources (e.g. wind or sunlight),
typically on an involuntary basis due to lack of demand or system inertia. 10
National Grid (2017) Future Energy Scenarios. This analysis assumes 85% shifting in a scenario where consumers are engaged but only
15% shifting where consumers are not.

10
in order to manage additional and shift away from peak demand. The Office for Low Emission Vehicles (OLEV) strategy, likely published in the coming months, will set out the Government’s analysis of the impact of EVs on the electricity system. There a number of other studies which also find significant potential for DSR, although costs remain very uncertain:
● Imperial College and Carbon Trust estimate that to achieve maximum societal benefit we would need to see 3 – 5 GW of DSR in 2020; 3 – 15 GW in 2030; 7 – 35 GW in 2050.11
● The European Commission’s Preparatory Study on Smart Appliances finds potential for 43 GW of peak flexible power from smart appliances in 2030 under business-as-usual for the EU-28 area, rising to 180 GW in a scenario where all relevant appliances are smart; this corresponds to electricity system benefits of £420m and £12.7bn respectively.12
● The European Commission’s impact assessment on DSR undertook a bottom up assessment of UK DSR potential and found potential of 4.6 GW in 2030, of which 2.4 GW is in the in the UK residential sector, 1.5 GW in the commercial sector and 0.7 GW in the industrial sector (Figure 1).13 The residential sector DSR comprises 1.9 GW from behind-the-meter batteries including electric vehicles and 0.5 GW from appliances.
The studies outlined above suggest that we would want significant levels of DSR from the mid-2030s to help reduce peak demand, and that smart appliances are a key source of DSR potential. Appliance lifetimes are typically in the region of 10 to 15 years,14 meaning that we would expect almost all of the stock of relevant smart appliances to have turned over 10 to 15 years after any standards come into force. In order to unlock a maximum technical potential of DSR from the residential sector in the mid-2030s, this would require taking action on smart appliances in the early 2020s.
Figure 1: UK DSR potential broken down by sector
Source: European Commission (2016) Impact Assessment study on downstream flexibility, price flexibility, demand response and smart metering. Note: all residential appliances in the EC study are considered in this impact assessment. The impact of smartening industrial and commercial appliances/processes is not considered in this document.
11
Imperial and Carbon Trust (2016) An analysis of electricity system flexibility for Great Britain. Note that this study estimated the benefits of a
more flexible energy system to be £17 – 40 billion cumulative to 2050. It differs from the Government estimate primarily because it includes benefits to the distribution network, it includes benefits from gas generation and interconnection in its headline figure and it includes non-domestic DSR. Government numbers exclude those. See also National Infrastructure Commission (2016) Smart power. 12
Ecodesign for European Commission (2017) Preparatory study on smart appliances Numbers converted from €2014 to £2016. 13
European Commission (2016) Impact assessment study on downstream flexibility, price flexibility, demand response and smart metering.
The analysis was based on data from Gils (2014) Assessment of the theoretical demand response potential in Europe which assessed spatial distribution of DSR potentials using high resolution GIS data of population data, land use and industrial production statistics. Load curves were either estimated or extracted from metered data available in literature and applied per appliance or process; the expected growth was considered from 2010 to 2020 and 2030. 14
Ecodesign for European Commission (2017) Preparatory study on smart appliances
11
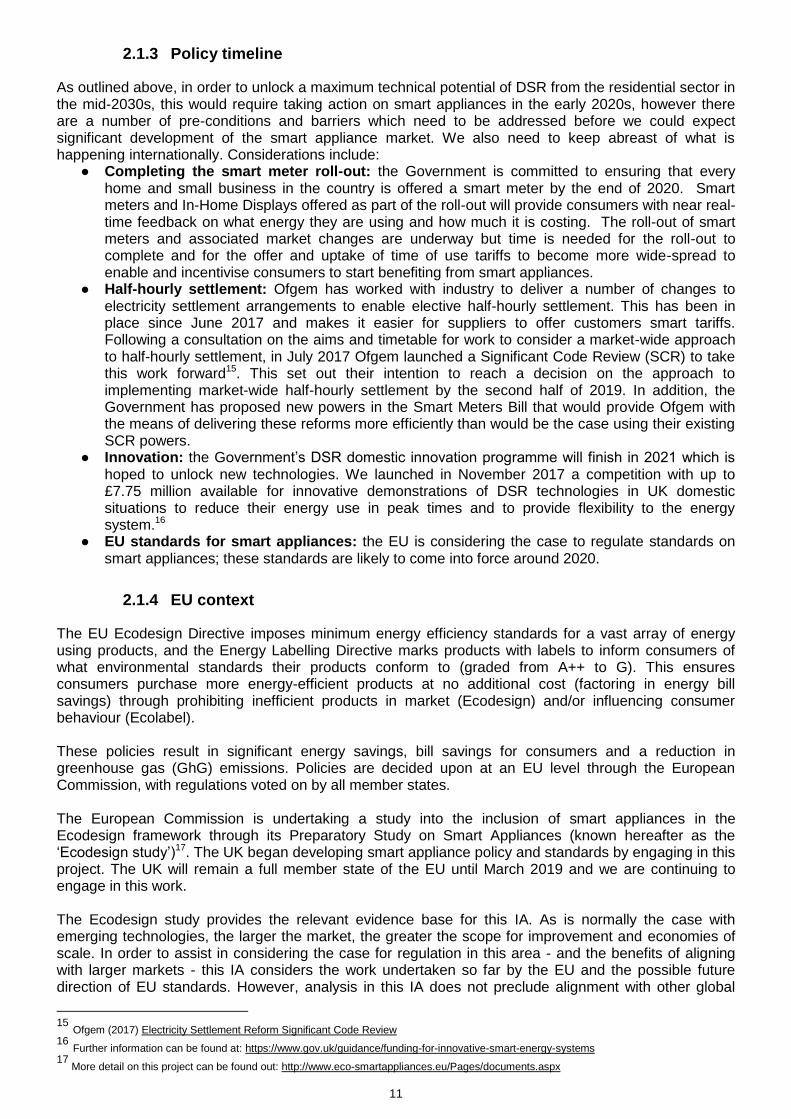
2.1.3 Policy timeline
As outlined above, in order to unlock a maximum technical potential of DSR from the residential sector in the mid-2030s, this would require taking action on smart appliances in the early 2020s, however there are a number of pre-conditions and barriers which need to be addressed before we could expect significant development of the smart appliance market. We also need to keep abreast of what is happening internationally. Considerations include:
● Completing the smart meter roll-out: the Government is committed to ensuring that every home and small business in the country is offered a smart meter by the end of 2020. Smart meters and In-Home Displays offered as part of the roll-out will provide consumers with near real-time feedback on what energy they are using and how much it is costing. The roll-out of smart meters and associated market changes are underway but time is needed for the roll-out to complete and for the offer and uptake of time of use tariffs to become more wide-spread to enable and incentivise consumers to start benefiting from smart appliances.
● Half-hourly settlement: Ofgem has worked with industry to deliver a number of changes to electricity settlement arrangements to enable elective half-hourly settlement. This has been in place since June 2017 and makes it easier for suppliers to offer customers smart tariffs. Following a consultation on the aims and timetable for work to consider a market-wide approach to half-hourly settlement, in July 2017 Ofgem launched a Significant Code Review (SCR) to take this work forward15. This set out their intention to reach a decision on the approach to implementing market-wide half-hourly settlement by the second half of 2019. In addition, the Government has proposed new powers in the Smart Meters Bill that would provide Ofgem with the means of delivering these reforms more efficiently than would be the case using their existing SCR powers.
● Innovation: the Government’s DSR domestic innovation programme will finish in 2021 which is hoped to unlock new technologies. We launched in November 2017 a competition with up to £7.75 million available for innovative demonstrations of DSR technologies in UK domestic situations to reduce their energy use in peak times and to provide flexibility to the energy system.16
● EU standards for smart appliances: the EU is considering the case to regulate standards on smart appliances; these standards are likely to come into force around 2020.
2.1.4 EU context
The EU Ecodesign Directive imposes minimum energy efficiency standards for a vast array of energy using products, and the Energy Labelling Directive marks products with labels to inform consumers of what environmental standards their products conform to (graded from A++ to G). This ensures consumers purchase more energy-efficient products at no additional cost (factoring in energy bill savings) through prohibiting inefficient products in market (Ecodesign) and/or influencing consumer behaviour (Ecolabel). These policies result in significant energy savings, bill savings for consumers and a reduction in greenhouse gas (GhG) emissions. Policies are decided upon at an EU level through the European Commission, with regulations voted on by all member states. The European Commission is undertaking a study into the inclusion of smart appliances in the Ecodesign framework through its Preparatory Study on Smart Appliances (known hereafter as the ‘Ecodesign study’)17. The UK began developing smart appliance policy and standards by engaging in this project. The UK will remain a full member state of the EU until March 2019 and we are continuing to engage in this work. The Ecodesign study provides the relevant evidence base for this IA. As is normally the case with emerging technologies, the larger the market, the greater the scope for improvement and economies of scale. In order to assist in considering the case for regulation in this area - and the benefits of aligning with larger markets - this IA considers the work undertaken so far by the EU and the possible future direction of EU standards. However, analysis in this IA does not preclude alignment with other global
15 Ofgem (2017) Electricity Settlement Reform Significant Code Review 16 Further information can be found at: https://www.gov.uk/guidance/funding-for-innovative-smart-energy-systems 17
More detail on this project can be found out: http://www.eco-smartappliances.eu/Pages/documents.aspx

12
standards, as and when these are developed. The UK’s relationship with EU standards, including this area, is a matter for ongoing negotiations and the analysis presented here is without prejudice to the UK’s future relationship with the EU after the UK has left in March 2019. This work (on UK smart appliance policy) is expected to help the UK influence and take part in processes to develop such standards at an international level, including in the EU. This will in turn help to ensure international alignment in this sphere as far as possible. We will take into account developments elsewhere, such as in the United States, where they are similarly reviewing standards for connected devices to encourage interoperability and to ensure devices have appropriate protection from cyber risks. Continued engagement with international standards- both European and wider global standards- will allow British manufacturers to benefit from a wider market in which to sell their products as well as a wider market for consumers; and either avoid excluding European smart appliances from the UK market by setting too high a standard, or avoid the UK becoming a smart appliance dumping ground for inferior or defective smart appliances.
2.1.5 UK Market and Manufacturers
Globally, key manufactures developing smart appliances include Bosch, Electrolux, GE, Indesit, and Whirlpool which have pilot programmes underway for several products.18 There are currently few UK-centred companies with significant positions in the smart appliances market, and these are typically large international firms based in the UK.19
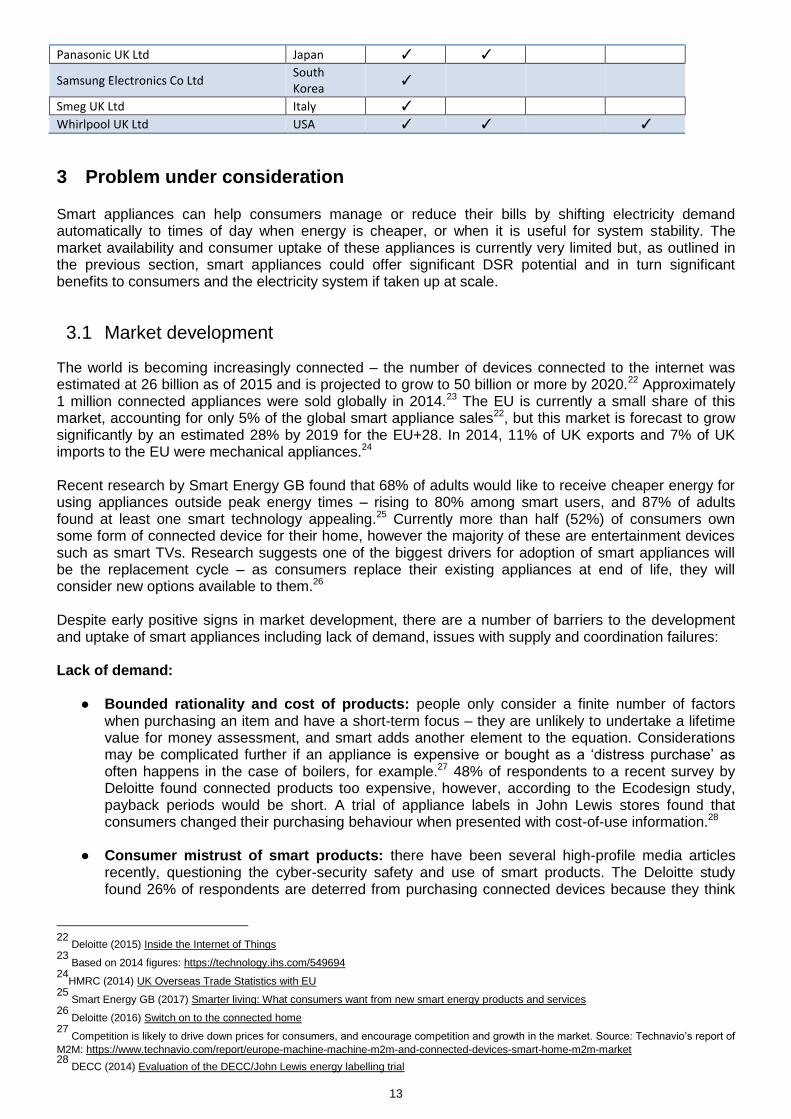
Table 1 provides an overview of key smart appliance manufacturers with a market presence in the UK currently. There is a dominance of companies with head-quarters based in Western Europe. Two companies have their headquarters based in the UK (Crosslee plc and Glen Dimplex Home Appliances Ltd) with the remainder being located predominantly in Germany and Italy. Major Asian players with a market presence in the UK include Samsung, LG Electronics, Panasonic and Haier.
Although several smart appliance manufacturers are shown to have presence in the UK, this is largely for retail and distribution purposes, with the production process occurring outside the UK. For example, of the listed companies for washing machines, only one has a manufacturing plant base within the UK.
Table 1: Manufacturers of Smart Appliances with Market Presence in the UK20
Company
Head Quarters
Fridges /Freezers
Washing machines
Tumble dryers
Dishwashers
Baumatic21 Czech
Republic ✓
Beko plc Turkey ✓
BSH Home Appliances Ltd (Bosch and Siemens Subsidiary)
Germany ✓ ✓ ✓
Crosslee plc UK ✓
Electrolux plc Sweden ✓ ✓ ✓ ✓
Glen Dimplex Home Appliances Ltd UK
Haier UK Ltd China ✓ ✓
Hoover Ltd Italy ✓ ✓
Indesit Co UK Ltd Italy ✓ ✓ ✓ ✓
LG Electronics UK Ltd South Korea
✓ ✓
Miele Company Ltd Germany ✓ ✓ ✓
18
Pike Research (2013) Executive Summary: Smart Appliances Intelligent Control, Power Management, and Networking Technologies for
Household Appliances on the Smart Grid: Global Market Analysis and Forecasts, Published Q3 2012. 19
HM Government (2013) Smart Cities: Opportunities for the UK 20
Adapted from YouGov (2012) Smart Appliances, 2012 21
Baumatic was acquired by Hoover in 2013 (SeeWhich? (2013) Hoover buys Baumatic appliance brand, Available at
http://www.which.co.uk/news/2013/11/hoover-buys-baumatic-appliance-brand-341021/
13
Panasonic UK Ltd Japan ✓ ✓
Samsung Electronics Co Ltd South Korea
✓
Smeg UK Ltd Italy ✓
Whirlpool UK Ltd USA ✓ ✓ ✓
3 Problem under consideration Smart appliances can help consumers manage or reduce their bills by shifting electricity demand automatically to times of day when energy is cheaper, or when it is useful for system stability. The market availability and consumer uptake of these appliances is currently very limited but, as outlined in the previous section, smart appliances could offer significant DSR potential and in turn significant benefits to consumers and the electricity system if taken up at scale.
3.1 Market development
The world is becoming increasingly connected – the number of devices connected to the internet was estimated at 26 billion as of 2015 and is projected to grow to 50 billion or more by 2020.22 Approximately 1 million connected appliances were sold globally in 2014.23 The EU is currently a small share of this market, accounting for only 5% of the global smart appliance sales22, but this market is forecast to grow significantly by an estimated 28% by 2019 for the EU+28. In 2014, 11% of UK exports and 7% of UK imports to the EU were mechanical appliances.24 Recent research by Smart Energy GB found that 68% of adults would like to receive cheaper energy for using appliances outside peak energy times – rising to 80% among smart users, and 87% of adults found at least one smart technology appealing.25 Currently more than half (52%) of consumers own some form of connected device for their home, however the majority of these are entertainment devices such as smart TVs. Research suggests one of the biggest drivers for adoption of smart appliances will be the replacement cycle – as consumers replace their existing appliances at end of life, they will consider new options available to them.26 Despite early positive signs in market development, there are a number of barriers to the development and uptake of smart appliances including lack of demand, issues with supply and coordination failures: Lack of demand:
● Bounded rationality and cost of products: people only consider a finite number of factors when purchasing an item and have a short-term focus – they are unlikely to undertake a lifetime value for money assessment, and smart adds another element to the equation. Considerations may be complicated further if an appliance is expensive or bought as a ‘distress purchase’ as often happens in the case of boilers, for example.27 48% of respondents to a recent survey by Deloitte found connected products too expensive, however, according to the Ecodesign study, payback periods would be short. A trial of appliance labels in John Lewis stores found that consumers changed their purchasing behaviour when presented with cost-of-use information.28
● Consumer mistrust of smart products: there have been several high-profile media articles recently, questioning the cyber-security safety and use of smart products. The Deloitte study found 26% of respondents are deterred from purchasing connected devices because they think
22
Deloitte (2015) Inside the Internet of Things 23
Based on 2014 figures: https://technology.ihs.com/549694 24
HMRC (2014) UK Overseas Trade Statistics with EU 25
Smart Energy GB (2017) Smarter living: What consumers want from new smart energy products and services 26
Deloitte (2016) Switch on to the connected home 27
Competition is likely to drive down prices for consumers, and encourage competition and growth in the market. Source: Technavio’s report of
M2M: https://www.technavio.com/report/europe-machine-machine-m2m-and-connected-devices-smart-home-m2m-market 28
DECC (2014) Evaluation of the DECC/John Lewis energy labelling trial
14
the technology still needs to evolve.29 The impact of standards was seen with heat pumps in Germany where an initial collapse of the market was eventually reversed through the introduction of technical standards, quality assurance and information campaigns which addressed consumer confidence problems.30
Issues with supply:
● Lack of interoperability standards: currently there are no set standards for smart appliances internationally or at EU level. Interoperability (the ability of a product or system to work with other products or systems) is vital to enable consumer choice and ensure consumers can benefit fully from a connected home, ensuring consumers are not locked in to devices from a particular manufacturer. Open standards31 would enable interoperability, promoting competition and innovation.32 Work is being conducted on creating these standards, but thus far progress has been relatively slow.33 Evidence set out in this IA suggests creating standards can help build trust in the nascent industry.
● Cyber risks: there are risks that products are being produced without appropriate attention given to cyber or data privacy – this risks problems in future which could further undermine consumer trust in the emerging market.
Timing, scale and coordination failures:
● Limited financial incentives for consumers: in order for consumers to benefit financially from owning and using smart appliances, the capability to measure time of use and the emergence of Time of Use tariffs and/or businesses that provide a service to reward demand-side response is required. At the end of September 2017, there were over 8.6m smart and advanced meters operating in homes and businesses.34 Smart meters which record half-hourly consumption allow the consumer to make use of a smart tariff. Similarly there are limited smart tariffs or aggregation services available on the market at present which would allow the consumer to realise energy bill savings from smart appliances.
● Lack of consumer demand to stimulate market development: without demand for their products, manufacturers are unlikely to significantly invest in the development of smart appliances, given high capital costs of innovation.
● Lack of scale to realise timely system benefits: as outlined in the section above, from 2030 onwards, given forecasted increases in electricity demand from the electrification of heat and transport, DSR can reduce costs to the electricity system. Smart appliances offer significant cost-effective DSR potential but, given the lifetime of products, for this potential to be available at scale requires earlier action to stimulate market development and consumer uptake (rather than relying on a demand-led/market led approach).
29
Deloitte (2016) Switch on to the connected home 30
UKERC Technology and Policy Assessment (2016) 31
Standards made available to the general public and are developed (or approved) and maintained via a collaborative and consensus driven
process. They are intended for widespread adoption. Source: http://www.itu.int/en/ITU-T/ipr/Pages/open.aspx 32
This is supported by responses to the BEIS Smart Systems Call for Evidence. 33
The IEC is working to develop standards suitable for smart grids, including those for interoperability; the European Commission has
requested a report into standards by CENELEC for Machine to Machine communicating-appliances, one aspect of which included interoperability. They created Saref which is an ontology whereby common technological instructions are shared and used. This is expected to feed into any Ecodesign regulation on smart appliances, which is currently being reviewed. A group within BSI (L13) has also recently been reformed to look into standards relating to the smart grid. 34
Latest data published by government here: https://www.gov.uk/government/collections/smart-meters-statistics

15
4 Rationale for intervention
4.1 Addressing timing and coordination issue to stimulate demand and supply
Building on the previous section, the following market failures exist which imply uptake would be sub-optimal in the absence of Government intervention. If we wait for the energy tariff and aggregation market to develop first to fully incentivise uptake, then, given the 10-15 year lifetime of products, we may reduce much of the potential benefits from DSR in the 2030s when they may be required. This suggests that some form of intervention will be key to establishing greater use of DSR from smart appliances, compared to the business-as-usual case, in order to maximise electricity system benefits within appropriate time scales.35 1) Positive externalities are associated with the deployment and use of smart appliances to manage
electricity system demand. When a consumer allows their appliance to be managed, this DSR together with other smart flexibility can contribute to £17 – 40 billion cumulative to 2050 (2016 prices, present value).36 Consumers should receive a financial incentive from the use of their smart appliances (either through smart tariffs or business services assuming they have an agreement with their supplier or aggregator). Smart functionality will also enable consumers to better manage their bills, potentially lowering these costs. However, there are additional electricity system benefits which may not accrue directly to the smart appliance owner, leading to less than optimal smart appliance uptake and usage if left to the market alone.
2) Coordination failures in the nascent market for smart appliances could lead to a ‘first mover disadvantage’. Creating minimum standards which deliver clear parameters for technical development and build consumer trust in cyber-security and data privacy should signal a time for businesses to begin developing their products and services to help boost demand for smart appliances.37
3) Creating the right conditions for competitive behaviour can limit technological fragmentation, which would deter consumers from purchasing smart appliances. By creating standards, the Government can ensure open communication channels are used and so smart appliances are interoperable, thus leading to improved consumer experience and expected higher uptake.
4) Imperfect information, particularly lack of awareness and bounded rationality by consumers in understanding the relative costs and benefits of smart appliances, as well as mistrust of the smart functionality, can hinder consumers from wanting to purchase and use smart appliances. Labelling provides information to consumers to help overcome this barrier.
4.2 Addressing consumer protection and cyber threat
4.2.1 Consumer protection
To protect consumers against potential risks posed by smart appliances the following points should be considered:
1) Data Privacy: consumers must be in control of any data exchanged with third parties arising from the appliances with clear consent procedures that will ensure they are able to make informed decisions regarding data sharing. Existing regulation on data privacy will continue to apply, including the Data Protection Act 1998 and the Data Protection Bill (when enacted).
2) Cyber-security for individuals: there are significant potential risks to individuals from the ability of third parties, without permission, to control consumption,38 or to have access to data regarding consumption and access to insight into a consumer’s home life through appliances. As well as the risks posed to the electricity system itself (explained in more detail below), we are mindful that cyber-security issues can adversely affect consumer confidence in, and acceptance of, smart
35
BEIS (2017) Realising the potential of demand-side response to 2025 36
Imperial College and Carbon Trust (2015) An analysis of electricity system flexibility for Great Britain. The study differs from the Government
estimate primarily because it includes benefits to the distribution network, it includes benefits from gas generation and interconnection in its headline figure and it includes non-domestic DSR. Government numbers exclude those. 37
For example, smart tariffs are limited on the market thus far: Tide from Green Energy is one of the first of its kind. 38
e.g. Nest hackers in 2014 in the USA on smart thermostats: https://motherboard.vice.com/en_us/article/internet-of-things-ransomware-smart-
thermostat
16
energy applications.39 Therefore there is a role for the Government, Ofgem and industry to ensure the risks are addressed proportionately.
4.2.2 Cyber security for the electricity system
The proliferation of Internet of Things (IoT) devices is increasing in all aspects of our everyday life and throughout the home environment. There is already a well-established market for products including IoT thermostats and smart chargers for EVs which are covered by separate standards and manufacturers are exploring new markets with products including smart appliances. In the move to a smart energy system, that is more complex and more driven by data and communication technologies, it is essential that cyber-security risks are effectively understood and acted upon. In the longer term, system stability is recognised as one of the requirements we identified for a future system. The Government has undertaken significant stakeholder engagement across industry to assess the magnitude of the smart cyber-security risk up to 2030, including consideration of the increasing levels of smart EV charging and electrical heating. We believe that this risk, although comparatively small now due to the low penetration and the types of DSR on the network, could increase with time as the amount of DSR grows to balance an increased amount of renewables, and as the role of automated DSR becomes more prevalent in the domestic sector. The Government takes its duty seriously to ensure sufficient protections are in place to mitigate potential risk to grid-stability, such as the threat from cyber which smart appliances could be associated with.
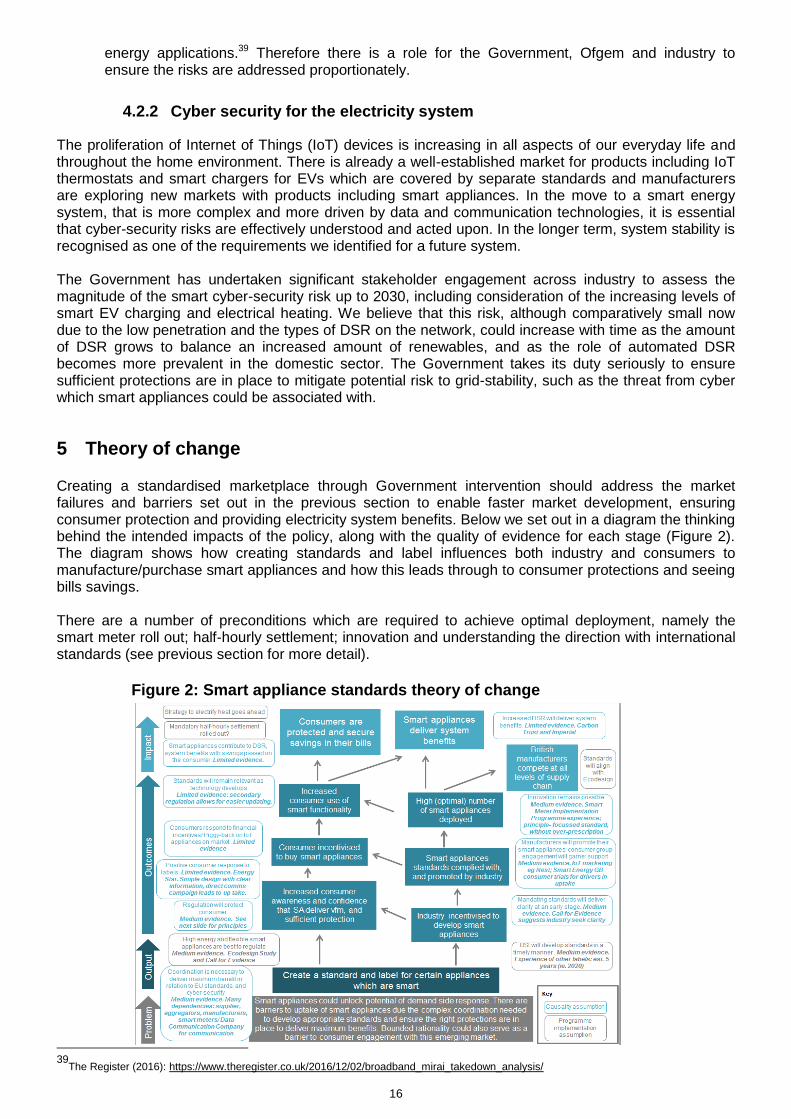
5 Theory of change Creating a standardised marketplace through Government intervention should address the market failures and barriers set out in the previous section to enable faster market development, ensuring consumer protection and providing electricity system benefits. Below we set out in a diagram the thinking behind the intended impacts of the policy, along with the quality of evidence for each stage (Figure 2). The diagram shows how creating standards and label influences both industry and consumers to manufacture/purchase smart appliances and how this leads through to consumer protections and seeing bills savings. There are a number of preconditions which are required to achieve optimal deployment, namely the smart meter roll out; half-hourly settlement; innovation and understanding the direction with international standards (see previous section for more detail).
Figure 2: Smart appliance standards theory of change
39
The Register (2016): https://www.theregister.co.uk/2016/12/02/broadband_mirai_takedown_analysis/

17
6 Policy objectives
The main objectives behind potential minimum standards are to:
1. Provide certainty in the sector to help rectify the coordination failure between the availability of smart appliances and smart tariffs, enabling electricity system benefits and consumer rewards.
2. Ensure minimum standards of functionality of smart appliances to protect consumers and the electricity system.
3. Enable the UK marketplace to be at the forefront of an emerging sector.
7 Description of options considered (including status-quo)
7.1 Long list of options
This impact assessment forms part of the supporting evidence for the consultation on proposals to
regulate smart appliances (see consultation document40). A number of policy options were initially
identified by BEIS, set out in Table 2:
Table 2: Initial long list of policy options identified
Regulation Fiscal measures Non-regulatory & non-fiscal measures
Restrict choice
Eliminate choice
Incentives Disincentives Non-fiscal measures
Persuasion Provision of information
Changes to the default policy
Industry level
Align with Ecodesign Standards Mandatory "smart" labelling Mandate all smart appliances meet certain minimum standards
Mandatory single standard (such as
ZigBee)41
Mandate that all relevant appliances be smart
Tax reductions on smart appliances Tax breaks for energy suppliers who provide smart tariffs
Increased taxes on non-smart appliances Do nothing
Setting smart standards and associated label to indicate compliance
Work with energy suppliers on offers for connected homes Industry-led voluntary standards
Consumer level
Scrappage schemes Tax breaks for consumers who opt for smart tariffs Tax reductions on smart appliances
Comms campaigns around smart homes (such as Smart Energy GB)
The options were then assessed qualitatively against the following criteria under current conditions: effectiveness at meeting policy objectives (set out in Section 6); cost to Government; and public and industry support, combined to consider overall potential value for money. It was considered disproportionate to carry out a full value for money assessment for each of these options. These options are not necessarily mutually exclusive and we do not preclude the possibility of reconsidering some of
40
This can be found at: https://www.gov.uk/government/consultations/proposals-regarding-setting-standards-for-smart-appliances 41
ZigBee is an open global standard for wireless technology designed to use low-power digital radio signals for personal area networks.
18
these options at a later date in light of new evidence, under our adaptive strategy approach as set out in the smart systems plan.42
The first question that was asked when narrowing down the long list of options was whether the option effectively met the policy objectives. On this basis, the information and communications based options were not taken as the primary preferred policy options as they are less likely to be effective in achieving policy goals than setting standards. The factor of international alignment played a role here too: many manufacturers are based in the EU Member States. Manufacturer responses to the Call for Evidence indicated they were keen to align standards across Member States. This was an important factor in narrowing down the long list of policy options towards a voluntary labelling/ standard-setting policy approach: creating an environment where the smart appliance market can flourish in the UK. Fiscal provisions too were a factor in narrowing this list: although fiscal measures may incentivise high uptake of smart appliances (this is uncertain), there is the potential for significant cost to the Government in doing so. Since there are other effective means of achieving the policy aims without incurring such governmental cost, fiscal measures were not pursued as options. Standards were considered to be a more proportionate approach in the financial sense. Standards (set through regulation or support for voluntary industry measures) were therefore chosen on effectiveness and cost to Government grounds, they also allow scope for international alignment. Fiscal measures may incentivise higher uptake although this is uncertain and may come at significant cost to the Government and greater risk to consumers and electricity system protection. Communications and information options were considered insufficient in isolation to encourage the development of an infant industry like smart appliances, although may be required alongside regulation.
This is consistent with and also reflects findings from the BEIS-Ofgem 2016 Call for Evidence, where most respondents supported voluntary standards for smart appliances, with an associated label to indicate compliance with those standards, initially. Many supported the progression to mandatory standards for smart appliances, once the industry has become familiar with the voluntary standards.
7.1.1 Fiscal measures
Fiscal incentives were considered inappropriate for further investigation because of the cost to Government and potential distributional impacts as they could effectively subsidise high-income consumers under non-market-wide standards. Fiscal disincentives are likely to receive push-back from industry. In addition, not ensuring minimum standards could (greatly) reduce benefits to consumers (for example, by consumers getting locked into certain brands). However, fiscal incentives would likely be effective in achieving the objectives of providing certainty and enabling development of the UK market place.
7.1.2 Communications and information
Communications and information-based policy is unlikely to be as effective as regulation for the purposes of this policy. However, it will be important to consider communications support alongside the implementation of regulatory policy to deliver maximum effectiveness. The evidence synthesis from the smart meter installation programme shows that both public awareness raising and the provision of detailed information for smart meter recipients before the installation have been important in influencing whether householders were to engage effectively with smart metering.
7.1.3 Regulation
The UK will continue to be a full member state of the EU until March 2019 and we are actively engaging
in the European Commission’s Ecodesign preparatory study on smart appliances.43
The UK’s future
relationship with the EU, including any implementation period, is a matter for ongoing negotiations. However, it is prudent to also consider our policy on smart appliances at the domestic level.
42
BEIS (2017) Upgrading our energy system: smart systems and flexibility plan 43
More detail on this project can be found out: http://www.eco-smartappliances.eu/Pages/documents.aspx
19
In August 2017, a recommended approach for inclusion of smart appliances within the Ecodesign framework was published by the EU’s consultants. This would be to impose energy labelling requirements for smart appliances, which meet specified smart functionality criteria. We will continue to monitor and engage with the EU and other international organisations as they consider standards for smart appliances. Further information on this project is expected in 2018. For the reasons outlined above, it is prudent to begin our own work on the development of domestic standards, and use that to influence international standards to ensure alignment as far as possible. In doing this, we will also take into account developments elsewhere, such as in the United States where they are similarly reviewing standards for connected devices to encourage interoperability and to ensure cyber-security.
7.2 Short list of options
Four options for introducing minimum standards are assessed in this impact assessment, against the counterfactual. Base case – do nothing (the counterfactual) Government takes no action to create or actively support any voluntary industry initiative.44 Industry may develop standards, either in line or different to HM Government/BEIS policy concerns about interoperability, data privacy and cyber- and grid-security, but at a slower rate than if BEIS guided the development of a technical standard. The EU will also continue to consider the case for developing an EU-wide standard. Option A: Voluntary industry standard developed by industry and interested stakeholders through the BSI (the British Standards Institution), compliance with which is represented by a label, for all relevant appliances (see Box 1 for explanation of appliance types45) which are communications-enabled and able to automatically modulate energy consumption in response to signals. Government policy encourages compliance for these smart appliances. Option B: Mandatory standards and labelling for all relevant smart appliances. Standard developed by industry through BSI, combined with a label to show compliance, is mandated by legislation for all new relevant appliances that are communications-enabled and able to automatically modulate energy consumption in response to signals to comply with standards to be set by regulation. Option C: Mandatory standards and labelling for all relevant appliances to be smart. Standard developed by industry through BSI, combined with a label to show compliance, is mandated by legislation for all new relevant appliances to comply with standards to be set by regulation. Option D: Combined option: transition from voluntary to mandatory standards for smart appliances in 2020s, with a review of implementation of mandatory standards for all relevant appliances to be smart thereafter. Standard developed industry and stakeholders through the BSI combined with a label to show compliance (i.e. transition from Options A to B in 2020s with a view to review implementation of Option C thereafter). We have not considered a reverse option to transition from mandatory to self-regulation once the market imperfections listed are addressed. As smart appliances are not yet prevalent in the market, Option D allows for Options A and B to be pursued sequentially, so standards are available for smart appliances while non-smart appliances are still available and in use. Option D allows implementation of mandatory smart products if and when the non-smart market decreases to an extent that mandating smart appliances would be proportionate in order to achieve optimal DSR benefits. It is a policy option which allows for review and adaptability which is important in a developing and novel sector, such as smart appliances.
44
Broader-range policy options were initially considered, and discounted for various reasons, leaving the three options and counterfactual
considered here. 45
Relevant appliances are as defined below to include cold and wet appliances, heating, ventilation and air conditioning (HVAC) and battery
storage.
20
A main difference between the options is the rate at which they would be expected to impact upon smart appliance uptake and the extent to which they would provide the protection needed for consumers and the grid.
7.3 Definition of smart and relevant appliances
For the purpose of this policy we have defined “smart” appliances as: a) Appliances which are able to automatically respond to communication of command and control
messages, e.g. price information, direct control signals, and/or local measurements of electricity supply (mainly voltage and frequency); and
b) The response is a change of the appliance’s electricity consumption pattern, known as ‘flexibility’.46
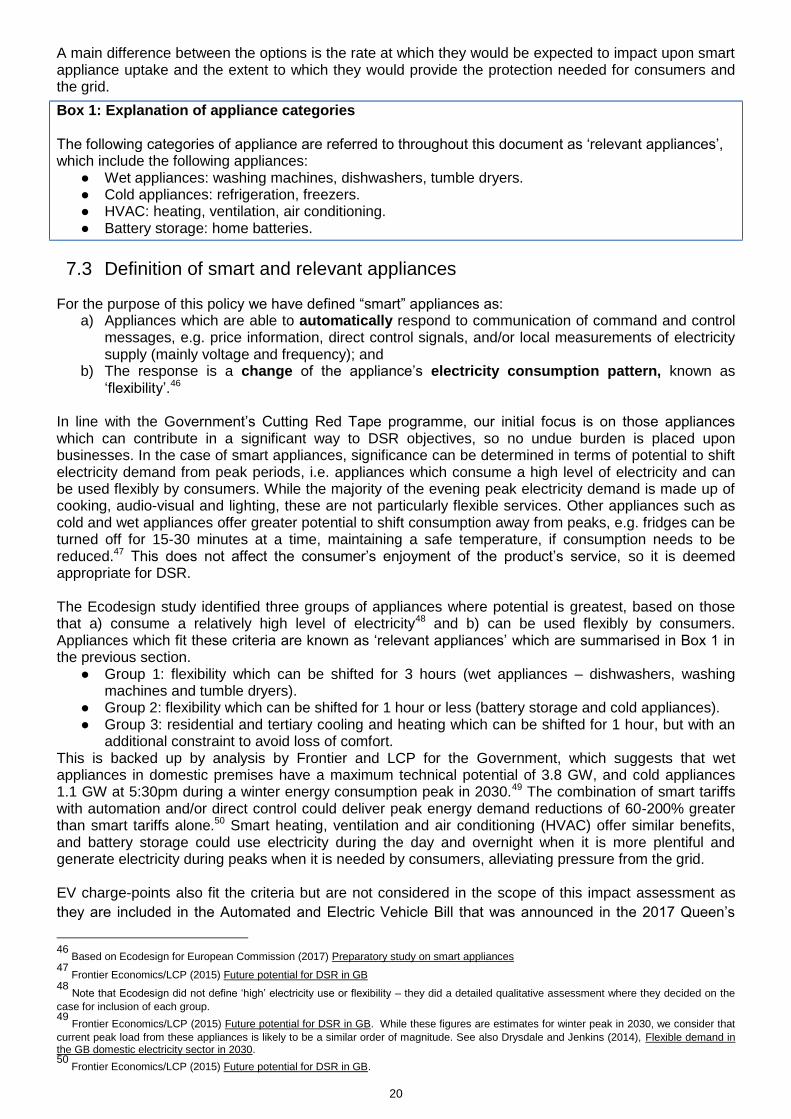
In line with the Government’s Cutting Red Tape programme, our initial focus is on those appliances which can contribute in a significant way to DSR objectives, so no undue burden is placed upon businesses. In the case of smart appliances, significance can be determined in terms of potential to shift electricity demand from peak periods, i.e. appliances which consume a high level of electricity and can be used flexibly by consumers. While the majority of the evening peak electricity demand is made up of cooking, audio-visual and lighting, these are not particularly flexible services. Other appliances such as cold and wet appliances offer greater potential to shift consumption away from peaks, e.g. fridges can be turned off for 15-30 minutes at a time, maintaining a safe temperature, if consumption needs to be reduced.47 This does not affect the consumer’s enjoyment of the product’s service, so it is deemed appropriate for DSR. The Ecodesign study identified three groups of appliances where potential is greatest, based on those that a) consume a relatively high level of electricity48 and b) can be used flexibly by consumers. Appliances which fit these criteria are known as ‘relevant appliances’ which are summarised in Box 1 in the previous section.
● Group 1: flexibility which can be shifted for 3 hours (wet appliances – dishwashers, washing machines and tumble dryers).
● Group 2: flexibility which can be shifted for 1 hour or less (battery storage and cold appliances). ● Group 3: residential and tertiary cooling and heating which can be shifted for 1 hour, but with an
additional constraint to avoid loss of comfort. This is backed up by analysis by Frontier and LCP for the Government, which suggests that wet appliances in domestic premises have a maximum technical potential of 3.8 GW, and cold appliances 1.1 GW at 5:30pm during a winter energy consumption peak in 2030.49 The combination of smart tariffs with automation and/or direct control could deliver peak energy demand reductions of 60-200% greater than smart tariffs alone.50 Smart heating, ventilation and air conditioning (HVAC) offer similar benefits, and battery storage could use electricity during the day and overnight when it is more plentiful and generate electricity during peaks when it is needed by consumers, alleviating pressure from the grid. EV charge-points also fit the criteria but are not considered in the scope of this impact assessment as
they are included in the Automated and Electric Vehicle Bill that was announced in the 2017 Queen’s
46
Based on Ecodesign for European Commission (2017) Preparatory study on smart appliances 47
Frontier Economics/LCP (2015) Future potential for DSR in GB 48
Note that Ecodesign did not define ‘high’ electricity use or flexibility – they did a detailed qualitative assessment where they decided on the
case for inclusion of each group. 49
Frontier Economics/LCP (2015) Future potential for DSR in GB. While these figures are estimates for winter peak in 2030, we consider that
current peak load from these appliances is likely to be a similar order of magnitude. See also Drysdale and Jenkins (2014), Flexible demand in the GB domestic electricity sector in 2030. 50
Frontier Economics/LCP (2015) Future potential for DSR in GB.
Box 1: Explanation of appliance categories The following categories of appliance are referred to throughout this document as ‘relevant appliances’, which include the following appliances:
● Wet appliances: washing machines, dishwashers, tumble dryers. ● Cold appliances: refrigeration, freezers. ● HVAC: heating, ventilation, air conditioning. ● Battery storage: home batteries.

21
Speech.51 Therefore, this impact assessment considers the scope of Government intervention to
be focused on cold and wet appliances, HVAC and battery storage, defined hereafter as ‘relevant
appliances’.
51
The Queen’s Speech 2017
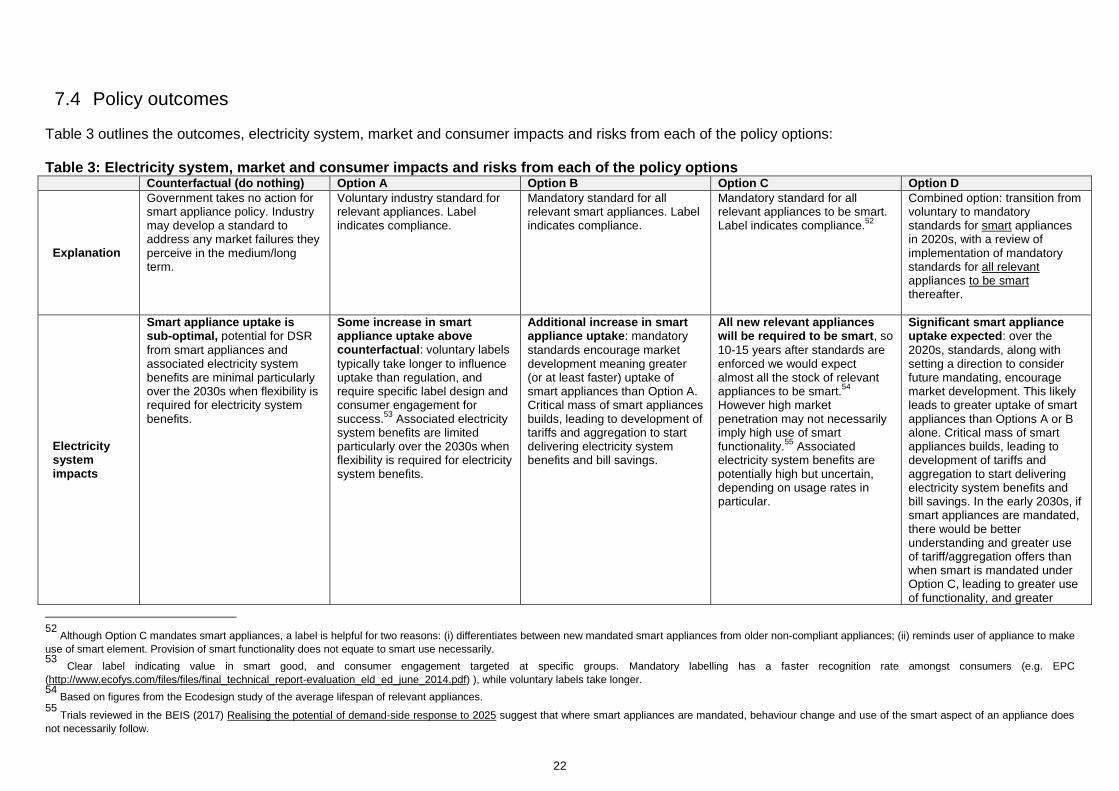
22
7.4 Policy outcomes
Table 3 outlines the outcomes, electricity system, market and consumer impacts and risks from each of the policy options: Table 3: Electricity system, market and consumer impacts and risks from each of the policy options
Counterfactual (do nothing) Option A Option B Option C Option D
Explanation
Government takes no action for smart appliance policy. Industry may develop a standard to address any market failures they perceive in the medium/long term.
Voluntary industry standard for relevant appliances. Label indicates compliance.
Mandatory standard for all relevant smart appliances. Label indicates compliance.
Mandatory standard for all relevant appliances to be smart. Label indicates compliance.
52
Combined option: transition from voluntary to mandatory standards for smart appliances in 2020s, with a review of implementation of mandatory standards for all relevant appliances to be smart thereafter.
Electricity system impacts
Smart appliance uptake is sub-optimal, potential for DSR
from smart appliances and associated electricity system benefits are minimal particularly over the 2030s when flexibility is required for electricity system benefits.
Some increase in smart appliance uptake above counterfactual: voluntary labels
typically take longer to influence uptake than regulation, and require specific label design and consumer engagement for success.
53 Associated electricity
system benefits are limited particularly over the 2030s when flexibility is required for electricity system benefits.
Additional increase in smart appliance uptake: mandatory
standards encourage market development meaning greater (or at least faster) uptake of smart appliances than Option A. Critical mass of smart appliances builds, leading to development of tariffs and aggregation to start delivering electricity system benefits and bill savings.
All new relevant appliances will be required to be smart, so
10-15 years after standards are enforced we would expect almost all the stock of relevant appliances to be smart.
54
However high market penetration may not necessarily imply high use of smart functionality.
55 Associated
electricity system benefits are potentially high but uncertain, depending on usage rates in particular.
Significant smart appliance uptake expected: over the
2020s, standards, along with setting a direction to consider future mandating, encourage market development. This likely leads to greater uptake of smart appliances than Options A or B alone. Critical mass of smart appliances builds, leading to development of tariffs and aggregation to start delivering electricity system benefits and bill savings. In the early 2030s, if smart appliances are mandated, there would be better understanding and greater use of tariff/aggregation offers than when smart is mandated under Option C, leading to greater use of functionality, and greater
52
Although Option C mandates smart appliances, a label is helpful for two reasons: (i) differentiates between new mandated smart appliances from older non-compliant appliances; (ii) reminds user of appliance to make
use of smart element. Provision of smart functionality does not equate to smart use necessarily. 53
Clear label indicating value in smart good, and consumer engagement targeted at specific groups. Mandatory labelling has a faster recognition rate amongst consumers (e.g. EPC
(http://www.ecofys.com/files/files/final_technical_report-evaluation_eld_ed_june_2014.pdf) ), while voluntary labels take longer. 54
Based on figures from the Ecodesign study of the average lifespan of relevant appliances. 55
Trials reviewed in the BEIS (2017) Realising the potential of demand-side response to 2025 suggest that where smart appliances are mandated, behaviour change and use of the smart aspect of an appliance does
not necessarily follow.

23
electricity system benefits.
Market and consumer impacts
Cost reduction likely to be driven by EU standards. UK market development is limited
and could stall. Consumers are not protected
or this is delayed, if a voluntary standard develops. Consumers have full choice of
appliances, but range of smart appliances may be limited.
Cost reduction likely to be driven by EU standards if we opt for the same technical standards. Some UK market development and competition driving reduction in mark-up:
little impact on coordination barrier, so only industry innovators will move towards smart products and services. Limited consumer protection:
risk of undercutting or appropriate protections may not be provided. Consumers have full choice of
appliances.
Cost reduction likely to be driven by EU standards if we opt for the same technical standard. Some UK market development competition driving reduction in mark-up:
likely higher/faster levels of uptake than Option A. Certainty from policy encourages smart appliance production and sales
56
which is expected to encourage market competition and deployment to drive consumer price down.
57
Consumer protection:
minimum, open standard can engender trust and support innovation. Consumers have full choice of
appliances.
Cost reduction likely to be driven by EU standards if we opt for the same technical standard. Significant market development and competition driving reduction in mark-up:
significant cost reduction potential for producers (likely passed to consumers) – greater than other options, so offers the opportunity for more consumers to use smart appliances, without being inhibited by cost.
58
However, the Ecodesign study notes views that the market is technically not yet fully ready which could result in a higher cost increase. Consumer protection:
minimum, open standard can engender trust and support innovation. Choice of non-smart appliances is taken away
which could hinder effective usage of smart appliances and risk consumer mistrust.
Cost reduction likely to be driven by EU standards if we opt for the same technical standard. Significant market development and competition driving reduction in mark-up:
creates clear signal for industry to encourage market to move towards smart appliances without removing consumer choice as under Option C. There would be good cost reduction potential as the market is promoted by standards, before smart appliances become mandatory. Consumer protection:
minimum, open standard can engender trust and support innovation while the market is developing, leading to improved trust of smart functionality before smart is mandated. Choice of non-smart appliances is not taken away
until they become commonplace.
Distributio-nal impact
Some consumers will choose to purchase and pay more for smart appliances if they consider them to be beneficial.
Consumers will choose to purchase and pay more for smart appliances if they consider them to be beneficial. The technologically-aware are
likely to benefit most.59
Other
consumers may lose out because they cannot afford the
Consumers will choose to purchase and pay more for smart appliances if they consider them to be beneficial. Some consumers may lose out – either because they cannot afford the additional upfront cost and/or because they cannot
Consumers must pay more for smart appliances regardless of their income group and whether they consider them to be beneficial. Some consumers may not be able to be flexible to demand shifting, and/or may not have
Allows time for behaviour change and smart tariffs/aggregation offers to develop, as well as cost reduction before smart appliances become mandatory. Likely to have much lower distributional impacts than Option C.
56
Indicated by Call for Evidence responses, and various literature reviews e.g. BEIS (2017) Realising the potential of demand-side response to 2025 57
Seen in EV uptake, and studies considered in BEIS (2017) Realising the potential of demand-side response to 2025 58
In this scenario, there is a risk that this economy of scale may not arise depending on the outcome of the UK-EU future economic partnership negotiations. In the meantime we continue to monitor EU progress on
Ecodesign and engage with relevant officials to remain abreast of EU standards. In addition, industry may well delay development of a domestic standard until the EU standard is developed.. 59
Stragier (2013) Towards More Energy Efficient Domestic Appliances? Measuring the Perception of Households on Smart Appliances

24
additional upfront cost and/or because they cannot realise the benefits if, for example, they do not have smart tariffs.
realise the benefits if they do not have smart tariffs. However, the mandatory nature of the standard may increase competition and deployment, driving down the price of smart appliances allowing for greater accessibility by all.
smart tariffs and so would not benefit from lower bills and so it is likely to have the biggest distributional impacts. Over time as more appliances are smart, there may be less benefit to individuals from shifting, and so this disparity may lessen.
Risks (Political/ commercial/ delivery)
● Government may not be performing its role in protecting consumers and grid-stability, if no action is taken.
● Risk that smart appliances do not develop/are not taken up by consumers.
● Industry could choose not to abide by the standard or develop a competing one, which may not adequately protect consumers.
60
● Government may not be performing its role in protecting consumers and grid-stability, if no action is taken, although there is less red tape than Options B and C. Option A was preferred by stakeholders in the Call for Evidence responses, moving on to Option B.
● Some potential for undercutting by smart appliances which do not comply with the standard.
61
● Risk that smart appliances do not develop/are not taken up by consumers.
● Industry push-back less likely: responses to the Call for Evidence supported this option in general.
62
● Less commercial risk than Option C: manufacturers free to choose smart or non-smart.
● Risk that smart appliances do not develop/are not taken up by consumers.
● Risk of industry and consumer push-back: Call for Evidence responses were not supportive of this option.
● Heavy Government involvement in a new market area which does not align with the Cabinet’s ‘Cutting Red Tape’ programme’s work.
● Removes consumer choice (main objection to this option in Call for Evidence responses). Consumer apathy/ mistrust: forced to purchase smart, but may not use smart functionality.
● Industry push-back much less likely than under Option C given long lead time and clear policy direction.
● Consumer choice removed but after significant adjustment time – given the direction is set for industry, it is likely that the market would move towards smart appliances before they are mandated.
Strength of evidence for option’s effectivene-ss
Low
New market is developing, with no standards, so impact and likelihood of a market-led standard and risks without one are uncertain at this time.
High
There is considerable evidence of the extent to which voluntary labelling schemes increases uptake e.g. Energy Star, Ecolabel, John Lewis Label, Forest Stewardship Council Certification, Fair Trade and Blue
High
Energy Performance Certificate (A-G rating of products for energy efficiency) has increased awareness of, and uptake of, more energy efficient products.
63
Evidence from the voluntary Energy Star label showed that
Medium/Low
Ecodesign minimum standards have improved energy efficiency of products. Responses to the Call for Evidence suggested more evidence was needed as to the effectiveness and risks of this option.
Medium
This is a combination of the other options and so is based on evidence of voluntary standards, mandatory standards and mandating smart functionality as set out under those options. It allows Government flexibility to
60
As consumers may equate smart policies, so meters and energy, into one; so the consequences of any policy may have widespread reputational effects. 61
Seen in studies of voluntary labels e.g. John Lewis, Energy Star. 62
This is supported by responses to the BEIS Smart Systems Call for Evidence. 63
Ecofys, 2014, Evaluation of EU Energy Labelling and Ecodesign Directives: http://www.ecofys.com/en/publication/evaluation-of-the-eu-energy-labelling-and-ecodesign-directives/

25
Angel.
up to five times more frequently purchased goods (e.g. printers) contained the label than less frequently purchased white goods suggesting a mandatory label may be more appropriate in this context. Responses to the Call for Evidence supported this approach, but indicated further trials are needed to establish the detail of this policy.
adapt their strategy in light of new information and as the market develops before smart functionality would be mandated.
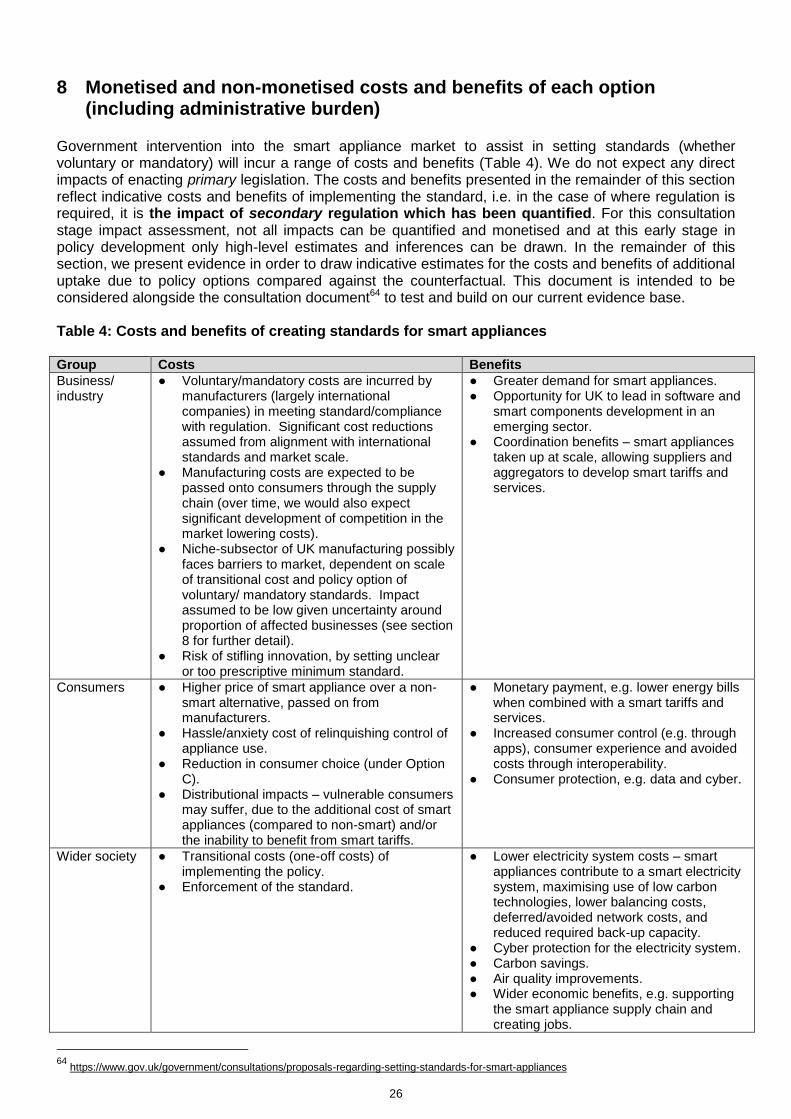
26
8 Monetised and non-monetised costs and benefits of each option (including administrative burden)
Government intervention into the smart appliance market to assist in setting standards (whether voluntary or mandatory) will incur a range of costs and benefits (Table 4). We do not expect any direct impacts of enacting primary legislation. The costs and benefits presented in the remainder of this section reflect indicative costs and benefits of implementing the standard, i.e. in the case of where regulation is required, it is the impact of secondary regulation which has been quantified. For this consultation stage impact assessment, not all impacts can be quantified and monetised and at this early stage in policy development only high-level estimates and inferences can be drawn. In the remainder of this section, we present evidence in order to draw indicative estimates for the costs and benefits of additional uptake due to policy options compared against the counterfactual. This document is intended to be considered alongside the consultation document64 to test and build on our current evidence base. Table 4: Costs and benefits of creating standards for smart appliances Group Costs Benefits
Business/ industry
● Voluntary/mandatory costs are incurred by manufacturers (largely international companies) in meeting standard/compliance with regulation. Significant cost reductions assumed from alignment with international standards and market scale.
● Manufacturing costs are expected to be passed onto consumers through the supply chain (over time, we would also expect significant development of competition in the market lowering costs).
● Niche-subsector of UK manufacturing possibly faces barriers to market, dependent on scale of transitional cost and policy option of voluntary/ mandatory standards. Impact assumed to be low given uncertainty around proportion of affected businesses (see section 8 for further detail).
● Risk of stifling innovation, by setting unclear or too prescriptive minimum standard.
● Greater demand for smart appliances. ● Opportunity for UK to lead in software and
smart components development in an emerging sector.
● Coordination benefits – smart appliances taken up at scale, allowing suppliers and aggregators to develop smart tariffs and services.
Consumers ● Higher price of smart appliance over a non-smart alternative, passed on from manufacturers.
● Hassle/anxiety cost of relinquishing control of appliance use.
● Reduction in consumer choice (under Option C).
● Distributional impacts – vulnerable consumers may suffer, due to the additional cost of smart appliances (compared to non-smart) and/or the inability to benefit from smart tariffs.
● Monetary payment, e.g. lower energy bills when combined with a smart tariffs and services.
● Increased consumer control (e.g. through apps), consumer experience and avoided costs through interoperability.
● Consumer protection, e.g. data and cyber.
Wider society ● Transitional costs (one-off costs) of implementing the policy.
● Enforcement of the standard.
● Lower electricity system costs – smart appliances contribute to a smart electricity system, maximising use of low carbon technologies, lower balancing costs, deferred/avoided network costs, and reduced required back-up capacity.
● Cyber protection for the electricity system. ● Carbon savings. ● Air quality improvements. ● Wider economic benefits, e.g. supporting
the smart appliance supply chain and creating jobs.
64
https://www.gov.uk/government/consultations/proposals-regarding-setting-standards-for-smart-appliances
27
8.1 Monetised costs and benefits per appliance
Voluntary or mandatory standards for smart appliances will result in an initial direct cost incurred by business from manufacturing smart appliances. These are the key monetised costs reflected in this appraisal, whereby, over time, we would expect significant scale and development of competition in the market to lower costs, in particular where aligned with international standards.
The key monetised benefits of smart appliances are to the electricity system, from lower peak demand lowering costs of generation capacity, network and balancing costs and enabling greater use of low carbon technologies.
Both costs and benefits are expected to be to be passed through to consumers, who may face higher costs for smart appliances (as the manufacturing costs are passed through the supply chain), and who also benefit from the use of smart functionality and lower electricity bills over the lifetime of the appliance.
For the purposes of this quantified cost and benefit analysis, based on available evidence, we focus on capturing monetisable costs of manufacturing smart appliances and the electricity system benefits. Impacts to consumers are considered a transfer and explored in later sections. As such this quantified appraisal is partial, based on the limited evidence available to date, and non-quantifiable/non-monetised impacts are considered qualitatively in later sections.
For illustration of the costs and benefits, we draw on the example of a dishwasher bought in 2021. The additional manufacturing cost to the appliance of being smart is £4.10 (details in next section), and the electricity system benefits per appliance are estimated over the lifetime of the appliance, i.e. at £4.60 in 2020 and £3.20 in 2030 (as per Ecodesign business-as-usual scenario, details in the next section).65 We have interpolated between these years to estimate appliance benefits for each year for a lifetime of 13 years (2021 – 2033). The present value benefits, discounted to 2017 using the 3.5% government discount rate in 2016 prices, are estimated at £33.90 and the total present value cost discounted is £3.60. The illustrative net present value benefits to society in this example are £30.40. This does not reflect all impacts, only the cost to the manufacturer, passed onto the consumer, and benefits to the electricity system, passed on to the consumer through reduced energy prices and bills.
In the remainder of this section we set out the detail behind these cost and benefits estimates and explain assumptions behind uptake under the different policy options.
8.2 Policy option uptake assumptions and sensitivity analysis
In this impact assessment, we take projected smart appliance uptake in the UK and multiply by the estimated costs and benefits per appliance (detailed later in the section). We assess a number of potential uptake scenarios to reflect the range of policy options. This allows an initial estimation of the order of magnitude of costs to manufacturers and electricity system benefits from smart appliances. To estimate the stock of smart appliances in the counterfactual, we take proportions of the share of appliance stocks projected to be smart under the “business-as-usual” (BAU) scenario in the Ecodesign study (Table 5) and apply it to the total UK appliance stock estimated using the BEIS Products Policy model.66 We currently only have data for wet and cold appliances in the Products Policy model, and so at this stage, we have not modelled the impacts on HVAC and batteries and we will endeavour to do this in future. As the counterfactual uptake of smart appliances is based on an EU-wide industry assessment, this does not specifically take into full account of the impact of the timeline of wider UK policies set out in Section 2.1.3 (for example, on smart meters, half-hourly settlement and innovation). These are considered preconditions to encourage and unlock the benefits of smart appliances, but reflecting the market barriers and failures outlined in section 3, these wider policy developments alone are not expected to significantly determine the level of smart appliance uptake in the counterfactual. It is important to note that the counterfactual forecast is subject to uncertainty due to limited of evidence in
65
Ecodesign for European Commission (2017) Preparatory study on smart appliances 66
The BEIS products policy model has two main applications a) to provide cost benefit analyses to inform impact assessments of Ecodesign
product legislation; and b) to provide estimates of energy savings that can be fed into BEIS Energy and Emissions Projections, to assess UK performance against its carbon targets. The modelling approach calculates stock or sales depending on the quality of the data. Where there is good confidence in stock data, then sales figures can be automatically generated by the models or alternatively the stock of individual products can be calculated based on sales data and replacement (lifespan) of products.
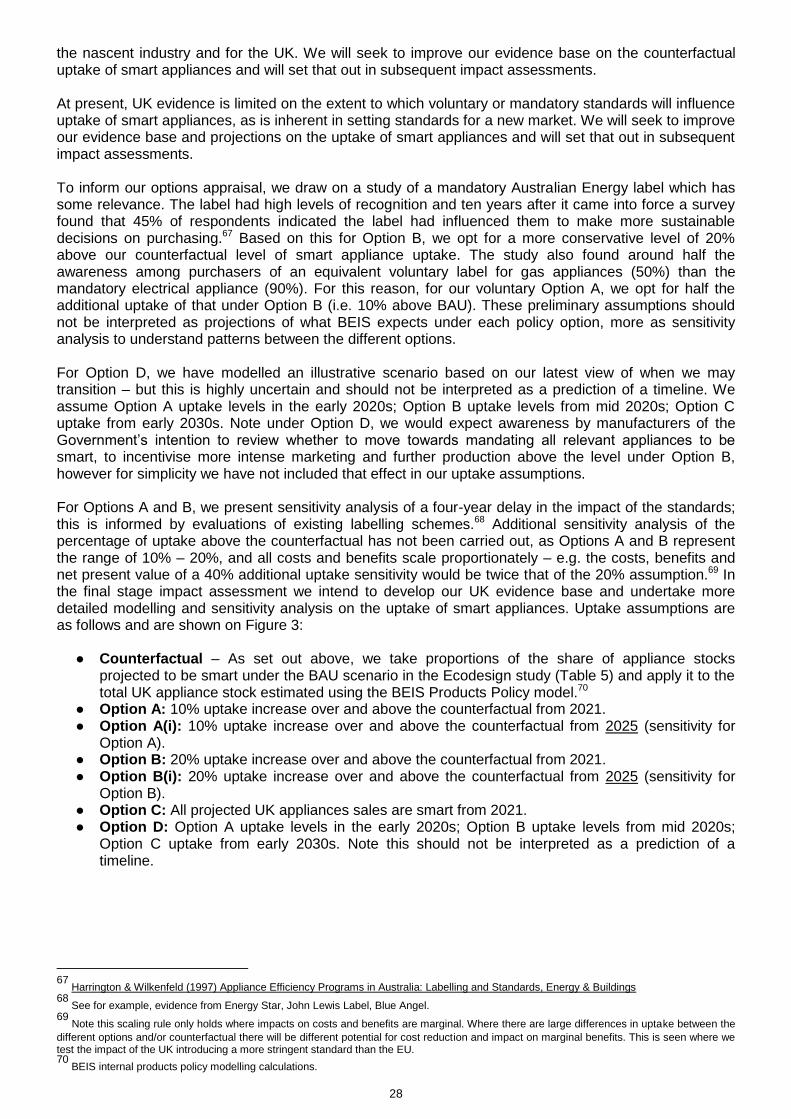
28
the nascent industry and for the UK. We will seek to improve our evidence base on the counterfactual uptake of smart appliances and will set that out in subsequent impact assessments. At present, UK evidence is limited on the extent to which voluntary or mandatory standards will influence uptake of smart appliances, as is inherent in setting standards for a new market. We will seek to improve our evidence base and projections on the uptake of smart appliances and will set that out in subsequent impact assessments. To inform our options appraisal, we draw on a study of a mandatory Australian Energy label which has some relevance. The label had high levels of recognition and ten years after it came into force a survey found that 45% of respondents indicated the label had influenced them to make more sustainable decisions on purchasing.67 Based on this for Option B, we opt for a more conservative level of 20% above our counterfactual level of smart appliance uptake. The study also found around half the awareness among purchasers of an equivalent voluntary label for gas appliances (50%) than the mandatory electrical appliance (90%). For this reason, for our voluntary Option A, we opt for half the additional uptake of that under Option B (i.e. 10% above BAU). These preliminary assumptions should not be interpreted as projections of what BEIS expects under each policy option, more as sensitivity analysis to understand patterns between the different options. For Option D, we have modelled an illustrative scenario based on our latest view of when we may transition – but this is highly uncertain and should not be interpreted as a prediction of a timeline. We assume Option A uptake levels in the early 2020s; Option B uptake levels from mid 2020s; Option C uptake from early 2030s. Note under Option D, we would expect awareness by manufacturers of the Government’s intention to review whether to move towards mandating all relevant appliances to be smart, to incentivise more intense marketing and further production above the level under Option B, however for simplicity we have not included that effect in our uptake assumptions. For Options A and B, we present sensitivity analysis of a four-year delay in the impact of the standards; this is informed by evaluations of existing labelling schemes.68 Additional sensitivity analysis of the percentage of uptake above the counterfactual has not been carried out, as Options A and B represent the range of 10% – 20%, and all costs and benefits scale proportionately – e.g. the costs, benefits and net present value of a 40% additional uptake sensitivity would be twice that of the 20% assumption.69 In the final stage impact assessment we intend to develop our UK evidence base and undertake more detailed modelling and sensitivity analysis on the uptake of smart appliances. Uptake assumptions are as follows and are shown on Figure 3:
● Counterfactual – As set out above, we take proportions of the share of appliance stocks projected to be smart under the BAU scenario in the Ecodesign study (Table 5) and apply it to the total UK appliance stock estimated using the BEIS Products Policy model.70
● Option A: 10% uptake increase over and above the counterfactual from 2021. ● Option A(i): 10% uptake increase over and above the counterfactual from 2025 (sensitivity for
Option A). ● Option B: 20% uptake increase over and above the counterfactual from 2021. ● Option B(i): 20% uptake increase over and above the counterfactual from 2025 (sensitivity for
Option B). ● Option C: All projected UK appliances sales are smart from 2021. ● Option D: Option A uptake levels in the early 2020s; Option B uptake levels from mid 2020s;
Option C uptake from early 2030s. Note this should not be interpreted as a prediction of a timeline.
67
Harrington & Wilkenfeld (1997) Appliance Efficiency Programs in Australia: Labelling and Standards, Energy & Buildings 68
See for example, evidence from Energy Star, John Lewis Label, Blue Angel. 69
Note this scaling rule only holds where impacts on costs and benefits are marginal. Where there are large differences in uptake between the
different options and/or counterfactual there will be different potential for cost reduction and impact on marginal benefits. This is seen where we test the impact of the UK introducing a more stringent standard than the EU. 70
BEIS internal products policy modelling calculations.
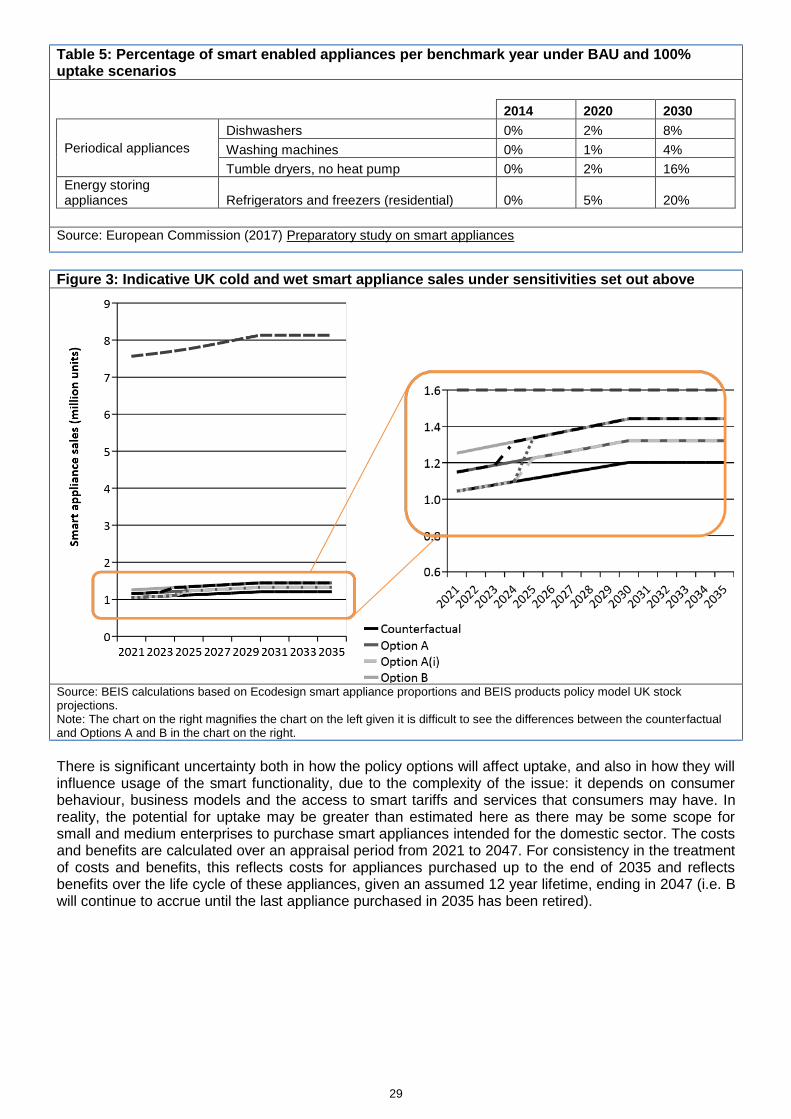
29
Table 5: Percentage of smart enabled appliances per benchmark year under BAU and 100% uptake scenarios
2014 2020 2030
Periodical appliances
Dishwashers 0% 2% 8%
Washing machines 0% 1% 4%
Tumble dryers, no heat pump 0% 2% 16%
Energy storing appliances Refrigerators and freezers (residential) 0% 5% 20%
Source: European Commission (2017) Preparatory study on smart appliances
Figure 3: Indicative UK cold and wet smart appliance sales under sensitivities set out above
Source: BEIS calculations based on Ecodesign smart appliance proportions and BEIS products policy model UK stock projections. Note: The chart on the right magnifies the chart on the left given it is difficult to see the differences between the counterfactual and Options A and B in the chart on the right.
There is significant uncertainty both in how the policy options will affect uptake, and also in how they will influence usage of the smart functionality, due to the complexity of the issue: it depends on consumer behaviour, business models and the access to smart tariffs and services that consumers may have. In reality, the potential for uptake may be greater than estimated here as there may be some scope for small and medium enterprises to purchase smart appliances intended for the domestic sector. The costs and benefits are calculated over an appraisal period from 2021 to 2047. For consistency in the treatment of costs and benefits, this reflects costs for appliances purchased up to the end of 2035 and reflects benefits over the life cycle of these appliances, given an assumed 12 year lifetime, ending in 2047 (i.e. B will continue to accrue until the last appliance purchased in 2035 has been retired).
30
8.3 Indicative costs
8.3.1 Unit costs for manufacturers
We are at the early stages of policy development and given the wide ranging and innovative nature of the costs of this policy, we are unable to fully quantify costs at this stage. The costs captured in this impact assessment are the additional costs of making a smart appliance over a non-smart alternative, multiplied by the increase in sales above the counterfactual as a result of policy intervention (as outlined above). We expect and assume that the additional cost incurred to manufacturers will be passed on to consumers, reflected in the final sale price of smart appliances. Today, most new appliances already feature electronic controllers which in principle would be capable of managing a smart operation of the appliance. However, each smart appliance has to be equipped with a communication module, which will typically be either a powerline communication or a wireless module (such as WLAN or ZigBee). At this stage it has not been possible to differentiate how these costs may vary been manufacturer types. Although thought to be relatively low, this may differ between a manufacturer that produces a range of electronic products or more ‘traditional’ appliance-specific manufacturers. Evidence for this will further be explored in future impact assessments. The cost of the communication module or “circuitry” will be driven by the market size, i.e. level of uptake of a particular circuitry, as well as the method of creating the smart technology underlying the product development. There are significant opportunities for cost reduction under policy options that increase deployment of smart appliances which adhere to a particular set of standards. The larger the potential market, the greater the scope for cost reduction. Therefore standards that align with a larger market, such as the EU, could allow the UK to benefit from greater cost-reduction opportunities. Evidence on cost and scope for cost-reduction for smart appliance circuitries is detailed in Annex I. Based on this evidence, to create cost-reduction scenarios in this impact assessment, we use a ‘learning rate’ of 15%, meaning that cost falls by 15% for every doubling of market size, reaching £3.20 after 10 million units sold. We also assume a particular circuitry would have a market size of 30% of the market adhering to a particular standard.71 Home batteries are smart by default and so the additional cost of smartening a battery is considered zero.72 In a scenario where the UK develops a different technical standard to those developed internationally and may not benefit from the potential scale of international cost-reduction, in theory, we would expect greatest cost-reduction opportunities under Option C where sales of smart appliances could be around 6 – 11 times higher than the counterfactual under assumptions set out in the previous section. However, the Ecodesign study notes views that the international market is technically not yet fully ready which could result in a higher cost increase if all products over a short period of time would need to be converted to smart appliances. Options A and B are likely to deliver modest cost-reduction over and above the counterfactual given the scenarios are expected to lead to much lower additional uptake than Option C (see uptake scenarios, Figure 3 earlier in the section). As previously noted, it is thought that the UK no longer has any large multi-national domestic appliance manufacturing businesses (remaining companies are niche manufacturers), so these costs are largely incurred by foreign business and it is our assessment that manufacturers will seek to fully pass this on through the supply chain to higher consumer costs. At this point it is not possible to estimate whether the additional costs would make any of these manufacturers exit the UK market (should the UK set its own standards), but we aim to improve the evidence for this area following the consultation. We also recognise that there is uncertainty around how costs would be passed through to consumers and also to what extent prices are likely to come down with time, particularly if we see high volumes and good competition between suppliers. In each of the options this impact is expected to be small since the price increase is small and smart appliances, when used, would be net-beneficial for the consumer over the lifetime of the product. Work in this policy area in the UK is expected to help the UK influence and take part in processes to develop such standards at international level, including in the EU. This will in turn help to ensure international alignment in this sphere as far as possible. We will take into account developments
71
Assumption derived through workshops with overseas manufacturers and experience in related sectors e.g. telecoms. 72
Ecodesign for European Commission (2017) Preparatory study on smart appliances
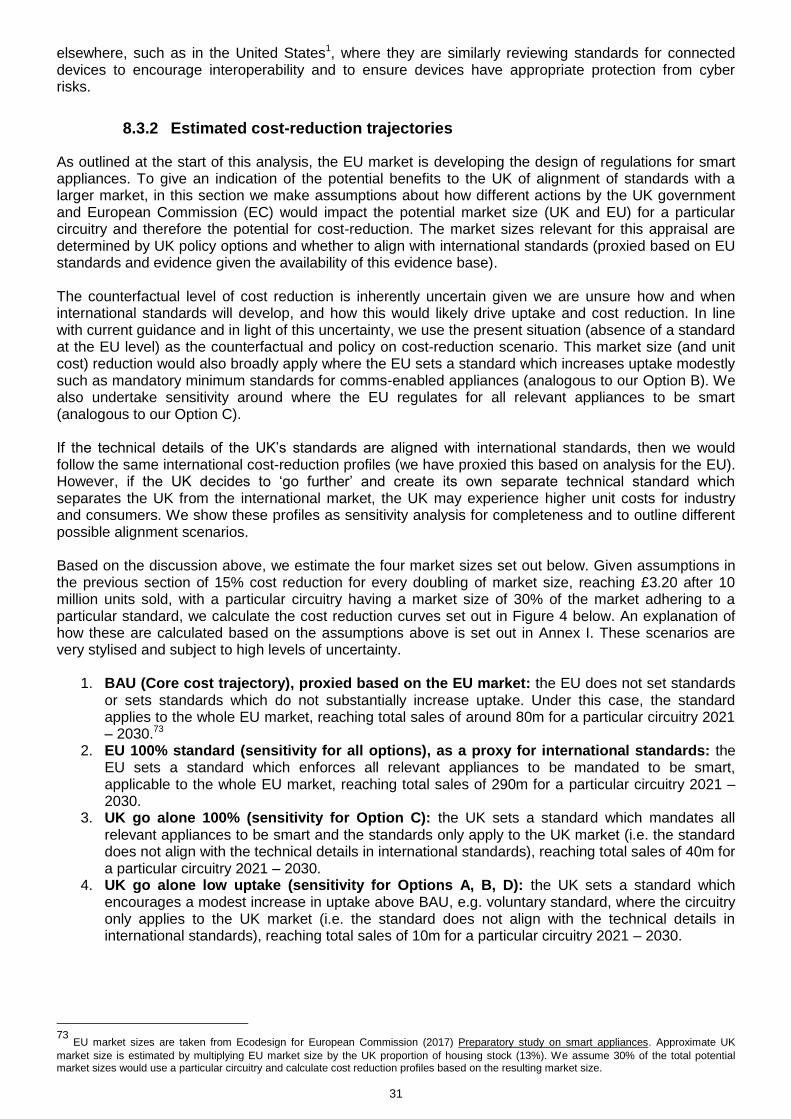
31
elsewhere, such as in the United States1, where they are similarly reviewing standards for connected devices to encourage interoperability and to ensure devices have appropriate protection from cyber risks.
8.3.2 Estimated cost-reduction trajectories
As outlined at the start of this analysis, the EU market is developing the design of regulations for smart appliances. To give an indication of the potential benefits to the UK of alignment of standards with a larger market, in this section we make assumptions about how different actions by the UK government and European Commission (EC) would impact the potential market size (UK and EU) for a particular circuitry and therefore the potential for cost-reduction. The market sizes relevant for this appraisal are determined by UK policy options and whether to align with international standards (proxied based on EU standards and evidence given the availability of this evidence base). The counterfactual level of cost reduction is inherently uncertain given we are unsure how and when international standards will develop, and how this would likely drive uptake and cost reduction. In line with current guidance and in light of this uncertainty, we use the present situation (absence of a standard at the EU level) as the counterfactual and policy on cost-reduction scenario. This market size (and unit cost) reduction would also broadly apply where the EU sets a standard which increases uptake modestly such as mandatory minimum standards for comms-enabled appliances (analogous to our Option B). We also undertake sensitivity around where the EU regulates for all relevant appliances to be smart (analogous to our Option C). If the technical details of the UK’s standards are aligned with international standards, then we would follow the same international cost-reduction profiles (we have proxied this based on analysis for the EU). However, if the UK decides to ‘go further’ and create its own separate technical standard which separates the UK from the international market, the UK may experience higher unit costs for industry and consumers. We show these profiles as sensitivity analysis for completeness and to outline different possible alignment scenarios. Based on the discussion above, we estimate the four market sizes set out below. Given assumptions in the previous section of 15% cost reduction for every doubling of market size, reaching £3.20 after 10 million units sold, with a particular circuitry having a market size of 30% of the market adhering to a particular standard, we calculate the cost reduction curves set out in Figure 4 below. An explanation of how these are calculated based on the assumptions above is set out in Annex I. These scenarios are very stylised and subject to high levels of uncertainty.
1. BAU (Core cost trajectory), proxied based on the EU market: the EU does not set standards or sets standards which do not substantially increase uptake. Under this case, the standard applies to the whole EU market, reaching total sales of around 80m for a particular circuitry 2021 – 2030.73
2. EU 100% standard (sensitivity for all options), as a proxy for international standards: the EU sets a standard which enforces all relevant appliances to be mandated to be smart, applicable to the whole EU market, reaching total sales of 290m for a particular circuitry 2021 – 2030.
3. UK go alone 100% (sensitivity for Option C): the UK sets a standard which mandates all relevant appliances to be smart and the standards only apply to the UK market (i.e. the standard does not align with the technical details in international standards), reaching total sales of 40m for a particular circuitry 2021 – 2030.
4. UK go alone low uptake (sensitivity for Options A, B, D): the UK sets a standard which encourages a modest increase in uptake above BAU, e.g. voluntary standard, where the circuitry only applies to the UK market (i.e. the standard does not align with the technical details in international standards), reaching total sales of 10m for a particular circuitry 2021 – 2030.
73
EU market sizes are taken from Ecodesign for European Commission (2017) Preparatory study on smart appliances. Approximate UK
market size is estimated by multiplying EU market size by the UK proportion of housing stock (13%). We assume 30% of the total potential market sizes would use a particular circuitry and calculate cost reduction profiles based on the resulting market size.
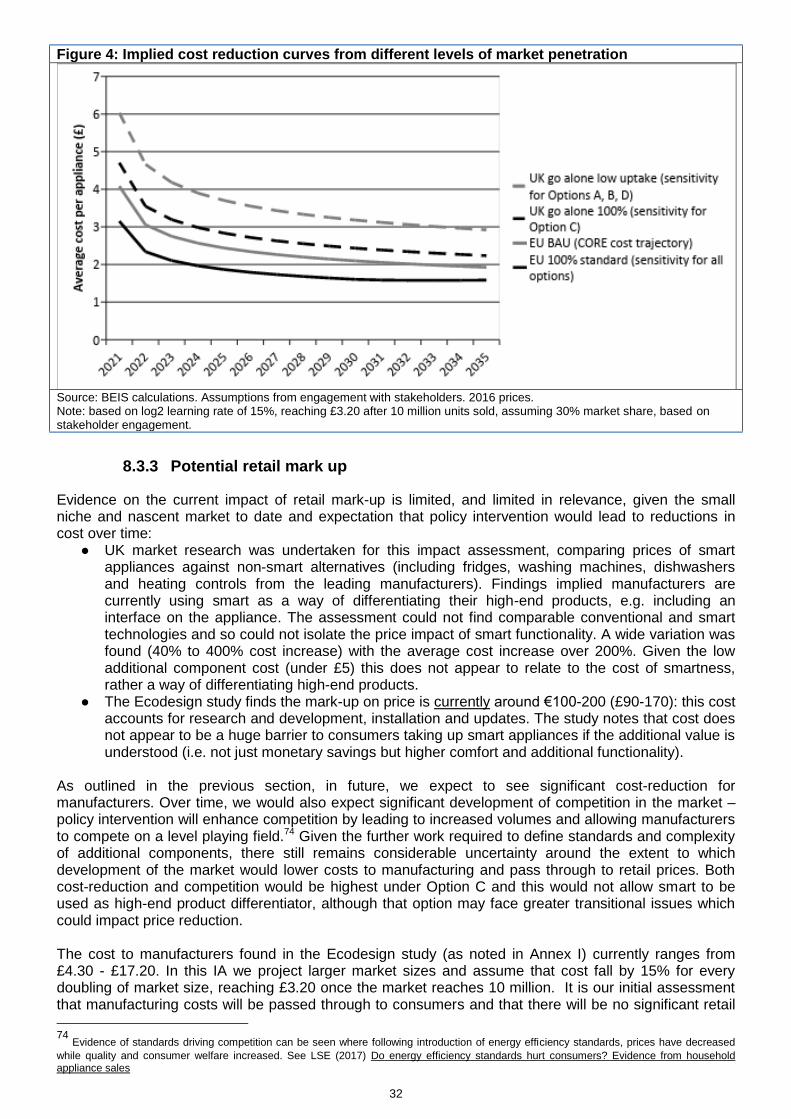
32
Figure 4: Implied cost reduction curves from different levels of market penetration
Source: BEIS calculations. Assumptions from engagement with stakeholders. 2016 prices. Note: based on log2 learning rate of 15%, reaching £3.20 after 10 million units sold, assuming 30% market share, based on stakeholder engagement.
8.3.3 Potential retail mark up
Evidence on the current impact of retail mark-up is limited, and limited in relevance, given the small niche and nascent market to date and expectation that policy intervention would lead to reductions in cost over time:
● UK market research was undertaken for this impact assessment, comparing prices of smart appliances against non-smart alternatives (including fridges, washing machines, dishwashers and heating controls from the leading manufacturers). Findings implied manufacturers are currently using smart as a way of differentiating their high-end products, e.g. including an interface on the appliance. The assessment could not find comparable conventional and smart technologies and so could not isolate the price impact of smart functionality. A wide variation was found (40% to 400% cost increase) with the average cost increase over 200%. Given the low additional component cost (under £5) this does not appear to relate to the cost of smartness, rather a way of differentiating high-end products.
● The Ecodesign study finds the mark-up on price is currently around €100-200 (£90-170): this cost accounts for research and development, installation and updates. The study notes that cost does not appear to be a huge barrier to consumers taking up smart appliances if the additional value is understood (i.e. not just monetary savings but higher comfort and additional functionality).
As outlined in the previous section, in future, we expect to see significant cost-reduction for manufacturers. Over time, we would also expect significant development of competition in the market – policy intervention will enhance competition by leading to increased volumes and allowing manufacturers to compete on a level playing field.74 Given the further work required to define standards and complexity of additional components, there still remains considerable uncertainty around the extent to which development of the market would lower costs to manufacturing and pass through to retail prices. Both cost-reduction and competition would be highest under Option C and this would not allow smart to be used as high-end product differentiator, although that option may face greater transitional issues which could impact price reduction. The cost to manufacturers found in the Ecodesign study (as noted in Annex I) currently ranges from £4.30 - £17.20. In this IA we project larger market sizes and assume that cost fall by 15% for every doubling of market size, reaching £3.20 once the market reaches 10 million. It is our initial assessment that manufacturing costs will be passed through to consumers and that there will be no significant retail
74
Evidence of standards driving competition can be seen where following introduction of energy efficiency standards, prices have decreased
while quality and consumer welfare increased. See LSE (2017) Do energy efficiency standards hurt consumers? Evidence from household appliance sales

33
mark-up as smart appliances would not be a niche market under mandatory standards. We also do not expect to see a reduction in appliance sales due to the level of appliance price increase. We will draw on any further information from the consultation and seek to develop our evidence base to inform subsequent impact assessments.
Indicative present value costs for policy options Table 6 sets out the indicative present value costs for policy options under different cost-reduction scenarios. Estimated costs are partial and only cover the additional costs to (detailed below) the manufacturer (as outlined in the section above and detailed below). We expect cost to the Government to be negligible as set out in the next section. Policy options cover ‘relevant’ domestic appliances, i.e. wet appliances, cold appliances, HVAC and battery storage. However, in this impact assessment we only assess costs and benefits for wet and cold appliances. We intend to gather more evidence and assess all appliances in the final stage impact assessment. The total cost estimates are based on combining smart appliance uptake scenarios (as outlined in section 8.2) together with unit cost assumptions (based on scenarios outlined in section 8.3.1). A scenario approach is used to explore sensitivity behind our central estimate, reflecting limitations in the evidence base and inherent uncertainty in the assumptions. Table 6: Indicative Present value additional cost of smart appliances under policy options (£m)
Option A
From 2021 10% uptake over counterfactual from 2021
Option B
From 2021 20% uptake over counterfactual from 2021
Option C
From 2021 all new sales are smart
Option D
From 2021 10% above counterfactual; mid-2020s 20% above counterfactual; early-2030s all new sales.
Core Cost-reduction profile: all options: CORE (EU BAU)
3 6 172 35
Delay impact of policy on uptake by 4 years Cost-reduction profile: all options: CORE (EU BAU)
2 4 N/A 33
UK go alone Cost-reduction profiles:
Counterfactual: CORE (EU BAU)
Options A, B, D: UK alone low uptake
Option C: UK alone 100%
19 24 204 68
EU choose mandatory standard for all appliances to be smart Cost-reduction profile: all options: EU 100% standard
2 4 133 28
Note: 2016 prices; discounted to base year 2017 at 3.5% government discount rate; appraisal period for appliances purchased 2021 – 2035.
The greatest scale of costs accrue under Option C where a greater number of appliances are in scope and there is significantly greater uptake over the appraisal period than the other policy options (approximately 6 – 11 times greater than the counterfactual and Options A and B). These costs will fall initially to manufacturers but are likely to be passed onto consumers through higher product prices. There is also a higher total cost under Option D than A and B for the same reason, but these costs are significantly lower that option C due to the gradual transition and lower scale and scope over the appraisal period .

34
Sensitivity analysis where the impact of policy on uptake is delayed by four years, leads to a small reduction in cost across the policy options compared to the Core scenario, because fewer smart appliances are purchased. The most likely scenario at this stage is for the EU to opt for voluntary standards; if the UK were to align its technical standards, it could benefit from significant cost savings (as evidenced in the Core scenario compared to the UK alone sensitivity). If the EU chose a standard where all appliances were mandated to be smart, it would give greater scope for cost reduction in both our counterfactual and ‘policy on’ scenarios – this means that the cost of the policy options is lower but not greatly.
8.4 Indicative benefits
Our relationship with this area of regulation will be part of wider considerations on our future relationship with the EU, which is subject to negotiations. As noted previously for cost, we are at early stages of policy development and given the complex, wide-ranging and innovative nature of the benefits of this policy, we are unable to fully quantify the benefits at this stage. The Ecodesign study has undertaken detailed quantitative analysis on the benefits of smart appliances to the electricity system in the European Union and so for this consultation stage impact assessment, we draw heavily on that assessment as a data source. This is used to give an indication of the potential benefits to the UK of alignment of standards with a larger market. We will test assumptions with stakeholders in this consultation and as policy development progresses we will develop the evidence base.
8.4.1 Ecodesign analysis
The Ecodesign study investigates how future flexibility provided by smart appliances can unlock potential domestic DSR and support the electricity system. The study estimates the value of the economic and environmental benefits potentially provided by the flexibility of smart appliances to the electricity system. The focus is on the impacts for where DSR is used in the day-ahead market;75 however, the study notes that additional use cases exist where the flexibility of smart appliances would have significant value (such as using DSR to manage imbalances or use by Distribution System Operators to solve local grid congestion constraints). The study calculates two indicators which are relevant to this impact assessment: economic savings and emission savings:
1) Economic value in terms of total electricity system costs. This indicator quantifies the avoided costs related to the more efficient use of the electricity system following the introduction of the flexibility from smart appliances. Ecodesign’s model captures benefits in terms of avoided or deferred transmission network reinforcements; avoided generation build; avoided curtailment of low carbon generation; and better operation of the electricity system, but does not model savings to the distribution network from smart. This economic benefit is also estimated on an annual, per-appliance basis for the EU average but is not necessarily in line with what we would expect in the UK for reasons outlined below.
2) Total amount of CO2 emissions avoided to 2030. This indicator quantifies part of the environmental benefits of decreased utilisation of the less efficient and more CO2-emitting peaking power plants in the electricity system.
The Ecodesign study assesses two scenarios against the base case: 1) business as usual (BAU) where they use industry views of expected uptake with no policy intervention and 2) 100% uptake: a theoretical scenario where all relevant appliances are smart. The base is a theoretical case where no flexibility from smart appliances is allowed. Total electricity system benefits increase over time as more smart appliances are used and flexibility becomes more valuable to the system. Over time, increasingly volatile wholesale prices are predicted due to both increased penetration of renewables and higher fossil fuel prices/CO2 price. Electricity system benefits and emissions savings from the study for the EU-28 are presented in Annex II. The Ecodesign study also calculates the marginal benefits per individual appliance by comparing marginal electricity prices in scenarios with smart appliance flexibility against no smart appliance
75
The day-ahead market is the main arena for trading power. Here, contracts are made between seller and buyer for the delivery of power the
following day, the price is set and the trade is agreed.
35
flexibility. The overall electricity system savings are then apportioned to individual appliances based on the share of smart appliances and their flexibility profiles. There is a finite potential value to the electricity system so as the system becomes ‘saturated’ with smart appliances, marginal benefits decrease. However, with greater scale across the options/level of uptake, overall benefits still increase, just at a decreasing rate. It is for this reason that benefits per appliance in the Ecodesign study generally decrease between 2020 and 2030, and benefits are lower in the 100% uptake case (Table 7). These results are very dependent on assumptions and the approach to modelling the electricity system – more detailed modelling for the UK could lead to quite different results.76
Table 7: Estimated monetary benefits from providing flexibility per smart appliance per year (EU28 average)
2020 2030
Group DSF capable appliance BAU 100% BAU 100%
Periodical appliances
Dishwashers 3.5 2.1 12.0 5.5
Washing machines 2.1 1.2 6.5 3.1
Tumble dryers, no heat pump 4.1 2.3 13.8 6.0
Energy storing appliances Refrigerators and freezers (residential) 0.4 0.3 1.4 0.7
Source: European Commission (2017) Preparatory study on smart appliances Note: converted into GBP based on assumed exchange rate of 0.86 GBP/EUR
To estimate total benefits for each option:
● For the counterfactual and Options A and B (and Option D during 2020s) we take marginal benefits per appliance under Ecodesign’s BAU scenario and multiply by the projected stock of smart appliances from 2021 as outlined above (relevant for each appliance and each policy option).
● For Option C (and Option D after early 2030s), we use Ecodesign’s BAU marginal benefits per appliance in the first year smart appliances are mandated and interpolate to reach Ecodesign’s 100% uptake scenario when the stock would reach full saturation of smart appliances (i.e. when all the stock has turned over). We then multiply by all new relevant appliance sales after smart appliances are mandated.
8.4.2 Technical potential versus feasible potential
The numbers presented in the Ecodesign report represent maximum technical potential and do not account for the impact of consumer behaviour, e.g. they do not reflect the proportion of consumers who will actually use the smart functionality, and whether those consumers would enable an aggregator to control their load or manually respond to price signals. There have been several surveys on people’s willingness to use smart functionality on washing machines, finding generally positive attitudes and significant shifting potential.77 A Dutch study that assessed usage of smart functionality looked at a group of 50 households who opted to receive a free smart washing machine.78 Half used the smart functionality regularly, averaging 36% of washes being ‘smart’, and half did not regularly use smart functionality, averaging 1% usage. Under Option C, where all relevant appliances are mandated to be smart, we would expect a lower usage rate because not all consumers have chosen to buy the smart functionality. Some parallel can be drawn with studies that assess peak demand reduction under opt-in and opt-out smart tariffs, where opt-in could align with Option B and opt-out with Option C. US studies found that while, as expected, enrolment rates for opt-out variable tariffs were much higher than for opt-in (92% vs. 15%), peak demand reductions were lower per household under default opt-out approaches (6% vs. 12% for time of use tariffs and 13% vs. 23% for critical peak pricing). Given that peak reduction is approximately half in the
76
Comparison of Ecodesign study’s levels of electrification of heat and transport c.f. our GCS modelling. 77
See Timpe (2009) Smart Domestic Appliances Supporting the System Integration of Renewable Energy; and Broman et al. (2014)
Responsible technology acceptance. Model development and application to consumer acceptance of smart grid technology. 78
Kobus, C. et al. (2015) A real-life assessment on the effect of smart appliances for shifting households’ electricity demand

36
opt-out than opt-in for both tariffs, we test a sensitivity where benefits are half of the technical potential, proxying a 50% usage rate. A recent rapid evidence assessment by BEIS on realising the potential of DSR found that, although take-up of smart tariffs was much higher in an ‘opt out’ than an ‘opt in’ trial, actual aggregate response is similar in both, although evidence is mixed.79 In light of this evidence, we test an additional sensitivity where Option C’s benefits are in-line with consumers’ voluntary uptake of smart appliances (i.e. Option B). Therefore we test the following three sensitivities for benefits under Option C:
● Technical potential – assumes smart functionality is used in all smart appliances. This represents maximum technical potential and is very unlikely to be realised in practice.
● Core: 50% usage – assumes smart functionality is used by a half of households. This sensitivity is based on a crude assumption, and reflects the high levels of uncertainty in consumer engagement. We use benefits based on the midpoint of Ecodesign’s marginal benefits in the 100% uptake case and the BAU case.
● ‘Usage in line with consumers’ voluntary update of smart appliances’ – assumes only consumers who choose to buy a smart appliance would use the functionality, as implied by findings from BEIS’s rapid evidence assessment. In this sensitivity, benefits are set to the same level of benefits assumed to be realised on Option B.
8.4.3 Limitations, evidence gaps and risks with this approach
There are a number of limitations with the approach set out above which we will seek to improve upon by building our evidence base for the Final Stage impact assessment. In general, the approach is only partial – i.e. doesn’t capture all costs and benefits and is based on crude methodology without detailed modelling of UK electricity system. Current limitations are as follows: ● The Ecodesign evidence base is EU- rather than UK-specific. There are cultural and seasonal
differences between the countries which lead to appliances being used differently and a different electricity generation mix leading to different marginal energy costs and emissions intensity. The evidence base is likely to underestimate benefits to the UK because the UK has more renewables (estimated around 43% in 2030) 80 and less interconnection than average EU which make flexibility more valuable.
● The Ecodesign analysis assumes limited other sources of flexibility, which may over-attribute flexibility benefits to smart appliances, where in practice flexibility may come from other flexible technologies such as energy storage.
● Numbers represent technical potential – we have adjusted for this crudely under Options C and D but we have not assessed in detail the impact of consumer behaviour on usage of functionality.
● Projecting uptake is subject to inherent uncertainty, as well as significant uncertainty about the tariff market.
● The UK’s future relationship with the EU, including on any standards applied to smart appliances, is subject to ongoing negotiations. The conclusions reached in this document are therefore subject to the outcome of those negotiations.
8.4.4 Indicative present value benefits for policy options
Present value benefits estimated using the methodology above are presented in Table 8. These are partial as reflect only electricity system benefits, and in particular do not reflect wider environmental benefits.
The total benefits estimates are based on combining smart appliance uptake scenarios (as outlined in section 8.2) together with assumptions on the usage rate of the smart appliances, together with marginal benefit assumptions (based on scenarios outlined in section 8.4.1). A scenario approach is used to explore sensitivity behind our central estimate, reflecting limitations in the evidence base and inherent uncertainty in the assumptions.
79
BEIS (2017) Realising the potential of demand-side response to 2025 80
BEIS (2016) Updated Energy & Emissions Projections

37
Greatest electricity system benefits can be seen under Option C as it drives the highest uptake. Benefits under Option D are also much higher than Options A and B. Benefits under Option B are twice as high as Option A because we have assumed it drives twice as high levels of additional uptake.
Table 8: Indicative present value electricity system benefits for uptake under policy options (£m)
Option A
10% uptake over
counterfactual from 2021
(Benefits based on Ecodesign BAU)
Option B
20% uptake over
counterfactual from 2021
(Benefits based on Ecodesign BAU)
Option C
All new sales are smart: approx. 50% usage
(Core scenario: benefits based on midpoint between Ecodesign BAU and 100% uptake scenario except in usage sensitivity)
Option D
From 2021 10% above
counterfactual; mid-2020s 20% above
counterfactual; early-2030s all new sales approx. 50% usage.
(Benefits based on Ecodesign BAU)
Core scenario 13 26 301 147
Delay impact of policy on uptake by 4 years
11
23 N/A 141
Option C
● Usage in line with uptake in Option B
(Benefits based on Ecodesign BAU)
● Technical potential (100% usage) –
(Benefits based Ecodesign 100% uptake scenario)
N/A N/A 26 – 432 N/A
Source: BEIS calculations based on uptake projections from Ecodesign using Products Policy model data and benefits per appliance from Ecodesign. Note: 2016 prices; discounted to base year 2017 at 3.5% government discount rate; appraisal period for appliances purchased 2021 – 2035 (remaining in use until 2047 i.e. 13 year lifetime).
If the impact of the Options A, B or D on uptake is delayed by four years due to, for example, lack of consumer recognition, it would not substantially impact results. Under Option C, usage of functionality is particularly uncertain – results under the sensitivity show a large range in benefits based on usage which presses the importance of ensuring consumers are able to take advantage of benefits through smart tariff and aggregation services, and that they are aware of the benefits.
8.4.5 Non-monetised benefits
Environmental benefits Carbon savings and air quality improvements are not possible to quantify with standard appraisal techniques because smart appliances will not necessarily reduce the amount of energy consumption (as is typical with energy efficiency policies, for example) – instead they enable energy to be used at different times and in different ways. Forecasting the environmental impacts of smart appliance usage on the electricity system would require a significant level of detail and modelling through the UK’s energy system models. For this consultation stage IA, given the limited UK evidence base available to forecast specific smart appliance changes to patterns of demand, no attempt has been made to model and quantify these benefits. An assessment will be made in later impact assessments. As an indication of the potential scale of benefits, Ecodesign estimate carbon savings for 100% uptake for smart appliances against a counterfactual of business-as-usual uptake is estimated at 57,000 ktCO2 for the EU-28 in the traded sector.81 Other non-monetised benefits Consumer benefits from the policy such as cyber-security, data protection and avoided costs through interoperability have not been quantified at this stage. As secondary legislation is designed in detail, and through the consultation, we will have a better understanding of these benefits. Similarly, coordination
81
Note we have subtracted the carbon savings from the BAU scenario from the carbon savings from the 100% uptake scenario.
38
benefits (smart appliances taken up at scale allowing suppliers and aggregators to develop services which benefit smart appliances further) have not been quantified at this stage due to lack of evidence. An international review of studies on the scope of DSR has found that there is limited evidence on the responsiveness of vulnerable consumers to DSR.82 Evidence for responses to DSR measures was mixed for low-income consumers and large households, who are likely to have children and so be considered a vulnerable consumer. A study modelling the impacts of Time of Use tariffs on 17 different sociodemographic groups83 found that most social groups could save money on their bills under a Time of Use tariff.84 However, there are certain groups and households in each group which would be worse off under Time of Use tariffs including students and those on modest incomes. Wider economic benefits, for example, supporting the smart appliance supply chain and creating green jobs have not been quantified due to lack of evidence in the nascent industry – the services outlined in this IA are only available in limited quantities to industrial customers at present and are only just becoming available to domestic consumers in pilot demonstration projects. This regulatory proposal is therefore the start of a new industry in the UK and should be viewed differently to standards to regulate existing industries. Under Option D, this would imply producing an additional 30m circuitries between 2021 and 2035 which will have implications for jobs in the manufacturing sector and services providers. An analogy to the standards outlined in this IA would be the role out of smartphones in the telecommunications industry, where the Government (in conjunction with the EU) released radio spectrum and regulated that this must be used for services to the 3GPP standard. By timely regulation of the smartphones, the UK Government has ensured the development of businesses that is estimated to be worth £31bn per annum to the UK economy by 2025.85 Note that this is in an industry where the UK no longer produces the smartphone hardware, but excels in the production of services (‘Apps’). It is this success in the telecommunications industry that this proposal for regulation in the upcoming smart appliance industry is designed to emulate.
9 Costs to different groups
9.1 Cost to businesses of complying with standards
The primary or direct costs of these measures, if implemented through secondary legislation, would come about from the additional costs that smart appliance manufacturers will incur from manufacturing additional products. To assess the wider or indirect impact on UK businesses requires a consideration of the different types of businesses:
● Smart appliance manufacturing businesses: these will have to (or choose to under voluntary options to) implement any proposed smart appliance standard and will face additional costs of manufacturing smart appliances as outlined in section 8.3.1. Under Options A and B, manufacturers are not obligated to make all relevant appliances smart, and our assumption is that manufacturers who choose to produce smart appliances will face additional manufacturing costs but will only rationally choose to do so should this be net beneficial for them (i.e. they will pass on costs, or for future market share). Under Options C (and D once mandatory smart appliances are introduced), all manufacturers will be required to produce smart appliances. These options would have a direct cost on manufactures who choose to stay in the market, but we note that under these options costs of firmware development are expected to decrease faster than Options A and B due to the market scale – industry stakeholders estimate around 15% decrease in costs per doubling of volume of sales of smart appliances. We assume that costs would be passed on through to consumers, and the expectation is that the low–level of increase in cost would not impact on market sales (and potentially be offset/boosted by the greater benefits of smart appliances to consumers). We will explore these impacts further through consultation and in future impact assessments.
82
The Government's Fuel Poverty Strategy defines vulnerable consumers as people with a long-term illness, families with children, disabled
people and the elderly. 83
Groups defined using ACORN sociodemographic segmentation. 84
Cambridge Economic Policy Associates Ltd for Ofgem ( 2017) Distributional Impact of Time of Use Tariffs 85
https://www.theguardian.com/technology/2014/jun/26/uk-apps-economy-worth-four-billion-pounds

39
● Non-smart appliance manufacturing businesses: under Options A and B, there will still be a
market for non-smart appliances. Under mandatory standards, Option C, and once introduced in Option D, traditional ‘non’ smart market manufacturer would have to adjust their production, and may need to invest in some R&D (research and development) to make their devices compliant, or exit the market etc. Under Options C and D limited barriers are expected in adapting production processes and this should minimise the potential R&D or investment costs for those who choose to adjust to smart manufacturing. We have not aimed to quantify the impact of this in this initial IA as our initial assessment is that this is minimal, but the evidence for the scale will be explored during future consultation.
● Considering it is thought that the UK no longer has any large multi-national domestic appliance
manufacturing businesses (remaining companies are niche manufacturers86
), these costs are
largely incurred by foreign business and it is our assessment that manufacturers will seek to become smart appliance manufacturers and to fully pass on through the supply chain as costs to consumers. At this point it is not possible to estimate the extent to which additional costs would force or choose to exit the UK market, but we aim to improve the evidence for this area following consultation.
● Smart appliance service providers (new entrants): these can either be physical businesses,
e.g. aggregators or software solution developers (i.e. smart appliance ‘Apps’). Both business types require standardised smart appliances to justify the large development costs of these services and the options that are mandatory single standard solutions (Options C and D) achieve the greatest market reach for these businesses. Note that the UK leads Europe in the development of these kinds of businesses (for example: Open Utility, Open Energi, Green Running, Kiwipower, Tempus Energy). Costs incurred by these types of business are largely unknown, dependant on the scale and nature of the service provided, but it is assumed that new entrants will only occur if activity is likely to be net benefit.
● Appliance supply chain: these are the businesses that sell appliances, install and maintain
them. Most of the costs relate to training to understand smart appliances, however, appliances are continuously changing and evolving. It is our initial assessment that the additional costs related to the smart element of new product ranges will be small (discussed further in Section 12).
● Consumer businesses: those that purchase the smart appliances as end consumers. Since smart appliance users are rewarded by lower energy bills or through taking part in DSR through a DSR aggregator service for a monetary payment, and since under Options A and B, a business can choose whether to buy a smart appliance or not, the expectation is that through active and voluntary choice, under Option A and B, that this will be a net benefit to consumer businesses. Under Options C and D, with mandatory smart appliances, all businesses will face the costs upon purchase of appliances (expected to be minimised due to cost reduction from scale) and all businesses could benefit from lower energy bills and DSR payments, but they would need to actively use smart functionality or sign up to DSR services. The rate of usage is uncertain, particularly among different consumer types as some may engage and benefit more than others. All options are estimated overall to have net benefits for society and we would expect in a competitive market that the benefits would be passed onto consumers through a monetary payment, so payments for DSR services exceed smart appliance additional cost. Options C and D also bring the most benefit to these businesses.
● Electricity industry: this includes National Grid, Distribution Network Operators, energy suppliers, electricity generators, who can save investment through using DSR over conventional ways to balance electricity supply and demand. The National Infrastructure Commission has projected the demand for DSR services will grow in the 2020s as we progressively decarbonise the grid and so there would be greatest benefit from the maximum amount of DSR being available (i.e. Options C and D).87 In this analysis, we have captured the electricity system
86
See section 2.1.5 for detail on UK smart appliance market and manufacturers 87
National Infrastructure Commission (2016) Smart Power
40
benefits and we would expect that these savings would be passed on to consumers by competitive pressures and market regulation by Ofgem, in the form of lower energy prices.
9.2 Transition and familiarisation costs
The impact of transition and familiarisation will depend on the business type (as grouped in the previous section). At this stage in policy development the detail of the secondary regulation has yet to be considered, alongside uncertainty in how international standards may develop. As such the impact on transition and familiarisation costs cannot be fully assessed and this prevents a quantitative analysis. As the policy detail develops we will have a clearer understanding of the magnitude of these impacts and will look to assess this in future IAs. We do, however, make a qualitative assessment to give an indication of the likely impacts. Manufacturing businesses will need to spend time familiarising themselves with the new rules and requirements. Currently, for example, for every EU Ecodesign and Energy labelling proposal, 1,100 registered stakeholders are consulted at least four times during the process at regular intervals, and so proposals are known with sufficient time for industry to understand the implications. Reflecting that manufacturers are typically large multinational companies that would be engaging with EU and other international standards irrespective of UK regulation, and given the UK aim to align with international standards, the additional familiarisation costs of UK regulation are expected to be low. This is particularly the case for Option D where the gradual transition to mandatory standards enables the UK to follow and align to international developments. These costs are driven by the number of staff that are needed to understand the regulations, their wage rates and the complexity of the requirements. For this consultation stage IA it would be disproportionate to gather detailed information from manufacturers on what these impacts could be, but this will be explored through the consultation. Once standards are created, these factors will be considered for each individual standard generated using the powers taken in these primary regulations. Elements of transition costs to change the production process such as redesign, integration of smart circuitry and displays, as noted for the direct unit cost for manufacturers are largely incurred by non-UK firms. It is not possible at this point to estimate what these costs are. It is our initial assessment that these costs are low and that they will vary between those producing a range of electronic products or more ‘traditional’ appliance specific manufacturers. Evidence for this will further be explored in future consultation. We also note that the findings of the BEIS-Ofgem 2016 Call for Evidence, where many supported the progression to mandatory standards for smart appliances, once the industry has become familiar with the voluntary standards and that Option D, the preferred option, represents a gradual transition from voluntary to mandatory standards which should minimise these costs. For consumers and consumer businesses, familiarisation will relate to the ease of use of smart appliances compared to their non-smart equivalents. The main action will be to select parameters of control on the appliance interface; for example, ‘I want my clothes washed by 07:00 tomorrow’. Consumer interfaces will not be mandated in any of the policy options and therefore manufacturers will be free to compete in developing the best consumer interfaces as they are currently and it is expected that competition will minimise consumer familiarisation costs.
9.3 Enforcement costs
We would expect these powers to have low associated level of administrative burden both on the smart appliance industry and on the Government. While this will depend on the standards imposed under secondary regulation and the provisions required to manage these, there is significant existing infrastructure in both the Government and manufacturing businesses to deal with existing Ecodesign products policy regulation; and enforcement of smart appliance standards will aim to utilise this framework. Ecodesign products policy is enforced by the UK Market Surveillance Authority. Under the specific product regulations, manufacturers are obliged to carry out a conformity assessment of any product which they place on the market in accordance with Article 8 of Directive/2005/32/EC. Past experience has shown that no significant additional staffing resource has been required for specific regulations

41
under the Ecodesign Directive for manufacturers given the resource in place to comply with Monitoring, Regulation and Verification for current Ecodesign energy efficiency standards. The burden may be greater on smaller firms which are unable to spread the compliance costs over a larger number of units of production. It is the initial assessment from the experts who manage and enforce Ecodesign regulation within Government that no significant additional staffing resource would be required for enforcement. Evidence from Ecodesign regulation is thought to be the best available evidence and an indicator of the potential future enforcement cost of smart appliances. Estimates of any additional enforcement cost under secondary legislation may be possible once the technical requirements have been established and more evidence is available, and will be explored in future Impact Assessments.
9.4 Additional electricity consumption of consumers
Smart appliances responding to signals from the electricity network may require some small additional electricity consumption compared to non-smart appliances, and evidence varies on this. Additional electricity may be required either because appliances are required to be in standby mode or by deviating from the most energy efficient operation point, e.g. by cooling deeper or heating higher. Ecodesign finds the operating costs related to in-house communication infrastructure is mostly shared with other devices and applications, so the cost that can be attributed to the smart appliance is assumed to be very low or negligible. Another key study of smart appliance impacts finds electricity consumption of the appliance increases between 0.1% and 2%, ranging between €0.02 and €1.10 per appliance per year.88
9.5 Infrastructure costs
The costs outlined above do not include any infrastructure cost, but this is thought to be minor. Total data used by smart energy services is very small and the infrastructure is being rolled out to meet the requirement for broadband, video, etc. There may be an issue with rural communities without reliable internet connection who may not be able to access smart appliance controls, who may potentially be disadvantaged. However, the Government is encouraging the rollout of digital services to remote areas for other reasons, so any increase in cost due to smart appliances would be small. This would also be supported by the infrastructure and connection required by the Government commitment to ensuring that every home and small business in the country is offered a smart meter by the end of 2020.
9.6 Cost of label
There could be one label or icon required to denote compliance with the standard, or a more detailed label with a graded scale. This will be scoped further in later stages of policy development. The Ecodesign study estimates energy labels cost €0.3 per label, however, our internal engagement with stakeholders suggests the cost of additional labelling information would be negligible in the context of broader Ecodesign standards and labelling requirements (labelling requirements for smart appliances are not thought to be any more complex, or require further verification of standards, than the existing labelling processes). Specific policy requirements for labelling will also seek to minimise any additional labelling costs. For example, long lead times could be provided so that manufacturers do not recall models and re-label but simply schedule into the production model cycle. Other businesses in the supply chain such as distributors should also not face any additional labelling costs, assuming that original appliance manufacturers are compliant. In addition to costs outlined in this section, we acknowledge there are a number of intangible and uncertain costs which are not monetised here due to lack of data, namely the possibility of stifling innovation by setting unclear or too prescriptive minimum standards; and a reduction in consumer choice, particularly under Option C. The Government is aware of this risk, and will work with industry to minimise it.
88
R. Stamminger et al (2009), Strategies and Recommendations for Smart Appliances; a report from the Smart-A project.

42
10 Social cost-benefit analysis
Based on the assumptions set out above on uptake, costs and benefits per appliance, we set out the resulting net present value (NPV) in Table 9. Given the partial estimates of costs and benefits, the NPV is also only a partial representation. We have also only assessed costs and benefits for domestic wet and cold appliances due to data limitations and we intend to build on this evidence base in the Final IA to also include HVAC and batteries, where we would expect the scale of the costs, benefits and NPV to be greater.
Table 9: Indicative net present value (NPV) benefits (£m, 2016 prices, discounted to base year 2017 at 3.5% government discount rate)
Option A Option B Option C Option D
Core sensitivity
Costs 3 6 172 35
Benefits 13 26 301 147
Net benefits 10 20 129 112
Sensitivity analysis
Costs 2 – 19 4 – 24 130 – 204 28 – 68
Benefits 11 – 13 23 – 26 26 – 432 141 – 147
Net benefits -8 to 11 -1 to 22 -178 to 302 73 to 119
Source: BEIS analysis (2017)
Note: The scope of this analysis covers wet and cold appliances only, it does not estimate costs/benefits for batteries and
HVAC. Ranges in benefits for Option A, B and B reflect uptake, and for Option C reflects usage of smart functionality. Ranges in
costs reflect market size: for all options, the high end of the cost range reflects the UK setting a different technical standard to
the EU, and the low end reflects the EU regulating for all relevant to be smart.
Indicative results imply Option C, whilst potentially offering the highest net benefits, could yield the greatest range in net benefits reflecting the high level of uncertainty around what this option could deliver. The estimated high-end NPV reflects technical potential of the high scale of uptake of smart appliances (driven by mandatory smart appliances) and full smart usage of the appliances by consumers. The low-end negative NPV reflects potentially very low usage of smart functionality among those who would not have opted to buy a smart appliance if given the choice, and so low electricity system benefits. This option limits consumer choice, and incurs high direct costs on producers, likely to be passed on to consumers through higher product prices, including those who are unable to take advantage of the functionality, so it is likely to have the biggest distributional impacts. Option C is also likely to have greater transition and familiarisation costs through mandating all appliances to be smart in 2021, compared to other options which are voluntary, only apply to smart appliances, or reflect a transition of all three options.
Options A and B, voluntary standards or mandatory standards to only smart appliances respectively, have a significantly lower impact on the share of the appliance market over the appraisal period, and so have lower scale of both costs and benefits. Within these options, given the consumer choice to purchase a smart appliance or not, we expect there to be less uncertainty in the rate of usage in appliances (i.e. those choosing to buy a smart appliance are more likely to use the functionality), and so present a smaller estimated range in net benefits. Option B has greater net benefits than Option A, which is based on the assumption it achieves higher or earlier levels of uptake, and so achieves greater scale. Option D reflects a transition from voluntary to mandatory standards, and transition in coverage from all smart appliances to all relevant appliances. Option D presents a significantly higher NPV than Option A and B, though slightly lower than Option C. However, there is less uncertainty in achieving a positive net result for this option than compared to Option C. The uncertainty range for Option D, based on the scenarios of lower uptake and cost, reflects less uncertainty on the usage of smart appliances given the transitional approach. Option D could yield significant positive benefits, and allows the decision of whether to mandate smart appliances to be made when there is better information about market development, cost-reduction and consumer attitudes. Although Option C has the higher NPV, Option D is our preferred Option at this stage because it allows the Government flexibility to adapt their strategy in

43
light of new information and as the market develops – it is therefore a “low regret” option. In addition, the familiarisation and transitional costs are expected to be lower. In practice we might expect Option D uptake to be higher across the 2020s than Options A and B, given there is a signal for industry to promote smart appliances. Similarly, usage may be higher than under Option C during the 2030s as consumers will have been exposed to smart appliances before they are made mandatory and tariff/aggregation services will have had time to develop. This would positively impact the NPV, making it higher than presented here. Note, in order to do this analysis, we have picked an illustrative scenario for Option D based on our latest view of when we may transition but this is highly uncertain and should not be interpreted as a prediction of a timeline. Where the UK creates a different technical standard to those developed internationally, Options A – C are less cost effective (i.e. the low end of the range). This reflects the UK following different standards and therefore not achieving the same levels of international cost reduction anticipated under the counterfactual. In reality, net benefits for wet and cold appliances may be greater than estimated here as there may be some scope for small and medium enterprises to purchase smart appliances intended for the domestic sector. The net societal impacts of the policies shown in Table 9 are not expected to be distributed equally across society, with manufacturers in particular expected to incur the direct costs presented, however, these are likely to be passed on to the consumer. There are significant electricity system benefits that will be passed through to consumers in lower bills. However, it is unknown how these benefits will be apportioned between the customer, aggregator/supplier, and society as a whole. Benefits will also accrue to the smart appliance owner, if they have contracted with some type of smart tariff, e.g. a time of use tariff or direct load control through an aggregator. It has not been possible to estimate a meaningful business NPV in this appraisal. Firstly, as outlined in the previous sections, at this stage we are only able to estimate a partial NPV impact. Secondly the evidence base to estimate electricity system benefits is high-level at this stage and it is not possible to robustly allocate the share of benefits passed through to lower domestic vs non-domestic energy prices and bills. Thirdly, as outlined above, it is also unclear regarding the extent to which non-domestic consumers will purchase smart appliances and this has not been reflected in the partial appraisal above. Costs to business are assumed in this IA to be passed through to consumers (see section 14 for an assessment of direct costs to business). We will improve our evidence base and seek to include business NPV impacts in subsequent IAs.
11 Rationale and evidence that justify the level of analysis used in the IA (proportionality approach)
Based on the impact assessment guidance criteria, we have followed a proportionate approach to approximate costs and benefits. This is based on considerations, primarily of limited data available and because this is a consultation stage IA. We are at early stages of policy development and given the complex, wide-ranging and innovative nature of the benefits of this policy, we are currently unable to fully quantify benefits. We will test assumptions with stakeholders in this consultation and build our evidence base to develop the policy accordingly. We note the high levels of uncertainty with benefits and distributional impacts throughout this document.
12 Small and Micro Business Assessment (SAMBA) The exact number of small or micro businesses (defined as having up to 49 FTE and 10 FTE employees respectively, BEIS Better Regulation Framework Manual) that the proposed provisions will affect is uncertain. The businesses directly affected are the appliance manufacturers who are larger and fall outside of the defined employee range (see section 2). For those indirectly affected we have not been able to quantify the scale of business affected due to lack of evidence. The expected impact is qualitatively discussed below and noted as an area for improved evidence in future consultation. The main small and micro businesses that are thought to be affected fall into the category of the supply chain and service provider categories set out in section 9.1. Of these, the service providers are strongly

44
growing and would benefit maximally from Options C and D to maximise their business opportunity. These are new business types and have only benefits, no costs, from the proposed standards. It should also be noted that any remaining small and micro business, such as local retailers, will only face minimal added labelling and familiarisation costs as this is largely incurred by the original manufacturers. The supply chain will face costs in training their workforce to sell and service appliances that are more complex than non-smart appliances, but smart appliances are expected to include smart fault detection functionality which can support servicing and repairs of smart appliances. It is important to also recognise that appliances are continuously changing and evolving, and that supply chain businesses are continually developing their practices. Our initial assessment is that the additional costs related to the smart element of new product ranges are likely to be small, but expected to be relatively higher in Options C and D (than A and B), where there is likely to be a much higher uptake of smart appliances. The Government’s Industrial Strategy89, which has pledged three million apprenticeship starts by 2020 and a new National Retraining Scheme that supports people to reskill beginning with a £64m investment in digital and construction, will mitigate potential costs on the supply chain. Another example from the Ecodesign requirements has shown that standards can be introduced gradually in order to provide a sufficient timeframe for manufacturers, including small businesses, to redesign their products and services in accordance with the standards. In addition, the UK Market Surveillance Authority is required to raise awareness of the Ecodesign and Energy Labelling Requirements, so industry and small businesses will be made aware of the consequences of placing non-compliant products on the market. Specific information campaigns provided through this channel could be used to mitigate any disproportionate demands in respect of understanding what compliance looks like and what is required. This method of cost minimisation is particularly relevant to Option D, as mandatory standards are introduced over a longer time period. Of the small and micro businesses indirectly affected outlined above (supply chain and service providers), a number of further methods could be considered in future consultation to mitigate any costs:
● Partial exception - small and micro businesses could be issued warnings rather than sanctions being applied where non-compliance is identified, or a certain subset of rules could be deemed not applicable to smaller business.
● Extended transition period - Option D provides this as the default option for all business sizes. This could be more explicitly included in the proposed legislation to give a fixed extension under Options C and D. This would also provide the opportunity for compliance authorities to identify and target larger manufacturers or distributors that are non-compliant with regulation.
● Temporary exemptions - this could be provided under all options for a sub-set of service providers, to continue existing business for older non-smart products. This could be extended to exempt any small and micro business that have to conduct redesign in order to be compliant. Valid reasons (such as capacity or financial) would have to be provided to justify a longer time period than larger businesses.
● Varying requirements by type and/or size of business - given the expected minimal additional costs, it is our view that this would be disproportionate to initially consider, as other methods would be more appropriate at targeting any additional costs.
● Specific information campaigns or user guides, training and dedicated support for smaller businesses - as noted above, this would be an essential method of cost minimisation for all options.
● Direct financial aid for smaller business - given the expected minimal additional costs, it is our view that this would be disproportionate to initially consider, as other methods would be more appropriate at targeting any additional costs.
● Opt-in and voluntary solutions - this is considered under Options A, B and D where all businesses voluntarily “opt-in” to the full regulatory or industry-led smart appliance standards.
89
HM Government (2017) Industrial Strategy, Building a Britain fit for the future
45
13 Risks
The risks associated with this policy are set out below:
● Non-compliance by industry – the nature of this risk varies between the policy options. If standards are not clear or strictly enforced, there may be non-compliant products on the market undermining confidence and consumer protection.
● Increased energy consumption – smart appliances may use more energy on standby or by deviating from the most energy efficient operation point, e.g. by cooling deeper or heating higher. This is assumed to be negligible by Ecodesign.
● Regulation does not drive uptake and/or use of smart functionality is low – additional cost of smart appliances; media push back; general consumer disengagement with energy issues could limit effectiveness of policy.
● Regulation does not drive smart tariffs and services – there is a risk that regulation comes at the wrong time or is insufficient to incentivise smart tariffs and services from suppliers/aggregators, meaning that the smart functionality is not used to manage the electricity system.
● Vulnerable consumers are left behind – if they are unable to afford smart appliances or have inflexible load, they may be faced with higher energy costs.
● Industry push-back – without consistent involvement with industry to develop the standard, industry could reject the standard. This is particularly an issue under Option C.
14 Wider impacts
14.1.1 Direct costs and benefits to business calculations
Given that the legislation is for primary powers only, and that decisions on the introduction and detail of any secondary legislation will be taken at a later date in light of the development of the market, the Equivalent Annual Net Cost to Business (EANCB) of the primary regulation is therefore zero. EANCB of individual measures will be quantified and scored at the point when any regulations, which would then bring about impacts to business within the UK, which are introduced in secondary legislation. Nevertheless we have produced an initial indicative estimate for EANCB for secondary regulation (see Table 10). Based on the available evidence, this reflects the direct costs incurred by product manufacturers from the proposed policy, but at this stage we are not able to quantify any direct benefits. As a result, these indicative estimates are considered partial, and subject to uncertainty regarding the unit cost estimates as outlined in the previous section 8.3. Particularly, there is uncertainty around to what extent costs are likely to come down with time given assumptions on competition, learning rates and volume of sales/ uptake under different policy options. Under the preferred Option D – the central estimate of EANCB to manufacturers for Option D is £2.5m (2014 prices, present value, 2015 base year, government 3.5% real discount rate).90 This value is higher than in Option B, but lower than Option C, reflecting the scope of the Option (a transition of mandatory standard covering smart and thereafter all appliances). As outlined in section 10, this is the preferred Option at this stage. It should be noted that the EANCB has been estimated without account for any direct benefits. We also anticipate that manufacturers will pass through costs to consumers and that business and industry in general could benefit from wider indirect benefits, for example, supporting the smart appliance supply chain and creating green jobs (see section 8.4.5).
90
This figure is calculated using the Government online Impact Assessment calculator, using the present value costs to businesses set out in
Section 8.
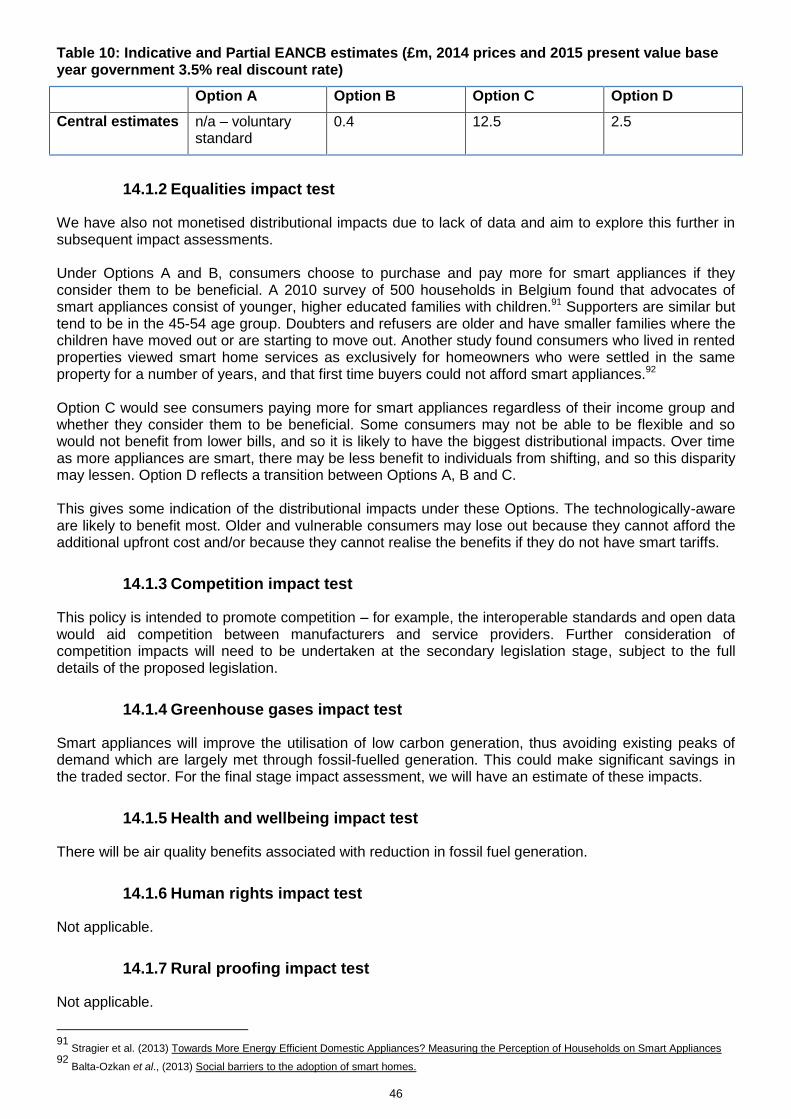
46
Table 10: Indicative and Partial EANCB estimates (£m, 2014 prices and 2015 present value base year government 3.5% real discount rate)
Option A Option B Option C Option D
Central estimates n/a – voluntary standard
0.4 12.5 2.5
14.1.2 Equalities impact test
We have also not monetised distributional impacts due to lack of data and aim to explore this further in subsequent impact assessments. Under Options A and B, consumers choose to purchase and pay more for smart appliances if they consider them to be beneficial. A 2010 survey of 500 households in Belgium found that advocates of smart appliances consist of younger, higher educated families with children.91 Supporters are similar but tend to be in the 45-54 age group. Doubters and refusers are older and have smaller families where the children have moved out or are starting to move out. Another study found consumers who lived in rented properties viewed smart home services as exclusively for homeowners who were settled in the same property for a number of years, and that first time buyers could not afford smart appliances.92 Option C would see consumers paying more for smart appliances regardless of their income group and whether they consider them to be beneficial. Some consumers may not be able to be flexible and so would not benefit from lower bills, and so it is likely to have the biggest distributional impacts. Over time as more appliances are smart, there may be less benefit to individuals from shifting, and so this disparity may lessen. Option D reflects a transition between Options A, B and C. This gives some indication of the distributional impacts under these Options. The technologically-aware are likely to benefit most. Older and vulnerable consumers may lose out because they cannot afford the additional upfront cost and/or because they cannot realise the benefits if they do not have smart tariffs.
14.1.3 Competition impact test
This policy is intended to promote competition – for example, the interoperable standards and open data would aid competition between manufacturers and service providers. Further consideration of competition impacts will need to be undertaken at the secondary legislation stage, subject to the full details of the proposed legislation.
14.1.4 Greenhouse gases impact test
Smart appliances will improve the utilisation of low carbon generation, thus avoiding existing peaks of demand which are largely met through fossil-fuelled generation. This could make significant savings in the traded sector. For the final stage impact assessment, we will have an estimate of these impacts.
14.1.5 Health and wellbeing impact test
There will be air quality benefits associated with reduction in fossil fuel generation.
14.1.6 Human rights impact test
Not applicable.
14.1.7 Rural proofing impact test
Not applicable.
91
Stragier et al. (2013) Towards More Energy Efficient Domestic Appliances? Measuring the Perception of Households on Smart Appliances 92
Balta-Ozkan et al., (2013) Social barriers to the adoption of smart homes.

47
15 Summary The preferred option is Option D, a transition from voluntary to mandatory standards for all smart appliances in the 2020s, with a review of implementation of mandatory standards for all relevant appliances to be smart thereafter. This is consistent with the findings from the BEIS-Ofgem 2016 Call for Evidence, where most respondents supported voluntary standards for smart appliances, with an associated label to indicate compliance with those standards, initially. Many supported the progression to mandatory standards for smart appliances, once the industry has become familiar with the voluntary standards.
Based on the assessment in this consultation stage impact assessment, although Option C has the higher central estimated net benefits (NPV), Option D is our preferred Option at this stage because it allows the Government flexibility to adapt their strategy in light of new information and as the market develops – it is therefore a “low regret” option, and has a lower uncertainty range explored through our sensitivity analysis. As this is a new and rapidly developing sector, we recognise that the smart system may evolve into any one of a number of foreseen or unforeseen ways. Therefore, the Government must allow flexibility in how we deal with the smart appliances sector.
Due to the transitional approach, Option D is also expected to have lower transition and familiarisation costs compared to Option C, whilst achieving a significant scale of benefits to the electricity system. In comparison, Options A and B would have lower costs per se, but also significantly lower scale of benefits and are unlikely to address the rationale for intervention to support a smarter more flexible energy system.
We note that the quantitative analysis presented in this impact assessment is only partial; for example, it does not take full account of the costs or risks, nor capture all the benefits (for example, environmental benefits). Improvements to both our quantitative and qualitative evidence base will be sought through the consultation and explored in future impact assessments.
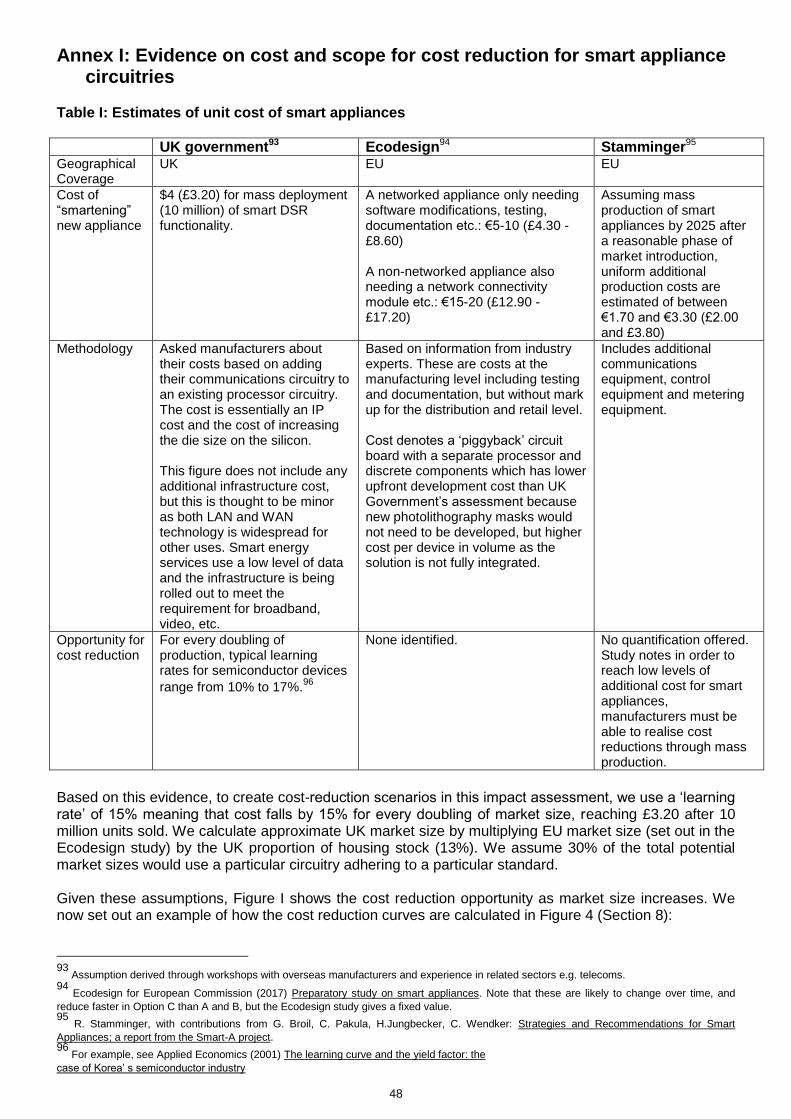
48
Annex I: Evidence on cost and scope for cost reduction for smart appliance circuitries
Table I: Estimates of unit cost of smart appliances UK government93 Ecodesign94 Stamminger95 Geographical Coverage
UK EU EU
Cost of “smartening” new appliance
$4 (£3.20) for mass deployment (10 million) of smart DSR functionality.
A networked appliance only needing software modifications, testing, documentation etc.: €5-10 (£4.30 - £8.60) A non-networked appliance also needing a network connectivity module etc.: €15-20 (£12.90 - £17.20)
Assuming mass production of smart appliances by 2025 after a reasonable phase of market introduction, uniform additional production costs are estimated of between €1.70 and €3.30 (£2.00 and £3.80)
Methodology Asked manufacturers about their costs based on adding their communications circuitry to an existing processor circuitry. The cost is essentially an IP cost and the cost of increasing the die size on the silicon. This figure does not include any additional infrastructure cost, but this is thought to be minor as both LAN and WAN technology is widespread for other uses. Smart energy services use a low level of data and the infrastructure is being rolled out to meet the requirement for broadband, video, etc.
Based on information from industry experts. These are costs at the manufacturing level including testing and documentation, but without mark up for the distribution and retail level. Cost denotes a ‘piggyback’ circuit board with a separate processor and discrete components which has lower upfront development cost than UK Government’s assessment because new photolithography masks would not need to be developed, but higher cost per device in volume as the solution is not fully integrated.
Includes additional communications equipment, control equipment and metering equipment.
Opportunity for cost reduction
For every doubling of production, typical learning rates for semiconductor devices
range from 10% to 17%.96
None identified. No quantification offered. Study notes in order to reach low levels of additional cost for smart appliances, manufacturers must be able to realise cost reductions through mass production.
Based on this evidence, to create cost-reduction scenarios in this impact assessment, we use a ‘learning rate’ of 15% meaning that cost falls by 15% for every doubling of market size, reaching £3.20 after 10 million units sold. We calculate approximate UK market size by multiplying EU market size (set out in the Ecodesign study) by the UK proportion of housing stock (13%). We assume 30% of the total potential market sizes would use a particular circuitry adhering to a particular standard. Given these assumptions, Figure I shows the cost reduction opportunity as market size increases. We now set out an example of how the cost reduction curves are calculated in Figure 4 (Section 8):
93
Assumption derived through workshops with overseas manufacturers and experience in related sectors e.g. telecoms. 94
Ecodesign for European Commission (2017) Preparatory study on smart appliances. Note that these are likely to change over time, and
reduce faster in Option C than A and B, but the Ecodesign study gives a fixed value. 95
R. Stamminger, with contributions from G. Broil, C. Pakula, H.Jungbecker, C. Wendker: Strategies and Recommendations for Smart
Appliances; a report from the Smart-A project. 96
For example, see Applied Economics (2001) The learning curve and the yield factor: the
case of Korea’ s semiconductor industry
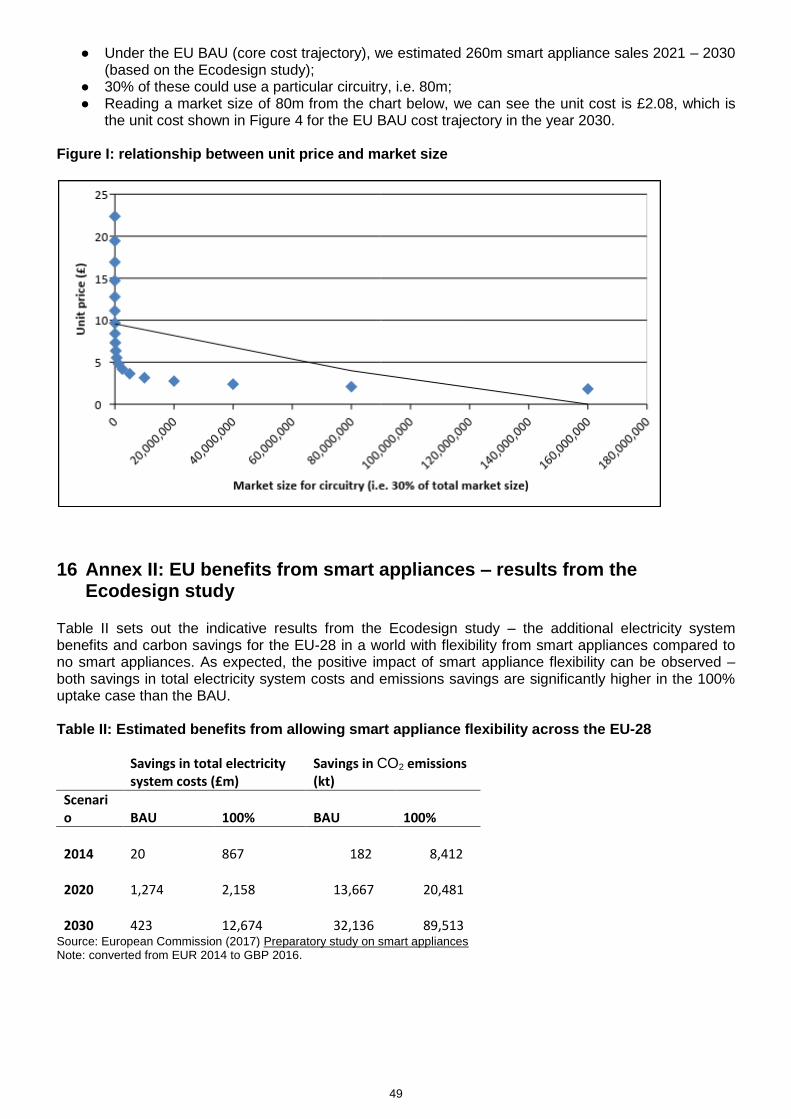
49
● Under the EU BAU (core cost trajectory), we estimated 260m smart appliance sales 2021 – 2030 (based on the Ecodesign study);
● 30% of these could use a particular circuitry, i.e. 80m; ● Reading a market size of 80m from the chart below, we can see the unit cost is £2.08, which is
the unit cost shown in Figure 4 for the EU BAU cost trajectory in the year 2030.
Figure I: relationship between unit price and market size
16 Annex II: EU benefits from smart appliances – results from the Ecodesign study
Table II sets out the indicative results from the Ecodesign study – the additional electricity system benefits and carbon savings for the EU-28 in a world with flexibility from smart appliances compared to no smart appliances. As expected, the positive impact of smart appliance flexibility can be observed – both savings in total electricity system costs and emissions savings are significantly higher in the 100% uptake case than the BAU. Table II: Estimated benefits from allowing smart appliance flexibility across the EU-28
Savings in total electricity system costs (£m)
Savings in CO2 emissions (kt)
Scenario BAU 100% BAU 100%
2014 20
867 182 8,412
2020 1,274
2,158 13,667 20,481
2030 423
12,674 32,136 89,513
Source: European Commission (2017) Preparatory study on smart appliances Note: converted from EUR 2014 to GBP 2016.