Statewide Truck/Bus Proposed Regulation · PDF fileStatewide Truck/Bus Proposed Regulation 3 9...
10
Statewide Truck/Bus Proposed Regulation 1 Proposed Statewide Diesel Truck and Bus Regulation Workshop Series Workshop Series El Monte El Monte – – May 21 (day) May 21 (day) San Diego San Diego – – May 27 (day) May 27 (day) El Centro El Centro – – May 27 (evening) May 27 (evening) Riverside Riverside – – May 29 (evening) May 29 (evening) San Jose San Jose – – May 30 (day and evening) May 30 (day and evening) Redding Redding – – June 2 (day and evening) June 2 (day and evening) Sacramento Sacramento – – June 4 (day and evening) June 4 (day and evening) Fresno Fresno – – June 10 (day and evening) June 10 (day and evening) 2 Overview Need for emission reductions Proposed diesel truck and bus regulation Emissions benefits and costs Next steps 3 Need for Emissions Reductions Reduce diesel particulate matter (PM) emissions Meet goals of Diesel Risk Reduction Plan Reduce oxides of nitrogen (NOx) Attain health based 8-hour ozone and PM2.5 standards Federal Clean Air Act State Implementation Plan (SIP) commitments 4 Area Designations for National Ambient Air Quality Standards for Ozone and PM2.5 8-Hour Ozone PM2.5 Annual Unclassified/Attainment Nonattainment 15 areas violate the standard 2 areas violate the standard
Transcript of Statewide Truck/Bus Proposed Regulation · PDF fileStatewide Truck/Bus Proposed Regulation 3 9...

Statewide Truck/Bus Proposed Regulation
1
Proposed Statewide Diesel Truck and Bus Regulation
Workshop SeriesWorkshop SeriesEl MonteEl Monte –– May 21 (day)May 21 (day)San DiegoSan Diego –– May 27 (day)May 27 (day)El CentroEl Centro –– May 27 (evening)May 27 (evening)RiversideRiverside –– May 29 (evening)May 29 (evening)San JoseSan Jose –– May 30 (day and evening)May 30 (day and evening)ReddingRedding –– June 2 (day and evening)June 2 (day and evening)SacramentoSacramento –– June 4 (day and evening)June 4 (day and evening)FresnoFresno –– June 10 (day and evening)June 10 (day and evening)
2
Overview
� Need for emission reductions� Proposed diesel truck and bus regulation� Emissions benefits and costs� Next steps
3
Need for Emissions Reductions
� Reduce diesel particulate matter (PM) emissions� Meet goals of Diesel Risk Reduction Plan
� Reduce oxides of nitrogen (NOx) � Attain health based 8-hour ozone and PM2.5
standards� Federal Clean Air Act � State Implementation Plan (SIP) commitments
4
Area Designations for National Ambient Air Quality Standards for Ozone and PM2.5
8-Hour Ozone PM2.5 Annual
Unclassified/Attainment
Nonattainment
15 areas violate the standard
2 areas violate the standard

Statewide Truck/Bus Proposed Regulation
2
5
State Implementation Plan (SIP)
� Required by U.S. EPA
� SIP is a master plan developed by ARB and districts that shows how regions will meet federal clean air deadlines
� September 27, 2007 ARB adopted the ozone SIP for South Coast and San Joaquin Valley
� May 22, 2008 ARB to consider PM2.5 SIP for San Joaquin Valley
� Commitment for significant emissions reductions from trucks and buses
6
Potential Health Benefits from Truck and Bus Regulation can be Significant
� Proposed regulation would reduce health risks and costs
� Without regulation from 2010 and 2020� Expect 11,000 premature deaths� Health care costs� Valued at $70 to $89 billion
� Local health risk� West Oakland health risk from trucks is 2 to 3 times
higher than background levels� 2/3 of this increase is from non-port trucks
7
In-Use Diesel Regulatory Activity
� Public Fleets & Utilities (2005)
� Cargo Handling Equipment at Ports and Rail Yards (2005)
� Off-Road Vehicles (2007)
� Port Trucks (2007)
� Other Trucks and Buses(under development for 2008)
� Off-Road Agricultural Vehicles (under development for 2009)
� Urban Buses (2000)
� Garbage Trucks (2003)
� School Bus Idling (2003)
� Stationary Engines (2004)
� TRUs (2004)
� Truck and Bus Idling (2004)
� Portable Engines (2004)
� Transit Fleet Vehicles (2005)
Proposed StatewideTruck and Bus Regulation
Statewide Truck/Bus Proposed Regulation
3
9
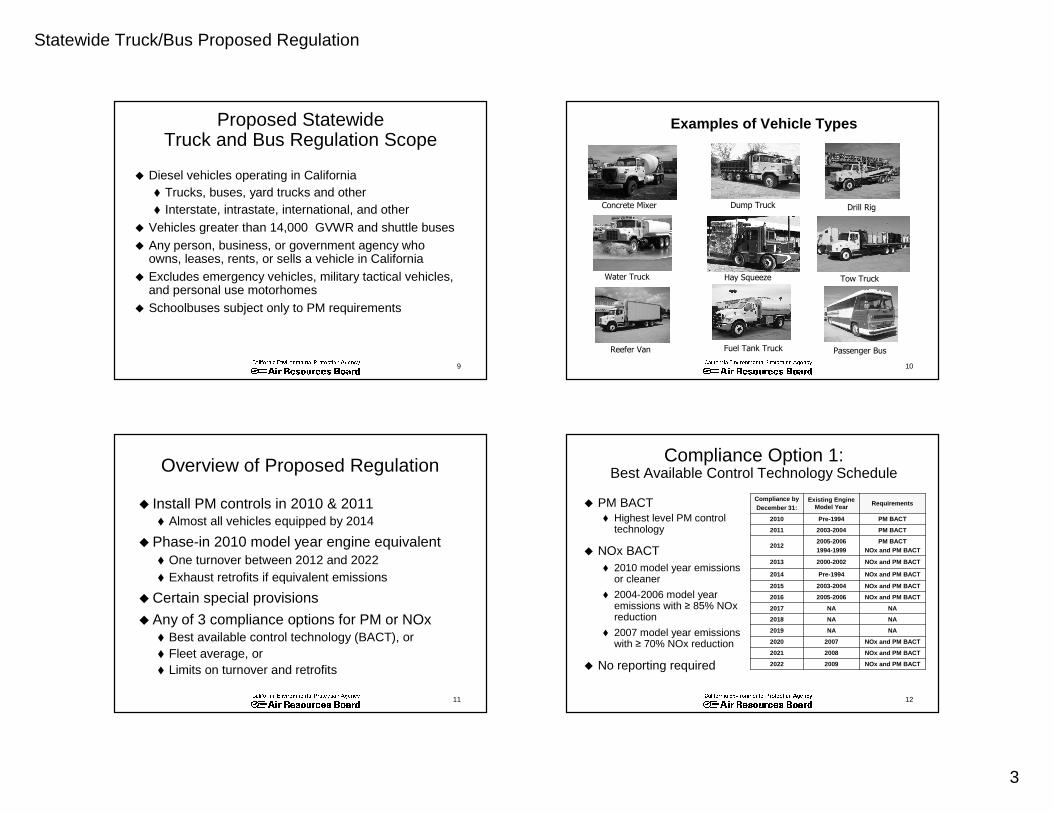
Proposed StatewideTruck and Bus Regulation Scope
� Diesel vehicles operating in California� Trucks, buses, yard trucks and other� Interstate, intrastate, international, and other
� Vehicles greater than 14,000 GVWR and shuttle buses� Any person, business, or government agency who
owns, leases, rents, or sells a vehicle in California� Excludes emergency vehicles, military tactical vehicles,
and personal use motorhomes� Schoolbuses subject only to PM requirements
10
Examples of Vehicle Types
Hay SqueezeWater Truck Tow Truck
Fuel Tank Truck Passenger Bus
Concrete Mixer
Reefer Van
Dump Truck Drill Rig
11
Overview of Proposed Regulation
� Install PM controls in 2010 & 2011� Almost all vehicles equipped by 2014
� Phase-in 2010 model year engine equivalent� One turnover between 2012 and 2022� Exhaust retrofits if equivalent emissions
� Certain special provisions
� Any of 3 compliance options for PM or NOx� Best available control technology (BACT), or� Fleet average, or� Limits on turnover and retrofits
12
Compliance Option 1:Best Available Control Technology Schedule
� PM BACT� Highest level PM control
technology
� NOx BACT� 2010 model year emissions
or cleaner
� 2004-2006 model year emissions with ≥ 85% NOxreduction
� 2007 model year emissions with ≥ 70% NOx reduction
� No reporting required NOx and PM BACT
NOx and PM BACT
NOx and PM BACT
NA
NA
NA
NOx and PM BACT
NOx and PM BACT
NOx and PM BACT
NOx and PM BACT
PM BACTNOx and PM BACT
PM BACT
PM BACT
Requirements
NA2019
Pre-19942010
20082021
2022
2020
2018
2017
2016
2015
2014
2013
2012
2011
Compliance byDecember 31:
2007
2005-2006
NA
NA
2009
Pre-1994
2003-2004
2000-2002
2005-20061994-1999
2003-2004
Existing Engine Model Year

Statewide Truck/Bus Proposed Regulation
4
13
Compliance Option 2:Turnover and PM Retrofit Limits
90%“2019
“
“
“
“
“
“
“
“
100%
75%
50%
25%
PMBACT
NA2010
90%2021
2022
2020
2018
2017
2016
2015
2014
2013
2012
2011
Compliance byDecember 31:
90%
80%
80%
80%
100%
60%
70%
50%
25%
NA
NOxBACT
� PM BACT� Highest level PM control
technology
� NOx BACT� 2010 model year
emissions or cleaner
� 2004-2006 model year emissions with ≥ 85% NOxreduction
� 2007 model year emissions with ≥ 70% NOxreduction
� Requires reporting
14
Compliance Option 3:Fleet Average
� Can be met by any method
� Provides opportunities for NOx controls
� Preserves flexibility of prior proposal� Allows mix of cleaner and dirtier engines� Same PM targets� Softer early NOx targets
� Staggered start dates� PM begins in 2010� NOx begins in 2012
� Reporting required
15
Emission Factors in Fleet AverageClass 8 Vehicles ( >33,000 lbs)
22.0
12.0
7.0
4.4
2.51.6
0
5
10
15
20
25
Pre-2004
2004-2006
2007-2009
2010 2011 2012+
Engine Model Year
NO
x E
mis
sion
Fac
tors
(g/m
ile)
3.36
1.25
0.81
0.11
0.0
0.5
1.0
1.5
2.0
2.5
3.0
3.5
4.0
Pre-1991 1991-1993 1994-2006 2007+
Engine Model Year
PM
Em
issi
on F
acto
rs (g
/mile
)
NOx PM
Note: Most 2003 model year engines met 2004 emissions standardSeparate emission factors for smaller vehicles not shown
16
Fleet Average Emission TargetsClass 8 Vehicles
0
2
4
6
8
10
12
14
16
18
2010
2011
2012
2013
2014
2015
2016
2017
2018
2019
2020
2021
2022
End of Calendar Year
Em
issi
on T
arge
ts (
g/m
ile)
PM x10
NOx
Note: Separate emission targets for smaller vehicles not shown
Statewide Truck/Bus Proposed Regulation
5
17
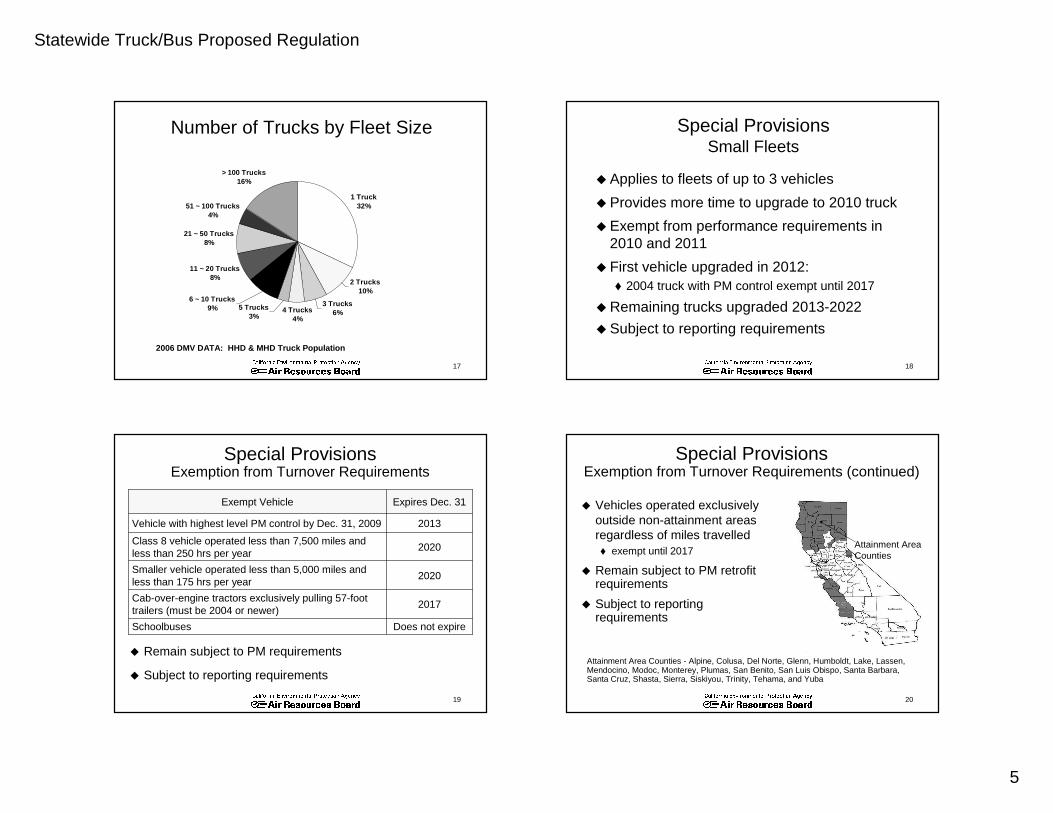
Number of Trucks by Fleet Size
1 Truck32%
2 Trucks10%
3 Trucks6%4 Trucks
4%
21 ~ 50 Trucks8%
51 ~ 100 Trucks4%
> 100 Trucks16%
6 ~ 10 Trucks9% 5 Trucks
3%
11 ~ 20 Trucks8%
2006 DMV DATA: HHD & MHD Truck Population
18
Special ProvisionsSmall Fleets
� Applies to fleets of up to 3 vehicles
� Provides more time to upgrade to 2010 truck
� Exempt from performance requirements in 2010 and 2011
� First vehicle upgraded in 2012:� 2004 truck with PM control exempt until 2017
� Remaining trucks upgraded 2013-2022
� Subject to reporting requirements
19
Special ProvisionsExemption from Turnover Requirements
2020Class 8 vehicle operated less than 7,500 miles and less than 250 hrs per year
Does not expireSchoolbuses
2017Cab-over-engine tractors exclusively pulling 57-foot trailers (must be 2004 or newer)
2020Smaller vehicle operated less than 5,000 miles and less than 175 hrs per year
2013Vehicle with highest level PM control by Dec. 31, 2009
Expires Dec. 31Exempt Vehicle
� Remain subject to PM requirements
� Subject to reporting requirements
20
Special Provisions Exemption from Turnover Requirements (continued)
� Vehicles operated exclusively outside non-attainment areas regardless of miles travelled� exempt until 2017
� Remain subject to PM retrofit requirements
� Subject to reporting requirements
Attainment Area Counties - Alpine, Colusa, Del Norte, Glenn, Humboldt, Lake, Lassen, Mendocino, Modoc, Monterey, Plumas, San Benito, San Luis Obispo, Santa Barbara, Santa Cruz, Shasta, Sierra, Siskiyou, Trinity, Tehama, and Yuba
Attainment Area Counties

Statewide Truck/Bus Proposed Regulation
6
21
Special Provisions (continued)
� Certain specialty farm vehicles exempt from PM requirements until 2017� Remain subject to NOx requirements
� Vehicles used fewer than 1,000 miles and less than 100 hours per year exempt from all clean up requirements
� Credits for hybrid vehicles expires in 2017
� Subject to reporting requirements
22
Additional Proposed ChangesTwo Engine Cranes
� Make two engine cranes subject to regulation for in-use off-road diesel fueled fleets (off-road regulation)� Both upper and lower engine
� Exempt from Portable engine and equipment registration requirements� Except for the opacity limits
� No longer be subject to the ATCM for diesel PM from portable engines
23
Additional Proposed Changes Public Agency and Utilities (PAU)
� Modify Diesel PM control measure for municipality or utility on-road heavy-duty diesel vehicles� Light heavy-duty engines would be subject to the
truck and bus rule unless the owner opts into the PAU regulation by December 31, 2008
� Include 2007 model-year or newer engines certified above the 0.01g/bhp-hr standard
24
Reporting
� Annual demonstration of compliance for all options except BACT schedule
� Owner contact information including motor carrier number
� Vehicle and engine information� Make, model, model year, VIN, License plate, engine
family, engine serial number, etc.� Emission control system information
� Mileage exemptions or NOx Exempt Area� Records from a tracking system, Highway Vehicle
Use Tax Return, other documentation

Statewide Truck/Bus Proposed Regulation
7
25
Enforcement
� Web based database for tracking vehicle records
� Provisions built into regulation to crosscheck other programs� DMV (registration/MCP), U.S. DOT, IRS
� Expand existing inspection efforts� Weigh stations, random roadside and fleet
� Audits of records� Additional resources needed
Emissions Benefits and Costs
27
Emissions Benefits
5.27812.3135Net Reduction
42%36%67%28%Percent Reduction
7.12606.2346With Proposed Regulation
12.333818.5481Baseline
PMNOxPMNOx
20202014Emissions (tons per day)
28
Statewide Truck and Bus Emissions
0
100
200
300
400
500
600
700
800
2010
2011
2012
2013
2014
2015
2016
2017
2018
2019
2020
2021
2022
2023
Calendar Year
Em
issi
ons
(ton
s pe
r da
y)NOx Emissions
With Proposed Regulation
NOx EmissionsWithout Regulation

Statewide Truck/Bus Proposed Regulation
8
29
Statewide Truck and Bus Emissions
0
5
10
15
20
25
3020
10
2011
2012
2013
2014
2015
2016
2017
2018
2019
2020
2021
2022
2023
Calendar Year
Em
issi
ons
(ton
s pe
r da
y)
PM EmissionsWith Proposed Regulation
PM EmissionsWithout Regulation
30
Preliminary Estimateof Statewide Costs
� Preliminary cost estimate ranges from $3.6 to $5.5 billion ($2008)
� Cost effectiveness� NOx: $5,000 to $7,800 per ton ($2 to $4 per lb)� PM: $74,000 to $113,000 per ton ($37 to $57 per lb)
� Greatest uncertainty with estimate of affected interstate fleet population
� Plan future workshop to discuss cost methodology and inputs
31
Cost Methodology and Inventory Workshop
� Planned for July 2008� Normal replacement costs compared to costs
with regulation� Vehicle replacement prices� Salvage value� Retrofit costs� Change in operating costs� Other input assumptions
� Affected population
32
Planned Emissions Inventory Improvement
� Verify model assumptions� Use field study data to validate the age distribution assumptions� Use field study data to improve estimates of inter-regional travel
and to accurately assess regional travel � Use historical truck sales, economic trends and other
information to project future sales of trucks and impact on future used truck availability and emissions
� Use addition economic trend data to improve growth estimates
� Enhance inventory detail� Currently split by GVWR class, body type, registration� Add separate categories for agricultural and Mexican trucks
� Improve benefits assessment� Account for fleet turnover behavior in fleet survey

Statewide Truck/Bus Proposed Regulation
9
33
Verified Exhaust RetrofitsFor On-Road Vehicles
$11,000 – $20,00085% PM (Active)
$18,000 – $22,00025% NOx and 85% PM
$18,000 – $22,00040% NOx and 85% PM
$9,000 - $11,00085% PM (Passive)
Installed CostControl Technology
34
Proposition 1B Incentives
� Administered locally by Air Districts and Ports
� $760 million for trucks operating exclusively in California and greater than 50% in trade corridors
� $222 million allocated for trucks in FY 2007-08
� Priority placed on retrofits and replacements� Up to $50,000 for truck replacement
� Up to $5,000 for a retrofit
� Projects must be completed before required to do so by a regulation http://arb.ca.gov/gmbond or (916) 444-6637
35
Potential Financing Solutions
� Low-interest financing being explored to assist with costs � Leverages private money� Spread out capital costs to fleets� Actual state investment can be modest
� ARB working closely with State Treasurer’s Office
� New revenue stream likely needed
36
Fleet Survey Information
� Details on over 900 companies� Over 7,500 vehicles� Close to 50% of respondents have one vehicle
Note: Per ARB survey data received on 6,356 HHD and 1,665 MHD vehicles
Vehicles <33,000Vehicles >33,000
9 2%7 21%>55,000
8 3%14 11%35,001 to 55,000
8 6%24 10%25,001 to 35,000
8 18%11 19%15,001 to 25,000
10 37%13 21%7,500 to 15,000
23 34%20 17%<7,500
AgePercentAgePercentTotal Miles Driven

Statewide Truck/Bus Proposed Regulation
10
37
Next Steps
� Workshop on cost methodology and emissions inventory July 2008
� Additional workshop on proposed regulation in August 2008
� Additional meetings with stakeholders
� Board consideration October 2008
38
Statewide Diesel Truck and Bus Regulation Contacts
Gloria Lindner, [email protected](916) 323-2803
Jackie [email protected](916) 323-2750
Ron [email protected](916) 327-0376
Erik White, ChiefHeavy-Duty Diesel In-Use Strategies [email protected](916) 322-1017
Tony Brasil, ManagerIn-Use Control Measures [email protected](916) 323-2927
Statewide Truck and Bus Regulation - www.arb.ca.gov/dieseltruckVerified Devices - www.arb.ca.gov/diesel/verdev/verdev.htm
39
Emissions Inventory Contacts
Todd Sax, ManagerRegulatory Support [email protected](916) 322-5474
Kathy Jaw, StaffRegulatory Support [email protected](916) 322-1720
www.arb.ca.gov/msei/onroad/onroad.htm