Proposed evaluation and repair procedures for precast, prestressed concrete … Journal... · ·...
26
Spring 2012 | PCI Journal 94 P recast, prestressed concrete bridge girders are widely used in the United States. Longitudinal web cracks, often called end-zone cracks, at the ends of pretensioned concrete girders are commonly observed at the time of strand detensioning, an event generally referred to as prestress transfer. During the past two decades, especially with the use of relatively high concrete strength, deep girders, and high levels of prestress, these cracks have become more noticeable. Longitudinal cracks will always develop in prestressed concrete girders if the bursting stresses generated by prestress transfer are greater than the tensile capacity of the concrete. Conventional rein- forcement is generally placed to keep crack widths within acceptable limits. In practice, there is no consistent understanding of the effect of end-zone cracking on the strength and durability of the girders. Thus, the decisions made by bridge owners vary from doing nothing to total rejection of the girders. Other reactions include debonding of strands at the girder ends, limiting prestress levels, reducing allowable com- pression stress at the time of prestress transfer, injecting grout into the cracks, and coating the girder ends with seal- ants. There is no consensus among owners on acceptance criteria for these longitudinal cracks. ■ Cracks often develop near the ends of prestressed concrete girders at release of prestress. ■ This paper examines the effects of these cracks on load capac- ity and durability, including field inspection of bridges in service. ■ Criteria are provided to assist bridge owners in deciding whether to accept girders with end-zone cracking as is, repair them, or reject them. ■ The paper also recommends repair materials and methods. Proposed evaluation and repair procedures for precast, prestressed concrete girders with end-zone cracking Christie J. Hasenkamp, Sameh S. Badie, Kromel E. Hanna, and Maher K. Tadros
Transcript of Proposed evaluation and repair procedures for precast, prestressed concrete … Journal... · ·...

Spr ing 2012 | PCI Journal94
Precast, prestressed concrete bridge girders are widely used in the United States. Longitudinal web cracks, often called end-zone cracks, at the ends of
pretensioned concrete girders are commonly observed at the time of strand detensioning, an event generally referred to as prestress transfer. During the past two decades, especially with the use of relatively high concrete strength, deep girders, and high levels of prestress, these cracks have become more noticeable. Longitudinal cracks will always develop in prestressed concrete girders if the bursting stresses generated by prestress transfer are greater than the tensile capacity of the concrete. Conventional rein-forcement is generally placed to keep crack widths within acceptable limits.
In practice, there is no consistent understanding of the effect of end-zone cracking on the strength and durability of the girders. Thus, the decisions made by bridge owners vary from doing nothing to total rejection of the girders. Other reactions include debonding of strands at the girder ends, limiting prestress levels, reducing allowable com-pression stress at the time of prestress transfer, injecting grout into the cracks, and coating the girder ends with seal-ants. There is no consensus among owners on acceptance criteria for these longitudinal cracks.
■ Cracks often develop near the ends of prestressed concrete girders at release of prestress.
■ This paper examines the effects of these cracks on load capac-ity and durability, including field inspection of bridges in service.
■ Criteria are provided to assist bridge owners in deciding whether to accept girders with end-zone cracking as is, repair them, or reject them.
■ The paper also recommends repair materials and methods.
Proposed evaluation and repair procedures for precast, prestressed concrete girders with end-zone cracking
Christie J. Hasenkamp, Sameh S. Badie, Kromel E. Hanna, and Maher K. Tadros

95PCI Journal | Spr ing 2012
Concerns regarding end-zone cracks are based on the pos-sibility of reduced structural capacity and durability due to strand and bar corrosion. End-zone cracks parallel to or intersecting the prestressing strands, reflecting strand locations, could cause debonding. This would result in an increase in transfer and development lengths, consequently reducing the shear and flexural capacity of the girder. Wide reflective cracks along strands exposed to chloride solutions may promote corrosion. Therefore, a thorough understanding of whether longitudinal web cracks are of structural significance was needed. If these cracks are not structurally significant, an understanding of their effects on durability was required.
Published guidelines regarding acceptance and repair criteria of prestressed concrete girders consider many types of cracking that may be reported but do not adequately address the uniqueness of end-zone cracking. Also, most of these guidelines are influenced by the criteria developed for flexural cracking in beams, which is fundamentally different in cause and effects from end-zone cracking. For example, flexural cracks in beams tend to grow in width and depth with the application of superimposed loads. In contrast, end-zone cracks tend to become narrower with the application of superimposed loads and the development of long-term prestress losses.
In 2005, research was conducted to develop a user’s manual for the acceptance, repair, or rejection of precast, prestressed concrete girders with longitudinal web crack-ing. National Cooperative Highway Research (NCHRP) re-port 6541 describes the results of this research. To achieve this objective, guidelines needed to be established for the following cracking categories:
• cracks that do not require repair
• cracks that require repair, including methods and materials of repair
• cracks that compromise the structural capacity and thus cause the girders to be rejected
The following work was conducted to achieve these objectives:
• Structural investigation and full-scale girder testing was conducted to study the effect of end-zone cracking on shear and flexural capacities and to investigate the performance of different amounts and details of end-zone reinforcement.
• Durability testing allowed researchers to investigate what repair method and material should be used, if repair is required, and whether the end-zone surface should be sealed with a surface sealant regardless of whether cracks are required to be filled with a patching material.
• Field inspections of bridges provided checks of the in-service condition of end-zone cracking changes with time. The field inspection was also used to investigate whether unrepaired end-zone cracking promotes cor-rosion of the reinforcement or delamination of the concrete.
Current criteria of crack control
The research team searched the literature for performance criteria and data on end-zone cracking in prestressed con-crete girders. The authors found that most of the available measures are related to flexural cracks in conventionally reinforced beams2–6 where maximum crack width varies from 0.002 in. to 0.016 in. (0.05 mm to 0.41 mm), depend-ing on the exposure condition.
Few publications dealing with end-zone cracking of pre-stressed concrete bridge girders were available. The major-ity of publications on end-zone cracking agree that crack width is the best basis for practical acceptance criteria. In 2006, PCI published the Manual for the Evaluation and Repair of Precast, Prestressed Concrete Bridge Products.7 The objective of the report was to achieve a greater degree of uniformity among owners, engineers, and precast con-crete producers with respect to the evaluation and repair of precast, prestressed concrete bridge beams. The report recognizes end-of-beam cracking in Troubleshooting, Item 4. A summary of the report findings and recommendations follows:
• Cracks that intercept or are collinear with strands but without evidence of strand slippage, such as signifi-cant retraction of strand into the beam end, should be injected with epoxy.
• Cracks that intercept or are collinear with strands with evidence of strand slippage should be injected with epoxy, and a recomputation of stresses after shift-ing the transfer and development length of affected strands should be conducted.
The report uses the crack widths developed in American Concrete Institute’s ACI Manual of Concrete Practice, Part 2 (ACI 224R-01)6 as guidelines for whether to inject cracks with epoxy. Table 1 summarizes the repair crite-ria. The report recognizes that such cracks do not grow once the beam is installed in a bridge. On the contrary, the cracks will close to some extent due to dead and live loads as end reactions provide a clamping force. However, the report does not give any guidelines on when to reject a beam with end cracks.

Spr ing 2012 | PCI Journal96
Crack control criteria received from the national survey
The literature search showed that there is no widely accept-ed unified approach or criteria for use by highway authori-ties in the United States. Therefore, a survey was devel-oped to collect data on experiences regarding longitudinal end-zone cracking. The survey was sent to state highway authorities, bridge consultants, precast concrete produc-ers, and members of the PCI Bridges Committee and the PCI Bridge Producers Committee. It included questions on reinforcement details, strand release, criteria for repair and rejection of cracked members, and repair methods. Ques-tion 10 of the survey asked about established criteria for when to repair end-zone cracking. Table 2 summarizes the results. The majority of state highway authorities, 36 out of 41 responses, stated that crack width is their sole criterion. Also, the majority of the respondents who recommend us-ing epoxy injection to repair end-zone cracking believe that their repair methods do not restore the tensile capacity of the member but serve only to protect the beam reinforce-ment against corrosion.
In regard to rejecting a girder due to end-zone cracking, most responses stated that they deal with the beams on a case-by-case basis, considering the width, length, and number of cracks and their proximity to one another. Most stated that rejection is rare or they have not known of a
beam rejected because of end-zone cracking. The survey showed that it is a common belief among design engineers, precast concrete producers, and contractors that repaired girders can be used as long as the end-zone cracks are sealed and the cracked part of the girder is embedded in the diaphragm. Also, many respondents believe that these cracks will close to some extent after the beam is installed in a bridge due to the weight of the deck slab and barri-ers. This is because the orientation of the end-zone cracks is perpendicular to the direction of shear cracks, which means that the end-zone cracks will be subjected to diago-nal compressive stresses that help to close them.
Structural investigation of full-scale girders
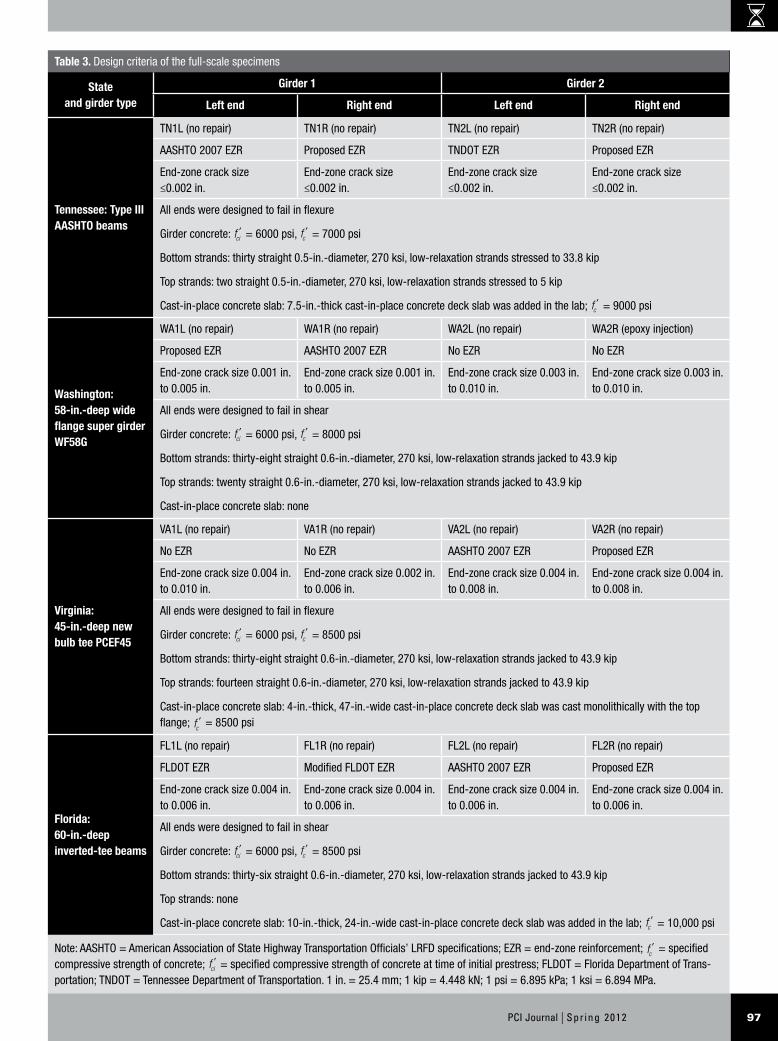
The objective of the full-scale girder testing was to investi-gate whether end-zone cracking negatively affects the flex-ural and shear capacities of prestressed concrete girders. The test plan included eight 42-ft-long (13 m) full-scale girders fabricated in four states with different end-zone reinforcement details. One precast concrete producer was selected from each of four states: Tennessee (TN), Florida (FL), Virginia (VA), and Washington (WA). Each precast concrete producer agreed to fabricate two specimens as part of an actual bridge girder project. Table 3 summarizes the details of the eight specimens, which include the girder type, end-zone reinforcement details, end-zone crack size, material properties, and number of prestress strands. Specimens are listed in the order that they were fabricated and tested.
Among the end-zone reinforcement details used on the eight specimens were the American Association of State Highway and Transportation Officials’ (AASHTO’s) LRFD Bridge Design Specifications, 4th Edition—2008 Interim Revisions8 detail and a proposed detail. The pro-posed detail was developed by the research team based on research conducted by Tuan et al.9 The AASHTO LRFD specifications and proposed details recommend that the end-zone reinforcement be designed to resist 4% of the total prestressing force at transfer and that the reinforce-ment should be designed for a service stress not exceeding 20 ksi (140 MPa). The AASHTO LRFD specifications state that this reinforcement should be distributed within one-fourth of the depth of the girder from the end of the girder, while the proposed detail recommends that 50% of this reinforcement be placed within one-eighth of the depth of the girder from the end of the beam and the remainder should be placed between one-eighth and one-half of the girder depth from the end. Figures 1 through 4 give details of the end-zone reinforcement of the eight specimens.
To test the first end of a specimen, the specimen was sup-ported at 6 in. (150 mm) from both ends, leaving an unsup-ported length of 41 ft (12.5 m). A load setup was applied at 12 ft (3.7 m) from the end being tested and 30 ft (9.1 m)
Table 2. Responses to question 10 of the national survey
Crack width, in. Action
<0.007 Surface sealing
0.007 to 0.025 Epoxy injection
>0.025 Reject beam
Source: Tadros, M. K., S. S. Badie, and C. Y. Tuan, National Cooperative Highway Research Project NCHRP 18-14. 2010. Evaluation and Repair Procedures for Precast/Prestressed Concrete Girders with Longitudi-nal Cracking in the Web. Report 654. Washington, DC: Transportation Research Board.Note: 1 in. = 25.4 mm.
Table 1. End-of-beam cracks that should be injected
Exposure condition Crack width, in.
Concrete exposed to humidity >0.012
Concrete subjected to deicing chemicals >0.007
Concrete exposed to seawater and seawater spray, wetting and drying cycles
>0.006
Source: PCI 2006.Note: 1 in. = 25.4 mm.
97PCI Journal | Spr ing 2012
Table 3. Design criteria of the full-scale specimens
State and girder type
Girder 1 Girder 2
Left end Right end Left end Right end
Tennessee: Type III AASHTO beams
TN1L (no repair) TN1R (no repair) TN2L (no repair) TN2R (no repair)
AASHTO 2007 EZR Proposed EZR TNDOT EZR Proposed EZR
End-zone crack size ≤0.002 in.
End-zone crack size ≤0.002 in.
End-zone crack size ≤0.002 in.
End-zone crack size ≤0.002 in.
All ends were designed to fail in flexure
Girder concrete: fcil = 6000 psi, fcl = 7000 psi
Bottom strands: thirty straight 0.5-in.-diameter, 270 ksi, low-relaxation strands stressed to 33.8 kip
Top strands: two straight 0.5-in.-diameter, 270 ksi, low-relaxation strands stressed to 5 kip
Cast-in-place concrete slab: 7.5-in.-thick cast-in-place concrete deck slab was added in the lab; fcl = 9000 psi
Washington: 58-in.-deep wide flange super girder WF58G
WA1L (no repair) WA1R (no repair) WA2L (no repair) WA2R (epoxy injection)
Proposed EZR AASHTO 2007 EZR No EZR No EZR
End-zone crack size 0.001 in. to 0.005 in.
End-zone crack size 0.001 in. to 0.005 in.
End-zone crack size 0.003 in. to 0.010 in.
End-zone crack size 0.003 in. to 0.010 in.
All ends were designed to fail in shear
Girder concrete: fcil = 6000 psi, fcl = 8000 psi
Bottom strands: thirty-eight straight 0.6-in.-diameter, 270 ksi, low-relaxation strands jacked to 43.9 kip
Top strands: twenty straight 0.6-in.-diameter, 270 ksi, low-relaxation strands jacked to 43.9 kip
Cast-in-place concrete slab: none
Virginia: 45-in.-deep new bulb tee PCEF45
VA1L (no repair) VA1R (no repair) VA2L (no repair) VA2R (no repair)
No EZR No EZR AASHTO 2007 EZR Proposed EZR
End-zone crack size 0.004 in. to 0.010 in.
End-zone crack size 0.002 in. to 0.006 in.
End-zone crack size 0.004 in. to 0.008 in.
End-zone crack size 0.004 in. to 0.008 in.
All ends were designed to fail in flexure
Girder concrete: fcil = 6000 psi, fcl = 8500 psi
Bottom strands: thirty-eight straight 0.6-in.-diameter, 270 ksi, low-relaxation strands jacked to 43.9 kip
Top strands: fourteen straight 0.6-in.-diameter, 270 ksi, low-relaxation strands jacked to 43.9 kip
Cast-in-place concrete slab: 4-in.-thick, 47-in.-wide cast-in-place concrete deck slab was cast monolithically with the top flange; fcl = 8500 psi
Florida: 60-in.-deep inverted-tee beams
FL1L (no repair) FL1R (no repair) FL2L (no repair) FL2R (no repair)
FLDOT EZR Modified FLDOT EZR AASHTO 2007 EZR Proposed EZR
End-zone crack size 0.004 in. to 0.006 in.
End-zone crack size 0.004 in. to 0.006 in.
End-zone crack size 0.004 in. to 0.006 in.
End-zone crack size 0.004 in. to 0.006 in.
All ends were designed to fail in shear
Girder concrete: fcil = 6000 psi, fcl = 8500 psi
Bottom strands: thirty-six straight 0.6-in.-diameter, 270 ksi, low-relaxation strands jacked to 43.9 kip
Top strands: none
Cast-in-place concrete slab: 10-in.-thick, 24-in.-wide cast-in-place concrete deck slab was added in the lab; fcl = 10,000 psi
Note: AASHTO = American Association of State Highway Transportation Officials’ LRFD specifications; EZR = end-zone reinforcement; fcl = specified compressive strength of concrete; fcil = specified compressive strength of concrete at time of initial prestress; FLDOT = Florida Department of Trans-portation; TNDOT = Tennessee Department of Transportation. 1 in. = 25.4 mm; 1 kip = 4.448 kN; 1 psi = 6.895 kPa; 1 ksi = 6.894 MPa.

Spr ing 2012 | PCI Journal98
provided by using a hydraulic jack attached to a self-equilib-rium frame built around the specimen (Fig. 6). The clamp-ing force was calculated as the balance between the reaction developed by the actual bridge girder (due to the weight of the slab, barrier, wearing surface, and utilities) and the reac-tion generated by the 42-ft-long (13 m) specimen.
The testing load was applied at a rate of 5 kip/sec (22 kN/sec) in stages of 100 kip (445 kN) until the estimated failure load was reached. After each additional increment of 100 kip, the loading was paused so that the girder could
from the other end. Once the test on this end was complete, the support on this end was moved 12 ft inside the speci-men and the load setup was placed 12 ft from the second support (Fig. 5). This setup enabled testing both ends of every specimen without any effect from the tested end on the performance of the second end of the specimen.
A clamping force mechanism was provided in the test setup at 30 in. (760 mm) away from the girder end being tested in order to simulate the dead loads that are applied after a girder is installed in a bridge. The clamping force was
Figure 1. End-zone reinforcement details. Note: no. 3 = 10M; no. 4 = 13M; no. 5 = 16M; no. 6 = 19M; no. 8 = 25M; 1 in. = 25.4 mm; 1 ft = 0.305 m.
1 in
.
5 in
.
3 in
.
6 pairs of no. 6
5 no. 3at 6 in.
41/2 in. 3 no. 5 projecting 6 in.
5 sp
aces
at 3
in.
4 pairsof no. 6
10 spaces at 6 in.
4 pairs of no. 6
3 sp
aces
at 2
in.
3 sp
aces
at 6
in.
6 in. spacing
Pairs of no. 5
11/2 in.
12 no. 3at 3 in.and 12 no. 3at 3 in.
3 ft
9 in
.
3 in
.
41/2 in.
4 pairs of no. 6
12 no. 3at 6 in.and 12 no. 3at 6 in.
2 sp
aces
at 3
in.
2 sp
aces
at 4
1 / 2 in
.
3 ft
9 in
.
1 in
.
3 sp
aces
at 2
in.
5 in
.
11/2 in.
Pairs of no. 5 at 6 in.
4 pairs ofno. 6
12 no. 3at 3 in.and 12 no. 3at 3 in.
TN1L (AASHTO LRFD specifications) End of TN1R (proposed)
End of TN2L (TN) End of TN2R (proposed)

99PCI Journal | Spr ing 2012
be checked and marked for cracks. Once the estimated failure load was reached, the loading was stopped, the girder was checked for signs of failure, and the cracks were marked. Then the loading was resumed until failure was reached.
The failure load was calculated using the measured mate-rial properties of the concrete cylinders made during fabrication of the specimens and the coupons taken of the reinforcing bars. In some cases, failure could not be reached because the failure load was beyond the capacity of the loading frame.
The maximum point load that could be applied by the loading frame was 800 kip (3600 kN) for the Tennessee and Washington specimens and 1200 kip (5300 kN) for the Virginia and Florida specimens. NCHRP report 654 has more details about the testing of all specimens.
Test results
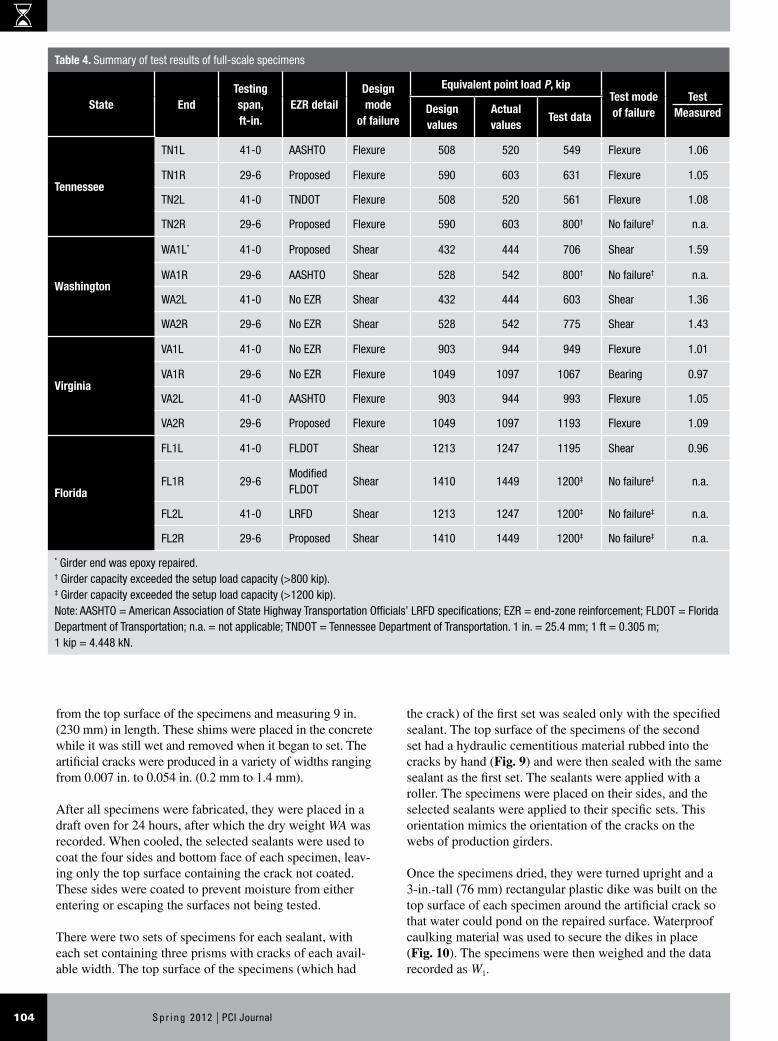
Table 4 summarizes the test results. The table gives the mode of failure and the corresponding failure load.
The following system was developed to designate the girder ends. The first two letters refer to the state (TN, WA, VA, and FL). The number after the first two letters gives the girder number (1 for the first girder and 2 for the second girder). The last letter indicates the girder end (L for the left end and R for the right end).
From the test results, the following conclusions were reported:
• End-zone cracking has no effect on the shear or flex-ural capacity of the tested girders. Fourteen ends (out of the sixteen ends tested) were able to develop shear/flexure capacity higher than design capacity. Only
Figure 2. End-zone reinforcement details. Note: no. 3 = 10M; no. 4 = 13M; no. 6 = 19M; no. 8 = 25M; 1 in. = 25.4 mm; 1 ft = 0.305 m.
2 in.
Pairs of no. 314 spaces at 6 in.
2 in. Pairs of no. 4 at 12 in.
3 in.Pairs of no. 314 spaces at 6 in.3 in.
4 ft
10 in
.
No. 8 C-barand2 no. 6
5 sp
aces
at
21 / 2
in.
3 in. Pairs of no. 314 spaces at 6 in.
8 spaces at 3 in.
2 no. 6
11/2 in. Pairs of no. 4 at 12 in. Pairs of no. 4
4 ft
10 in
.
12 in.11/2 in.
3 in.Pairs of no. 314 spaces at 6 in.
Pairs of no. 6
End of WA1L (proposed) End of WA1R (AASHTO LRFD specifications)
End of WA2L (no end-zone reinforcement) End of WA2R (no end-zone reinforcement)

Spr ing 2012 | PCI Journal100
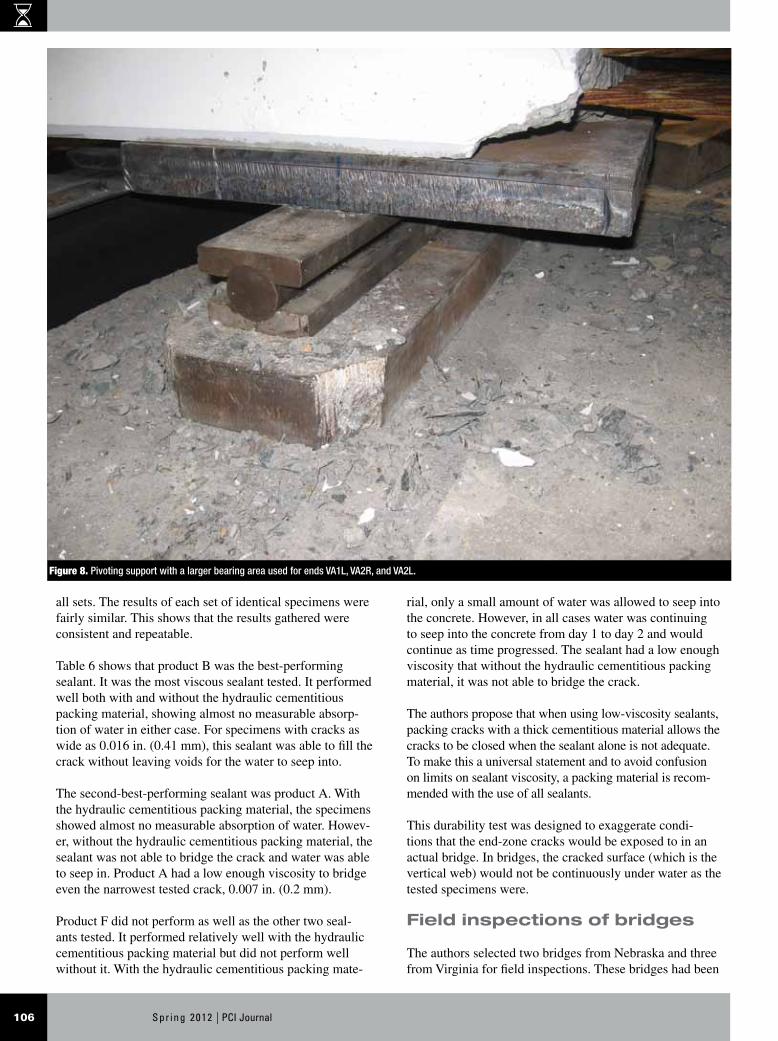
two ends, VA1R and FL1L, did not develop the mea-sured capacity due to fabrication flaws. End VA1R was the first Virginia end tested, and it failed prema-turely due to inadequate bearing area (Fig. 7). This occurrence prompted the team to devise a pivoting support with a larger bearing area (Fig. 8). As a result, the three remaining ends of the VA specimens failed in flexure as designed, where all ends sustained loads higher than their design capacities. End FL1L failed prematurely in shear due to a mix-up at the precast concrete plant that caused this end of the girder to
contain only half the amount of shear reinforcement requested.
• End-zone reinforcement appears not to have any effect on the shear or flexural capacities of a girder. Three ends (out of four) that contained no additional end-zone reinforcement were able to develop failure capacity higher than the design values. Only end VA1R failed prematurely due to inadequate bearing area, as discussed earlier. The authors believe that providing adequate confinement reinforcement in the
Figure 3. End-zone reinforcement details. Note: no. 4 = 13M; no. 5 = 16M; no. 6 = 19M; no. 8 = 25M; 1 in. = 25.4 mm; 1 ft = 0.305 m.
11/2 in.
61/2 in.
6 pairsof no. 6at 2 in.
11/2 in.
No. 421/2 in.
12 in. spacing 21/2 in.7 spaces at 4 in.
4 sp
aces
at
2 in
.3
in.
10 in. 4 in. 2 spaces at 4 in.Pairs of no. 5 at 4 in.
2 pairsof no. 5at 2 in.
No. 8 C-clampand 2 no. 6
3 in
.2
in.
No. 4 at 12 in. 71/2 in.
4 ft
1 in
.
6 spaces at 4 in.
4 ft
1 in
.71/2 in.
Pairs of no. 5 at 4 in.
No. 4 at 12 in.
11/2 in.
31/2 in. No. 4 at 12 in. No. 4 at 4 in.
11/2 in.
31/2 in.No. 4 at 4 in.
71/2 in.
End of VA1L (no end-zone reinforcement) End of VA1R (no end-zone reinforcement)
End of VA2L (AASHTO LRFD specifications) End of VA2R (proposed)

101PCI Journal | Spr ing 2012
Durability testing
The durability testing consisted of two stages. The objec-tive of the first stage was to investigate which sealant mate-rial should be used if repair is required.
The objective of the second stage was to investigate whether it is required that end-zone cracks be filled with a patching material before a surface sealant is applied.
bottom flange at the end of the girder and anchoring some of the bottom-flange strands in the end dia-phragm provide the girder with the tension tie required to develop the design shear and flexural capacities at the girder end.
• Epoxy injection repair of end-zone cracking does not enhance girder capacity. This can be seen by compar-ing end WA1L (which was repaired) with end WA1R (which was not repaired).
Figure 4. End-zone reinforcement details. Note: no. 3 = 10M; no. 4 = 13M; no. 5 = 16M; no. 6 = 19M; 1 in. = 25.4 mm.
4 in. spacing
Six no. 6 bars full length
Pairs ofno. 5 11 / 2
in. 5 spaces
at 3 in.
11 / 2 in
.11/2 in.
6 in. spacing 6 spacesat 3 in. 11 / 2
in.Pairs of
no. 3
5 spaces at 2 in.
No. 4 bars
6 in. spacing
Six no. 6 bars full length
5 pairs ofno. 5 L-shape and no. 4 straight
6 spaces at 3 in.
Pairs ofno. 3
11 / 2 in
.
11 / 2 in
.
6 spaces at 3 in.
11/2 in. 3 in. spacing 3 sp
aces
at
2 in
.
2 sp
aces
at
3 in
.
11 / 2 in
.
Pairs ofno. 5
6 in. spacing
End of FL1L (FDOT) End of FL1R (modified FDOT)
End of FL2L (AASHTO LRFD specifications) End of FL2R (proposed)

Spr ing 2012 | PCI Journal102
Water Absorption of Hardened Concrete Treated with a Water Repellant Coating.10 Five sealants were selected:
• Product A: low-viscosity methacrylate resin.
Stage 1
The test procedure was a slightly modified version of the ASTM D6489 Standard Test Method for Determining the
Figure 5. Support and loading arrangement of the full-scale specimens. Note: P = load. 1 in. = 25.4 mm; 1 ft = 0.305 m.
7.119P, kip-ft
0.41P
0.59P
Location of the clamping force
30 in.
12 ft 29 ft 6 in. 6 in.
12 ft17 ft 6 in.
P
Bending moment diagram
Shear force diagram
6 in. 11 ft 6 in. 29 ft 6 in. 6 in.41 ft
8.274P, kip-ft
0.72P
0.28P
Bending moment diagram
Shear force diagram
Location of the clamping force
30 in. P
Test setup for the first end
Test setup for the second end

103PCI Journal | Spr ing 2012
• Product B: water-based epoxy modified portland ce-ment bonding agent with anticorrosion coating.
• Product C: cement-based filler.
• Product D: high molecular weight methacrylate resin.
• Product E: cementitious crystalline sealant.
These sealants were chosen based on the responses to the national survey and recommendations from the precast concrete producers that fabricated the full-scale girder specimens. Sixty 4 in. × 8 in. (100 mm × 200 mm) con-crete cylinders were produced, ten cylinders for every seal-ant and ten cylinders for a control group, which received no coating.
After the cylinders were cured for 28 days, they were washed and cleaned of debris and then heated in a draft oven for 24 hours. They were then coated with the selected sealants. All of the specimens were then immersed com-pletely in water and left to soak. At 24 hours and again at 96 hours, the specimens were towel dried and weighed. By weighing the specimens before and after submersion, the percentage of absorption A% was calculated and averaged for each sealant type.
Table 5 gives a summary of the average percentage of ab-sorption A% for each sealant at 24 hours and 96 hours, as
well as the standard deviation and variance. The table also gives the observations reported during application of the sealants. The five sealants were rated based on the absorp-tion results and ease of application. The top-performing sealants retained for stage 2 of the durability testing were products A, B, and D.
Stage 2
In the second stage of the durability test, the authors ob-served how assorted sealants performed in limiting water penetrating into concrete specimens exhibiting various sizes of cracks. The procedure of the test was modified from the two ASTM standards: G109-99a Standard Test Method for Determining the Effects of Chemical Admix-tures on the Corrosion of Embedded Steel Reinforcement in Concrete Exposed to Chloride Environments11 and D6489-99 Standard Test Method for Determining the Wa-ter Absorption of Hardened Concrete Treated with a Water Repellent Coating.10
The concrete specimens were made in the form of 3 in. × 3 in. × 12 in. (76 mm × 76 mm × 300 mm) rectangular prisms. The design concrete strength was 5000 psi (34 MPa). Although this concrete mixture is relatively more porous than that normally used in precast concrete girders, it was used to amplify the amount of water absorbed if the sealants failed. Artificial cracks were formed with met-al and plastic shims, penetrating down 2.25 in. (57.2 mm)
Figure 6. Location of the point load and clamping mechanism.
12 ft2 ft 6 in.
6 in. P
Hydraulic jack
2 threaded rods
Back-to-back channels
Heavy duty nut
Heavy duty nutBack-to-back channels
Spr ing 2012 | PCI Journal104
from the top surface of the specimens and measuring 9 in. (230 mm) in length. These shims were placed in the concrete while it was still wet and removed when it began to set. The artificial cracks were produced in a variety of widths ranging from 0.007 in. to 0.054 in. (0.2 mm to 1.4 mm).
After all specimens were fabricated, they were placed in a draft oven for 24 hours, after which the dry weight WA was recorded. When cooled, the selected sealants were used to coat the four sides and bottom face of each specimen, leav-ing only the top surface containing the crack not coated. These sides were coated to prevent moisture from either entering or escaping the surfaces not being tested.
There were two sets of specimens for each sealant, with each set containing three prisms with cracks of each avail-able width. The top surface of the specimens (which had
the crack) of the first set was sealed only with the specified sealant. The top surface of the specimens of the second set had a hydraulic cementitious material rubbed into the cracks by hand (Fig. 9) and were then sealed with the same sealant as the first set. The sealants were applied with a roller. The specimens were placed on their sides, and the selected sealants were applied to their specific sets. This orientation mimics the orientation of the cracks on the webs of production girders.
Once the specimens dried, they were turned upright and a 3-in.-tall (76 mm) rectangular plastic dike was built on the top surface of each specimen around the artificial crack so that water could pond on the repaired surface. Waterproof caulking material was used to secure the dikes in place (Fig. 10). The specimens were then weighed and the data recorded as W1.
Table 4. Summary of test results of full-scale specimens
State EndTesting span, ft-in.
EZR detailDesign mode
of failure
Equivalent point load P, kipTest mode of failure
Test MeasuredDesign
valuesActual values
Test data
Tennessee
TN1L 41-0 AASHTO Flexure 508 520 549 Flexure 1.06
TN1R 29-6 Proposed Flexure 590 603 631 Flexure 1.05
TN2L 41-0 TNDOT Flexure 508 520 561 Flexure 1.08
TN2R 29-6 Proposed Flexure 590 603 800† No failure† n.a.
Washington
WA1L* 41-0 Proposed Shear 432 444 706 Shear 1.59
WA1R 29-6 AASHTO Shear 528 542 800† No failure† n.a.
WA2L 41-0 No EZR Shear 432 444 603 Shear 1.36
WA2R 29-6 No EZR Shear 528 542 775 Shear 1.43
Virginia
VA1L 41-0 No EZR Flexure 903 944 949 Flexure 1.01
VA1R 29-6 No EZR Flexure 1049 1097 1067 Bearing 0.97
VA2L 41-0 AASHTO Flexure 903 944 993 Flexure 1.05
VA2R 29-6 Proposed Flexure 1049 1097 1193 Flexure 1.09
Florida
FL1L 41-0 FLDOT Shear 1213 1247 1195 Shear 0.96
FL1R 29-6Modified FLDOT
Shear 1410 1449 1200‡ No failure‡ n.a.
FL2L 41-0 LRFD Shear 1213 1247 1200‡ No failure‡ n.a.
FL2R 29-6 Proposed Shear 1410 1449 1200‡ No failure‡ n.a.
* Girder end was epoxy repaired.† Girder capacity exceeded the setup load capacity (>800 kip).‡ Girder capacity exceeded the setup load capacity (>1200 kip).Note: AASHTO = American Association of State Highway Transportation Officials’ LRFD specifications; EZR = end-zone reinforcement; FLDOT = Florida Department of Transportation; n.a. = not applicable; TNDOT = Tennessee Department of Transportation. 1 in. = 25.4 mm; 1 ft = 0.305 m; 1 kip = 4.448 kN.

105PCI Journal | Spr ing 2012
results of this step showed clearly that the sealants were not able to bridge wide cracks, 0.033 in. and 0.054 in. (0.84 mm and 1.4 mm), unless the cracks were filled be-fore sealing. Also, this step enabled the authors to identify the three top-performing sealants, which reported the lowest absorption. These sealants were products A, B, and F, which were retained for the second step. The results of this step were consistent with the results of stage 1, except that product D, which was rated third in stage 1, was out-performed by product F, where the latter reported a lower absorption and was more amenable to vertical application.
The second step of testing included 69 specimens and 4 crack sizes (0.007 in., 0.016 in., 0.033 in., and 0.054 in. [0.2 mm, 0.41 mm, 0.84 mm, and 1.4 mm]). Table 6 shows the details of this step where three specimens were made for each set. For crack widths 0.033 in. and 0.54 in. (0.84 mm and 1.4 mm), all specimens were first filled with the hydraulic cementitious packing material.
Readings were taken at 24 hours and 48 hours, and the absorption A% for each specimen was determined. Table 6 gives the average absorption at 24 hours and 48 hours of
The specimens were all placed face up in an area where they would not be disturbed. Each dike was then filled to the top with water. The specimens were given the opportu-nity to absorb water for 24 hours. Every effort was made to ensure that the dike remained filled with water at all times. At 24 hours, the water in each dike was emptied. Then the specimens were towel dried. The weight of each sample was measured and recorded as W2. The percentage of water absorption A% by each sample was calculated using Eq. (1):
A% = W
W W100
A
2 1-a k
(1)
Stage 2 was conducted in two identical steps. The first step was conducted on 46 specimens using the four sealants, five crack sizes (0.007 in., 0.012 in., 0.016 in., 0.033 in., and 0.054 in. [0.2 mm, 0.30 mm, 0.41 mm, 0.84 mm, and 1.4 mm]), and a control group that did not receive any sealant coating. The sealants used for this step were the top three sealants from stage 1 and another sealant, product F alkyl trialkoxysilane, which was recommended by mem-bers of the review panel of the NCHRP 18-14 project. The
Figure 7. Premature failure of end VA1R due to inadequate bearing area.
Spr ing 2012 | PCI Journal106
rial, only a small amount of water was allowed to seep into the concrete. However, in all cases water was continuing to seep into the concrete from day 1 to day 2 and would continue as time progressed. The sealant had a low enough viscosity that without the hydraulic cementitious packing material, it was not able to bridge the crack.
The authors propose that when using low-viscosity sealants, packing cracks with a thick cementitious material allows the cracks to be closed when the sealant alone is not adequate. To make this a universal statement and to avoid confusion on limits on sealant viscosity, a packing material is recom-mended with the use of all sealants.
This durability test was designed to exaggerate condi-tions that the end-zone cracks would be exposed to in an actual bridge. In bridges, the cracked surface (which is the vertical web) would not be continuously under water as the tested specimens were.
Field inspections of bridges
The authors selected two bridges from Nebraska and three from Virginia for field inspections. These bridges had been
all sets. The results of each set of identical specimens were fairly similar. This shows that the results gathered were consistent and repeatable.
Table 6 shows that product B was the best-performing sealant. It was the most viscous sealant tested. It performed well both with and without the hydraulic cementitious packing material, showing almost no measurable absorp-tion of water in either case. For specimens with cracks as wide as 0.016 in. (0.41 mm), this sealant was able to fill the crack without leaving voids for the water to seep into.
The second-best-performing sealant was product A. With the hydraulic cementitious packing material, the specimens showed almost no measurable absorption of water. Howev-er, without the hydraulic cementitious packing material, the sealant was not able to bridge the crack and water was able to seep in. Product A had a low enough viscosity to bridge even the narrowest tested crack, 0.007 in. (0.2 mm).
Product F did not perform as well as the other two seal-ants tested. It performed relatively well with the hydraulic cementitious packing material but did not perform well without it. With the hydraulic cementitious packing mate-
Figure 8. Pivoting support with a larger bearing area used for ends VA1L, VA2R, and VA2L.

107PCI Journal | Spr ing 2012
Table 5. Summary of percentage of absorption A% of all sealants at 24 and 96 hours
Sealant
Absorption
Notes Rating*Average, standard deviation,
and variance
24 hours 96 hours
Control set
Average % 2.720 2.840
No coating was applied. n.a.Standard deviation
0.190 0.199
Variance 0.036 0.040
Product A: low-viscosity methacrylate resin
Average % 0.350 0.580Performed well on vertical surfaces, such as girder webs, and did not flow off.
High workability and easy mixing procedure.
The chemical is highly volatile and produces harsh, potentially dangerous fumes.
1Standard deviation
0.195 0.273
Variance 0.038 0.074
Product B: water-based epoxy modified portland cement bonding agent with anticorrosion coating
Average % 0.480 0.770 The mixture requires the blending of three separate chemicals.
The mixture is nonvolatile and does not give off any harmful fumes.
The product is viscous, making it difficult to apply a thin coating. Once dry, the product is rough and cementlike in texture, giving the impression of being porous.
2Standard deviation
0.112 0.177
Variance 0.012 0.031
Product C: cement-based filler
Average % 1.480 1.560 As a liquid, the product is thick and easy to apply by hand.
When dry, the coating could easily be rubbed away and was also water absorbent.
Due to its cement base, it is not intended to be a waterproofing sealant.
3Standard deviation
0.118 0.122
Variance 0.014 0.015
Product D: high molecular weight methacrylate resin
Average % 2.410 2.790 When the three components are combined, they may produce skin irritation and will give off harsh, volatile fumes.
Due to the ultra-low viscosity of the product, it easily flowed off of the surface before setting up. It is not effective for vertical application on the webs of precast concrete girders.
4Standard deviation
0.219 0.226
Variance 0.048 0.051
Product E: cementitious crystalline sealant
Average % 3.070 3.320 It is mixed with water and can be made into different consistencies to match the application method.
Requires initial saturation of the surface and moist curing procedure.
5Standard deviation
0.199 0.219
Variance 0.040 3.048
* 1 = best, 5 = worstNote: n.a. = not applicable.

Spr ing 2012 | PCI Journal108
examine the repair method and material, collections of inspection reports of the bridges in service, and visits to the bridges under study to report on visible signs of crack growth since production and signs of reinforcement corro-sion and concrete delamination.
It was difficult to collect the inspection reports conducted at the fabrication plants of most of the selected bridges. The fabrication plants do not retain these reports for an ex-tended period, assuming that it is the responsibility of the bridge owner to maintain such records. On the other hand, the bridge owners do not keep these records if no serious problems were detected in the girders before shipping them to the bridge site.
At the precasting plant, the inspectors are usually looking for imperfections or visible damage to the girders, such as sweep, excessive deflection, chipping of concrete, and so forth. End-zone cracking, if present, is not typically re-corded in these reports as long as the cracks do not exceed acceptable limits mandated by the owner and the inspector feels that they are not severe enough to be repaired.
in service for three to five years at the time of inspection. The objectives of the field inspections were to determine whether end-zone cracking widens with time and whether unrepaired end-zone cracks lead to corrosion of the strands and bars. The inspection process included collections of reports of inspection conducted at the fabrication plant to
Figure 9. Hand application of the hydraulic cementitious material.
Figure 10. Specimens with water dams.

109PCI Journal | Spr ing 2012
repaired in the fabrication plant it would not be easy to locate the girder in the bridge to see whether the original damage was causing any problems.
Based on the field inspection conducted on the five bridges in Nebraska and Virginia, the following conclusions were made:
• Crack width was in the range of 0.006 in. to 0.020 in. (0.15 mm to 0.50 mm). Comparing the crack widths at the time of our inspection with those documented in the inspection reports revealed no growth.
• Four of the five bridges were built over water chan-nels, where the ambient air is humid for an extended period in the summer. Field inspection of these bridg-es did not reveal any visible signs of reinforcement corrosion or concrete delamination, though end-zone cracking had existed at the time of prestress release.
After the selected bridges were opened to traffic, they were inspected every two years. The field inspectors typically look for visible signs of damage and distress that might af-fect durability and service conditions, such as deck crack-ing and damage to bearing devices. The field inspection reports are typically well maintained by the bridge owner. The authors found that end-zone cracking was recorded in the field inspection reports in four out of the five selected bridges, but in an ambiguous way. For example, instead of giving the crack width, the reports stated: hairline cracks exist. Length and pattern of the cracks were not recorded for future follow-up and comparison. As a result, in some cases it was hard to know whether the recorded cracks were end-zone cracks or vertical shear cracks.
Also, the authors found it difficult to trace a specific girder from the precast concrete plant to the construction site because the girder producer and the bridge owner used different identification systems. Therefore, if a girder was
Table 6. Summary of percentage of absorption A% for the durability test, stage II (step 2)
Crack width,
in.
Control set
Product A Product B Product F
With hydraulic cementitious
material
Without hydraulic
cementitious material
With hydraulic cementitious
material
Without hydraulic
cementitious material
With hydraulic cementitious
material
Without hydraulic
cementitious material
Number of specimens
n.a. 3 n.a. n.a. n.a. n.a. n.a. n.a.
A% at 24 hours 0.000 2.280 n.a. n.a. n.a. n.a. n.a. n.a.
A% at 48 hours 0.000 2.886 n.a. n.a. n.a. n.a. n.a. n.a.
Number of specimens
n.a. 3 3 3 3 3 3 3
A% at 24 hours 0.007 4.014 0.001 2.318 0.000 0.000 0.155 2.416
A% at 48 hours 0.007 4.375 0.000 2.783 0.000 0.000 0.195 3.462
Number of specimens
n.a. 3 3 3 3 3 3 3
A% at 24 hours 0.016 4.663 0.001 2.696 0.000 0.000 0.081 2.332
A% at 48 hours 0.016 4.839 0.000 2.907 0.000 0.000 0.106 2.912
Number of specimens
n.a. 3 3 n.a. 3 n.a. 3 n.a.
A% at 24 hours 0.033 4.594 0.000 n.a. 0.000 n.a. 0.097 n.a.
A% at 48 hours 0.033 4.772 0.000 n.a. 0.000 n.a. 0.137 n.a.
Number of specimens
n.a. 3 3 n.a. 3 n.a. 3 n.a.
A% at 24 hours 0.054 5.054 0.000 n.a. 0.002 n.a. 0.192 n.a.
A% at 48 hours 0.054 5.158 0.000 n.a. 0.002 n.a. 0.257 n.a.
Note: hr = hours; n.a. = not applicable. 1 in. = 25.4 mm.
Spr ing 2012 | PCI Journal110
sions, especially for cases with high prestressing levels. The recommendations are based on experience in Ne-braska, Florida, and Washington, where large amounts of prestressing have been provided on some projects. Results of a study conducted by Tuan et al.9 on bridge girders show that the end-zone reinforcement closest to the member end is the most highly stressed and would correspond to the widest crack (Fig. 11). It also shows that the stress in the vertical reinforcement drops sharply at a distance h/8 (where h is the member depth) from the girder end, with steel beyond the h/2 distance having little influence on cracking. Nonlinear finite element analysis recently conducted by Amir et al.12 confirmed the findings of Tuan et al.9 The following are proposed requirements:
• Provide reinforcement in the end (h/8) to resist at least 2% of the prestressing force, using an allowable stress limit of 20 ksi (138 MPa).
• Provide reinforcement in the end (h/2) to resist at least 4% of the prestressing force, using an allowable stress limit of 20 ksi (140 MPa). The reinforcement in the zone between the (h/8) and (h/2) sections must not be less than the shear reinforcement required beyond (h/2).
• Beyond the (h/2) zone, provide reinforcement to meet the shear requirements at the nearest critical section.
• Determine the bar anchorage into the flanges for a maximum stress of 30 ksi (210 MPa). Because the end-zone reinforcement is provided to minimize crack width and not for strength, there is no need to develop the full yield strength beyond the locations of the top and bottom cracks, which are assumed for design to be at the junction between the web and the flanges.
• Confine the strands in the bottom flange with at least the equivalent of no. 3 (10M) bars at 3 in. (75 mm) spacing for a distance equal to at least 60 strand diameters. The no. 3 bars must completely enclose the bottom flange strands. Welded-wire reinforcement of the same area per unit length may be used to substitute for the no. 3 (10M) bars. The same amount of confine-ment steel must be provided at the bonded ends of all debonded strand groups.
The proposed detail was used in the full-scale specimens as discussed earlier. The full-scale testing confirmed that, while the AASHTO LRFD specification requirements gave acceptable performance in all cases, the proposed details gave better performance. More important, the proposed details lend themselves to optimal bar detailing with mini-mized end-zone reinforcement congestion.
Appendix B gives an example for the design of end-zone reinforcement using the AASHTO LRFD specifications and the proposed requirements.
• Although girders in some of the selected bridges were repaired at the precast concrete plant, there was no documentation relative to methods and materials used to repair end-zone cracking.
Neither the Nebraska Department of Roads (NDOR) nor Virginia Department of Transportation (VDOT) had a policy to include in the field inspection reports whether end-zone bursting cracks had been reported in the plant inspection reports. Also, there was no consistency in girder identification between the producer’s and the owner’s iden-tification systems.
Proposed manual of acceptance, repair, or rejection
Based on the information presented in NCHRP report 654, the authors developed a manual of criteria for acceptance and repair of web-end cracking during production. Appen-dix A gives the manual, which can be used as a template by bridge owners. The proposed manual uses the crack width as the major criterion for acceptance, repair, or rejection as follows:
• Cracks narrower than 0.012 in. (0.30 mm) may be left unrepaired.
• Cracks ranging in width from 0.012 in. to 0.025 in. (0.64 mm) should be repaired by filling the cracks with approved specialty cementitious materials and coating the end 4 ft (1.2 m) of the girder side faces with an approved sealant.
• Cracks ranging in width from 0.025 in. to 0.050 in. (1.30 mm) should be filled by epoxy injection, and then the surface coated with a sealant.
• For girders exhibiting cracks wider than 0.05 in., the research team recommends that the girder be rejected. For such girders, it is believed that the cause of crack-ing may be beyond just the expected bursting force effects. If the owner wishes to reconsider these girders, it is recommended that a thorough structural analysis for the cause and effect of the cracking be conducted and appropriate measures taken.
Improved crack control reinforcement details
Most designers follow the provisions of article 5.10.10.1 of the AASHTO LRFD specifications. However, states with recently introduced I-girder shapes that can accommodate as many as sixty-eight 0.6-in.-diameter (15 mm) strands have developed supplementary requirements for end-zone reinforcement. The following recommendations offer improvement to the AASHTO LFRD specifications provi-

111PCI Journal | Spr ing 2012
Based on the experience gained in this project, the authors recommend improved end-zone details for use in new girders. End-zone reinforcement of the improved details is determined using 4% of the prestressed force at transfer and 20 ksi (140 MPa) allowable steel stress, which are the same criteria stated by the AASHTO LRFD specifications. However, the proposed details require that at least 50% of the end-zone reinforcement be placed within h/8 of the end of the member. The balance of the end-zone reinforcement is recommended to be placed between h/8 and h/2 of the member end. This distribution concentrates the reinforce-ment where the bursting stresses are highest. The bursting reinforcement must be embedded into the top and bottom flanges such that it can develop at least 30 ksi (200 MPa) at the junctions of the flanges with the web. The anchorage is considerably less than that required to develop the full yield strength of the bars.
Conclusion
Based on the work conducted in this project, the authors have developed a user’s manual for acceptance criteria and repair materials and methods for prestressed concrete girders experiencing end-zone cracking due to transfer of the pretensioning force. The manual consists of four criteria depending on the crack width. These criteria allow for ac-ceptance of girders with cracks wider than those implied for flexural members in ACI’s Building Code Requirements for Structural Concrete (ACI 318-08) and Commentary (ACI 318R-08)13 and the AASHTO LRFD specifications. The nature and consequences of end-zone cracking are differ-ent from those of flexural cracking. For example, flexural cracks in beams tend to grow in width and depth with the application of superimposed loads. They may adversely af-fect deflection, vibration, and fatigue behavior of the mem-ber. On the contrary, the width of end-zone cracks tends to decrease with the application of superimposed loads and the development of time-dependent prestress losses.
Figure 11. Average measured stress in end-zone reinforcement versus distance from the member end. Note: 1 ksi = 6.895 MPa.
0.0
5.0
10.0
15.0
20.0
25.0
0.0 0.2500.125 0.375 0.500 0.625 0.750 0.875 1.000 1.1250
2.8 ksi4.0 ksi
5.1 ksi
6.9 ksi
8.3 ksi
10.7 ksi
14.8 ksi
Distance from the girder end/girder height (z/h)
Ste
el s
tress
, ksi
h/8 h/8 h/4 h/4 h/4
f = 2.4/(z/h+0.1)s

Spr ing 2012 | PCI Journal112
3. Nawy, E. 1968. Crack Control in Reinforced Concrete Structures. ACI Journal, V. 65, No. 10 (October): pp. 825–836.
4. Kaar, P., and A. Mattock. 1963. High Strength Bars as Concrete Reinforcement—Part 4: Control of Crack-ing. PCA Research and Development Laboratories Journal, V. 5, No. 1 (January): pp. 15–38.
5. Hognestad, E. 1962. High Strength Bars as Concrete Reinforcement—Part 2: Control of Flexural Crack-ing. PCA Research and Development Laboratories Journal, V. 4, No. 1 (January): pp. 46–63.
6. American Concrete Institute (ACI). 2003. Control of Cracking in Concrete Structures. ACI Manual of Concrete Practice, Part 2. ACI 224R-01. Farmington Hills, MI: ACI.
7. PCI. 2006. Manual for the Evaluation and Repair of Precast, Prestressed Concrete Bridge Products. MNL-37-06. Chicago, IL: PCI.
8. American Association of State Highway and Trans-portation Officials (AASHTO). 2007. LRFD Bridge Design Specifications, 4th Edition—2008 Interim Revisions. Washington, DC: AASHTO.
9. Tuan, C., S. Yehia, N. Jongpitaksseel, and M. Tadros. 2004. End Zone Reinforcement for Pretensioned Con-crete Girders. PCI Journal, V. 49, No. 3 (May–June): pp. 68–82.
10. ASTM standards D6489-99. 1999. Standard Test Method for Determining the Water Absorption of Hardened Concrete Treated with a Water Repellent Coating. West Conshohocken, PA: ASTM Interna-tional.
11. ASTM standards G109-99a. 1999. Standard Test Method for Determining the Effects of Chemical Admixtures on the Corrosion of Embedded Steel Re-inforcement in Concrete Exposed to Chloride Environ-ments. West Conshohocken, PA: ASTM International.
12. Arab, A., S. Badie, and M. Manzari. Forthcoming. A Methodological Approach for Finite Element Model-ing of Pretensioned Concrete Members at the Release of Pretensioning. Engineering Structures. Available online at www.sciencedirect.com/science/article/pii/S014102961100099X.
13. ACI Committee 318. 2008. Building Code Require-ments for Structural Concrete (ACI 318-08) and Commentary (ACI 318R-08). Farmington Hills, MI: ACI.
Acknowledgments
The research reported here was performed under NCHRP project 18-14 by the University of Nebraska–Lincoln and George Washington University, Washington, D.C. The authors would like to express their gratitude to David Beal and Waseem Dekelbab, senior program officers of NCHRP at the Transportation Research Board, for their support and helpful direction during all phases of the project.
The authors would like to express their gratitude to Mark Lafferty of Concrete Industries Inc. in Lincoln, Neb.; Steve Seguirant and Dave Chapman of Concrete Technology Corp. in Tacoma, Wash; Todd Culp of Coreslab Structure (OMAHA) Inc. in Nebraska; Chad Saunders and Joe Rose of Bayshore Concrete Products Corp. in Cape Charles, Va.; Don Thomson of Construction Products Inc. in Jackson, Tenn.; and John Robertson of Standard Concrete Products Inc. in Tampa, Fla., for their generous donations of the fabrication, storage, transportation, and disposal of the girders for testing.
The authors would like to thank state bridge engineer Mark Traynowicz, the engineers and personnel of the Bridge Division of NDOR and assistant state structure and bridge engineer Julius F. J. Volgyi, materials engineer William F. Via, structures and bridge safety inspection engineer Chris-topher R. Williams, and the engineers and personnel of the structure and bridge division of VDOT for their help and support that allowed the authors to inspect many concrete bridges in Nebraska and Virginia.
The following individuals provided assistance during vari-ous phases of the project: Christopher Y. Tuan, professor; Gary L. Krause, associate professor; and senior laboratory technician Kelvin J. Lein of the University of Nebraska–Lincoln and Majid T. Manzari, professor, and Amir Arab, doctoral candidate, at George Washington University. Their assistance and contributions are greatly appreciated.
The authors would like to express their gratitude to the PCI reviewers for their constructive and helpful comments and thorough review of the manuscript.
References
1. Tadros, M. K., S. S. Badie, and C. Y. Tuan. 2010. Evaluation and Repair Procedures for Precast/Pre-stressed Concrete Girders with Longitudinal Cracking in the Web. National Cooperative Highway Research project NCHRP 18-14 report 654. Washington, DC: Transportation Research Board (TRB).
2. Reis, E. R., J. D. Mozer, A. C. Bianchini, and C. E. Kesler. 1965. Causes and Control of Cracking with High Strength Steel Bars—A Review of Research. Illinois University Engineering Experiment Station bulletin no. 479. Washington, DC: TRB.

113PCI Journal | Spr ing 2012
Notation
A% = percentage of water absorption
fcl = specified compressive strength of concrete
fcil = specified compressive strength of concrete at time of
initial prestress
h = member depth
L = span length
P = equivalent point load
W1 = specimen weight with dam in place
W2 = specimen weight with dam in place after 24 hours of water absorption (towel dried)
WA = dry weight of specimens

Spr ing 2012 | PCI Journal114
top face of the girder, where it normally is connected with a cast-in-place concrete slab, should not be covered with sealant. A minimum length of 4 ft (1.2 m) at each end of the girder is recommended to be covered.
Criterion 3
Crack width is 0.025 in. to 0.050 in. (0.64 mm to 1.3 mm)
Action recommended
Inject epoxy into cracks larger than 0.025 in. (0.64 mm). Apply surface sealant to the end 4 ft (1.2 m) as recom-mended in this report
For cracks wider than 0.025 in. (0.64 mm), epoxy injec-tion is recommended. It is important that this be performed such that the crack is completely filled and that the epoxy is effectively bonded to both surfaces of the crack. Cracks of this size in the webs generally exist in the full width of the web and appear on both faces of the member. Injec-tion must be done in accordance with proven practices and the epoxy manufacturer’s specifications. Epoxy pressure should be high enough to fully penetrate the crack depth, yet the pressure should not cause a blowout of the epoxy paste material used to confine the epoxy.
Before injection, the surface and interior of the crack should be cleared of all debris, such as dirt, dust, grease, oil, moisture, or any other foreign material, without using corrosive chemicals. If loose particles have entered the crack, they can be blown out with filtered high-pressured air equipment, as long as they do not introduce oil into the fissure. Water, solvents, or detergents should not be used because they may compromise the ability of the epoxy to bond to the concrete.
Before the epoxy is applied, the crack should first be ex-amined to determine the ideal placement for the injection ports. The port spacing can depend on the crack width and the amount of pressure applied, and professional judgment from an experienced injector should be used. The ports should be at least 8 in. (200 mm) apart. However, if the crack passes through the entire web, the spacing should not exceed the thickness of the web. After the ports are installed, the exterior of the crack is to be sealed with an epoxy paste and allowed to harden. This is to prevent the injected epoxy from leaking out of the crack. With cracks that extend on both sides of the girder, the opposite side of injection should be sealed as well. If the cracks on each side do not connect, epoxy injection should be performed on each side individually.
After confining the cracked area, the epoxy can be mixed and the injection can begin from the bottom up. Injection should be performed with an epoxy injecting machine. The lowest injection port should be filled with epoxy first until
Appendix A: Proposed
manual of acceptance,
repair, or rejection
Table A.1 shows the decision criteria for acceptance and repair of web end cracking during production.
Criterion 1
Crack width is less than 0.012 in. (0.3 mm).
Action recommended
No action should be taken.
With a crack width this narrow, no repair is required. How-ever, if the owner desires repair, steps for criterion 2 can be followed.
Criterion 2
Crack width is 0.012 in. to 0.025 in. (0.30 mm to 0.64 mm).
Action recommended
Apply cementitious packing materials to cracks between 0.012 in. and 0.025 in. (0.30 mm and 0.64 mm). Apply surface sealant to the end 4 ft (1.2 m) as recommended in this manual.
It is recommended that the crack be filled with a cementi-tious packing material and covered with a water-resistant surface sealant to keep water contaminated with corrosion-inducing chemicals from reaching the steel inside the girder.
The area in question should be cleaned and cleared of any debris, such as dirt, dust, grease, oil, or any other foreign material. This will aid in the bonding of the material to the concrete. Cleaning products that are corrosive should not be used.
It is best that the packing material used to fill the cracks be cementitious, slightly viscous, and easily worked by hand. The material should be rubbed into the cracks either by hand or by brush until the entire outer opening is filled and a surface is created that is even with the original girder web surface. Excess material should be wiped off so that the surface remains even.
The surface sealant should be water resistant and highly flowable. Its application should result in a smooth surface. The sealant should be applied with either a brush or a roller so that the side faces of the girder are fully covered. The

115PCI Journal | Spr ing 2012
it begins to come out of the next port slightly higher than it. The used port is to be plugged so that the epoxy does not leak out. Then the process can be repeated until epoxy begins to come out of the next port in line. This process continues until the top port is reached and the crack is completely filled. The final port should be placed a few inches away from the termination point of the crack, but this remaining portion of the crack should still be filled with the last injection.
Criterion 4
Crack width is greater than 0.050 in. (1.3 mm).
Action recommended
Reject girder unless shown by detailed analysis that struc-tural capacity and durability are satisfactory.
Cracks exceeding a width of 0.050 in. (1.3 mm) may be symptomatic of causes beyond the normal effects of burst-ing forces due to prestress release. All aspects of material quality, reinforcement quality and quantity, and production practices must be examined. If a loss of structural capacity were to occur, typical methods of epoxy injection may not be sufficient to measurably return the girder to its intended strength, especially if cracking causes excessive loss of prestress.
Table A.1. Criteria for acceptance and repair of web end cracking during production
Criterion Crack width, in. Action
1 <0.012 No action should be taken.
2 0.012 to 0.025 Fill the cracks and apply surface sealant to the end 4 ft as recommended in this report.
3 0.025 to 0.05 Fill cracks with epoxy and apply surface sealant to the end 4 ft as recommended in this report.
4 >0.05 Reject girder, unless shown by detailed analysis that structural capacity and durability are sufficient.
Note: 1 in. = 25.4 mm; 1 ft = 0.305 m.

Spr ing 2012 | PCI Journal116
debonded 16 ft (4.9 m) from the ends. The strands are tensioned to 44 kip (200 kN). All strands are straight.
Solution
Prestressing force at member end = (72 – 10 – 8)(44) = 2376 kip (10,570 kN)
Bursting force = (0.04)(2376) = 95.04 kip (422.7 kN)
Table B.1 compares the calculations according to AAS-HTO LRFD specifications with the proposed detail.
Appendix B:
Design example of
end-zone reinforcement
Example 1
Design the end-zone reinforcement for the newly intro-duced Florida I-beam. The beam is 45 in. deep (1140 mm). Seventy-two 0.6-in.-diameter (15 mm) strands are placed in the bottom flange. Of these strands, ten are debonded 8 ft (2.44 m) from the ends and another eight strands are
Table B.1. Example 1 comparison of calculations according to AASHTO LRFD specifications with the proposed detail
Design of EZR according to AASHTO LRFD specifications
Design of EZR according to proposed detail
Required EZR area and distance
Total area = 95.04 kip/20 ksi = 4.75 in.2
uniformly distributed over h /4 = 11.25 in.
Total area = 95.04 kip/20 ksi = 4.75 in.2, 1/2 × 4.75 in.2 over h /8 = 5.63 in. followed by greater of (1/2 × 4.75 = 2.38 in.2) or the vertical shear reinforcement over 3h /8 = 16.875 in.
Provided EZR detailUse six pairs of no. 6 bars with 1 in. clear cover and a spacing of 2 in.
Use two 1-in.-diameter coil rods with 1 in. clear cover, followed by a pair of no. 6 bars at 4 in. on center, followed by four pairs of no. 5 bars at 4 in. on center.
Provided EZR area and distance
6 × 2 × 0.44 = 5.28 in.2
1.375 + (5 × 2) = 11.375 in.
(2 × 0.79 + 2 × 0.44) = 2.45 in.2 over (1.5 + 4) = 5.5 in. followed by (2 × 4 × 0.31) = 2.48 in.2 over (4 × 4) = 16 in.
Note: EZR = end-zone reinforcement; h = member depth; no. 5 = 16M; no. 6 = 19M; 1 in. = 25.4 mm; 1 kip = 4.448 kN; 1 ksi = 6.895 MPa.
Figure B.1. Web end reinforcement details of example 1 using the proposed requirements. Note: no. 3 = 10M; no. 4 = 13M; no. 5 = 16M; no. 6 = 19M; 1 in. = 25.4 mm; 1 ft = 0.305 m.
No. 3 at 3 in.for 19 ft
3 in
.1
ft 2
in.
3 ft
9 in
.
3 ft 2 in.
16 spaces at 2 in.
2 in. clear
No. 4 bars
Nuts are tack weldedto the base plate
No. 5 bars
2 in. clear
Two 1 in. coil rods
Section A-A Section B-B
No. 4 bars
No. 3 at 3 in.for 19 ft
Two 1 in. coil rods
1 ft 9 in.1 in.clearcover
5 spaces at 4 in.
4 pairs of no. 5 barsat 4 in.
2 no. 6
2 in. No. 3 at 3 in. for 19 ft
A
A
B
B

117PCI Journal | Spr ing 2012
(2.5 m) and a third set starting at 16 ft (4.9 m). However, for simplicity it is recommended to uniformly use no. 3 (10M) at 3 in. (75 mm) for a distance = 16 + (36/12) = 19 ft (5.8 m) from the ends.
Example 2
Design the end-zone reinforcement for the Washing-ton State Wide Flange WF100G. The beam is 100 in. (2500 mm) deep. At midspan, the bottom flange houses
The threaded coil rods are provided with nuts at the top and bottom for anchorage. The bottom nuts are welded to the steel base plate (Fig. B.1). The details of the new Florida I-beam provide only one strand across the thickness of the web to allow for 2 in. (50 mm) clear cover on the web vertical reinforcement.
Confinement steel should be provided for a distance of 60 strand diameters, or 36 in. (910 mm), from the end. A sec-ond set of confining steel should be provided starting at 8 ft
Figure B.2. Web end reinforcement details of example 2 using the proposed requirements. Note: no. 3 = 10M; no. 4 = 13M; no. 5 = 16M; no. 8 = 25M; 1 in. = 25.4 mm; 1 ft = 0.305 m.
No. 8 C-clamp
61/8 in.
31/2 in.
No. 5 bars
Pairs of no. 4
No. 3 at 3 in.for 12 ft 6 in.
No. 8 C-clamp
No. 5 bar
A
A
4 ft 1 in.
2 in.
3 ft 23/8 in.
8 ft
4 in
.
Section A-A
4 1/2 in.
3 ft 2 in.3 in. 9 in.
4 ft 2 in.

Spr ing 2012 | PCI Journal118
seventy-two 0.6-in.-diameter (15 mm) strands, 46 straight strands, and 26 draped strands in two groups. The draped strands are draped at 0.4L, where L is the span length, toward the top flange (Fig. B.2). This beam is used for the Alaskan Way Viaduct in Seattle, Wash. The span length is 205 ft (62.5 m). The strands are tensioned to 44 kip (200 kN).
Solution
Prestressing force at member end = (72)(44) = 3168 kip (14,090 kN)
Bursting force = (0.04)(3168) = 126.7 kip (563.6 kN)
Table B.2 compares the calculations according to AAS-HTO LRFD specifications with the proposed detail.
Table B.2. Example 2 comparison of calculations according to AASHTO LRFD specifications compared with the proposed detail
Design of EZR according to AASHTO LRFD specifications
Design of EZR according to proposed detail
Required EZR area and distance
Total area = 126.7 kip/20 ksi = 6.33 in.2 uniformly distributed over h /4 = 25 in.
Total area = 126.7 kip/20 ksi = 6.33 in.2
1/2 × 6.33 in.2 over h /8 = 12.5 in.
followed by
Greater of (1/2 × 6.33 = 3.17 in.2) or the vertical shear reinforcement over 3h /8 = 37.5 in.
Provided EZR detailUse eleven pairs of no. 5 bars with 3 in. cover on the first pair and a spacing of 2.5 in. afterward.
Use no. 8 C clamp and two no. 5 bars at 3 in. from member end, followed by three pairs of no. 5 bars at 3 in. spacing on center, followed by eight pairs of no. 4 bars at 4.75 in. spacing on center.
Provided EZR area and distance
11 × 2 × 0.31 = 6.82 in.2, 3 + (10 × 2.5) = 28 in.(0.79 + 4 × 2 × 0.31) = 3.27 in.2 over (3 + 3 × 3) = 12.0 in. followed by (8 × 2 × 0.20) = 3.20 in.2 over (8 × 4.75) = 38 in.
Note: EZR = end-zone reinforcement; h = height of girder. no. 4 = 13M; no. 5 = 16M; no. 8 = 25M; 1 in. = 25.4 mm; 1 kip = 4.448 kN; 1 ksi = 6.895 MPa.

119PCI Journal | Spr ing 2012
About the authors
Christie J. Hasenkamp is an engineer I at Larson Engineering Inc. in Omaha, Neb.
Sameh S. Badie, PhD, P.E., is an associate professor in the Civil and Environmental Engineering Department at George Washington University in Washington, D.C.
Kromel E. Hanna, PhD, P.E., is a project engineer at Con-Fab California Corp. in Lathrop, Calif.
Maher K. Tadros, PhD, P.E., FPCI, FACI, is an emeritus professor of civil engineering at the University of Nebraska–Lin-coln and principal at e.construct.USA.
Abstract
Precast, prestressed concrete bridge girders are widely used in the United States. Longitudinal web cracks, of-ten called end-zone cracks, at the ends of pretensioned concrete girders are commonly observed at the time of strand detensioning. End-zone cracks differ from flexural cracks in conventionally reinforced beams and slabs and from tensile cracks in water storage struc-tures. In practice, there is no consistent understanding of the effect of end-zone cracking on the strength and durability of the girders. Thus, the decisions made by bridge owners vary from doing nothing to total rejection of the girders. There is no consensus among owners as to acceptable crack widths. This paper gives a user’s manual for acceptance and repair of web end cracking and details of end-zone reinforcement that will minimize the number and width of end-zone cracks. The user’s manual and reinforcement details were developed in the NCHRP 18-14 report 654.
Keywords
Bridge, cracking, durability, end zone, girders, rein-forcement, repair.
Review policy
This paper was reviewed in accordance with the Precast/Prestressed Concrete Institute’s peer-review process.
Reader comments
Please address any reader comments to journal@pci .org or Precast/Prestressed Concrete Institute, c/o PCI Journal 200 W. Adams St., Suite 2100, Chicago, IL 60606. J