Proposal for the Acquisition of Sample Acquisition ... · Proposal for the Acquisition of Sample...
91
Proposal for the Acquisition of Sample Acquisition Candidate, Inc. Prepared for: Gary Sandler Mezzanine Funding Group Prepared by: Robert B. Machiz Exchange Capital, Inc. 1 East Camelback Road, Ste. 550 Phoenix, AZ 85012 The information contained herein is of a confidential nature and is intended for the exclusive use of the persons or firm for whom it was prepared. Reproduction, publication or dissemination of all or portions hereof may not be made without prior approval from Exchange Capital, Inc.. This sample acquisition proposal was generated using DealSense ® Plus+ and the Financial Report Builder™. For more information call MoneySoft at (800) 966-7797. Note: this footer is fully customizable.
Transcript of Proposal for the Acquisition of Sample Acquisition ... · Proposal for the Acquisition of Sample...
Proposal for the Acquisition of Sample Acquisition Candidate, Inc.
Prepared for: Gary SandlerMezzanine Funding Group
Prepared by: Robert B. Machiz
Exchange Capital, Inc.1 East Camelback Road, Ste. 550
Phoenix, AZ 85012
The information contained herein is of a confidential nature and is intended for the exclusive use of the persons or firm for whom it was prepared. Reproduction,
publication or dissemination of all or portions hereof may not be made without prior approval from Exchange Capital, Inc..
This sample acquisition proposal was generated using DealSense® Plus+ and the Financial Report Builder™. For more information call MoneySoft at (800) 966-7797. Note: this footer is fully customizable.
How This Report Was Generated This report is a sample of the type of comprehensive acquisition proposal that you can quickly create with MoneySoft’s DealSense® Plus+ and Financial Report Builder™ enhancement. DealSense Plus+ was used to analyze the target company, determine purchase price and terms, and structure a workable financing plan. The Financial Report Builder was then used to automatically create and format the acquisition proposal as a Microsoft Word document! If this were a “live case,” descriptive text would be added about the company, its markets, management and staffing, capabilities and operations, developing trends, and future prospects of the company. In addition, the rationale for assumptions, potential synergies, changes to be made after the sale, capabilities of the buyer, and a discussion of the strengths, weaknesses, opportunities and threats (risks) involved in the proposed transaction could also be included in the presentation.
An Overview of the Scenario In this sample case, the buyer is an investment group that has adopted a vertical build-and-hold strategy. The target company is profitable, stable, fits well into the buyer’s strategic portfolio and offers much needed productive capacity. The Sellers are asking for $18,000,000 based upon an asset sale. The Buyer estimates that the Enterprise Value of the company is approximately $16,245,656 and has offered $16,000,000. The target’s assets will be acquired by a newly formed entity that the buyer will control (“NewCo”). This is a friendly transaction. Most of the management of the seller will be retained and have an opportunity acquire an equity stake in NewCo. The acquisition will be funded with the buyer’s stock, senior secured debt, a convertible mezzanine strip, and some seller carryback. After the acquisition, the buyer intends to use the target’s available capacity to manufacture product currently produced by third-party vendors. In addition, the buyer intends to upgrade equipment and install procedures that will improve collections and reduce inventory levels. This DealSense Plus+ report pulls the deal together and provides a thorough bottom-line analysis of the proposed deal. The names and numbers used in this sample report are fictitious. Any similarity to the names or information of actual companies is strictly coincidental. A note about the colors used in this sample report: As you review this sample report, you will notice that some of the text is blue, dark red and magenta.
• The blue items are cell references that are pulled in from the DealSense Plus+ file. Blue is also used whenever the Report Builder creates a table that has a fixed width.
• Tables with variable widths (dependent upon the number of years/periods selected) are indicated in dark red.
• Non-printable comments are indicated in magenta.
This sample acquisition proposal was generated using DealSense® Plus+ and the Financial Report Builder™. For more information call MoneySoft at (800) 966-7797. Note: this footer is fully customizable.
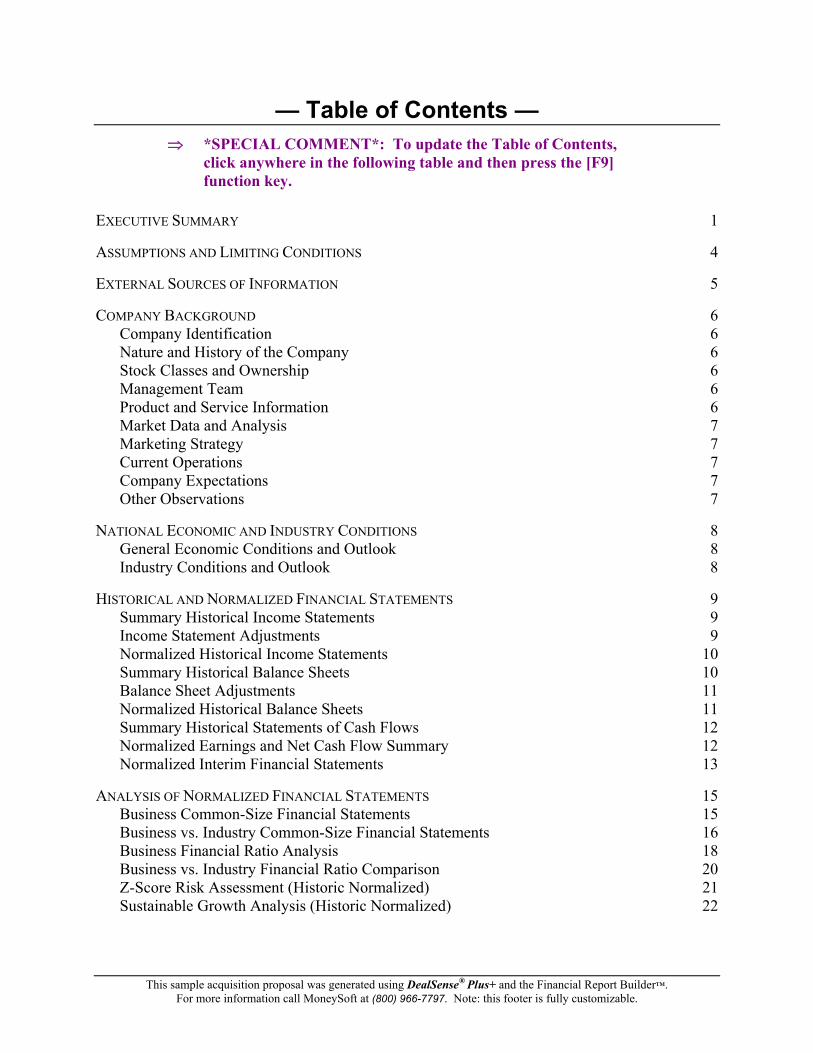
— Table of Contents — ⇒ *SPECIAL COMMENT*: To update the Table of Contents,
click anywhere in the following table and then press the [F9] function key.
EXECUTIVE SUMMARY 1
ASSUMPTIONS AND LIMITING CONDITIONS 4
EXTERNAL SOURCES OF INFORMATION 5
COMPANY BACKGROUND 6 Company Identification 6 Nature and History of the Company 6 Stock Classes and Ownership 6 Management Team 6 Product and Service Information 6 Market Data and Analysis 7 Marketing Strategy 7 Current Operations 7 Company Expectations 7 Other Observations 7
NATIONAL ECONOMIC AND INDUSTRY CONDITIONS 8 General Economic Conditions and Outlook 8 Industry Conditions and Outlook 8
HISTORICAL AND NORMALIZED FINANCIAL STATEMENTS 9 Summary Historical Income Statements 9 Income Statement Adjustments 9 Normalized Historical Income Statements 10 Summary Historical Balance Sheets 10 Balance Sheet Adjustments 11 Normalized Historical Balance Sheets 11 Summary Historical Statements of Cash Flows 12 Normalized Earnings and Net Cash Flow Summary 12 Normalized Interim Financial Statements 13
ANALYSIS OF NORMALIZED FINANCIAL STATEMENTS 15 Business Common-Size Financial Statements 15 Business vs. Industry Common-Size Financial Statements 16 Business Financial Ratio Analysis 18 Business vs. Industry Financial Ratio Comparison 20 Z-Score Risk Assessment (Historic Normalized) 21 Sustainable Growth Analysis (Historic Normalized) 22
This sample acquisition proposal was generated using DealSense® Plus+ and the Financial Report Builder™. For more information call MoneySoft at (800) 966-7797. Note: this footer is fully customizable.
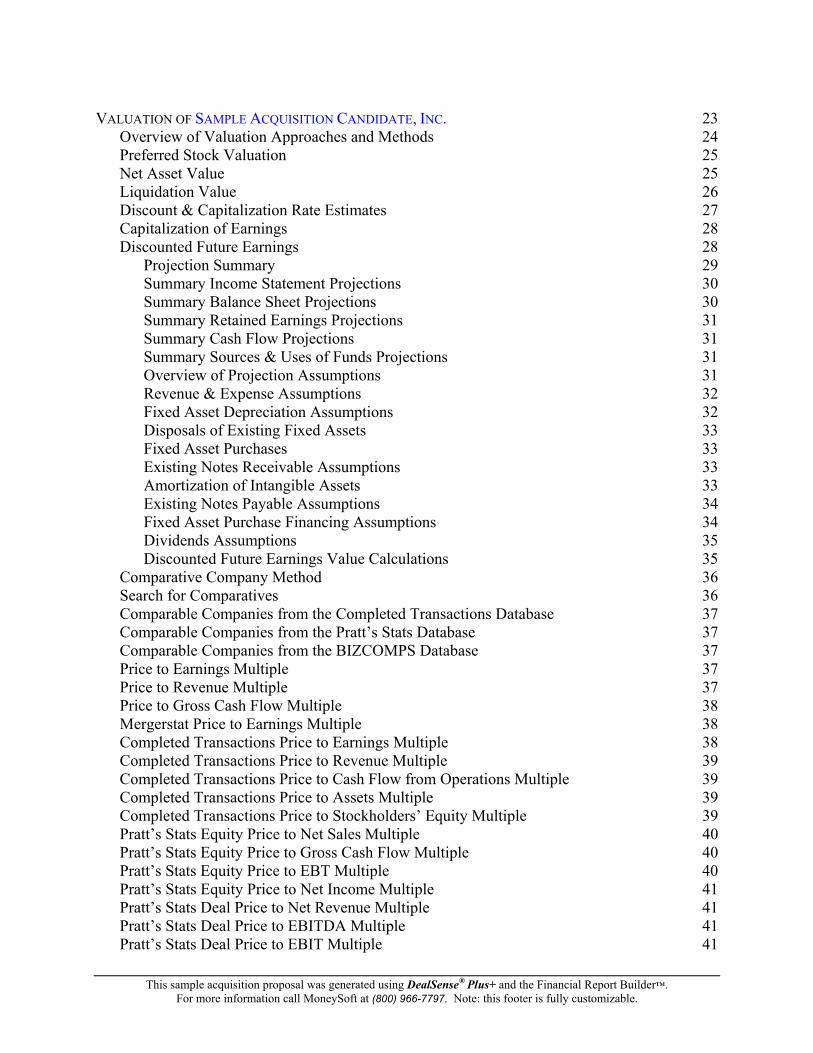
VALUATION OF SAMPLE ACQUISITION CANDIDATE, INC. 23 Overview of Valuation Approaches and Methods 24 Preferred Stock Valuation 25 Net Asset Value 25 Liquidation Value 26 Discount & Capitalization Rate Estimates 27 Capitalization of Earnings 28 Discounted Future Earnings 28
Projection Summary 29 Summary Income Statement Projections 30 Summary Balance Sheet Projections 30 Summary Retained Earnings Projections 31 Summary Cash Flow Projections 31 Summary Sources & Uses of Funds Projections 31 Overview of Projection Assumptions 31 Revenue & Expense Assumptions 32 Fixed Asset Depreciation Assumptions 32 Disposals of Existing Fixed Assets 33 Fixed Asset Purchases 33 Existing Notes Receivable Assumptions 33 Amortization of Intangible Assets 33 Existing Notes Payable Assumptions 34 Fixed Asset Purchase Financing Assumptions 34 Dividends Assumptions 35 Discounted Future Earnings Value Calculations 35
Comparative Company Method 36 Search for Comparatives 36 Comparable Companies from the Completed Transactions Database 37 Comparable Companies from the Pratt’s Stats Database 37 Comparable Companies from the BIZCOMPS Database 37 Price to Earnings Multiple 37 Price to Revenue Multiple 37 Price to Gross Cash Flow Multiple 38 Mergerstat Price to Earnings Multiple 38 Completed Transactions Price to Earnings Multiple 38 Completed Transactions Price to Revenue Multiple 39 Completed Transactions Price to Cash Flow from Operations Multiple 39 Completed Transactions Price to Assets Multiple 39 Completed Transactions Price to Stockholders’ Equity Multiple 39 Pratt’s Stats Equity Price to Net Sales Multiple 40 Pratt’s Stats Equity Price to Gross Cash Flow Multiple 40 Pratt’s Stats Equity Price to EBT Multiple 40 Pratt’s Stats Equity Price to Net Income Multiple 41 Pratt’s Stats Deal Price to Net Revenue Multiple 41 Pratt’s Stats Deal Price to EBITDA Multiple 41 Pratt’s Stats Deal Price to EBIT Multiple 41
This sample acquisition proposal was generated using DealSense® Plus+ and the Financial Report Builder™. For more information call MoneySoft at (800) 966-7797. Note: this footer is fully customizable.
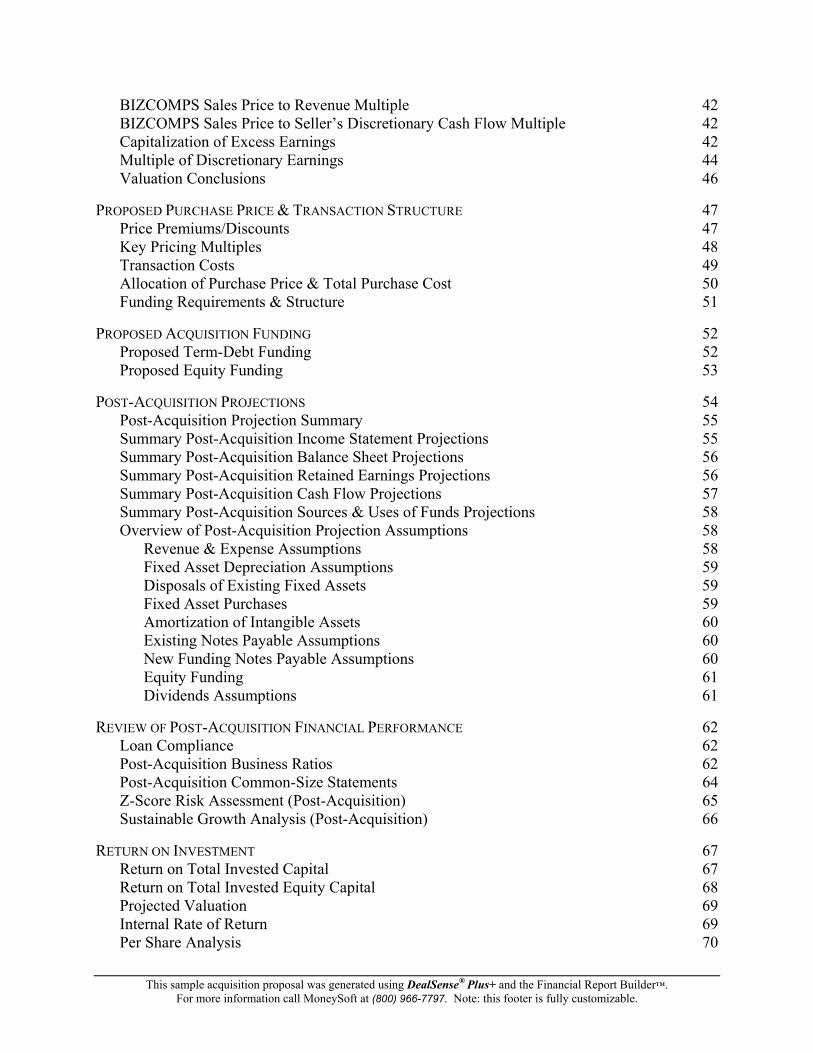
BIZCOMPS Sales Price to Revenue Multiple 42 BIZCOMPS Sales Price to Seller’s Discretionary Cash Flow Multiple 42 Capitalization of Excess Earnings 42 Multiple of Discretionary Earnings 44 Valuation Conclusions 46
PROPOSED PURCHASE PRICE & TRANSACTION STRUCTURE 47 Price Premiums/Discounts 47 Key Pricing Multiples 48 Transaction Costs 49 Allocation of Purchase Price & Total Purchase Cost 50 Funding Requirements & Structure 51
PROPOSED ACQUISITION FUNDING 52 Proposed Term-Debt Funding 52 Proposed Equity Funding 53
POST-ACQUISITION PROJECTIONS 54 Post-Acquisition Projection Summary 55 Summary Post-Acquisition Income Statement Projections 55 Summary Post-Acquisition Balance Sheet Projections 56 Summary Post-Acquisition Retained Earnings Projections 56 Summary Post-Acquisition Cash Flow Projections 57 Summary Post-Acquisition Sources & Uses of Funds Projections 58 Overview of Post-Acquisition Projection Assumptions 58
Revenue & Expense Assumptions 58 Fixed Asset Depreciation Assumptions 59 Disposals of Existing Fixed Assets 59 Fixed Asset Purchases 59 Amortization of Intangible Assets 60 Existing Notes Payable Assumptions 60 New Funding Notes Payable Assumptions 60 Equity Funding 61 Dividends Assumptions 61
REVIEW OF POST-ACQUISITION FINANCIAL PERFORMANCE 62 Loan Compliance 62 Post-Acquisition Business Ratios 62 Post-Acquisition Common-Size Statements 64 Z-Score Risk Assessment (Post-Acquisition) 65 Sustainable Growth Analysis (Post-Acquisition) 66
RETURN ON INVESTMENT 67 Return on Total Invested Capital 67 Return on Total Invested Equity Capital 68 Projected Valuation 69 Internal Rate of Return 69 Per Share Analysis 70
This sample acquisition proposal was generated using DealSense® Plus+ and the Financial Report Builder™. For more information call MoneySoft at (800) 966-7797. Note: this footer is fully customizable.
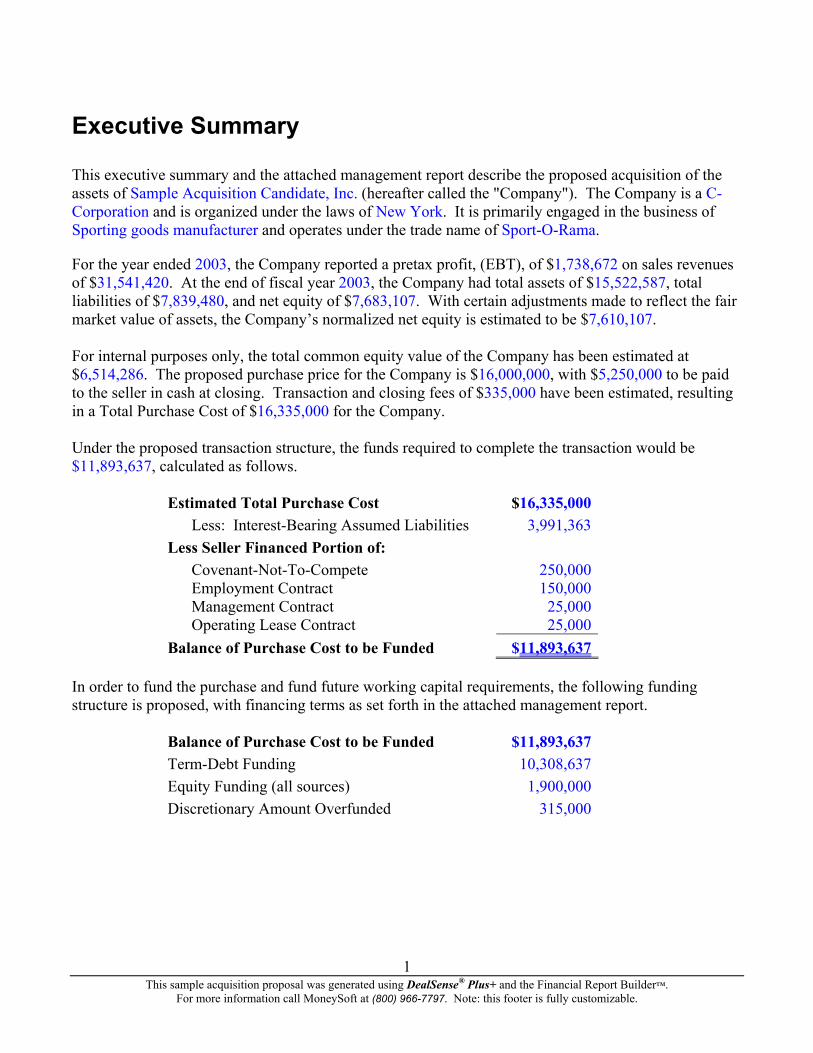
Executive Summary This executive summary and the attached management report describe the proposed acquisition of the assets of Sample Acquisition Candidate, Inc. (hereafter called the "Company"). The Company is a C-Corporation and is organized under the laws of New York. It is primarily engaged in the business of Sporting goods manufacturer and operates under the trade name of Sport-O-Rama.
For the year ended 2003, the Company reported a pretax profit, (EBT), of $1,738,672 on sales revenues of $31,541,420. At the end of fiscal year 2003, the Company had total assets of $15,522,587, total liabilities of $7,839,480, and net equity of $7,683,107. With certain adjustments made to reflect the fair market value of assets, the Company’s normalized net equity is estimated to be $7,610,107. For internal purposes only, the total common equity value of the Company has been estimated at $6,514,286. The proposed purchase price for the Company is $16,000,000, with $5,250,000 to be paid to the seller in cash at closing. Transaction and closing fees of $335,000 have been estimated, resulting in a Total Purchase Cost of $16,335,000 for the Company. Under the proposed transaction structure, the funds required to complete the transaction would be $11,893,637, calculated as follows.
Estimated Total Purchase Cost $16,335,000Less: Interest-Bearing Assumed Liabilities 3,991,363
Less Seller Financed Portion of: Covenant-Not-To-Compete 250,000Employment Contract 150,000Management Contract 25,000Operating Lease Contract 25,000
1
Balance of Purchase Cost to be Funded $11,893,637 In order to fund the purchase and fund future working capital requirements, the following funding structure is proposed, with financing terms as set forth in the attached management report.
Balance of Purchase Cost to be Funded $11,893,637Term-Debt Funding 10,308,637Equity Funding (all sources) 1,900,000Discretionary Amount Overfunded 315,000
This sample acquisition proposal was generated using DealSense® Plus+ and the Financial Report Builder™. For more information call MoneySoft at (800) 966-7797. Note: this footer is fully customizable.
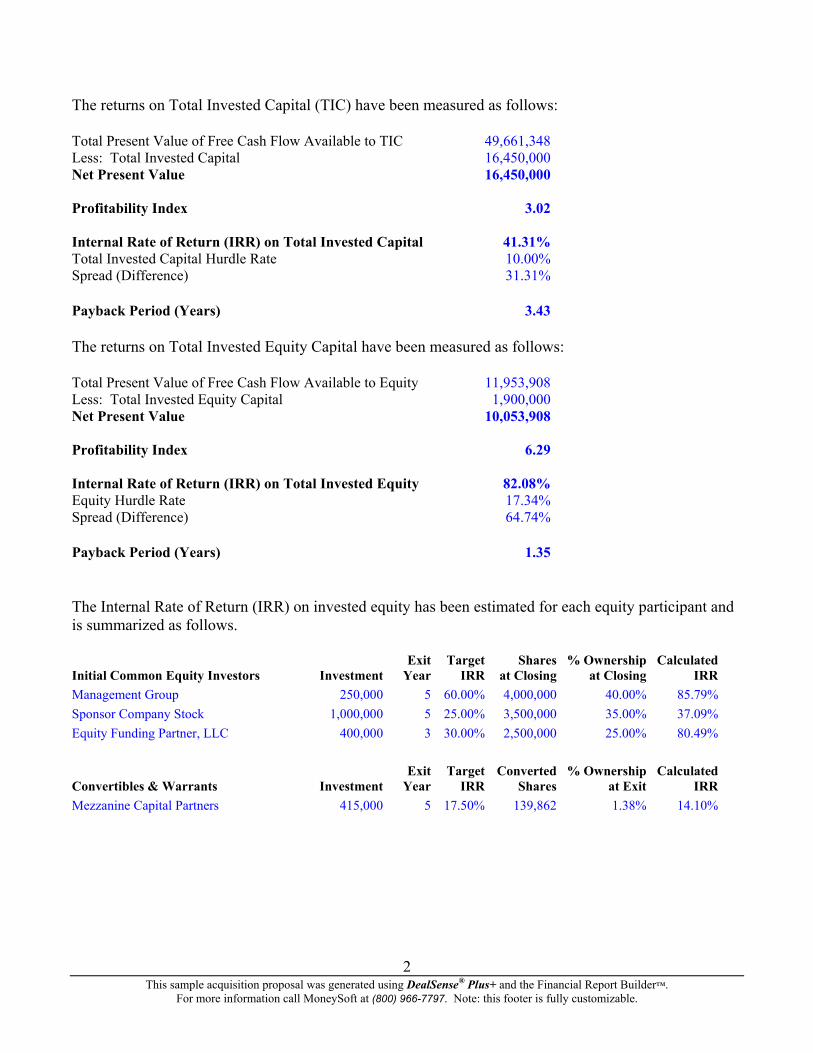
The returns on Total Invested Capital (TIC) have been measured as follows: Total Present Value of Free Cash Flow Available to TIC 49,661,348Less: Total Invested Capital 16,450,000Net Present Value 16,450,000 Profitability Index 3.02 Internal Rate of Return (IRR) on Total Invested Capital 41.31%Total Invested Capital Hurdle Rate 10.00%Spread (Difference) 31.31% Payback Period (Years) 3.43 The returns on Total Invested Equity Capital have been measured as follows: Total Present Value of Free Cash Flow Available to Equity 11,953,908Less: Total Invested Equity Capital 1,900,000Net Present Value 10,053,908 Profitability Index 6.29 Internal Rate of Return (IRR) on Total Invested Equity 82.08%Equity Hurdle Rate 17.34%Spread (Difference) 64.74% Payback Period (Years) 1.35 The Internal Rate of Return (IRR) on invested equity has been estimated for each equity participant and is summarized as follows. Exit Target Shares % Ownership Calculated Initial Common Equity Investors Investment Year IRR at Closing at Closing IRR Management Group 250,000 5 60.00% 4,000,000 40.00% 85.79% Sponsor Company Stock 1,000,000 5 25.00% 3,500,000 35.00% 37.09% Equity Funding Partner, LLC 400,000 3 30.00% 2,500,000 25.00% 80.49% Exit Target Converted % Ownership Calculated Convertibles & Warrants Investment Year IRR Shares at Exit IRR Mezzanine Capital Partners 415,000 5 17.50% 139,862 1.38% 14.10%
This sample acquisition proposal was generated using DealSense® Plus+ and the Financial Report Builder™.
For more information call MoneySoft at (800) 966-7797. Note: this footer is fully customizable.
2
A detailed management report is attached describing the Company, its operations, financial performance, and profit potential. The report also includes a discussion on value, pricing, transaction costs, and details on the proposed financing of the purchase. Finally, projections regarding the outlook for the company after the acquisition have been prepared along with an analysis of potential returns to investors. For additional information contact:
COMMENT: On the lines above, enter all appropriate contact information. Please note that this comment will not print.
This sample acquisition proposal was generated using DealSense® Plus+ and the Financial Report Builder™.
For more information call MoneySoft at (800) 966-7797. Note: this footer is fully customizable.
3
Assumptions and Limiting Conditions This analysis is subject to the following assumptions and limiting conditions: 1. Information, estimates, and opinions contained in this report are obtained from sources considered to be reliable. However, we assume no liability for such sources. 2. The Company and its representatives warranted to us that the information they supplied was complete and accurate to the best of their knowledge and that the financial statement information reflects the Company’s results of operations and financial condition in accordance with generally accepted accounting principles, unless otherwise noted. Information supplied by management has been accepted as correct without further verification, (and we express no opinion on that information). 3. Possession of this report, or a copy thereof, does not carry with it the right of publication of all or part of it, nor may it be used for any purpose by anyone but the client without the previous written consent of the client or us and, in any event, only with proper attribution. 4. We are not required to give testimony in court, or be in attendance during any hearings or depositions, with reference to the company being valued, unless previous arrangements have been made. 5. The various estimates of value presented in this report apply to this valuation only and may not be used out of the context presented herein. This valuation is valid only for the purpose or purposes specified herein. 6. (This valuation assumes that the Company will continue to operate as a going concern, and that the character of its present business will remain intact.) 7. The valuation contemplates facts and conditions existing as of the valuation date. Events and conditions occurring after that date have not been considered, and we have no obligation to update our report for such events and conditions. 8. We have assumed that there is full compliance with all applicable federal, state, and local regulations and laws unless otherwise specified in this report. 9. This report was prepared under the direction of Robert B. Machiz. Neither the professionals who worked on this engagement nor Exchange Capital, Inc. have any present or contemplated future interest in Sample Acquisition Candidate, Inc., any personal interest with respect to the parties involved, or any other interest that might prevent us from performing an unbiased valuation. Our compensation is not contingent on an action or event resulting from the analyses, opinions, or conclusions in, or the use of, this report.
COMMENT: Modify the above list as necessary to reflect the actual assumptions and limiting conditions relevant to the specific valuation engagement. Please note that these comments will not print.
This sample acquisition proposal was generated using DealSense® Plus+ and the Financial Report Builder™. For more information call MoneySoft at (800) 966-7797. Note: this footer is fully customizable.
4
External Sources of Information To aid us in our analysis of the Company, we consulted a number of publicly available sources of information. Numerous financial publications and databases were consulted including Business Statistics, Standard & Poor’s Industry Surveys, Ibbotson Associates’ Stocks, Bonds, Bills and Inflation 200X Yearbook, Mergerstat Review, U.S. Financial Data, Standard & Poor’s Register of Corporations, Directors, and Executives, Disclosure, Inc. on-line database, and Value Line Investment Survey.
COMMENT: Add to or delete from this listing of sources of external information as necessary. Please note that this comment will not print.
This sample acquisition proposal was generated using DealSense® Plus+ and the Financial Report Builder™.
For more information call MoneySoft at (800) 966-7797. Note: this footer is fully customizable.
5
Company Background
Company Identification Sample Acquisition Candidate, Inc. is a C-Corporation organized under the laws of New York and located at 10 Wall Street, New York, NY, 10005. The Company can be categorized under the Standard Industrial Classification (SIC) Code of 3949 and North American Industry Classification System (NAICS) Code of 33992.
COMMENT: In addition to the linked information above, enter any additional identification information that you feel is appropriate for purposes of this report. Please note that this comment will not print.
Nature and History of the Company Established in 1990, the Company is primarily engaged in the business of Sporting goods manufacturer and operates under the trade name of Sport-O-Rama.
COMMENT: In addition to the linked information above, explain the history of the company since its inception and describe the nature of the company’s current activities. Please note that this comment will not print.
Stock Classes and Ownership
COMMENT: Describe all classes of stock including both common and preferred and discuss any special rights or restrictions associated with each class. Summarize the total number of shares authorized, issued and outstanding for each class. List each major shareholder, amount and class of stock they own, and their relationship to other major shareholders, if any. Please note that this comment will not print.
Management Team
COMMENT: Provide an overview of the background and qualifications of key personnel. Also include an overview of other staff, if applicable. Please note that this comment will not print.
Product and Service Information
COMMENT: Provide a description of the company’s products and/or services. Please note that this comment will not print.
This sample acquisition proposal was generated using DealSense® Plus+ and the Financial Report Builder™.
For more information call MoneySoft at (800) 966-7797. Note: this footer is fully customizable.
6
Market Data and Analysis
COMMENT: Provide an overview of the market(s) in which the company competes. Please note that this comment will not print.
Marketing Strategy
COMMENT: Describe the company’s current marketing plan and strategy. Please note that this comment will not print.
Current Operations
COMMENT: Describe the company’s facilities, capabilities, and its methods of providing products and/or services. Please note that this comment will not print.
Company Expectations
COMMENT: Provide a description of the Company’s future expectations with respect to growth, profitability and financial position. Please note that this comment will not print.
Other Observations
COMMENT: Describe any other observations not explained in the previous sections. Please note that this comment will not print.
This sample acquisition proposal was generated using DealSense® Plus+ and the Financial Report Builder™.
For more information call MoneySoft at (800) 966-7797. Note: this footer is fully customizable.
7
National Economic and Industry Conditions
General Economic Conditions and Outlook
COMMENT: Discuss or insert the distributed national, regional, and/or local economic conditions at the Valuation Date and their future economic outlook as applicable to the subject company. Identify all sources of information referenced in your discussion. If national, regional, and/or local conditions do not affect the subject company, explain why. Please note that this comment will not print.
Industry Conditions and Outlook
COMMENT: Discuss the economic conditions at the Valuation Date and the future economic outlook for the industry in which the subject company operates. Identify all sources of information referenced in your discussion Please note that this comment will not print.
This sample acquisition proposal was generated using DealSense® Plus+ and the Financial Report Builder™.
For more information call MoneySoft at (800) 966-7797. Note: this footer is fully customizable.
8
Historical and Normalized Financial Statements
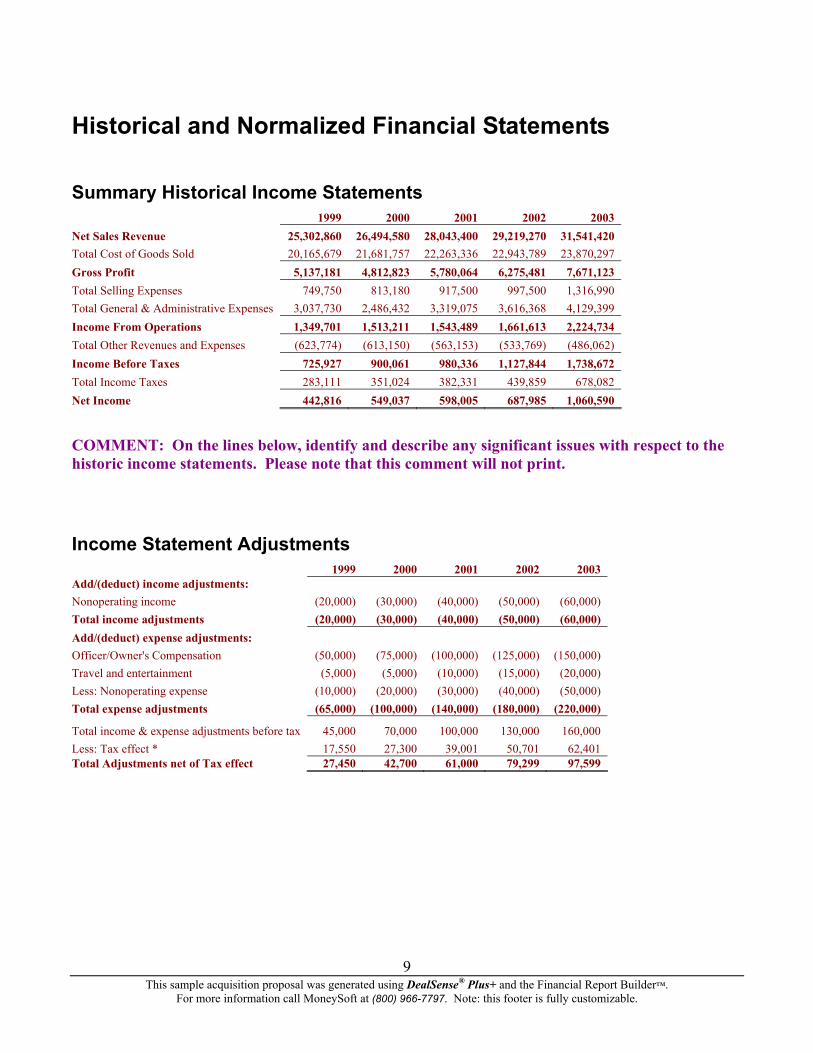
Summary Historical Income Statements 1999 2000 2001 2002 2003 Net Sales Revenue 25,302,860 26,494,580 28,043,400 29,219,270 31,541,420 Total Cost of Goods Sold 20,165,679 21,681,757 22,263,336 22,943,789 23,870,297 Gross Profit 5,137,181 4,812,823 5,780,064 6,275,481 7,671,123 Total Selling Expenses 749,750 813,180 917,500 997,500 1,316,990 Total General & Administrative Expenses 3,037,730 2,486,432 3,319,075 3,616,368 4,129,399 Income From Operations 1,349,701 1,513,211 1,543,489 1,661,613 2,224,734 Total Other Revenues and Expenses (623,774) (613,150) (563,153) (533,769) (486,062) Income Before Taxes 725,927 900,061 980,336 1,127,844 1,738,672 Total Income Taxes 283,111 351,024 382,331 439,859 678,082 Net Income 442,816 549,037 598,005 687,985 1,060,590
COMMENT: On the lines below, identify and describe any significant issues with respect to the historic income statements. Please note that this comment will not print.
Income Statement Adjustments 1999 2000 2001 2002 2003 Add/(deduct) income adjustments: Nonoperating income (20,000) (30,000) (40,000) (50,000) (60,000) Total income adjustments (20,000) (30,000) (40,000) (50,000) (60,000) Add/(deduct) expense adjustments: Officer/Owner's Compensation (50,000) (75,000) (100,000) (125,000) (150,000) Travel and entertainment (5,000) (5,000) (10,000) (15,000) (20,000) Less: Nonoperating expense (10,000) (20,000) (30,000) (40,000) (50,000) Total expense adjustments (65,000) (100,000) (140,000) (180,000) (220,000)
Total income & expense adjustments before tax 45,000 70,000 100,000 130,000 160,000 Less: Tax effect * 17,550 27,300 39,001 50,701 62,401 Total Adjustments net of Tax effect 27,450 42,700 61,000 79,299 97,599
This sample acquisition proposal was generated using DealSense® Plus+ and the Financial Report Builder™.
For more information call MoneySoft at (800) 966-7797. Note: this footer is fully customizable.
9
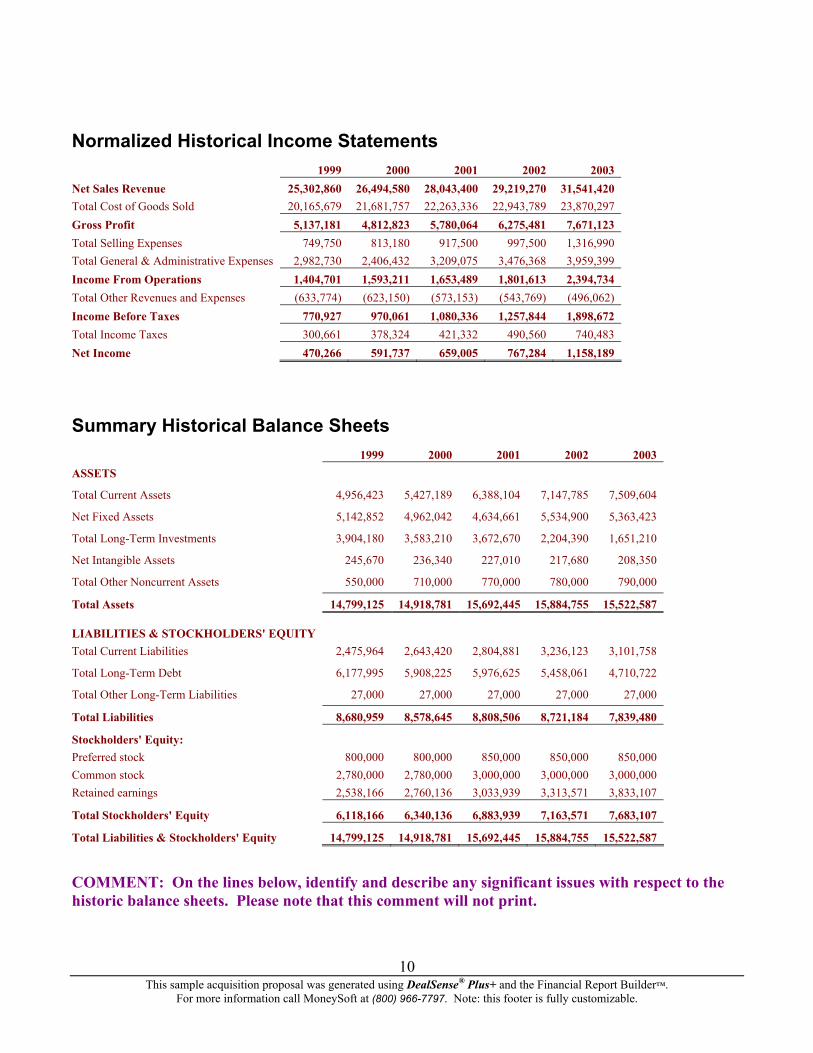
Normalized Historical Income Statements 1999 2000 2001 2002 2003 Net Sales Revenue 25,302,860 26,494,580 28,043,400 29,219,270 31,541,420 Total Cost of Goods Sold 20,165,679 21,681,757 22,263,336 22,943,789 23,870,297 Gross Profit 5,137,181 4,812,823 5,780,064 6,275,481 7,671,123 Total Selling Expenses 749,750 813,180 917,500 997,500 1,316,990 Total General & Administrative Expenses 2,982,730 2,406,432 3,209,075 3,476,368 3,959,399 Income From Operations 1,404,701 1,593,211 1,653,489 1,801,613 2,394,734 Total Other Revenues and Expenses (633,774) (623,150) (573,153) (543,769) (496,062) Income Before Taxes 770,927 970,061 1,080,336 1,257,844 1,898,672 Total Income Taxes 300,661 378,324 421,332 490,560 740,483 Net Income 470,266 591,737 659,005 767,284 1,158,189
Summary Historical Balance Sheets 1999 2000 2001 2002 2003 ASSETS
Total Current Assets 4,956,423 5,427,189 6,388,104 7,147,785 7,509,604
Net Fixed Assets 5,142,852 4,962,042 4,634,661 5,534,900 5,363,423
Total Long-Term Investments 3,904,180 3,583,210 3,672,670 2,204,390 1,651,210
Net Intangible Assets 245,670 236,340 227,010 217,680 208,350
Total Other Noncurrent Assets 550,000 710,000 770,000 780,000 790,000
Total Assets 14,799,125 14,918,781 15,692,445 15,884,755 15,522,587
LIABILITIES & STOCKHOLDERS' EQUITY Total Current Liabilities 2,475,964 2,643,420 2,804,881 3,236,123 3,101,758
Total Long-Term Debt 6,177,995 5,908,225 5,976,625 5,458,061 4,710,722
Total Other Long-Term Liabilities 27,000 27,000 27,000 27,000 27,000
Total Liabilities 8,680,959 8,578,645 8,808,506 8,721,184 7,839,480
Stockholders' Equity: Preferred stock 800,000 800,000 850,000 850,000 850,000 Common stock 2,780,000 2,780,000 3,000,000 3,000,000 3,000,000 Retained earnings 2,538,166 2,760,136 3,033,939 3,313,571 3,833,107
Total Stockholders' Equity 6,118,166 6,340,136 6,883,939 7,163,571 7,683,107
10
Total Liabilities & Stockholders' Equity 14,799,125 14,918,781 15,692,445 15,884,755 15,522,587
COMMENT: On the lines below, identify and describe any significant issues with respect to the historic balance sheets. Please note that this comment will not print.
This sample acquisition proposal was generated using DealSense® Plus+ and the Financial Report Builder™. For more information call MoneySoft at (800) 966-7797. Note: this footer is fully customizable.
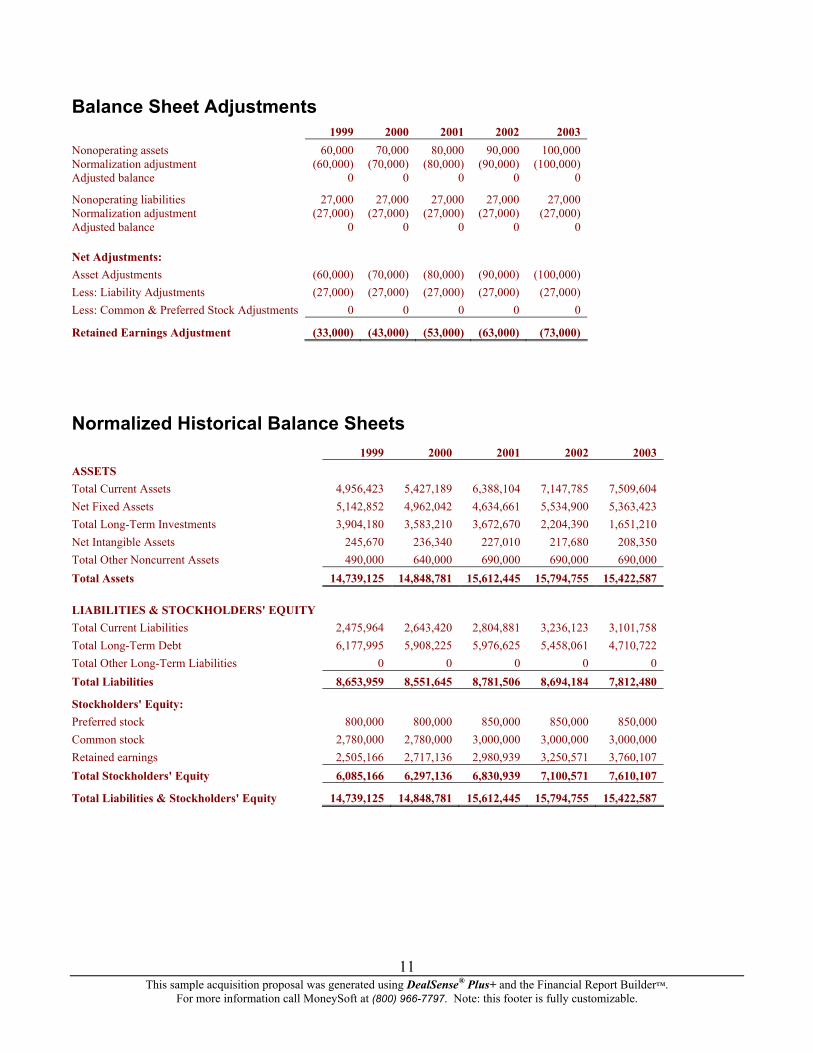
Balance Sheet Adjustments 1999 2000 2001 2002 2003 Nonoperating assets 60,000 70,000 80,000 90,000 100,000 Normalization adjustment (60,000) (70,000) (80,000) (90,000) (100,000) Adjusted balance 0 0 0 0 0
Nonoperating liabilities 27,000 27,000 27,000 27,000 27,000 Normalization adjustment (27,000) (27,000) (27,000) (27,000) (27,000) Adjusted balance 0 0 0 0 0
Net Adjustments: Asset Adjustments (60,000) (70,000) (80,000) (90,000) (100,000) Less: Liability Adjustments (27,000) (27,000) (27,000) (27,000) (27,000) Less: Common & Preferred Stock Adjustments 0 0 0 0 0
Retained Earnings Adjustment (33,000) (43,000) (53,000) (63,000) (73,000)
Normalized Historical Balance Sheets 1999 2000 2001 2002 2003 ASSETS Total Current Assets 4,956,423 5,427,189 6,388,104 7,147,785 7,509,604 Net Fixed Assets 5,142,852 4,962,042 4,634,661 5,534,900 5,363,423 Total Long-Term Investments 3,904,180 3,583,210 3,672,670 2,204,390 1,651,210 Net Intangible Assets 245,670 236,340 227,010 217,680 208,350 Total Other Noncurrent Assets 490,000 640,000 690,000 690,000 690,000 Total Assets 14,739,125 14,848,781 15,612,445 15,794,755 15,422,587
LIABILITIES & STOCKHOLDERS' EQUITY Total Current Liabilities 2,475,964 2,643,420 2,804,881 3,236,123 3,101,758 Total Long-Term Debt 6,177,995 5,908,225 5,976,625 5,458,061 4,710,722 Total Other Long-Term Liabilities 0 0 0 0 0 Total Liabilities 8,653,959 8,551,645 8,781,506 8,694,184 7,812,480
Stockholders' Equity: Preferred stock 800,000 800,000 850,000 850,000 850,000 Common stock 2,780,000 2,780,000 3,000,000 3,000,000 3,000,000 Retained earnings 2,505,166 2,717,136 2,980,939 3,250,571 3,760,107 Total Stockholders' Equity 6,085,166 6,297,136 6,830,939 7,100,571 7,610,107
Total Liabilities & Stockholders' Equity 14,739,125 14,848,781 15,612,445 15,794,755 15,422,587
This sample acquisition proposal was generated using DealSense® Plus+ and the Financial Report Builder™.
For more information call MoneySoft at (800) 966-7797. Note: this footer is fully customizable.
11
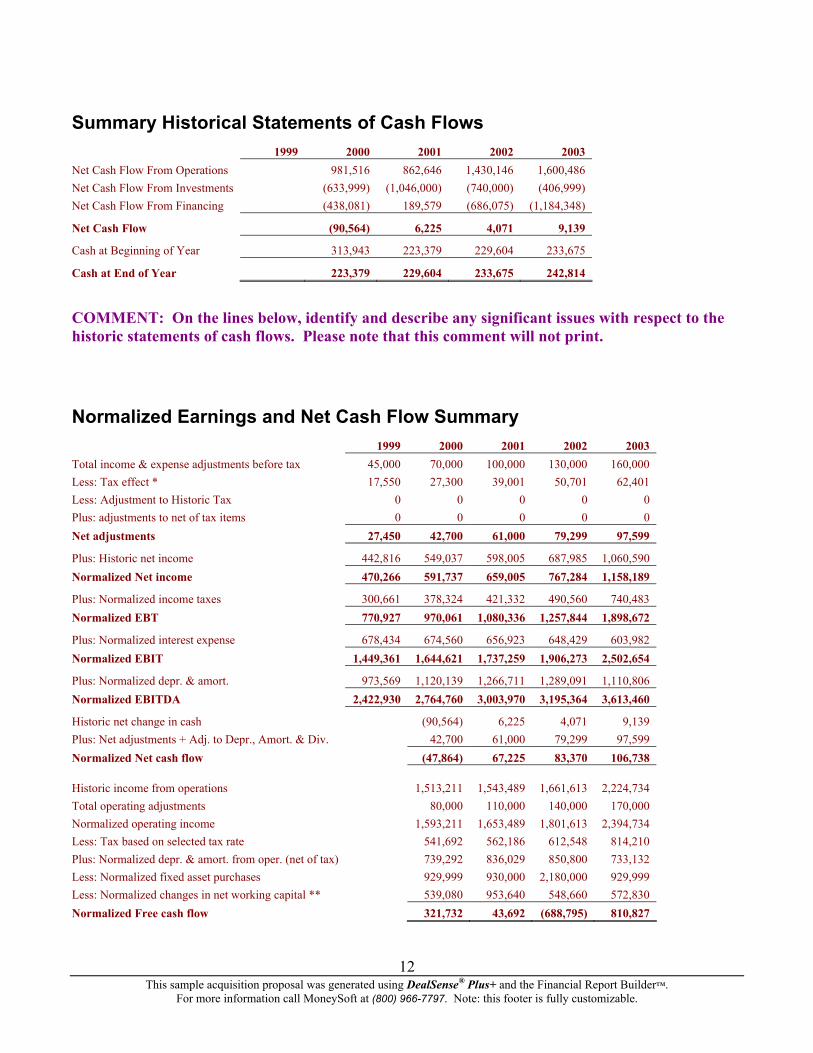
Summary Historical Statements of Cash Flows 1999 2000 2001 2002 2003 Net Cash Flow From Operations 981,516 862,646 1,430,146 1,600,486 Net Cash Flow From Investments (633,999) (1,046,000) (740,000) (406,999) Net Cash Flow From Financing (438,081) 189,579 (686,075) (1,184,348)
Net Cash Flow (90,564) 6,225 4,071 9,139
Cash at Beginning of Year 313,943 223,379 229,604 233,675
Cash at End of Year 223,379 229,604 233,675 242,814
COMMENT: On the lines below, identify and describe any significant issues with respect to the historic statements of cash flows. Please note that this comment will not print.
Normalized Earnings and Net Cash Flow Summary 1999 2000 2001 2002 2003 Total income & expense adjustments before tax 45,000 70,000 100,000 130,000 160,000 Less: Tax effect * 17,550 27,300 39,001 50,701 62,401 Less: Adjustment to Historic Tax 0 0 0 0 0 Plus: adjustments to net of tax items 0 0 0 0 0 Net adjustments 27,450 42,700 61,000 79,299 97,599
Plus: Historic net income 442,816 549,037 598,005 687,985 1,060,590 Normalized Net income 470,266 591,737 659,005 767,284 1,158,189
Plus: Normalized income taxes 300,661 378,324 421,332 490,560 740,483 Normalized EBT 770,927 970,061 1,080,336 1,257,844 1,898,672
Plus: Normalized interest expense 678,434 674,560 656,923 648,429 603,982 Normalized EBIT 1,449,361 1,644,621 1,737,259 1,906,273 2,502,654
Plus: Normalized depr. & amort. 973,569 1,120,139 1,266,711 1,289,091 1,110,806 Normalized EBITDA 2,422,930 2,764,760 3,003,970 3,195,364 3,613,460
Historic net change in cash (90,564) 6,225 4,071 9,139 Plus: Net adjustments + Adj. to Depr., Amort. & Div. 42,700 61,000 79,299 97,599 Normalized Net cash flow (47,864) 67,225 83,370 106,738
Historic income from operations 1,513,211 1,543,489 1,661,613 2,224,734 Total operating adjustments 80,000 110,000 140,000 170,000 Normalized operating income 1,593,211 1,653,489 1,801,613 2,394,734 Less: Tax based on selected tax rate 541,692 562,186 612,548 814,210 Plus: Normalized depr. & amort. from oper. (net of tax) 739,292 836,029 850,800 733,132 Less: Normalized fixed asset purchases 929,999 930,000 2,180,000 929,999 Less: Normalized changes in net working capital ** 539,080 953,640 548,660 572,830 Normalized Free cash flow 321,732 43,692 (688,795) 810,827
This sample acquisition proposal was generated using DealSense® Plus+ and the Financial Report Builder™.
For more information call MoneySoft at (800) 966-7797. Note: this footer is fully customizable.
12
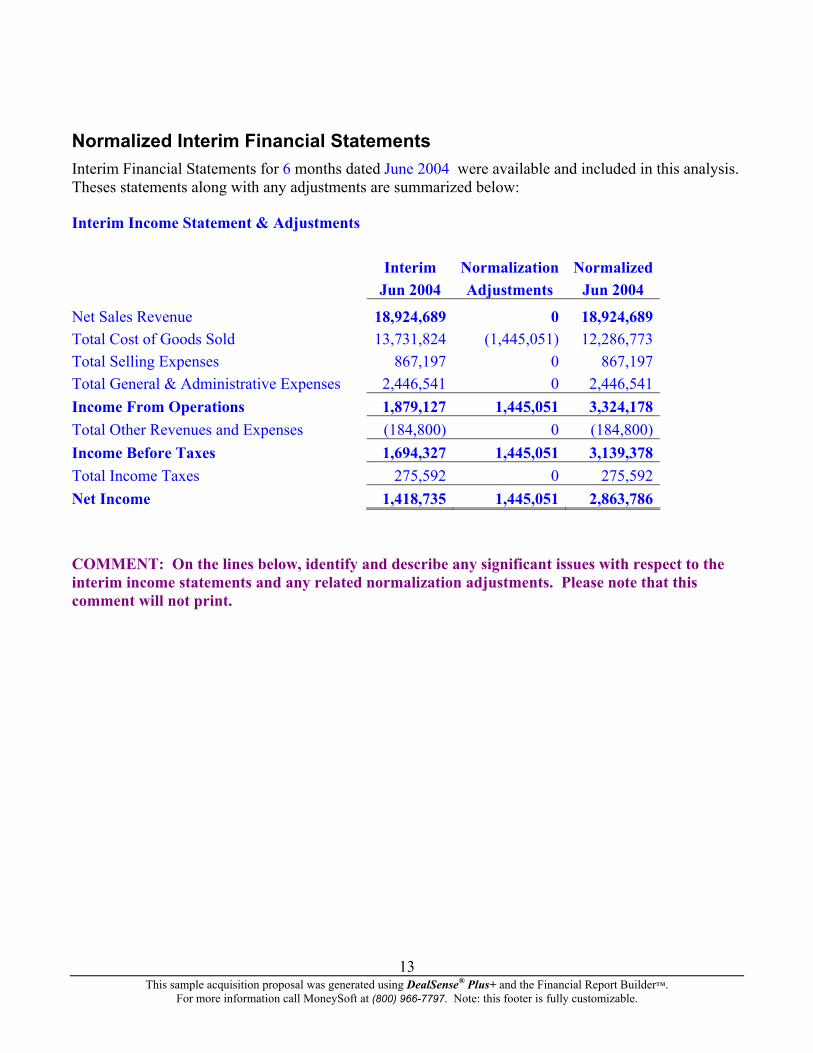
Normalized Interim Financial Statements Interim Financial Statements for 6 months dated June 2004 were available and included in this analysis. Theses statements along with any adjustments are summarized below:
Interim Income Statement & Adjustments Interim Normalization Normalized Jun 2004 Adjustments Jun 2004
18,924,689 0 18,924,689Net Sales RevenueTotal Cost of Goods Sold 13,731,824 (1,445,051) 12,286,773Total Selling Expenses 867,197 0 867,197Total General & Administrative Expenses 2,446,541 0 2,446,541Income From Operations 1,879,127 1,445,051 3,324,178Total Other Revenues and Expenses (184,800) 0 (184,800)Income Before Taxes 1,694,327 1,445,051 3,139,378Total Income Taxes 275,592 0 275,592Net Income 1,418,735 1,445,051 2,863,786
COMMENT: On the lines below, identify and describe any significant issues with respect to the interim income statements and any related normalization adjustments. Please note that this comment will not print.
This sample acquisition proposal was generated using DealSense® Plus+ and the Financial Report Builder™.
For more information call MoneySoft at (800) 966-7797. Note: this footer is fully customizable.
13
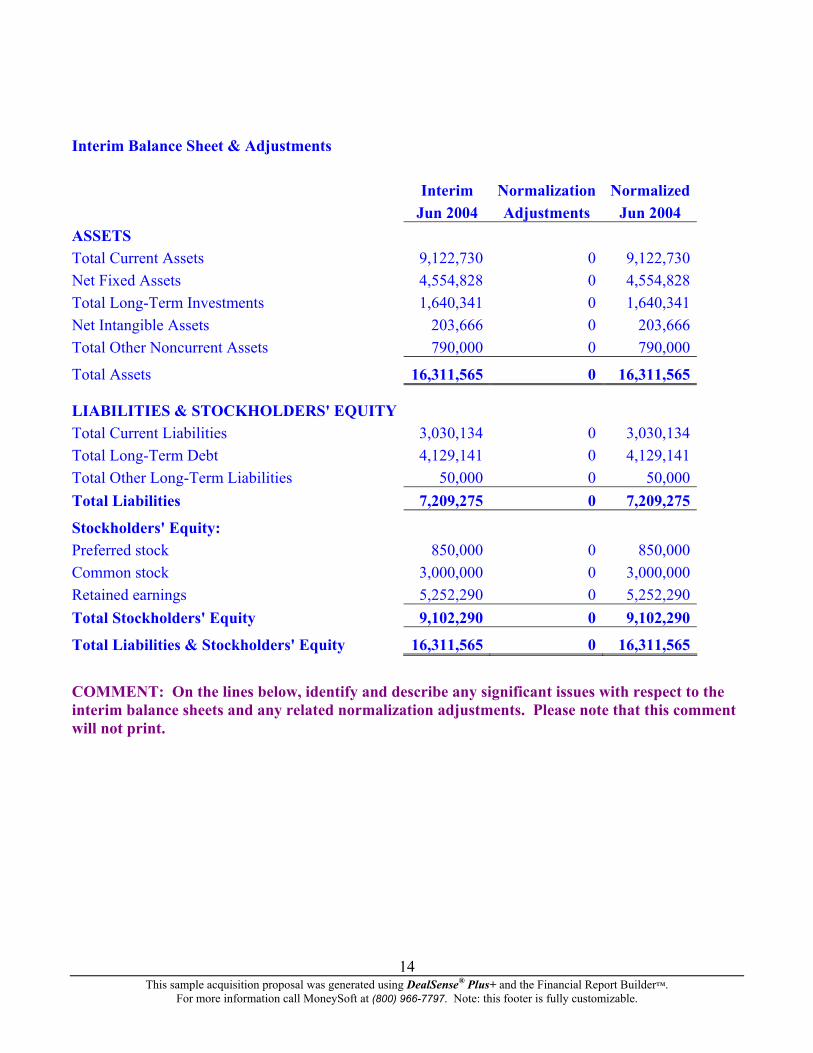
Interim Balance Sheet & Adjustments Interim Normalization Normalized Jun 2004 Adjustments Jun 2004ASSETS Total Current Assets 9,122,730 0 9,122,730Net Fixed Assets 4,554,828 0 4,554,828Total Long-Term Investments 1,640,341 0 1,640,341Net Intangible Assets 203,666 0 203,666Total Other Noncurrent Assets 790,000 0 790,000
Total Assets 16,311,565 0 16,311,565
LIABILITIES & STOCKHOLDERS' EQUITY Total Current Liabilities 3,030,134 0 3,030,134Total Long-Term Debt 4,129,141 0 4,129,141Total Other Long-Term Liabilities 50,000 0 50,000Total Liabilities 7,209,275 0 7,209,275
Stockholders' Equity: Preferred stock 850,000 0 850,000Common stock 3,000,000 0 3,000,000Retained earnings 5,252,290 0 5,252,290Total Stockholders' Equity 9,102,290 0 9,102,290
Total Liabilities & Stockholders' Equity 16,311,565 0 16,311,565
COMMENT: On the lines below, identify and describe any significant issues with respect to the interim balance sheets and any related normalization adjustments. Please note that this comment will not print.
This sample acquisition proposal was generated using DealSense® Plus+ and the Financial Report Builder™.
For more information call MoneySoft at (800) 966-7797. Note: this footer is fully customizable.
14
Analysis of Normalized Financial Statements
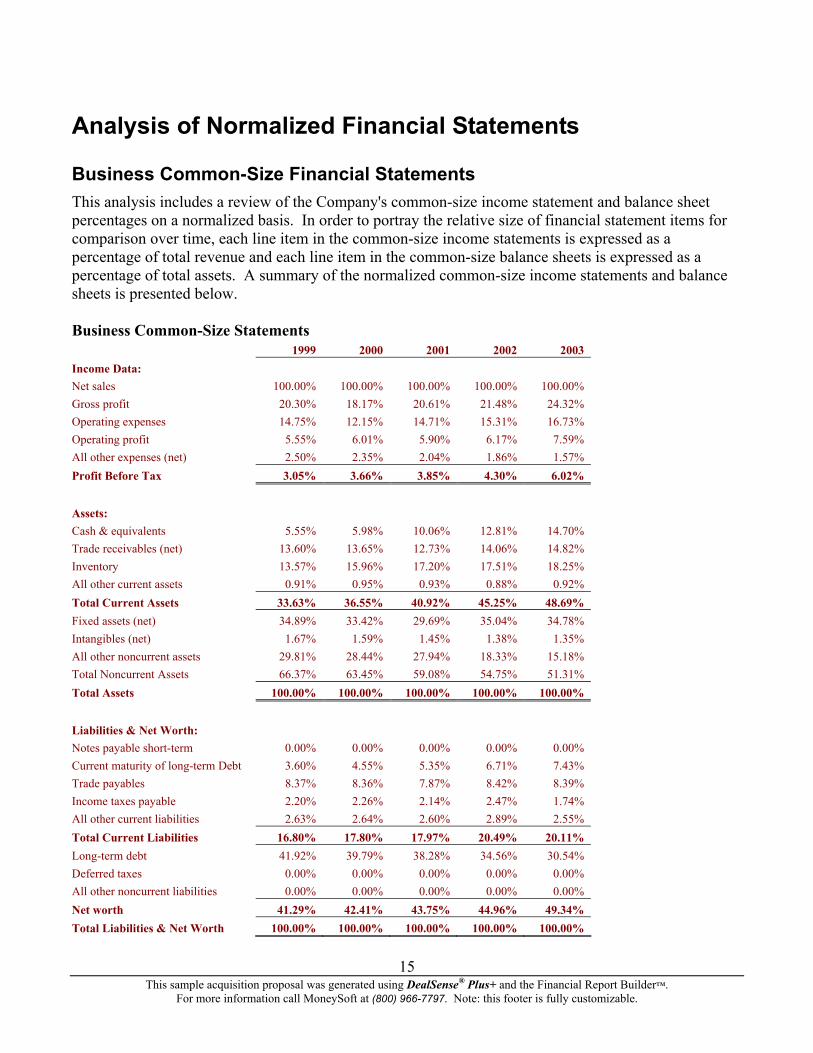
Business Common-Size Financial Statements This analysis includes a review of the Company's common-size income statement and balance sheet percentages on a normalized basis. In order to portray the relative size of financial statement items for comparison over time, each line item in the common-size income statements is expressed as a percentage of total revenue and each line item in the common-size balance sheets is expressed as a percentage of total assets. A summary of the normalized common-size income statements and balance sheets is presented below. Business Common-Size Statements 1999 2000 2001 2002 2003 Income Data: Net sales 100.00% 100.00% 100.00% 100.00% 100.00% Gross profit 20.30% 18.17% 20.61% 21.48% 24.32% Operating expenses 14.75% 12.15% 14.71% 15.31% 16.73% Operating profit 5.55% 6.01% 5.90% 6.17% 7.59% All other expenses (net) 2.50% 2.35% 2.04% 1.86% 1.57% Profit Before Tax 3.05% 3.66% 3.85% 4.30% 6.02% Assets: Cash & equivalents 5.55% 5.98% 10.06% 12.81% 14.70% Trade receivables (net) 13.60% 13.65% 12.73% 14.06% 14.82% Inventory 13.57% 15.96% 17.20% 17.51% 18.25% All other current assets 0.91% 0.95% 0.93% 0.88% 0.92% Total Current Assets 33.63% 36.55% 40.92% 45.25% 48.69% Fixed assets (net) 34.89% 33.42% 29.69% 35.04% 34.78% Intangibles (net) 1.67% 1.59% 1.45% 1.38% 1.35% All other noncurrent assets 29.81% 28.44% 27.94% 18.33% 15.18% Total Noncurrent Assets 66.37% 63.45% 59.08% 54.75% 51.31% Total Assets 100.00% 100.00% 100.00% 100.00% 100.00% Liabilities & Net Worth: Notes payable short-term 0.00% 0.00% 0.00% 0.00% 0.00% Current maturity of long-term Debt 3.60% 4.55% 5.35% 6.71% 7.43% Trade payables 8.37% 8.36% 7.87% 8.42% 8.39% Income taxes payable 2.20% 2.26% 2.14% 2.47% 1.74% All other current liabilities 2.63% 2.64% 2.60% 2.89% 2.55% Total Current Liabilities 16.80% 17.80% 17.97% 20.49% 20.11% Long-term debt 41.92% 39.79% 38.28% 34.56% 30.54% Deferred taxes 0.00% 0.00% 0.00% 0.00% 0.00% All other noncurrent liabilities 0.00% 0.00% 0.00% 0.00% 0.00% Net worth 41.29% 42.41% 43.75% 44.96% 49.34%
15
Total Liabilities & Net Worth 100.00% 100.00% 100.00% 100.00% 100.00%
This sample acquisition proposal was generated using DealSense® Plus+ and the Financial Report Builder™. For more information call MoneySoft at (800) 966-7797. Note: this footer is fully customizable.
COMMENT: On the lines below, identify and describe any significant trends or issues related to the Company's normalized common-size financial statements. Please note that this comment will not print.
Business vs. Industry Common-Size Financial Statements Sample Acquisition Candidate, Inc.'s common-size financial statements from the most recent historic year have been compared to composite, industry common-size financial statements from the SPORTING & ATHLETIC GOODS, NEC industry. To compare the business and industry statements and measure the differences quantitatively, a variance from industry and 5 year average variance from industry have been calculated for each line item. The source for the industry data used in both the common-size statement and financial ratio comparisons is RMA Annual Statement Studies using SIC Code number 3949. The industry data is categorized by All Sizes size of All sizes selected. The date of this industry information is 2003 with 140 different companies contained in the sample. Although industry statistics are a useful source of general analytical data, there can be significant variation in the reporting practices and operational methods of companies within a given industry. Therefore, industry statistics as used throughout this report should not be regarded as absolute norms or standards.
This sample acquisition proposal was generated using DealSense® Plus+ and the Financial Report Builder™.
For more information call MoneySoft at (800) 966-7797. Note: this footer is fully customizable.
16
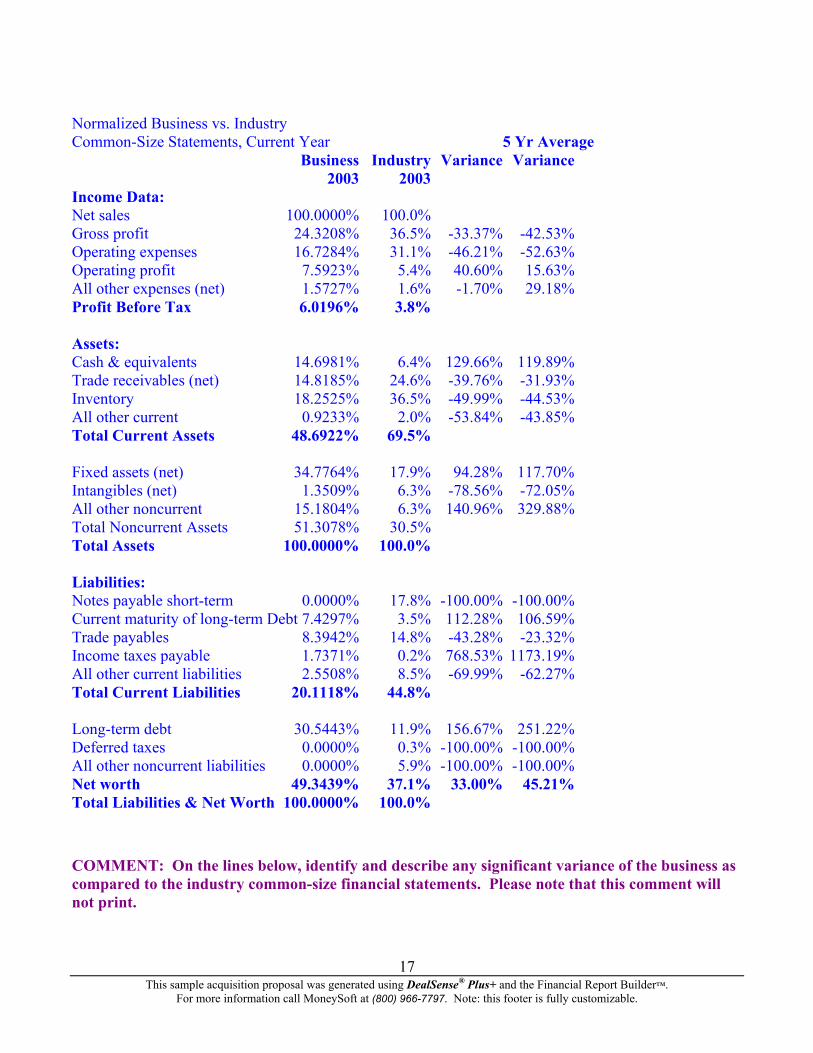
Normalized Business vs. Industry Common-Size Statements, Current Year 5 Yr Average Business Industry Variance Variance 2003 2003 Income Data: Net sales 100.0000% 100.0% Gross profit 24.3208% 36.5% -33.37% -42.53% Operating expenses 16.7284% 31.1% -46.21% -52.63% Operating profit 7.5923% 5.4% 40.60% 15.63% All other expenses (net) 1.5727% 1.6% -1.70% 29.18% Profit Before Tax 6.0196% 3.8% Assets: Cash & equivalents 14.6981% 6.4% 129.66% 119.89% Trade receivables (net) 14.8185% 24.6% -39.76% -31.93% Inventory 18.2525% 36.5% -49.99% -44.53% All other current 0.9233% 2.0% -53.84% -43.85% Total Current Assets 48.6922% 69.5% Fixed assets (net) 34.7764% 17.9% 94.28% 117.70% Intangibles (net) 1.3509% 6.3% -78.56% -72.05% All other noncurrent 15.1804% 6.3% 140.96% 329.88% Total Noncurrent Assets 51.3078% 30.5% Total Assets 100.0000% 100.0% Liabilities: Notes payable short-term 0.0000% 17.8% -100.00% -100.00% Current maturity of long-term Debt 7.4297% 3.5% 112.28% 106.59% Trade payables 8.3942% 14.8% -43.28% -23.32% Income taxes payable 1.7371% 0.2% 768.53% 1173.19% All other current liabilities 2.5508% 8.5% -69.99% -62.27% Total Current Liabilities 20.1118% 44.8% Long-term debt 30.5443% 11.9% 156.67% 251.22% Deferred taxes 0.0000% 0.3% -100.00% -100.00% All other noncurrent liabilities 0.0000% 5.9% -100.00% -100.00% Net worth 49.3439% 37.1% 33.00% 45.21% Total Liabilities & Net Worth 100.0000% 100.0%
COMMENT: On the lines below, identify and describe any significant variance of the business as compared to the industry common-size financial statements. Please note that this comment will not print.
This sample acquisition proposal was generated using DealSense® Plus+ and the Financial Report Builder™.
For more information call MoneySoft at (800) 966-7797. Note: this footer is fully customizable.
17
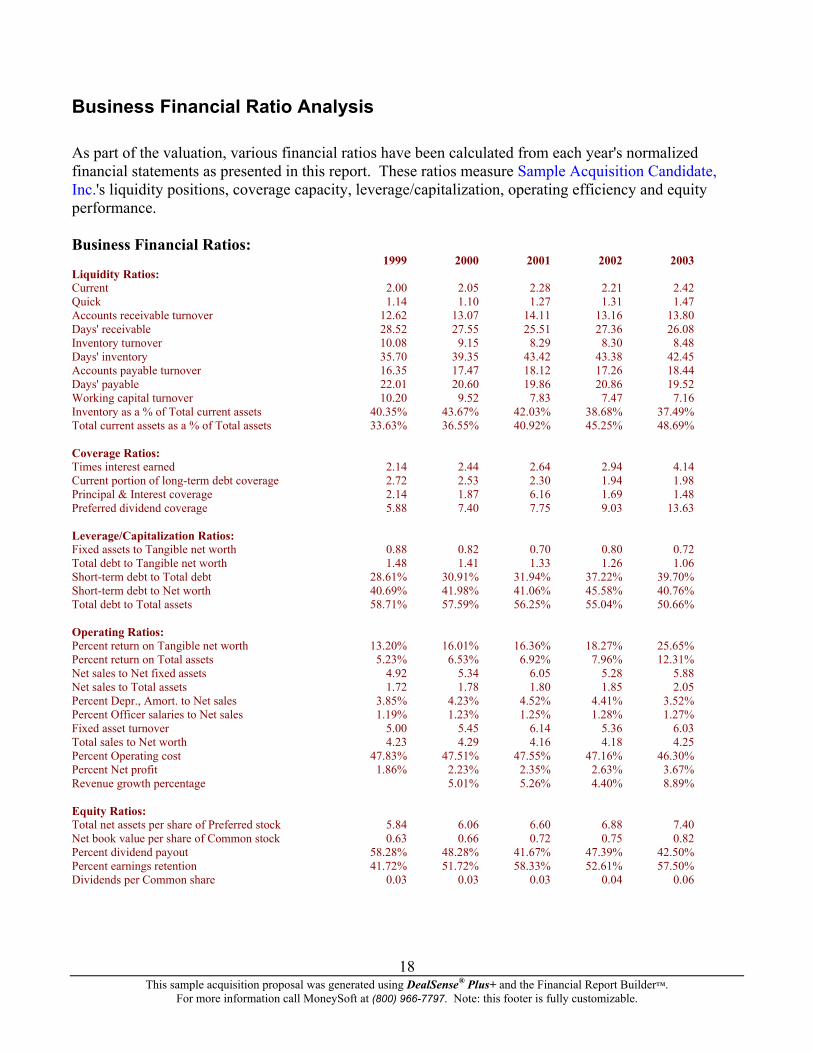
Business Financial Ratio Analysis As part of the valuation, various financial ratios have been calculated from each year's normalized financial statements as presented in this report. These ratios measure Sample Acquisition Candidate, Inc.'s liquidity positions, coverage capacity, leverage/capitalization, operating efficiency and equity performance. Business Financial Ratios: 1999 2000 2001 2002 2003 Liquidity Ratios: Current 2.00 2.05 2.28 2.21 2.42 Quick 1.14 1.10 1.27 1.31 1.47 Accounts receivable turnover 12.62 13.07 14.11 13.16 13.80 Days' receivable 28.52 27.55 25.51 27.36 26.08 Inventory turnover 10.08 9.15 8.29 8.30 8.48 Days' inventory 35.70 39.35 43.42 43.38 42.45 Accounts payable turnover 16.35 17.47 18.12 17.26 18.44 Days' payable 22.01 20.60 19.86 20.86 19.52 Working capital turnover 10.20 9.52 7.83 7.47 7.16 Inventory as a % of Total current assets 40.35% 43.67% 42.03% 38.68% 37.49% Total current assets as a % of Total assets 33.63% 36.55% 40.92% 45.25% 48.69% Coverage Ratios: Times interest earned 2.14 2.44 2.64 2.94 4.14 Current portion of long-term debt coverage 2.72 2.53 2.30 1.94 1.98 Principal & Interest coverage 2.14 1.87 6.16 1.69 1.48 Preferred dividend coverage 5.88 7.40 7.75 9.03 13.63 Leverage/Capitalization Ratios: Fixed assets to Tangible net worth 0.88 0.82 0.70 0.80 0.72 Total debt to Tangible net worth 1.48 1.41 1.33 1.26 1.06 Short-term debt to Total debt 28.61% 30.91% 31.94% 37.22% 39.70% Short-term debt to Net worth 40.69% 41.98% 41.06% 45.58% 40.76% Total debt to Total assets 58.71% 57.59% 56.25% 55.04% 50.66% Operating Ratios: Percent return on Tangible net worth 13.20% 16.01% 16.36% 18.27% 25.65% Percent return on Total assets 5.23% 6.53% 6.92% 7.96% 12.31% Net sales to Net fixed assets 4.92 5.34 6.05 5.28 5.88 Net sales to Total assets 1.72 1.78 1.80 1.85 2.05 Percent Depr., Amort. to Net sales 3.85% 4.23% 4.52% 4.41% 3.52% Percent Officer salaries to Net sales 1.19% 1.23% 1.25% 1.28% 1.27% Fixed asset turnover 5.00 5.45 6.14 5.36 6.03 Total sales to Net worth 4.23 4.29 4.16 4.18 4.25 Percent Operating cost 47.83% 47.51% 47.55% 47.16% 46.30% Percent Net profit 1.86% 2.23% 2.35% 2.63% 3.67% Revenue growth percentage 5.01% 5.26% 4.40% 8.89% Equity Ratios: Total net assets per share of Preferred stock 5.84 6.06 6.60 6.88 7.40 Net book value per share of Common stock 0.63 0.66 0.72 0.75 0.82 Percent dividend payout 58.28% 48.28% 41.67% 47.39% 42.50% Percent earnings retention 41.72% 51.72% 58.33% 52.61% 57.50% Dividends per Common share 0.03 0.03 0.03 0.04 0.06
This sample acquisition proposal was generated using DealSense® Plus+ and the Financial Report Builder™.
For more information call MoneySoft at (800) 966-7797. Note: this footer is fully customizable.
18
Financial Ratios Notes and Discussion of Trends: 1. Liquidity ratios measure the short-term ability of a company to meet its maturing obligations. 2. Coverage ratios measure the degree of protection for long-term creditors and investors and the margin by which certain obligations of a company can be met. 3. Leverage/capitalization ratios measure the amount of a company's operations that are financed from debt versus financed from equity. 4. Operating ratios measure the efficiency and productivity of a company using the resources that are available and the returns on sales and investments. 5. Equity ratios measure the performance of assets and earnings in relation to common and preferred equity.
COMMENT: For each group of ratios listed above, identify the importance of any individual ratios and discuss any significant trends over time. Please note that this comment will not print.
This sample acquisition proposal was generated using DealSense® Plus+ and the Financial Report Builder™.
For more information call MoneySoft at (800) 966-7797. Note: this footer is fully customizable.
19
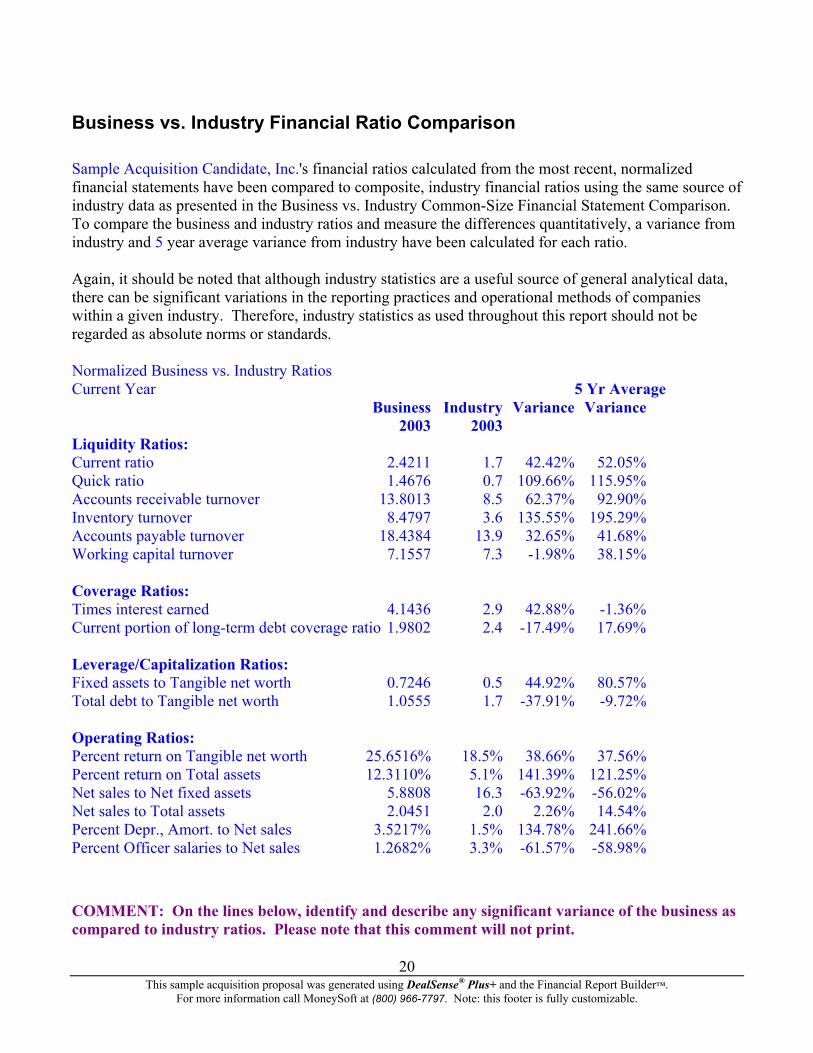
Business vs. Industry Financial Ratio Comparison Sample Acquisition Candidate, Inc.'s financial ratios calculated from the most recent, normalized financial statements have been compared to composite, industry financial ratios using the same source of industry data as presented in the Business vs. Industry Common-Size Financial Statement Comparison. To compare the business and industry ratios and measure the differences quantitatively, a variance from industry and 5 year average variance from industry have been calculated for each ratio. Again, it should be noted that although industry statistics are a useful source of general analytical data, there can be significant variations in the reporting practices and operational methods of companies within a given industry. Therefore, industry statistics as used throughout this report should not be regarded as absolute norms or standards. Normalized Business vs. Industry Ratios Current Year 5 Yr Average Business Industry Variance Variance 2003 2003 Liquidity Ratios: Current ratio 2.4211 1.7 42.42% 52.05% Quick ratio 1.4676 0.7 109.66% 115.95% Accounts receivable turnover 13.8013 8.5 62.37% 92.90% Inventory turnover 8.4797 3.6 135.55% 195.29% Accounts payable turnover 18.4384 13.9 32.65% 41.68% Working capital turnover 7.1557 7.3 -1.98% 38.15% Coverage Ratios: Times interest earned 4.1436 2.9 42.88% -1.36% Current portion of long-term debt coverage ratio 1.9802 2.4 -17.49% 17.69% Leverage/Capitalization Ratios: Fixed assets to Tangible net worth 0.7246 0.5 44.92% 80.57% Total debt to Tangible net worth 1.0555 1.7 -37.91% -9.72% Operating Ratios: Percent return on Tangible net worth 25.6516% 18.5% 38.66% 37.56% Percent return on Total assets 12.3110% 5.1% 141.39% 121.25% Net sales to Net fixed assets 5.8808 16.3 -63.92% -56.02% Net sales to Total assets 2.0451 2.0 2.26% 14.54% Percent Depr., Amort. to Net sales 3.5217% 1.5% 134.78% 241.66% Percent Officer salaries to Net sales 1.2682% 3.3% -61.57% -58.98%
COMMENT: On the lines below, identify and describe any significant variance of the business as compared to industry ratios. Please note that this comment will not print.
This sample acquisition proposal was generated using DealSense® Plus+ and the Financial Report Builder™.
For more information call MoneySoft at (800) 966-7797. Note: this footer is fully customizable.
20

Z-Score Risk Assessment (Historic Normalized) The Z-Score is calculated for each full year of the historic financial statements on both an unadjusted and normalized basis and is intended to aid in the assessment of the target company’s future viability. The Z-Score is a predictive model developed by Edward I Altman, Ph.D., that indicates the likelihood that a company will become insolvent within the next twelve months. Altman’s book, Corporate Financial Distress and Bankruptcy, Second Edition, states that the Z-Score predicted the bankruptcy filings of sample companies within 12 months with 95% accuracy, and that in later studies based on more extensive samples, over different time periods and under different economic conditions, the Z-Score still sustained 82%-85% accuracy. 1999 2000 2001 2002 2003 Z-Score Ratio Components Total Revenue 25,302,860 26,494,580 28,043,400 29,219,270 31,541,420 EBIT 1,449,361 1,644,621 1,737,259 1,906,273 2,502,654 Working Capital 2,480,459 2,783,769 3,583,223 3,911,662 4,407,846 Tangible Total Assets 14,493,455 14,612,441 15,385,435 15,577,075 15,214,237 Total Liabilities 8,653,959 8,551,645 8,781,506 8,694,184 7,812,480 Tangible Retained Earnings 2,505,166 2,717,136 2,980,939 3,250,571 3,760,107 Tangible Net Worth 5,839,496 6,060,796 6,603,929 6,882,891 7,401,757 Private Non-Manufacturing Company Ratios & Weighting Working Capital / Tangible Total Assets x (6.56) 1.12 1.25 1.53 1.65 1.90 Tangible Retained Earnings / Tangible Total Assets x (3.26) 0.56 0.61 0.63 0.68 0.81 EBIT / Tangible Total Assets x (6.72) 0.67 0.76 0.76 0.82 1.11 Tangible Net Worth / Total Liabilities x (1.05) 0.71 0.74 0.79 0.83 0.99 Total Z-Score 3.07 3.36 3.71 3.98 4.81 Private Non-Manufacturing Z-Score Scale 2.60 and up = Bankruptcy unlikely 1.11 to 2.59 = Monitoring and corrective action required 1.10 and less = Bankruptcy Likely Private Manufacturing Ratios & Weighting Working Capital / Tangible Total Assets x (.717) 0.12 0.14 0.17 0.18 0.21 Tangible Retained Earnings / Tangible Total Assets x (.847) 0.15 0.16 0.16 0.18 0.21 EBIT / Tangible Total Assets x (3.1) 0.31 0.35 0.35 0.38 0.51 Tangible Net Worth / Total Liabilities x (.42) 0.28 0.30 0.32 0.33 0.40 Sales / Tangible Total Assets x (.998) 1.74 1.81 1.82 1.87 2.07 Total Z-Score 2.60 2.75 2.82 2.94 3.39 Private Manufacturing Z-Score Scale 2.90 and up = Bankruptcy unlikely 1.24 to 2.89 = Monitoring and corrective action required 1.23 and less = Bankruptcy Likely
This sample acquisition proposal was generated using DealSense® Plus+ and the Financial Report Builder™.
For more information call MoneySoft at (800) 966-7797. Note: this footer is fully customizable.
21
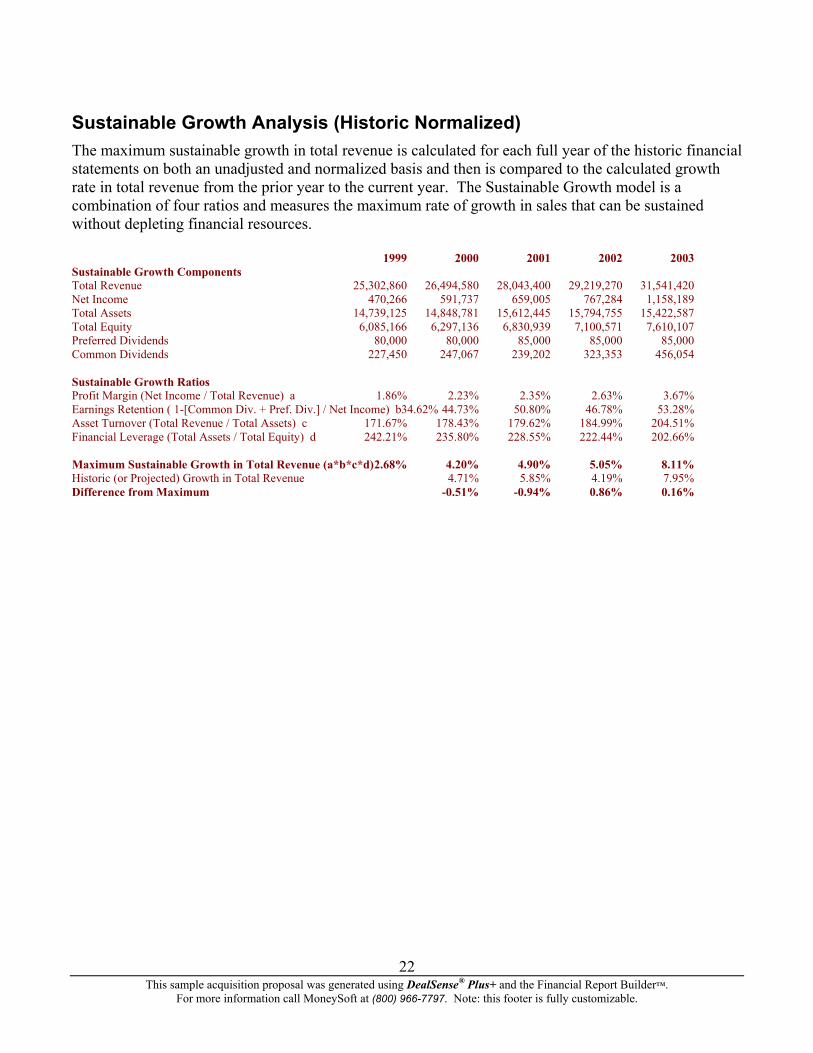
Sustainable Growth Analysis (Historic Normalized) The maximum sustainable growth in total revenue is calculated for each full year of the historic financial statements on both an unadjusted and normalized basis and then is compared to the calculated growth rate in total revenue from the prior year to the current year. The Sustainable Growth model is a combination of four ratios and measures the maximum rate of growth in sales that can be sustained without depleting financial resources. 1999 2000 2001 2002 2003 Sustainable Growth Components Total Revenue 25,302,860 26,494,580 28,043,400 29,219,270 31,541,420 Net Income 470,266 591,737 659,005 767,284 1,158,189 Total Assets 14,739,125 14,848,781 15,612,445 15,794,755 15,422,587 Total Equity 6,085,166 6,297,136 6,830,939 7,100,571 7,610,107 Preferred Dividends 80,000 80,000 85,000 85,000 85,000 Common Dividends 227,450 247,067 239,202 323,353 456,054 Sustainable Growth Ratios Profit Margin (Net Income / Total Revenue) a 1.86% 2.23% 2.35% 2.63% 3.67% Earnings Retention ( 1-[Common Div. + Pref. Div.] / Net Income) b34.62% 44.73% 50.80% 46.78% 53.28% Asset Turnover (Total Revenue / Total Assets) c 171.67% 178.43% 179.62% 184.99% 204.51% Financial Leverage (Total Assets / Total Equity) d 242.21% 235.80% 228.55% 222.44% 202.66% Maximum Sustainable Growth in Total Revenue (a*b*c*d) 2.68% 4.20% 4.90% 5.05% 8.11% Historic (or Projected) Growth in Total Revenue 4.71% 5.85% 4.19% 7.95% Difference from Maximum -0.51% -0.94% 0.86% 0.16%
This sample acquisition proposal was generated using DealSense® Plus+ and the Financial Report Builder™.
For more information call MoneySoft at (800) 966-7797. Note: this footer is fully customizable.
22
Valuation of Sample Acquisition Candidate, Inc.The objective of this valuation is to estimate the Fair Market Value of 100.00% of the common stock of Sample Acquisition Candidate, Inc. as of June 30, 2004 for the purpose as set forth in this Valuation Report. The standard of value used in our valuation of Sample Acquisition Candidate, Inc. is Fair Market Value. Fair Market Value is the price, in terms of cash or equivalent, that a buyer could reasonably be expected to pay, and a seller could reasonably be expected to accept, if the business were exposed for sale on the open market for a reasonable period of time, with both buyer and seller being in possession of the pertinent facts and neither being under any compulsion to act. There is a large number of factors to consider when estimating the common stock value of any business entity. These factors vary for each valuation depending on the unique circumstances of the business enterprise and general economic conditions that exist at the effective date of the valuation. However, fundamental guidelines of the factors to consider in any valuation have been established. The most commonly used valuation guidelines are derived from the Internal Revenue Service’s Revenue Ruling 59-60. Revenue Ruling 59-60 states that in the valuation of the stock of closely held businesses, the following factors, although not all inclusive, are fundamental and require careful consideration in each case:
a) The nature of the business and the history of the enterprise from its inception. b) The economic outlook in general and the condition and outlook of the specific industry in
particular. c) The book value of the stock and the financial condition of the business. d) The earning capacity of the company. e) The dividend-paying capacity. f) Whether or not the enterprise has goodwill or other intangible value. g) Sales of the stock and the size of the block of stock to be valued. h) The market price of stocks of corporations engaged in the same or a similar line of business
having their stocks actively traded in a free and open market, either on an exchange or over-the-counter.
Based on circumstances unique to Sample Acquisition Candidate, Inc. as of June 30, 2004, additional factors have been considered.
COMMENT: Identify and describe all additional factors considered significant in relation to the subject company at the date of the valuation. Please note that this comment will not print. In addition to providing general valuation guidelines, Revenue Ruling 59-60 outlines other considerations and techniques for valuing the stock of closely held businesses. The techniques are commonly divided into general approaches, i.e., the Asset, Income, Market, and Other approaches. Specific methods are then used to estimate the value of the total business entity under each approach.
This sample acquisition proposal was generated using DealSense® Plus+ and the Financial Report Builder™.
For more information call MoneySoft at (800) 966-7797. Note: this footer is fully customizable.
23
Our conclusion of Fair Market Value is determined based on the results of these methods and the specific circumstances surrounding the interest being valued.
Overview of Valuation Approaches and Methods
As previously specified, various approaches have been used to value Sample Acquisition Candidate, Inc. These approaches, described below, are the: 1) Asset Approach, 2) Income Approach, 3) Market Approach, and 4) Other. The Asset Approach is generally considered to yield the minimum benchmark of value for an operating enterprise. The most common methods within this approach are Net Asset Value and Liquidation Value. Net Asset Value represents net equity of the business after assets and liabilities have been adjusted to their fair market values. The Liquidation Value of the business represents the present value of the estimated net proceeds from liquidating the Company's assets and paying off its liabilities. The Income Approach serves to estimate value by considering the income (benefits) generated by the asset over a period of time. This approach is based on the fundamental valuation principle that the value of a business is equal to the present worth of the future benefits of ownership. The term income does not necessarily refer to income in the accounting sense but to future benefits accruing to the owner. The most common methods under this approach are Capitalization of Earnings and Discounted Future Earnings. Under the Capitalization of Earnings method, normalized historic earnings are capitalized at a rate that reflects the risk inherent in the expected future growth in those earnings. The Discounted Future Earnings method discounts projected future earnings back to present value at a rate that reflects the risk inherent in the projected earnings. The Market Approach compares the subject company to the prices of similar companies operating in the same industry that are either publicly traded or, if privately-owned, have been sold recently. A common problem for privately owned businesses is a lack of publicly available comparable data. The Other methods consist of valuation methods that cannot be classified into one of the previously discussed approaches. The methods utilized in the Other Approach are Capitalization of Excess Earnings and Multiple of Discretionary Earnings. Commonly referred to as the “formula method,” the Capitalization of Excess Earnings method determines the value of tangible and intangible assets separately and combines these component values for an indication of total entity value. Under the Multiple of Discretionary Earnings method, the entity is valued based on a multiple of “discretionary earnings,” i.e., earnings available to the owner who is also a manager. Both of these methods are normally used to value small businesses and professional practices. The methods utilized under each approach are presented and discussed in the following sections. COMMENT: The following sections discuss all of the valuation methods available in the Corporate Valuation program and their respective results. You are encouraged to modify these sections for each different valuation engagement as follows:
• Discuss the selection process used to accept and reject the individual valuation methods and identify your selection criteria.
This sample acquisition proposal was generated using DealSense® Plus+ and the Financial Report Builder™.
For more information call MoneySoft at (800) 966-7797. Note: this footer is fully customizable.
24
• Delete the discussions of and calculations for methods that were not considered. However, you should include an explanation of why each method was rejected.
• Discuss any methods that were considered but not used in the valuation conclusions and explain why the methods were not accepted.
• Elaborate on the methods that were used in the valuation conclusions, explain why they were accepted and discuss the relative weight or emphasis place on each method in the valuation conclusions.
• If any past transactions in the subject company’s stock have been identified, discuss why they were either accepted or rejected in the valuation conclusions.
Please note that this comment will not print.
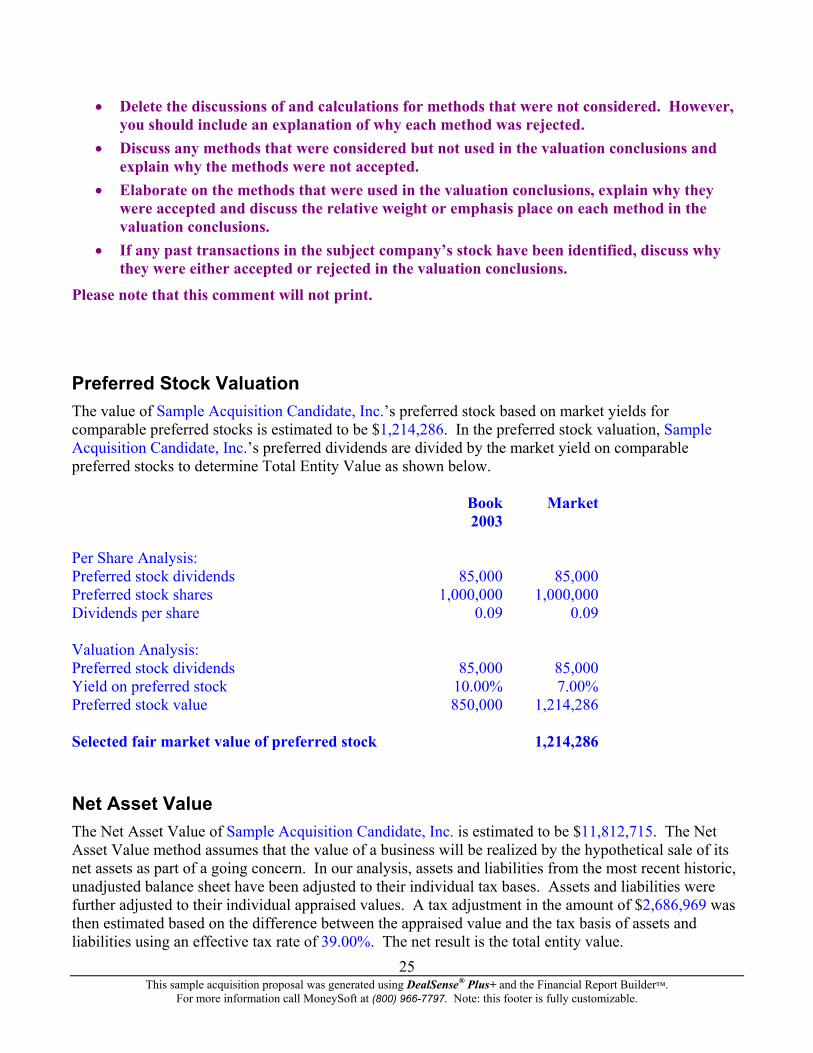
Preferred Stock Valuation The value of Sample Acquisition Candidate, Inc.’s preferred stock based on market yields for comparable preferred stocks is estimated to be $1,214,286. In the preferred stock valuation, Sample Acquisition Candidate, Inc.’s preferred dividends are divided by the market yield on comparable preferred stocks to determine Total Entity Value as shown below. Book Market 2003 Per Share Analysis: Preferred stock dividends 85,000 85,000 Preferred stock shares 1,000,000 1,000,000 Dividends per share 0.09 0.09 Valuation Analysis: Preferred stock dividends 85,000 85,000 Yield on preferred stock 10.00% 7.00% Preferred stock value 850,000 1,214,286 Selected fair market value of preferred stock 1,214,286
Net Asset Value The Net Asset Value of Sample Acquisition Candidate, Inc. is estimated to be $11,812,715. The Net Asset Value method assumes that the value of a business will be realized by the hypothetical sale of its net assets as part of a going concern. In our analysis, assets and liabilities from the most recent historic, unadjusted balance sheet have been adjusted to their individual tax bases. Assets and liabilities were further adjusted to their individual appraised values. A tax adjustment in the amount of $2,686,969 was then estimated based on the difference between the appraised value and the tax basis of assets and liabilities using an effective tax rate of 39.00%. The net result is the total entity value.
This sample acquisition proposal was generated using DealSense® Plus+ and the Financial Report Builder™. For more information call MoneySoft at (800) 966-7797. Note: this footer is fully customizable.
25
Liquidation Value The Liquidation Value of Sample Acquisition Candidate, Inc. is estimated to be $7,921,780. Liquidation Value is defined as the present value of the net cash remaining if all assets are sold in a quick and orderly, piecemeal sale and all liabilities are paid at face value with the proceeds. In our analysis, the appraised value of individual assets and liabilities have been adjusted to reflect the value that could be obtained in a quick and orderly liquidation. A tax adjustment in the amount of $199,270 was then estimated based on the difference between the appraised value and the tax basis of assets and liabilities using an effective tax rate of 39.00%. In addition, estimated liquidation costs in the amount of $273,802 have been deducted. The net result is the total entity value. See the Liquidation Value schedule for detailed value calculations and the Estimated Liquidation Cost schedule for the calculation of estimated liquidation costs.
This sample acquisition proposal was generated using DealSense® Plus+ and the Financial Report Builder™.
For more information call MoneySoft at (800) 966-7797. Note: this footer is fully customizable.
26
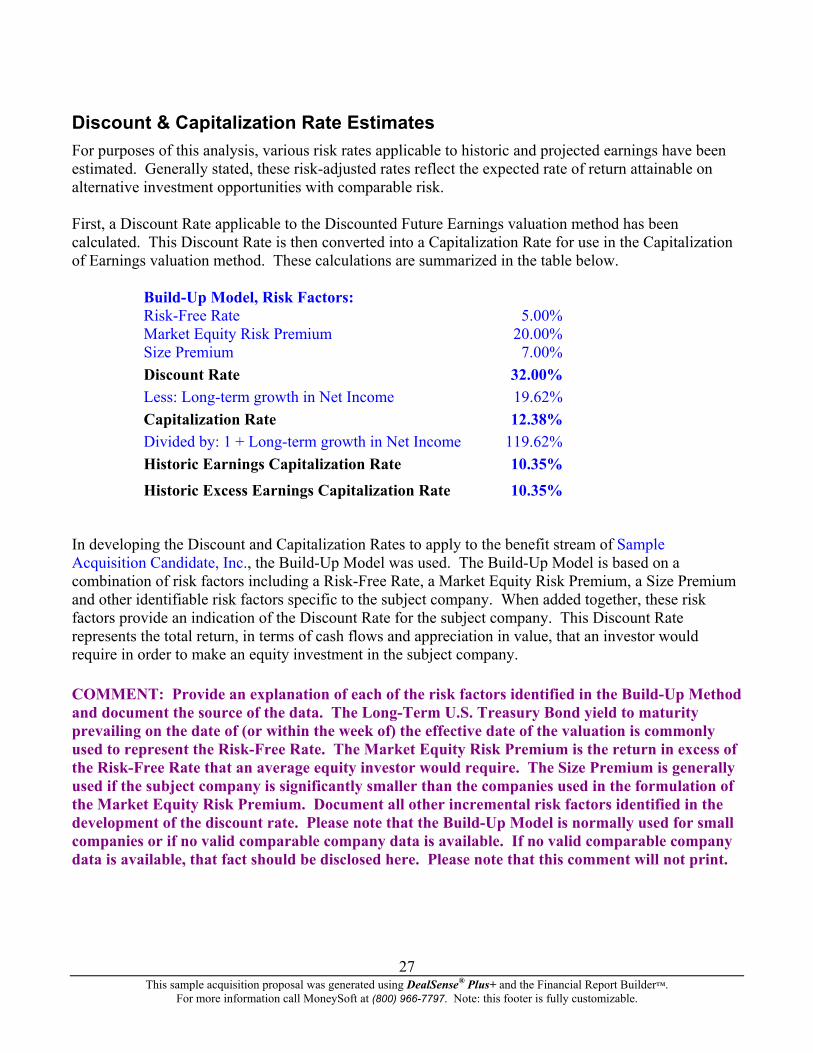
Discount & Capitalization Rate Estimates For purposes of this analysis, various risk rates applicable to historic and projected earnings have been estimated. Generally stated, these risk-adjusted rates reflect the expected rate of return attainable on alternative investment opportunities with comparable risk. First, a Discount Rate applicable to the Discounted Future Earnings valuation method has been calculated. This Discount Rate is then converted into a Capitalization Rate for use in the Capitalization of Earnings valuation method. These calculations are summarized in the table below.
Build-Up Model, Risk Factors: Risk-Free Rate 5.00% Market Equity Risk Premium 20.00% Size Premium 7.00% Discount Rate 32.00% Less: Long-term growth in Net Income 19.62% Capitalization Rate 12.38% Divided by: 1 + Long-term growth in Net Income 119.62% Historic Earnings Capitalization Rate 10.35% Historic Excess Earnings Capitalization Rate 10.35%
In developing the Discount and Capitalization Rates to apply to the benefit stream of Sample Acquisition Candidate, Inc., the Build-Up Model was used. The Build-Up Model is based on a combination of risk factors including a Risk-Free Rate, a Market Equity Risk Premium, a Size Premium and other identifiable risk factors specific to the subject company. When added together, these risk factors provide an indication of the Discount Rate for the subject company. This Discount Rate represents the total return, in terms of cash flows and appreciation in value, that an investor would require in order to make an equity investment in the subject company.
COMMENT: Provide an explanation of each of the risk factors identified in the Build-Up Method and document the source of the data. The Long-Term U.S. Treasury Bond yield to maturity prevailing on the date of (or within the week of) the effective date of the valuation is commonly used to represent the Risk-Free Rate. The Market Equity Risk Premium is the return in excess of the Risk-Free Rate that an average equity investor would require. The Size Premium is generally used if the subject company is significantly smaller than the companies used in the formulation of the Market Equity Risk Premium. Document all other incremental risk factors identified in the development of the discount rate. Please note that the Build-Up Model is normally used for small companies or if no valid comparable company data is available. If no valid comparable company data is available, that fact should be disclosed here. Please note that this comment will not print.
This sample acquisition proposal was generated using DealSense® Plus+ and the Financial Report Builder™.
For more information call MoneySoft at (800) 966-7797. Note: this footer is fully customizable.
27
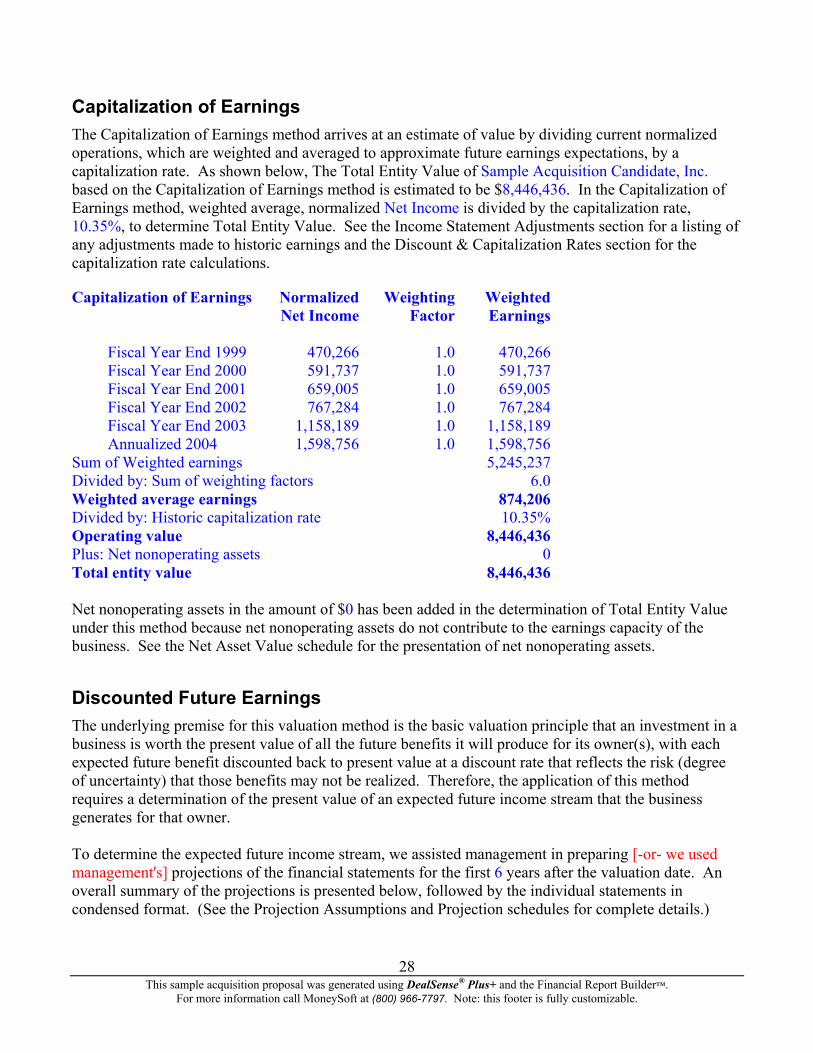
Capitalization of Earnings The Capitalization of Earnings method arrives at an estimate of value by dividing current normalized operations, which are weighted and averaged to approximate future earnings expectations, by a capitalization rate. As shown below, The Total Entity Value of Sample Acquisition Candidate, Inc. based on the Capitalization of Earnings method is estimated to be $8,446,436. In the Capitalization of Earnings method, weighted average, normalized Net Income is divided by the capitalization rate, 10.35%, to determine Total Entity Value. See the Income Statement Adjustments section for a listing of any adjustments made to historic earnings and the Discount & Capitalization Rates section for the capitalization rate calculations.
Capitalization of Earnings Normalized Weighting Weighted Net Income Factor Earnings Fiscal Year End 1999 470,266 1.0 470,266 Fiscal Year End 2000 591,737 1.0 591,737 Fiscal Year End 2001 659,005 1.0 659,005 Fiscal Year End 2002 767,284 1.0 767,284 Fiscal Year End 2003 1,158,189 1.0 1,158,189 Annualized 2004 1,598,756 1.0 1,598,756 Sum of Weighted earnings 5,245,237 Divided by: Sum of weighting factors 6.0 Weighted average earnings 874,206 Divided by: Historic capitalization rate 10.35% Operating value 8,446,436 Plus: Net nonoperating assets 0 Total entity value 8,446,436 Net nonoperating assets in the amount of $0 has been added in the determination of Total Entity Value under this method because net nonoperating assets do not contribute to the earnings capacity of the business. See the Net Asset Value schedule for the presentation of net nonoperating assets.
Discounted Future Earnings The underlying premise for this valuation method is the basic valuation principle that an investment in a business is worth the present value of all the future benefits it will produce for its owner(s), with each expected future benefit discounted back to present value at a discount rate that reflects the risk (degree of uncertainty) that those benefits may not be realized. Therefore, the application of this method requires a determination of the present value of an expected future income stream that the business generates for that owner. To determine the expected future income stream, we assisted management in preparing [-or- we used management's] projections of the financial statements for the first 6 years after the valuation date. An overall summary of the projections is presented below, followed by the individual statements in condensed format. (See the Projection Assumptions and Projection schedules for complete details.)
This sample acquisition proposal was generated using DealSense® Plus+ and the Financial Report Builder™.
For more information call MoneySoft at (800) 966-7797. Note: this footer is fully customizable.
28
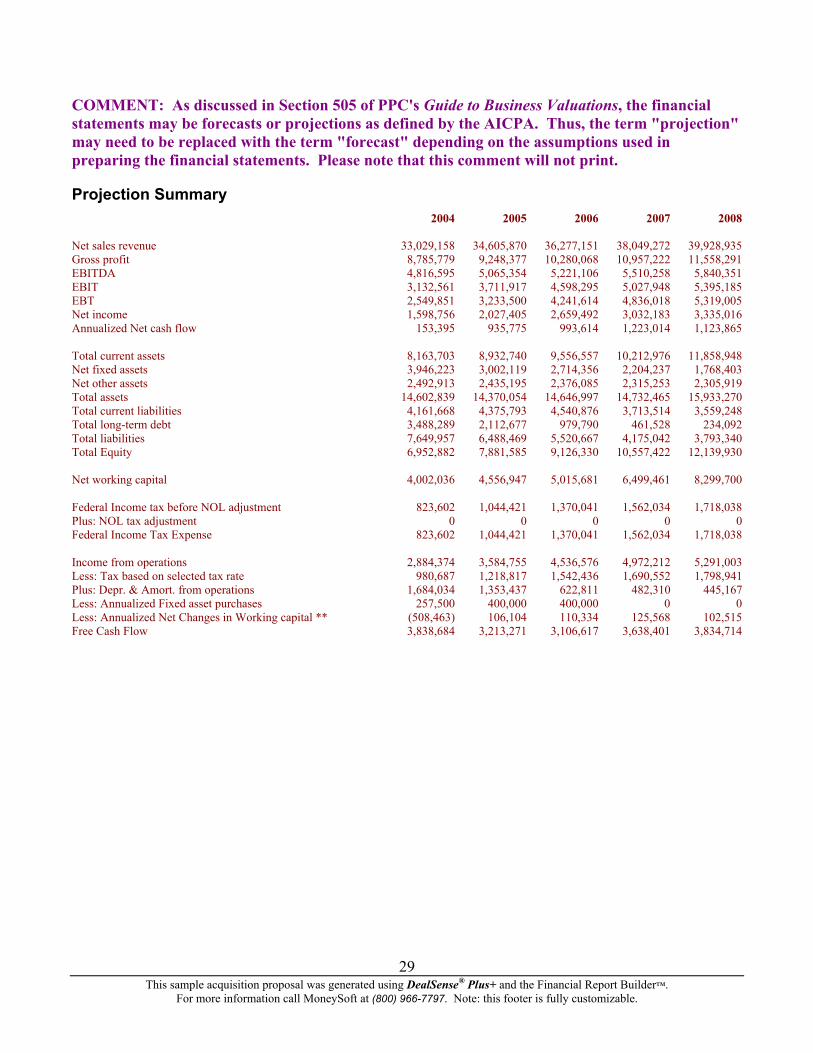
COMMENT: As discussed in Section 505 of PPC's Guide to Business Valuations, the financial statements may be forecasts or projections as defined by the AICPA. Thus, the term "projection" may need to be replaced with the term "forecast" depending on the assumptions used in preparing the financial statements. Please note that this comment will not print.
Projection Summary 2004 2005 2006 2007 2008 Net sales revenue 33,029,158 34,605,870 36,277,151 38,049,272 39,928,935 Gross profit 8,785,779 9,248,377 10,280,068 10,957,222 11,558,291 EBITDA 4,816,595 5,065,354 5,221,106 5,510,258 5,840,351 EBIT 3,132,561 3,711,917 4,598,295 5,027,948 5,395,185 EBT 2,549,851 3,233,500 4,241,614 4,836,018 5,319,005 Net income 1,598,756 2,027,405 2,659,492 3,032,183 3,335,016 Annualized Net cash flow 153,395 935,775 993,614 1,223,014 1,123,865 Total current assets 8,163,703 8,932,740 9,556,557 10,212,976 11,858,948 Net fixed assets 3,946,223 3,002,119 2,714,356 2,204,237 1,768,403 Net other assets 2,492,913 2,435,195 2,376,085 2,315,253 2,305,919 Total assets 14,602,839 14,370,054 14,646,997 14,732,465 15,933,270 Total current liabilities 4,161,668 4,375,793 4,540,876 3,713,514 3,559,248 Total long-term debt 3,488,289 2,112,677 979,790 461,528 234,092 Total liabilities 7,649,957 6,488,469 5,520,667 4,175,042 3,793,340 Total Equity 6,952,882 7,881,585 9,126,330 10,557,422 12,139,930 Net working capital 4,002,036 4,556,947 5,015,681 6,499,461 8,299,700 Federal Income tax before NOL adjustment 823,602 1,044,421 1,370,041 1,562,034 1,718,038 Plus: NOL tax adjustment 0 0 0 0 0 Federal Income Tax Expense 823,602 1,044,421 1,370,041 1,562,034 1,718,038 Income from operations 2,884,374 3,584,755 4,536,576 4,972,212 5,291,003 Less: Tax based on selected tax rate 980,687 1,218,817 1,542,436 1,690,552 1,798,941 Plus: Depr. & Amort. from operations 1,684,034 1,353,437 622,811 482,310 445,167 Less: Annualized Fixed asset purchases 257,500 400,000 400,000 0 0 Less: Annualized Net Changes in Working capital ** (508,463) 106,104 110,334 125,568 102,515 Free Cash Flow 3,838,684 3,213,271 3,106,617 3,638,401 3,834,714
This sample acquisition proposal was generated using DealSense® Plus+ and the Financial Report Builder™.
For more information call MoneySoft at (800) 966-7797. Note: this footer is fully customizable.
29
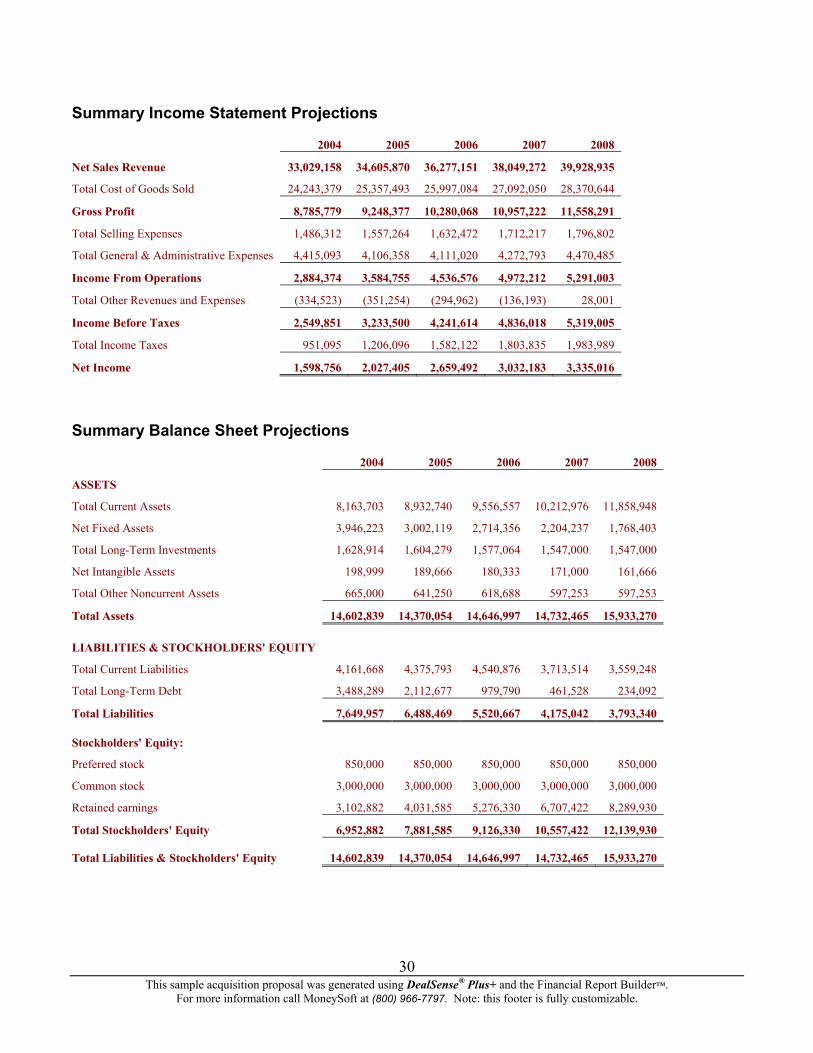
Summary Income Statement Projections
2004 2005 2006 2007 2008
Net Sales Revenue 33,029,158 34,605,870 36,277,151 38,049,272 39,928,935
Total Cost of Goods Sold 24,243,379 25,357,493 25,997,084 27,092,050 28,370,644
Gross Profit 8,785,779 9,248,377 10,280,068 10,957,222 11,558,291
Total Selling Expenses 1,486,312 1,557,264 1,632,472 1,712,217 1,796,802
Total General & Administrative Expenses 4,415,093 4,106,358 4,111,020 4,272,793 4,470,485
Income From Operations 2,884,374 3,584,755 4,536,576 4,972,212 5,291,003
Total Other Revenues and Expenses (334,523) (351,254) (294,962) (136,193) 28,001
Income Before Taxes 2,549,851 3,233,500 4,241,614 4,836,018 5,319,005
Total Income Taxes 951,095 1,206,096 1,582,122 1,803,835 1,983,989
Net Income 1,598,756 2,027,405 2,659,492 3,032,183 3,335,016
Summary Balance Sheet Projections
2004 2005 2006 2007 2008
ASSETS
Total Current Assets 8,163,703 8,932,740 9,556,557 10,212,976 11,858,948
Net Fixed Assets 3,946,223 3,002,119 2,714,356 2,204,237 1,768,403
Total Long-Term Investments 1,628,914 1,604,279 1,577,064 1,547,000 1,547,000
Net Intangible Assets 198,999 189,666 180,333 171,000 161,666
Total Other Noncurrent Assets 665,000 641,250 618,688 597,253 597,253
Total Assets 14,602,839 14,370,054 14,646,997 14,732,465 15,933,270
LIABILITIES & STOCKHOLDERS' EQUITY
Total Current Liabilities 4,161,668 4,375,793 4,540,876 3,713,514 3,559,248
Total Long-Term Debt 3,488,289 2,112,677 979,790 461,528 234,092
Total Liabilities 7,649,957 6,488,469 5,520,667 4,175,042 3,793,340
Stockholders' Equity:
Preferred stock 850,000 850,000 850,000 850,000 850,000
Common stock 3,000,000 3,000,000 3,000,000 3,000,000 3,000,000
Retained earnings 3,102,882 4,031,585 5,276,330 6,707,422 8,289,930
Total Stockholders' Equity 6,952,882 7,881,585 9,126,330 10,557,422 12,139,930
Total Liabilities & Stockholders' Equity 14,602,839 14,370,054 14,646,997 14,732,465 15,933,270
This sample acquisition proposal was generated using DealSense® Plus+ and the Financial Report Builder™.
For more information call MoneySoft at (800) 966-7797. Note: this footer is fully customizable.
30
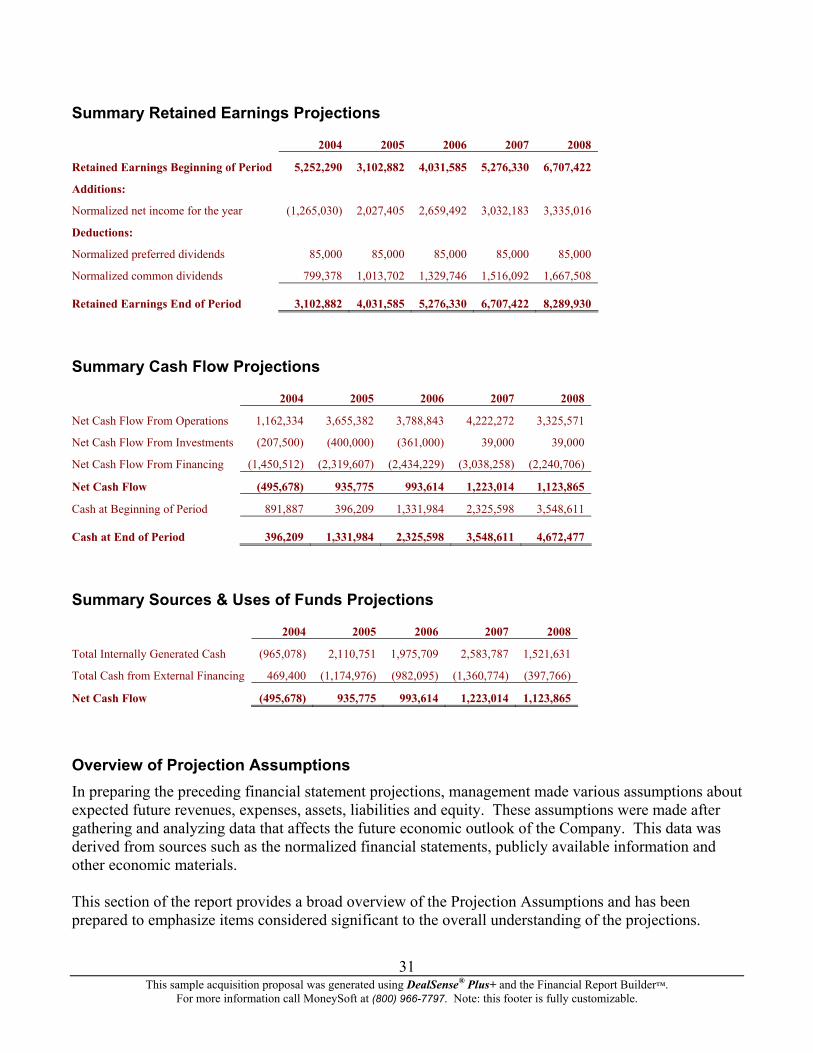
Summary Retained Earnings Projections
2004 2005 2006 2007 2008
Retained Earnings Beginning of Period 5,252,290 3,102,882 4,031,585 5,276,330 6,707,422
Additions:
Normalized net income for the year (1,265,030) 2,027,405 2,659,492 3,032,183 3,335,016
Deductions:
Normalized preferred dividends 85,000 85,000 85,000 85,000 85,000
Normalized common dividends 799,378 1,013,702 1,329,746 1,516,092 1,667,508
Retained Earnings End of Period 3,102,882 4,031,585 5,276,330 6,707,422 8,289,930
Summary Cash Flow Projections
2004 2005 2006 2007 2008
Net Cash Flow From Operations 1,162,334 3,655,382 3,788,843 4,222,272 3,325,571
Net Cash Flow From Investments (207,500) (400,000) (361,000) 39,000 39,000
Net Cash Flow From Financing (1,450,512) (2,319,607) (2,434,229) (3,038,258) (2,240,706)
Net Cash Flow (495,678) 935,775 993,614 1,223,014 1,123,865
Cash at Beginning of Period 891,887 396,209 1,331,984 2,325,598 3,548,611
Cash at End of Period 396,209 1,331,984 2,325,598 3,548,611 4,672,477
Summary Sources & Uses of Funds Projections
2004 2005 2006 2007 2008
Total Internally Generated Cash (965,078) 2,110,751 1,975,709 2,583,787 1,521,631
Total Cash from External Financing 469,400 (1,174,976) (982,095) (1,360,774) (397,766)
Net Cash Flow (495,678) 935,775 993,614 1,223,014 1,123,865
Overview of Projection Assumptions In preparing the preceding financial statement projections, management made various assumptions about expected future revenues, expenses, assets, liabilities and equity. These assumptions were made after gathering and analyzing data that affects the future economic outlook of the Company. This data was derived from sources such as the normalized financial statements, publicly available information and other economic materials. This section of the report provides a broad overview of the Projection Assumptions and has been prepared to emphasize items considered significant to the overall understanding of the projections.
This sample acquisition proposal was generated using DealSense® Plus+ and the Financial Report Builder™.
For more information call MoneySoft at (800) 966-7797. Note: this footer is fully customizable.
31
Revenue & Expense Assumptions Net Sales Revenues over the past 5 historic years have grown at a compound average annual rate of 5.66%. Future Net Sales Revenues are projected to grow at an estimated, compound average annual rate of 4.83%, starting from a base amount of $31,541,420 and growing to $33,029,158 in the first projected year and $39,928,935 in projected year 5.
Total Cost of Goods Sold over the past 5 historic years has averaged 79.02% of Net Sales Revenues for each respective year and was 75.68% of Net Sales Revenues in the most recent historic fiscal year, 2003. Total Cost of Goods Sold has been projected to be $24,243,379, or 73.40% of Net Sales Revenues in the first projected year and $28,370,644, or 71.05% of Net Sales Revenues in projected year 5. On average, Total Cost of Goods Sold has been projected to be 72.12% of each year’s respective Net Sales Revenues.
Total Selling Expenses over the past 5 historic years have averaged 3.38% of Net Sales Revenues for each respective year and were 4.18% of Net Sales Revenues in the most recent historic fiscal year, 2003. Total Selling Expenses have been projected to be $1,486,312, or 4.50% of Net Sales Revenues in the first projected year and $1,796,802, or 4.50% of Net Sales Revenues in projected year 5. On average, Total Selling Expenses have been projected to be 4.50% of each year’s respective Net Sales Revenues.
Total General & Administrative Expenses over the past 5 historic years have grown at a compound average annual rate of 7.34%. Total General & Administrative Expenses are projected to grow at an estimated, compound average annual rate of 0.87%, starting from a base amount of $4,282,007 and growing to $4,415,093 in the first projected year and $4,470,485 in projected year 5.
Cash Equivalents have been projected using the Manual Input method. Annual interest income is projected to be earned at the rate of 5.0% of the projected account balance in each projected year.
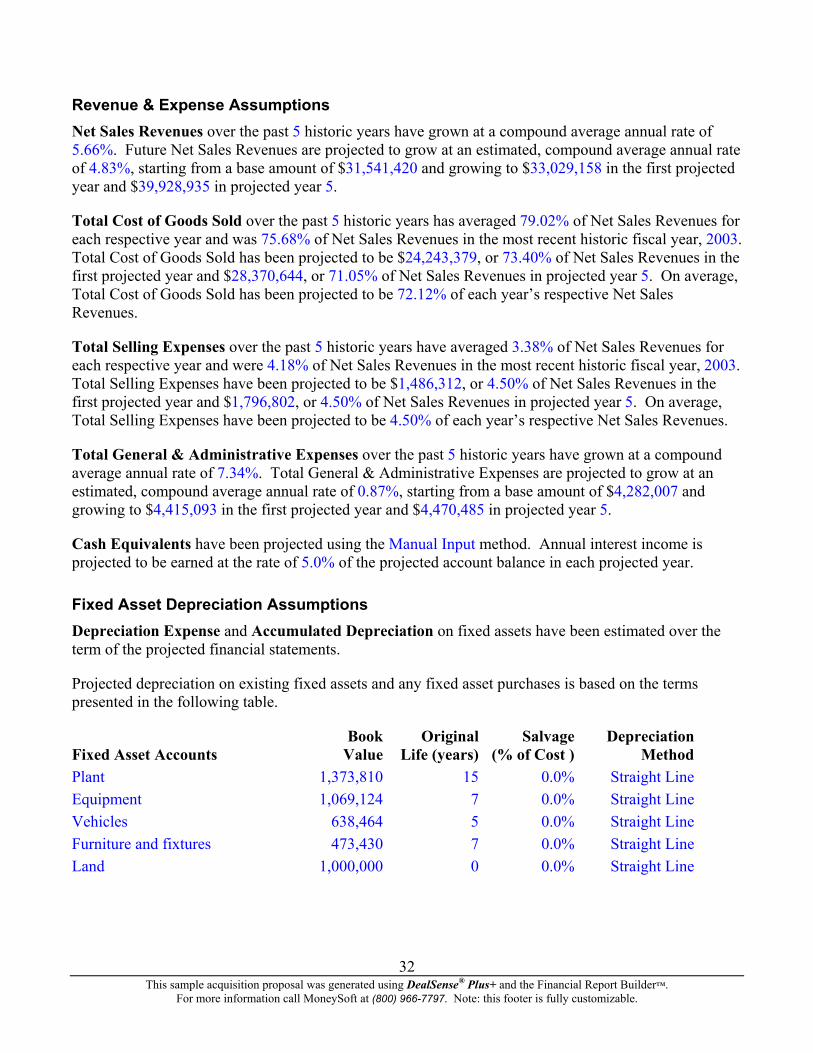
Fixed Asset Depreciation Assumptions Depreciation Expense and Accumulated Depreciation on fixed assets have been estimated over the term of the projected financial statements.
Projected depreciation on existing fixed assets and any fixed asset purchases is based on the terms presented in the following table.
Book Original Salvage Depreciation Fixed Asset Accounts Value Life (years) (% of Cost ) Method Plant 1,373,810 15 0.0% Straight Line Equipment 1,069,124 7 0.0% Straight Line Vehicles 638,464 5 0.0% Straight Line Furniture and fixtures 473,430 7 0.0% Straight Line Land 1,000,000 0 0.0% Straight Line
This sample acquisition proposal was generated using DealSense® Plus+ and the Financial Report Builder™.
For more information call MoneySoft at (800) 966-7797. Note: this footer is fully customizable.
32
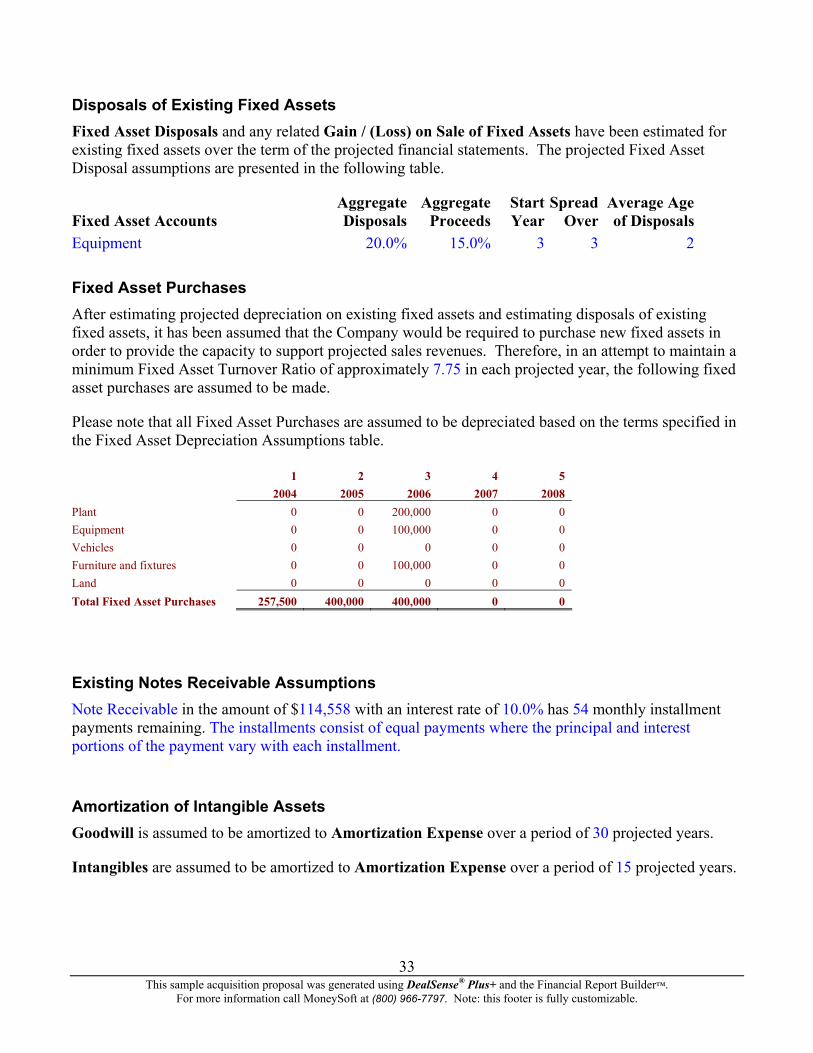
Disposals of Existing Fixed Assets Fixed Asset Disposals and any related Gain / (Loss) on Sale of Fixed Assets have been estimated for existing fixed assets over the term of the projected financial statements. The projected Fixed Asset Disposal assumptions are presented in the following table.
Aggregate Aggregate Start Spread Average Age Fixed Asset Accounts Disposals Proceeds Year Over of Disposals Equipment 20.0% 15.0% 3 3 2
Fixed Asset Purchases After estimating projected depreciation on existing fixed assets and estimating disposals of existing fixed assets, it has been assumed that the Company would be required to purchase new fixed assets in order to provide the capacity to support projected sales revenues. Therefore, in an attempt to maintain a minimum Fixed Asset Turnover Ratio of approximately 7.75 in each projected year, the following fixed asset purchases are assumed to be made.
Please note that all Fixed Asset Purchases are assumed to be depreciated based on the terms specified in the Fixed Asset Depreciation Assumptions table.
1 2 3 4 5 2004 2005 2006 2007 2008 Plant 0 0 200,000 0 0 Equipment 0 0 100,000 0 0 Vehicles 0 0 0 0 0 Furniture and fixtures 0 0 100,000 0 0 Land 0 0 0 0 0 Total Fixed Asset Purchases 257,500 400,000 400,000 0 0
Existing Notes Receivable Assumptions Note Receivable in the amount of $114,558 with an interest rate of 10.0% has 54 monthly installment payments remaining. The installments consist of equal payments where the principal and interest portions of the payment vary with each installment.
Amortization of Intangible Assets Goodwill is assumed to be amortized to Amortization Expense over a period of 30 projected years.
Intangibles are assumed to be amortized to Amortization Expense over a period of 15 projected years.
This sample acquisition proposal was generated using DealSense® Plus+ and the Financial Report Builder™.
For more information call MoneySoft at (800) 966-7797. Note: this footer is fully customizable.
33
Existing Notes Payable Assumptions Payable to Main Street Bank in the amount of $114,558 with an interest rate of 10.0% has 54 monthly installment payments remaining. The installments consist of equal payments where the principal and interest portions of the payment vary with each installment.
Payable to Main Street Bank in the amount of $280,964 with an interest rate of 10.0% has 30 monthly installment payments remaining. The installments consist of equal payments where the principal and interest portions of the payment vary with each installment.
Payable to ABC Bank in the amount of $2,974,214 with an interest rate of 12.0% has 42 monthly installment payments remaining. The installments consist of equal payments where the principal and interest portions of the payment vary with each installment.
Payable to Acme Bank in the amount of $921,087 with an interest rate of 12.0% has 78 monthly installment payments remaining. The installments consist of equal principal payments with monthly interest charged on the outstanding balance.
Payable to First National in the amount of $1,017,149 with an interest rate of 10.0% has 54 monthly installment payments remaining. The installments consist of equal payments where the principal and interest portions of the payment vary with each installment.
Comment: If you are using monthly projections, you must manually edit the paragraphs below related to Fixed Asset Purchase Financing for Year 1 and Year 2. With monthly financing assumptions, these paragraphs are no longer relevant. Please note that this comment will not print.
Fixed Asset Purchase Financing Assumptions In projected year 3, 100.0% of total fixed asset purchases ($400,000) would be financed. A new loan in the amount of $400,000 would be added in that year. This loan would have an interest rate of 7.5% and would be repaid in 60 monthly installments. The installments consist of equal payments where the principal and interest portions of the payment vary with each installment.
In projected year 4, 100.0% of total fixed asset purchases ($0) would be financed. A new loan in the amount of $0 would be added in that year. This loan would have an interest rate of 7.5% and would be repaid in 60 monthly installments. The installments consist of equal payments where the principal and interest portions of the payment vary with each installment.
In projected year 5, 100.0% of total fixed asset purchases ($0) would be financed. A new loan in the amount of $0 would be added in that year. This loan would have an interest rate of 7.5% and would be repaid in 60 monthly installments. The installments consist of equal payments where the principal and interest portions of the payment vary with each installment.
This sample acquisition proposal was generated using DealSense® Plus+ and the Financial Report Builder™.
For more information call MoneySoft at (800) 966-7797. Note: this footer is fully customizable.
34
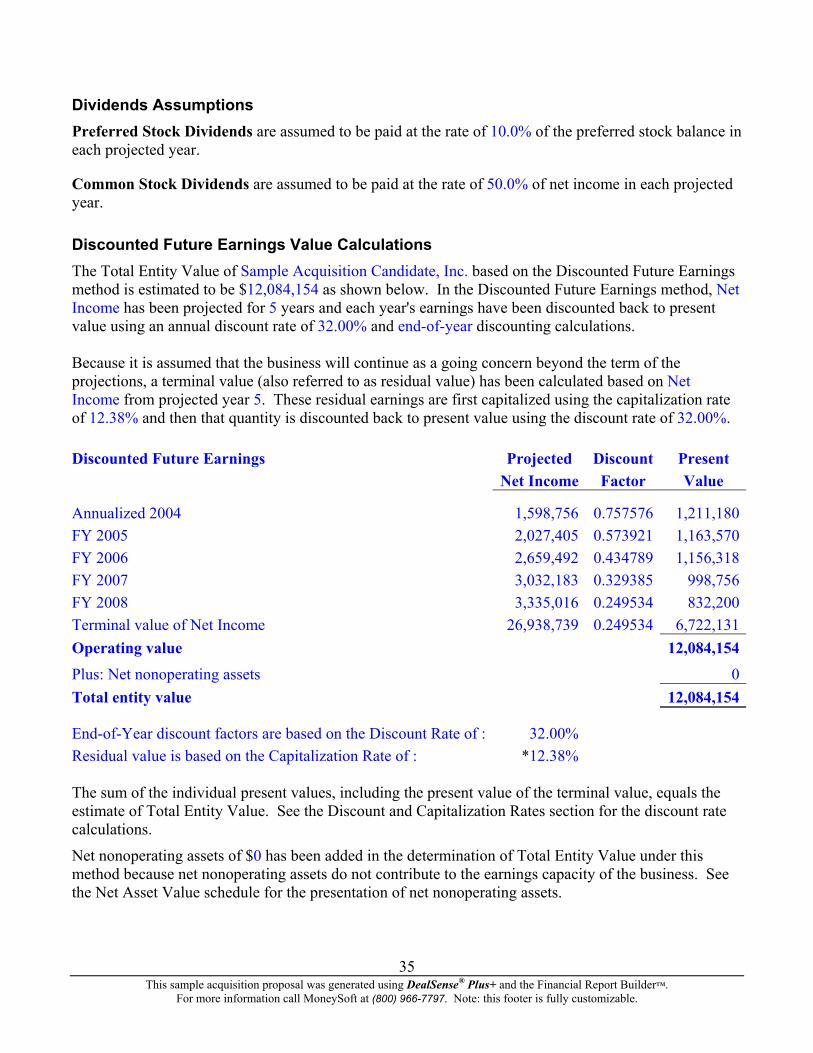
Dividends Assumptions Preferred Stock Dividends are assumed to be paid at the rate of 10.0% of the preferred stock balance in each projected year.
Common Stock Dividends are assumed to be paid at the rate of 50.0% of net income in each projected year.
Discounted Future Earnings Value Calculations The Total Entity Value of Sample Acquisition Candidate, Inc. based on the Discounted Future Earnings method is estimated to be $12,084,154 as shown below. In the Discounted Future Earnings method, Net Income has been projected for 5 years and each year's earnings have been discounted back to present value using an annual discount rate of 32.00% and end-of-year discounting calculations. Because it is assumed that the business will continue as a going concern beyond the term of the projections, a terminal value (also referred to as residual value) has been calculated based on Net Income from projected year 5. These residual earnings are first capitalized using the capitalization rate of 12.38% and then that quantity is discounted back to present value using the discount rate of 32.00%. Discounted Future Earnings Projected Discount Present Net Income Factor Value
Annualized 2004 1,598,756 0.757576 1,211,180FY 2005 2,027,405 0.573921 1,163,570FY 2006 2,659,492 0.434789 1,156,318FY 2007 3,032,183 0.329385 998,756FY 2008 3,335,016 0.249534 832,200Terminal value of Net Income 26,938,739 0.249534 6,722,131Operating value 12,084,154Plus: Net nonoperating assets 0Total entity value 12,084,154
End-of-Year discount factors are based on the Discount Rate of : 32.00% Residual value is based on the Capitalization Rate of : *12.38% The sum of the individual present values, including the present value of the terminal value, equals the estimate of Total Entity Value. See the Discount and Capitalization Rates section for the discount rate calculations.
Net nonoperating assets of $0 has been added in the determination of Total Entity Value under this method because net nonoperating assets do not contribute to the earnings capacity of the business. See the Net Asset Value schedule for the presentation of net nonoperating assets.
This sample acquisition proposal was generated using DealSense® Plus+ and the Financial Report Builder™.
For more information call MoneySoft at (800) 966-7797. Note: this footer is fully customizable.
35
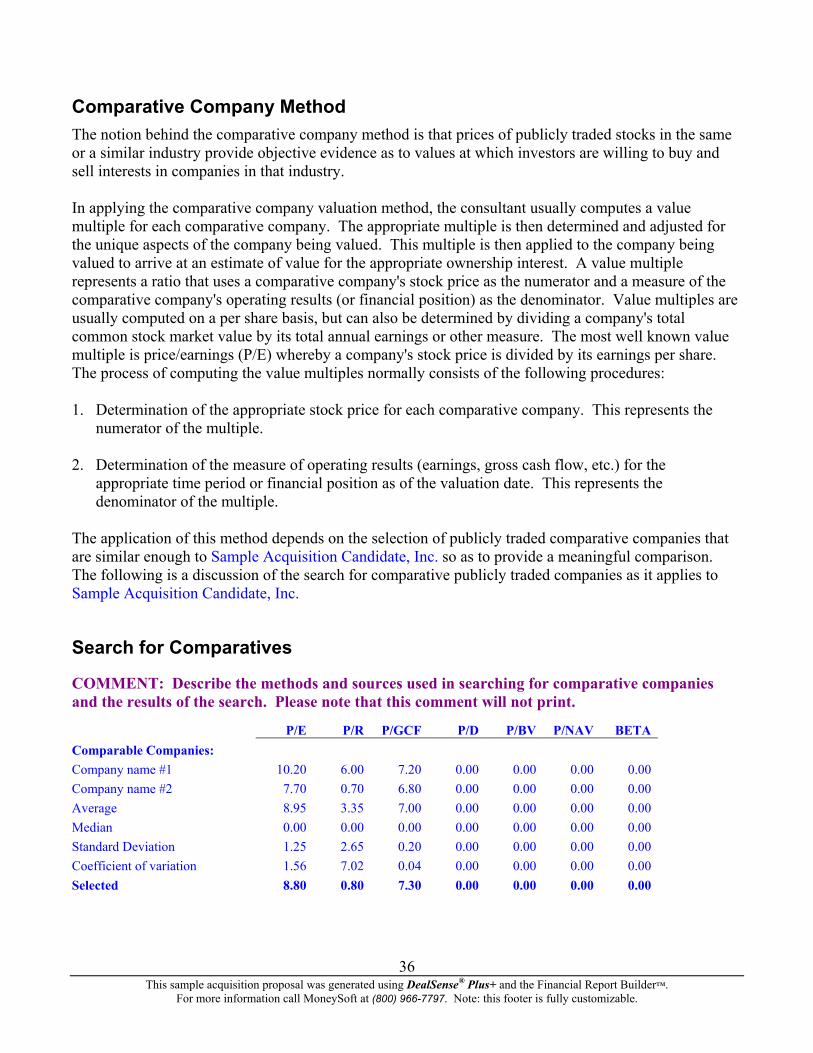
Comparative Company Method
The notion behind the comparative company method is that prices of publicly traded stocks in the same or a similar industry provide objective evidence as to values at which investors are willing to buy and sell interests in companies in that industry. In applying the comparative company valuation method, the consultant usually computes a value multiple for each comparative company. The appropriate multiple is then determined and adjusted for the unique aspects of the company being valued. This multiple is then applied to the company being valued to arrive at an estimate of value for the appropriate ownership interest. A value multiple represents a ratio that uses a comparative company's stock price as the numerator and a measure of the comparative company's operating results (or financial position) as the denominator. Value multiples are usually computed on a per share basis, but can also be determined by dividing a company's total common stock market value by its total annual earnings or other measure. The most well known value multiple is price/earnings (P/E) whereby a company's stock price is divided by its earnings per share. The process of computing the value multiples normally consists of the following procedures: 1. Determination of the appropriate stock price for each comparative company. This represents the
numerator of the multiple.
2. Determination of the measure of operating results (earnings, gross cash flow, etc.) for the appropriate time period or financial position as of the valuation date. This represents the denominator of the multiple.
The application of this method depends on the selection of publicly traded comparative companies that are similar enough to Sample Acquisition Candidate, Inc. so as to provide a meaningful comparison. The following is a discussion of the search for comparative publicly traded companies as it applies to Sample Acquisition Candidate, Inc.
Search for Comparatives
COMMENT: Describe the methods and sources used in searching for comparative companies and the results of the search. Please note that this comment will not print.
P/E P/R P/GCF P/D P/BV P/NAV BETAComparable Companies: Company name #1 10.20 6.00 7.20 0.00 0.00 0.00 0.00Company name #2 7.70 0.70 6.80 0.00 0.00 0.00 0.00Average 8.95 3.35 7.00 0.00 0.00 0.00 0.00Median 0.00 0.00 0.00 0.00 0.00 0.00 0.00Standard Deviation 1.25 2.65 0.20 0.00 0.00 0.00 0.00Coefficient of variation 1.56 7.02 0.04 0.00 0.00 0.00 0.00Selected 8.80 0.80 7.30 0.00 0.00 0.00 0.00
This sample acquisition proposal was generated using DealSense® Plus+ and the Financial Report Builder™.
For more information call MoneySoft at (800) 966-7797. Note: this footer is fully customizable.
36
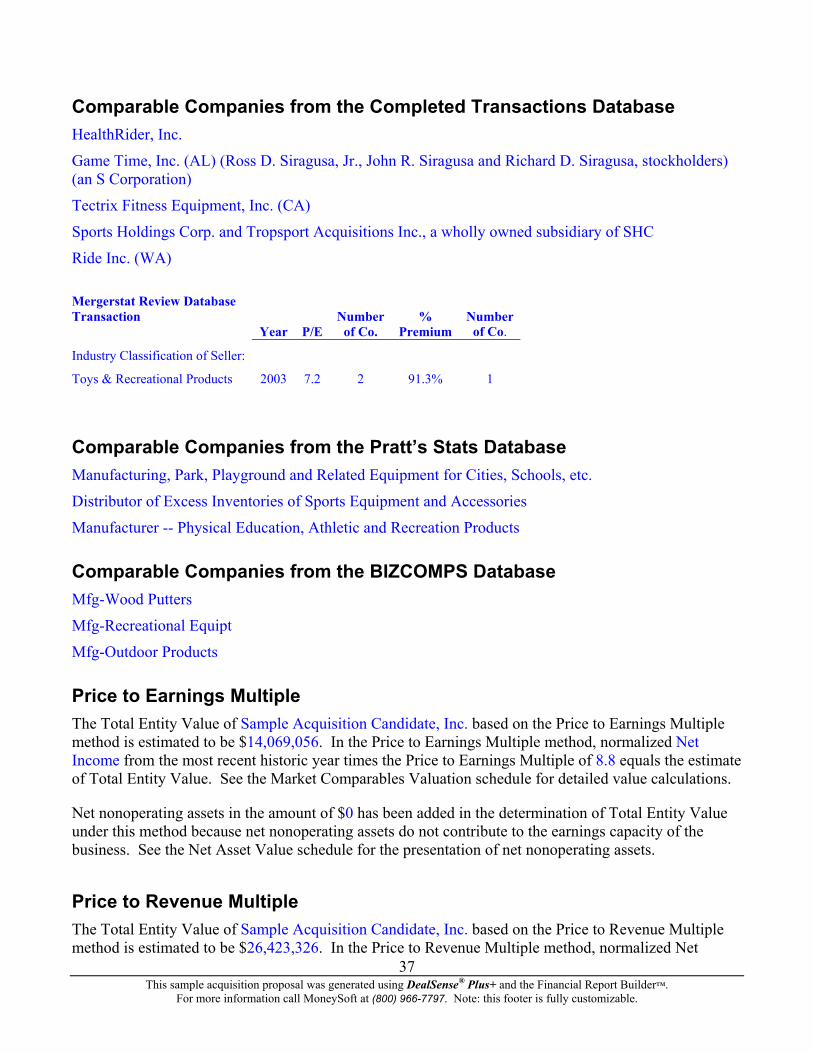
Comparable Companies from the Completed Transactions Database HealthRider, Inc.
Game Time, Inc. (AL) (Ross D. Siragusa, Jr., John R. Siragusa and Richard D. Siragusa, stockholders) (an S Corporation)
Tectrix Fitness Equipment, Inc. (CA)
Sports Holdings Corp. and Tropsport Acquisitions Inc., a wholly owned subsidiary of SHC
Ride Inc. (WA)
Mergerstat Review Database Transaction Number % Number
of Co.Year P/E of Co. Premium
Industry Classification of Seller:
Toys & Recreational Products 2003 7.2 2 91.3% 1
Comparable Companies from the Pratt’s Stats Database Manufacturing, Park, Playground and Related Equipment for Cities, Schools, etc.
Distributor of Excess Inventories of Sports Equipment and Accessories
Manufacturer -- Physical Education, Athletic and Recreation Products
Comparable Companies from the BIZCOMPS Database Mfg-Wood Putters
Mfg-Recreational Equipt
Mfg-Outdoor Products
Price to Earnings Multiple The Total Entity Value of Sample Acquisition Candidate, Inc. based on the Price to Earnings Multiple method is estimated to be $14,069,056. In the Price to Earnings Multiple method, normalized Net Income from the most recent historic year times the Price to Earnings Multiple of 8.8 equals the estimate of Total Entity Value. See the Market Comparables Valuation schedule for detailed value calculations.
Net nonoperating assets in the amount of $0 has been added in the determination of Total Entity Value under this method because net nonoperating assets do not contribute to the earnings capacity of the business. See the Net Asset Value schedule for the presentation of net nonoperating assets.
Price to Revenue Multiple
37
The Total Entity Value of Sample Acquisition Candidate, Inc. based on the Price to Revenue Multiple method is estimated to be $26,423,326. In the Price to Revenue Multiple method, normalized Net
This sample acquisition proposal was generated using DealSense® Plus+ and the Financial Report Builder™. For more information call MoneySoft at (800) 966-7797. Note: this footer is fully customizable.
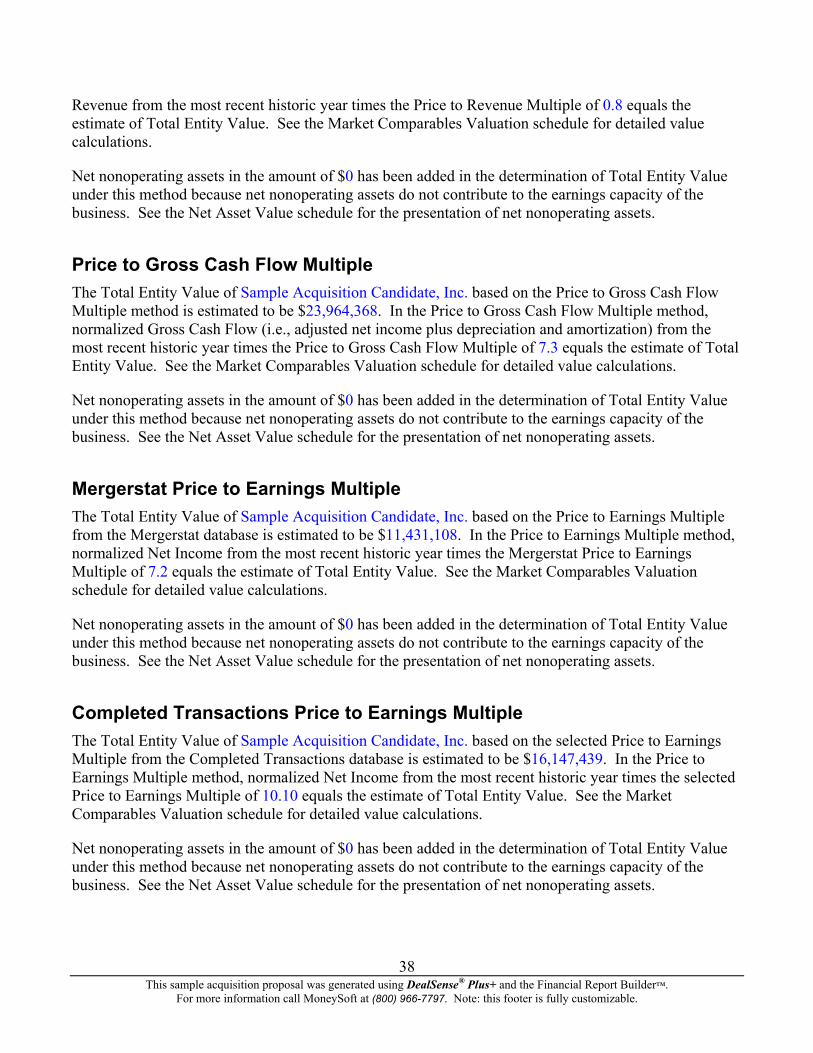
Revenue from the most recent historic year times the Price to Revenue Multiple of 0.8 equals the estimate of Total Entity Value. See the Market Comparables Valuation schedule for detailed value calculations.
Net nonoperating assets in the amount of $0 has been added in the determination of Total Entity Value under this method because net nonoperating assets do not contribute to the earnings capacity of the business. See the Net Asset Value schedule for the presentation of net nonoperating assets.
Price to Gross Cash Flow Multiple The Total Entity Value of Sample Acquisition Candidate, Inc. based on the Price to Gross Cash Flow Multiple method is estimated to be $23,964,368. In the Price to Gross Cash Flow Multiple method, normalized Gross Cash Flow (i.e., adjusted net income plus depreciation and amortization) from the most recent historic year times the Price to Gross Cash Flow Multiple of 7.3 equals the estimate of Total Entity Value. See the Market Comparables Valuation schedule for detailed value calculations.
Net nonoperating assets in the amount of $0 has been added in the determination of Total Entity Value under this method because net nonoperating assets do not contribute to the earnings capacity of the business. See the Net Asset Value schedule for the presentation of net nonoperating assets.
Mergerstat Price to Earnings Multiple The Total Entity Value of Sample Acquisition Candidate, Inc. based on the Price to Earnings Multiple from the Mergerstat database is estimated to be $11,431,108. In the Price to Earnings Multiple method, normalized Net Income from the most recent historic year times the Mergerstat Price to Earnings Multiple of 7.2 equals the estimate of Total Entity Value. See the Market Comparables Valuation schedule for detailed value calculations.
Net nonoperating assets in the amount of $0 has been added in the determination of Total Entity Value under this method because net nonoperating assets do not contribute to the earnings capacity of the business. See the Net Asset Value schedule for the presentation of net nonoperating assets.
Completed Transactions Price to Earnings Multiple The Total Entity Value of Sample Acquisition Candidate, Inc. based on the selected Price to Earnings Multiple from the Completed Transactions database is estimated to be $16,147,439. In the Price to Earnings Multiple method, normalized Net Income from the most recent historic year times the selected Price to Earnings Multiple of 10.10 equals the estimate of Total Entity Value. See the Market Comparables Valuation schedule for detailed value calculations.
Net nonoperating assets in the amount of $0 has been added in the determination of Total Entity Value under this method because net nonoperating assets do not contribute to the earnings capacity of the business. See the Net Asset Value schedule for the presentation of net nonoperating assets.
This sample acquisition proposal was generated using DealSense® Plus+ and the Financial Report Builder™.
For more information call MoneySoft at (800) 966-7797. Note: this footer is fully customizable.
38
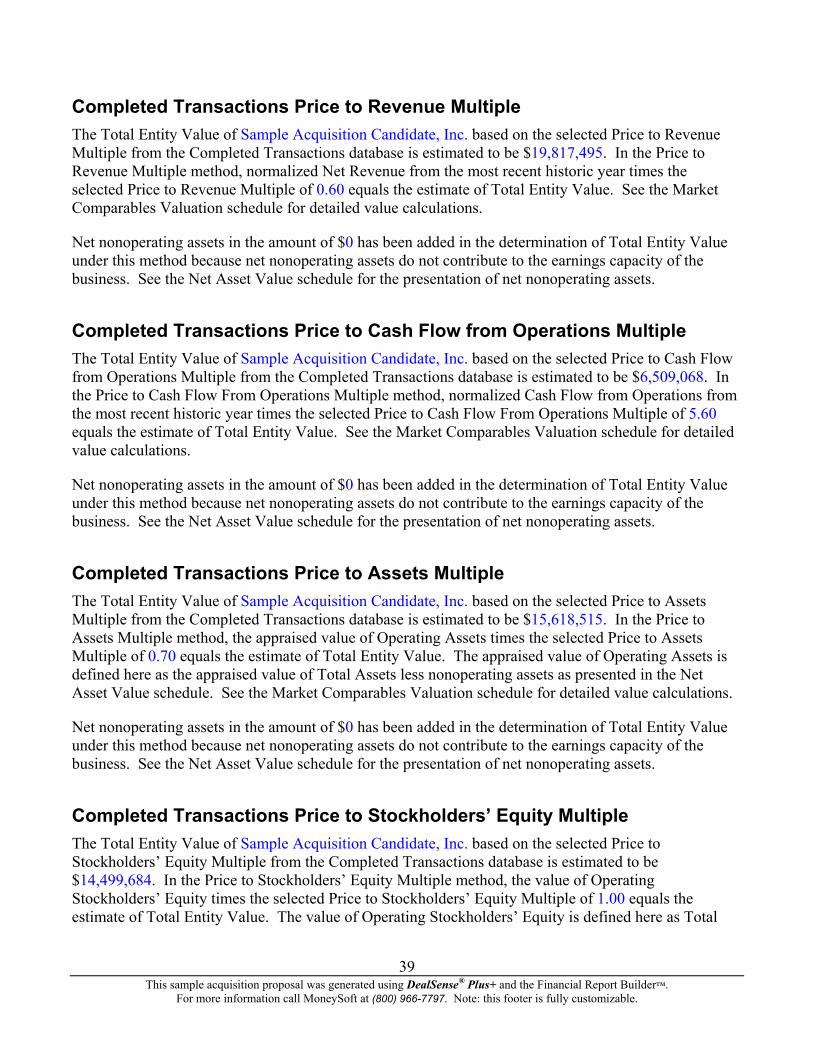
Completed Transactions Price to Revenue Multiple The Total Entity Value of Sample Acquisition Candidate, Inc. based on the selected Price to Revenue Multiple from the Completed Transactions database is estimated to be $19,817,495. In the Price to Revenue Multiple method, normalized Net Revenue from the most recent historic year times the selected Price to Revenue Multiple of 0.60 equals the estimate of Total Entity Value. See the Market Comparables Valuation schedule for detailed value calculations.
Net nonoperating assets in the amount of $0 has been added in the determination of Total Entity Value under this method because net nonoperating assets do not contribute to the earnings capacity of the business. See the Net Asset Value schedule for the presentation of net nonoperating assets.
Completed Transactions Price to Cash Flow from Operations Multiple The Total Entity Value of Sample Acquisition Candidate, Inc. based on the selected Price to Cash Flow from Operations Multiple from the Completed Transactions database is estimated to be $6,509,068. In the Price to Cash Flow From Operations Multiple method, normalized Cash Flow from Operations from the most recent historic year times the selected Price to Cash Flow From Operations Multiple of 5.60 equals the estimate of Total Entity Value. See the Market Comparables Valuation schedule for detailed value calculations.
Net nonoperating assets in the amount of $0 has been added in the determination of Total Entity Value under this method because net nonoperating assets do not contribute to the earnings capacity of the business. See the Net Asset Value schedule for the presentation of net nonoperating assets.
Completed Transactions Price to Assets Multiple The Total Entity Value of Sample Acquisition Candidate, Inc. based on the selected Price to Assets Multiple from the Completed Transactions database is estimated to be $15,618,515. In the Price to Assets Multiple method, the appraised value of Operating Assets times the selected Price to Assets Multiple of 0.70 equals the estimate of Total Entity Value. The appraised value of Operating Assets is defined here as the appraised value of Total Assets less nonoperating assets as presented in the Net Asset Value schedule. See the Market Comparables Valuation schedule for detailed value calculations.
Net nonoperating assets in the amount of $0 has been added in the determination of Total Entity Value under this method because net nonoperating assets do not contribute to the earnings capacity of the business. See the Net Asset Value schedule for the presentation of net nonoperating assets.
Completed Transactions Price to Stockholders’ Equity Multiple The Total Entity Value of Sample Acquisition Candidate, Inc. based on the selected Price to Stockholders’ Equity Multiple from the Completed Transactions database is estimated to be $14,499,684. In the Price to Stockholders’ Equity Multiple method, the value of Operating Stockholders’ Equity times the selected Price to Stockholders’ Equity Multiple of 1.00 equals the estimate of Total Entity Value. The value of Operating Stockholders’ Equity is defined here as Total
This sample acquisition proposal was generated using DealSense® Plus+ and the Financial Report Builder™.
For more information call MoneySoft at (800) 966-7797. Note: this footer is fully customizable.
39
Stockholders’ Equity less net nonoperating assets as presented in the Net Asset Value schedule. See the Market Comparables Valuation schedule for detailed value calculations.
Net nonoperating assets in the amount of $0 has been added in the determination of Total Entity Value under this method because net nonoperating assets do not contribute to the earnings capacity of the business. See the Net Asset Value schedule for the presentation of net nonoperating assets.
Pratt’s Stats Equity Price to Net Sales Multiple The Total Entity Value of Sample Acquisition Candidate, Inc. based on the selected Equity Price to Net Sales Multiple from the Pratt’s Stats database is estimated to be $16,514,579. In the Equity Price to Net Sales Multiple method, normalized Net Sales from the most recent historic year times the selected Equity Price to Net Sales Multiple of 0.50 equals the estimate of Operating Value. See the Pratt’s Stats Market Comparables Valuation schedule for detailed value calculations.
Net nonoperating assets in the amount of $0 has been added in the determination of Total Entity Value under this method because net nonoperating assets do not contribute to the earnings capacity of the business. See the Net Asset Value schedule for the presentation of net nonoperating assets.
Pratt’s Stats Equity Price to Gross Cash Flow Multiple The Total Entity Value of Sample Acquisition Candidate, Inc. based on the selected Equity Price to Gross Cash Flow Multiple from the Pratt’s Stats database is estimated to be $18,974,527. In the Equity Price to Gross Cash Flow Multiple method, normalized Net Income plus Noncash Charges (i.e., depreciation and amortization expense) from the most recent historic year times the selected Equity Price to Gross Cash Flow Multiple of 5.78 equals the estimate of Operating Value. See the Pratt’s Stats Market Comparables Valuation schedule for detailed value calculations.
Net nonoperating assets in the amount of $0 has been added in the determination of Total Entity Value under this method because net nonoperating assets do not contribute to the earnings capacity of the business.. See the Net Asset Value schedule for the presentation of net nonoperating assets.
Pratt’s Stats Equity Price to EBT Multiple The Total Entity Value of Sample Acquisition Candidate, Inc. based on the selected Equity Price to Earnings Before Taxes (EBT) Multiple from the Pratt’s Stats database is estimated to be $16,242,541. In the Equity Price to EBT Multiple method, normalized Earnings Before Taxes from the most recent historic year times the selected Equity Price to EBT Multiple of 6.37 equals the estimate of Operating Value. See the Pratt’s Stats Market Comparables Valuation schedule for detailed value calculations.
Net nonoperating assets in the amount of $0 has been added in the determination of Total Entity Value under this method because net nonoperating assets do not contribute to the earnings capacity of the business. See the Net Asset Value schedule for the presentation of net nonoperating assets.
This sample acquisition proposal was generated using DealSense® Plus+ and the Financial Report Builder™.
For more information call MoneySoft at (800) 966-7797. Note: this footer is fully customizable.
40
Pratt’s Stats Equity Price to Net Income Multiple The Total Entity Value of Sample Acquisition Candidate, Inc. based on the selected Equity Price to Net Income Multiple from the Pratt’s Stats database is estimated to be $10,583,767. In the Equity Price to Net Income Multiple method, normalized Net Income from the most recent historic year times the selected Equity Price to Net Income Multiple of 6.62 equals the estimate of Operating Value. See the Pratt’s Stats Market Comparables Valuation schedule for detailed value calculations.
Net nonoperating assets in the amount of $0 has been added in the determination of Total Entity Value under this method because net nonoperating assets do not contribute to the earnings capacity of the business. See the Net Asset Value schedule for the presentation of net nonoperating assets.
Pratt’s Stats Deal Price to Net Revenue Multiple The Total Entity Value of Sample Acquisition Candidate, Inc. based on the selected Deal Price to Net Revenue Multiple from the Pratt’s Stats database is estimated to be $11,803,857. In the Deal Price to Net Revenue Multiple method, normalized Net Revenue from the most recent historic year times the selected Deal Price to Net Revenue Multiple of 0.50 results in the Invested Capital Value. Then the Market Value of Long-Term Debt of $4,710,722 is deducted to determine the estimate of Operating Value. See the Pratt’s Stats Market Comparables Valuation schedule for detailed value calculations.
Net nonoperating assets in the amount of $0 has been added in the determination of Total Entity Value under this method because net nonoperating assets do not contribute to the earnings capacity of the business. See the Net Asset Value schedule for the presentation of net nonoperating assets.
Pratt’s Stats Deal Price to EBITDA Multiple The Total Entity Value of Sample Acquisition Candidate, Inc. based on the selected Deal Price to EBITDA Multiple from the Pratt’s Stats database is estimated to be $20,624,559. In the Deal Price to EBITDA Multiple method, normalized EBITDA from the most recent historic year times the selected Deal Price to EBITDA Multiple of 5.26 results in the Invested Capital Value. Then the Market Value of Long-Term Debt of $4,710,722 is deducted to determine the estimate of Operating Value. See the Pratt’s Stats Market Comparables Valuation schedule for detailed value calculations.
Net nonoperating assets in the amount of $0 has been added in the determination of Total Entity Value under this method because net nonoperating assets do not contribute to the earnings capacity of the business. See the Net Asset Value schedule for the presentation of net nonoperating assets.
Pratt’s Stats Deal Price to EBIT Multiple The Total Entity Value of Sample Acquisition Candidate, Inc. based on the selected Deal Price to EBITDA Multiple from the Pratt’s Stats database is estimated to be $13,959,332. In the Deal Price to EBIT Multiple method, normalized EBIT from the most recent historic year times the selected Deal Price to EBIT Multiple of 5.96 results in the Invested Capital Value. Then the Market Value of Long-Term Debt of $4,710,722 is deducted to determine the estimate of Operating Value. See the Pratt’s Stats Market Comparables Valuation schedule for detailed value calculations.
This sample acquisition proposal was generated using DealSense® Plus+ and the Financial Report Builder™.
For more information call MoneySoft at (800) 966-7797. Note: this footer is fully customizable.
41
Net nonoperating assets in the amount of $0 has been added in the determination of Total Entity Value under this method because net nonoperating assets do not contribute to the earnings capacity of the business. See the Net Asset Value schedule for the presentation of net nonoperating assets.
BIZCOMPS Sales Price to Revenue Multiple The Total Entity Value of Sample Acquisition Candidate, Inc. based on the selected Sales Price to Revenue Multiple from the BIZCOMPS database is estimated to be $23,508,054. In the Sales Price to Revenue Multiple method, normalized Net Revenue from the most recent historic year times the selected Sales Price to Revenue Multiple of 0.63 results in the Operating Value Before Net Assets. Then, Current Assets of $7,509,604, Long-Term Investments of $2,104,210, and Other Noncurrent Assets (except Nonoperating Assets) of $898,350 are added and Total Liabilities (except Nonoperating Liabilities) $7,812,480 are deducted to determine the estimate of Operating Value. See the BIZCOMPS Market Comparables Valuation schedule for detailed value calculations.
Net nonoperating assets in the amount of $0 has been added in the determination of Total Entity Value under this method because net nonoperating assets do not contribute to the earnings capacity of the business. See the Net Asset Value schedule for the presentation of net nonoperating assets.
BIZCOMPS Sales Price to Seller’s Discretionary Cash Flow Multiple The Total Entity Value of Sample Acquisition Candidate, Inc. based on the selected Sales Price to Seller’s Discretionary Cash Flow Multiple from the BIZCOMPS database is estimated to be $15,542,563. In the Sales Price to Seller’s Discretionary Cash Flow Multiple method, the Seller’s Discretionary Cash Flow from the most recent historic year times the selected Sales Price to Seller’s Discretionary Cash Flow Multiple of 3.39 results in the Operating Value Before Net Assets. Then, Current Assets of $7,509,604, Long-Term Investments of $2,104,210, and Other Noncurrent Assets (except Nonoperating Assets) of $898,350 are added and Total Liabilities (except Nonoperating Liabilities) $7,812,480 are deducted to determine the estimate of Operating Value. See the BIZCOMPS Market Comparables Valuation schedule for detailed value calculations.
Net nonoperating assets in the amount of $0 has been added in the determination of Total Entity Value under this method because net nonoperating assets do not contribute to the earnings capacity of the business.. See the Net Asset Value schedule for the presentation of net nonoperating assets.
Capitalization of Excess Earnings Usually, intangible assets are not reported on the balance sheet unless purchased. However, the existence of and the value for any intangible assets should be considered. A number of methodologies have been developed to estimate intangible assets of a business. One commonly used method is the excess earnings method. The excess earnings method was developed by the U.S. Treasury Department in 1920 in Appeals and Review Memorandum 34 (ARM34). Its current version is found in Revenue Ruling 68-609. The excess earnings method is commonly used in valuing small businesses and professional practices. The Internal Revenue Service suggests that it is to be used only when no better basis exists for separately estimating the value of the intangible assets.
This sample acquisition proposal was generated using DealSense® Plus+ and the Financial Report Builder™. For more information call MoneySoft at (800) 966-7797. Note: this footer is fully customizable.
42
The model for the excess earnings method computes the company's equity value based on the "appraised" value of tangible assets plus an additional amount for intangible assets. A company's tangible assets should provide a current return to the owner. Since there are risks associated with owning the company's assets, the rate of return on those assets should be commensurate with the risks involved. That rate of return should be either the prevailing industry rate of return required to attract capital to that industry or an appropriate rate above the risk-free rate. Any returns produced by the company above the rate on tangible assets are considered to arise from intangible assets. Accordingly, the weighted average capitalization rate for tangible assets and intangible assets should be equivalent to the capitalization rate of the entire company. In using the excess earnings method, a reasonable rate of return on net tangible assets was first calculated based on the cost of borrowing against those assets plus the cost of equity required to support the remaining investment in those assets, as shown in the following schedule. Percent of Cost Total Capital Weighted Required Return on Debt 4.88% 26.9% 1.31%Required Return on Equity 10.35% 73.1% 7.56%Rate of Return on Net Tangible Assets 8.87% (See the Rate of Return on Net Tangible Assets schedule for the calculation of the required return on debt.) Then, weighted average, normalized Net Income is compared to the reasonable rate of return. Excess earnings are defined as the difference between the weighted average earnings and the "normal" return. These excess earnings are then capitalized using the excess earnings capitalization rate of 10.35%. Therefore, capitalized excess earnings are an estimate of intangible value. This intangible value is then added to the appraised value of net tangible equity to estimate Total Entity Value. See the Income Statement Adjustments section for a listing of any adjustments made to historic earnings, the Discount and Capitalization Rates section for the excess earnings capitalization rate and the Net Asset Value schedule for the appraised value of net tangible equity.
This sample acquisition proposal was generated using DealSense® Plus+ and the Financial Report Builder™.
For more information call MoneySoft at (800) 966-7797. Note: this footer is fully customizable.
43
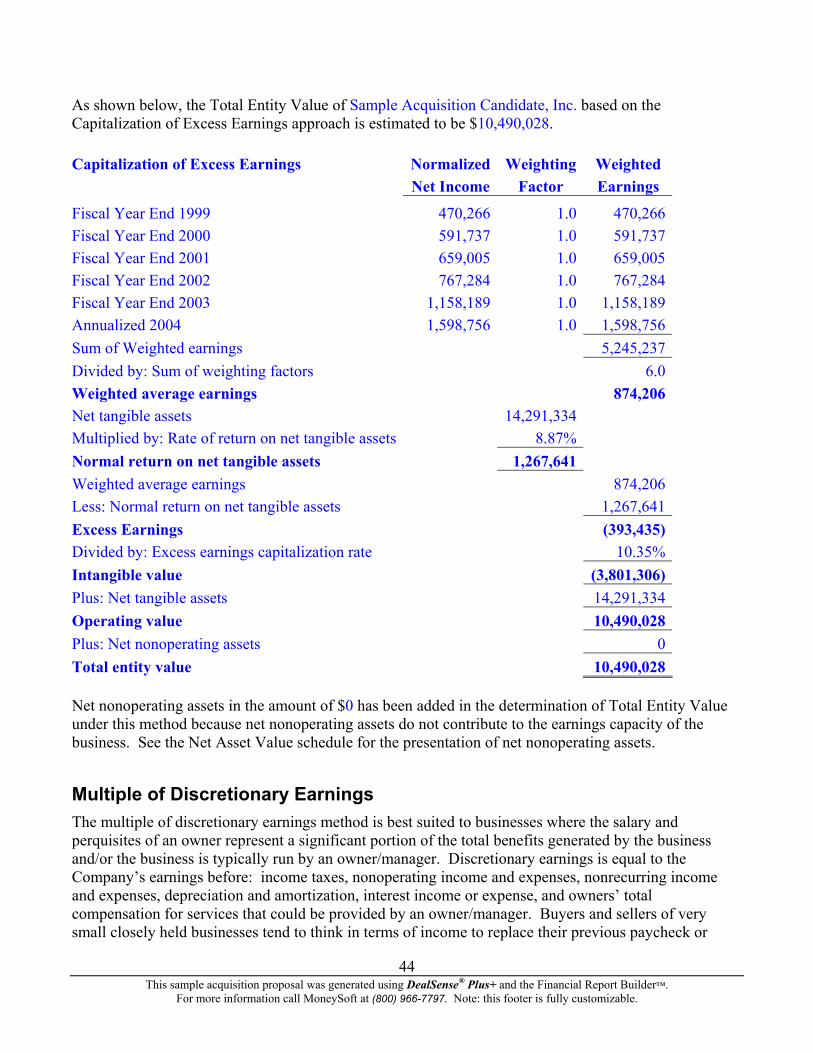
As shown below, the Total Entity Value of Sample Acquisition Candidate, Inc. based on the Capitalization of Excess Earnings approach is estimated to be $10,490,028. Capitalization of Excess Earnings Normalized Weighting Weighted Net Income Factor Earnings
Fiscal Year End 1999 470,266 1.0 470,266Fiscal Year End 2000 591,737 1.0 591,737Fiscal Year End 2001 659,005 1.0 659,005Fiscal Year End 2002 767,284 1.0 767,284Fiscal Year End 2003 1,158,189 1.0 1,158,189Annualized 2004 1,598,756 1.0 1,598,756Sum of Weighted earnings 5,245,237Divided by: Sum of weighting factors 6.0Weighted average earnings 874,206Net tangible assets 14,291,334Multiplied by: Rate of return on net tangible assets 8.87%Normal return on net tangible assets 1,267,641Weighted average earnings 874,206Less: Normal return on net tangible assets 1,267,641Excess Earnings (393,435)Divided by: Excess earnings capitalization rate 10.35%Intangible value (3,801,306)Plus: Net tangible assets 14,291,334Operating value 10,490,028Plus: Net nonoperating assets 0Total entity value 10,490,028 Net nonoperating assets in the amount of $0 has been added in the determination of Total Entity Value under this method because net nonoperating assets do not contribute to the earnings capacity of the business. See the Net Asset Value schedule for the presentation of net nonoperating assets.
Multiple of Discretionary Earnings The multiple of discretionary earnings method is best suited to businesses where the salary and perquisites of an owner represent a significant portion of the total benefits generated by the business and/or the business is typically run by an owner/manager. Discretionary earnings is equal to the Company’s earnings before: income taxes, nonoperating income and expenses, nonrecurring income and expenses, depreciation and amortization, interest income or expense, and owners’ total compensation for services that could be provided by an owner/manager. Buyers and sellers of very small closely held businesses tend to think in terms of income to replace their previous paycheck or
This sample acquisition proposal was generated using DealSense® Plus+ and the Financial Report Builder™.
For more information call MoneySoft at (800) 966-7797. Note: this footer is fully customizable.
44
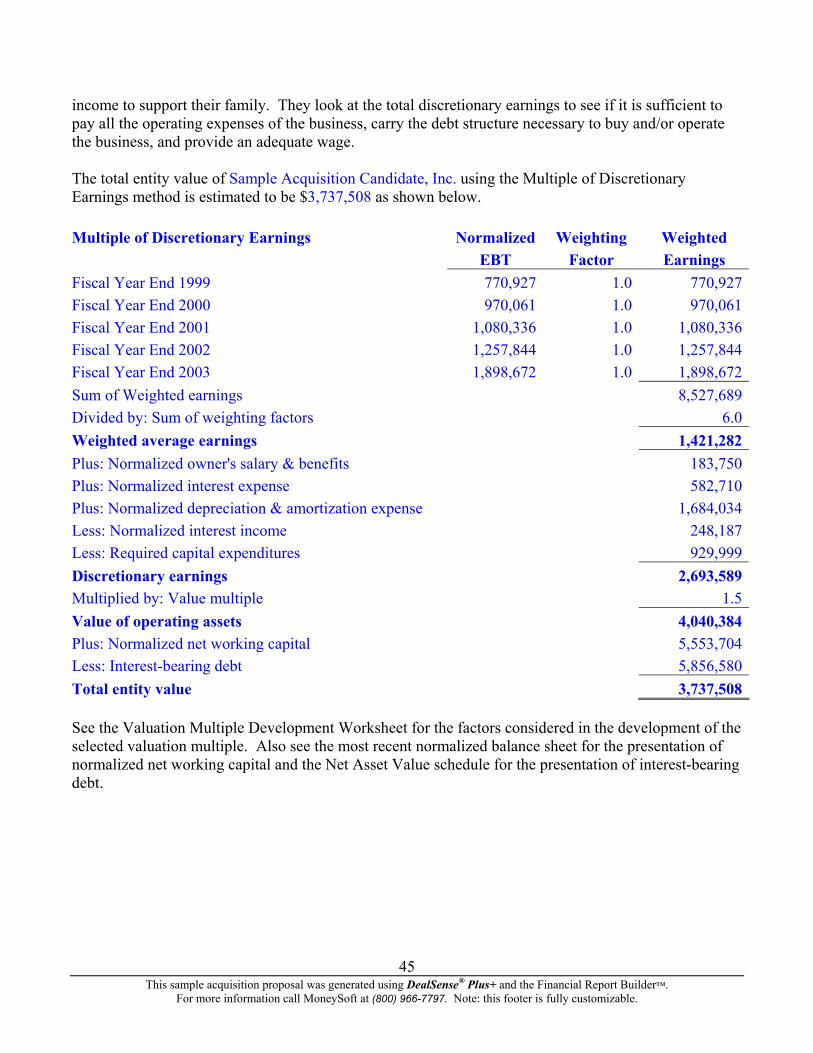
income to support their family. They look at the total discretionary earnings to see if it is sufficient to pay all the operating expenses of the business, carry the debt structure necessary to buy and/or operate the business, and provide an adequate wage. The total entity value of Sample Acquisition Candidate, Inc. using the Multiple of Discretionary Earnings method is estimated to be $3,737,508 as shown below. Multiple of Discretionary Earnings Normalized Weighting Weighted EBT Factor EarningsFiscal Year End 1999 770,927 1.0 770,927Fiscal Year End 2000 970,061 1.0 970,061Fiscal Year End 2001 1,080,336 1.0 1,080,336Fiscal Year End 2002 1,257,844 1.0 1,257,844Fiscal Year End 2003 1,898,672 1.0 1,898,672Sum of Weighted earnings 8,527,689Divided by: Sum of weighting factors 6.0Weighted average earnings 1,421,282Plus: Normalized owner's salary & benefits 183,750Plus: Normalized interest expense 582,710Plus: Normalized depreciation & amortization expense 1,684,034Less: Normalized interest income 248,187Less: Required capital expenditures 929,999Discretionary earnings 2,693,589Multiplied by: Value multiple 1.5Value of operating assets 4,040,384Plus: Normalized net working capital 5,553,704Less: Interest-bearing debt 5,856,580
45
Total entity value 3,737,508 See the Valuation Multiple Development Worksheet for the factors considered in the development of the selected valuation multiple. Also see the most recent normalized balance sheet for the presentation of normalized net working capital and the Net Asset Value schedule for the presentation of interest-bearing debt.
This sample acquisition proposal was generated using DealSense® Plus+ and the Financial Report Builder™. For more information call MoneySoft at (800) 966-7797. Note: this footer is fully customizable.
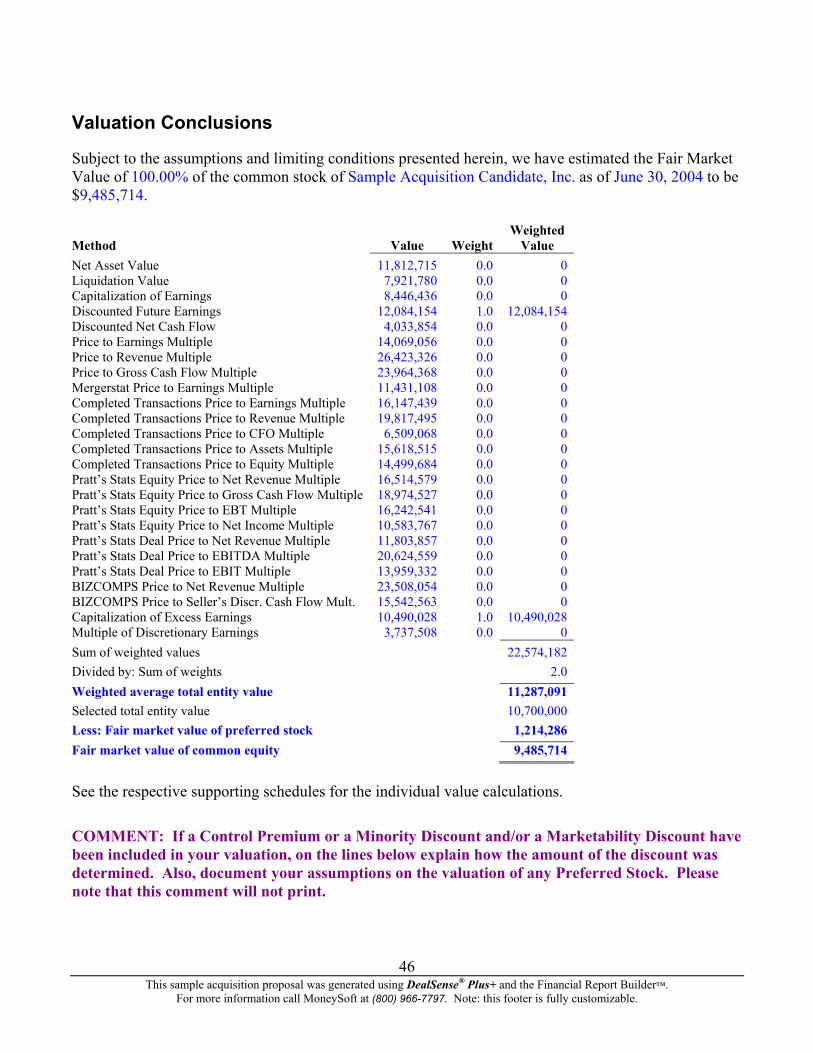
Valuation Conclusions
Subject to the assumptions and limiting conditions presented herein, we have estimated the Fair Market Value of 100.00% of the common stock of Sample Acquisition Candidate, Inc. as of June 30, 2004 to be $9,485,714. Weighted Method Value Weight Value Net Asset Value 11,812,715 0.0 0Liquidation Value 7,921,780 0.0 0Capitalization of Earnings 8,446,436 0.0 0Discounted Future Earnings 12,084,154 1.0 12,084,154Discounted Net Cash Flow 4,033,854 0.0 0Price to Earnings Multiple 14,069,056 0.0 0Price to Revenue Multiple 26,423,326 0.0 0Price to Gross Cash Flow Multiple 23,964,368 0.0 0Mergerstat Price to Earnings Multiple 11,431,108 0.0 0Completed Transactions Price to Earnings Multiple 16,147,439 0.0 0Completed Transactions Price to Revenue Multiple 19,817,495 0.0 0Completed Transactions Price to CFO Multiple 6,509,068 0.0 0Completed Transactions Price to Assets Multiple 15,618,515 0.0 0Completed Transactions Price to Equity Multiple 14,499,684 0.0 0Pratt’s Stats Equity Price to Net Revenue Multiple 16,514,579 0.0 0Pratt’s Stats Equity Price to Gross Cash Flow Multiple 18,974,527 0.0 0Pratt’s Stats Equity Price to EBT Multiple 16,242,541 0.0 0Pratt’s Stats Equity Price to Net Income Multiple 10,583,767 0.0 0Pratt’s Stats Deal Price to Net Revenue Multiple 11,803,857 0.0 0Pratt’s Stats Deal Price to EBITDA Multiple 20,624,559 0.0 0Pratt’s Stats Deal Price to EBIT Multiple 13,959,332 0.0 0BIZCOMPS Price to Net Revenue Multiple 23,508,054 0.0 0BIZCOMPS Price to Seller’s Discr. Cash Flow Mult. 15,542,563 0.0 0Capitalization of Excess Earnings 10,490,028 1.0 10,490,028Multiple of Discretionary Earnings 3,737,508 0.0 0Sum of weighted values 22,574,182Divided by: Sum of weights 2.0Weighted average total entity value 11,287,091Selected total entity value 10,700,000Less: Fair market value of preferred stock 1,214,286Fair market value of common equity 9,485,714
See the respective supporting schedules for the individual value calculations.
COMMENT: If a Control Premium or a Minority Discount and/or a Marketability Discount have been included in your valuation, on the lines below explain how the amount of the discount was determined. Also, document your assumptions on the valuation of any Preferred Stock. Please note that this comment will not print.
This sample acquisition proposal was generated using DealSense® Plus+ and the Financial Report Builder™.
For more information call MoneySoft at (800) 966-7797. Note: this footer is fully customizable.
46
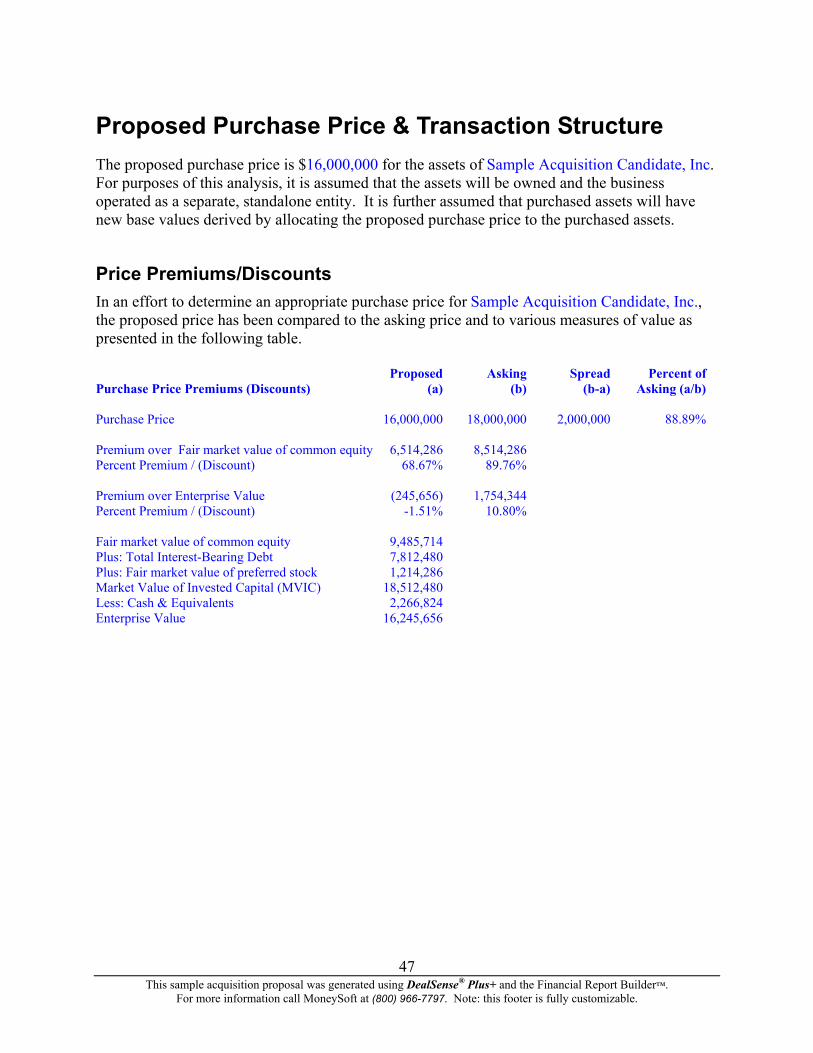
Proposed Purchase Price & Transaction Structure The proposed purchase price is $16,000,000 for the assets of Sample Acquisition Candidate, Inc. For purposes of this analysis, it is assumed that the assets will be owned and the business operated as a separate, standalone entity. It is further assumed that purchased assets will have new base values derived by allocating the proposed purchase price to the purchased assets.
Price Premiums/Discounts In an effort to determine an appropriate purchase price for Sample Acquisition Candidate, Inc., the proposed price has been compared to the asking price and to various measures of value as presented in the following table. Proposed Asking Spread Percent of Purchase Price Premiums (Discounts) (a) (b) (b-a) Asking (a/b) Purchase Price 16,000,000 18,000,000 2,000,000 88.89% Premium over Fair market value of common equity 6,514,286 8,514,286 Percent Premium / (Discount) 68.67% 89.76% Premium over Enterprise Value (245,656) 1,754,344 Percent Premium / (Discount) -1.51% 10.80% Fair market value of common equity 9,485,714 Plus: Total Interest-Bearing Debt 7,812,480 Plus: Fair market value of preferred stock 1,214,286 Market Value of Invested Capital (MVIC) 18,512,480 Less: Cash & Equivalents 2,266,824 Enterprise Value 16,245,656
This sample acquisition proposal was generated using DealSense® Plus+ and the Financial Report Builder™.
For more information call MoneySoft at (800) 966-7797. Note: this footer is fully customizable.
47
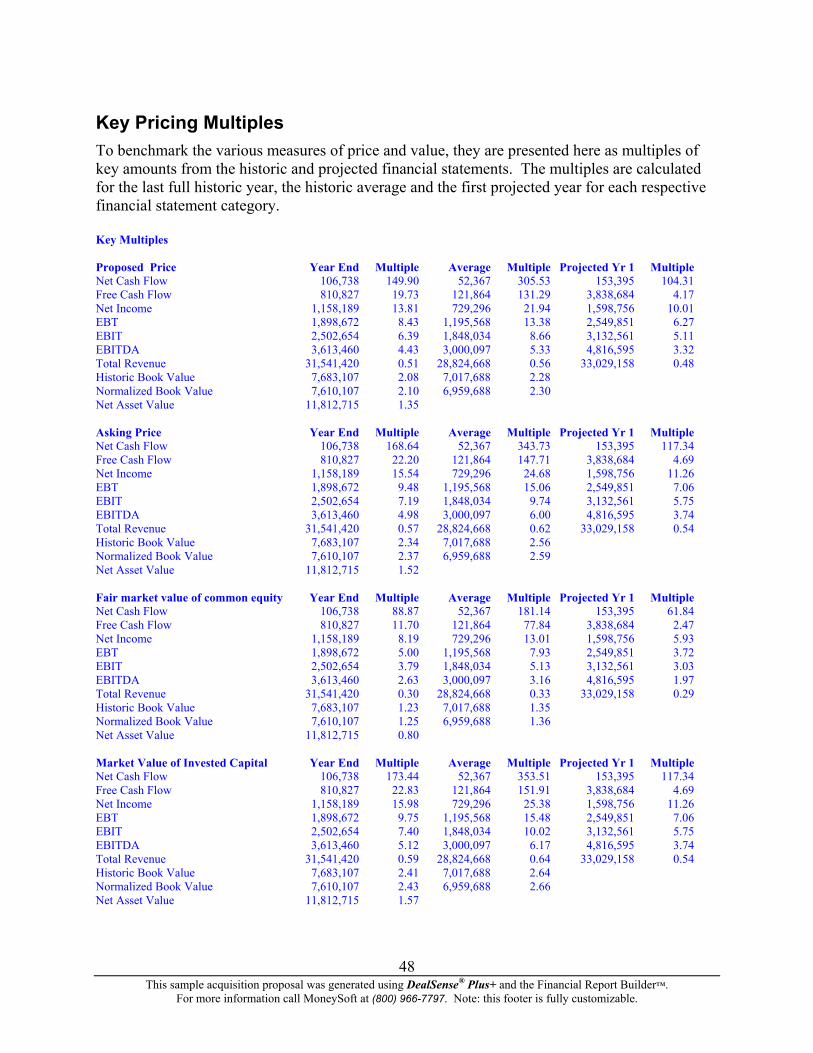
Key Pricing Multiples To benchmark the various measures of price and value, they are presented here as multiples of key amounts from the historic and projected financial statements. The multiples are calculated for the last full historic year, the historic average and the first projected year for each respective financial statement category. Key Multiples Proposed Price Year End Multiple Average Multiple Projected Yr 1 Multiple Net Cash Flow 106,738 149.90 52,367 305.53 153,395 104.31 Free Cash Flow 810,827 19.73 121,864 131.29 3,838,684 4.17 Net Income 1,158,189 13.81 729,296 21.94 1,598,756 10.01 EBT 1,898,672 8.43 1,195,568 13.38 2,549,851 6.27 EBIT 2,502,654 6.39 1,848,034 8.66 3,132,561 5.11 EBITDA 3,613,460 4.43 3,000,097 5.33 4,816,595 3.32 Total Revenue 31,541,420 0.51 28,824,668 0.56 33,029,158 0.48 Historic Book Value 7,683,107 2.08 7,017,688 2.28 Normalized Book Value 7,610,107 2.10 6,959,688 2.30 Net Asset Value 11,812,715 1.35 Asking Price Year End Multiple Average Multiple Projected Yr 1 Multiple Net Cash Flow 106,738 168.64 52,367 343.73 153,395 117.34 Free Cash Flow 810,827 22.20 121,864 147.71 3,838,684 4.69 Net Income 1,158,189 15.54 729,296 24.68 1,598,756 11.26 EBT 1,898,672 9.48 1,195,568 15.06 2,549,851 7.06 EBIT 2,502,654 7.19 1,848,034 9.74 3,132,561 5.75 EBITDA 3,613,460 4.98 3,000,097 6.00 4,816,595 3.74 Total Revenue 31,541,420 0.57 28,824,668 0.62 33,029,158 0.54 Historic Book Value 7,683,107 2.34 7,017,688 2.56 Normalized Book Value 7,610,107 2.37 6,959,688 2.59 Net Asset Value 11,812,715 1.52 Fair market value of common equity Year End Multiple Average Multiple Projected Yr 1 Multiple Net Cash Flow 106,738 88.87 52,367 181.14 153,395 61.84 Free Cash Flow 810,827 11.70 121,864 77.84 3,838,684 2.47 Net Income 1,158,189 8.19 729,296 13.01 1,598,756 5.93 EBT 1,898,672 5.00 1,195,568 7.93 2,549,851 3.72 EBIT 2,502,654 3.79 1,848,034 5.13 3,132,561 3.03 EBITDA 3,613,460 2.63 3,000,097 3.16 4,816,595 1.97 Total Revenue 31,541,420 0.30 28,824,668 0.33 33,029,158 0.29 Historic Book Value 7,683,107 1.23 7,017,688 1.35 Normalized Book Value 7,610,107 1.25 6,959,688 1.36 Net Asset Value 11,812,715 0.80 Market Value of Invested Capital Year End Multiple Average Multiple Projected Yr 1 Multiple Net Cash Flow 106,738 173.44 52,367 353.51 153,395 117.34 Free Cash Flow 810,827 22.83 121,864 151.91 3,838,684 4.69 Net Income 1,158,189 15.98 729,296 25.38 1,598,756 11.26 EBT 1,898,672 9.75 1,195,568 15.48 2,549,851 7.06 EBIT 2,502,654 7.40 1,848,034 10.02 3,132,561 5.75 EBITDA 3,613,460 5.12 3,000,097 6.17 4,816,595 3.74 Total Revenue 31,541,420 0.59 28,824,668 0.64 33,029,158 0.54 Historic Book Value 7,683,107 2.41 7,017,688 2.64 Normalized Book Value 7,610,107 2.43 6,959,688 2.66 Net Asset Value 11,812,715 1.57
This sample acquisition proposal was generated using DealSense® Plus+ and the Financial Report Builder™.
For more information call MoneySoft at (800) 966-7797. Note: this footer is fully customizable.
48
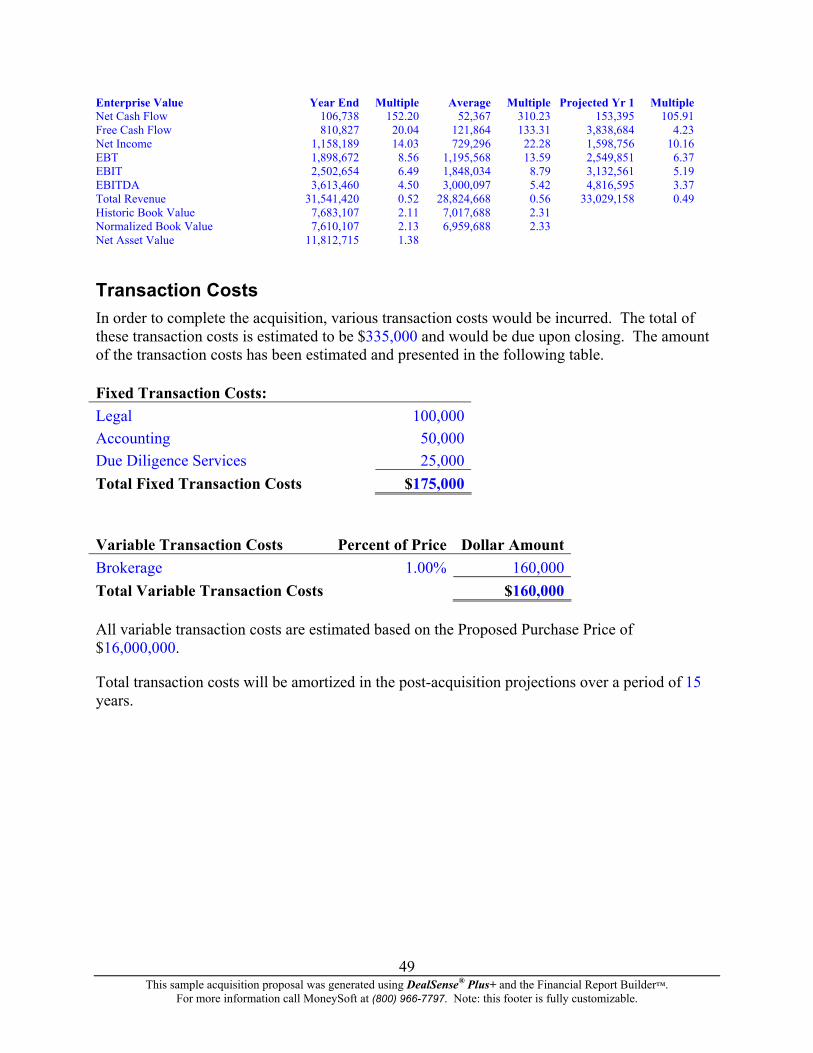
Enterprise Value Year End Multiple Average Multiple Projected Yr 1 Multiple Net Cash Flow 106,738 152.20 52,367 310.23 153,395 105.91 Free Cash Flow 810,827 20.04 121,864 133.31 3,838,684 4.23 Net Income 1,158,189 14.03 729,296 22.28 1,598,756 10.16 EBT 1,898,672 8.56 1,195,568 13.59 2,549,851 6.37 EBIT 2,502,654 6.49 1,848,034 8.79 3,132,561 5.19 EBITDA 3,613,460 4.50 3,000,097 5.42 4,816,595 3.37 Total Revenue 31,541,420 0.52 28,824,668 0.56 33,029,158 0.49 Historic Book Value 7,683,107 2.11 7,017,688 2.31 Normalized Book Value 7,610,107 2.13 6,959,688 2.33 Net Asset Value 11,812,715 1.38 Transaction Costs In order to complete the acquisition, various transaction costs would be incurred. The total of these transaction costs is estimated to be $335,000 and would be due upon closing. The amount of the transaction costs has been estimated and presented in the following table.
Fixed Transaction Costs: Legal 100,000Accounting 50,000Due Diligence Services 25,000
49
Total Fixed Transaction Costs $175,000 Variable Transaction Costs Percent of Price Dollar AmountBrokerage 1.00% 160,000Total Variable Transaction Costs $160,000 All variable transaction costs are estimated based on the Proposed Purchase Price of $16,000,000.
Total transaction costs will be amortized in the post-acquisition projections over a period of 15 years.
This sample acquisition proposal was generated using DealSense® Plus+ and the Financial Report Builder™. For more information call MoneySoft at (800) 966-7797. Note: this footer is fully customizable.
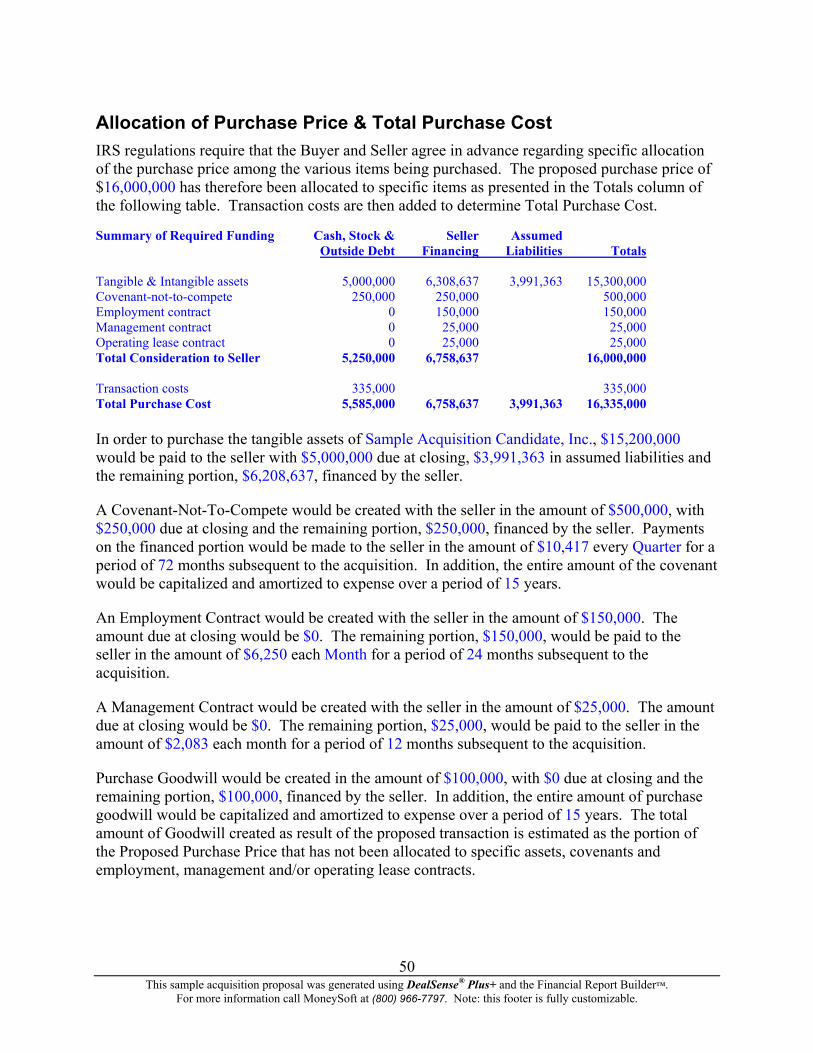
Allocation of Purchase Price & Total Purchase Cost IRS regulations require that the Buyer and Seller agree in advance regarding specific allocation of the purchase price among the various items being purchased. The proposed purchase price of $16,000,000 has therefore been allocated to specific items as presented in the Totals column of the following table. Transaction costs are then added to determine Total Purchase Cost.
Summary of Required Funding Cash, Stock & Seller Assumed Outside Debt Financing Liabilities Totals Tangible & Intangible assets 5,000,000 6,308,637 3,991,363 15,300,000 Covenant-not-to-compete 250,000 250,000 500,000 Employment contract 0 150,000 150,000 Management contract 0 25,000 25,000 Operating lease contract 0 25,000 25,000 Total Consideration to Seller 5,250,000 6,758,637 16,000,000 Transaction costs 335,000 335,000 Total Purchase Cost 5,585,000 6,758,637 3,991,363 16,335,000 In order to purchase the tangible assets of Sample Acquisition Candidate, Inc., $15,200,000 would be paid to the seller with $5,000,000 due at closing, $3,991,363 in assumed liabilities and the remaining portion, $6,208,637, financed by the seller.
A Covenant-Not-To-Compete would be created with the seller in the amount of $500,000, with $250,000 due at closing and the remaining portion, $250,000, financed by the seller. Payments on the financed portion would be made to the seller in the amount of $10,417 every Quarter for a period of 72 months subsequent to the acquisition. In addition, the entire amount of the covenant would be capitalized and amortized to expense over a period of 15 years.
An Employment Contract would be created with the seller in the amount of $150,000. The amount due at closing would be $0. The remaining portion, $150,000, would be paid to the seller in the amount of $6,250 each Month for a period of 24 months subsequent to the acquisition.
A Management Contract would be created with the seller in the amount of $25,000. The amount due at closing would be $0. The remaining portion, $25,000, would be paid to the seller in the amount of $2,083 each month for a period of 12 months subsequent to the acquisition.
Purchase Goodwill would be created in the amount of $100,000, with $0 due at closing and the remaining portion, $100,000, financed by the seller. In addition, the entire amount of purchase goodwill would be capitalized and amortized to expense over a period of 15 years. The total amount of Goodwill created as result of the proposed transaction is estimated as the portion of the Proposed Purchase Price that has not been allocated to specific assets, covenants and employment, management and/or operating lease contracts.
This sample acquisition proposal was generated using DealSense® Plus+ and the Financial Report Builder™.
For more information call MoneySoft at (800) 966-7797. Note: this footer is fully customizable.
50
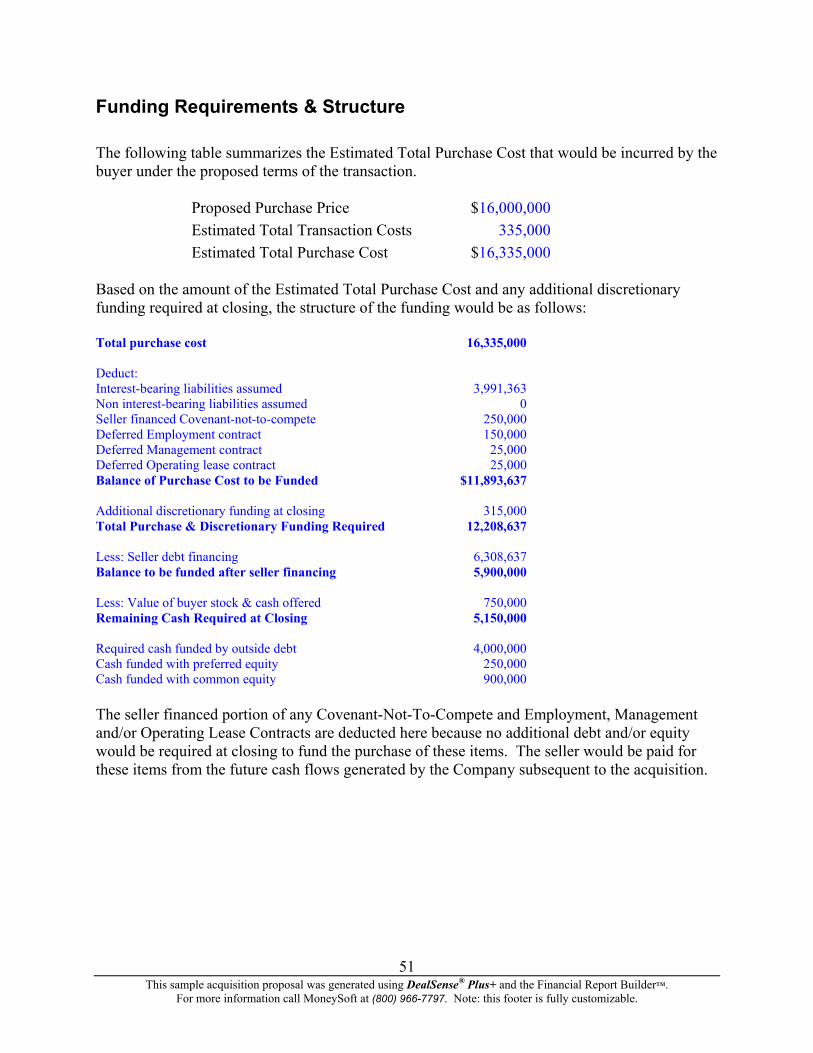
Funding Requirements & Structure The following table summarizes the Estimated Total Purchase Cost that would be incurred by the buyer under the proposed terms of the transaction.
Proposed Purchase Price $16,000,000Estimated Total Transaction Costs 335,000Estimated Total Purchase Cost $16,335,000
Based on the amount of the Estimated Total Purchase Cost and any additional discretionary funding required at closing, the structure of the funding would be as follows: Total purchase cost 16,335,000 Deduct: Interest-bearing liabilities assumed 3,991,363 Non interest-bearing liabilities assumed 0 Seller financed Covenant-not-to-compete 250,000 Deferred Employment contract 150,000 Deferred Management contract 25,000 Deferred Operating lease contract 25,000 Balance of Purchase Cost to be Funded $11,893,637 Additional discretionary funding at closing 315,000 Total Purchase & Discretionary Funding Required 12,208,637 Less: Seller debt financing 6,308,637 Balance to be funded after seller financing 5,900,000 Less: Value of buyer stock & cash offered 750,000 Remaining Cash Required at Closing 5,150,000 Required cash funded by outside debt 4,000,000 Cash funded with preferred equity 250,000 Cash funded with common equity 900,000 The seller financed portion of any Covenant-Not-To-Compete and Employment, Management and/or Operating Lease Contracts are deducted here because no additional debt and/or equity would be required at closing to fund the purchase of these items. The seller would be paid for these items from the future cash flows generated by the Company subsequent to the acquisition.
This sample acquisition proposal was generated using DealSense® Plus+ and the Financial Report Builder™.
For more information call MoneySoft at (800) 966-7797. Note: this footer is fully customizable.
51
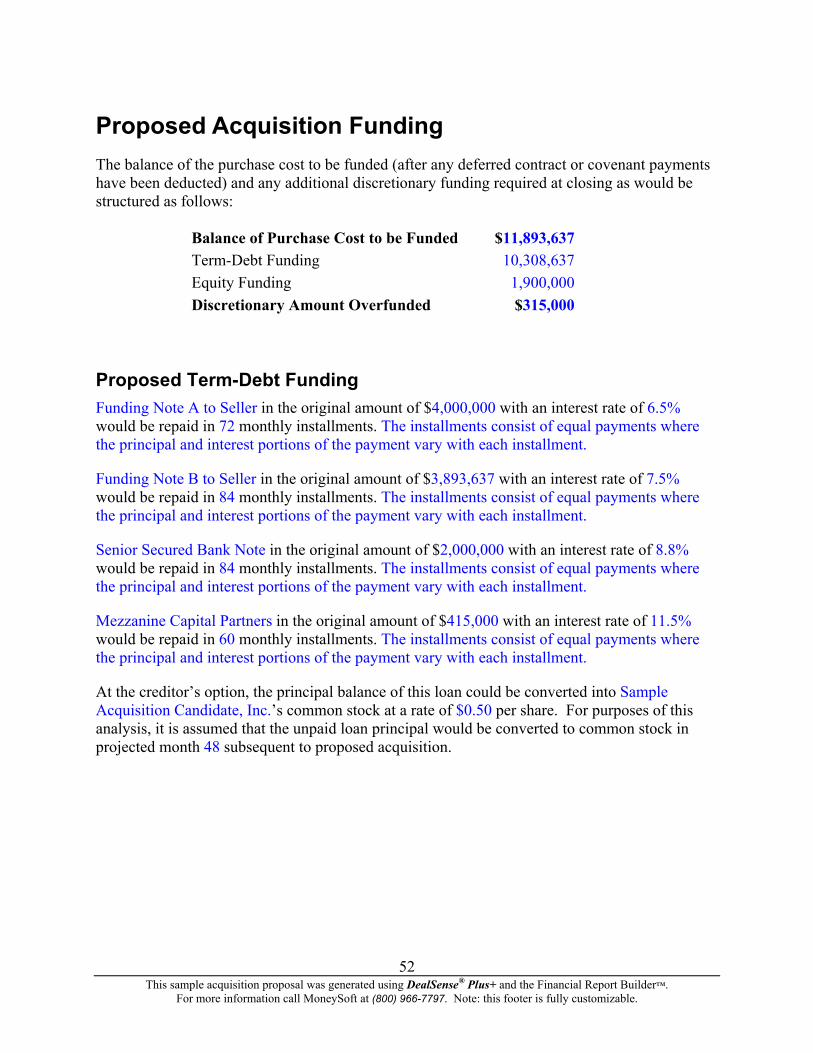
Proposed Acquisition Funding The balance of the purchase cost to be funded (after any deferred contract or covenant payments have been deducted) and any additional discretionary funding required at closing as would be structured as follows:
Balance of Purchase Cost to be Funded $11,893,637Term-Debt Funding 10,308,637Equity Funding 1,900,000Discretionary Amount Overfunded $315,000
Proposed Term-Debt Funding Funding Note A to Seller in the original amount of $4,000,000 with an interest rate of 6.5% would be repaid in 72 monthly installments. The installments consist of equal payments where the principal and interest portions of the payment vary with each installment.
Funding Note B to Seller in the original amount of $3,893,637 with an interest rate of 7.5% would be repaid in 84 monthly installments. The installments consist of equal payments where the principal and interest portions of the payment vary with each installment.
Senior Secured Bank Note in the original amount of $2,000,000 with an interest rate of 8.8% would be repaid in 84 monthly installments. The installments consist of equal payments where the principal and interest portions of the payment vary with each installment.
Mezzanine Capital Partners in the original amount of $415,000 with an interest rate of 11.5% would be repaid in 60 monthly installments. The installments consist of equal payments where the principal and interest portions of the payment vary with each installment.
At the creditor’s option, the principal balance of this loan could be converted into Sample Acquisition Candidate, Inc.’s common stock at a rate of $0.50 per share. For purposes of this analysis, it is assumed that the unpaid loan principal would be converted to common stock in projected month 48 subsequent to proposed acquisition.
This sample acquisition proposal was generated using DealSense® Plus+ and the Financial Report Builder™.
For more information call MoneySoft at (800) 966-7797. Note: this footer is fully customizable.
52

Proposed Equity Funding As a portion of the acquisition funding, cash and other contributions will be made and new common stock will be issued in the amount of $900,000 with $0 in new additional paid-in capital.
As a portion of the acquisition funding, cash and other contributions will be made and new preferred stock will be issued in the amount of $250,000 with $0 in new additional paid-in capital.
As a portion of the acquisition funding, buyer stock will be offered and new common stock will be issued in the amount of $750,000 with $0 in new additional paid-in capital.
This sample acquisition proposal was generated using DealSense® Plus+ and the Financial Report Builder™.
For more information call MoneySoft at (800) 966-7797. Note: this footer is fully customizable.
53
Post-Acquisition Projections In order to estimate Sample Acquisition Candidate, Inc.’s future performance under the direction of new ownership and management and to estimate the returns to investors subsequent to the proposed acquisition, a comprehensive 5 year projection of the financial statements has been prepared. The projections incorporate all assumptions related to the proposed transaction including the assumed financial performance under new ownership and management, estimated transaction costs, purchase price funding and any contingency and/or contract payments to the seller. These projections were prepared primarily to:
1. Determine earnings capacity subsequent to acquisition, 2. Estimate future capital and fixed asset requirements, 3. Analyze the ability to service acquisition-related obligations, and 4. Estimate the anticipated returns to investors.
For the most part, the Post-Acquisition Projections include the same projection options as the Pre-Acquisition Projections. The differences between the Post-Acquisition and Pre-Acquisition Projections are as follows: The post-acquisition income statement projection is based upon the buyer’s outlook for revenues and expenses. The economic impact of changes to be implemented by the buyer is included. In addition, depreciation, interest and amortization are based upon the purchase price and funding structure of the proposed transaction. Transaction costs (both fixed and variable) and terms of acquisition contracts (covenant-not-to-compete, employment, management, and lease, if any) are considered in the post-acquisition income statement projection. The post-acquisition balance sheet projection is based upon the allocated purchase price, the amount of any assumed liabilities and the funding structure for the proposed transaction. The asset values and liability balances in the Balance Sheet at Closing schedule will differ from the Company’s most recent historic balance sheet. The reader should take notice that the projected financial statements and related attachments are for planning and internal discussion purposes only, and that the same limitations and restrictions set forth in the Pre-Acquisition Projections are also applicable for the Post-Acquisition projections. The post-acquisition projected financial statements consist of income statements, balance sheets, statements of retained earnings, statements of cash flows and sources and uses of funds statements. An overall summary of the projections is presented below followed by the individual statements in condensed format. Please note that these projected financial statements and related attachments are for planning and internal discussion purposes only. See the Post-Acquisition Assumptions and Projection schedules for complete details.
This sample acquisition proposal was generated using DealSense® Plus+ and the Financial Report Builder™.
For more information call MoneySoft at (800) 966-7797. Note: this footer is fully customizable.
54
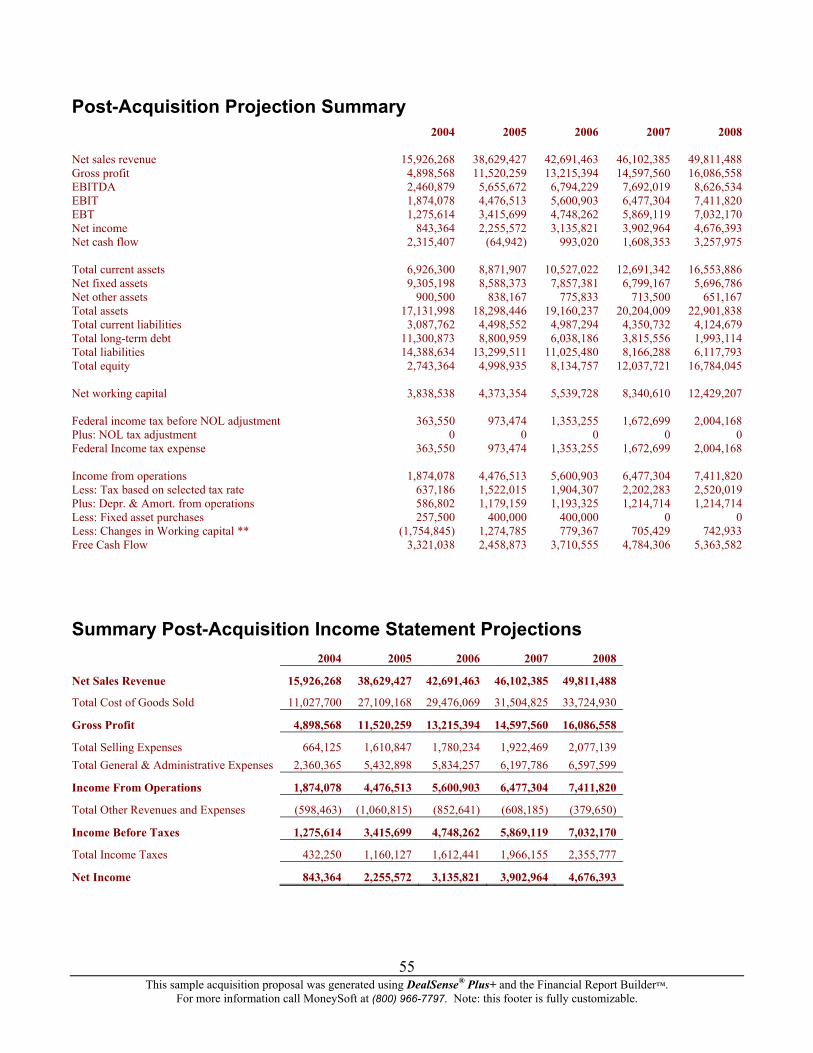
Post-Acquisition Projection Summary 2004 2005 2006 2007 2008 Net sales revenue 15,926,268 38,629,427 42,691,463 46,102,385 49,811,488 Gross profit 4,898,568 11,520,259 13,215,394 14,597,560 16,086,558 EBITDA 2,460,879 5,655,672 6,794,229 7,692,019 8,626,534 EBIT 1,874,078 4,476,513 5,600,903 6,477,304 7,411,820 EBT 1,275,614 3,415,699 4,748,262 5,869,119 7,032,170 Net income 843,364 2,255,572 3,135,821 3,902,964 4,676,393 Net cash flow 2,315,407 (64,942) 993,020 1,608,353 3,257,975 Total current assets 6,926,300 8,871,907 10,527,022 12,691,342 16,553,886 Net fixed assets 9,305,198 8,588,373 7,857,381 6,799,167 5,696,786 Net other assets 900,500 838,167 775,833 713,500 651,167 Total assets 17,131,998 18,298,446 19,160,237 20,204,009 22,901,838 Total current liabilities 3,087,762 4,498,552 4,987,294 4,350,732 4,124,679 Total long-term debt 11,300,873 8,800,959 6,038,186 3,815,556 1,993,114 Total liabilities 14,388,634 13,299,511 11,025,480 8,166,288 6,117,793 Total equity 2,743,364 4,998,935 8,134,757 12,037,721 16,784,045 Net working capital 3,838,538 4,373,354 5,539,728 8,340,610 12,429,207 Federal income tax before NOL adjustment 363,550 973,474 1,353,255 1,672,699 2,004,168 Plus: NOL tax adjustment 0 0 0 0 0 Federal Income tax expense 363,550 973,474 1,353,255 1,672,699 2,004,168 Income from operations 1,874,078 4,476,513 5,600,903 6,477,304 7,411,820 Less: Tax based on selected tax rate 637,186 1,522,015 1,904,307 2,202,283 2,520,019 Plus: Depr. & Amort. from operations 586,802 1,179,159 1,193,325 1,214,714 1,214,714 Less: Fixed asset purchases 257,500 400,000 400,000 0 0 Less: Changes in Working capital ** (1,754,845) 1,274,785 779,367 705,429 742,933 Free Cash Flow 3,321,038 2,458,873 3,710,555 4,784,306 5,363,582
Summary Post-Acquisition Income Statement Projections 2004 2005 2006 2007 2008
Net Sales Revenue 15,926,268 38,629,427 42,691,463 46,102,385 49,811,488
Total Cost of Goods Sold 11,027,700 27,109,168 29,476,069 31,504,825 33,724,930
Gross Profit 4,898,568 11,520,259 13,215,394 14,597,560 16,086,558
Total Selling Expenses 664,125 1,610,847 1,780,234 1,922,469 2,077,139 Total General & Administrative Expenses 2,360,365 5,432,898 5,834,257 6,197,786 6,597,599
Income From Operations 1,874,078 4,476,513 5,600,903 6,477,304 7,411,820
Total Other Revenues and Expenses (598,463) (1,060,815) (852,641) (608,185) (379,650)
Income Before Taxes 1,275,614 3,415,699 4,748,262 5,869,119 7,032,170
Total Income Taxes 432,250 1,160,127 1,612,441 1,966,155 2,355,777
Net Income 843,364 2,255,572 3,135,821 3,902,964 4,676,393
This sample acquisition proposal was generated using DealSense® Plus+ and the Financial Report Builder™.
For more information call MoneySoft at (800) 966-7797. Note: this footer is fully customizable.
55
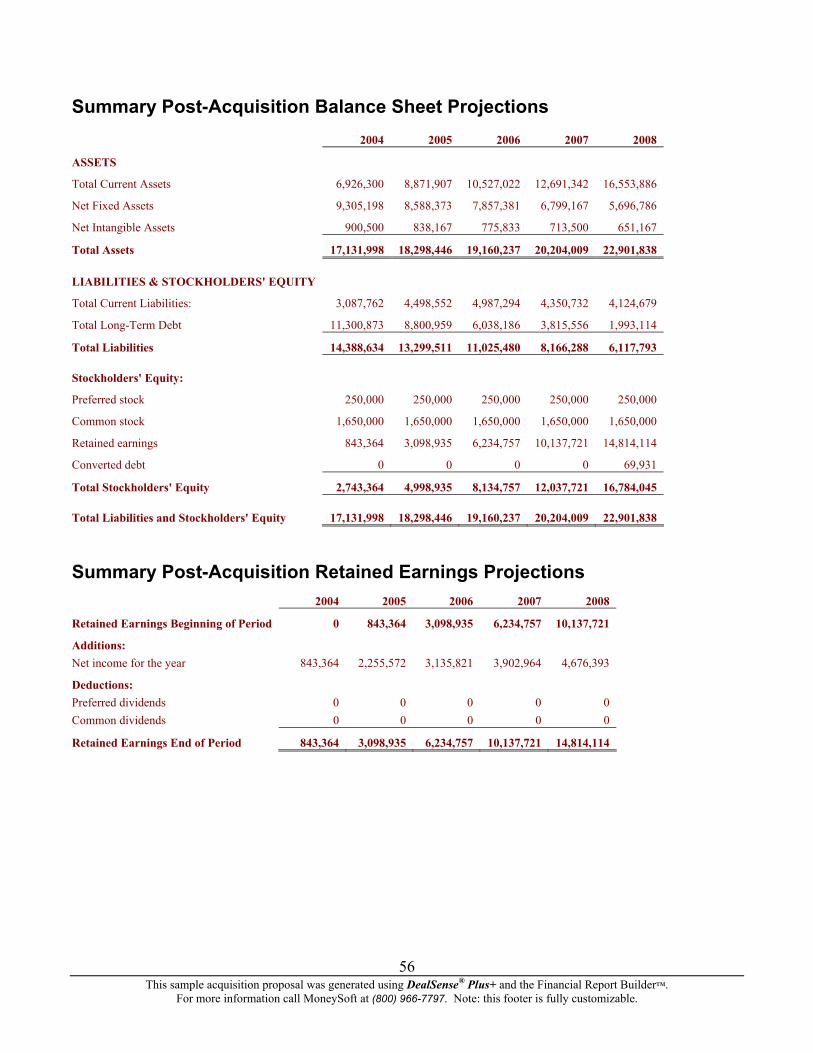
Summary Post-Acquisition Balance Sheet Projections 2004 2005 2006 2007 2008
ASSETS
Total Current Assets 6,926,300 8,871,907 10,527,022 12,691,342 16,553,886
Net Fixed Assets 9,305,198 8,588,373 7,857,381 6,799,167 5,696,786
Net Intangible Assets 900,500 838,167 775,833 713,500 651,167
Total Assets 17,131,998 18,298,446 19,160,237 20,204,009 22,901,838
LIABILITIES & STOCKHOLDERS' EQUITY
Total Current Liabilities: 3,087,762 4,498,552 4,987,294 4,350,732 4,124,679
Total Long-Term Debt 11,300,873 8,800,959 6,038,186 3,815,556 1,993,114
Total Liabilities 14,388,634 13,299,511 11,025,480 8,166,288 6,117,793
Stockholders' Equity:
Preferred stock 250,000 250,000 250,000 250,000 250,000
Common stock 1,650,000 1,650,000 1,650,000 1,650,000 1,650,000
Retained earnings 843,364 3,098,935 6,234,757 10,137,721 14,814,114
Converted debt 0 0 0 0 69,931
Total Stockholders' Equity 2,743,364 4,998,935 8,134,757 12,037,721 16,784,045
Total Liabilities and Stockholders' Equity 17,131,998 18,298,446 19,160,237 20,204,009 22,901,838
Summary Post-Acquisition Retained Earnings Projections 2004 2005 2006 2007 2008
Retained Earnings Beginning of Period 0 843,364 3,098,935 6,234,757 10,137,721
Additions: Net income for the year 843,364 2,255,572 3,135,821 3,902,964 4,676,393
Deductions: Preferred dividends 0 0 0 0 0 Common dividends 0 0 0 0 0
Retained Earnings End of Period 843,364 3,098,935 6,234,757 10,137,721 14,814,114
This sample acquisition proposal was generated using DealSense® Plus+ and the Financial Report Builder™.
For more information call MoneySoft at (800) 966-7797. Note: this footer is fully customizable.
56
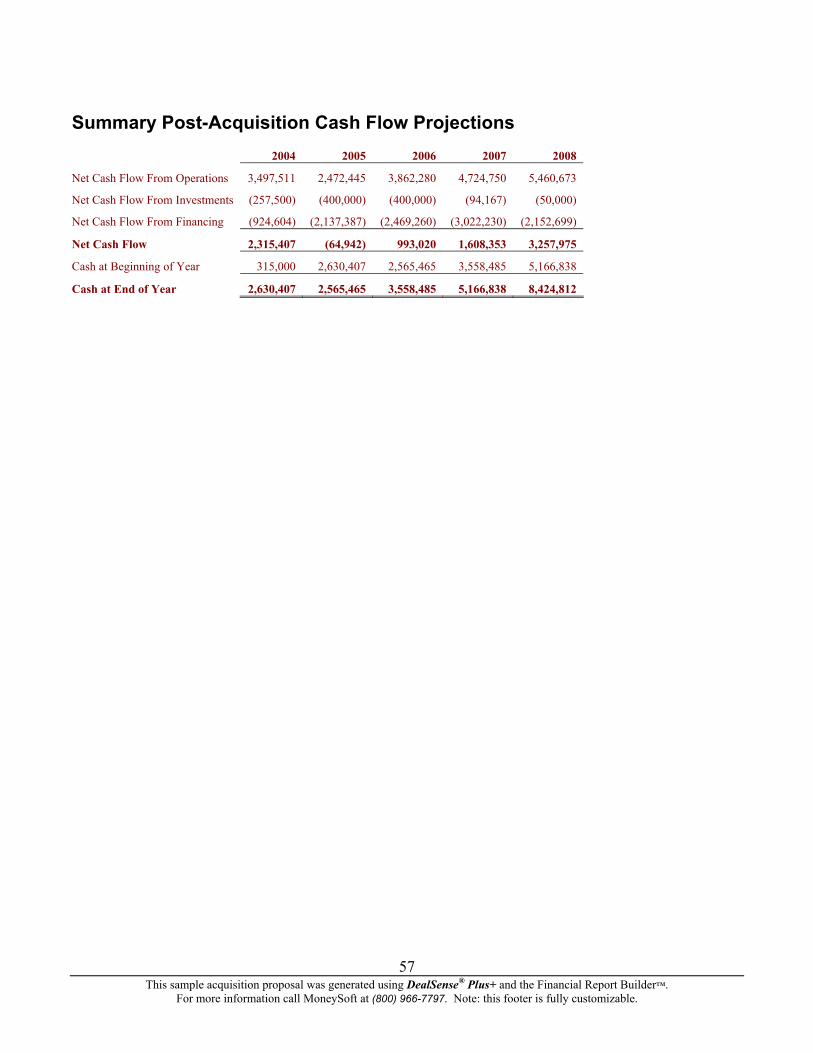
Summary Post-Acquisition Cash Flow Projections 2004 2005 2006 2007 2008
Net Cash Flow From Operations 3,497,511 2,472,445 3,862,280 4,724,750 5,460,673
Net Cash Flow From Investments (257,500) (400,000) (400,000) (94,167) (50,000)
Net Cash Flow From Financing (924,604) (2,137,387) (2,469,260) (3,022,230) (2,152,699)
Net Cash Flow 2,315,407 (64,942) 993,020 1,608,353 3,257,975
Cash at Beginning of Year 315,000 2,630,407 2,565,465 3,558,485 5,166,838
57
Cash at End of Year 2,630,407 2,565,465 3,558,485 5,166,838 8,424,812
This sample acquisition proposal was generated using DealSense® Plus+ and the Financial Report Builder™. For more information call MoneySoft at (800) 966-7797. Note: this footer is fully customizable.
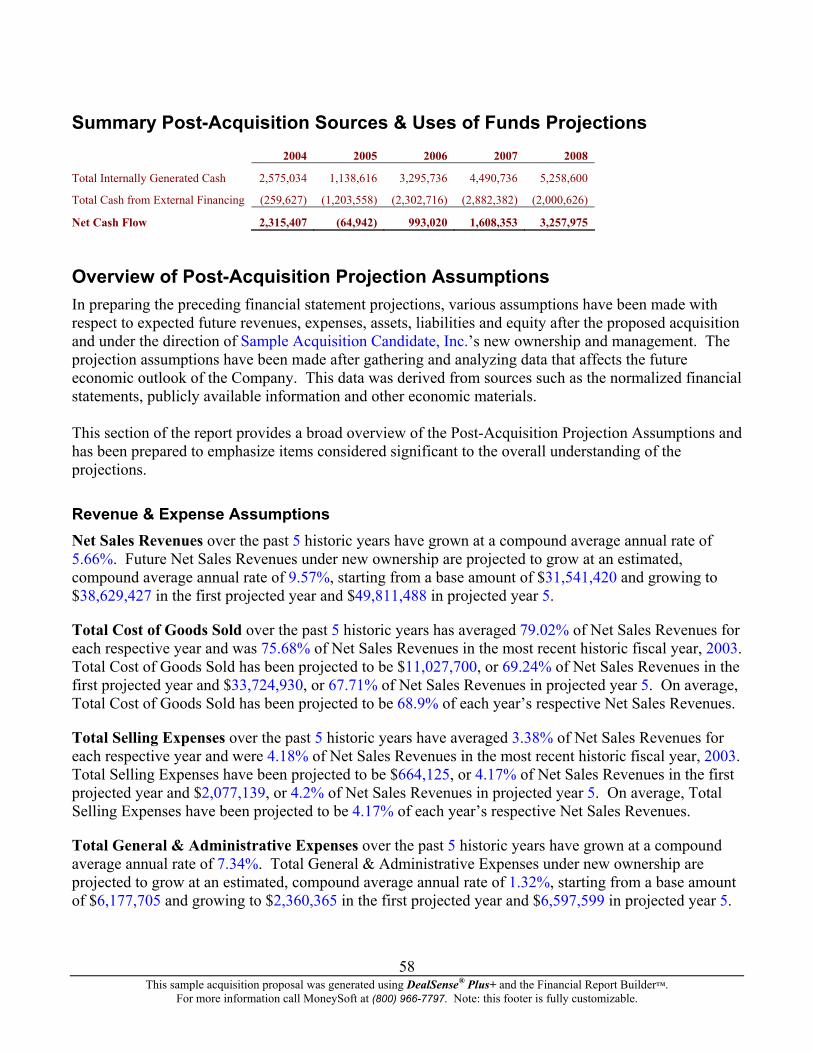
Summary Post-Acquisition Sources & Uses of Funds Projections 2004 2005 2006 2007 2008
Total Internally Generated Cash 2,575,034 1,138,616 3,295,736 4,490,736 5,258,600
Total Cash from External Financing (259,627) (1,203,558) (2,302,716) (2,882,382) (2,000,626)
58
Net Cash Flow 2,315,407 (64,942) 993,020 1,608,353 3,257,975
Overview of Post-Acquisition Projection Assumptions In preparing the preceding financial statement projections, various assumptions have been made with respect to expected future revenues, expenses, assets, liabilities and equity after the proposed acquisition and under the direction of Sample Acquisition Candidate, Inc.’s new ownership and management. The projection assumptions have been made after gathering and analyzing data that affects the future economic outlook of the Company. This data was derived from sources such as the normalized financial statements, publicly available information and other economic materials. This section of the report provides a broad overview of the Post-Acquisition Projection Assumptions and has been prepared to emphasize items considered significant to the overall understanding of the projections.
Revenue & Expense Assumptions Net Sales Revenues over the past 5 historic years have grown at a compound average annual rate of 5.66%. Future Net Sales Revenues under new ownership are projected to grow at an estimated, compound average annual rate of 9.57%, starting from a base amount of $31,541,420 and growing to $38,629,427 in the first projected year and $49,811,488 in projected year 5.
Total Cost of Goods Sold over the past 5 historic years has averaged 79.02% of Net Sales Revenues for each respective year and was 75.68% of Net Sales Revenues in the most recent historic fiscal year, 2003. Total Cost of Goods Sold has been projected to be $11,027,700, or 69.24% of Net Sales Revenues in the first projected year and $33,724,930, or 67.71% of Net Sales Revenues in projected year 5. On average, Total Cost of Goods Sold has been projected to be 68.9% of each year’s respective Net Sales Revenues.
Total Selling Expenses over the past 5 historic years have averaged 3.38% of Net Sales Revenues for each respective year and were 4.18% of Net Sales Revenues in the most recent historic fiscal year, 2003. Total Selling Expenses have been projected to be $664,125, or 4.17% of Net Sales Revenues in the first projected year and $2,077,139, or 4.2% of Net Sales Revenues in projected year 5. On average, Total Selling Expenses have been projected to be 4.17% of each year’s respective Net Sales Revenues.
Total General & Administrative Expenses over the past 5 historic years have grown at a compound average annual rate of 7.34%. Total General & Administrative Expenses under new ownership are projected to grow at an estimated, compound average annual rate of 1.32%, starting from a base amount of $6,177,705 and growing to $2,360,365 in the first projected year and $6,597,599 in projected year 5.
This sample acquisition proposal was generated using DealSense® Plus+ and the Financial Report Builder™. For more information call MoneySoft at (800) 966-7797. Note: this footer is fully customizable.
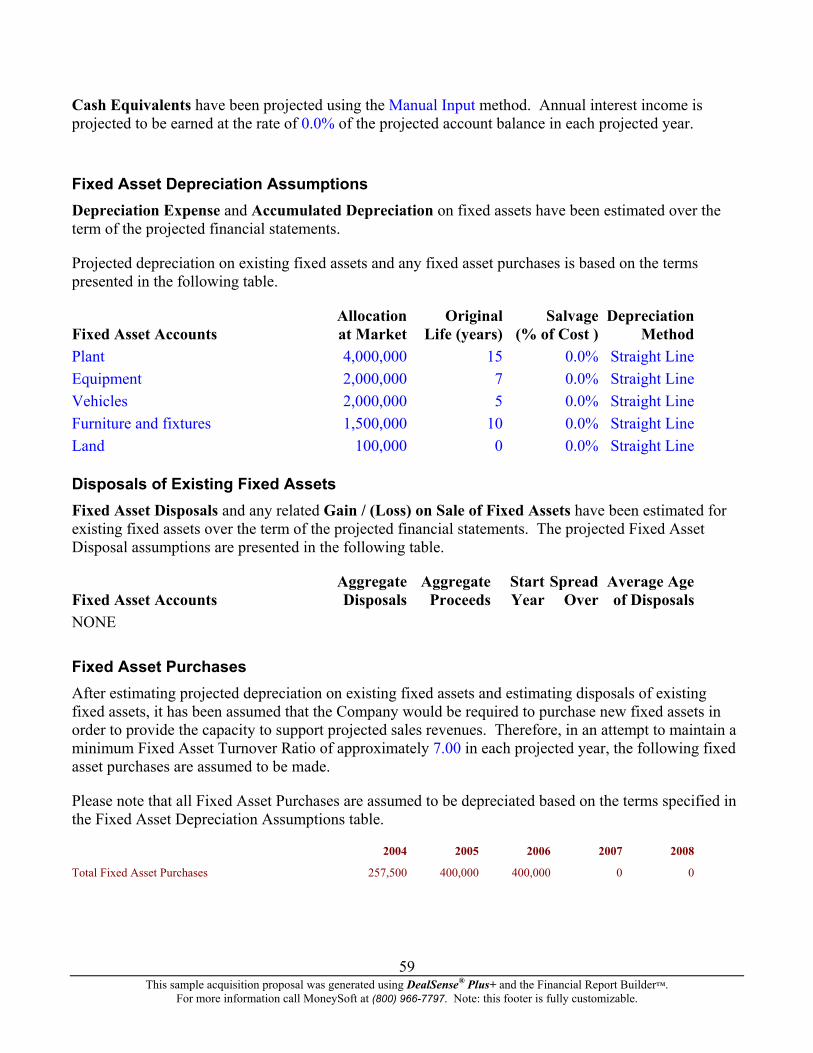
Cash Equivalents have been projected using the Manual Input method. Annual interest income is projected to be earned at the rate of 0.0% of the projected account balance in each projected year.
Fixed Asset Depreciation Assumptions Depreciation Expense and Accumulated Depreciation on fixed assets have been estimated over the term of the projected financial statements.
Projected depreciation on existing fixed assets and any fixed asset purchases is based on the terms presented in the following table.
Allocation Original Salvage Depreciation Fixed Asset Accounts at Market Life (years) (% of Cost ) Method Plant 4,000,000 15 0.0% Straight Line Equipment 2,000,000 7 0.0% Straight Line Vehicles 2,000,000 5 0.0% Straight Line Furniture and fixtures 1,500,000 10 0.0% Straight Line Land 100,000 0 0.0% Straight Line
Disposals of Existing Fixed Assets Fixed Asset Disposals and any related Gain / (Loss) on Sale of Fixed Assets have been estimated for existing fixed assets over the term of the projected financial statements. The projected Fixed Asset Disposal assumptions are presented in the following table.
Aggregate Aggregate Start Spread Average Age Fixed Asset Accounts Disposals Proceeds Year Over of Disposals NONE
Fixed Asset Purchases After estimating projected depreciation on existing fixed assets and estimating disposals of existing fixed assets, it has been assumed that the Company would be required to purchase new fixed assets in order to provide the capacity to support projected sales revenues. Therefore, in an attempt to maintain a minimum Fixed Asset Turnover Ratio of approximately 7.00 in each projected year, the following fixed asset purchases are assumed to be made.
Please note that all Fixed Asset Purchases are assumed to be depreciated based on the terms specified in the Fixed Asset Depreciation Assumptions table.
2004 2005 2006 2007 2008
Total Fixed Asset Purchases 257,500 400,000 400,000 0 0
This sample acquisition proposal was generated using DealSense® Plus+ and the Financial Report Builder™.
For more information call MoneySoft at (800) 966-7797. Note: this footer is fully customizable.
59
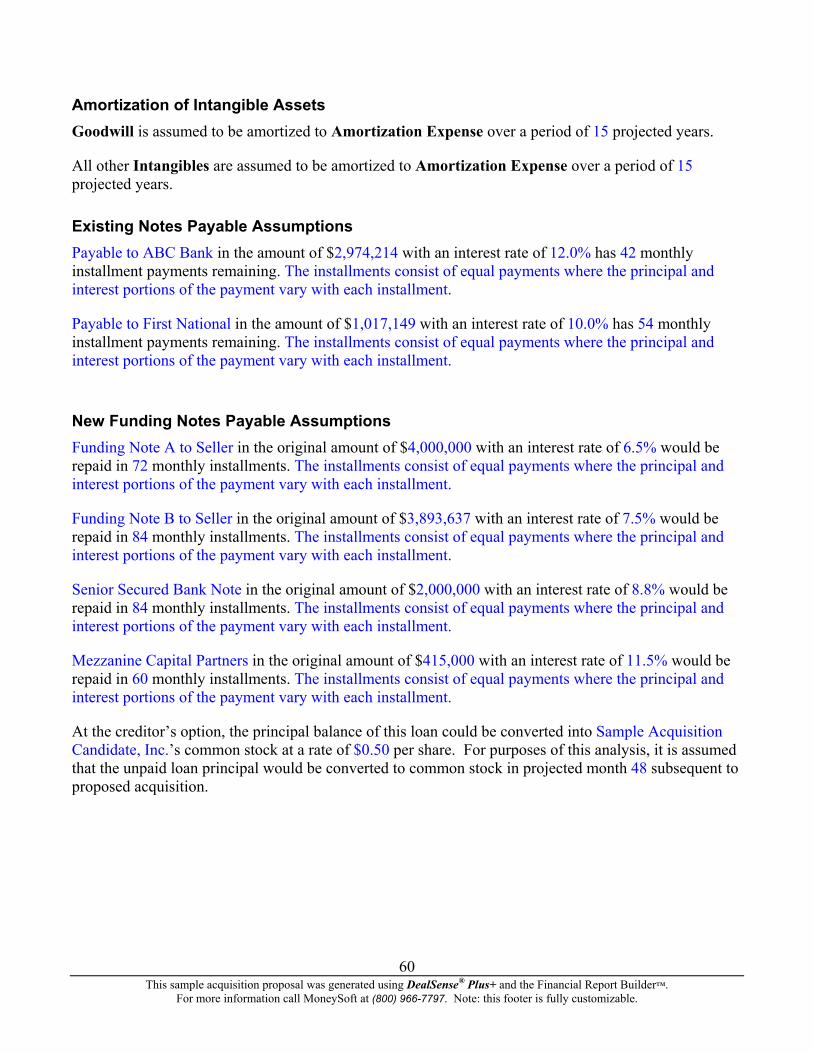
Amortization of Intangible Assets Goodwill is assumed to be amortized to Amortization Expense over a period of 15 projected years.
All other Intangibles are assumed to be amortized to Amortization Expense over a period of 15 projected years.
Existing Notes Payable Assumptions Payable to ABC Bank in the amount of $2,974,214 with an interest rate of 12.0% has 42 monthly installment payments remaining. The installments consist of equal payments where the principal and interest portions of the payment vary with each installment.
Payable to First National in the amount of $1,017,149 with an interest rate of 10.0% has 54 monthly installment payments remaining. The installments consist of equal payments where the principal and interest portions of the payment vary with each installment.
New Funding Notes Payable Assumptions Funding Note A to Seller in the original amount of $4,000,000 with an interest rate of 6.5% would be repaid in 72 monthly installments. The installments consist of equal payments where the principal and interest portions of the payment vary with each installment.
Funding Note B to Seller in the original amount of $3,893,637 with an interest rate of 7.5% would be repaid in 84 monthly installments. The installments consist of equal payments where the principal and interest portions of the payment vary with each installment.
Senior Secured Bank Note in the original amount of $2,000,000 with an interest rate of 8.8% would be repaid in 84 monthly installments. The installments consist of equal payments where the principal and interest portions of the payment vary with each installment.
Mezzanine Capital Partners in the original amount of $415,000 with an interest rate of 11.5% would be repaid in 60 monthly installments. The installments consist of equal payments where the principal and interest portions of the payment vary with each installment.
At the creditor’s option, the principal balance of this loan could be converted into Sample Acquisition Candidate, Inc.’s common stock at a rate of $0.50 per share. For purposes of this analysis, it is assumed that the unpaid loan principal would be converted to common stock in projected month 48 subsequent to proposed acquisition.
This sample acquisition proposal was generated using DealSense® Plus+ and the Financial Report Builder™.
For more information call MoneySoft at (800) 966-7797. Note: this footer is fully customizable.
60
Equity Funding As a portion of the acquisition funding, cash and other contributions will be made and new common stock will be issued in the amount of $900,000 with $0 in new additional paid-in capital.
As a portion of the acquisition funding, cash and other contributions will be made and new preferred stock will be issued in the amount of $250,000 with $0 in new additional paid-in capital.
As a portion of the acquisition funding, buyer stock will be offered and new common stock will be issued in the amount of $750,000 with $0 in new additional paid-in capital.
Dividends Assumptions Preferred Stock Dividends are assumed to be paid at the rate of 0.0% of the preferred stock balance in each projected year.
Common Stock Dividends are assumed to be paid at the rate of 0.0% of net income in each projected year.
This sample acquisition proposal was generated using DealSense® Plus+ and the Financial Report Builder™.
For more information call MoneySoft at (800) 966-7797. Note: this footer is fully customizable.
61
Review of Post-Acquisition Financial Performance The results of the Post-Acquisition Projections have been analyzed and reviewed. The objective of this review is to analyze the financial performance and position of the Company during the term of the projections.
Loan Compliance In the Loan Compliance analysis, selected ratios that are indicators of the Company’s ability to meet its obligations have been calculated for each year subsequent to the acquisition. A minimum performance level (frequently imposed as an affirmative covenant by a lender) for each ratio has been established and any anticipated defaults have been noted. See the Loan Compliance schedule for complete details.
Post-Acquisition Business Ratios The Post-Acquisition Business Ratios contain a review of the Company’s key business ratios. Ratios were calculated for each projected year of the Company’s Post-Acquisition projected financial statements. These ratios measure Sample Acquisition Candidate, Inc.’s liquidity positions, coverage capacity, leverage/capitalization, operating efficiency and equity performance. The listed ratios fall into the following five categories:
1. Liquidity ratios measure the short-term ability of a company to meet its maturing obligations.
2. Coverage ratios measure the degree of protection for long-term creditors and investors and the margin by which certain obligations of a company can be met.
3. Leverage/capitalization ratios measure the amount of a company’s operations that are financed
from debt versus financed from equity.
4. Operating ratios measure the efficiency and productivity of a company using the resources that are available and the returns on sales and investments.
5. Equity ratios measure the performance of assets and earnings in relation to common and
preferred equity.
This sample acquisition proposal was generated using DealSense® Plus+ and the Financial Report Builder™.
For more information call MoneySoft at (800) 966-7797. Note: this footer is fully customizable.
62
Post-Acquisition Business Ratios 2004 2005 2006 2007 2008
Liquidity Ratios: Current ratio 2.24 1.97 2.11 2.92 4.01 Quick ratio 1.24 1.21 1.35 1.97 2.93 Accounts receivable turnover 13.57 13.57 13.57 13.57 13.57 Days' receivable 26.53 26.53 26.53 26.53 26.53 Inventory turnover 3.54 7.86 7.73 7.65 7.58 Days' inventory 101.60 45.81 46.56 47.04 47.48 Accounts payable turnover 16.89 17.12 16.84 16.67 16.51 Days' payable 21.32 21.03 21.38 21.60 21.80 Working capital turnover 4.15 8.83 7.71 5.53 4.01 Inventory as a % of Total current assets 44.93% 38.88% 36.21% 32.44% 26.87% Total current assets as a % of Total assets 40.43% 48.48% 54.94% 62.82% 72.28% Coverage Ratios: Times interest earned 3.13 4.22 6.57 10.65 19.52 Current portion of long-term debt coverage 0.62 1.28 1.45 2.35 3.31 EBIT to Principal 2.03 2.09 2.27 2.14 3.33 EBIT to (Principal + Interest) 1.23 1.40 1.69 1.78 2.85 Leverage/Capitalization Ratios: Fixed assets to Tangible net worth 5.05 2.06 1.07 0.60 0.35 Total debt to Tangible net worth 7.81 3.20 1.50 0.72 0.38 Short-term debt to Total debt 21.46% 33.82% 45.23% 53.28% 67.42% Short-term debt to Net worth 112.55% 89.99% 61.31% 36.14% 24.57% Total debt to Total assets 83.99% 72.68% 57.54% 40.42% 26.71% Operating Ratios: Percent return on Tangible net worth 69.22% 82.09% 64.52% 51.83% 43.59% Percent return on Total assets 7.45% 18.67% 24.78% 29.05% 30.71% Net sales to Net fixed assets 1.71 4.50 5.43 6.78 8.74 Net sales to Total assets 0.93 2.11 2.23 2.28 2.17 Percent Depr., Amort. to Net sales 3.68% 3.05% 2.80% 2.63% 2.44% Percent Officer salaries to Net sales 0.55% 0.55% 0.55% 0.56% 0.57% Total sales to Net worth 5.89 7.85 5.33 3.89 3.01 Revenue growth percentage 142.55% 10.52% 7.99% 8.05% Sustainable growth rate 30.74% 45.12% 38.55% 32.42% 27.86% Z-Score 1.74 3.67 4.44 5.42 6.44
This sample acquisition proposal was generated using DealSense® Plus+ and the Financial Report Builder™.
For more information call MoneySoft at (800) 966-7797. Note: this footer is fully customizable.
63
Post-Acquisition Common-Size Statements This analysis includes a review of the Company’s common-size income statement and balance sheet percentages subsequent to the acquisition. In order to portray the relative size of financial statement items for comparison over time, each line item in the common-size income statements is expressed as a percentage of total revenue and each line item in the common-size balance sheets is expressed as a percentage of total assets as presented below. Post-Acquisition Common-Size Statements 2004 2005 2006 2007 2008 Income Data: Net sales 100.00% 100.00% 100.00% 100.00% 100.00% Gross profit 30.76% 29.82% 30.96% 31.66% 32.29% Operating expenses 18.99% 18.23% 17.84% 17.61% 17.42% Operating profit 11.77% 11.59% 13.12% 14.05% 14.88% All other expenses (net) -3.76% -2.75% -2.00% -1.32% -0.76%
Profit Before Tax 8.01% 8.84% 11.12% 12.73% 14.12%
Assets: Cash & equivalents 15.35% 14.02% 18.57% 25.57% 36.79% Trade receivables (net) 6.85% 15.56% 16.42% 16.82% 16.03% Inventory 18.17% 18.85% 19.90% 20.38% 19.42% All other current assets 0.06% 0.05% 0.05% 0.05% 0.04%
Total Current Assets 40.43% 48.48% 54.94% 62.82% 72.28%
Fixed assets (net) 54.31% 46.93% 41.01% 33.65% 24.87% Intangibles (net) 5.26% 4.58% 4.05% 3.53% 2.84% All other noncurrent assets 0.00% 0.00% 0.00% 0.00% 0.00%
Total Noncurrent Assets 59.57% 51.52% 45.06% 37.18% 27.72%
Total Assets 100.00% 100.00% 100.00% 100.00% 100.00%
Liabilities: Notes payable short-term 0.00% 0.00% 0.00% 0.00% 0.00% Current maturity of long-term Debt 13.57% 14.68% 15.56% 10.79% 7.78% Trade payables 3.81% 8.66% 9.14% 9.36% 8.92% Income taxes payable 0.00% 0.00% 0.00% 0.00% 0.00% All other current liabilities 0.64% 1.24% 1.34% 1.38% 1.32%
Total Current Liabilities 18.02% 24.58% 26.03% 21.53% 18.01%
Long-term debt 65.96% 48.10% 31.51% 18.89% 8.70% Deferred taxes 0.00% 0.00% 0.00% 0.00% 0.00% All other noncurrent liabilities 0.00% 0.00% 0.00% 0.00% 0.00%
Net worth 16.01% 27.32% 42.46% 59.58% 73.29%
64
Total Liabilities & Net Worth 100.00% 100.00% 100.00% 100.00% 100.00%
This sample acquisition proposal was generated using DealSense® Plus+ and the Financial Report Builder™. For more information call MoneySoft at (800) 966-7797. Note: this footer is fully customizable.
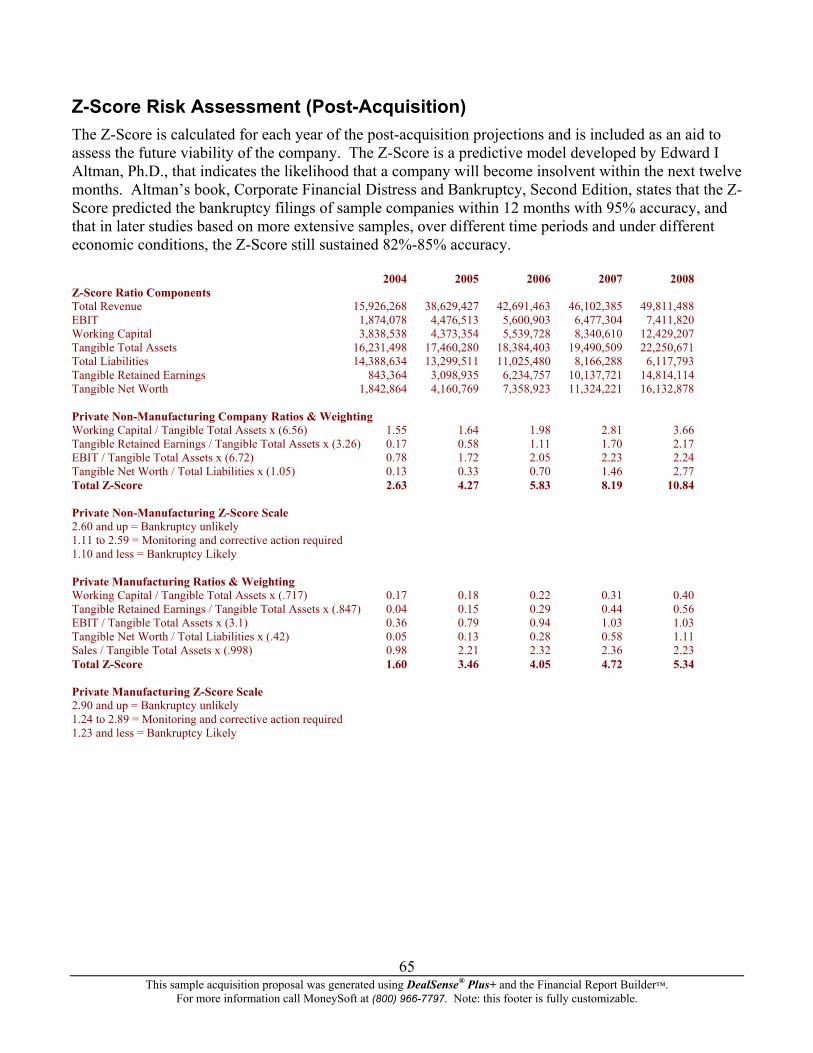
Z-Score Risk Assessment (Post-Acquisition) The Z-Score is calculated for each year of the post-acquisition projections and is included as an aid to assess the future viability of the company. The Z-Score is a predictive model developed by Edward I Altman, Ph.D., that indicates the likelihood that a company will become insolvent within the next twelve months. Altman’s book, Corporate Financial Distress and Bankruptcy, Second Edition, states that the Z-Score predicted the bankruptcy filings of sample companies within 12 months with 95% accuracy, and that in later studies based on more extensive samples, over different time periods and under different economic conditions, the Z-Score still sustained 82%-85% accuracy. 2004 2005 2006 2007 2008 Z-Score Ratio Components Total Revenue 15,926,268 38,629,427 42,691,463 46,102,385 49,811,488 EBIT 1,874,078 4,476,513 5,600,903 6,477,304 7,411,820 Working Capital 3,838,538 4,373,354 5,539,728 8,340,610 12,429,207 Tangible Total Assets 16,231,498 17,460,280 18,384,403 19,490,509 22,250,671 Total Liabilities 14,388,634 13,299,511 11,025,480 8,166,288 6,117,793 Tangible Retained Earnings 843,364 3,098,935 6,234,757 10,137,721 14,814,114 Tangible Net Worth 1,842,864 4,160,769 7,358,923 11,324,221 16,132,878 Private Non-Manufacturing Company Ratios & Weighting Working Capital / Tangible Total Assets x (6.56) 1.55 1.64 1.98 2.81 3.66 Tangible Retained Earnings / Tangible Total Assets x (3.26) 0.17 0.58 1.11 1.70 2.17 EBIT / Tangible Total Assets x (6.72) 0.78 1.72 2.05 2.23 2.24 Tangible Net Worth / Total Liabilities x (1.05) 0.13 0.33 0.70 1.46 2.77 Total Z-Score 2.63 4.27 5.83 8.19 10.84 Private Non-Manufacturing Z-Score Scale 2.60 and up = Bankruptcy unlikely 1.11 to 2.59 = Monitoring and corrective action required 1.10 and less = Bankruptcy Likely Private Manufacturing Ratios & Weighting Working Capital / Tangible Total Assets x (.717) 0.17 0.18 0.22 0.31 0.40 Tangible Retained Earnings / Tangible Total Assets x (.847) 0.04 0.15 0.29 0.44 0.56 EBIT / Tangible Total Assets x (3.1) 0.36 0.79 0.94 1.03 1.03 Tangible Net Worth / Total Liabilities x (.42) 0.05 0.13 0.28 0.58 1.11 Sales / Tangible Total Assets x (.998) 0.98 2.21 2.32 2.36 2.23 Total Z-Score 1.60 3.46 4.05 4.72 5.34 Private Manufacturing Z-Score Scale 2.90 and up = Bankruptcy unlikely 1.24 to 2.89 = Monitoring and corrective action required 1.23 and less = Bankruptcy Likely
This sample acquisition proposal was generated using DealSense® Plus+ and the Financial Report Builder™.
For more information call MoneySoft at (800) 966-7797. Note: this footer is fully customizable.
65
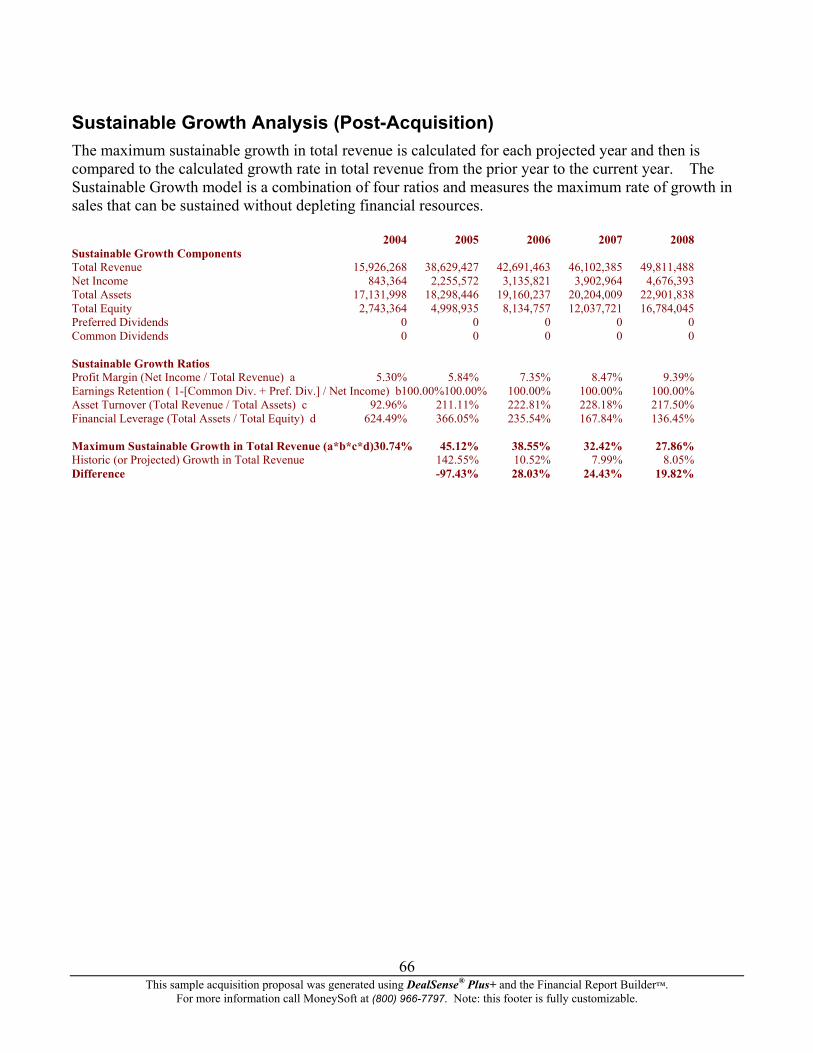
Sustainable Growth Analysis (Post-Acquisition) The maximum sustainable growth in total revenue is calculated for each projected year and then is compared to the calculated growth rate in total revenue from the prior year to the current year. The Sustainable Growth model is a combination of four ratios and measures the maximum rate of growth in sales that can be sustained without depleting financial resources. 2004 2005 2006 2007 2008 Sustainable Growth Components Total Revenue 15,926,268 38,629,427 42,691,463 46,102,385 49,811,488 Net Income 843,364 2,255,572 3,135,821 3,902,964 4,676,393 Total Assets 17,131,998 18,298,446 19,160,237 20,204,009 22,901,838 Total Equity 2,743,364 4,998,935 8,134,757 12,037,721 16,784,045 Preferred Dividends 0 0 0 0 0 Common Dividends 0 0 0 0 0 Sustainable Growth Ratios Profit Margin (Net Income / Total Revenue) a 5.30% 5.84% 7.35% 8.47% 9.39% Earnings Retention ( 1-[Common Div. + Pref. Div.] / Net Income) b100.00%100.00% 100.00% 100.00% 100.00% Asset Turnover (Total Revenue / Total Assets) c 92.96% 211.11% 222.81% 228.18% 217.50% Financial Leverage (Total Assets / Total Equity) d 624.49% 366.05% 235.54% 167.84% 136.45% Maximum Sustainable Growth in Total Revenue (a*b*c*d)30.74% 45.12% 38.55% 32.42% 27.86% Historic (or Projected) Growth in Total Revenue 142.55% 10.52% 7.99% 8.05% Difference -97.43% 28.03% 24.43% 19.82%
This sample acquisition proposal was generated using DealSense® Plus+ and the Financial Report Builder™.
For more information call MoneySoft at (800) 966-7797. Note: this footer is fully customizable.
66
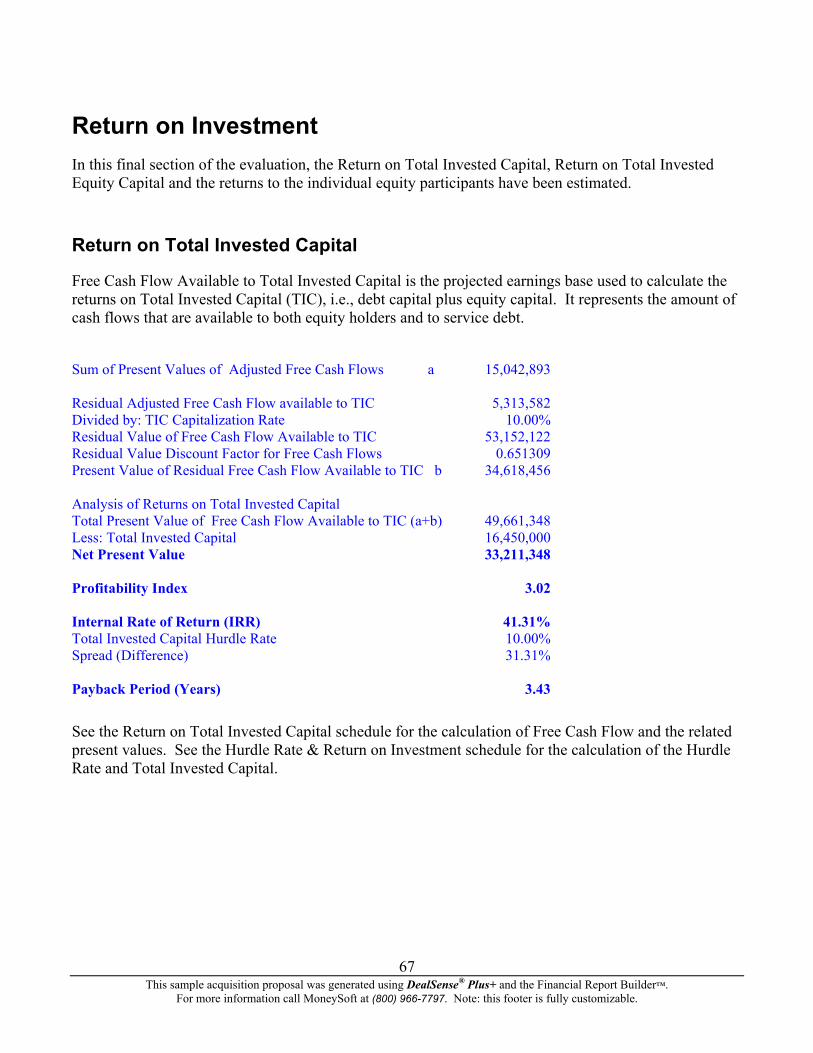
Return on Investment In this final section of the evaluation, the Return on Total Invested Capital, Return on Total Invested Equity Capital and the returns to the individual equity participants have been estimated.
Return on Total Invested Capital
Free Cash Flow Available to Total Invested Capital is the projected earnings base used to calculate the returns on Total Invested Capital (TIC), i.e., debt capital plus equity capital. It represents the amount of cash flows that are available to both equity holders and to service debt.
Sum of Present Values of Adjusted Free Cash Flows a 15,042,893 Residual Adjusted Free Cash Flow available to TIC 5,313,582 Divided by: TIC Capitalization Rate 10.00% Residual Value of Free Cash Flow Available to TIC 53,152,122 Residual Value Discount Factor for Free Cash Flows 0.651309 Present Value of Residual Free Cash Flow Available to TIC b 34,618,456 Analysis of Returns on Total Invested Capital Total Present Value of Free Cash Flow Available to TIC (a+b) 49,661,348 Less: Total Invested Capital 16,450,000 Net Present Value 33,211,348 Profitability Index 3.02 Internal Rate of Return (IRR) 41.31% Total Invested Capital Hurdle Rate 10.00% Spread (Difference) 31.31% Payback Period (Years) 3.43
See the Return on Total Invested Capital schedule for the calculation of Free Cash Flow and the related present values. See the Hurdle Rate & Return on Investment schedule for the calculation of the Hurdle Rate and Total Invested Capital.
This sample acquisition proposal was generated using DealSense® Plus+ and the Financial Report Builder™.
For more information call MoneySoft at (800) 966-7797. Note: this footer is fully customizable.
67
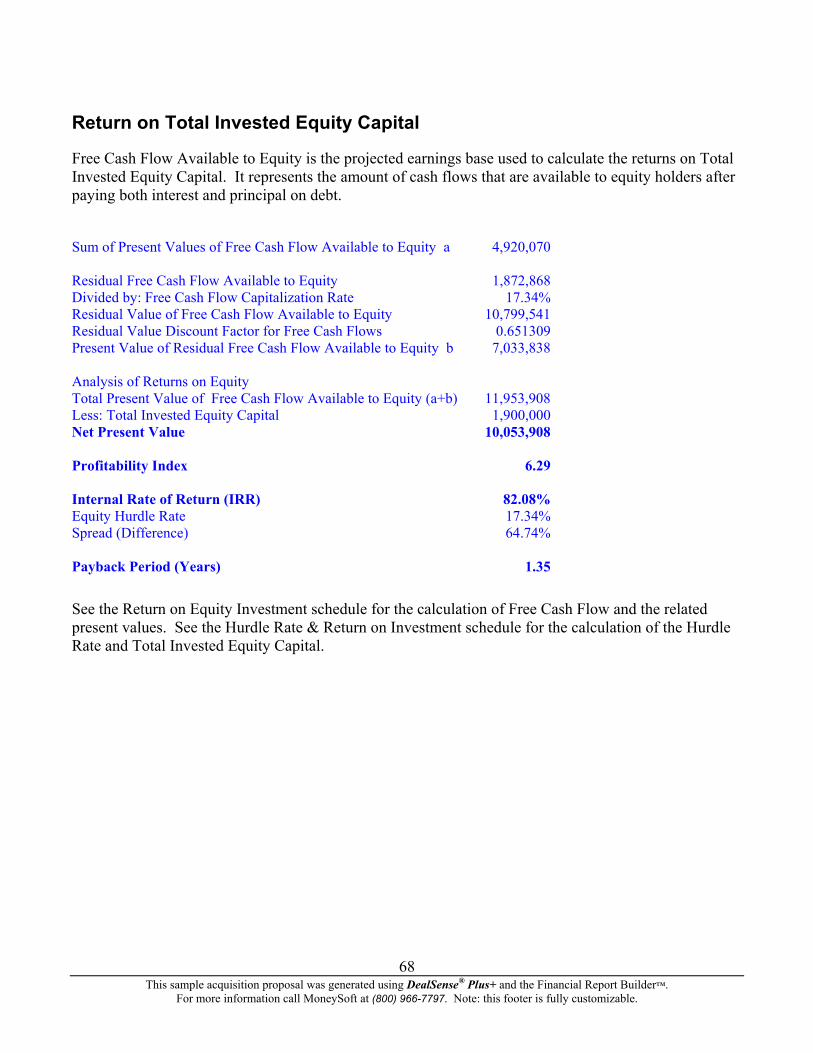
Return on Total Invested Equity Capital
Free Cash Flow Available to Equity is the projected earnings base used to calculate the returns on Total Invested Equity Capital. It represents the amount of cash flows that are available to equity holders after paying both interest and principal on debt.
Sum of Present Values of Free Cash Flow Available to Equity a 4,920,070 Residual Free Cash Flow Available to Equity 1,872,868 Divided by: Free Cash Flow Capitalization Rate 17.34% Residual Value of Free Cash Flow Available to Equity 10,799,541 Residual Value Discount Factor for Free Cash Flows 0.651309 Present Value of Residual Free Cash Flow Available to Equity b 7,033,838 Analysis of Returns on Equity Total Present Value of Free Cash Flow Available to Equity (a+b) 11,953,908 Less: Total Invested Equity Capital 1,900,000 Net Present Value 10,053,908 Profitability Index 6.29 Internal Rate of Return (IRR) 82.08% Equity Hurdle Rate 17.34% Spread (Difference) 64.74% Payback Period (Years) 1.35
See the Return on Equity Investment schedule for the calculation of Free Cash Flow and the related present values. See the Hurdle Rate & Return on Investment schedule for the calculation of the Hurdle Rate and Total Invested Equity Capital.
This sample acquisition proposal was generated using DealSense® Plus+ and the Financial Report Builder™.
For more information call MoneySoft at (800) 966-7797. Note: this footer is fully customizable.
68
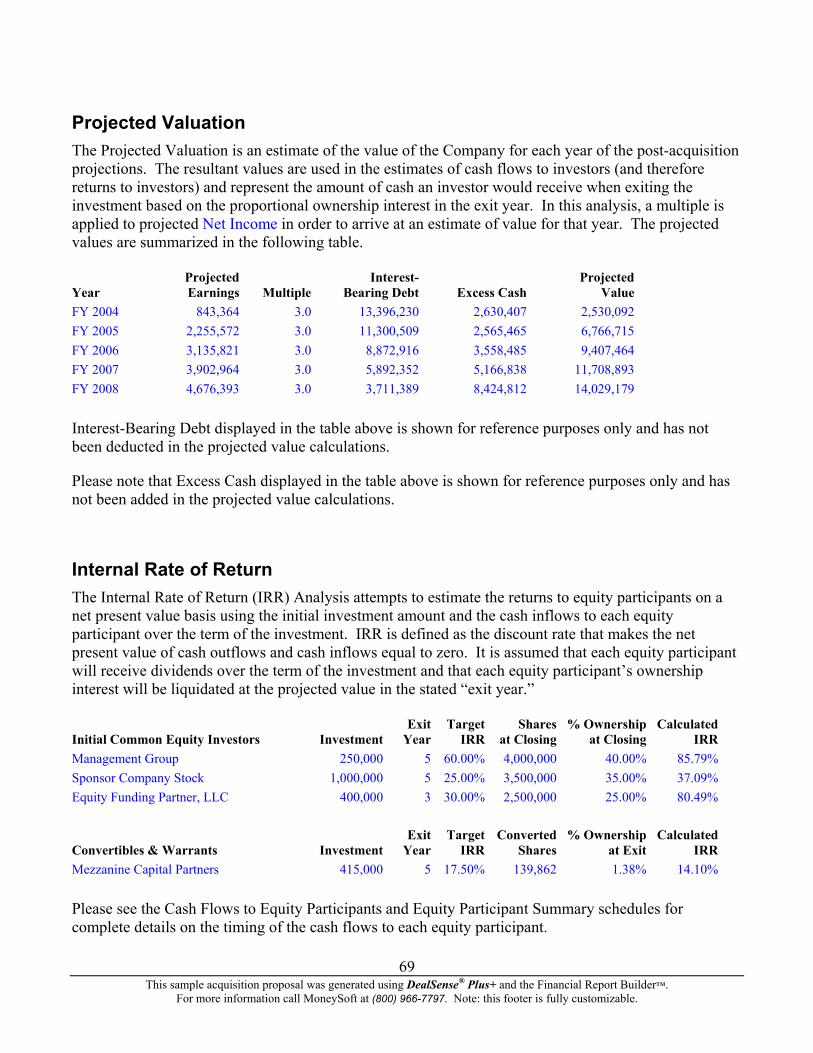
Projected Valuation The Projected Valuation is an estimate of the value of the Company for each year of the post-acquisition projections. The resultant values are used in the estimates of cash flows to investors (and therefore returns to investors) and represent the amount of cash an investor would receive when exiting the investment based on the proportional ownership interest in the exit year. In this analysis, a multiple is applied to projected Net Income in order to arrive at an estimate of value for that year. The projected values are summarized in the following table. Projected Interest- Projected Year Earnings Multiple Bearing Debt Excess Cash Value FY 2004 843,364 3.0 13,396,230 2,630,407 2,530,092 FY 2005 2,255,572 3.0 11,300,509 2,565,465 6,766,715 FY 2006 3,135,821 3.0 8,872,916 3,558,485 9,407,464 FY 2007 3,902,964 3.0 5,892,352 5,166,838 11,708,893 FY 2008 4,676,393 3.0 3,711,389 8,424,812 14,029,179 Interest-Bearing Debt displayed in the table above is shown for reference purposes only and has not been deducted in the projected value calculations.
Please note that Excess Cash displayed in the table above is shown for reference purposes only and has not been added in the projected value calculations.
Internal Rate of Return The Internal Rate of Return (IRR) Analysis attempts to estimate the returns to equity participants on a net present value basis using the initial investment amount and the cash inflows to each equity participant over the term of the investment. IRR is defined as the discount rate that makes the net present value of cash outflows and cash inflows equal to zero. It is assumed that each equity participant will receive dividends over the term of the investment and that each equity participant’s ownership interest will be liquidated at the projected value in the stated “exit year.” Exit Target Shares % Ownership Calculated Initial Common Equity Investors Investment Year IRR at Closing at Closing IRR Management Group 250,000 5 60.00% 4,000,000 40.00% 85.79% Sponsor Company Stock 1,000,000 5 25.00% 3,500,000 35.00% 37.09% Equity Funding Partner, LLC 400,000 3 30.00% 2,500,000 25.00% 80.49% Exit Target Converted % Ownership Calculated Convertibles & Warrants Investment Year IRR Shares at Exit IRR Mezzanine Capital Partners 415,000 5 17.50% 139,862 1.38% 14.10% Please see the Cash Flows to Equity Participants and Equity Participant Summary schedules for complete details on the timing of the cash flows to each equity participant.
This sample acquisition proposal was generated using DealSense® Plus+ and the Financial Report Builder™. For more information call MoneySoft at (800) 966-7797. Note: this footer is fully customizable.
69
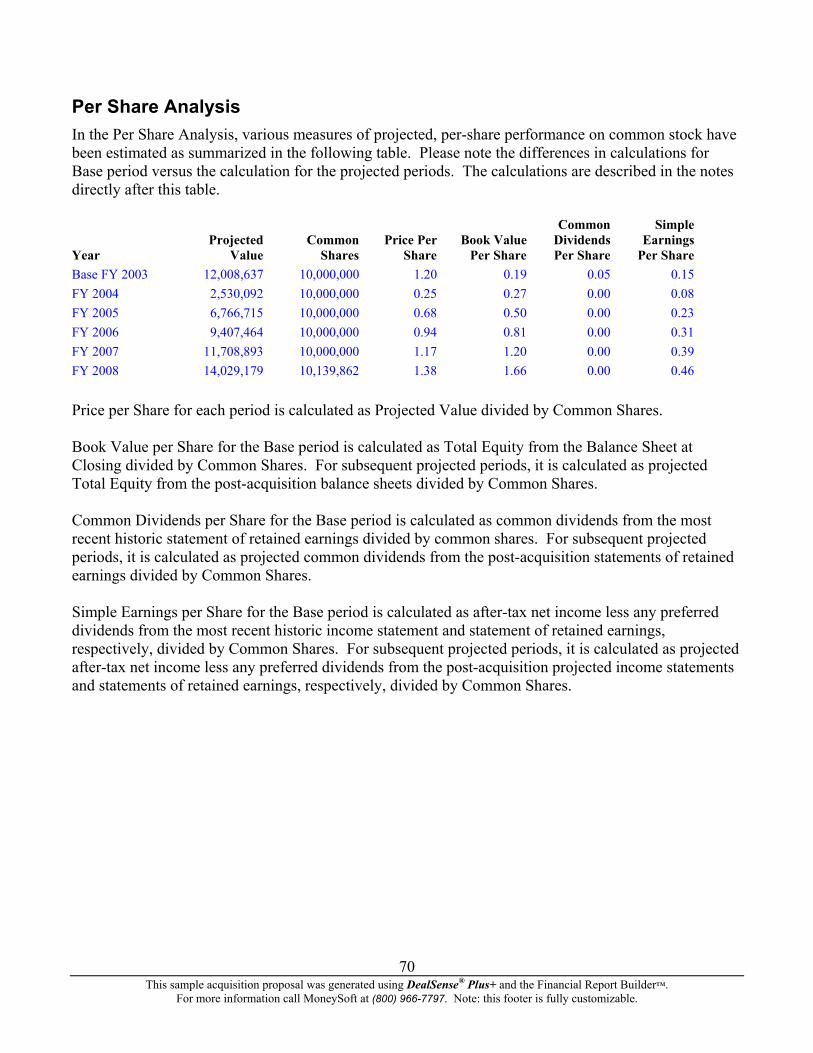
Per Share Analysis In the Per Share Analysis, various measures of projected, per-share performance on common stock have been estimated as summarized in the following table. Please note the differences in calculations for Base period versus the calculation for the projected periods. The calculations are described in the notes directly after this table. Common Simple Projected Common Price Per Book Value Dividends Earnings Year Value Shares Share Per Share Per Share Per Share Base FY 2003 12,008,637 10,000,000 1.20 0.19 0.05 0.15 FY 2004 2,530,092 10,000,000 0.25 0.27 0.00 0.08 FY 2005 6,766,715 10,000,000 0.68 0.50 0.00 0.23 FY 2006 9,407,464 10,000,000 0.94 0.81 0.00 0.31 FY 2007 11,708,893 10,000,000 1.17 1.20 0.00 0.39 FY 2008 14,029,179 10,139,862 1.38 1.66 0.00 0.46 Price per Share for each period is calculated as Projected Value divided by Common Shares. Book Value per Share for the Base period is calculated as Total Equity from the Balance Sheet at Closing divided by Common Shares. For subsequent projected periods, it is calculated as projected Total Equity from the post-acquisition balance sheets divided by Common Shares. Common Dividends per Share for the Base period is calculated as common dividends from the most recent historic statement of retained earnings divided by common shares. For subsequent projected periods, it is calculated as projected common dividends from the post-acquisition statements of retained earnings divided by Common Shares. Simple Earnings per Share for the Base period is calculated as after-tax net income less any preferred dividends from the most recent historic income statement and statement of retained earnings, respectively, divided by Common Shares. For subsequent projected periods, it is calculated as projected after-tax net income less any preferred dividends from the post-acquisition projected income statements and statements of retained earnings, respectively, divided by Common Shares.
This sample acquisition proposal was generated using DealSense® Plus+ and the Financial Report Builder™.
For more information call MoneySoft at (800) 966-7797. Note: this footer is fully customizable.
70
Confidential Information Memorandum
June 30, 2011
Sample Industries, Inc. (Not a real company.)
Prepared by:
John Smith, CPA Middle Market Business Advisors
500 North Michigan Ave. Chicago, IL. 60600
This Memorandum is confidential and private. Distribution is restricted. It may not be reproduced, copied or replicated in any form without the express and written authorization of Middle Market Business Advisors. Middle
Market Business Advisors has not made any independent investigation, verification or audit of any of the information contained in this Memorandum. Middle Market Business Advisors makes no representations or
warranties, expressed or implied, regarding the accuracy or completeness of the information contained herein.
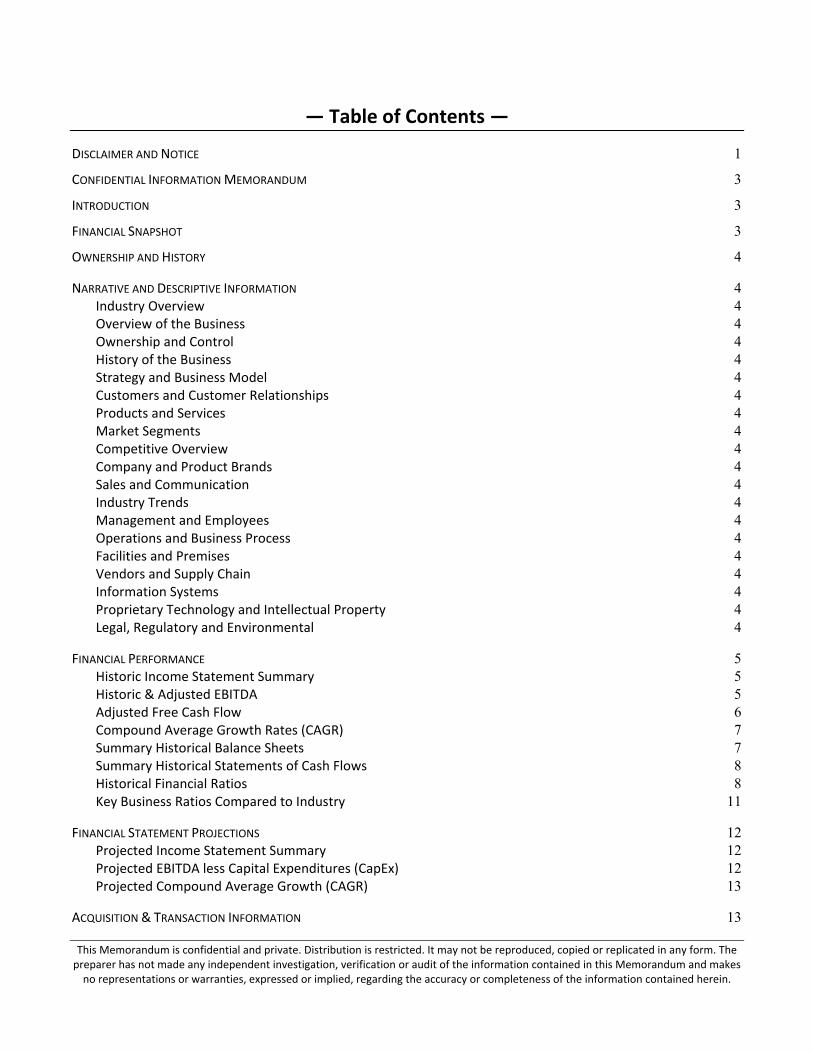
This Memorandum is confidential and private. Distribution is restricted. It may not be reproduced, copied or replicated in any form. The preparer has not made any independent investigation, verification or audit of the information contained in this Memorandum and makes no representations or warranties, expressed or implied, regarding the accuracy or completeness of the information contained herein.
— Table of Contents —
DISCLAIMER AND NOTICE 1
CONFIDENTIAL INFORMATION MEMORANDUM 3
INTRODUCTION 3
FINANCIAL SNAPSHOT 3
OWNERSHIP AND HISTORY 4
NARRATIVE AND DESCRIPTIVE INFORMATION 4 Industry Overview 4 Overview of the Business 4 Ownership and Control 4 History of the Business 4 Strategy and Business Model 4 Customers and Customer Relationships 4 Products and Services 4 Market Segments 4 Competitive Overview 4 Company and Product Brands 4 Sales and Communication 4 Industry Trends 4 Management and Employees 4 Operations and Business Process 4 Facilities and Premises 4 Vendors and Supply Chain 4 Information Systems 4 Proprietary Technology and Intellectual Property 4 Legal, Regulatory and Environmental 4
FINANCIAL PERFORMANCE 5 Historic Income Statement Summary 5 Historic & Adjusted EBITDA 5 Adjusted Free Cash Flow 6 Compound Average Growth Rates (CAGR) 7 Summary Historical Balance Sheets 7 Summary Historical Statements of Cash Flows 8 Historical Financial Ratios 8 Key Business Ratios Compared to Industry 11
FINANCIAL STATEMENT PROJECTIONS 12 Projected Income Statement Summary 12 Projected EBITDA less Capital Expenditures (CapEx) 12 Projected Compound Average Growth (CAGR) 13
ACQUISITION & TRANSACTION INFORMATION 13
1 This Memorandum is confidential and private. Distribution is restricted. It may not be reproduced, copied or replicated in any form. The preparer has not made any independent investigation, verification or audit of the information contained in this Memorandum and makes no representations or warranties, expressed or implied, regarding the accuracy or completeness of the information contained herein.
Disclaimer and Notice
Confidential and Private Information Legal Notice: Read this first before viewing this document.
The purpose of this Confidential Information Memorandum (the “Memorandum”) is to acquaint and familiarize prospective buyers with a Client of Middle Market Business Advisors (the “Business Intermediary”). The Client seeks to sell all or substantially all of its business and related assets. In order to properly obtain and read this Memorandum, you are required to sign a Confidentiality Agreement that was provided by the Business Intermediary. This Memorandum and any additional information provided by the Business Intermediary or contained in any online Data Room are provided subject to the Confidentiality Agreement. Do not read this Memorandum unless you have signed a Confidentiality Agreement furnished by the Business Intermediary. The Business Intermediary's contact information is provided at the bottom of this notice. Contact the Business Intermediary immediately in order to obtain and sign a Confidentiality Agreement or return this Memorandum to the Business Intermediary.
This Memorandum is confidential and private. Distribution is restricted. It may not be reproduced, copied or replicated in any form including print and digital media without the express and written authorization of the Business Intermediary. This Memorandum is and at all times shall remain the exclusive property of the Business Intermediary. You are responsible for protecting the confidentiality and propriety of the information contained in this Memorandum. Improper disclosure may harm our Client and you will be held responsible for any damages resulting from an improper disclosure on your part.
Should it become necessary to present this Memorandum to third parties as part of a due‐diligence investigation or to obtain financing, you should advise the third parties that this Memorandum is confidential and that you have signed a Confidentiality Agreement in order to obtain it. You are responsible for maintaining and protecting the confidentiality of this Memorandum and that obligation extends to your employees, advisors, representatives, agents and any other third parties who subsequently receive this Memorandum and the information contained herein. The Business Intermediary, employees, representatives and agents have not made any independent investigation, verification or audit of any of the information contained in this Memorandum and any representation to the contrary is not authorized. No representations or warranties, expressed or implied, are made regarding the accuracy or completeness of the information contained herein and such representations and warranties by Business Intermediary are not authorized. This Memorandum contains statements, estimates and projections provided by the Client concerning
2 This Memorandum is confidential and private. Distribution is restricted. It may not be reproduced, copied or replicated in any form. The preparer has not made any independent investigation, verification or audit of the information contained in this Memorandum and makes no representations or warranties, expressed or implied, regarding the accuracy or completeness of the information contained herein.
anticipated future performance. Such statements, estimates and projections reflect assumptions by our Client concerning anticipated results, which may or may not prove to be correct. No representations, expressed or implied are made as to the accuracy of such statements, estimates and projections. The Business Intermediary represents the Seller(s). It is expressly understood that the Business Intermediary is not an agent or representative of any prospective buyer or recipient of this Memorandum and that the Business Intermediary is not acting and shall not act as a fiduciary of the Buyer. The Business Intermediary does not and shall not provide legal, tax, accounting and risk management advice. Prospective buyers are advised to seek and obtain the counsel of competent professionals. Additional Information: All communication regarding this Memorandum and requests for additional information should be directed to the Business Intermediary: John Smith, CPA Middle Market Business Advisors 500 North Michigan Ave. Chicago, IL. 60600
3 This Memorandum is confidential and private. Distribution is restricted. It may not be reproduced, copied or replicated in any form. The preparer has not made any independent investigation, verification or audit of the information contained in this Memorandum and makes no representations or warranties, expressed or implied, regarding the accuracy or completeness of the information contained herein.
Confidential Information Memorandum
Introduction This Confidential Information Memorandum has been prepared by John Smith, CPA, Business Intermediary, in order to acquaint and familiarize prospective buyers with the business and operations of Sample Industries, Inc. (the “Company”). The information contained herein is confidential and provided subject to the Disclaimer and Notice on the previous page. The Company is primarily engaged in the business of Sporting goods manufacturing and its secondary business activity is Athletic goods distribution. The applicable SIC / NAICS codes for the Company's business activity are 3949 / 12345. The Company does business under the trade name of Sample Sporting Equipment.
Financial Snapshot The following tables provide a summary of key income statement accounts for fiscal year 2010 and the trailing twelve months ending Jun 2011. Latest Reported Trailing Income Data: Full Year Twelve Months
Net Sales Revenue $31,541,420 $33,034,700 Net Income $1,060,590 $1,582,448 Adjusted EBITDA $3,613,460 $4,219,339 Most Recent Percent of Balance Sheet Data: Reported Total Assets
Current Assets $7,509,604 48.38% Fixed Assets (Net of Accumulated) $5,363,423 34.55% Other Assets $2,649,560 17.07% Total Assets $15,522,587 100.00% A more detailed summary of financial statement data and ratio analysis are included later on along with financial statements for the above periods (as an addendum).
4 This Memorandum is confidential and private. Distribution is restricted. It may not be reproduced, copied or replicated in any form. The preparer has not made any independent investigation, verification or audit of the information contained in this Memorandum and makes no representations or warranties, expressed or implied, regarding the accuracy or completeness of the information contained herein.
Ownership and History The Company was established in 1989 and is organized under the laws of California. The Company is structured as a C‐Corporation. The Company has engaged Middle Market Business Advisors and a majority block of the controlling interest has authorized Middle Market Business Advisors to find a buyer for all or substantially all of the Company's business and related assets.
Narrative and Descriptive Information When presenting an actual company for sale, you would include descriptive information about the business. The report generated by DealSense Plus includes section headings for the topics that are typically required by prospective buyers. These section headings (topics) are listed below:
Industry Overview
Overview of the Business
Ownership and Control
History of the Business
Strategy and Business Model
Customers and Customer Relationships
Products and Services
Market Segments
Competitive Overview
Company and Product Brands
Sales and Communication
Industry Trends
Management and Employees
Operations and Business Process
Facilities and Premises
Vendors and Supply Chain
Information Systems
Proprietary Technology and Intellectual Property
Legal, Regulatory and Environmental
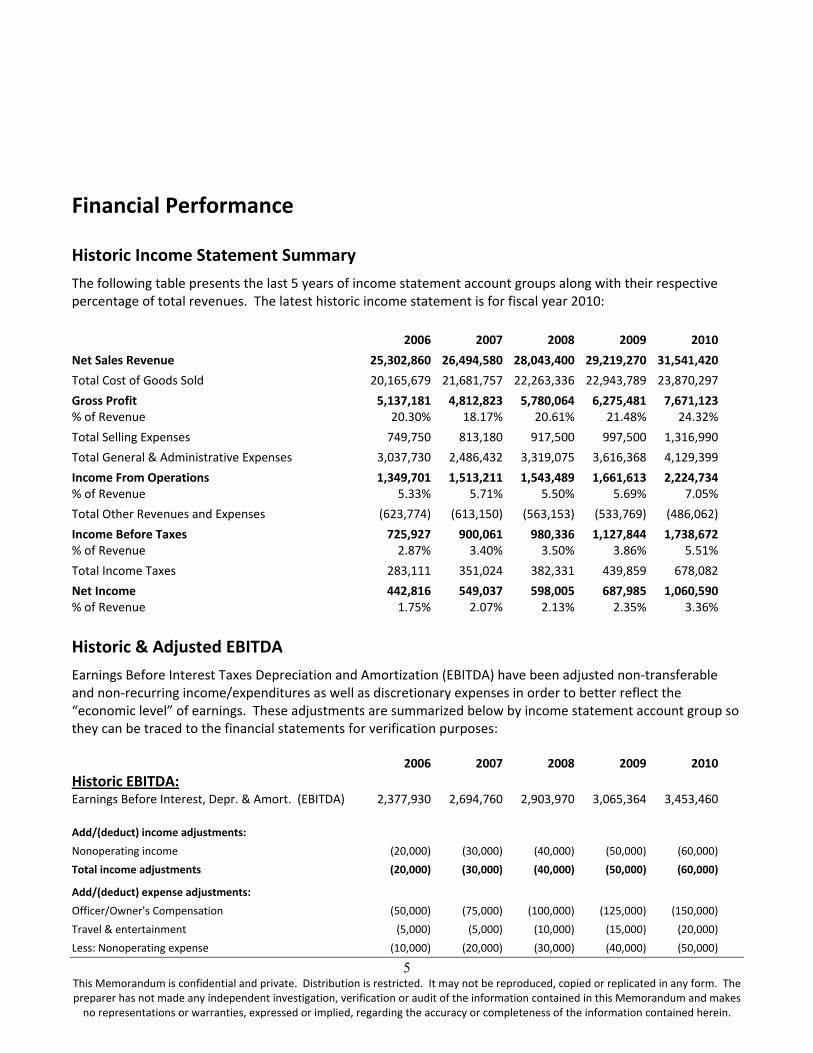
5 This Memorandum is confidential and private. Distribution is restricted. It may not be reproduced, copied or replicated in any form. The preparer has not made any independent investigation, verification or audit of the information contained in this Memorandum and makes no representations or warranties, expressed or implied, regarding the accuracy or completeness of the information contained herein.
Financial Performance
Historic Income Statement Summary The following table presents the last 5 years of income statement account groups along with their respective percentage of total revenues. The latest historic income statement is for fiscal year 2010: 2006 2007 2008 2009 2010 Net Sales Revenue 25,302,860 26,494,580 28,043,400 29,219,270 31,541,420 Total Cost of Goods Sold 20,165,679 21,681,757 22,263,336 22,943,789 23,870,297 Gross Profit 5,137,181 4,812,823 5,780,064 6,275,481 7,671,123 % of Revenue 20.30% 18.17% 20.61% 21.48% 24.32% Total Selling Expenses 749,750 813,180 917,500 997,500 1,316,990 Total General & Administrative Expenses 3,037,730 2,486,432 3,319,075 3,616,368 4,129,399 Income From Operations 1,349,701 1,513,211 1,543,489 1,661,613 2,224,734 % of Revenue 5.33% 5.71% 5.50% 5.69% 7.05% Total Other Revenues and Expenses (623,774) (613,150) (563,153) (533,769) (486,062) Income Before Taxes 725,927 900,061 980,336 1,127,844 1,738,672 % of Revenue 2.87% 3.40% 3.50% 3.86% 5.51% Total Income Taxes 283,111 351,024 382,331 439,859 678,082 Net Income 442,816 549,037 598,005 687,985 1,060,590 % of Revenue 1.75% 2.07% 2.13% 2.35% 3.36%
Historic & Adjusted EBITDA Earnings Before Interest Taxes Depreciation and Amortization (EBITDA) have been adjusted non‐transferable and non‐recurring income/expenditures as well as discretionary expenses in order to better reflect the “economic level” of earnings. These adjustments are summarized below by income statement account group so they can be traced to the financial statements for verification purposes: 2006 2007 2008 2009 2010 Historic EBITDA: Earnings Before Interest, Depr. & Amort. (EBITDA) 2,377,930 2,694,760 2,903,970 3,065,364 3,453,460 Add/(deduct) income adjustments: Nonoperating income (20,000) (30,000) (40,000) (50,000) (60,000) Total income adjustments (20,000) (30,000) (40,000) (50,000) (60,000)
Add/(deduct) expense adjustments: Officer/Owner's Compensation (50,000) (75,000) (100,000) (125,000) (150,000) Travel & entertainment (5,000) (5,000) (10,000) (15,000) (20,000) Less: Nonoperating expense (10,000) (20,000) (30,000) (40,000) (50,000)
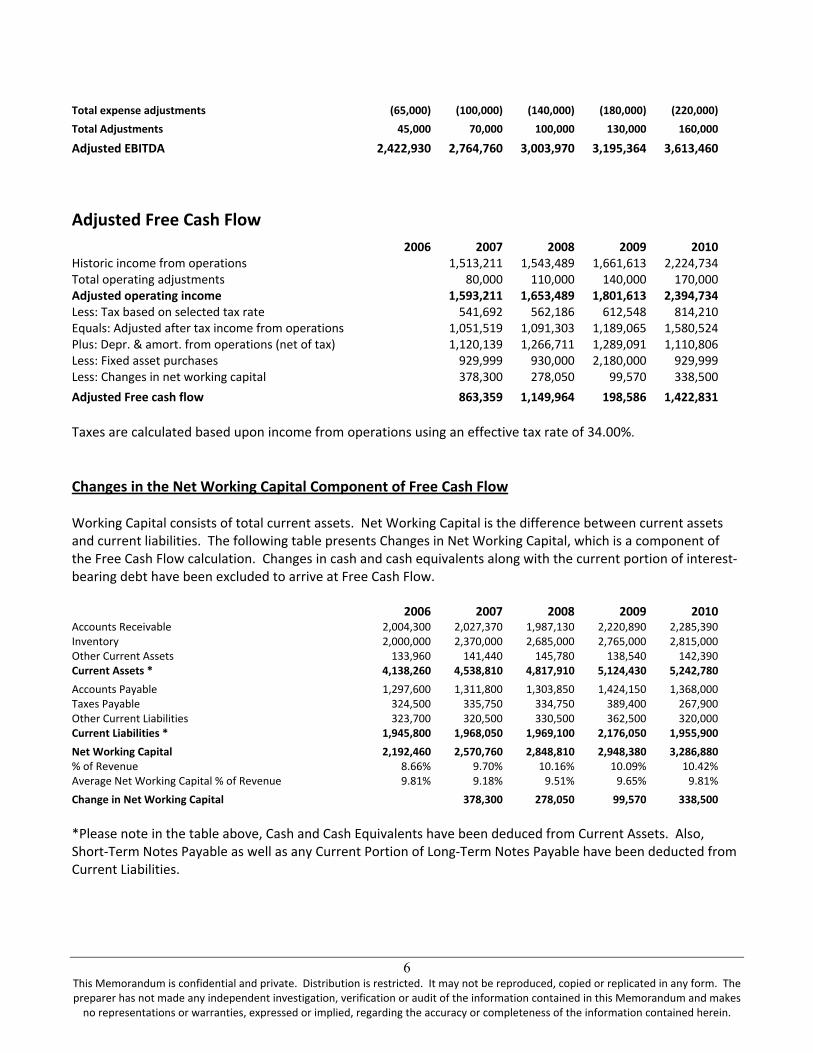
6 This Memorandum is confidential and private. Distribution is restricted. It may not be reproduced, copied or replicated in any form. The preparer has not made any independent investigation, verification or audit of the information contained in this Memorandum and makes no representations or warranties, expressed or implied, regarding the accuracy or completeness of the information contained herein.
Total expense adjustments (65,000) (100,000) (140,000) (180,000) (220,000) Total Adjustments 45,000 70,000 100,000 130,000 160,000
Adjusted EBITDA 2,422,930 2,764,760 3,003,970 3,195,364 3,613,460
Adjusted Free Cash Flow 2006 2007 2008 2009 2010 Historic income from operations 1,513,211 1,543,489 1,661,613 2,224,734 Total operating adjustments 80,000 110,000 140,000 170,000 Adjusted operating income 1,593,211 1,653,489 1,801,613 2,394,734 Less: Tax based on selected tax rate 541,692 562,186 612,548 814,210 Equals: Adjusted after tax income from operations 1,051,519 1,091,303 1,189,065 1,580,524 Plus: Depr. & amort. from operations (net of tax) 1,120,139 1,266,711 1,289,091 1,110,806 Less: Fixed asset purchases 929,999 930,000 2,180,000 929,999 Less: Changes in net working capital 378,300 278,050 99,570 338,500 Adjusted Free cash flow 863,359 1,149,964 198,586 1,422,831 Taxes are calculated based upon income from operations using an effective tax rate of 34.00%. Changes in the Net Working Capital Component of Free Cash Flow Working Capital consists of total current assets. Net Working Capital is the difference between current assets and current liabilities. The following table presents Changes in Net Working Capital, which is a component of the Free Cash Flow calculation. Changes in cash and cash equivalents along with the current portion of interest‐bearing debt have been excluded to arrive at Free Cash Flow. 2006 2007 2008 2009 2010 Accounts Receivable 2,004,300 2,027,370 1,987,130 2,220,890 2,285,390 Inventory 2,000,000 2,370,000 2,685,000 2,765,000 2,815,000 Other Current Assets 133,960 141,440 145,780 138,540 142,390 Current Assets * 4,138,260 4,538,810 4,817,910 5,124,430 5,242,780 Accounts Payable 1,297,600 1,311,800 1,303,850 1,424,150 1,368,000 Taxes Payable 324,500 335,750 334,750 389,400 267,900 Other Current Liabilities 323,700 320,500 330,500 362,500 320,000 Current Liabilities * 1,945,800 1,968,050 1,969,100 2,176,050 1,955,900 Net Working Capital 2,192,460 2,570,760 2,848,810 2,948,380 3,286,880 % of Revenue 8.66% 9.70% 10.16% 10.09% 10.42% Average Net Working Capital % of Revenue 9.81% 9.18% 9.51% 9.65% 9.81% Change in Net Working Capital 378,300 278,050 99,570 338,500 *Please note in the table above, Cash and Cash Equivalents have been deduced from Current Assets. Also, Short‐Term Notes Payable as well as any Current Portion of Long‐Term Notes Payable have been deducted from Current Liabilities.
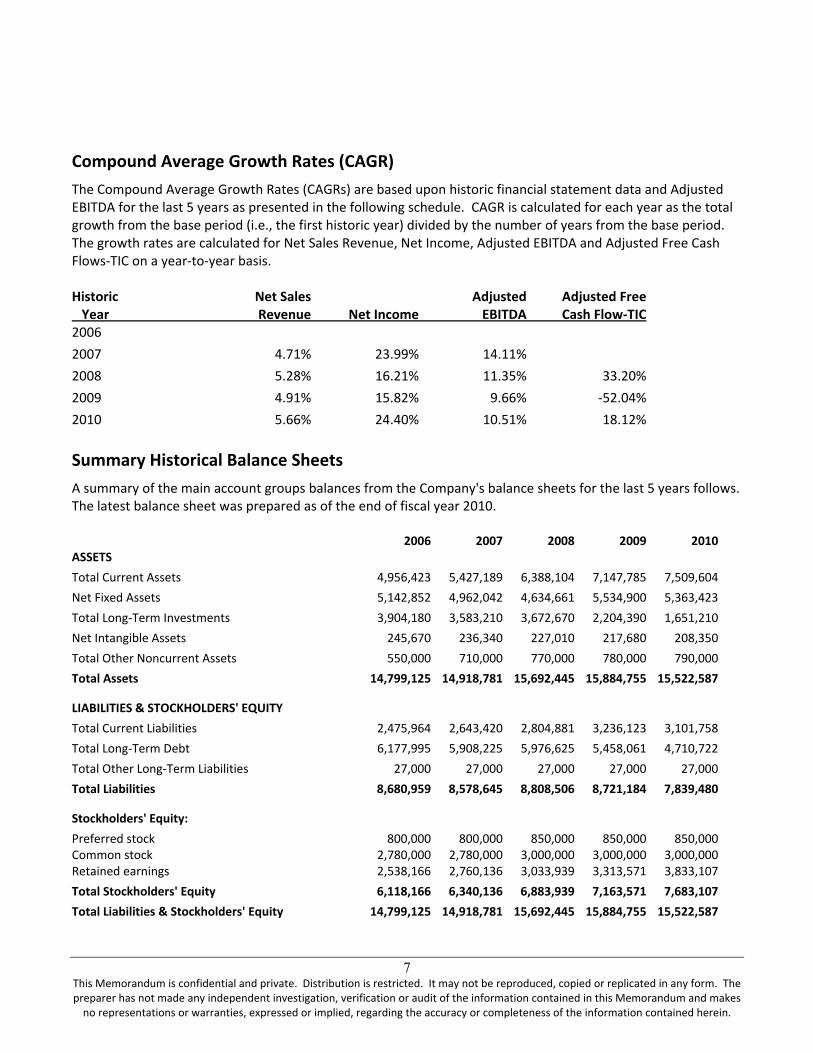
7 This Memorandum is confidential and private. Distribution is restricted. It may not be reproduced, copied or replicated in any form. The preparer has not made any independent investigation, verification or audit of the information contained in this Memorandum and makes no representations or warranties, expressed or implied, regarding the accuracy or completeness of the information contained herein.
Compound Average Growth Rates (CAGR) The Compound Average Growth Rates (CAGRs) are based upon historic financial statement data and Adjusted EBITDA for the last 5 years as presented in the following schedule. CAGR is calculated for each year as the total growth from the base period (i.e., the first historic year) divided by the number of years from the base period. The growth rates are calculated for Net Sales Revenue, Net Income, Adjusted EBITDA and Adjusted Free Cash Flows‐TIC on a year‐to‐year basis. Historic Net Sales Adjusted Adjusted Free Year Revenue Net Income EBITDA Cash Flow‐TIC 2006 2007 4.71% 23.99% 14.11% 2008 5.28% 16.21% 11.35% 33.20% 2009 4.91% 15.82% 9.66% ‐52.04% 2010 5.66% 24.40% 10.51% 18.12%
Summary Historical Balance Sheets A summary of the main account groups balances from the Company's balance sheets for the last 5 years follows. The latest balance sheet was prepared as of the end of fiscal year 2010. 2006 2007 2008 2009 2010 ASSETS Total Current Assets 4,956,423 5,427,189 6,388,104 7,147,785 7,509,604 Net Fixed Assets 5,142,852 4,962,042 4,634,661 5,534,900 5,363,423 Total Long‐Term Investments 3,904,180 3,583,210 3,672,670 2,204,390 1,651,210 Net Intangible Assets 245,670 236,340 227,010 217,680 208,350 Total Other Noncurrent Assets 550,000 710,000 770,000 780,000 790,000 Total Assets 14,799,125 14,918,781 15,692,445 15,884,755 15,522,587
LIABILITIES & STOCKHOLDERS' EQUITY Total Current Liabilities 2,475,964 2,643,420 2,804,881 3,236,123 3,101,758 Total Long‐Term Debt 6,177,995 5,908,225 5,976,625 5,458,061 4,710,722 Total Other Long‐Term Liabilities 27,000 27,000 27,000 27,000 27,000 Total Liabilities 8,680,959 8,578,645 8,808,506 8,721,184 7,839,480
Stockholders' Equity: Preferred stock 800,000 800,000 850,000 850,000 850,000 Common stock 2,780,000 2,780,000 3,000,000 3,000,000 3,000,000 Retained earnings 2,538,166 2,760,136 3,033,939 3,313,571 3,833,107 Total Stockholders' Equity 6,118,166 6,340,136 6,883,939 7,163,571 7,683,107 Total Liabilities & Stockholders' Equity 14,799,125 14,918,781 15,692,445 15,884,755 15,522,587
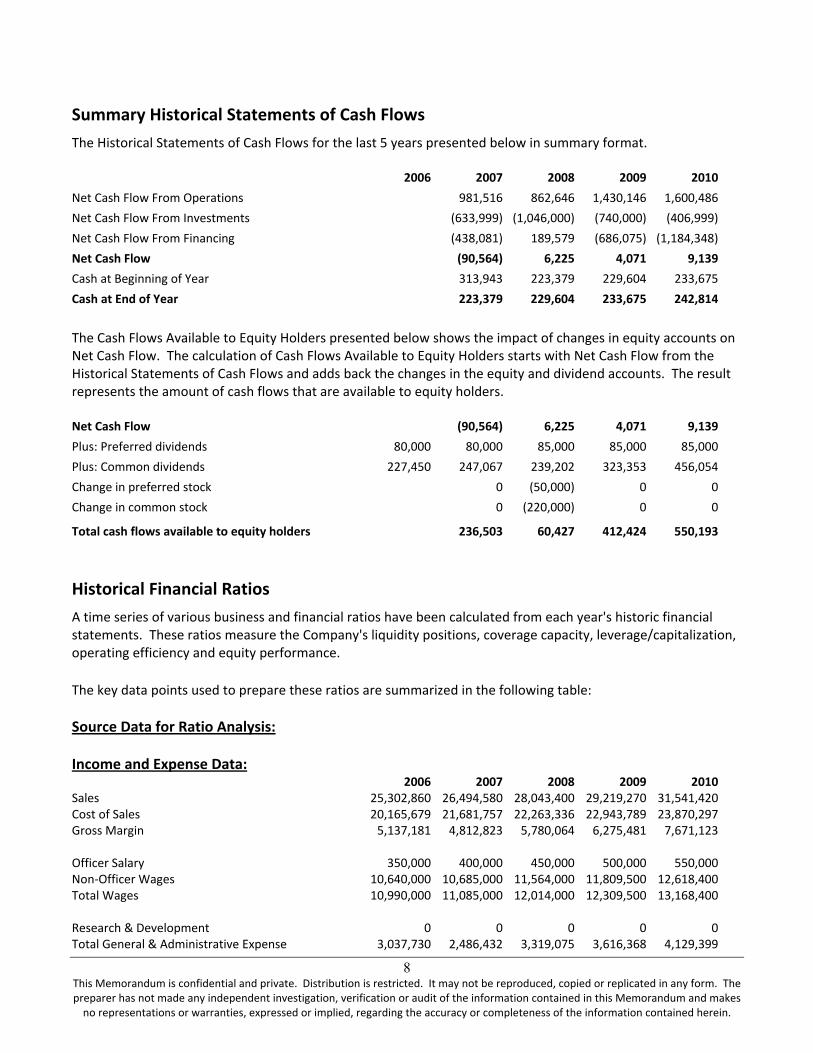
8 This Memorandum is confidential and private. Distribution is restricted. It may not be reproduced, copied or replicated in any form. The preparer has not made any independent investigation, verification or audit of the information contained in this Memorandum and makes no representations or warranties, expressed or implied, regarding the accuracy or completeness of the information contained herein.
Summary Historical Statements of Cash Flows The Historical Statements of Cash Flows for the last 5 years presented below in summary format. 2006 2007 2008 2009 2010 Net Cash Flow From Operations 981,516 862,646 1,430,146 1,600,486 Net Cash Flow From Investments (633,999) (1,046,000) (740,000) (406,999) Net Cash Flow From Financing (438,081) 189,579 (686,075) (1,184,348) Net Cash Flow (90,564) 6,225 4,071 9,139 Cash at Beginning of Year 313,943 223,379 229,604 233,675 Cash at End of Year 223,379 229,604 233,675 242,814
The Cash Flows Available to Equity Holders presented below shows the impact of changes in equity accounts on Net Cash Flow. The calculation of Cash Flows Available to Equity Holders starts with Net Cash Flow from the Historical Statements of Cash Flows and adds back the changes in the equity and dividend accounts. The result represents the amount of cash flows that are available to equity holders. Net Cash Flow (90,564) 6,225 4,071 9,139 Plus: Preferred dividends 80,000 80,000 85,000 85,000 85,000 Plus: Common dividends 227,450 247,067 239,202 323,353 456,054 Change in preferred stock 0 (50,000) 0 0 Change in common stock 0 (220,000) 0 0
Total cash flows available to equity holders 236,503 60,427 412,424 550,193
Historical Financial Ratios A time series of various business and financial ratios have been calculated from each year's historic financial statements. These ratios measure the Company's liquidity positions, coverage capacity, leverage/capitalization, operating efficiency and equity performance. The key data points used to prepare these ratios are summarized in the following table: Source Data for Ratio Analysis: Income and Expense Data: 2006 2007 2008 2009 2010 Sales 25,302,860 26,494,580 28,043,400 29,219,270 31,541,420 Cost of Sales 20,165,679 21,681,757 22,263,336 22,943,789 23,870,297 Gross Margin 5,137,181 4,812,823 5,780,064 6,275,481 7,671,123 Officer Salary 350,000 400,000 450,000 500,000 550,000 Non‐Officer Wages 10,640,000 10,685,000 11,564,000 11,809,500 12,618,400 Total Wages 10,990,000 11,085,000 12,014,000 12,309,500 13,168,400 Research & Development 0 0 0 0 0 Total General & Administrative Expense 3,037,730 2,486,432 3,319,075 3,616,368 4,129,399
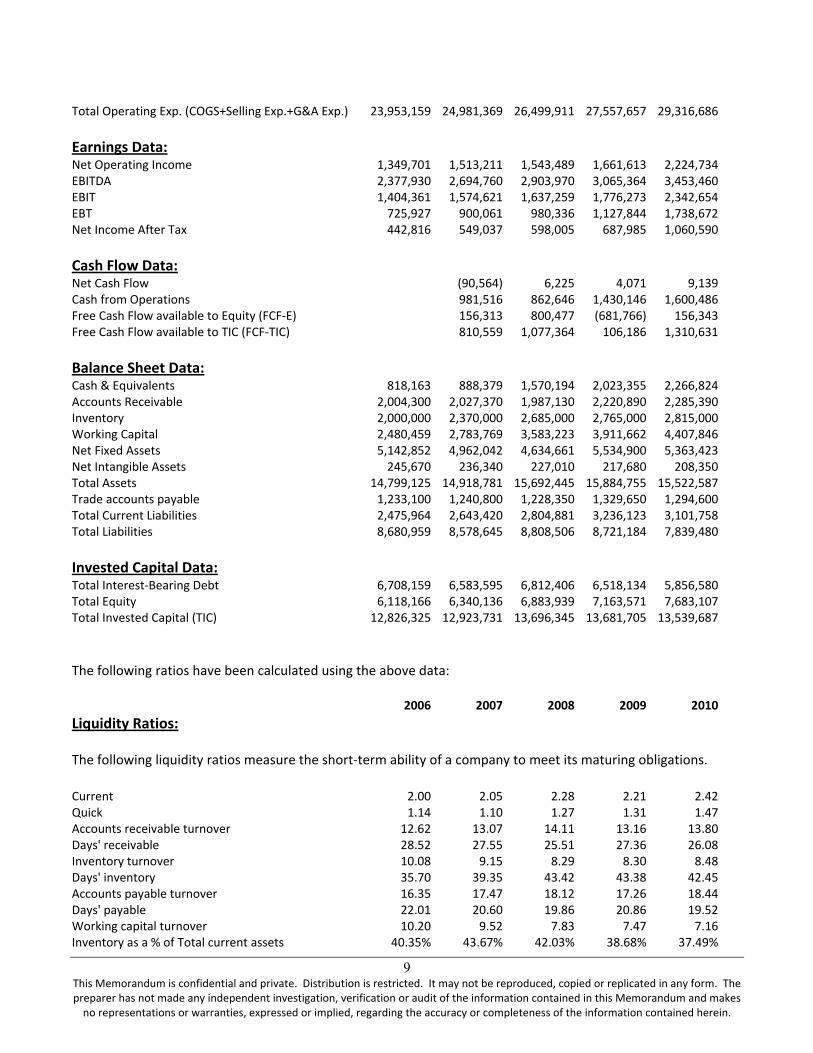
9 This Memorandum is confidential and private. Distribution is restricted. It may not be reproduced, copied or replicated in any form. The preparer has not made any independent investigation, verification or audit of the information contained in this Memorandum and makes no representations or warranties, expressed or implied, regarding the accuracy or completeness of the information contained herein.
Total Operating Exp. (COGS+Selling Exp.+G&A Exp.) 23,953,159 24,981,369 26,499,911 27,557,657 29,316,686 Earnings Data: Net Operating Income 1,349,701 1,513,211 1,543,489 1,661,613 2,224,734 EBITDA 2,377,930 2,694,760 2,903,970 3,065,364 3,453,460 EBIT 1,404,361 1,574,621 1,637,259 1,776,273 2,342,654 EBT 725,927 900,061 980,336 1,127,844 1,738,672 Net Income After Tax 442,816 549,037 598,005 687,985 1,060,590 Cash Flow Data: Net Cash Flow (90,564) 6,225 4,071 9,139 Cash from Operations 981,516 862,646 1,430,146 1,600,486 Free Cash Flow available to Equity (FCF‐E) 156,313 800,477 (681,766) 156,343 Free Cash Flow available to TIC (FCF‐TIC) 810,559 1,077,364 106,186 1,310,631 Balance Sheet Data: Cash & Equivalents 818,163 888,379 1,570,194 2,023,355 2,266,824 Accounts Receivable 2,004,300 2,027,370 1,987,130 2,220,890 2,285,390 Inventory 2,000,000 2,370,000 2,685,000 2,765,000 2,815,000 Working Capital 2,480,459 2,783,769 3,583,223 3,911,662 4,407,846 Net Fixed Assets 5,142,852 4,962,042 4,634,661 5,534,900 5,363,423 Net Intangible Assets 245,670 236,340 227,010 217,680 208,350 Total Assets 14,799,125 14,918,781 15,692,445 15,884,755 15,522,587 Trade accounts payable 1,233,100 1,240,800 1,228,350 1,329,650 1,294,600 Total Current Liabilities 2,475,964 2,643,420 2,804,881 3,236,123 3,101,758 Total Liabilities 8,680,959 8,578,645 8,808,506 8,721,184 7,839,480 Invested Capital Data: Total Interest‐Bearing Debt 6,708,159 6,583,595 6,812,406 6,518,134 5,856,580 Total Equity 6,118,166 6,340,136 6,883,939 7,163,571 7,683,107 Total Invested Capital (TIC) 12,826,325 12,923,731 13,696,345 13,681,705 13,539,687 The following ratios have been calculated using the above data: 2006 2007 2008 2009 2010 Liquidity Ratios: The following liquidity ratios measure the short‐term ability of a company to meet its maturing obligations. Current 2.00 2.05 2.28 2.21 2.42 Quick 1.14 1.10 1.27 1.31 1.47 Accounts receivable turnover 12.62 13.07 14.11 13.16 13.80 Days' receivable 28.52 27.55 25.51 27.36 26.08 Inventory turnover 10.08 9.15 8.29 8.30 8.48 Days' inventory 35.70 39.35 43.42 43.38 42.45 Accounts payable turnover 16.35 17.47 18.12 17.26 18.44 Days' payable 22.01 20.60 19.86 20.86 19.52 Working capital turnover 10.20 9.52 7.83 7.47 7.16 Inventory as a % of Total current assets 40.35% 43.67% 42.03% 38.68% 37.49%
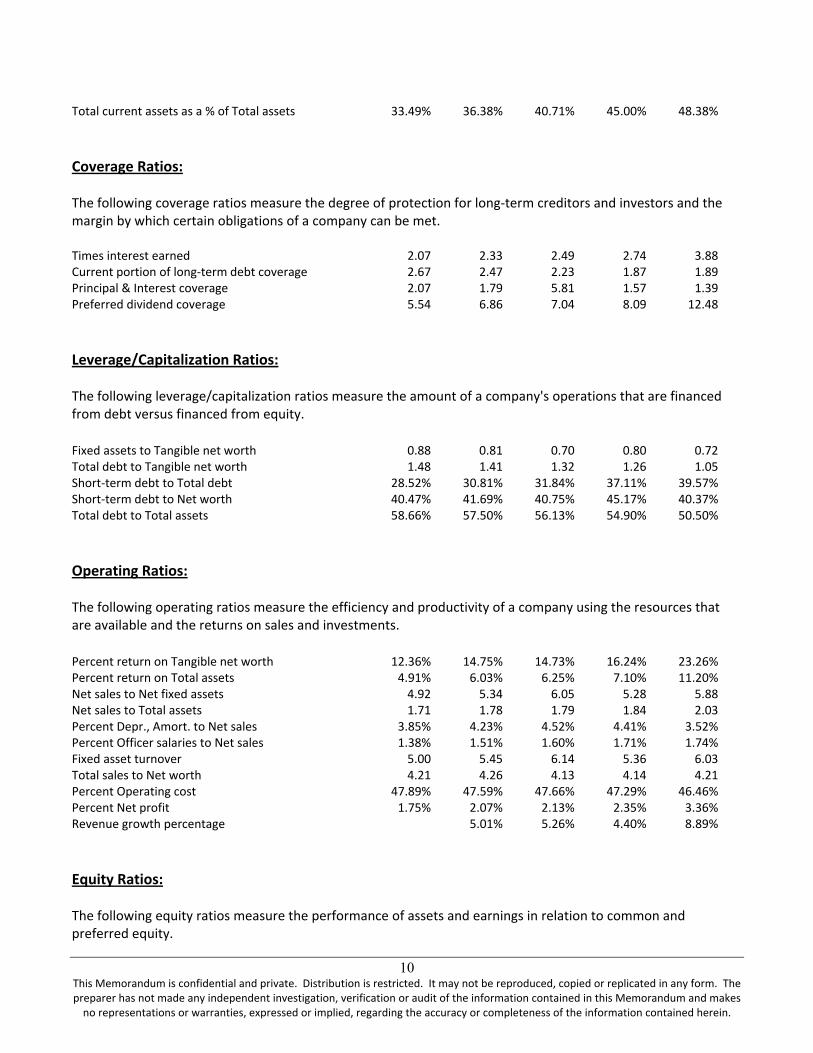
10 This Memorandum is confidential and private. Distribution is restricted. It may not be reproduced, copied or replicated in any form. The preparer has not made any independent investigation, verification or audit of the information contained in this Memorandum and makes no representations or warranties, expressed or implied, regarding the accuracy or completeness of the information contained herein.
Total current assets as a % of Total assets 33.49% 36.38% 40.71% 45.00% 48.38%
Coverage Ratios: The following coverage ratios measure the degree of protection for long‐term creditors and investors and the margin by which certain obligations of a company can be met. Times interest earned 2.07 2.33 2.49 2.74 3.88 Current portion of long‐term debt coverage 2.67 2.47 2.23 1.87 1.89 Principal & Interest coverage 2.07 1.79 5.81 1.57 1.39 Preferred dividend coverage 5.54 6.86 7.04 8.09 12.48
Leverage/Capitalization Ratios: The following leverage/capitalization ratios measure the amount of a company's operations that are financed from debt versus financed from equity. Fixed assets to Tangible net worth 0.88 0.81 0.70 0.80 0.72 Total debt to Tangible net worth 1.48 1.41 1.32 1.26 1.05 Short‐term debt to Total debt 28.52% 30.81% 31.84% 37.11% 39.57% Short‐term debt to Net worth 40.47% 41.69% 40.75% 45.17% 40.37% Total debt to Total assets 58.66% 57.50% 56.13% 54.90% 50.50%
Operating Ratios: The following operating ratios measure the efficiency and productivity of a company using the resources that are available and the returns on sales and investments. Percent return on Tangible net worth 12.36% 14.75% 14.73% 16.24% 23.26% Percent return on Total assets 4.91% 6.03% 6.25% 7.10% 11.20% Net sales to Net fixed assets 4.92 5.34 6.05 5.28 5.88 Net sales to Total assets 1.71 1.78 1.79 1.84 2.03 Percent Depr., Amort. to Net sales 3.85% 4.23% 4.52% 4.41% 3.52% Percent Officer salaries to Net sales 1.38% 1.51% 1.60% 1.71% 1.74% Fixed asset turnover 5.00 5.45 6.14 5.36 6.03 Total sales to Net worth 4.21 4.26 4.13 4.14 4.21 Percent Operating cost 47.89% 47.59% 47.66% 47.29% 46.46% Percent Net profit 1.75% 2.07% 2.13% 2.35% 3.36% Revenue growth percentage 5.01% 5.26% 4.40% 8.89%
Equity Ratios: The following equity ratios measure the performance of assets and earnings in relation to common and preferred equity.
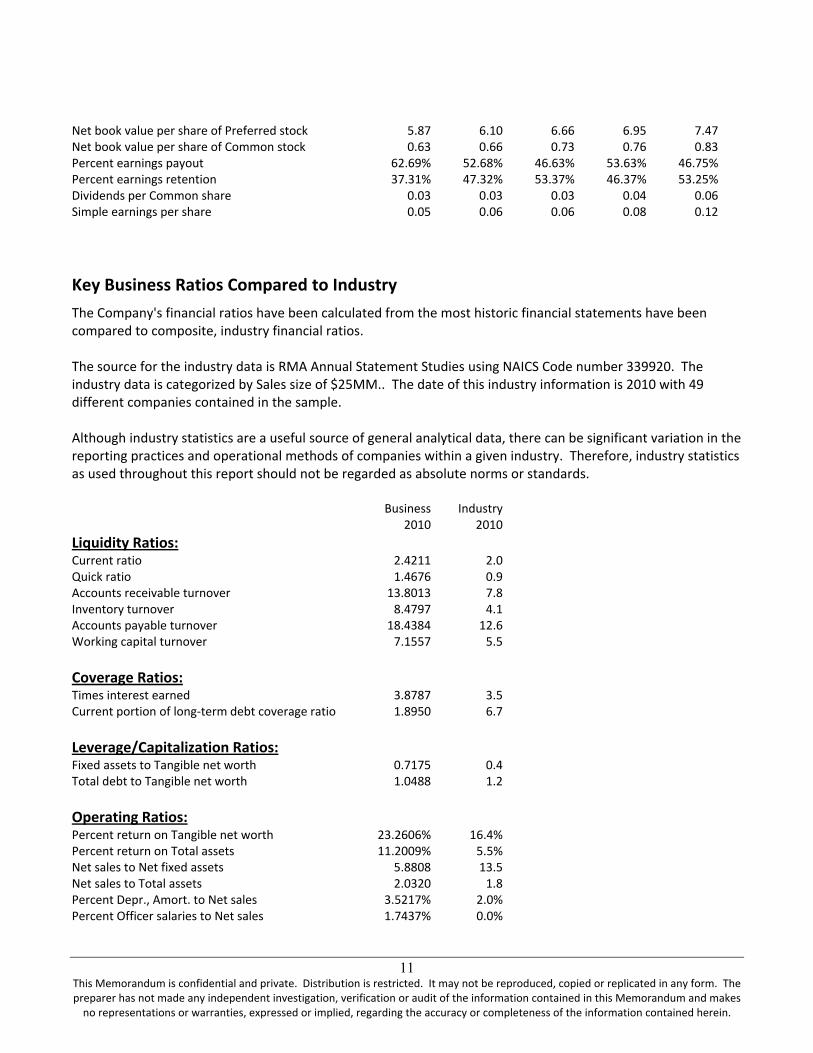
11 This Memorandum is confidential and private. Distribution is restricted. It may not be reproduced, copied or replicated in any form. The preparer has not made any independent investigation, verification or audit of the information contained in this Memorandum and makes no representations or warranties, expressed or implied, regarding the accuracy or completeness of the information contained herein.
Net book value per share of Preferred stock 5.87 6.10 6.66 6.95 7.47 Net book value per share of Common stock 0.63 0.66 0.73 0.76 0.83 Percent earnings payout 62.69% 52.68% 46.63% 53.63% 46.75% Percent earnings retention 37.31% 47.32% 53.37% 46.37% 53.25% Dividends per Common share 0.03 0.03 0.03 0.04 0.06 Simple earnings per share 0.05 0.06 0.06 0.08 0.12
Key Business Ratios Compared to Industry The Company's financial ratios have been calculated from the most historic financial statements have been compared to composite, industry financial ratios. The source for the industry data is RMA Annual Statement Studies using NAICS Code number 339920. The industry data is categorized by Sales size of $25MM.. The date of this industry information is 2010 with 49 different companies contained in the sample. Although industry statistics are a useful source of general analytical data, there can be significant variation in the reporting practices and operational methods of companies within a given industry. Therefore, industry statistics as used throughout this report should not be regarded as absolute norms or standards. Business Industry 2010 2010 Liquidity Ratios: Current ratio 2.4211 2.0 Quick ratio 1.4676 0.9 Accounts receivable turnover 13.8013 7.8 Inventory turnover 8.4797 4.1 Accounts payable turnover 18.4384 12.6 Working capital turnover 7.1557 5.5 Coverage Ratios: Times interest earned 3.8787 3.5 Current portion of long‐term debt coverage ratio 1.8950 6.7 Leverage/Capitalization Ratios: Fixed assets to Tangible net worth 0.7175 0.4 Total debt to Tangible net worth 1.0488 1.2 Operating Ratios: Percent return on Tangible net worth 23.2606% 16.4% Percent return on Total assets 11.2009% 5.5% Net sales to Net fixed assets 5.8808 13.5 Net sales to Total assets 2.0320 1.8 Percent Depr., Amort. to Net sales 3.5217% 2.0% Percent Officer salaries to Net sales 1.7437% 0.0%
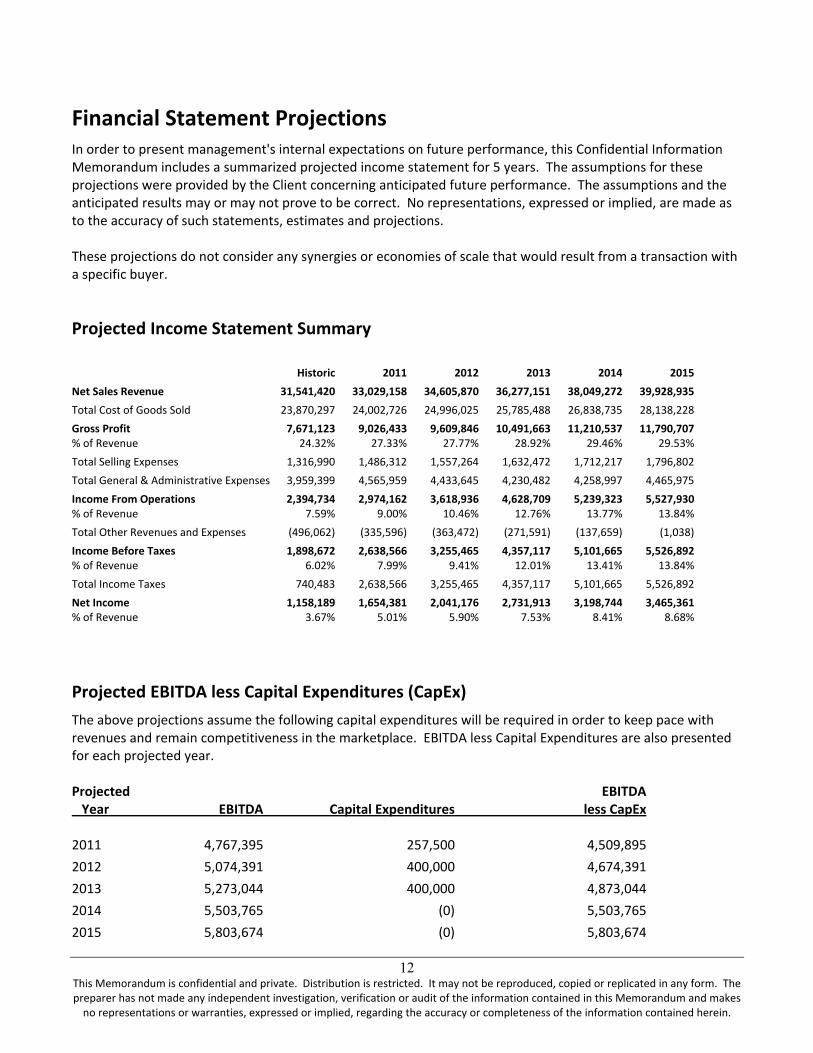
12 This Memorandum is confidential and private. Distribution is restricted. It may not be reproduced, copied or replicated in any form. The preparer has not made any independent investigation, verification or audit of the information contained in this Memorandum and makes no representations or warranties, expressed or implied, regarding the accuracy or completeness of the information contained herein.
Financial Statement Projections In order to present management's internal expectations on future performance, this Confidential Information Memorandum includes a summarized projected income statement for 5 years. The assumptions for these projections were provided by the Client concerning anticipated future performance. The assumptions and the anticipated results may or may not prove to be correct. No representations, expressed or implied, are made as to the accuracy of such statements, estimates and projections. These projections do not consider any synergies or economies of scale that would result from a transaction with a specific buyer.
Projected Income Statement Summary Historic 2011 2012 2013 2014 2015 Net Sales Revenue 31,541,420 33,029,158 34,605,870 36,277,151 38,049,272 39,928,935 Total Cost of Goods Sold 23,870,297 24,002,726 24,996,025 25,785,488 26,838,735 28,138,228 Gross Profit 7,671,123 9,026,433 9,609,846 10,491,663 11,210,537 11,790,707 % of Revenue 24.32% 27.33% 27.77% 28.92% 29.46% 29.53% Total Selling Expenses 1,316,990 1,486,312 1,557,264 1,632,472 1,712,217 1,796,802 Total General & Administrative Expenses 3,959,399 4,565,959 4,433,645 4,230,482 4,258,997 4,465,975 Income From Operations 2,394,734 2,974,162 3,618,936 4,628,709 5,239,323 5,527,930 % of Revenue 7.59% 9.00% 10.46% 12.76% 13.77% 13.84% Total Other Revenues and Expenses (496,062) (335,596) (363,472) (271,591) (137,659) (1,038) Income Before Taxes 1,898,672 2,638,566 3,255,465 4,357,117 5,101,665 5,526,892 % of Revenue 6.02% 7.99% 9.41% 12.01% 13.41% 13.84% Total Income Taxes 740,483 2,638,566 3,255,465 4,357,117 5,101,665 5,526,892 Net Income 1,158,189 1,654,381 2,041,176 2,731,913 3,198,744 3,465,361 % of Revenue 3.67% 5.01% 5.90% 7.53% 8.41% 8.68%
Projected EBITDA less Capital Expenditures (CapEx) The above projections assume the following capital expenditures will be required in order to keep pace with revenues and remain competitiveness in the marketplace. EBITDA less Capital Expenditures are also presented for each projected year. Projected EBITDA Year EBITDA Capital Expenditures less CapEx 2011 4,767,395 257,500 4,509,895 2012 5,074,391 400,000 4,674,391 2013 5,273,044 400,000 4,873,044 2014 5,503,765 (0) 5,503,765 2015 5,803,674 (0) 5,803,674
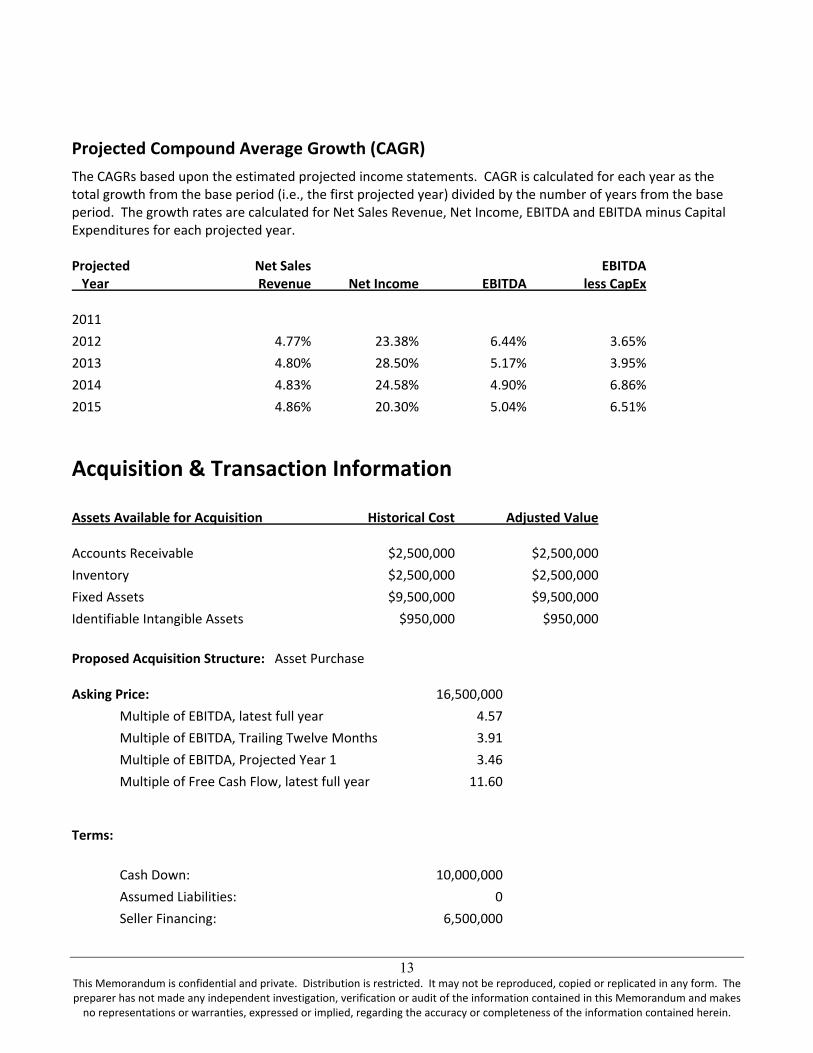
13 This Memorandum is confidential and private. Distribution is restricted. It may not be reproduced, copied or replicated in any form. The preparer has not made any independent investigation, verification or audit of the information contained in this Memorandum and makes no representations or warranties, expressed or implied, regarding the accuracy or completeness of the information contained herein.
Projected Compound Average Growth (CAGR) The CAGRs based upon the estimated projected income statements. CAGR is calculated for each year as the total growth from the base period (i.e., the first projected year) divided by the number of years from the base period. The growth rates are calculated for Net Sales Revenue, Net Income, EBITDA and EBITDA minus Capital Expenditures for each projected year. Projected Net Sales EBITDA Year Revenue Net Income EBITDA less CapEx 2011 2012 4.77% 23.38% 6.44% 3.65% 2013 4.80% 28.50% 5.17% 3.95% 2014 4.83% 24.58% 4.90% 6.86% 2015 4.86% 20.30% 5.04% 6.51%
Acquisition & Transaction Information Assets Available for Acquisition Historical Cost Adjusted Value Accounts Receivable $2,500,000 $2,500,000 Inventory $2,500,000 $2,500,000 Fixed Assets $9,500,000 $9,500,000 Identifiable Intangible Assets $950,000 $950,000 Proposed Acquisition Structure: Asset Purchase Asking Price: 16,500,000
Multiple of EBITDA, latest full year 4.57 Multiple of EBITDA, Trailing Twelve Months 3.91 Multiple of EBITDA, Projected Year 1 3.46 Multiple of Free Cash Flow, latest full year 11.60
Terms:
Cash Down: 10,000,000 Assumed Liabilities: 0 Seller Financing: 6,500,000
14 This Memorandum is confidential and private. Distribution is restricted. It may not be reproduced, copied or replicated in any form. The preparer has not made any independent investigation, verification or audit of the information contained in this Memorandum and makes no representations or warranties, expressed or implied, regarding the accuracy or completeness of the information contained herein.
For addition information contact:
John Smith, CPA Middle Market Business Advisors 500 North Michigan Ave. Chicago, IL. 60600