Investment Proposal - Portfolio360 · PDF fileInvestment Proposal Prepared for: Client March...
35
Securities and advisory services offered through LPL Financial, member FINRA/SIPC. Not FDIC/NCUA Insured Not Bank/Credit Union Guaranteed May Lose Value Not Guaranteed by any Government Agency Not a Bank/Credit Union Deposit Tracking # 429093 Investment Proposal Prepared for: Client March 26, 2013 Prepared by: Team 150 N Wacker Apt GS Chicago, IL 60606 | Phone: 312-453-7800
-
Upload
truongdien -
Category
Documents
-
view
221 -
download
1
Transcript of Investment Proposal - Portfolio360 · PDF fileInvestment Proposal Prepared for: Client March...
Securities and advisory services offered through LPL Financial, member FINRA/SIPC. Not FDIC/NCUA Insured Not Bank/Credit Union Guaranteed May Lose Value Not Guaranteed by any Government Agency Not a Bank/Credit Union Deposit Tracking # 429093
Investment Proposal
Prepared for: Client
March 26, 2013
Prepared by:
Team
150 N Wacker Apt GS
Chicago, IL 60606 | Phone: 312-453-7800
Sam DavittPractice summary text.
Practice Summary
Who We Are: Test Advisor, FA
Bio text.
Who We Are:

Proposed Portfolio
Proposed allocation of platforms. This is a snapshot of your proposed portfolio. The pie chart depicts how your initial investment may be allocated among the specified platforms. The table at the bottom shows how your investment will be allocated across the individual platforms.
Strategic Asset Management (SAM) 50.00 %
Model Wealth Portfolios (MWP) 50.00 %
Proposed Platforms StrategistInvestment Objective Model
Proposed Advisory
Fee
Maximum Advisory
FeeAllocation
%Allocation
$
Strategic Asset Management (SAM) - - - 0.00 % 3.00 % 50.00 % $75,000
Model Wealth Portfolios (MWP) LPL Financial Research Aggressive Growth Diversified - MF 0.00 % 2.50 % 50.00 % $75,000
100.00 % $150,000

Proposed Portfolio
Proposed Managers and/or Mutual Funds
The table shows how your investment will be allocated
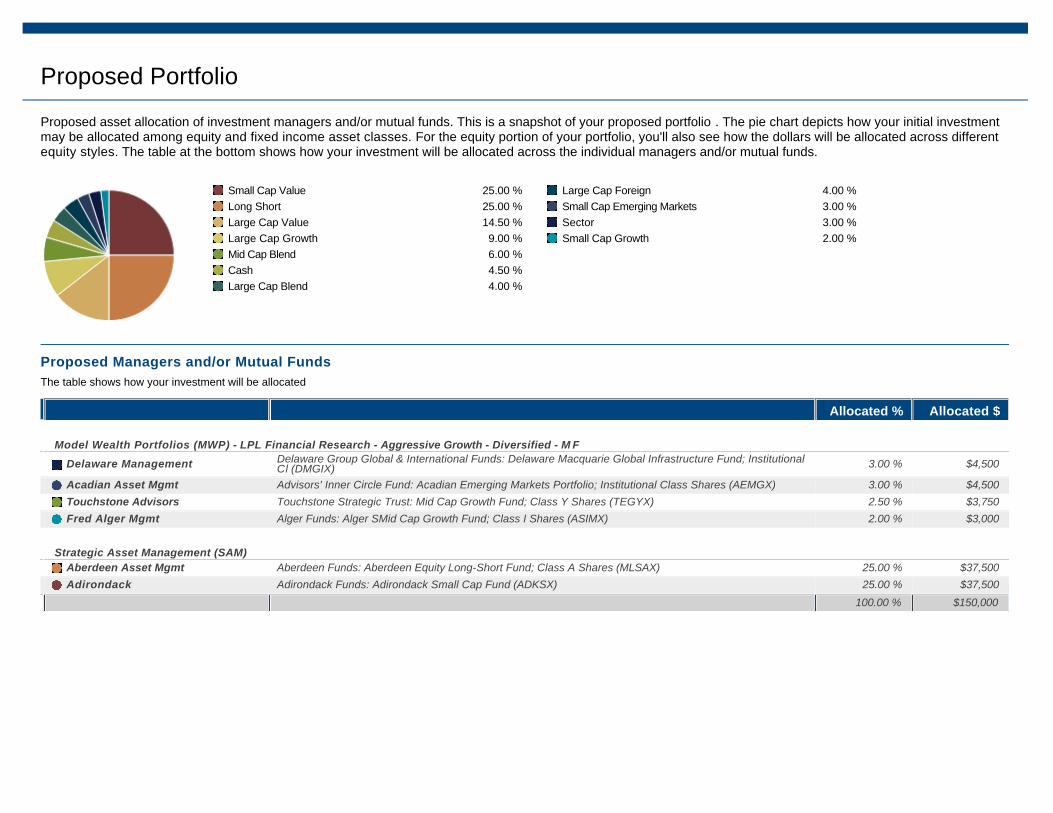
Proposed asset allocation of investment managers and/or mutual funds. This is a snapshot of your proposed portfolio . The pie chart depicts how your initial investment may be allocated among equity and fixed income asset classes. For the equity portion of your portfolio, you'll also see how the dollars will be allocated across different equity styles. The table at the bottom shows how your investment will be allocated across the individual managers and/or mutual funds.
Small Cap Value 25.00 %
Long Short 25.00 %
Large Cap Value 14.50 %
Large Cap Growth 9.00 %
Mid Cap Blend 6.00 %
Cash 4.50 %
Large Cap Blend 4.00 %
Large Cap Foreign 4.00 %
Small Cap Emerging Markets 3.00 %
Sector 3.00 %
Small Cap Growth 2.00 %
Allocated % Allocated $
Model Wealth Portfolios (MWP) - LPL Financial Research - Aggressive Growth - Diversified - M F
Edgewood Mgmt Advisors' Inner Circle Fund: Edgewood Growth Fund; Institutional Class Shares (EGFIX) 9.00 % $13,500
Nuveen Asset Mgmt Nuveen Investment Trust: Nuveen NWQ Large-Cap Value Fund; Class I Shares (NQCRX) 7.50 % $11,250
Allianz Global Investors Allianz Funds: NFJ Dividend Value Fund; Class P Shares (ADJPX) 7.00 % $10,500
Cash 4.50 % $6,750
Davis Selected Advisers Davis Series, Inc: Davis Opportunity Fund; Class Y Shares (DGOYX) 4.00 % $6,000
Oakmark Family of Funds Harris Associates Investment Trust: Oakmark International Fund; Class I Shares (OAKIX) 4.00 % $6,000
Wallace R Weitz & Co. Weitz Funds: Hickory Fund (WEHIX) 3.50 % $5,250
Proposed Portfolio
Proposed Managers and/or Mutual Funds
The table shows how your investment will be allocated
Proposed asset allocation of investment managers and/or mutual funds. This is a snapshot of your proposed portfolio . The pie chart depicts how your initial investment may be allocated among equity and fixed income asset classes. For the equity portion of your portfolio, you'll also see how the dollars will be allocated across different equity styles. The table at the bottom shows how your investment will be allocated across the individual managers and/or mutual funds.
Small Cap Value 25.00 %
Long Short 25.00 %
Large Cap Value 14.50 %
Large Cap Growth 9.00 %
Mid Cap Blend 6.00 %
Cash 4.50 %
Large Cap Blend 4.00 %
Large Cap Foreign 4.00 %
Small Cap Emerging Markets 3.00 %
Sector 3.00 %
Small Cap Growth 2.00 %
Allocated % Allocated $
Model Wealth Portfolios (MWP) - LPL Financial Research - Aggressive Growth - Diversified - M F
Delaware Management Delaware Group Global & International Funds: Delaware Macquarie Global Infrastructure Fund; Institutional Cl (DMGIX) 3.00 % $4,500
Acadian Asset Mgmt Advisors' Inner Circle Fund: Acadian Emerging Markets Portfolio; Institutional Class Shares (AEMGX) 3.00 % $4,500
Touchstone Advisors Touchstone Strategic Trust: Mid Cap Growth Fund; Class Y Shares (TEGYX) 2.50 % $3,750
Fred Alger Mgmt Alger Funds: Alger SMid Cap Growth Fund; Class I Shares (ASIMX) 2.00 % $3,000
Strategic Asset Management (SAM)
Aberdeen Asset Mgmt Aberdeen Funds: Aberdeen Equity Long-Short Fund; Class A Shares (MLSAX) 25.00 % $37,500
Adirondack Adirondack Funds: Adirondack Small Cap Fund (ADKSX) 25.00 % $37,500
100.00 % $150,000
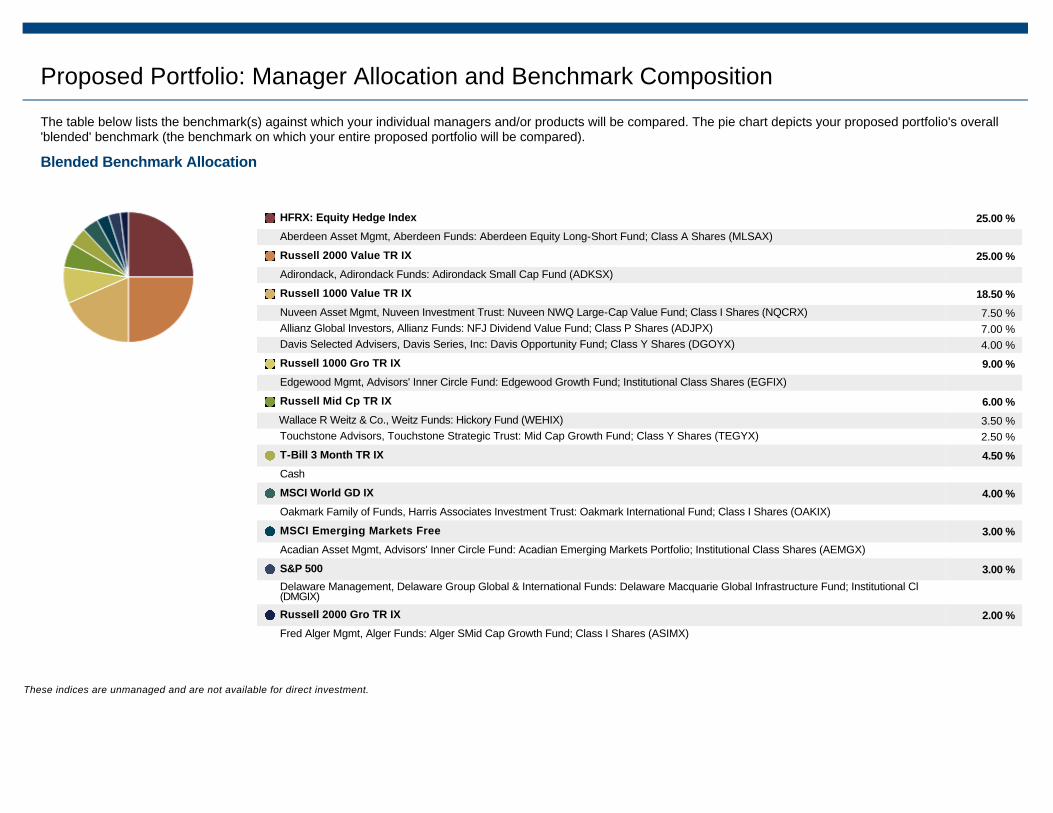
Proposed Portfolio: Manager Allocation and Benchmark Composition
The table below lists the benchmark(s) against which your individual managers and/or products will be compared. The pie chart depicts your proposed portfolio's overall 'blended' benchmark (the benchmark on which your entire proposed portfolio will be compared).
These indices are unmanaged and are not available for direct investment.
Blended Benchmark Allocation
HFRX: Equity Hedge Index 25.00 %
Aberdeen Asset Mgmt, Aberdeen Funds: Aberdeen Equity Long-Short Fund; Class A Shares (MLSAX)
Russell 2000 Value TR IX 25.00 %
Adirondack, Adirondack Funds: Adirondack Small Cap Fund (ADKSX)
Russell 1000 Value TR IX 18.50 %
Nuveen Asset Mgmt, Nuveen Investment Trust: Nuveen NWQ Large-Cap Value Fund; Class I Shares (NQCRX) 7.50 %
Allianz Global Investors, Allianz Funds: NFJ Dividend Value Fund; Class P Shares (ADJPX) 7.00 %
Davis Selected Advisers, Davis Series, Inc: Davis Opportunity Fund; Class Y Shares (DGOYX) 4.00 %
Russell 1000 Gro TR IX 9.00 %
Edgewood Mgmt, Advisors' Inner Circle Fund: Edgewood Growth Fund; Institutional Class Shares (EGFIX)
Russell Mid Cp TR IX 6.00 %
Wallace R Weitz & Co., Weitz Funds: Hickory Fund (WEHIX) 3.50 %
Touchstone Advisors, Touchstone Strategic Trust: Mid Cap Growth Fund; Class Y Shares (TEGYX) 2.50 %
T-Bill 3 Month TR IX 4.50 %
Cash
MSCI World GD IX 4.00 %
Oakmark Family of Funds, Harris Associates Investment Trust: Oakmark International Fund; Class I Shares (OAKIX)
MSCI Emerging Markets Free 3.00 %
Acadian Asset Mgmt, Advisors' Inner Circle Fund: Acadian Emerging Markets Portfolio; Institutional Class Shares (AEMGX)
S&P 500 3.00 %
Delaware Management, Delaware Group Global & International Funds: Delaware Macquarie Global Infrastructure Fund; Institutional Cl (DMGIX)
Russell 2000 Gro TR IX 2.00 %
Fred Alger Mgmt, Alger Funds: Alger SMid Cap Growth Fund; Class I Shares (ASIMX)

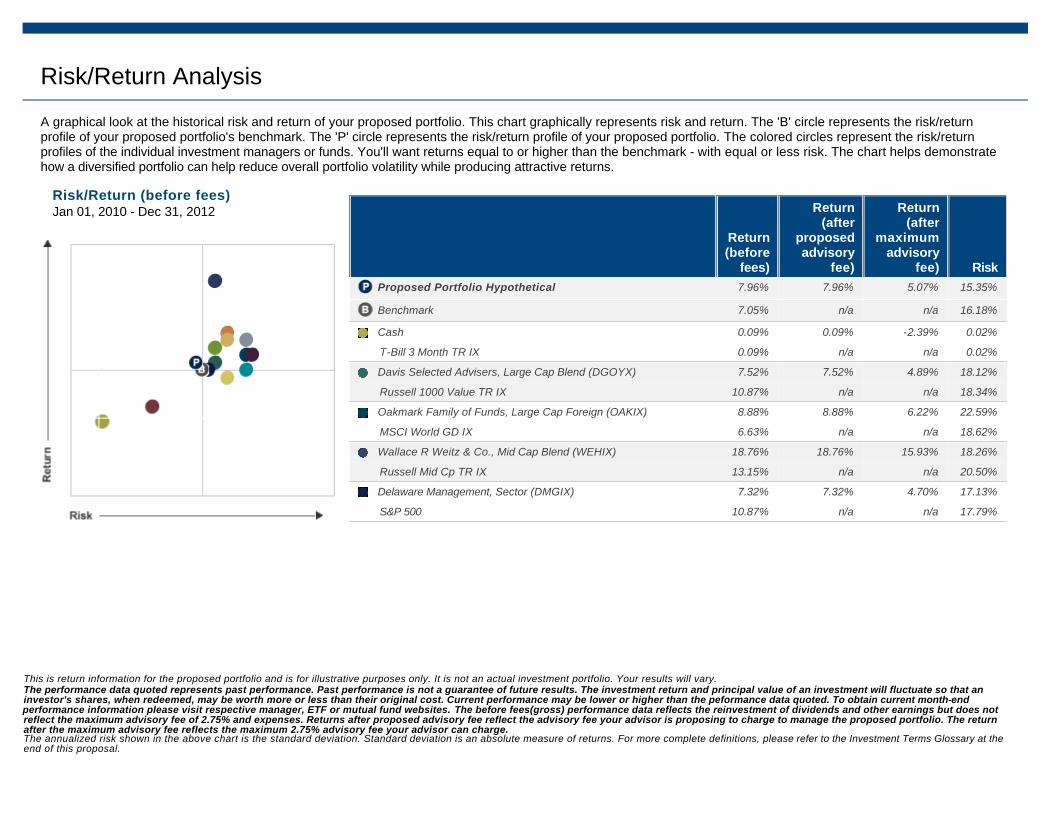
Risk/Return Analysis
A graphical look at the historical risk and return of your proposed portfolio. This chart graphically represents risk and return. The 'B' circle represents the risk/return profile of your proposed portfolio's benchmark. The 'P' circle represents the risk/return profile of your proposed portfolio. The colored circles represent the risk/return profiles of the individual investment managers or funds. You'll want returns equal to or higher than the benchmark - with equal or less risk. The chart helps demonstrate how a diversified portfolio can help reduce overall portfolio volatility while producing attractive returns.
Risk/Return (before fees)Jan 01, 2010 - Dec 31, 2012
Return (before
fees)
Return (after
proposed advisory
fee)
Return (after
maximum advisory
fee) Risk
Proposed Portfolio Hypothetical 7.96% 7.96% 5.07% 15.35%
Benchmark 7.05% n/a n/a 16.18%
Aberdeen Asset Mgmt, Long Short (MLSAX) 1.52% 1.52% -1.48% 8.01%
HFRX: Equity Hedge Index -2.84% n/a n/a 9.99%
Adirondack, Small Cap Value (ADKSX) 12.09% 12.09% 8.85% 19.85%
Russell 2000 Value TR IX 11.57% n/a n/a 22.23%
Edgewood Mgmt, Large Cap Growth (EGFIX) 11.37% 11.37% 8.67% 19.92%
Russell 1000 Gro TR IX 11.35% n/a n/a 18.54%
Nuveen Asset Mgmt, Large Cap Value (NQCRX) 5.74% 5.74% 3.14% 19.98%
Russell 1000 Value TR IX 10.87% n/a n/a 18.34%
Allianz Global Investors, Large Cap Value (ADJPX) 10.19% 10.19% 7.51% 17.77%
Russell 1000 Value TR IX 10.87% n/a n/a 18.34%
This is return information for the proposed portfolio and is for illustrative purposes only. It is not an actual investment portfolio. Your results will vary. The performance data quoted represents past performance. Past performance is not a guarantee of future results. The investment return and principal value of an investment will fluctuate so that an investor's shares, when redeemed, may be worth more or less than their original cost. Current performance may be lower or higher than the peformance data quoted. To obtain current month-end performance information please visit respective manager, ETF or mutual fund websites. The before fees(gross) performance data reflects the reinvestment of dividends and other earnings but does not reflect the maximum advisory fee of 2.75% and expenses. Returns after proposed advisory fee reflect the advisory fee your advisor is proposing to charge to manage the proposed portfolio. The return after the maximum advisory fee reflects the maximum 2.75% advisory fee your advisor can charge. The annualized risk shown in the above chart is the standard deviation. Standard deviation is an absolute measure of returns. For more complete definitions, please refer to the Investment Terms Glossary at the end of this proposal.
Risk/Return Analysis
A graphical look at the historical risk and return of your proposed portfolio. This chart graphically represents risk and return. The 'B' circle represents the risk/return profile of your proposed portfolio's benchmark. The 'P' circle represents the risk/return profile of your proposed portfolio. The colored circles represent the risk/return profiles of the individual investment managers or funds. You'll want returns equal to or higher than the benchmark - with equal or less risk. The chart helps demonstrate how a diversified portfolio can help reduce overall portfolio volatility while producing attractive returns.
Risk/Return (before fees)Jan 01, 2010 - Dec 31, 2012
Return (before
fees)
Return (after
proposed advisory
fee)
Return (after
maximum advisory
fee) Risk
Proposed Portfolio Hypothetical 7.96% 7.96% 5.07% 15.35%
Benchmark 7.05% n/a n/a 16.18%
Cash 0.09% 0.09% -2.39% 0.02%
T-Bill 3 Month TR IX 0.09% n/a n/a 0.02%
Davis Selected Advisers, Large Cap Blend (DGOYX) 7.52% 7.52% 4.89% 18.12%
Russell 1000 Value TR IX 10.87% n/a n/a 18.34%
Oakmark Family of Funds, Large Cap Foreign (OAKIX) 8.88% 8.88% 6.22% 22.59%
MSCI World GD IX 6.63% n/a n/a 18.62%
Wallace R Weitz & Co., Mid Cap Blend (WEHIX) 18.76% 18.76% 15.93% 18.26%
Russell Mid Cp TR IX 13.15% n/a n/a 20.50%
Delaware Management, Sector (DMGIX) 7.32% 7.32% 4.70% 17.13%
S&P 500 10.87% n/a n/a 17.79%
This is return information for the proposed portfolio and is for illustrative purposes only. It is not an actual investment portfolio. Your results will vary. The performance data quoted represents past performance. Past performance is not a guarantee of future results. The investment return and principal value of an investment will fluctuate so that an investor's shares, when redeemed, may be worth more or less than their original cost. Current performance may be lower or higher than the peformance data quoted. To obtain current month-end performance information please visit respective manager, ETF or mutual fund websites. The before fees(gross) performance data reflects the reinvestment of dividends and other earnings but does not reflect the maximum advisory fee of 2.75% and expenses. Returns after proposed advisory fee reflect the advisory fee your advisor is proposing to charge to manage the proposed portfolio. The return after the maximum advisory fee reflects the maximum 2.75% advisory fee your advisor can charge. The annualized risk shown in the above chart is the standard deviation. Standard deviation is an absolute measure of returns. For more complete definitions, please refer to the Investment Terms Glossary at the end of this proposal.

Risk/Return Analysis
A graphical look at the historical risk and return of your proposed portfolio. This chart graphically represents risk and return. The 'B' circle represents the risk/return profile of your proposed portfolio's benchmark. The 'P' circle represents the risk/return profile of your proposed portfolio. The colored circles represent the risk/return profiles of the individual investment managers or funds. You'll want returns equal to or higher than the benchmark - with equal or less risk. The chart helps demonstrate how a diversified portfolio can help reduce overall portfolio volatility while producing attractive returns.
Risk/Return (before fees)Jan 01, 2010 - Dec 31, 2012
Return (before
fees)
Return (after
proposed advisory
fee)
Return (after
maximum advisory
fee) Risk
Proposed Portfolio Hypothetical 7.96% 7.96% 5.07% 15.35%
Benchmark 7.05% n/a n/a 16.18%
Acadian Asset Mgmt, Small Cap Emerging Markets (AEMGX) 6.57% 6.57% 3.95% 22.80%
MSCI Emerging Markets Free 2.16% n/a n/a 22.08%
Touchstone Advisors, Mid Cap Blend (TEGYX) 8.92% 8.92% 6.26% 23.64%
Russell Mid Cp TR IX 13.15% n/a n/a 20.50%
Fred Alger Mgmt, Small Cap Growth (ASIMX) 10.61% 10.61% 7.92% 23.24%
Russell 2000 Gro TR IX 12.82% n/a n/a 23.02%
This is return information for the proposed portfolio and is for illustrative purposes only. It is not an actual investment portfolio. Your results will vary. The performance data quoted represents past performance. Past performance is not a guarantee of future results. The investment return and principal value of an investment will fluctuate so that an investor's shares, when redeemed, may be worth more or less than their original cost. Current performance may be lower or higher than the peformance data quoted. To obtain current month-end performance information please visit respective manager, ETF or mutual fund websites. The before fees(gross) performance data reflects the reinvestment of dividends and other earnings but does not reflect the maximum advisory fee of 2.75% and expenses. Returns after proposed advisory fee reflect the advisory fee your advisor is proposing to charge to manage the proposed portfolio. The return after the maximum advisory fee reflects the maximum 2.75% advisory fee your advisor can charge. The annualized risk shown in the above chart is the standard deviation. Standard deviation is an absolute measure of returns. For more complete definitions, please refer to the Investment Terms Glossary at the end of this proposal.
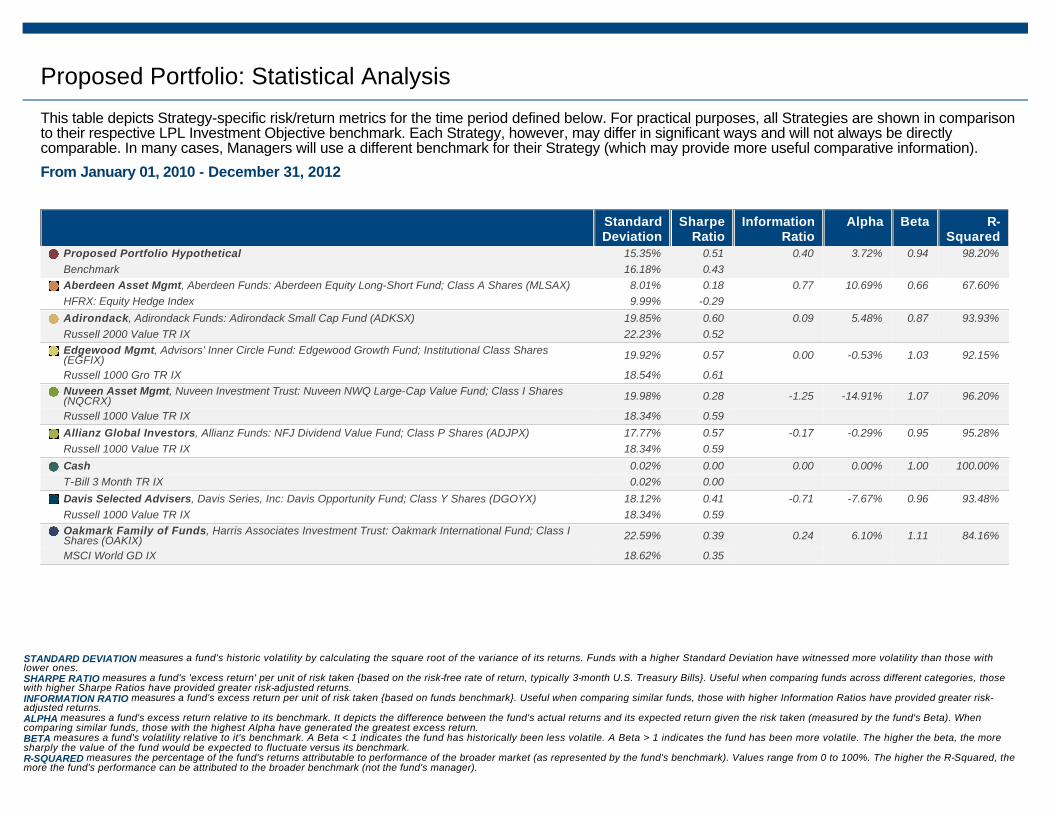
Proposed Portfolio: Statistical Analysis
This table depicts Strategy-specific risk/return metrics for the time period defined below. For practical purposes, all Strategies are shown in comparison to their respective LPL Investment Objective benchmark. Each Strategy, however, may differ in significant ways and will not always be directly comparable. In many cases, Managers will use a different benchmark for their Strategy (which may provide more useful comparative information).
From January 01, 2010 - December 31, 2012
Standard Deviation
Sharpe Ratio
Information Ratio
Alpha Beta R-Squared
Proposed Portfolio Hypothetical 15.35% 0.51 0.40 3.72% 0.94 98.20%
Benchmark 16.18% 0.43
Aberdeen Asset Mgmt, Aberdeen Funds: Aberdeen Equity Long-Short Fund; Class A Shares (MLSAX) 8.01% 0.18 0.77 10.69% 0.66 67.60%
HFRX: Equity Hedge Index 9.99% -0.29
Adirondack, Adirondack Funds: Adirondack Small Cap Fund (ADKSX) 19.85% 0.60 0.09 5.48% 0.87 93.93%
Russell 2000 Value TR IX 22.23% 0.52
Edgewood Mgmt, Advisors' Inner Circle Fund: Edgewood Growth Fund; Institutional Class Shares (EGFIX) 19.92% 0.57 0.00 -0.53% 1.03 92.15%
Russell 1000 Gro TR IX 18.54% 0.61
Nuveen Asset Mgmt, Nuveen Investment Trust: Nuveen NWQ Large-Cap Value Fund; Class I Shares (NQCRX) 19.98% 0.28 -1.25 -14.91% 1.07 96.20%
Russell 1000 Value TR IX 18.34% 0.59
Allianz Global Investors, Allianz Funds: NFJ Dividend Value Fund; Class P Shares (ADJPX) 17.77% 0.57 -0.17 -0.29% 0.95 95.28%
Russell 1000 Value TR IX 18.34% 0.59
Cash 0.02% 0.00 0.00 0.00% 1.00 100.00%
T-Bill 3 Month TR IX 0.02% 0.00
Davis Selected Advisers, Davis Series, Inc: Davis Opportunity Fund; Class Y Shares (DGOYX) 18.12% 0.41 -0.71 -7.67% 0.96 93.48%
Russell 1000 Value TR IX 18.34% 0.59
Oakmark Family of Funds, Harris Associates Investment Trust: Oakmark International Fund; Class I Shares (OAKIX) 22.59% 0.39 0.24 6.10% 1.11 84.16%
MSCI World GD IX 18.62% 0.35
STANDARD DEVIATION measures a fund's historic volatility by calculating the square root of the variance of its returns. Funds with a higher Standard Deviation have witnessed more volatility than those with lower ones. SHARPE RATIO measures a fund's 'excess return' per unit of risk taken {based on the risk-free rate of return, typically 3-month U.S. Treasury Bills}. Useful when comparing funds across different categories, those with higher Sharpe Ratios have provided greater risk-adjusted returns. INFORMATION RATIO measures a fund's excess return per unit of risk taken {based on funds benchmark}. Useful when comparing similar funds, those with higher Information Ratios have provided greater risk-adjusted returns. ALPHA measures a fund's excess return relative to its benchmark. It depicts the difference between the fund's actual returns and its expected return given the risk taken (measured by the fund's Beta). When comparing similar funds, those with the highest Alpha have generated the greatest excess return. BETA measures a fund's volatility relative to it's benchmark. A Beta < 1 indicates the fund has historically been less volatile. A Beta > 1 indicates the fund has been more volatile. The higher the beta, the more sharply the value of the fund would be expected to fluctuate versus its benchmark. R-SQUARED measures the percentage of the fund's returns attributable to performance of the broader market (as represented by the fund's benchmark). Values range from 0 to 100%. The higher the R-Squared, the more the fund's performance can be attributed to the broader benchmark (not the fund's manager).

Proposed Portfolio: Statistical Analysis
This table depicts Strategy-specific risk/return metrics for the time period defined below. For practical purposes, all Strategies are shown in comparison to their respective LPL Investment Objective benchmark. Each Strategy, however, may differ in significant ways and will not always be directly comparable. In many cases, Managers will use a different benchmark for their Strategy (which may provide more useful comparative information).
From January 01, 2010 - December 31, 2012
Standard Deviation
Sharpe Ratio
Information Ratio
Alpha Beta R-Squared
Proposed Portfolio Hypothetical 15.35% 0.51 0.40 3.72% 0.94 98.20%
Benchmark 16.18% 0.43
Wallace R Weitz & Co., Weitz Funds: Hickory Fund (WEHIX) 18.26% 1.02 0.85 22.55% 0.85 90.04%
Russell Mid Cp TR IX 20.50% 0.64
Delaware Management, Delaware Group Global & International Funds: Delaware Macquarie Global Infrastructure Fund; Institutional Cl (DMGIX) 17.13% 0.42 -0.49 -5.90% 0.88 83.64%
S&P 500 17.79% 0.61
Acadian Asset Mgmt, Advisors' Inner Circle Fund: Acadian Emerging Markets Portfolio; Institutional Class Shares (AEMGX) 22.80% 0.28 1.74 13.52% 1.03 98.84%
MSCI Emerging Markets Free 22.08% 0.09
Touchstone Advisors, Touchstone Strategic Trust: Mid Cap Growth Fund; Class Y Shares (TEGYX) 23.64% 0.37 -0.76 -14.21% 1.13 95.63%
Russell Mid Cp TR IX 20.50% 0.64
Fred Alger Mgmt, Alger Funds: Alger SMid Cap Growth Fund; Class I Shares (ASIMX) 23.24% 0.45 -0.58 -5.56% 1.00 97.34%
Russell 2000 Gro TR IX 23.02% 0.55
STANDARD DEVIATION measures a fund's historic volatility by calculating the square root of the variance of its returns. Funds with a higher Standard Deviation have witnessed more volatility than those with lower ones. SHARPE RATIO measures a fund's 'excess return' per unit of risk taken {based on the risk-free rate of return, typically 3-month U.S. Treasury Bills}. Useful when comparing funds across different categories, those with higher Sharpe Ratios have provided greater risk-adjusted returns. INFORMATION RATIO measures a fund's excess return per unit of risk taken {based on funds benchmark}. Useful when comparing similar funds, those with higher Information Ratios have provided greater risk-adjusted returns. ALPHA measures a fund's excess return relative to its benchmark. It depicts the difference between the fund's actual returns and its expected return given the risk taken (measured by the fund's Beta). When comparing similar funds, those with the highest Alpha have generated the greatest excess return. BETA measures a fund's volatility relative to it's benchmark. A Beta < 1 indicates the fund has historically been less volatile. A Beta > 1 indicates the fund has been more volatile. The higher the beta, the more sharply the value of the fund would be expected to fluctuate versus its benchmark. R-SQUARED measures the percentage of the fund's returns attributable to performance of the broader market (as represented by the fund's benchmark). Values range from 0 to 100%. The higher the R-Squared, the more the fund's performance can be attributed to the broader benchmark (not the fund's manager).
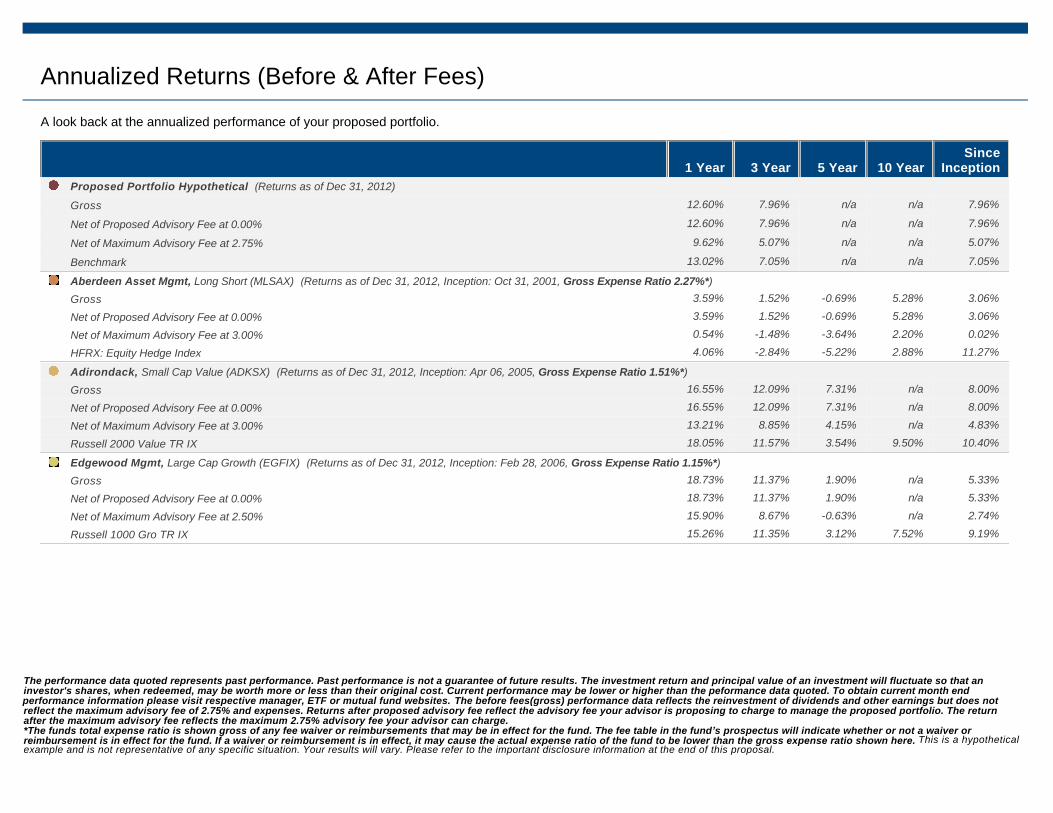
Annualized Returns (Before & After Fees)
A look back at the annualized performance of your proposed portfolio.
1 Year 3 Year 5 Year 10 Year
SinceInception
Proposed Portfolio Hypothetical (Returns as of Dec 31, 2012)
Gross 12.60% 7.96% n/a n/a 7.96%
Net of Proposed Advisory Fee at 0.00% 12.60% 7.96% n/a n/a 7.96%
Net of Maximum Advisory Fee at 2.75% 9.62% 5.07% n/a n/a 5.07%
Benchmark 13.02% 7.05% n/a n/a 7.05%
Aberdeen Asset Mgmt, Long Short (MLSAX) (Returns as of Dec 31, 2012, Inception: Oct 31, 2001, Gross Expense Ratio 2.27%*)
Gross 3.59% 1.52% -0.69% 5.28% 3.06%
Net of Proposed Advisory Fee at 0.00% 3.59% 1.52% -0.69% 5.28% 3.06%
Net of Maximum Advisory Fee at 3.00% 0.54% -1.48% -3.64% 2.20% 0.02%
HFRX: Equity Hedge Index 4.06% -2.84% -5.22% 2.88% 11.27%
Adirondack, Small Cap Value (ADKSX) (Returns as of Dec 31, 2012, Inception: Apr 06, 2005, Gross Expense Ratio 1.51%*)
Gross 16.55% 12.09% 7.31% n/a 8.00%
Net of Proposed Advisory Fee at 0.00% 16.55% 12.09% 7.31% n/a 8.00%
Net of Maximum Advisory Fee at 3.00% 13.21% 8.85% 4.15% n/a 4.83%
Russell 2000 Value TR IX 18.05% 11.57% 3.54% 9.50% 10.40%
Edgewood Mgmt, Large Cap Growth (EGFIX) (Returns as of Dec 31, 2012, Inception: Feb 28, 2006, Gross Expense Ratio 1.15%*)
Gross 18.73% 11.37% 1.90% n/a 5.33%
Net of Proposed Advisory Fee at 0.00% 18.73% 11.37% 1.90% n/a 5.33%
Net of Maximum Advisory Fee at 2.50% 15.90% 8.67% -0.63% n/a 2.74%
Russell 1000 Gro TR IX 15.26% 11.35% 3.12% 7.52% 9.19%
The performance data quoted represents past performance. Past performance is not a guarantee of future results. The investment return and principal value of an investment will fluctuate so that an investor's shares, when redeemed, may be worth more or less than their original cost. Current performance may be lower or higher than the peformance data quoted. To obtain current month end performance information please visit respective manager, ETF or mutual fund websites. The before fees(gross) performance data reflects the reinvestment of dividends and other earnings but does not reflect the maximum advisory fee of 2.75% and expenses. Returns after proposed advisory fee reflect the advisory fee your advisor is proposing to charge to manage the proposed portfolio. The return after the maximum advisory fee reflects the maximum 2.75% advisory fee your advisor can charge. *The funds total expense ratio is shown gross of any fee waiver or reimbursements that may be in effect for the fund. The fee table in the fund’s prospectus will indicate whether or not a waiver or reimbursement is in effect for the fund. If a waiver or reimbursement is in effect, it may cause the actual expense ratio of the fund to be lower than the gross expense ratio shown here. This is a hypotheticalexample and is not representative of any specific situation. Your results will vary. Please refer to the important disclosure information at the end of this proposal.
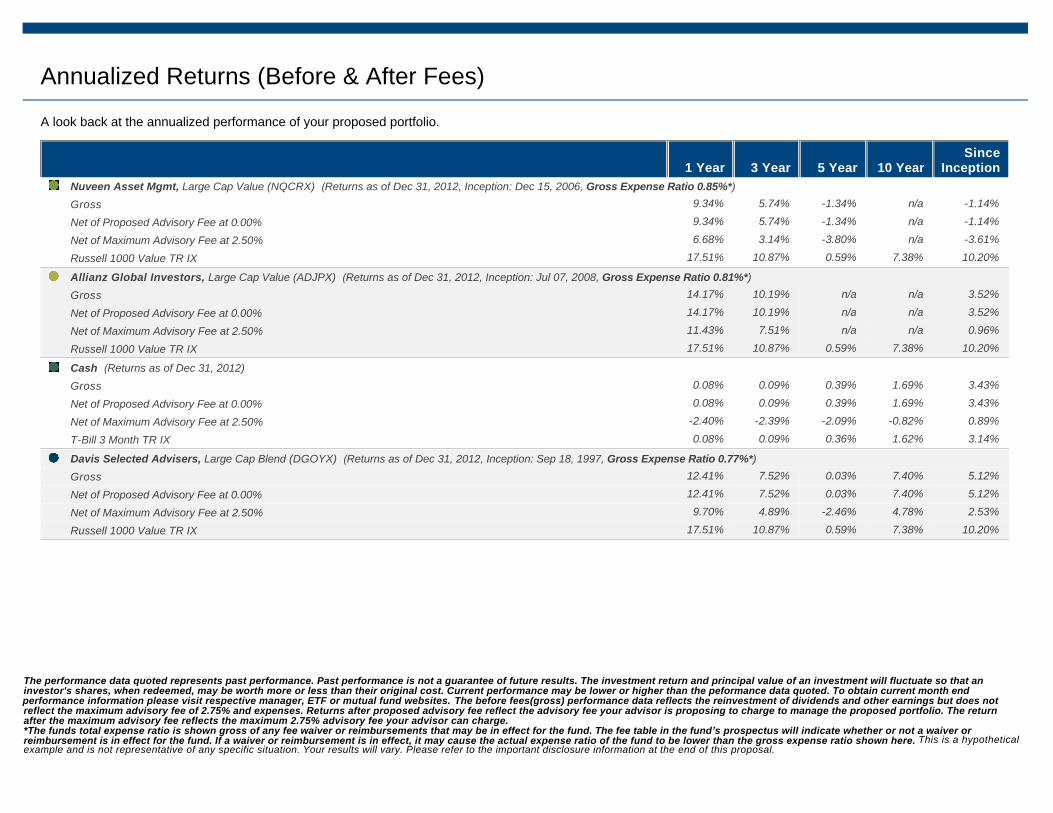
Annualized Returns (Before & After Fees)
A look back at the annualized performance of your proposed portfolio.
1 Year 3 Year 5 Year 10 Year
SinceInception
Nuveen Asset Mgmt, Large Cap Value (NQCRX) (Returns as of Dec 31, 2012, Inception: Dec 15, 2006, Gross Expense Ratio 0.85%*)
Gross 9.34% 5.74% -1.34% n/a -1.14%
Net of Proposed Advisory Fee at 0.00% 9.34% 5.74% -1.34% n/a -1.14%
Net of Maximum Advisory Fee at 2.50% 6.68% 3.14% -3.80% n/a -3.61%
Russell 1000 Value TR IX 17.51% 10.87% 0.59% 7.38% 10.20%
Allianz Global Investors, Large Cap Value (ADJPX) (Returns as of Dec 31, 2012, Inception: Jul 07, 2008, Gross Expense Ratio 0.81%*)
Gross 14.17% 10.19% n/a n/a 3.52%
Net of Proposed Advisory Fee at 0.00% 14.17% 10.19% n/a n/a 3.52%
Net of Maximum Advisory Fee at 2.50% 11.43% 7.51% n/a n/a 0.96%
Russell 1000 Value TR IX 17.51% 10.87% 0.59% 7.38% 10.20%
Cash (Returns as of Dec 31, 2012)
Gross 0.08% 0.09% 0.39% 1.69% 3.43%
Net of Proposed Advisory Fee at 0.00% 0.08% 0.09% 0.39% 1.69% 3.43%
Net of Maximum Advisory Fee at 2.50% -2.40% -2.39% -2.09% -0.82% 0.89%
T-Bill 3 Month TR IX 0.08% 0.09% 0.36% 1.62% 3.14%
Davis Selected Advisers, Large Cap Blend (DGOYX) (Returns as of Dec 31, 2012, Inception: Sep 18, 1997, Gross Expense Ratio 0.77%*)
Gross 12.41% 7.52% 0.03% 7.40% 5.12%
Net of Proposed Advisory Fee at 0.00% 12.41% 7.52% 0.03% 7.40% 5.12%
Net of Maximum Advisory Fee at 2.50% 9.70% 4.89% -2.46% 4.78% 2.53%
Russell 1000 Value TR IX 17.51% 10.87% 0.59% 7.38% 10.20%
The performance data quoted represents past performance. Past performance is not a guarantee of future results. The investment return and principal value of an investment will fluctuate so that an investor's shares, when redeemed, may be worth more or less than their original cost. Current performance may be lower or higher than the peformance data quoted. To obtain current month end performance information please visit respective manager, ETF or mutual fund websites. The before fees(gross) performance data reflects the reinvestment of dividends and other earnings but does not reflect the maximum advisory fee of 2.75% and expenses. Returns after proposed advisory fee reflect the advisory fee your advisor is proposing to charge to manage the proposed portfolio. The return after the maximum advisory fee reflects the maximum 2.75% advisory fee your advisor can charge. *The funds total expense ratio is shown gross of any fee waiver or reimbursements that may be in effect for the fund. The fee table in the fund’s prospectus will indicate whether or not a waiver or reimbursement is in effect for the fund. If a waiver or reimbursement is in effect, it may cause the actual expense ratio of the fund to be lower than the gross expense ratio shown here. This is a hypotheticalexample and is not representative of any specific situation. Your results will vary. Please refer to the important disclosure information at the end of this proposal.
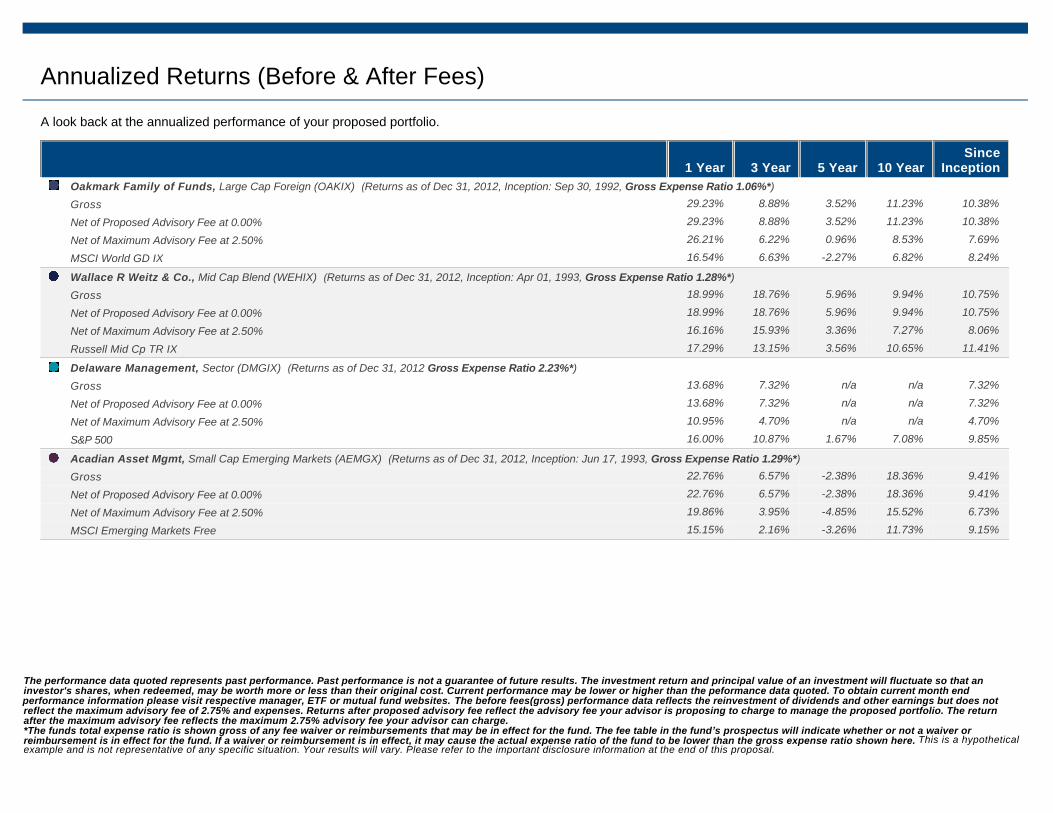
Annualized Returns (Before & After Fees)
A look back at the annualized performance of your proposed portfolio.
1 Year 3 Year 5 Year 10 Year
SinceInception
Oakmark Family of Funds, Large Cap Foreign (OAKIX) (Returns as of Dec 31, 2012, Inception: Sep 30, 1992, Gross Expense Ratio 1.06%*)
Gross 29.23% 8.88% 3.52% 11.23% 10.38%
Net of Proposed Advisory Fee at 0.00% 29.23% 8.88% 3.52% 11.23% 10.38%
Net of Maximum Advisory Fee at 2.50% 26.21% 6.22% 0.96% 8.53% 7.69%
MSCI World GD IX 16.54% 6.63% -2.27% 6.82% 8.24%
Wallace R Weitz & Co., Mid Cap Blend (WEHIX) (Returns as of Dec 31, 2012, Inception: Apr 01, 1993, Gross Expense Ratio 1.28%*)
Gross 18.99% 18.76% 5.96% 9.94% 10.75%
Net of Proposed Advisory Fee at 0.00% 18.99% 18.76% 5.96% 9.94% 10.75%
Net of Maximum Advisory Fee at 2.50% 16.16% 15.93% 3.36% 7.27% 8.06%
Russell Mid Cp TR IX 17.29% 13.15% 3.56% 10.65% 11.41%
Delaware Management, Sector (DMGIX) (Returns as of Dec 31, 2012 Gross Expense Ratio 2.23%*)
Gross 13.68% 7.32% n/a n/a 7.32%
Net of Proposed Advisory Fee at 0.00% 13.68% 7.32% n/a n/a 7.32%
Net of Maximum Advisory Fee at 2.50% 10.95% 4.70% n/a n/a 4.70%
S&P 500 16.00% 10.87% 1.67% 7.08% 9.85%
Acadian Asset Mgmt, Small Cap Emerging Markets (AEMGX) (Returns as of Dec 31, 2012, Inception: Jun 17, 1993, Gross Expense Ratio 1.29%*)
Gross 22.76% 6.57% -2.38% 18.36% 9.41%
Net of Proposed Advisory Fee at 0.00% 22.76% 6.57% -2.38% 18.36% 9.41%
Net of Maximum Advisory Fee at 2.50% 19.86% 3.95% -4.85% 15.52% 6.73%
MSCI Emerging Markets Free 15.15% 2.16% -3.26% 11.73% 9.15%
The performance data quoted represents past performance. Past performance is not a guarantee of future results. The investment return and principal value of an investment will fluctuate so that an investor's shares, when redeemed, may be worth more or less than their original cost. Current performance may be lower or higher than the peformance data quoted. To obtain current month end performance information please visit respective manager, ETF or mutual fund websites. The before fees(gross) performance data reflects the reinvestment of dividends and other earnings but does not reflect the maximum advisory fee of 2.75% and expenses. Returns after proposed advisory fee reflect the advisory fee your advisor is proposing to charge to manage the proposed portfolio. The return after the maximum advisory fee reflects the maximum 2.75% advisory fee your advisor can charge. *The funds total expense ratio is shown gross of any fee waiver or reimbursements that may be in effect for the fund. The fee table in the fund’s prospectus will indicate whether or not a waiver or reimbursement is in effect for the fund. If a waiver or reimbursement is in effect, it may cause the actual expense ratio of the fund to be lower than the gross expense ratio shown here. This is a hypotheticalexample and is not representative of any specific situation. Your results will vary. Please refer to the important disclosure information at the end of this proposal.

Annualized Returns (Before & After Fees)
A look back at the annualized performance of your proposed portfolio.
1 Year 3 Year 5 Year 10 Year
SinceInception
Touchstone Advisors, Mid Cap Blend (TEGYX) (Returns as of Dec 31, 2012, Inception: Feb 02, 2009, Gross Expense Ratio 1.11%*)
Gross 20.13% 8.92% n/a n/a 18.63%
Net of Proposed Advisory Fee at 0.00% 20.13% 8.92% n/a n/a 18.63%
Net of Maximum Advisory Fee at 2.50% 17.28% 6.26% n/a n/a 15.79%
Russell Mid Cp TR IX 17.29% 13.15% 3.56% 10.65% 11.41%
Fred Alger Mgmt, Small Cap Growth (ASIMX) (Returns as of Dec 31, 2012, Inception: Aug 06, 2007, Gross Expense Ratio 1.21%*)
Gross 14.10% 10.61% 0.09% n/a 0.66%
Net of Proposed Advisory Fee at 0.00% 14.10% 10.61% 0.09% n/a 0.66%
Net of Maximum Advisory Fee at 2.50% 11.36% 7.92% -2.41% n/a -1.85%
Russell 2000 Gro TR IX 14.60% 12.82% 3.48% 9.80% 6.83%
The performance data quoted represents past performance. Past performance is not a guarantee of future results. The investment return and principal value of an investment will fluctuate so that an investor's shares, when redeemed, may be worth more or less than their original cost. Current performance may be lower or higher than the peformance data quoted. To obtain current month end performance information please visit respective manager, ETF or mutual fund websites. The before fees(gross) performance data reflects the reinvestment of dividends and other earnings but does not reflect the maximum advisory fee of 2.75% and expenses. Returns after proposed advisory fee reflect the advisory fee your advisor is proposing to charge to manage the proposed portfolio. The return after the maximum advisory fee reflects the maximum 2.75% advisory fee your advisor can charge. *The funds total expense ratio is shown gross of any fee waiver or reimbursements that may be in effect for the fund. The fee table in the fund’s prospectus will indicate whether or not a waiver or reimbursement is in effect for the fund. If a waiver or reimbursement is in effect, it may cause the actual expense ratio of the fund to be lower than the gross expense ratio shown here. This is a hypotheticalexample and is not representative of any specific situation. Your results will vary. Please refer to the important disclosure information at the end of this proposal.
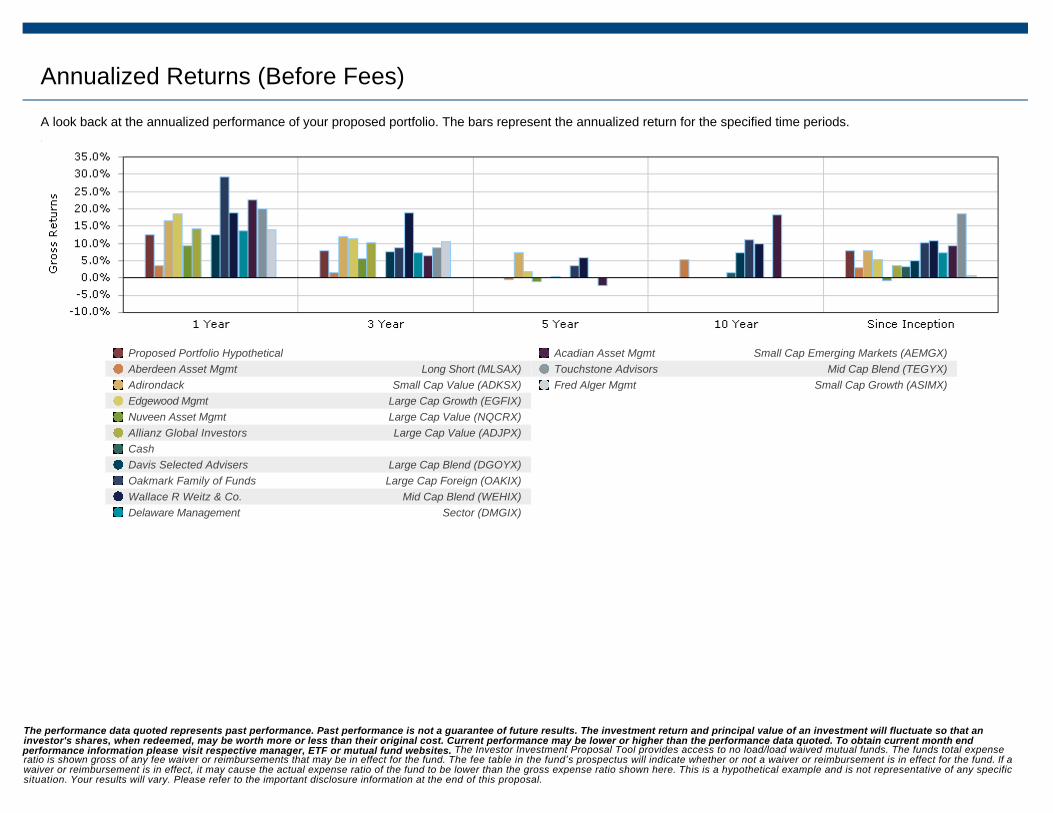
Annualized Returns (Before Fees)
A look back at the annualized performance of your proposed portfolio. The bars represent the annualized return for the specified time periods.
Proposed Portfolio Hypothetical
Aberdeen Asset Mgmt Long Short (MLSAX)
Adirondack Small Cap Value (ADKSX)
Edgewood Mgmt Large Cap Growth (EGFIX)
Nuveen Asset Mgmt Large Cap Value (NQCRX)
Allianz Global Investors Large Cap Value (ADJPX)
Cash
Davis Selected Advisers Large Cap Blend (DGOYX)
Oakmark Family of Funds Large Cap Foreign (OAKIX)
Wallace R Weitz & Co. Mid Cap Blend (WEHIX)
Delaware Management Sector (DMGIX)
Acadian Asset Mgmt Small Cap Emerging Markets (AEMGX)
Touchstone Advisors Mid Cap Blend (TEGYX)
Fred Alger Mgmt Small Cap Growth (ASIMX)
The performance data quoted represents past performance. Past performance is not a guarantee of future results. The investment return and principal value of an investment will fluctuate so that an investor's shares, when redeemed, may be worth more or less than their original cost. Current performance may be lower or higher than the performance data quoted. To obtain current month end performance information please visit respective manager, ETF or mutual fund websites. The Investor Investment Proposal Tool provides access to no load/load waived mutual funds. The funds total expense ratio is shown gross of any fee waiver or reimbursements that may be in effect for the fund. The fee table in the fund’s prospectus will indicate whether or not a waiver or reimbursement is in effect for the fund. If a waiver or reimbursement is in effect, it may cause the actual expense ratio of the fund to be lower than the gross expense ratio shown here. This is a hypothetical example and is not representative of any specific situation. Your results will vary. Please refer to the important disclosure information at the end of this proposal.
Prospectus Legend
Investors should consider the investment objectives, risks, charges and expenses of each investment company carefully before investing. Each prospectus contains this and other important information.
Contact the following for most recent month-end results or to receive prospectuses:
Aberdeen Asset Management Inc at 800-522-5465, www.aberdeen-asset.us
Acadian Asset Management, LLC at 617-850-3500, www.acadian-asset.com
Adirondack Research & Management Inc at 888-686-2729, www.adirondackfunds.com
Allianz Global Investors at 800-426-0107, www.allianzglobalinvestors.com
Davis Selected Advisers, L.P. (d.b.a. at 800-440-0334, www.davisfunds.com
Edgewood Management LLC at 212-652-9123, www.edgewood.com
Fred Alger Management, Inc. at 800-992-3863, www.spectrafund.com
Nuveen Asset Management at 800-257-8787, www.nuveen.com
Oakmark Family of Funds at 800-625-6275, www.oakmark.com
Touchstone Advisors Inc at 800-543-0407, www.touchstoneadvisors.com
Wallace R Weitz & Company at 800-304-9745, www.weitzfunds.com
Read carefully before investing.
Please refer to the important disclosure information at the end of this proposal.

Calendar Returns (Before & After Fees)
A look back at the calendar returns performance of your proposed portfolio. It helps illustrate how the returns of individual strategies can be more volatile — higher highs and lower lows — than a diversified portfolio.
2008 2009 2010 2011 2012
Proposed Portfolio Hypothetical
Gross n/a n/a 16.70% -4.24% 12.60%
Net of Proposed Advisory Fee at 0.00% n/a n/a 16.70% -4.24% 12.60%
Net of Maximum Advisory Fee at 2.75% n/a n/a 13.64% -6.88% 9.62%
Benchmark n/a n/a 16.25% -6.63% 13.02%
Aberdeen Asset Mgmt, Long Short (MLSAX)
Gross -13.88% 7.21% 4.63% -3.45% 3.59%
Net of Proposed Advisory Fee at 0.00% -13.88% 7.21% 4.63% -3.45% 3.59%
Net of Maximum Advisory Fee at 3.00% -16.53% 4.08% 1.56% -6.34% 0.54%
HFRX: Equity Hedge Index -26.30% 13.15% 8.92% -19.07% 4.06%
Adirondack, Small Cap Value (ADKSX)
Gross -35.22% 55.98% 31.24% -7.92% 16.55%
Net of Proposed Advisory Fee at 0.00% -35.22% 55.98% 31.24% -7.92% 16.55%
Net of Maximum Advisory Fee at 3.00% -37.37% 51.75% 27.59% -10.72% 13.21%
Russell 2000 Value TR IX -28.93% 20.57% 24.49% -5.49% 18.05%
Edgewood Mgmt, Large Cap Growth (EGFIX)
Gross -39.15% 30.73% 12.15% 3.73% 18.73%
Net of Proposed Advisory Fee at 0.00% -39.15% 30.73% 12.15% 3.73% 18.73%
Net of Maximum Advisory Fee at 2.50% -40.87% 27.69% 9.43% 1.18% 15.90%
Russell 1000 Gro TR IX -38.44% 37.20% 16.71% 2.64% 15.26%
Nuveen Asset Mgmt, Large Cap Value (NQCRX)
Gross -38.19% 27.96% 16.74% -7.38% 9.34%
Net of Proposed Advisory Fee at 0.00% -38.19% 27.96% 16.74% -7.38% 9.34%
Net of Maximum Advisory Fee at 2.50% -39.92% 24.96% 13.95% -9.73% 6.68%
Russell 1000 Value TR IX -36.85% 19.69% 15.50% 0.40% 17.51%
The performance data quoted represents past performance. Past performance is not a guarantee of future results. The investment return and principal value of an investment will fluctuate so that an investor's shares, when redeemed, may be worth more or less than their original cost. Current performance may be lower or higher than the performance data quoted. To obtain current month end performance information please visit respective manager, ETF or mutual fund websites. The before fees(gross) performance data reflects the reinvestment of dividends and other earnings but does not relect the maximum advisory fee of 2.75% and expenses. Returns after proposed advisory fee reflect the advisory fee your advisor is proposing to charge to manage the proposed portfolio. The return after the maximum advisory fee reflects the maximum 2.75% advisory fee your advisor can charge. This is a hypothetical example and is not representative of any specific situation. Your results will vary. Please refer to the important disclosure information at the end of this proposal.
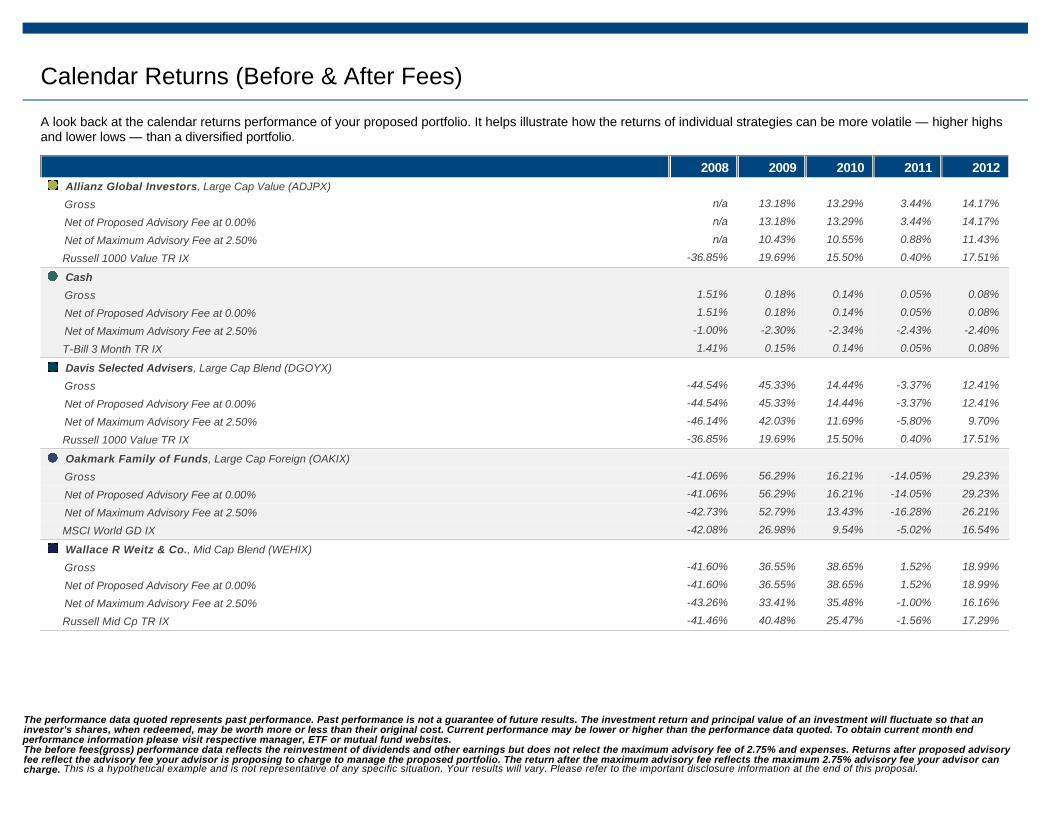
Calendar Returns (Before & After Fees)
A look back at the calendar returns performance of your proposed portfolio. It helps illustrate how the returns of individual strategies can be more volatile — higher highs and lower lows — than a diversified portfolio.
2008 2009 2010 2011 2012
Allianz Global Investors, Large Cap Value (ADJPX)
Gross n/a 13.18% 13.29% 3.44% 14.17%
Net of Proposed Advisory Fee at 0.00% n/a 13.18% 13.29% 3.44% 14.17%
Net of Maximum Advisory Fee at 2.50% n/a 10.43% 10.55% 0.88% 11.43%
Russell 1000 Value TR IX -36.85% 19.69% 15.50% 0.40% 17.51%
Cash
Gross 1.51% 0.18% 0.14% 0.05% 0.08%
Net of Proposed Advisory Fee at 0.00% 1.51% 0.18% 0.14% 0.05% 0.08%
Net of Maximum Advisory Fee at 2.50% -1.00% -2.30% -2.34% -2.43% -2.40%
T-Bill 3 Month TR IX 1.41% 0.15% 0.14% 0.05% 0.08%
Davis Selected Advisers, Large Cap Blend (DGOYX)
Gross -44.54% 45.33% 14.44% -3.37% 12.41%
Net of Proposed Advisory Fee at 0.00% -44.54% 45.33% 14.44% -3.37% 12.41%
Net of Maximum Advisory Fee at 2.50% -46.14% 42.03% 11.69% -5.80% 9.70%
Russell 1000 Value TR IX -36.85% 19.69% 15.50% 0.40% 17.51%
Oakmark Family of Funds, Large Cap Foreign (OAKIX)
Gross -41.06% 56.29% 16.21% -14.05% 29.23%
Net of Proposed Advisory Fee at 0.00% -41.06% 56.29% 16.21% -14.05% 29.23%
Net of Maximum Advisory Fee at 2.50% -42.73% 52.79% 13.43% -16.28% 26.21%
MSCI World GD IX -42.08% 26.98% 9.54% -5.02% 16.54%
Wallace R Weitz & Co., Mid Cap Blend (WEHIX)
Gross -41.60% 36.55% 38.65% 1.52% 18.99%
Net of Proposed Advisory Fee at 0.00% -41.60% 36.55% 38.65% 1.52% 18.99%
Net of Maximum Advisory Fee at 2.50% -43.26% 33.41% 35.48% -1.00% 16.16%
Russell Mid Cp TR IX -41.46% 40.48% 25.47% -1.56% 17.29%
The performance data quoted represents past performance. Past performance is not a guarantee of future results. The investment return and principal value of an investment will fluctuate so that an investor's shares, when redeemed, may be worth more or less than their original cost. Current performance may be lower or higher than the performance data quoted. To obtain current month end performance information please visit respective manager, ETF or mutual fund websites. The before fees(gross) performance data reflects the reinvestment of dividends and other earnings but does not relect the maximum advisory fee of 2.75% and expenses. Returns after proposed advisory fee reflect the advisory fee your advisor is proposing to charge to manage the proposed portfolio. The return after the maximum advisory fee reflects the maximum 2.75% advisory fee your advisor can charge. This is a hypothetical example and is not representative of any specific situation. Your results will vary. Please refer to the important disclosure information at the end of this proposal.
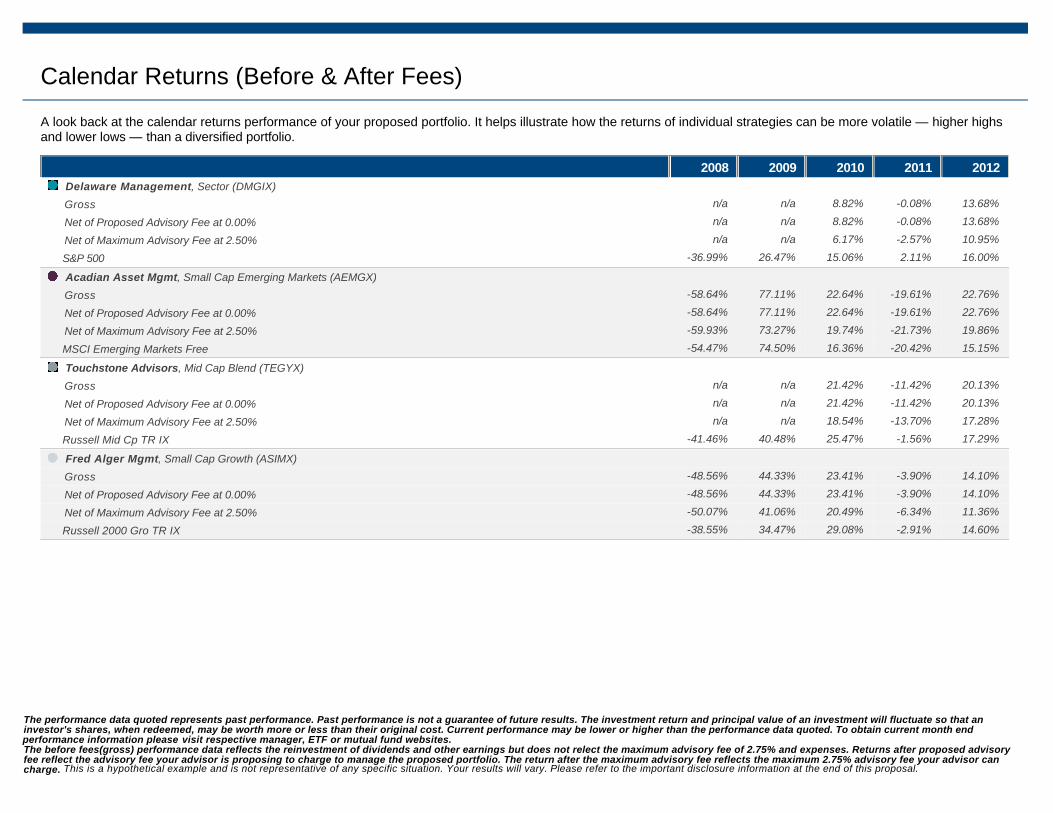
Calendar Returns (Before & After Fees)
A look back at the calendar returns performance of your proposed portfolio. It helps illustrate how the returns of individual strategies can be more volatile — higher highs and lower lows — than a diversified portfolio.
2008 2009 2010 2011 2012
Delaware Management, Sector (DMGIX)
Gross n/a n/a 8.82% -0.08% 13.68%
Net of Proposed Advisory Fee at 0.00% n/a n/a 8.82% -0.08% 13.68%
Net of Maximum Advisory Fee at 2.50% n/a n/a 6.17% -2.57% 10.95%
S&P 500 -36.99% 26.47% 15.06% 2.11% 16.00%
Acadian Asset Mgmt, Small Cap Emerging Markets (AEMGX)
Gross -58.64% 77.11% 22.64% -19.61% 22.76%
Net of Proposed Advisory Fee at 0.00% -58.64% 77.11% 22.64% -19.61% 22.76%
Net of Maximum Advisory Fee at 2.50% -59.93% 73.27% 19.74% -21.73% 19.86%
MSCI Emerging Markets Free -54.47% 74.50% 16.36% -20.42% 15.15%
Touchstone Advisors, Mid Cap Blend (TEGYX)
Gross n/a n/a 21.42% -11.42% 20.13%
Net of Proposed Advisory Fee at 0.00% n/a n/a 21.42% -11.42% 20.13%
Net of Maximum Advisory Fee at 2.50% n/a n/a 18.54% -13.70% 17.28%
Russell Mid Cp TR IX -41.46% 40.48% 25.47% -1.56% 17.29%
Fred Alger Mgmt, Small Cap Growth (ASIMX)
Gross -48.56% 44.33% 23.41% -3.90% 14.10%
Net of Proposed Advisory Fee at 0.00% -48.56% 44.33% 23.41% -3.90% 14.10%
Net of Maximum Advisory Fee at 2.50% -50.07% 41.06% 20.49% -6.34% 11.36%
Russell 2000 Gro TR IX -38.55% 34.47% 29.08% -2.91% 14.60%
The performance data quoted represents past performance. Past performance is not a guarantee of future results. The investment return and principal value of an investment will fluctuate so that an investor's shares, when redeemed, may be worth more or less than their original cost. Current performance may be lower or higher than the performance data quoted. To obtain current month end performance information please visit respective manager, ETF or mutual fund websites. The before fees(gross) performance data reflects the reinvestment of dividends and other earnings but does not relect the maximum advisory fee of 2.75% and expenses. Returns after proposed advisory fee reflect the advisory fee your advisor is proposing to charge to manage the proposed portfolio. The return after the maximum advisory fee reflects the maximum 2.75% advisory fee your advisor can charge. This is a hypothetical example and is not representative of any specific situation. Your results will vary. Please refer to the important disclosure information at the end of this proposal.

Calendar Returns (Before Fees)
A look back at the calendar returns performance of your proposed portfolio. This bar chart shows the historical calendar returns performance (before fees) of your proposed portfolio, as well as that of the individual managers or funds. It helps illustrate how the returns of individual strategies can be more volatile — higher highs and lower lows — than a diversified portfolio.
Proposed Portfolio Hypothetical
Aberdeen Asset Mgmt Long Short (MLSAX)
Adirondack Small Cap Value (ADKSX)
Edgewood Mgmt Large Cap Growth (EGFIX)
Nuveen Asset Mgmt Large Cap Value (NQCRX)
Allianz Global Investors Large Cap Value (ADJPX)
Cash
Davis Selected Advisers Large Cap Blend (DGOYX)
Oakmark Family of Funds Large Cap Foreign (OAKIX)
Wallace R Weitz & Co. Mid Cap Blend (WEHIX)
Delaware Management Sector (DMGIX)
Acadian Asset Mgmt Small Cap Emerging Markets (AEMGX)
Touchstone Advisors Mid Cap Blend (TEGYX)
Fred Alger Mgmt Small Cap Growth (ASIMX)
The performance data quoted represents past performance. Past performance is not a guarantee of future results. The investment return and principal value of an investment will flucturate so that an investor's shares, when redeemed, may be worth more or less than their original cost. Current performance may be lower or higher than the performance quoted. To obtain current month end performance information please visit respective manager, ETF or mutual fund websites. The before fees performance data reflects the reinvestment of dividends and other earnings but does not reflect expenses and the deduction of the maximum advisory fee of 2.75%. The return shown would be reduced by such fees and expenses if taken into consideration. This is a hypothetical example and is not representative of any specific situation. Your results will vary. Please refer to the important disclosure information at the end of this proposal.
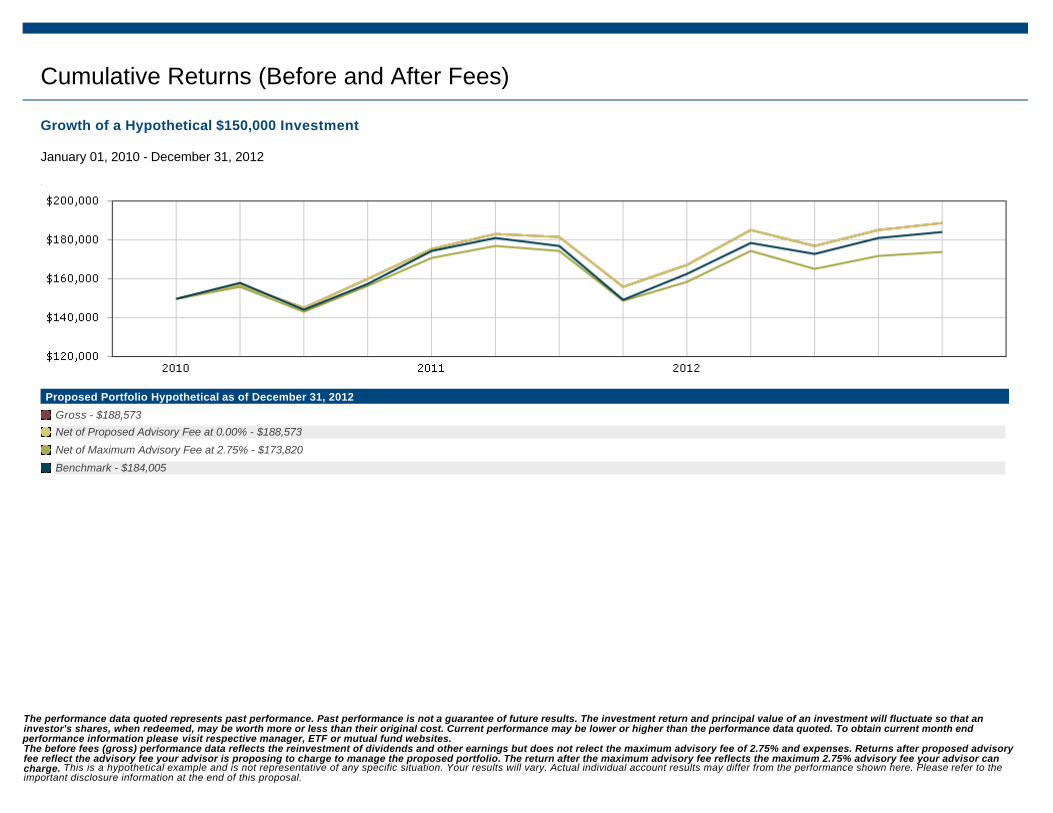
Cumulative Returns (Before and After Fees)
Growth of a Hypothetical $150,000 Investment
January 01, 2010 - December 31, 2012
Proposed Portfolio Hypothetical as of December 31, 2012
Gross - $188,573
Net of Proposed Advisory Fee at 0.00% - $188,573
Net of Maximum Advisory Fee at 2.75% - $173,820
Benchmark - $184,005
The performance data quoted represents past performance. Past performance is not a guarantee of future results. The investment return and principal value of an investment will fluctuate so that an investor's shares, when redeemed, may be worth more or less than their original cost. Current performance may be lower or higher than the performance data quoted. To obtain current month end performance information please visit respective manager, ETF or mutual fund websites. The before fees (gross) performance data reflects the reinvestment of dividends and other earnings but does not relect the maximum advisory fee of 2.75% and expenses. Returns after proposed advisory fee reflect the advisory fee your advisor is proposing to charge to manage the proposed portfolio. The return after the maximum advisory fee reflects the maximum 2.75% advisory fee your advisor can charge. This is a hypothetical example and is not representative of any specific situation. Your results will vary. Actual individual account results may differ from the performance shown here. Please refer to the important disclosure information at the end of this proposal.
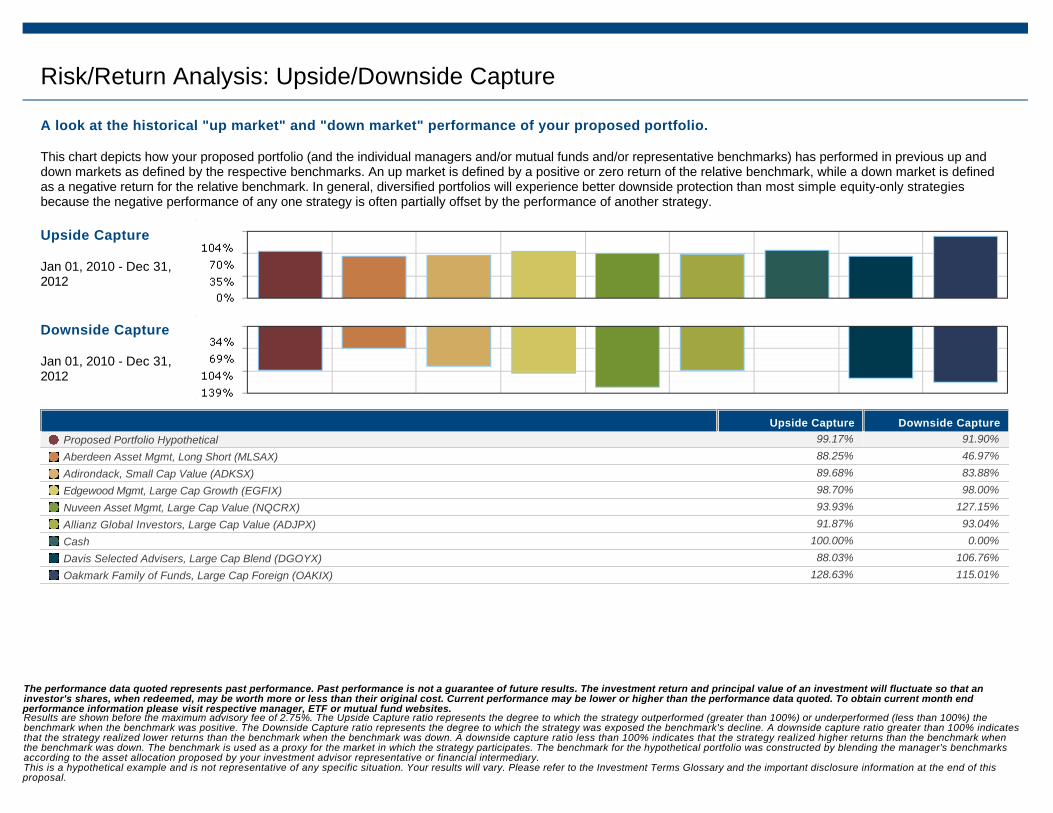
Risk/Return Analysis: Upside/Downside Capture
A look at the historical "up market" and "down market" performance of your proposed portfolio.
This chart depicts how your proposed portfolio (and the individual managers and/or mutual funds and/or representative benchmarks) has performed in previous up and down markets as defined by the respective benchmarks. An up market is defined by a positive or zero return of the relative benchmark, while a down market is defined as a negative return for the relative benchmark. In general, diversified portfolios will experience better downside protection than most simple equity-only strategies because the negative performance of any one strategy is often partially offset by the performance of another strategy.
Upside Capture
Jan 01, 2010 - Dec 31, 2012
Downside Capture
Jan 01, 2010 - Dec 31, 2012
Upside Capture Downside Capture
Proposed Portfolio Hypothetical 99.17% 91.90%
Aberdeen Asset Mgmt, Long Short (MLSAX) 88.25% 46.97%
Adirondack, Small Cap Value (ADKSX) 89.68% 83.88%
Edgewood Mgmt, Large Cap Growth (EGFIX) 98.70% 98.00%
Nuveen Asset Mgmt, Large Cap Value (NQCRX) 93.93% 127.15%
Allianz Global Investors, Large Cap Value (ADJPX) 91.87% 93.04%
Cash 100.00% 0.00%
Davis Selected Advisers, Large Cap Blend (DGOYX) 88.03% 106.76%
Oakmark Family of Funds, Large Cap Foreign (OAKIX) 128.63% 115.01%
The performance data quoted represents past performance. Past performance is not a guarantee of future results. The investment return and principal value of an investment will fluctuate so that an investor's shares, when redeemed, may be worth more or less than their original cost. Current performance may be lower or higher than the performance data quoted. To obtain current month end performance information please visit respective manager, ETF or mutual fund websites. Results are shown before the maximum advisory fee of 2.75%. The Upside Capture ratio represents the degree to which the strategy outperformed (greater than 100%) or underperformed (less than 100%) the benchmark when the benchmark was positive. The Downside Capture ratio represents the degree to which the strategy was exposed the benchmark's decline. A downside capture ratio greater than 100% indicatesthat the strategy realized lower returns than the benchmark when the benchmark was down. A downside capture ratio less than 100% indicates that the strategy realized higher returns than the benchmark when the benchmark was down. The benchmark is used as a proxy for the market in which the strategy participates. The benchmark for the hypothetical portfolio was constructed by blending the manager's benchmarks according to the asset allocation proposed by your investment advisor representative or financial intermediary. This is a hypothetical example and is not representative of any specific situation. Your results will vary. Please refer to the Investment Terms Glossary and the important disclosure information at the end of this proposal.
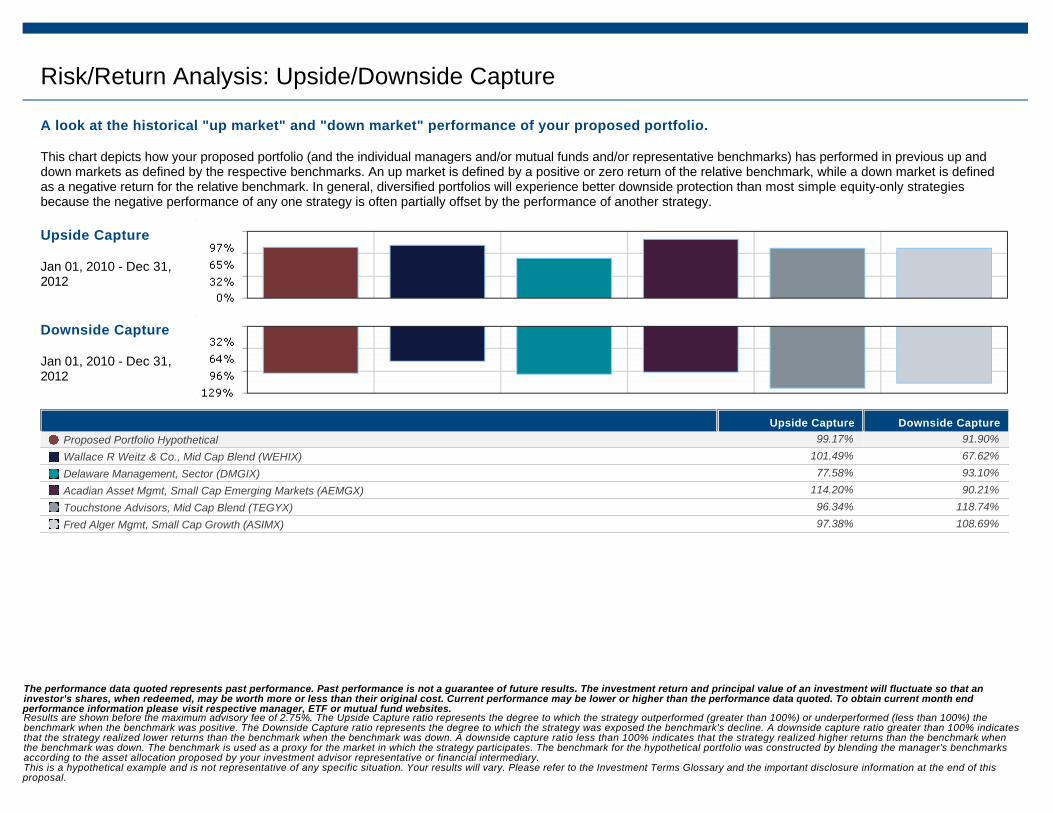
Risk/Return Analysis: Upside/Downside Capture
A look at the historical "up market" and "down market" performance of your proposed portfolio.
This chart depicts how your proposed portfolio (and the individual managers and/or mutual funds and/or representative benchmarks) has performed in previous up and down markets as defined by the respective benchmarks. An up market is defined by a positive or zero return of the relative benchmark, while a down market is defined as a negative return for the relative benchmark. In general, diversified portfolios will experience better downside protection than most simple equity-only strategies because the negative performance of any one strategy is often partially offset by the performance of another strategy.
Upside Capture
Jan 01, 2010 - Dec 31, 2012
Downside Capture
Jan 01, 2010 - Dec 31, 2012
Upside Capture Downside Capture
Proposed Portfolio Hypothetical 99.17% 91.90%
Wallace R Weitz & Co., Mid Cap Blend (WEHIX) 101.49% 67.62%
Delaware Management, Sector (DMGIX) 77.58% 93.10%
Acadian Asset Mgmt, Small Cap Emerging Markets (AEMGX) 114.20% 90.21%
Touchstone Advisors, Mid Cap Blend (TEGYX) 96.34% 118.74%
Fred Alger Mgmt, Small Cap Growth (ASIMX) 97.38% 108.69%
The performance data quoted represents past performance. Past performance is not a guarantee of future results. The investment return and principal value of an investment will fluctuate so that an investor's shares, when redeemed, may be worth more or less than their original cost. Current performance may be lower or higher than the performance data quoted. To obtain current month end performance information please visit respective manager, ETF or mutual fund websites. Results are shown before the maximum advisory fee of 2.75%. The Upside Capture ratio represents the degree to which the strategy outperformed (greater than 100%) or underperformed (less than 100%) the benchmark when the benchmark was positive. The Downside Capture ratio represents the degree to which the strategy was exposed the benchmark's decline. A downside capture ratio greater than 100% indicatesthat the strategy realized lower returns than the benchmark when the benchmark was down. A downside capture ratio less than 100% indicates that the strategy realized higher returns than the benchmark when the benchmark was down. The benchmark is used as a proxy for the market in which the strategy participates. The benchmark for the hypothetical portfolio was constructed by blending the manager's benchmarks according to the asset allocation proposed by your investment advisor representative or financial intermediary. This is a hypothetical example and is not representative of any specific situation. Your results will vary. Please refer to the Investment Terms Glossary and the important disclosure information at the end of this proposal.
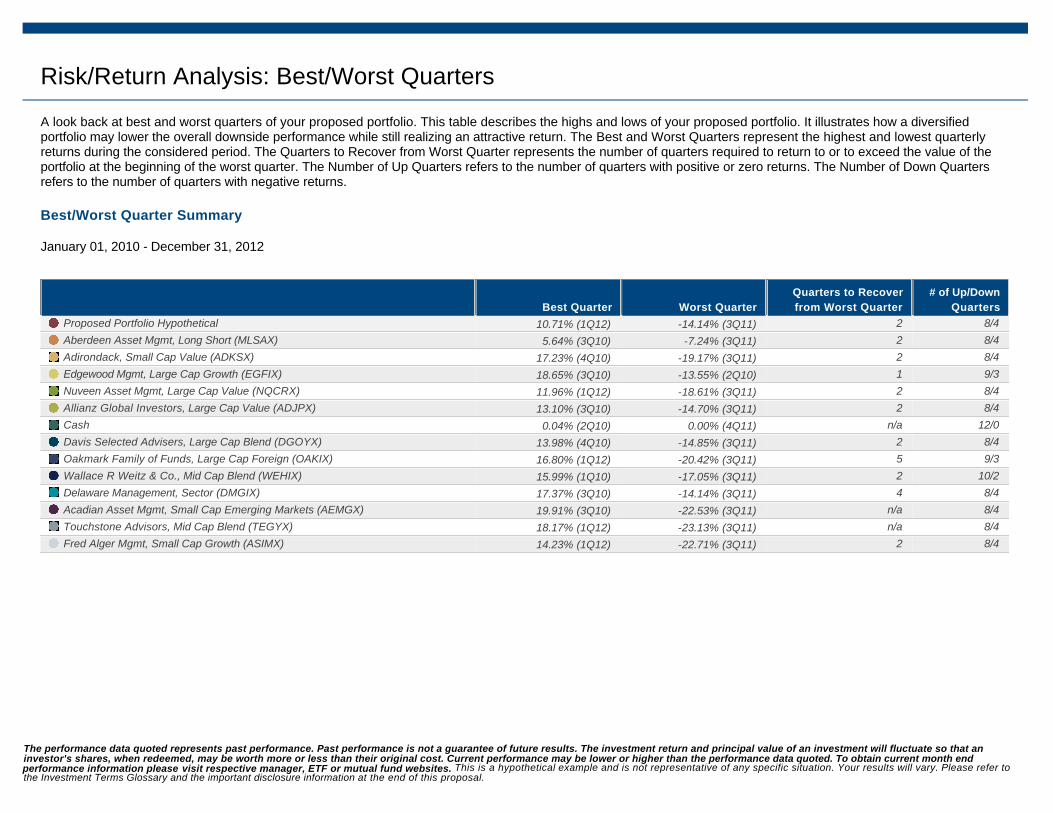
Risk/Return Analysis: Best/Worst Quarters
Best/Worst Quarter Summary
January 01, 2010 - December 31, 2012
A look back at best and worst quarters of your proposed portfolio. This table describes the highs and lows of your proposed portfolio. It illustrates how a diversified portfolio may lower the overall downside performance while still realizing an attractive return. The Best and Worst Quarters represent the highest and lowest quarterly returns during the considered period. The Quarters to Recover from Worst Quarter represents the number of quarters required to return to or to exceed the value of the portfolio at the beginning of the worst quarter. The Number of Up Quarters refers to the number of quarters with positive or zero returns. The Number of Down Quarters refers to the number of quarters with negative returns.
Best Quarter Worst Quarter
Quarters to Recover
from Worst Quarter
# of Up/Down
Quarters
Proposed Portfolio Hypothetical 10.71% (1Q12) -14.14% (3Q11) 2 8/4
Aberdeen Asset Mgmt, Long Short (MLSAX) 5.64% (3Q10) -7.24% (3Q11) 2 8/4
Adirondack, Small Cap Value (ADKSX) 17.23% (4Q10) -19.17% (3Q11) 2 8/4
Edgewood Mgmt, Large Cap Growth (EGFIX) 18.65% (3Q10) -13.55% (2Q10) 1 9/3
Nuveen Asset Mgmt, Large Cap Value (NQCRX) 11.96% (1Q12) -18.61% (3Q11) 2 8/4
Allianz Global Investors, Large Cap Value (ADJPX) 13.10% (3Q10) -14.70% (3Q11) 2 8/4
Cash 0.04% (2Q10) 0.00% (4Q11) n/a 12/0
Davis Selected Advisers, Large Cap Blend (DGOYX) 13.98% (4Q10) -14.85% (3Q11) 2 8/4
Oakmark Family of Funds, Large Cap Foreign (OAKIX) 16.80% (1Q12) -20.42% (3Q11) 5 9/3
Wallace R Weitz & Co., Mid Cap Blend (WEHIX) 15.99% (1Q10) -17.05% (3Q11) 2 10/2
Delaware Management, Sector (DMGIX) 17.37% (3Q10) -14.14% (3Q11) 4 8/4
Acadian Asset Mgmt, Small Cap Emerging Markets (AEMGX) 19.91% (3Q10) -22.53% (3Q11) n/a 8/4
Touchstone Advisors, Mid Cap Blend (TEGYX) 18.17% (1Q12) -23.13% (3Q11) n/a 8/4
Fred Alger Mgmt, Small Cap Growth (ASIMX) 14.23% (1Q12) -22.71% (3Q11) 2 8/4
The performance data quoted represents past performance. Past performance is not a guarantee of future results. The investment return and principal value of an investment will fluctuate so that an investor's shares, when redeemed, may be worth more or less than their original cost. Current performance may be lower or higher than the performance data quoted. To obtain current month end performance information please visit respective manager, ETF or mutual fund websites. This is a hypothetical example and is not representative of any specific situation. Your results will vary. Please refer to the Investment Terms Glossary and the important disclosure information at the end of this proposal.
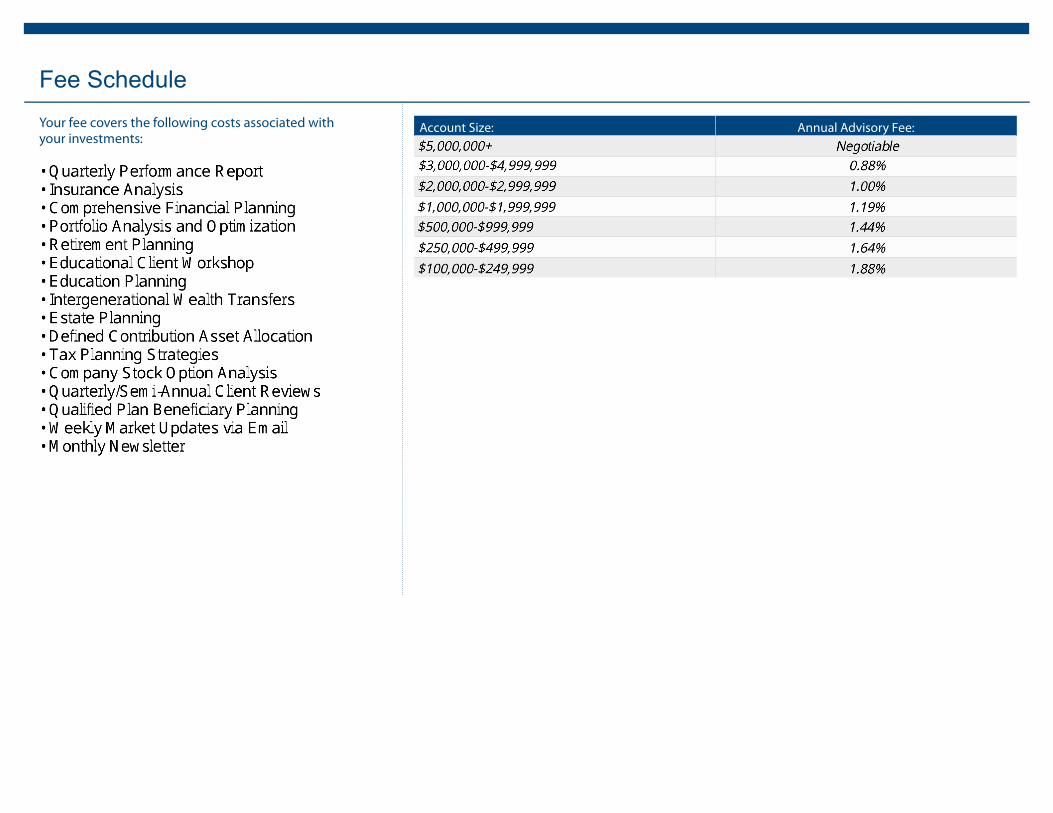
Account Size: Annual Advisory Fee:Your fee covers the following costs associated with your investments:
Fee Schedule
Investment Terms Glossary
Definition of terms used within this proposal
# of Up Periods: This measurement indicates the number of quarters the portfolio or manager has
generated a positive return over the indicated time period.
# of Down Periods: This measurement indicates the number of quarters the portfolio or manager has
generated a negative return over the indicated time period.
Best Period Return: Best Period Return indicates the manager's highest rate of return within the
selected data range.
Worst Period Return: Worst Period Return indicates the manager's lowest rate of return within the
selected data range.
Up Capture and Down Capture: These statistics measure the percentage of the manager's
benchmark return captured by the manager. More specifically, an up capture ratio of 110%
suggests that if the benchmark returns 10%, the manager would return 11%. Likewise, a
down capture ratio of 80% suggests that if the benchmark falls 10%, the manager's return
would be -8%.
Standard Deviation: Standard Deviation is a measure of dispersion around the average. It
is a good measure of the historical volatility of return earned by the given portfolio,
benchmark, or money manager during the specified trailing time period.
Average Up Return: Average Up Return measures the average return generated by the
manager during periods that the manager had a positive return.
Average Down Return: Average Down Return measures the average return generated by
the manager during periods that the manager had a negative return.
Important notes about your proposal
This material was prepared for the client whose name appears at the front of this report and is for discussion purposes only with an LPL Financial investment advisor Representative (IAR). This material
is intended to be private and confidential. Clients should read the additional information available regarding LPL Financial’s advisory programs, including the Client Agreement and LPL Financial’s Form
ADV. This report is presented for illustrative purposes to show a hypothetical portfolio, investment management selection, fee and performance information and other information directed or provided by
your IAR or financial intermediary. The investment managers and/or mutual fund providers listed herein have not reviewed, approved or endorsed this information or content in any way. No assurances
are provided regarding the completion or accuracy of any such information. This report is not a recommendation to buy or sell or a solicitation of an offer to buy or sell any securities or investment
services or to adopt any investment strategies. Past performance is no guarantee of future returns and individual client results will vary.
The universe of investments used in this proposal is platform specific. The range of choices for the centrally managed platform (OMP, PWP, MWP) is dictated by the model. For SAM and Manager Select
the universe of funds available is based on our recommended or participating managers or funds. Keep in mind, there may be additional funds or options not considered in our platform that could be
used to achieve the suggested strategy.
The annualized performance shown for each investment company has been calculated pursuant to Form N-1A and is based on information from different sources for different types of investments.
Your proposal contains performance that was generated from multiple data sources. The provider of this report cannot guarantee the accuracy or completeness of any data received from third parties.
For mutual funds and ETFs, the since inception return number shown reflects the first full calendar quarter of performance after the fund's inception date. Therefore, there could be differences
between the return number shown for such fund and the actual return of the fund since its inception date.
All separate account manager performance numbers (if applicable) represent a dollar-weighted average of all fully discretionary equity accounts managed in this investment style by that manager.
An investment in Exchange Traded Funds (ETFs), structured as a mutual fund or unit investment trust, involves the risk of losing money and should be considered as part of an overall program, not a
complete investment program. An investment in ETFs involves additional risks: not diversified, the risks of price volatility, competitive industry pressure, international political and economic developments,
possible trading halts, and index tracking error. Although many ETFs are registered under the Investment Company Act like traditional mutual funds, some ETFs, in particular those that invest in
commodities, are not registered as an investment company under the Investment Company Act. These types of ETFs may be formed as limited partnerships or grantor trusts and may have unique tax
consequences.
Investing in mutual funds involve risk, including possible loss of principal. Investments in specialized industry sectors have additional risks, which are outlined in the prospectus
Please see your IAR for additional information regarding, as applicable: the terms and fees of a managed accounts program; copies of Profiles and Form ADV, Part 2 of the investment managers listed;
prospectuses for the mutual funds listed, and/or additional performance presentations.
The period identified reflects the shortest common period of composite or mutual fund history among the composites shown (e.g., if five managers/composites or funds are selected, three with 10 year
track records, one with a 15 year track record and one with a 5 year track record, the hypothetical portfolio will show a 5 year track record only). Hypothetical portfolio returns do not reflect the result
of an actual investment program that was invested throughout the periods indicated, and may not reflect the impact that material economic and/or market factors may have had on decision making of LPL
Financial or your IAR if they had been providing advisory services throughout the periods indicated. There are no assurances that the portfolio will meet this objective and outperform your current
portfolio in the future. Individual client returns may vary significantly from the hypothetical returns represented.
Your IAR’s choice of any investment manager or mutual fund is not based on performance alone. These charts are for illustrative purposes only. The presentation is designed to illustrate one approach
to asset allocation of specific portfolios and is not a substitute for comprehensive investment planning.
Investing entails risks, including possible loss of principal. There are special risk considerations associated with international investing, high-yield bonds, technology, small-company investing, single
industry, single-country, or other special, aggressive or concentrated investment strategies.
The universe of investments used in this proposal is platform specific. The range of choices for the centrally managed platform (OMP, PWP, MWP) is dictated by the model. For SAM the universe of
funds available is based on our recommended funds. For our Manager Select platform, investments available are from our recommended or participating managers. Keep in mind, there may be additional
funds or options not considered in our platform that could be used to achieve the suggested strategy.
Important Proposal Disclosure
Investing in alternative investments may not be suitable for all investors and involves special risks, such as risks associated with leverage, selling securities short, the use of derivatives, potential
adverse market forces, regulatory changes and potential illiquidity. There are special risks associated with mutual funds that invest principally in real estate securities, such as sensitivity to changes in
real estate values and interest rates and price volatility because of the fund’s concentration in the real estate industry.
Important Proposal Disclosure
Definitions of the indices that may have been included in your portfolio
Index returns are calculated on a total-return basis with dividends reinvested. These indices are
unmanaged and are not available for direct investment. Past performance is no guarantee of future
results. Below are descriptions of various indices, some of which are referenced in this report.
Barclays Capital 1-3 Gv/Cred PIX: The Barclays 1-3 Year Government/Corporate Bond Index is a
market value weighted performance benchmark for government and corporate fixed-rate debt
issues with maturities between one and three years.
Barclays Capital 1-3 Yr Government Index: The Barclays 1-3 Year Government/Corporate Bond
Index is a market value weighted performance benchmark for government and corporate fixed-rate
debt issues with maturities between one and three years.
Barclays Capital 3-Year Municipal Bond Index: The Barclays 3 Year Municipal Index is a subset of
the Barclays Municipal Bond Index covering those issues with remaining maturities of two to three
years with total return performance.
Barclays Capital 5-Year Municipal Bond Index: This index is the 5 Year (4-6) component of the
Municipal Bond index.
Barclays Capital 7-Year Municipal Bond Index: The Barclays 7-Year Municipal Bond Index is a subset
of the Lehman Municipal Bond Index. It is an unmanaged index that tracks debt obligations of the U.S.
government with a maturity date of one to seven years.
Barclays Capital 10-Year Municipal Bond Index: An unmanaged index with maturities between nine
and twelve years. The Barclays Captial 10-Year Musincipal Bond Index is th 10-Year total return
subset of the Barclays Capital Municipal Bond Index.
Barclays Capital 1-10 Year Blend (1-12) Municipal Bond Index: The Barclays 1-10 Year Municipal
Blend Index is a market value-weighted index which covers the short and intermediate components
of the Barclays Municipal Bond Index—an unmanaged, market value-weighted index which covers
the U.S. investment-grade tax-exempt bond market. The 1-10 Year Municipal Blend index tracks tax-
exempt municipal General Obligation, Revenue, Insured, and Prerefunded bonds with a minimum $5
million par amount outstanding, issued as part of a transaction of at least $50 million, and with a
remaining maturity from 1 up to (but not including) 12 years. The index includes reinvestment of
income.
Barclays Capital CTA Index: The Barclay CTA Index is a leading industry benchmark of
representative performance of commodity trading advisors. There are currently 494 programs
included in the calculation of the Barclay CTA Index for the year 2009, which is unweighted and
rebalanced at the beginning of each year. To qualify for inclusion in the CTA Index, an advisor must
have four years of prior performance history. Additional programs introduced by qualified advisors
are not added to the Index until after their second year. These restrictions, which offset the high
HFRX: Equity Hedge Index: Equity Hedge, also known as long/short equity, combines core
long holdings of equities with short sales of stock or stock index options. Equity hedge
portfolios may be anywhere from net long to net short depending on market conditions.
Equity hedge managers generally increase net long exposure in bull markets and decrease
net long exposure or even are net short in a bear market. Generally, the short exposure is
intended to generate an ongoing positive return in addition to acting as a hedge against a
general stock market decline. Stock index put options are also often used as a hedge
against market risk. Profits are made when long positions appreciate and stocks sold short
depreciate. Conversely, losses are incurred when long positions depreciate and/or the
value of stocks sold short appreciates. Equity hedge managers' source of return is similar
to that of traditional stock pickers on the upside, but they use short selling and hedging to
attempt to outperform the market on the downside.
HFRX Quantitative Directional Index: HFRX Quantitative Directional Index, an index that
uses a methodology based on objective criteria to maximize representation of the hedge
fund universe using quantitative directional strategies analyzing price, and technical and
fundamental data.
JPMorgan EMBI Plus IX: J.P. Morgan Emerging Markets Bond Index Global (EMBI Global)
tracks total returns for U.S. dollar denominated debt instruments issued by emerging
market sovereign and quasi-sovereign entities: Brady bonds, loans, Eurobonds. Currently,
the EMBI Global covers 188 instruments across 33 countries.
ML USD LIBOR 3m Cnstnt Mat: The index is based on the assumed purchase of a synthetic
instrument having 3 months to maturity and with a coupon equal to the closing quote for 3-
Month LIBOR. That issue is sold the following day (priced at a yield equal to the current
day closing 3-Month LIBOR rate) and is rolled into a new 3-Month instrument. The index,
therefore, will always have a constant maturity equal to exactly 3 months. (source:
www.bankofamerica.com)
MSCI AC World GD IX: The MSCI ACWI Index is a free float-adjusted market capitalization
weighted index that is designed to measure the equity market performance of developed
and emerging markets. The MSCI ACWI consists of 45 country indices comprising 24
developed and 21 emerging market country indices. The developed market country indices
included are: Australia, Austria, Belgium, Canada, Denmark, Finland, France, Germany,
Greece, Hong Kong, Ireland, Israel, Italy, Japan, Netherlands, New Zealand, Norway,
Portugal, Singapore, Spain, Sweden, Switzerland, the United Kingdom and the United
States. The emerging market country indices included are: Brazil, Chile, China, Colombia,
Czech Republic, Egypt, Hungary, India, Indonesia, Korea, Malaysia, Mexico, Morocco, Peru,
Philippines, Poland, Russia, South Africa, Taiwan, Thailand, and Turkey.
Index Definitions
turnover rates of trading advisors as well as their artificially high short-term performance records,
ensure the accuracy and reliability of the Barclay CTA Index.
Barclays Capital Fixed Rate MBS: This index is the U.S. MBS component of the U.S. Aggregate index.
The MBS Index covers the mortgage-backed pass-through securities of Ginnie Mae (GNMA), Fannie
Mae (FNMA), and Freddie Mac (FHLMC).
Barclays Capital Government/Credit Index: This index includes treasuries (i.e., public obligations of
the U.S. Treasury that have remaining maturities of more than one year) and agencies (i.e., publicly
issued debt of U.S. Government agencies, quasi-federal corporations, and corporate or foreign debt
guaranteed by the U.S. Government). The Credit Index includes publicly issued U.S. corporate and
foreign debentures and secured notes that meet specified maturity, liquidity, and quality requirements
Barclays Capital Gov/Credit Intermediate Index: The Barclays Government/Credit Intermediate Index is
a market value weighted performance benchmark for government and corporate fixed-rate debt
issues with maturities between one and 10 years.
Barclays Capital Gov/Credit Long Term Index: The Barclays Long-Term Government/Corporate Bond
Index - is an unmanaged index that includes fixed rate debt issues rated investment grade or higher
by Moody's Investors Services, Standard & Poor's Corporation or Fitch Investor's Service, in order.
Long-term indices include bonds with maturities of ten years or longer. Investors cannot invest
directly in this index.
Barclay Capital Int US Gv/Cr TRIX: Barclay’s Capital Intermediate U.S. Government/Credit Index: This
index includes securities in the Government and Credit Indices with a maturity from 1 up to 10 years.
Barclays Capital High Yield Bond Index: The Barclays Capital High Yield Index covers the universe of
publicly issued debt obligations rated below investment grade. Bonds must be rated below
investment-grade, or high-yield (Ba1/BB+ or lower), by at least two of the following ratings
agencies: Moody's, S&P, Fitch. Bonds must also have at least one year to maturity, have at least
$150 million in par value outstanding, and must be U.S. dollar denominated and non-convertible.
Bonds issued by countries designated as emerging markets are excluded.
Barclays Capital High Yield U.S. Corporate Index: The Barclays U.S. Corporate High Yield Index
covers the USD-denominated, non-investment grade, fixed-rate, taxable corporate bond market.
Securities are classified as high-yield if the middle rating of Moody’s, Fitch, and S&P is Ba1/BB+/BB+
or below. The index excludes Emerging Markets debt. The index was created in 1986, with index
history backfilled to January 1, 1983. The U.S. Corporate High Yield Index is part of the U.S.
Universal and Global High Yield Indices.
Barclays Capital Municipals Index: The Barclays Municipal Bond Index is a market capitalization-
weighted index of investment-grade municipal bonds with maturities of at least one year. All indices
are unmanaged and include reinvested dividends. One cannot invest directly in an index. Past
performance is no guarantee of future results.
MSCI AC World IMI: The MSCI All Country World Index is an unmanaged, free float-adjusted
market capitalization weighted index composed of stocks of companies located in
countries throughout the world. It is designed to measure equity market performance in
global developed and emerging markets. The index includes reinvestment of dividends, net
of foreign withholding taxes.
MSCI AC World Index: The MSCI All Country World Index is an unmanaged, free float-
adjusted market capitalization weighted index composed of stocks of companies located in
countries throughout the world. It is designed to measure equity market performance in
global developed and emerging markets. The index includes reinvestment of dividends, net
of foreign withholding taxes.
MSCI AC World Small Cap Growth: The MSCI Small Cap Index target 40% of the eligible
Small Cap universe within each industry group, within each country. MSCI defines the
Small Cap universe as all listed securities that have a market capitalization in the range of
USD200-1,500 million.
MSCI EAFE: MSCI EAFE is made up of approximately 1,045 equity securities issued by
companies located in 19 countries and listed on the stock exchanges of Europe, Australia,
and the Far East. All values are expressed in U.S. dollars. All values are expressed in US
dollars. Past performance is no guarantee of future results.
MSCI Emerging Markets Free: The MSCI Emerging Markets Index is a free float-adjusted
market capitalization index that is designed to measure equity market performance in the
global emerging markets. As of May 2005 the MSCI Emerging Markets Index consisted of
the following 26 emerging market country indices: Argentina, Brazil, Chile, China, Colombia,
Czech Republic, Egypt, Hungary, India, Indonesia, Israel, Jordan, Korea, Malaysia, Mexico,
Morocco, Pakistan, Peru, Philippines, Poland, Russia, South Africa, Taiwan, Thailand,
Turkey and Venezuela.
MSCI World Index: The MSCI World Index (Europe, Australasia, Far East) is a free float-
adjusted market capitalization index that is designed to measure developed market equity
performance, excluding the US & Canada. As of June 2006 the MSCI EAFE Index
consisted of the following 21 developed market country indices: Australia, Austria,
Belgium, Denmark, Finland, France, Germany, Greece, Hong Kong, Ireland, Italy, Japan, the
Netherlands, New Zealand, Norway, Portugal, Singapore, Spain, Sweden, Switzerland
and the United Kingdom.
Russell 1000® Index: The Russell 1000 Index consists of the 1,000 largest securities in the
Russell 3000 Index, which represents 90% of the total market capitalization of the Russell
3000 Index. It is a large-cap, market oriented index and is highly correlated with the S&P
500 Index.
Index Definitions
Barclays Capital US Aggregate Bond Index: This Barclays Aggregate Bond Index represents
securities that are SEC-registered, taxable, and dollar denominated. The index covers the U.S.
investment-grade fixed rate bond market, with index components for government and corporate
securities, mortgage pass-through securities, and asset-backed securities.
Barclay Capital US Lg Gv/Cr TRIX: This index includes securities in the Government and Credit
Indices with a maturity greater than 10 years.
Barclay Capital US MBS FxRt TRIX: The Barclays Mortgage-backed Securities Index is a market
value-weighted index which covers the mortgage-backed securities component of the Barclays U.S.
Aggregate Bond Index. The index is composed of agency mortgage-backed passthrough securities
of the Government National Mortgage Association (Ginnie Mae), the Federal National Mortgage
Association (Fannie Mae), and the Federal Home Loan Mortgage Corporation (Freddie Mac) with a
minimum $150 million par amount outstanding and a weighted-average maturity of at least 1 year. The
index includes reinvestment of income.
BofA ML Convertible Bonds All Qualities: The Merrill Lynch All Convertibles All Qualities Index is a
widely used, unmanaged index that measures convertible securities’ performance. It measures the
performance of U.S. dollar-denominated convertible securities not currently in bankruptcy with a total
market value greater than $50 million at issuance. It is unmanaged and unavailable for investment.
(source: www.bankofamerica.com).
BofA Merrill Lynch High Yield: The BofA Merrill Lynch U.S. High Yield BB-B (Constrained 2%) Index
contains all securities in the BofA Merrill Lynch U.S. High Yield Index rated BB+ through B- by S&P
(or equivalent as rated by Moody’s or Fitch), but caps issuer exposure at 2%. Index constituents are
capitalization-weighted, based on their current amount outstanding, provided the total allocation to an
individual issuer does not exceed 2%.
Citigroup High-Yield Market: The US High-Yield Market Index captures the performance of below-
investment-grade debt issued by corporations domiciled in the United States or Canada. This index is
our broadest high-yield market measure and includes cash-pay and deferred-interest securities. All
the bonds are publicly placed, have a fixed coupon, and are nonconvertible. Bonds issued under
Rule 144A are included in their unregistered form.
Citigroup Non-US WGBI Hedged: Citigroup World Government Bond ex-U.S. Index (Hedged): The
Citigroup World Government Bond ex-U.S. Index (Hedged) is a market capitalization weighted index
consisting of the government bond markets of the following countries: Australia, Austria, Belgium,
Canada, Denmark, Finland, France, Germany, Ireland, Italy, Japan, the Netherlands, Portugal, Spain,
Sweden, Switzerland, and the United Kingdom. Country eligibility is determined based on market
capitalization and investability criteria. All issues have a remaining maturity of at least one year.
Citigroup Non-US WGBI Unhedged: The Citigroup World Government Bond Index ex-US – Unhedged
Index is a market capitalization weighted index consisting of the government bonds of the following
countries: Austria, Belgium, Canada, Denmark, Finland, France, Germany, Greece, Ireland, Italy,
Russell 1000® Growth Index: Russell 1000® Growth Index measures the performance of
those Russell 1000 companies with higher price-to-book ratios and higher forecasted
growth values.
Russell 1000® Value Index: Russell 1000® Value Index measures the performance of
those Russell 1000 companies with lower price-to-book ratios and lower forecasted
growth values.
Russell 2000® Index: The Russell 2000 Index is an unmanaged index generally
representative of the 2,000 smallest companies in the Russell Index, which represents
approximately 10% of the total market capitalization of the Russell 3000 Index.
Russell 2000® Growth Index: Russell 2000® Growth Index measures the performance of
those Russell 2000 companies with higher price-to-book ratios and higher forecasted
growth values.
Russell 2000® Value Index: Russell 2000® Value Index measures the performance of
those Russell 2000 companies with lower price-to-book ratios and lower forecasted
growth values.
Russell 2500® Index: The Russell 2500 Index measures the performance of the small to
mid-cap segment of the U.S. equity universe, commonly referred to as ""smid"" cap. The
Russell 2500 is a subset of the Russell 3000® Index. It includes approximately 2500 of the
smallest securities based on a combination of their market cap and current index
membership.
Russell 2500® Growth Index: The Russell 2500 Growth Index measures the performance
of the small to mid-cap growth segment of the U.S. equity universe. It includes those
Russell 2500 Index companies with higher price-to-book ratios and higher forecasted
growth values.
Russell 3000® Index: The Russell 3000 Index measures the performance of the 3,000
largest U.S. companies based on total market capitalization, which represents
approximately 98% of the investable U.S. equity market. As of the latest reconstitution, the
average market capitalization was approximately $4 billion; the median market capitalization
was approximately $700 million. The index had a total market capitalization range of
approximately $309 billion to $128 million.
Russell 3000® Growth Index: The Russell 3000 Growth Index measures the performance
of the broad growth segment of the U.S. equity universe. It includes those Russell 3000
Index companies with higher price-to-book ratios and higher forecasted growth values.
Russell 3000® Value Index: The Russell 3000 Value Index measures the performance of
those Russell 3000 companies with lower price-to-book rations and lower forecasted
growth values.
Index Definitions
Japan, the Netherlands, Norway, Poland, Portugal, Singapore, Spain, Sweden, Switzerland, and the
United Kingdom.
Citigroup WBIG (World Broad Investment Grade): The Citigroup World Broad Investment-Grade
(WorldBIG) index is constructed using the World Government Bond Index (WGBI) as the core.
Additional sectors of the broad family of indexes are added to the WBGI creating the WorldBIG Index.
The major indexes that make up the WorldBIG include the following; WBGI, USBIG, EuroBIG, Euroyen,
Eurodollar and Eurosterling.
DJ UBS Commodity TR IX: The Dow Jones - UBS Commodity Index is composed of futures contracts
on 19 physical commodities. Unlike equities, which entitle the holder to a continuing stake in a
corporation, commodity futures contracts specify a delivery date for the underlying physical
commodity. In order to avoid delivery and maintain a long futures position, nearby contracts must be
sold and contracts that have not yet reached the delivery period must be purchased. This process is
known as "rolling" a futures position. The DJ-AIGCI is a "rolling index."The DJ-AIGCI is composed of
commodities traded on U.S. exchanges, with the exception of aluminum, nickel and zinc, which trade
on the London Metal Exchange (LME). Trading hours for the U.S. commodity exchanges are between
8:00 am and 3:00 pm ET. A daily settlement price for the index is published at approximately 5:00 pm
ET.
Dow Jones Commodity TR: The Dow Jones Commodity Index is a broadly diversified index that
allows investors to track commodity futures through a single, simple measure
FTSE Gold Mine: The index series encompasses all gold mining companies that have a sustainable
and attributable gold production of at least 300,000 ounces a year, and that derive 51% or more of
their revenue from mined gold. (source: www.FTSE.com)
FTSE NAREIT All Eq TR IX: The NAREIT Equity REIT Index is an unmanaged index consisting of certain
companies that own and operate income-producing real estate and have 75% or more of their
respective gross invested assets in the equity or mortgage debt, respectively, of commercial
properties.
HFRI FOF: Conservative Index: FOFs classified as "Conservative" exhibit one or more of the
following characteristics: seeks consistent returns by primarily investing in funds that generally
engage in more "conservative" strategies such as Equity Market Neutral, Fixed Income Arbitrage, and
Convertible Arbitrage; exhibits a lower historical annual standard deviation than the HFRI Fund of
Funds Composite Index. A fund in the HFRI FOF Conservative Index shows generally consistent
performance regardless of market conditions.
HFRI Fund of Funds Composite Index: Includes over 600 constituent funds. Includes both domestic
and offshore funds. Equal-weighted Index. All funds report assets in USD. Only Fund of Funds
included in Index. All funds report Net of All Fees returns on a monthly basis. Have at least $50
Million under management or have been actively trading for at least twelve (12) months (source:
www.hedgefundresearch.com)
Russell Midcap® Index: The Russell Mid Cap Index offers investors access to the mid cap
segment of the U.S. equity universe. The Russell Mid Cap Index is constructed to provide a
comprehensive and unbiased barometer for the mid-cap segment and is completely
reconstituted annually to ensure larger stocks do not distort the performance and
characteristics of the true mid cap opportunity set. The Russell Mid Cap Index includes the
smallest 800 securities in the Russell 1000.
Russell Midcap® Growth Index: The Russell Mid Cap Growth Index offers investors
access to the mid-cap growth segment of the U.S. equity universe. The Russell Mid Cap
Growth Index is constructed to provide a comprehensive and unbiased barometer of the
mid-cap growth market. Based on ongoing empirical research of investment manager
behavior, the methodology used to determine growth probability approximates the
aggregate mid-cap growth manager's opportunity set.
Russell Midcap® Value Index: The Russell Mid Cap Value Index offers investors access to
the mid cap value segment of the U.S. equity universe. The Russell Mid Cap Value Index is
constructed to provide a comprehensive and unbiased barometer of the mid cap value
market. Based on ongoing empirical research of investment manager behavior, the
methodology used to determine value probability approximates the aggregate mid cap
value manager's opportunity set.
S&P 500: The S&P 500 Index is a capitalization-weighted index of 500 stocks designed to
measure performance of the broad domestic economy through changes in the aggregate
market value of 500 stocks representing all major industries.
S&P Natural Resources: The index includes 90 of the largest publicly-traded companies in
natural resources and commodities businesses that meet specific investability
requirements, offering investors diversified and investable equity exposure across 3
primary commodity-related sectors: agribusiness, energy, and metals & mining. (Source: S&P Dow Jones Indices).
S&P U.S. REIT Composite: The S&P REIT Composite ia designed as a market indicator,
contains securities selected for market representation according to geography and
property type. Equity REITs currently compose approximately 95% of the S&P REIT
Composite. Hybrid and mortgage REITs balance out the remainder of the index, but are
gradually being phased out so that the Composite focuses exclusively on the equity REIT
market.
S&P 500 Util Sec TR IX: The S&P Utilities Index is comprised primarily of companies
involved in water and electrical power and natural gas distribution industries.
Salomon Bros. Non $ World Govt. Bond Index (Unhedged): This index covers the available
market for domestic government bonds in 13 countries: Japan, Germany, France, UK,
Canada, Italy, Australia, Belgium, Denmark, Netherlands, Spain, Sweden and Austria.
Index Definitions
HFRI Equity Hedge Index: An equally weighed hedge fund performance index. Equity Hedge, also
known as long/short equity, combines core long holdings of equities with short sales of stock or
stock index options. Equity hedge portfolios may be anywhere from net long to net short depending
on market conditions.
HRFI Fund of Hedge Fund Index: An equally weighted hedge fund performance index, which invest
with multiple managers through funds or managed accounts. The strategy designs a diversified
portfolio of managers with the objective of significantly lower the risk (volatility) of investing with an
individual manager.
HFRX Absolute Return Index: The HFRX Absolute Return Index and the HFRX Market Directional
Index represent "opposing" classes of hedge funds: those that seek stable performance regardless
of market conditions (the "absolute return funds") and those that add value by participating in moves
in the financial markets (the "directional funds"). The difference between the two classes becomes
apparent in various statistics describing performance - absolute return funds tend to be
considerably less volatile and correlate less to major market benchmarks than directional funds.
Treasury Bills: Treasury Bills are short-term government securities usually sold with three-
, six-, or twelve-month maturities. They are available in $10,000 minimum amounts and
additional multiples of $5,000. They are issued at a discount and mature at face value. The
difference between issue price and maturation value is interest earned.
T-Bill 3 Month TR IX: A short-term debt obligation backed by the U.S. government with a
maturity of less than one year. T-bills are sold in denominations of $1,000 up to a maximumpurchase of $5 million and commonly have maturities of one month (four weeks), three months (13 weeks) or six months (26 weeks).
Wilshire Real Estate Securities Index: A capitalization-weighted index that measures the
performance of publicly traded real estate securities such as Real Estate Investment
Trusts (REITs) and Real Estate Operating Companies (REOCs).
Index Definitions