Study of Neutrino-Induced Neutral Current Neutral Pion Production ...
Page 1 of 26
07 January 2016
HLIB Research
PP 9484/12/2012 (031413)
Property (Neutral; ) INDUSTRY INSIGHT 7 January 2016
January 7, 2016
2016 – Another Challenging Year…
Highlights
Recapping 2015… Property companies underperformed FBM KLCI Index in 2015 with average return of -7.3 % versus FBM KLCI at -3.4%. Property outlook suffered further weakness in 2H15 with lower consumer sentiment arising from GST imposition, poorer macro environment (i.e. 1MDB, plunge in crude oil price) and weakening Ringgit.
HPI growth normalises back to long-term growth rate … Annual house price index (HPI) growth eased to 5.4% in 3Q15 after rising by CAGG of 12.6% from 2010 – 2014. Going forward. we expect HPI growth rate to normalise back to 10-year CAGR of circa 5%
Leading loan indicators remain weak… Leading indicators such as loan application remain sluggish, declining YoY basis for tenth straight month. Furthermore, tighter bank lending further dampened property sales with approval rate persistently below 50%.
Supply continues to accelerate…In 3Q15, supply continues to accelerate with incoming supply reach 870k, representing 18% of Malaysia’s existing stocks, the highest since 2004.
Johor remains oversupplied in near term… Johor region seems to remain oversupplied with incoming supply and planned supply amounting to 47% of existing stock. This is mainly concentrated in the high rise segment (~circa 41% of total incoming supply).
KL and Selangor remain core market with more balanced demand and supply dynamics… In the next 5 years, demand would outstrip supply due to urbanization and improving infrastructure. Under ETP program, the government aims to grow the Greater KL population to 10m by 2020 from an estimated 8m currently. This would translate into annual housing demand of 100k unit p.a., almost matching the total completion for whole country in 2014.
Some property stocks are trading close to 5 years historical low of P/B band… Property stocks such as IOI Properties, Mahsing and YNH are trading close to their 5 years historical low of P/B valuation band.
Prefer companies that… concentrated towards affordable housings, landed properties and township developments for resilient future sales and earnings.
Rating NEUTRAL ()
Positives: Favourable demographics with housing inflation hedge; increased opportunities within the affordable/mass market segment.
Negatives: Prolonged weakening in consumer sentiment and tightening policy from government.
Valuation Top picks: IOI Prop (BUY; TP: 2.77) and Matrix Concepts (BUY; TP:RM2.90).
We maintain most of our recommendations with Matrix Concepts upgraded from HOLD to BUY (dividend yield one of the highest in the sector at 7%). YNH is upgraded from SELL to HOLD (TP:1.85).
Jason, CFA
(603) 2176 2751
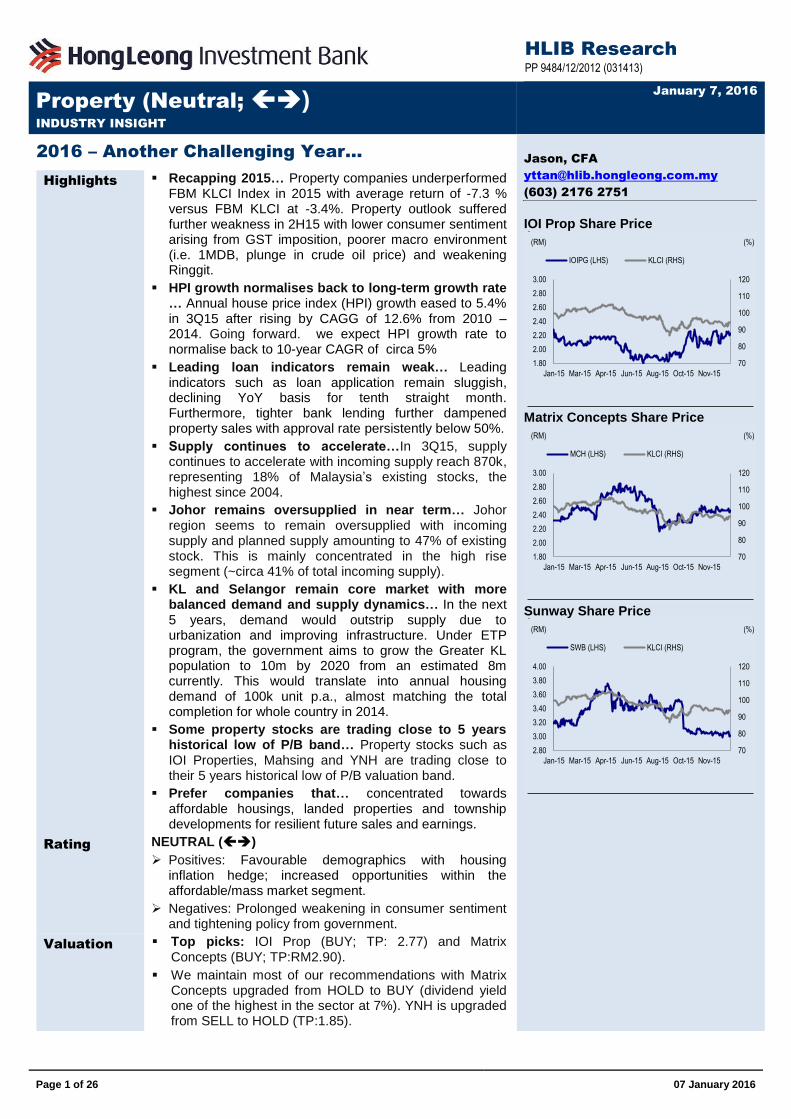
IOI Prop Share Price
70
80
90
100
110
120
1.80
2.00
2.20
2.40
2.60
2.80
3.00
Jan-15 Mar-15 Apr-15 Jun-15 Aug-15 Oct-15 Nov-15
(%)(RM)
IOIPG (LHS) KLCI (RHS)
Matrix Concepts Share Price
70
80
90
100
110
120
1.80
2.00
2.20
2.40
2.60
2.80
3.00
Jan-15 Mar-15 Apr-15 Jun-15 Aug-15 Oct-15 Nov-15
(%)(RM)
MCH (LHS) KLCI (RHS)
Sunway Share Price
70
80
90
100
110
120
2.80
3.00
3.20
3.40
3.60
3.80
4.00
Jan-15 Mar-15 Apr-15 Jun-15 Aug-15 Oct-15 Nov-15
(%)(RM)
SWB (LHS) KLCI (RHS)

HLIB Research | Property
www.hlebroking.com
Page 2 of 26
07 January 2016
Recapping 2015
Property companies underperformed FBM KLCI Index in 2015 with average return of -7.3 % versus FBM KLCI at -3.4% (Figure 1). The underperformance was not unexpected after the government implemented cooling policy in budget 2014 coupled. Consumer sentiment was further dampened with interest rate hike in Jul 14 and GST implementation in Apr 15. In view of the cautious consumer sentiment, developers deferred major launches to 2H15. Property outlook suffered further weakness in 2H15 with poorer macro issues (i.e. 1MDB issue and plunge in crude oil price) and weakening Ringgit.
Figure 1: FBMKLCI and KLPRP Index Performance
-7
-6
-5
-4
-3
-2
-1
0
1
2
80
85
90
95
100
105
110
115
120
J-15 F-15 M-15 A-15 M-15 J-15 J-15 A-15 S-15 O-15 N-15 D-15
PtsPtsKLCI Index KLPRP Index Relative Perf.
Source: Bloomberg, HLIB.
Among the property stocks, large cap companies underperformed FBM KLCI by an average of 5.4%. UEM Sunrise was the worst performer with share price falling by 26% in a year mainly due to its land concentration in Johor due to concern about oversupply (Figure 2). Sunway outperformed by 8.7% due to its active capital management to reward shareholders (value unlocking exercise by listing of Sunway Construction with special dividend).
Figure 2: Property Stocks Relative Performance Vs. FBM KLCI (Large
Cap)
Market Cap Price Absolute Return
Large Cap (RM m) (RM) 1 month 3 month 1 year 1 year
SP SETIA BHD 8,306 3.2 1.6 (5.0) 2.0 (3.0)
IOI PROPERTIES 8,625 2.3 2.2 9.1 (3.4) (8.1)
SUNWAY BHD 5,428 3.1 0.6 (8.5) 8.7 3.3
UEM SUNRISE BHD 4,991 1.1 (0.5) (6.3) (22.0) (25.8)
MAH SING GROUP 3,277 1.4 2.0 2.2 (11.9) (16.2)
ECO WORLD DEVELO 3,405 1.4 3.4 (4.9) (14.2) (18.4)
UOADEV 3,267 2.2 (3.9) 5.2 3.2 (1.9)
Average 0.8 (1.2) (5.4) (10.0)
Relative Performance %
Source: Bloomberg, HLIB.
Property companies
underperformed FBM
KLCI Index in 2015 with
average return of -7.3 %
versus FBM KLCI at -
3.4%.
Large cap companies
underperformed FBM
KLCI by average 5.4%.
HLIB Research | Property
www.hlebroking.com
Page 3 of 26
07 January 2016
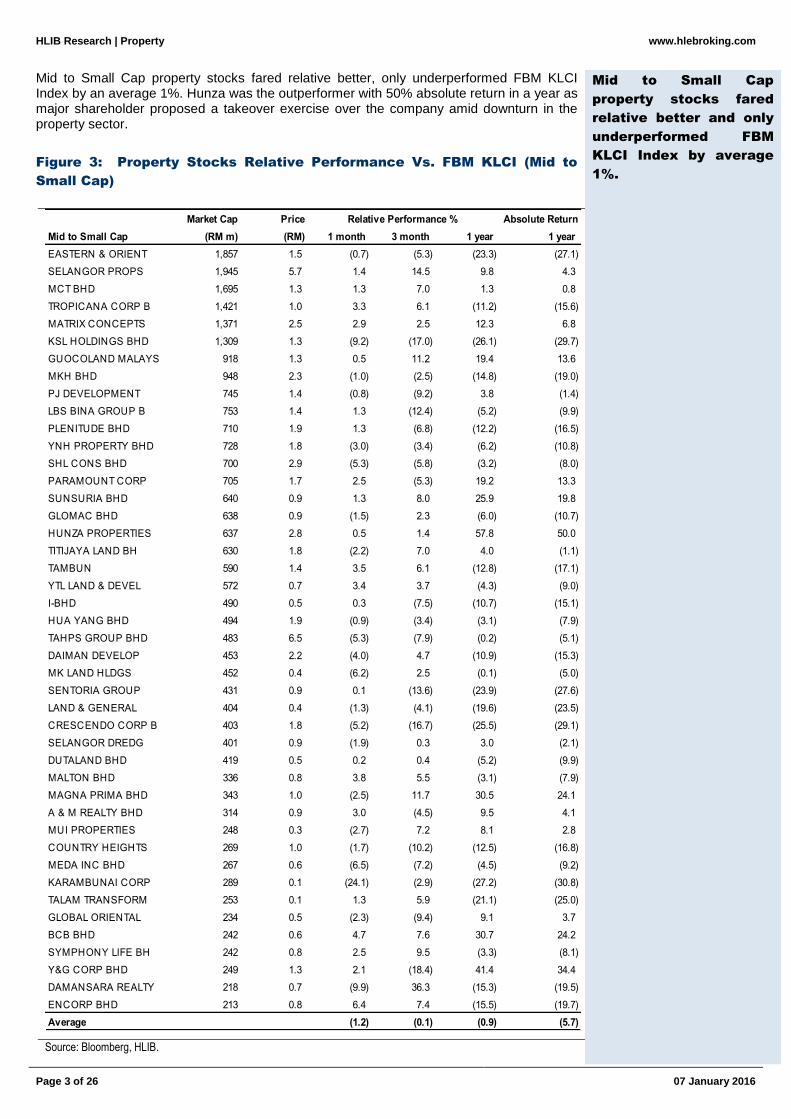
Mid to Small Cap property stocks fared relative better, only underperformed FBM KLCI Index by an average 1%. Hunza was the outperformer with 50% absolute return in a year as major shareholder proposed a takeover exercise over the company amid downturn in the property sector.
Figure 3: Property Stocks Relative Performance Vs. FBM KLCI (Mid to
Small Cap)
Market Cap Price Absolute Return
Mid to Small Cap (RM m) (RM) 1 month 3 month 1 year 1 year
EASTERN & ORIENT 1,857 1.5 (0.7) (5.3) (23.3) (27.1)
SELANGOR PROPS 1,945 5.7 1.4 14.5 9.8 4.3
MCT BHD 1,695 1.3 1.3 7.0 1.3 0.8
TROPICANA CORP B 1,421 1.0 3.3 6.1 (11.2) (15.6)
MATRIX CONCEPTS 1,371 2.5 2.9 2.5 12.3 6.8
KSL HOLDINGS BHD 1,309 1.3 (9.2) (17.0) (26.1) (29.7)
GUOCOLAND MALAYS 918 1.3 0.5 11.2 19.4 13.6
MKH BHD 948 2.3 (1.0) (2.5) (14.8) (19.0)
PJ DEVELOPMENT 745 1.4 (0.8) (9.2) 3.8 (1.4)
LBS BINA GROUP B 753 1.4 1.3 (12.4) (5.2) (9.9)
PLENITUDE BHD 710 1.9 1.3 (6.8) (12.2) (16.5)
YNH PROPERTY BHD 728 1.8 (3.0) (3.4) (6.2) (10.8)
SHL CONS BHD 700 2.9 (5.3) (5.8) (3.2) (8.0)
PARAMOUNT CORP 705 1.7 2.5 (5.3) 19.2 13.3
SUNSURIA BHD 640 0.9 1.3 8.0 25.9 19.8
GLOMAC BHD 638 0.9 (1.5) 2.3 (6.0) (10.7)
HUNZA PROPERTIES 637 2.8 0.5 1.4 57.8 50.0
TITIJAYA LAND BH 630 1.8 (2.2) 7.0 4.0 (1.1)
TAMBUN 590 1.4 3.5 6.1 (12.8) (17.1)
YTL LAND & DEVEL 572 0.7 3.4 3.7 (4.3) (9.0)
I-BHD 490 0.5 0.3 (7.5) (10.7) (15.1)
HUA YANG BHD 494 1.9 (0.9) (3.4) (3.1) (7.9)
TAHPS GROUP BHD 483 6.5 (5.3) (7.9) (0.2) (5.1)
DAIMAN DEVELOP 453 2.2 (4.0) 4.7 (10.9) (15.3)
MK LAND HLDGS 452 0.4 (6.2) 2.5 (0.1) (5.0)
SENTORIA GROUP 431 0.9 0.1 (13.6) (23.9) (27.6)
LAND & GENERAL 404 0.4 (1.3) (4.1) (19.6) (23.5)
CRESCENDO CORP B 403 1.8 (5.2) (16.7) (25.5) (29.1)
SELANGOR DREDG 401 0.9 (1.9) 0.3 3.0 (2.1)
DUTALAND BHD 419 0.5 0.2 0.4 (5.2) (9.9)
MALTON BHD 336 0.8 3.8 5.5 (3.1) (7.9)
MAGNA PRIMA BHD 343 1.0 (2.5) 11.7 30.5 24.1
A & M REALTY BHD 314 0.9 3.0 (4.5) 9.5 4.1
MUI PROPERTIES 248 0.3 (2.7) 7.2 8.1 2.8
COUNTRY HEIGHTS 269 1.0 (1.7) (10.2) (12.5) (16.8)
MEDA INC BHD 267 0.6 (6.5) (7.2) (4.5) (9.2)
KARAMBUNAI CORP 289 0.1 (24.1) (2.9) (27.2) (30.8)
TALAM TRANSFORM 253 0.1 1.3 5.9 (21.1) (25.0)
GLOBAL ORIENTAL 234 0.5 (2.3) (9.4) 9.1 3.7
BCB BHD 242 0.6 4.7 7.6 30.7 24.2
SYMPHONY LIFE BH 242 0.8 2.5 9.5 (3.3) (8.1)
Y&G CORP BHD 249 1.3 2.1 (18.4) 41.4 34.4
DAMANSARA REALTY 218 0.7 (9.9) 36.3 (15.3) (19.5)
ENCORP BHD 213 0.8 6.4 7.4 (15.5) (19.7)
Average (1.2) (0.1) (0.9) (5.7)
Relative Performance %
Source: Bloomberg, HLIB.
Mid to Small Cap
property stocks fared
relative better and only
underperformed FBM
KLCI Index by average
1%.

HLIB Research | Property
www.hlebroking.com
Page 4 of 26
07 January 2016
Annual house price index (HPI) growth eased to 5.4% in 3Q15 after rise by a CAGG of 12.6% from 2010 – 2014 (Figure 4). This is a reflection of the series of cooling measures undertaken by the government which have been effective in bringing property prices under control. Measures announced during 2014 Budget include higher RPGT rates, higher minimum price for foreigners, disclosure of detailed sales price and the ban of DIBS scheme. To note, 10-year long term CAGR HPI growth rate averages about 4.8%. Going forward, we do not expect the above-average growth seen in 2010-2015 to be repeated. We expect HPI growth rate to normalise back to the 10-year CAGR of circa 5%. We also expect housing demand to emanate primarily from genuine house buyer while speculative investors hold back their purchases, contributing to a single-digit growth pace in HPI.
Figure 4: Malaysia House Price Index (HPI)
0.0
2.0
4.0
6.0
8.0
10.0
12.0
14.0
-
50.0
100.0
150.0
200.0
250.0
2000 2001 2002 2003 2004 2005 2006 2007 2008 2009 2010 2011 2012 2013 2014
Malaysia HPI (LHS) YoY Chg (RHS)
Source: Bloomberg, HLIB.
In term of HPI growth breakdown by state, Johor suffered the most significant moderation, easing to 3% growth in 3Q15 (3Q14: +11.2%). This is mainly due to oversupply situation in Johor and growth normalisation after a spike in 4Q12-1Q14 period (average of 20% YoY growth/quarter).
Figure 5: Malaysia House Price Index (HPI) Breakdown by State
0.0
5.0
10.0
15.0
20.0
25.0
30.0
1Q10
2Q10
3Q10
4Q10
1Q11
2Q11
3Q11
4Q11
1Q12
2Q12
3Q12
4Q12
1Q13
2Q13
3Q13
4Q13
1Q14
2Q14
3Q14
4Q14
1Q15
2Q15
3Q15
Kuala Lumpur Selangor Johor Pulau Pinang
Source: Bloomberg, HLIB.
Annual house price
index (HPI) growth
eased to 5.4% in 3Q15
after rise by CAGG of
12.6% from 2010 – 2014.
Expect annual house
price growth rate to
normalise back to 10
year CAGR of circa 5%.
Johor eased to 3%
growth in 3Q15 as
compared to 11.2%
growth in 3Q14.

HLIB Research | Property
www.hlebroking.com
Page 5 of 26
07 January 2016
Given the reasons mentioned above, developers had reduced their sales target by a range of 6-38% from the original targets set in early 2015. Notably, only Eco World and Matrix Concepts managed to achieve its revised sales target. We attribute this to the strong brand name, product differentiation (Eco World) and strategy to focus on affordable mass market (Matrix Concept). Despite better supply and demand dynamics in Penang, property developers like Tambun Indah were facing difficulty in securing advertising permit and developer licences (APDL), which subsequently resulted in failure to achieve full-year sales target due to fewer property launches.
Figure 6: Sales Target Lowered Down since Beginning of Year
Company Changes
FY14 FY15 B FY15 A (%)
IOI PROPERTIES 1,967.0 1,800.0 1,700.0 (5.6)
UEM SUNRISE BHD 2,443.0 2,400.0 2,000.0 (16.7)
SP SETIA BHD 4,623.0 4,600.0 4,000.0 (13.0)
MAH SING GROUP 3,433.0 3,400.0 2,300.0 (32.4)
SUNWAY BHD 1,300.0 1,200.0 750.0 (37.5)
MATRIX CONCEPTS 630.0 700.0 700.0 0.0
TAMBUN 429.0 400.0 300.0 (25.0)
YNH PROPERTY BHD NA NA NA NA
GLOMAC BHD 506.0 600.0 500.0 (16.7)
ECO WORLD DEVELO 3,000.0 3,016.0 0.5
Average (16.3)
Sales Target
Source: Bloomberg, HLIB.
Going into 2016…
Leading Loan Indicators Remain Weak
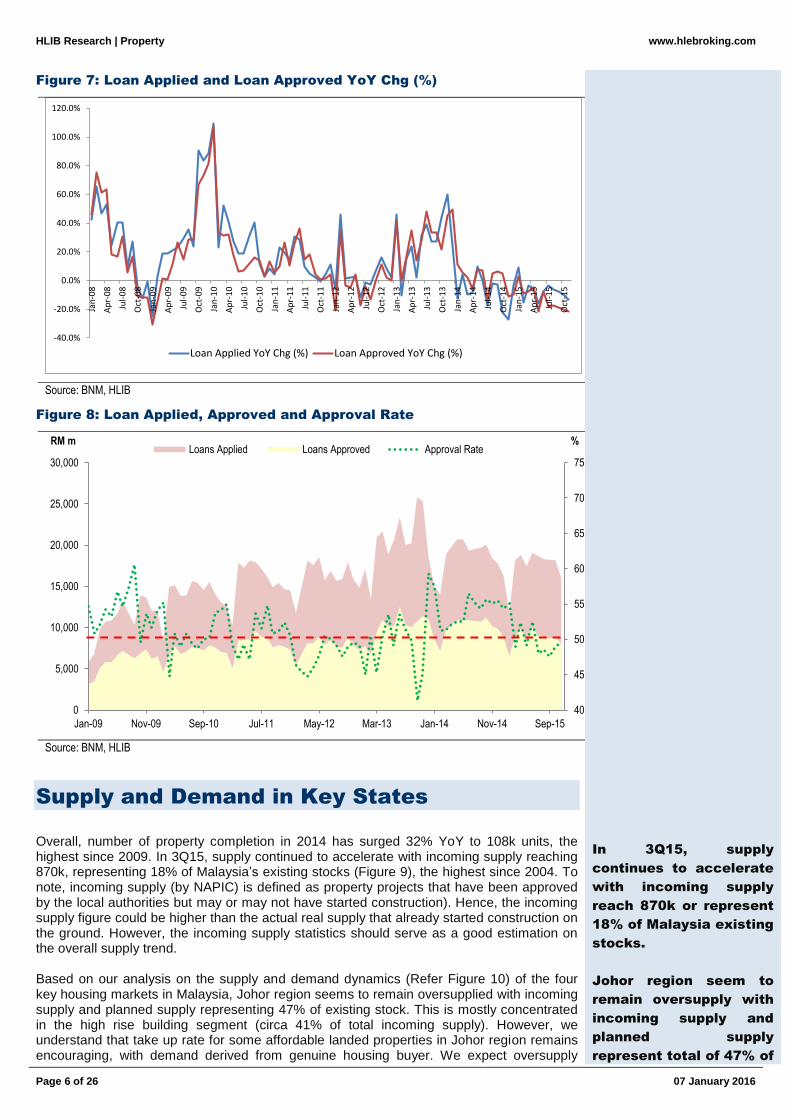
Going into 2016, we expect 1H16 outlook to remain weak with a moderate housing price growth. Leading indicators such as loan application remain sluggish. Latest data for Nov 15 (Figure 7) showed a contraction of 13% yoy, the tenth straight month of decline. This reinforces our view that property buyers remain on the wait and see mode. Furthermore, tighter bank lending also further dampened property sales with approval rate falling below 50% (Figure 8). We also understand that loan rejection rate for some peer’s projects has surged to more than 50%. Overall, we choose to wait for the leading indicator – number of loan application to show signs of bottoming and improvement before concluding that the worse is over.
Developers have
reduced their sales
target by range of 6-38%
as compare to the
targets at beginning of
2015.
Leading indicator like
loan application remains
sluggish with Nov 15
numbers (Refer Figure 5)
fell 13%.
HLIB Research | Property
www.hlebroking.com
Page 6 of 26
07 January 2016
Figure 7: Loan Applied and Loan Approved YoY Chg (%)
-40.0%
-20.0%
0.0%
20.0%
40.0%
60.0%
80.0%
100.0%
120.0%
Jan
-08
Ap
r-0
8
Jul-
08
Oct
-08
Jan
-09
Ap
r-0
9
Jul-
09
Oct
-09
Jan
-10
Ap
r-1
0
Jul-
10
Oct
-10
Jan
-11
Ap
r-1
1
Jul-
11
Oct
-11
Jan
-12
Ap
r-1
2
Jul-
12
Oct
-12
Jan
-13
Ap
r-1
3
Jul-
13
Oct
-13
Jan
-14
Ap
r-1
4
Jul-
14
Oct
-14
Jan
-15
Ap
r-1
5
Jul-
15
Oct
-15
Loan Applied YoY Chg (%) Loan Approved YoY Chg (%)
Source: BNM, HLIB
Figure 8: Loan Applied, Approved and Approval Rate
40
45
50
55
60
65
70
75
0
5,000
10,000
15,000
20,000
25,000
30,000
Jan-09 Nov-09 Sep-10 Jul-11 May-12 Mar-13 Jan-14 Nov-14 Sep-15
%RM mLoans Applied Loans Approved Approval Rate
Source: BNM, HLIB
Supply and Demand in Key States
Overall, number of property completion in 2014 has surged 32% YoY to 108k units, the highest since 2009. In 3Q15, supply continued to accelerate with incoming supply reaching 870k, representing 18% of Malaysia’s existing stocks (Figure 9), the highest since 2004. To note, incoming supply (by NAPIC) is defined as property projects that have been approved by the local authorities but may or may not have started construction). Hence, the incoming supply figure could be higher than the actual real supply that already started construction on the ground. However, the incoming supply statistics should serve as a good estimation on the overall supply trend. Based on our analysis on the supply and demand dynamics (Refer Figure 10) of the four key housing markets in Malaysia, Johor region seems to remain oversupplied with incoming supply and planned supply representing 47% of existing stock. This is mostly concentrated in the high rise building segment (circa 41% of total incoming supply). However, we understand that take up rate for some affordable landed properties in Johor region remains encouraging, with demand derived from genuine housing buyer. We expect oversupply
In 3Q15, supply
continues to accelerate
with incoming supply
reach 870k or represent
18% of Malaysia existing
stocks.
Johor region seem to
remain oversupply with
incoming supply and
planned supply
represent total of 47% of

HLIB Research | Property
www.hlebroking.com
Page 7 of 26
07 January 2016
situation to be remain in Johor in near term with an estimation of 11k/unit p.a. of surplus until demand catches up catalyzed by high speed rail (HSR). KL and Selangor should remain the core market with a more balanced and favorable supply and demand dynamics (Refer Figure 10). In the next 5 years, demand should outstrip supply due to urbanization and improving infrastructure. To recap, under the ETP program, the government aims to grow the Greater KL population to 10m by 2020 from an estimated 8m currently.This indicates Greater KL population to grow by CAGR of 4.6%, higher than national average of 1.3%. If this goal materialises, it would translate into annual housing demand of 100k unit p.a., almost matching the total completion for whole country in 2014. Improving public infrastructure (MRT, LRT 3, and HSR) will continue to drive demand toward KL South and KL North given limitation of land in KL Central. Penang market appears oversupplied in the near term given the large incoming supply (circa 19% of existing stock). However, we remain long-term positive on Penang market and expect demand to increase given strong catalyst from Penang Second Bridge and implementation of Penang Transport Master Plan.
Figure 9: Completion and Incoming Supply
Completions Chg (%) % of stock
Incoming
supply Chg (%) % of stock
Existing
stock
2002 156,524 5.1% 572,961 18.8% 3,050,277
2003 187,322 19.7 5.8% 584,531 2.0 18.1% 3,237,599
2004 164,636 (12.1) 4.8% 617,743 5.7 17.9% 3,452,369
2005 180,075 9.4 4.9% 612,718 (0.8) 16.8% 3,647,887
2006 170,962 (5.1) 4.4% 608,840 (0.6) 15.8% 3,850,568
2007 178,508 4.4 4.4% 574,841 (5.6) 14.2% 4,043,040
2008 134,334 (24.7) 3.2% 549,953 (4.3) 13.1% 4,203,260
2009 103,335 (23.1) 2.4% 545,479 (0.8) 12.6% 4,325,650
2010 95,938 (7.2) 2.2% 531,760 (2.5) 12.0% 4,435,736
2011 65,866 (31.3) 1.5% 559,121 5.1 12.4% 4,512,665
2012 73,788 12.0 1.6% 618,363 10.6 13.4% 4,631,607
2013 81,639 10.6 1.7% 692,475 12.0 14.7% 4,725,109
2014 107,747 32.0 2.2% 769,788 11.2 15.9% 4,848,030
3Q15 12,890 870,442 17.7% 4,910,539
Source: NAPIC, HLIB
existing stock.
KL and Selangor should
remain the core market
with favorable supply
and demand dynamic.

HLIB Research | Property
www.hlebroking.com
Page 8 of 26
07 January 2016
Figure 10: Demand and Supply Situation at Key States
3Q15 KL Selangor Johor Penang Others Malaysia
Existing Stock 446,724 1,397,587 729,297 394,848 1,942,073 4,910,529
% of Msia 9% 28% 15% 8% 40% 100%
Incoming supply 60,693 184,168 174,468 80,898 370,215 870,442
% of stock 14% 13% 24% 20% 19% 18%
Planned supply 65,211 88,381 169,970 58,344 271,804 653,710
% of stock 15% 6% 23% 15% 14% 13%
Incoming Supply pa 12,139 36,834 34,894 16,180 74,043 174,088
Estimated Demand pa 12,014 46,484 23,344 10,286 71,426 163,555
Surplus/Deficit 125 (9,651) 11,549 5,894 2,617 10,534
*Incoming supply pa is deriving from incoming supply spread over 5 years. We do not take into account planned supply as it might or might not get approval from authorities and without certainty on the timing of launching.
*Estimated Demand pa is average of 2016-2020 housing demand. Housing demand is based on our assumption on population growth and no of household formation in different states. Please refer Figure 11 for our key assumptions.
Source: NAPIC, HLIB
Figure 11: Key Assumptions on Housing Demand
2015 2016 2017 2018 2019 2020
Population (m) F:10-20 CAGR (%) 00-10 CAGR (%)
Malaysia 30.58 31.06 31.55 32.04 32.55 33.06 1.6% 1.9%
KL 1.82 1.85 1.88 1.91 1.94 1.98 1.7% 1.7%
Selangor 6.09 6.22 6.36 6.50 6.64 6.79 2.2% 2.7%
Penang 1.69 1.72 1.74 1.77 1.80 1.83 1.6% 1.6%
Johor 3.68 3.75 3.82 3.89 3.97 4.04 1.9% 1.9%
Average household size
Malaysia 4.1 4.1 4.1 4.0 4.0 4.0
KL 3.6 3.6 3.6 3.5 3.5 3.5
Selangor 3.8 3.8 3.8 3.7 3.7 3.7
Penang 3.7 3.7 3.7 3.6 3.6 3.6
Johor 4.0 4.0 4.0 3.9 3.9 3.9
No of Household Changes ('000)
Malaysia 152 155 159 163 168 172
KL 11 11 12 12 12 13
Selangor 43 44 45 46 48 49
Penang 10 10 10 10 11 11
Johor 22 22 23 23 24 25
Source: Department of Statistics Malaysia, HLIB
Affordable Housing Theme
Given the difficulty to secure housing loan due to tighter bank approval, property developers are shifting its strategy by focusing on providing affordable houses with price tag of below RM600k. According to our analysis, median household income in Selangor is at RM6,214 per month in 2014. With a conservative debt service ratio of 60% and other debt payment of RM1k/mth, we estimate the maximum loan to be allowed to borrow to be around RM600k. Hence, new property launches will be skewed towards KL South and KL North with lower land prices. Affordable landed properties will continue to see sustained demand. Several launches of affordable landed properties such as Saujana KLIA by Glomac have been fully sold. In addition, we foresee that developers will start to offer smaller built-up units to keep
Developers are shifting
its strategy by focusing
on providing affordable
houses with price tag
below RM600k.

HLIB Research | Property
www.hlebroking.com
Page 9 of 26
07 January 2016
absolute property prices low. For an example, REV.O @ Bukit Jalil with smaller size (starting from 318 sf) SOVO was selling for RM323k which translated to circa RM1k psf. This project received well response and achieved 95% take up rate after one month of launching.
Earnings Visibility and Balance Sheet
Given the challenging outlook, most of the developers have ramped up their marketing efforts, which in turn may cause margin pressure in the near term. Some developers also started to appoint third party property agency to boost up its property sales, giving as high as 5% of commission. With land prices holding well and a stagnated house price growth, margin for developers will be under pressure.
Earnings visibility for majority of developers has already deteriorated with shrinking unbilled sales coverage at an average of 1.5x. To note, property developers that focus on landed residential property and township development (such as IOI Properties, Matrix Concepts and Tambun Indah) tend to have lower unbilled sales of close to 1x, mainly due to shorter construction period (landed property and shop lot of 1-2 years vs. 3-4 years for high rise residential).
Figure 10: Unbilled Sales
Company Unbilled Sales
Coverage (x)
IOI PROPERTIES 1.0
UEM SUNRISE BHD 2.4
SP SETIA BHD 2.7
MAH SING GROUP 1.8
SUNWAY BHD 1.4
MATRIX CONCEPTS 1.1
TAMBUN 0.8
YNH PROPERTY BHD -
GLOMAC BHD 1.5
ECO WORLD DEVELO 2.5
Average 1.5
Source: Companies, HLIB
To survive through the downturn, property companies under our coverage have relatively strong balance sheet with an average net gearing of 0.3x (Figure 11), below the 0.5x normal threshold. YNH has a relative high net gearing at 0.9x mainly due to the large amount of borrowing for investment properties which will be self-financed by rental income.
Margin for developers
will be under pressure.
Earnings visibility for
majority of developers
has deteriorating with
unbilled sales shrinking
and stood at average of
1.5x.
Property under our
coverage have relatively
strong balance sheet
with average net
gearing of 0.3x.

HLIB Research | Property
www.hlebroking.com
Page 10 of 26
07 January 2016
Figure 11: Net Gearing as of 3Q15
Company
IOI PROPERTIES 0.13
UEM SUNRISE BHD 0.32
SP SETIA BHD 0.18
MAH SING GROUP 0.03
SUNWAY BHD 0.38
MATRIX CONCEPTS 0.07
TAMBUN 0.14
YNH PROPERTY BHD 0.92
GLOMAC BHD 0.37
ECO WORLD DEVELO 0.37
Average 0.29
Net Gearing (x)
Source: Companies, HLIB
Valuation
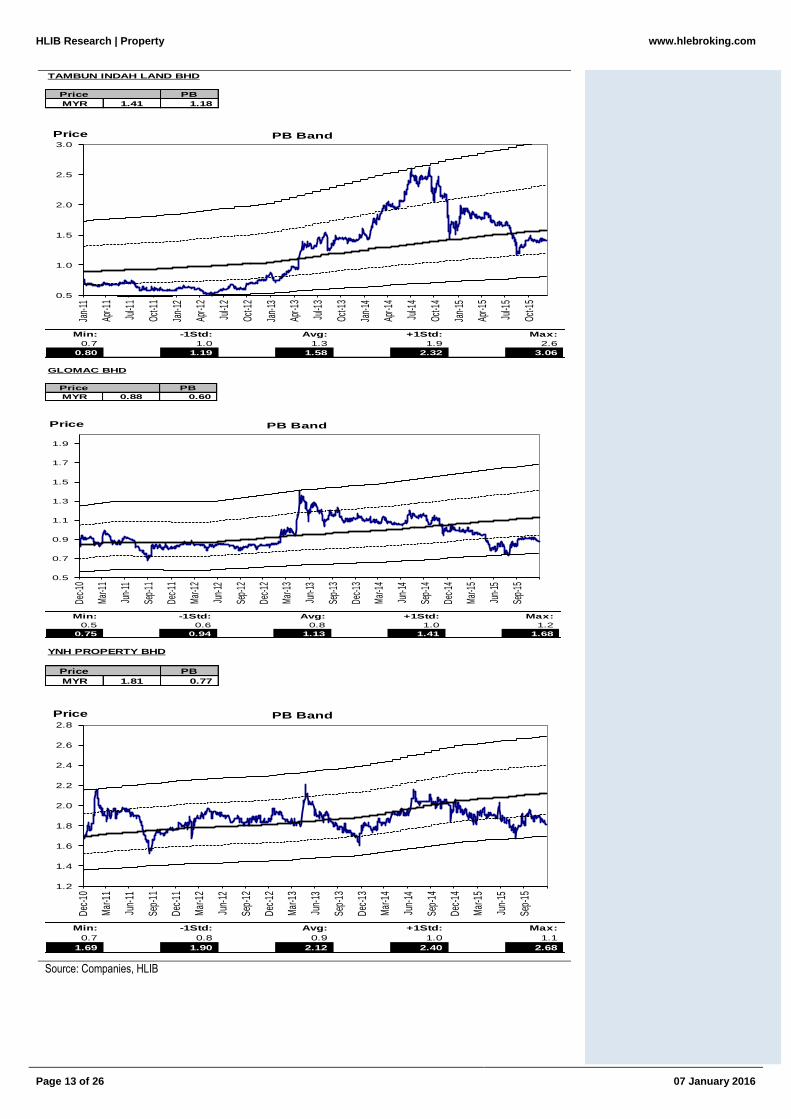
With all the negative factors in place, the key question is whether all have been reflected in the share price movement. Using Price-to-Book as a conservative valuation method (without taking into account the revised market value of landbank), some of the property stocks like IOI Properties, Mahsing and YNH are already trading close to their 5 years historical low of P/B valuation band (Figure 12 and 13). Despite lack of near term catalyst and still uncertain outlook, those property counters that are trading at close to historical low valuation would be a better rebound play with limited downside once sentiment improves in the near term.
Figure 12: Some property counters are trading close to lowest P/B band
Company Current Lowest Indicate Downside
Px 5 yrs P/B Px (%)
IOI PROPERTIES 2.29 0.5 1.84 (19.7)
UEM SUNRISE BHD 1.1 0.5 0.78 (29.1)
SP SETIA BHD 3.16 1.1 2.85 (9.8)
MAH SING GROUP 1.36 0.9 1.28 (5.9)
SUNWAY BHD 3.05 0.6 2.25 (26.2)
MATRIX CONCEPTS 2.49 1.2 1.87 (24.9)
TAMBUN 1.39 0.7 0.8 (42.4)
YNH PROPERTY BHD 1.81 0.7 1.69 (6.6)
GLOMAC BHD 0.88 0.5 0.75 (14.8)
Source: Companies, HLIB
Some property stocks
like IOI Properties,
Mahsing and YNH are
trading close to its 5
years historical low of
P/B valuation band.

HLIB Research | Property
www.hlebroking.com
Page 11 of 26
07 January 2016
Figure 13: 5 years P/B Valuation Band
IOI PROPERTIES GROUP BHD
PB
MYR 2.18 0.62
Min: -1Std: Avg: +1Std: Max:
0.5 0.6 0.6 0.8 0.9
1.84 2.07 2.30 2.71 3.13
Price
1.5
1.8
2.1
2.4
2.7
3.0
3.3
Jan-
14
Apr-1
4
Jul-1
4
Oct-1
4
Jan-
15
Apr-1
5
Jul-1
5
Oct-1
5
Price PB Band
MATRIX CONCEPTS HOLDINGS BHD
Price PB
MYR 2.47 1.53
Min: -1Std: Avg: +1Std: Max:
1.2 1.4 1.7 1.9 2.1
1.87 2.27 2.66 3.01 3.36
1.0
1.5
2.0
2.5
3.0
3.5
May
-13
Aug-
13
Nov
-13
Feb-
14
May
-14
Aug-
14
Nov
-14
Feb-
15
May
-15
Aug-
15
Nov
-15
Price PB Band
SUNWAY BHD
Price PB
MYR 3.05 0.86
Min: -1Std: Avg: +1Std: Max:
0.6 0.7 0.9 1.0 1.1
2.25 2.66 3.06 3.52 3.98
1.0
1.5
2.0
2.5
3.0
3.5
4.0
Aug
-11
Nov
-11
Feb-
12
May
-12
Aug
-12
Nov
-12
Feb-
13
May
-13
Aug
-13
Nov
-13
Feb-
14
May
-14
Aug
-14
Nov
-14
Feb-
15
May
-15
Aug
-15
Nov
-15
Price PB Band

HLIB Research | Property
www.hlebroking.com
Page 12 of 26
07 January 2016
UEM SUNRISE BHD
Price PB
MYR 1.12 0.75
Min: -1Std: Avg: +1Std: Max:
0.5 1.1 1.6 2.3 3.0
0.78 1.59 2.39 3.42 4.45
0.5
1.0
1.5
2.0
2.5
3.0
3.5
4.0
4.5
Dec
-10
Mar
-11
Jun-
11
Sep-
11
Dec
-11
Mar
-12
Jun-
12
Sep-
12
Dec
-12
Mar
-13
Jun-
13
Sep-
13
Dec
-13
Mar
-14
Jun-
14
Sep-
14
Dec
-14
Mar
-15
Jun-
15
Sep-
15
Price PB Band
MAH SING GROUP BHD
Price PB
MYR 1.41 0.99
Min: -1Std: Avg: +1Std: Max:
0.9 1.1 1.4 1.7 2.1
1.28 1.63 1.98 2.48 2.98
0.5
0.7
0.9
1.1
1.3
1.5
1.7
1.9
2.1
2.3
2.5
2.7
2.9
Dec
-10
Mar
-11
Jun-
11
Sep-
11
Dec
-11
Mar
-12
Jun-
12
Sep-
12
Dec
-12
Mar
-13
Jun-
13
Sep-
13
Dec
-13
Mar
-14
Jun-
14
Sep-
14
Dec
-14
Mar
-15
Jun-
15
Sep-
15
Price PB Band
SP SETIA BHD
Price PB
MYR 3.21 1.20
Min: -1Std: Avg: +1Std: Max:
1.1 1.3 1.5 2.0 2.4
2.85 3.46 4.06 5.29 6.52
2.0
2.5
3.0
3.5
4.0
4.5
5.0
5.5
6.0
6.5
7.0
Dec
-10
Mar
-11
Jun-
11
Sep-
11
Dec
-11
Mar
-12
Jun-
12
Sep-
12
Dec
-12
Mar
-13
Jun-
13
Sep-
13
Dec
-13
Mar
-14
Jun-
14
Sep-
14
Dec
-14
Mar
-15
Jun-
15
Sep-
15
Price PB Band
HLIB Research | Property
www.hlebroking.com
Page 13 of 26
07 January 2016
TAMBUN INDAH LAND BHD
Price PB
MYR 1.41 1.18
Min: -1Std: Avg: +1Std: Max:
0.7 1.0 1.3 1.9 2.6
0.80 1.19 1.58 2.32 3.06
0.5
1.0
1.5
2.0
2.5
3.0
Jan-
11
Apr-1
1
Jul-1
1
Oct-1
1
Jan-
12
Apr-1
2
Jul-1
2
Oct-1
2
Jan-
13
Apr-1
3
Jul-1
3
Oct-1
3
Jan-
14
Apr-1
4
Jul-1
4
Oct-1
4
Jan-
15
Apr-1
5
Jul-1
5
Oct-1
5
Price PB Band
GLOMAC BHD
Price PB
MYR 0.88 0.60
Min: -1Std: Avg: +1Std: Max:
0.5 0.6 0.8 1.0 1.2
0.75 0.94 1.13 1.41 1.68
0.5
0.7
0.9
1.1
1.3
1.5
1.7
1.9
Dec-
10
Mar
-11
Jun-
11
Sep-
11
Dec-
11
Mar
-12
Jun-
12
Sep-
12
Dec-
12
Mar
-13
Jun-
13
Sep-
13
Dec-
13
Mar
-14
Jun-
14
Sep-
14
Dec-
14
Mar
-15
Jun-
15
Sep-
15
Price PB Band
YNH PROPERTY BHD
Price PB
MYR 1.81 0.77
Min: -1Std: Avg: +1Std: Max:
0.7 0.8 0.9 1.0 1.1
1.69 1.90 2.12 2.40 2.68
1.2
1.4
1.6
1.8
2.0
2.2
2.4
2.6
2.8
Dec
-10
Mar
-11
Jun-
11
Sep-
11
Dec
-11
Mar
-12
Jun-
12
Sep-
12
Dec
-12
Mar
-13
Jun-
13
Sep-
13
Dec
-13
Mar
-14
Jun-
14
Sep-
14
Dec
-14
Mar
-15
Jun-
15
Sep-
15
Price PB Band
Source: Companies, HLIB

HLIB Research | Property
www.hlebroking.com
Page 14 of 26
07 January 2016
Risks
Prolonged weakening in consumer sentiment… Consumer sentiment which is expected to recover gradually from GST impact could experience a prolonged weakening given the lingering marco outlook (1MDB issue, plunge in oil price) and series of subsidy removals. Coupled with difficulty in securing housing loan from bank will translate into slower sales for developers.
Tightening of policy by the authorities … Any further tightening of policy or cooling measures from the authorities will dampen demand for properties which will negatively affect the take up rate of new project launches.
Delay in getting APDL… Timeliness in securing advertising permit and developer licenses is crucial to convert booking to sales. Persistent failure or delay in APDL will adversely impact the developers’ profitability.
Recommendation,
As we expect housing price growth to be moderate amidst tighter bank loan approval, demand will be primarily derived from genuine housing buyers with the focus on affordable price range of below RM600k. Hence, we are sticking to our preference for property developers that are more concentrated towards affordable housings, landed properties and township developments for resilient future sales and earnings. In term of region exposure, we remain cautious on the Johor region mainly due to the oversupply issue (especially high rise development). Property developments in southern KL and Penang are expected to perform better as majority of the incoming supply in southern KL are township developments or landed properties that cater for the mass market segment. Meanwhile, demand for properties in Penang is still intact given limited land supply with catalyst coming from improving infrastructure such as Penang Master Plan and Penang Second Bridge. Overall, we are maintaining NEUTRAL stance on the sector for 2016 mainly due to absence of near term catalyst. Top picks for the sector would be IOI Properties (BUY; TP:RM2.77) and Matrix Concepts (Buy; TP:RM2.90).
We like IOI Properties as it is one of the value stocks in our universe coverage given its attractive FY16 P/B at 0.6x (peer average at 1x). We believe the stock warrants a re-rating given its strong track record in township development and its attractive valuation. We believe the recent land acquisition from Tan Sri Dato’s Lee Shin Cheng is a fair and synergistic acquisition as this will expand IOI Prop’s landbank in IOI Resort City from existing 50 acres to 450 acres and provide opportunity for IOI Prop to embark on the development of second phase IOI City Mall which has already achieved 92% occupancy rate.
Our prefer pick for small to mid cap is Matrix Concepts. We upgrade our rating from HOLD to BUY with TP raised from RM2.54 to RM2.90 using lower discount to RNAV of 20%. It is one of the developers that mainly focus on affordable housing with price range below RM600k. Given its cheap land bank cost of RM7 psf, we believe Matrix can continue to sustain its property sales. Kota Gadong Perdana project (GDV: RM1bn) which comprises of 3,200 units of affordable house priced below RM400k is targeted to be launched in 1H16 and this will help to sustain sales. Dividend yield is one of the highest in the sector at 7%.
NEUTRAL stance on the sector for 2016. Top picks are IOI Property (BUY; TP:RM2.77) and Matrix Concepts (Buy; TP:RM2.90).
HLIB Research | Property
www.hlebroking.com
Page 15 of 26
07 January 2016
Some other changes in recommendation: YNH (HOLD: TP: 1.85 based on 50% discount to RNAV) We upgrade YNH from SELL to HOLD with TP raised from RM1.48 to RM1.85 after we reduced discount to RNAV from 60% to 50%. Despite disappointing quarter result due to company holding back launches, we believe the negative factors were already reflected in the share price. The company is deep in value and is trading at 50% discount to its RNAV without taking into account the potential value from Menara YNH. Long term investors should look past the weak near term earnings for longer term potential. We believe YNH will eventually unlock the value inside the company through active capital management.
Upgrading YNH from
SELL to HOLD with TP
raised from RM1.48 to
RM1.85.

HLIB Research | Property
www.hlebroking.com
Page 16 of 26
07 January 2016
Figure 14: Peer Comparison
Company Current Recomm TP Upside Mkt Cap (m) Discount to RNAV P/E (x) P/B (x) Dividend Yield Unbilled Sales
Px CY15 CY16 CY15 CY16 CY15 CY16 Coverage (x)
IOI PROPERTIES 2.29 Buy 2.77 21% 8,625.4 (46.2) 16.6 13.4 0.64 0.61 1.8 2.2 1.0
UEM SUNRISE BHD 1.1 Sell 0.94 -14% 4,991.2 (65.0) 20.7 12.4 0.77 0.74 1.5 2.4 2.4
SP SETIA BHD 3.16 Hold 3.47 10% 8,305.6 (36.3) 10.4 11.6 1.27 1.19 3.8 3.5 2.7
MAH SING GROUP 1.36 Hold 1.44 6% 3,276.8 (38.6) 8.9 8.2 1.05 0.97 4.5 4.9 1.8
SUNWAY BHD 3.05 Buy 3.63 19% 5,427.7 0.0 9.4 9.4 0.87 0.82 15.7 3.9 1.4
MATRIX CONCEPTS 2.49 Buy 2.90 17% 1,370.8 (31.4) 6.6 5.7 1.71 1.45 6.1 7.0 1.1
TAMBUN 1.39 Hold 1.39 0% 589.6 (40.2) 6.1 7.0 1.47 1.42 6.6 5.7 0.8
YNH PROPERTY BHD 1.81 Hold 1.85 2% 727.7 (51.2) 29.8 18.8 0.83 0.82 0.7 1.1 0.0
GLOMAC BHD 0.88 Hold 0.89 1% 638.0 (50.5) 8.0 7.1 0.65 0.61 4.8 5.0 1.5
ECO WORLD DEVELO 1.44 NR 3,404.5 (37.4) 62.6 24.0 0.95 0.92 - - 2.5
Average (39.7) 17.9 11.7 1.02 0.96 4.5 3.6 1.5
Source: HLIB

HLIB Research | Property
www.hlebroking.com
Page 17 of 26
07 January 2016
Financial Projections for Matrix Concepts
Income statement Cashflow
FYE 31 Dec (RM m) 2013A 2014A 2015E 2016E 2017E FYE 31 Dec (RM m) 2013A 2014A 2015E 2016E 2017E
Revenue 574 599 669 768 808 EBIT 203 244 276 311 308
Operating cost -369 -352 -389 -453 -496 D&A 3 3 4 4 3
EBITDA 206 247 279 314 312 Working capital changes (120) (56) (54) (77) (32)
D&A -3 -3 -4 -4 -3 Taxation (53) (62) (68) (74) (74)
Net Interest 2 0 -2 -1 -1 Others 4 8 (3) (3) (3)
Associates - - - - - Operating cashflow 40 136 153 160 203
Jointly controlled entities - - - - - Capex & acquisitions -69 -116 0 0 0
Exceptionals - - - - - Free cashflow -30 20 153 160 203
Pretax profit 205 245 274 309 307 Others -15 17 1 2 3
Taxation (53) (62) (68) (74) (74) Investing cashflow -84 -100 1 2 3
Minority Interest - - - - - Equity Raised 140 10 0 0 0
PATAMI 152 182 205 235 234 Others 0 0 0 0 0
Core Earning 152 182 205 235 234 Net Borrowing -3 21 0 0 0
Basic shares (m) 456 456 541 541 541 Financing cashflow 83 -47 -82 -94 -93
Basic EPS (sen) 33.3 40.0 37.9 43.4 43.2 Net cashflow 38 (10) 72 68 112
Balance sheet Valuation ratios
FYE 31 Dec (RM m) 2013A 2014A 2015E 2016E 2017E Net DPS (sen) 0.00 0.00 0.00 1.00 1.00
Fixed assets 80 192 188 185 181 FCF/ share (sen) -6.49 4.35 28.28 29.47 37.48
Other long-term assets 22 7 7 7 7 FCF y ield (% ) -2.6% 1.8% 11.5% 12.0% 15.2%
Other short-term assets 0 0 0 0 0 Market capitalization (m) 1,121 1,121 1,121 1,121 1,121
Working capital 425 411 460 527 555 Net cash (m) 50 19 91 158 270
Receivables 147 135 151 173 183 Enterprise value 1,071 1,103 1,030 963 851
Payables 277 274 306 351 370 EV/ EBITDA (x) 5.2 4.5 3.7 3.1 2.7
Inventory 1 2 2 3 3
Net cash / (debt) 50 19 91 158 270 Growth margins ratios
Cash 101 97 169 237 349 Growth (%)
ST debt 40 50 50 50 50 Sales Growth 4.3 11.7 14.8 5.3
LT debt 11 28 28 28 28 Operating expenses -4.5 10.7 16.4 9.5
Shareholders' funds 529 664 787 928 1,068 EBITDA Growth 20.2 13.1 12.5 -0.8
Share capital 301 457 457 457 457 PBT Growth 19.3 11.9 13.0 -0.6
Reserves 228 207 330 471 611 PATMI 20.2 12.7 14.5 -0.6
Minorities - - - - - Basic EPS Growth 20.2 -5.1 14.5 -0.6
Other liabilities 47 -35 -41 -51 -54
Summary Earnings Table
Revenue 574 599 669 768 808 Margins (%)
EBITDA 206 247 279 314 312 EBITDA Margin 35.8 41.2 41.8 40.9 38.6
Net profit 152 182 205 235 234 PBT Margin 35.7 40.8 40.9 40.3 38.0
P/E (x) 7.4 6.2 6.5 5.7 5.7 PATMI 26.4 30.4 30.7 30.6 28.9
BV / share 1.2 1.5 1.5 1.7 2.0
P/BV (x) 2.0 1.7 1.7 1.4 1.2
ROA (% ) 43.3 42.1 39.7 38.9 32.3
ROE (% ) 28.6 27.5 26.1 25.3 21.9
HLIB Research | Property
www.hlebroking.com
Page 18 of 26
07 January 2016
Financial Projections for IOI Prop
Income statement Cashflow
FYE 30 June (RM m) 2013A 2014A 2015A 2016E 2017E FYE 30 June (RM m) 2013A 2014A 2015A 2016E 2017E
Revenue 1,151 1,454 1,906 2,635 3,587 EBIT 638 1,069 1,006 817 1,068
Operating cost -508 -371 -901 -1,818 -2,519 D&A 6 14 - - -
EBITDA 644 1,083 1,006 817 1,068 Working capital changes 11 490 (759) (285) (1,151)
D&A -6 -14 0 0 0 Taxation (167) (217) (230) (188) (250)
Net Interest 1 -12 51 -66 -83 Others (43) (472) (530) (106) (106)
Associates 103 64 74 - 16 Operating cashflow 448 852 334 238 -440
Jointly controlled entities - - - - - Capex & acquisitions -1,538 -1,318 -921 -500 -500
Exceptionals - - - - - Free cashflow -1,091 -467 -587 -262 -940
Pretax profit 742 1,120 1,130 752 1,001 Others -324 -272 509 41 24
Taxation (167) (217) (230) (188) (250) Investing cashflow -1862 -1590 -412 -459 -476
Minority Interest 20 14 10 10 10 Equity Raised 0 0 1,025 0 0
PATAMI 494 380 487 554 741 Others 0 0 0 0 0
Core Earning 494 380 487 554 741 Net Borrowing 0 1,543 695 0 0
Basic shares (m) 2,791 2,791 3,779 3,779 3,779 Financing cashflow 1,216 979 1,344 -166 -222
Basic EPS (sen) 17.7 13.6 12.9 14.7 19.6 Net cashflow (199) 240 1,266 (387) (1,139)
Balance sheet Valuation ratios
FYE 30 June (RM m) 2013A 2014A 2015A 2016E 2017E Net DPS (sen) 0.00 0.00 0.00 1.00 1.00
Fixed assets 3,410 6,825 7,402 7,902 8,402 FCF/ share (sen) -39.08 -16.72 -15.53 -6.94 -24.88
Other long-term assets 2,395 4,088 4,457 4,457 4,473 FCF y ield (% ) -17.7% -7.6% -7.0% -3.1% -11.3%
Other short-term assets 94 94 94 94 94 Market capitalization (m) 6,168 6,168 6,168 6,168 6,168
Working capital 877 1,724 2,871 3,125 4,253 Net cash (m) -186 -1,664 -1,596 -1,277 -2,416
Receivables 416 492 907 892 1,214 Enterprise value 6,354 7,832 7,764 7,445 8,584
Payables 341 1,041 1,662 1,886 2,567 EV/ EBITDA (x) 9.9 7.2 7.7 9.1 8.0
Inventory 120 192 302 347 472
Net cash / (debt) -186 -1,664 -1,596 -1,277 -2,416 Growth margins ratios
Cash 317 393 1,203 1,522 383 Growth (%)
ST debt 0 750 560 560 560 Sales Growth 26.3 31.1 38.2 36.1
LT debt 502 1,307 2,239 2,239 2,239 Operating expenses -26.8 142.4 101.9 38.6
Shareholders' funds 5,678 11,301 13,538 13,936 14,465 EBITDA Growth 68.3 -7.1 -18.7 30.6
Share capital 406 3,239 3,779 3,779 3,779 PBT Growth 51.1 0.9 -33.5 33.2
Reserves 5,171 7,964 9,648 10,036 10,555 PATMI -23.0 28.0 13.8 33.8
Minorities 100 99 111 121 131 Basic EPS Growth -23.0 -5.4 13.8 33.8
Other liabilities 913 -235 -309 366 343
Summary Earnings Table
Revenue 1,151 1,454 1,906 2,635 3,587 Margins (%)
EBITDA 644 1,083 1,006 817 1,068 EBITDA Margin 55.9 74.5 52.8 31.0 29.8
Net profit 494 380 487 554 741 PBT Margin 64.4 77.0 59.3 28.5 27.9
P/E (x) 12.5 16.2 17.2 15.1 11.3 PATMI 42.9 26.1 25.5 21.0 20.7
BV / share 2.6 4.0 3.6 3.7 3.8
P/BV (x) 0.9 0.6 0.6 0.6 0.6
ROA (% ) 7.3 3.1 3.4 3.6 4.9
ROE (% ) 8.7 3.4 3.6 4.0 5.1

HLIB Research | Property
www.hlebroking.com
Page 19 of 26
07 January 2016
Financial Projections for Tambun Indah
Income statement Cashflow
FYE 31 Dec (RM m) 2013A 2014A 2015E 2016E 2017E FYE 31 Dec (RM m) 2013A 2014A 2015E 2016E 2017E
Revenue 376 467 420 363 404 EBIT 116 139 134 116 129
Operating cost -260 -327 -285 -246 -274 D&A 0 1 1 1 1
EBITDA 116 140 135 117 130 Working capital changes (27) (99) 30 37 (27)
D&A 0 -1 -1 -1 -1 Taxation (30) (35) (33) (28) (32)
Net Interest 0 -2 -5 -4 -4 Others 1 3 (7) (7) (7)
Associates 2 1 1 1 1 Operating cashflow 54 -5 126 119 65
Jointly controlled entities - - - - - Capex & acquisitions 0 0 -1 -1 -1
Exceptionals - - - - - Free cashflow 54 -6 125 118 64
Pretax profit 118 138 130 113 126 Others -26 -12 2 3 3
Taxation (30) (35) (33) (28) (32) Investing cashflow -26 -13 1 2 2
Minority Interest 23 1 1 1 1 Equity Raised 27 0 0 0 0
PATAMI 65 102 97 84 94 Others 0 0 0 0 0
Core Earning 65 102 97 84 94 Net Borrowing 14 55 0 0 0
Basic shares (m) 405 405 421 421 421 Financing cashflow -4 36 -39 -33 -37
Basic EPS (sen) 16.0 25.2 22.9 19.9 22.2 Net cashflow 24 18 88 87 30
Balance sheet Valuation ratios
FYE 31 Dec (RM m) 2013A 2014A 2015E 2016E 2017E Net DPS (sen) 6.60 9.70 9.18 7.95 8.89
Fixed assets 146 298 83 83 83 FCF/ share (sen) 13.24 -1.48 29.73 28.03 15.22
Other long-term assets 11 27 29 30 31 FCF y ield (% ) 9.5% -1.1% 21.2% 20.0% 10.9%
Other short-term assets 5 5 5 5 5 Market capitalization (m) 567 567 567 567 567
Working capital 168 224 202 174 194 Net cash (m) 13 -38 74 161 190
Receivables 87 118 106 92 102 Enterprise value 554 605 494 407 377
Payables 81 104 94 81 90 EV/ EBITDA (x) 4.8 4.3 3.7 3.5 2.9
Inventory 0 2 2 2 2
Net cash / (debt) 13 -38 74 161 190 Growth margins ratios
Cash 111 115 226 314 343 Growth (%)
ST debt 25 35 35 35 35 Sales Growth 26.9 24.0 -10.0 -13.6 11.3
LT debt 73 118 118 118 118 Operating expenses 19.8 25.6 -12.8 -13.6 11.3
Shareholders' funds 314 399 459 510 567 EBITDA Growth 46.0 20.5 -3.5 -13.5 11.2
Share capital 197 210 210 210 210 PBT Growth 49.0 17.4 -5.6 -13.2 11.7
Reserves 113 187 245 295 351 PATMI 59.2 57.2 -5.4 -13.4 11.9
Minorities 4 2 4 5 6 Basic EPS Growth 59.2 57.2 -8.9 -13.4 11.9
Other liabilities 30 118 -66 -56 -63
Summary Earnings Table
Revenue 376 467 420 363 404 Margins (%)
EBITDA 116 140 135 117 130 EBITDA Margin 30.9 30.0 32.1 32.2 32.1
Net profit 65 102 97 84 94 PBT Margin 31.3 29.6 31.0 31.2 31.3
P/E (x) 8.7 5.6 6.1 7.0 6.3 PATMI 17.3 21.9 23.0 23.0 23.2
BV / share 0.9 1.0 1.1 1.2 1.3
P/BV (x) 1.5 1.4 1.3 1.2 1.1
ROA (% ) 18.0 18.0 21.4 15.9 16.5
ROE (% ) 20.7 25.6 21.1 16.4 16.5

HLIB Research | Property
www.hlebroking.com
Page 20 of 26
07 January 2016
Financial Projections for YNH
Income statement Cashflow
FYE 30 June (RM m) 2013A 2014A 2015E 2016E 2017E FYE 30 June (RM m) 2013A 2014A 2015E 2016E 2017E
Revenue 303 391 288 413 517 EBIT 83 101 66 86 141
Operating cost -217 -287 -219 -324 -373 D&A 3 3 3 3 3
EBITDA 86 103 69 89 144 Working capital changes (48) (31) 184 (190) (158)
D&A -3 -3 -3 -3 -3 Taxation (18) (23) (12) (18) (34)
Net Interest -23 -31 -30 -29 -30 Others (29) (4) (34) (34) (34)
Associates - - - - - Operating cashflow -11 48 208 -152 -82
Jointly controlled entities - - - - - Capex & acquisitions -117 -98 0 0 0
Exceptionals - - - - - Free cashflow -129 -50 208 -152 -82
Pretax profit 61 70 37 57 110 Others -53 0 4 5 3
Taxation (18) (23) (12) (18) (34) Investing cashflow -170 -98 4 5 3
Minority Interest - - - - - Equity Raised 18 21 0 0 0
PATAMI 43 73 25 40 76 Others 0 0 0 0 0
Core Earning 43 73 25 40 76 Net Borrowing 120 116 0 0 0
Basic shares (m) 412 412 411 411 411 Financing cashflow 113 75 -5 -8 -15
Basic EPS (sen) 10.4 17.8 6.1 9.6 18.6 Net cashflow (69) 25 207 (155) (94)
Balance sheet Valuation ratios
FYE 30 June (RM m) 2013A 2014A 2015E 2016E 2017E Net DPS (sen) 0.00 0.00 0.00 1.00 1.00
Fixed assets 567 621 618 615 612 FCF/ share (sen) -31.20 -12.09 50.67 -36.98 -20.03
Other long-term assets 329 307 307 307 307 FCF y ield (% ) -17.1% -6.6% 27.8% -20.3% -11.0%
Other short-term assets 6 6 6 6 6 Market capitalization (m) 750 750 750 750 750
Working capital 444 510 355 509 637 Net cash (m) -561 -653 -445 -600 -694
Receivables 108 136 79 113 142 Enterprise value 1,311 1,403 1,196 1,350 1,445
Payables 104 90 66 95 119 EV/ EBITDA (x) 15.2 13.6 17.2 15.1 10.1
Inventory 231 285 210 301 377
Net cash / (debt) -561 -653 -445 -600 -694 Growth margins ratios
Cash 21 22 229 74 -20 Growth (%)
ST debt 361 460 460 460 460 Sales Growth 28.8 -26.2 43.2 25.2
LT debt 221 214 214 214 214 Operating expenses 32.5 -23.7 47.9 15.2
Shareholders' funds 868 875 895 926 987 EBITDA Growth 19.7 -32.9 28.5 61.2
Share capital 426 441 441 441 441 PBT Growth 15.5 -47.5 56.3 92.4
Reserves 442 433 453 485 546 PATMI 72.0 -66.0 58.6 92.4
Minorities - - - - - Basic EPS Growth 72.0 -65.9 58.6 92.4
Other liabilities -83 -82 -53 -89 -119
Summary Earnings Table
Revenue 303 391 288 413 517 Margins (%)
EBITDA 86 103 69 89 144 EBITDA Margin 28.5 26.5 24.1 21.6 27.8
Net profit 43 73 25 40 76 PBT Margin 20.0 17.9 12.7 13.9 21.4
P/E (x) 17.6 10.2 29.9 18.9 9.8 PATMI 14.1 18.8 8.7 9.6 14.7
BV / share 2.0 2.1 2.2 2.3 2.4
P/BV (x) 0.9 0.9 0.8 0.8 0.8
ROA (% ) 3.4 5.3 1.7 2.8 5.3
ROE (% ) 4.9 8.4 2.8 4.3 7.7

HLIB Research | Property
www.hlebroking.com
Page 21 of 26
07 January 2016
Financial Projections for Glomac
Income statement Cashflow
FYE 30 Apr (RM m) 2014A 2015A 2016E 2017E 2018E FYE 30 Apr (RM m) 2014A 2015A 2016E 2016E 2017E
Revenue 677 472 588 585 672 EBIT 147 145 126 133 156
Operating cost -526 -324 -462 -452 -515 D&A 4 4 - - -
EBITDA 151 148 126 133 156 Working capital changes (97) (185) (0) 1 (43)
D&A -4 -4 0 0 0 Taxation (44) (49) (31) (33) (39)
Net Interest -7 -6 -8 -6 -6 Others 11 (26) (15) (15) (15)
Associates 17 6 6 6 6 Operating cashflow 13 -113 80 86 59
Jointly controlled entities - - - - - Capex & acquisitions -1 -24 0 -20 -20
Exceptionals - - - - - Free cashflow 12 -137 80 66 39
Pretax profit 157 144 124 133 156 Others 8 22 8 9 9
Taxation (44) (49) (31) (33) (39) Investing cashflow 7 -1 8 -11 -11
Minority Interest 5 8 8 8 - Equity Raised 0 0 0 0 0
PATAMI 108 67 85 91 117 Others 0 0 0 0 0
Core Earning 108 67 85 91 117 Net Borrowing 21 101 0 0 0
Basic shares (m) 724 724 721 721 721 Financing cashflow 8 55 -30 -32 -41
Basic EPS (sen) 15.0 9.3 11.8 12.7 16.2 Net cashflow 28 (60) 57 43 6
Balance sheet Valuation ratios
FYE 30 Apr (RM m) 2014A 2015A 2016E 2017E 2018E Net DPS (sen) 0.00 0.00 0.00 1.00 1.00
Fixed assets 639 920 920 940 960 FCF/ share (sen) 1.67 -18.93 11.03 9.19 5.38
Other long-term assets 84 75 80 86 91 FCF y ield (% ) 1.9% -21.5% 12.5% 10.4% 6.1%
Other short-term assets 9 9 9 9 9 Market capitalization (m) 637 637 637 637 637
Working capital 429 446 484 482 553 Net cash (m) -199 -357 -300 -257 -250
Receivables 181 187 161 160 184 Enterprise value 836 994 937 894 888
Payables 159 157 195 194 223 EV/ EBITDA (x) 5.5 6.7 7.4 6.7 5.7
Inventory 90 103 128 127 146
Net cash / (debt) -199 -357 -300 -257 -250 Growth margins ratios
Cash 333 275 332 374 381 Growth (%)
ST debt 218 208 208 208 208 Sales Growth -30.2 24.5 -0.5 14.8
LT debt 314 424 424 424 424 Operating expenses -38.4 42.4 -2.1 14.1
Shareholders' funds 936 996 1,059 1,126 1,201 EBITDA Growth -1.9 -14.6 5.5 17.3
Share capital 364 364 364 364 364 PBT Growth -8.6 -13.4 6.6 17.4
Reserves 523 575 630 689 764 PATMI -38.2 27.2 7.2 27.7
Minorities 49 58 66 74 74 Basic EPS Growth -38.2 27.9 7.2 27.7
Other liabilities 26 97 135 134 162
Summary Earnings Table
Revenue 677 472 588 585 672 Margins (%)
EBITDA 151 148 126 133 156 EBITDA Margin 22.3 31.4 21.5 22.8 23.3
Net profit 108 67 85 91 117 PBT Margin 23.2 30.4 21.2 22.7 23.2
P/E (x) 5.9 9.5 7.4 6.9 5.4 PATMI 16.0 14.2 14.5 15.6 17.4
BV / share 1.2 1.3 1.4 1.5 1.6
P/BV (x) 0.7 0.7 0.6 0.6 0.6
ROA (% ) 8.1 4.3 5.2 5.4 6.6
ROE (% ) 11.6 6.7 8.1 8.1 9.7

HLIB Research | Property
www.hlebroking.com
Page 22 of 26
07 January 2016
Financial Projections for Spsetia
Income statement Cashflow
FYE 31 Dec (RM m) 2013# 2014# 2015* 2016E 2017E FYE 31 Dec (RM m) 2013# 2014# 2015* 2016E 2017E
Revenue 3,261 3,810 6,017 4,464 3,845 EBIT 723 821 1,359 981 803
Operating cost -2,518 -2,961 -4,612 -3,407 -2,941 D&A 21 28 46 77 101
EBITDA 744 849 1,405 1,057 904 Working capital changes 481 100 (1,617) 2,096 836
D&A -21 -28 -46 -77 -101 Taxation (174) (206) (359) (313) (288)
Net Interest -35 -20 -30 -20 -11 Others (163) (238) (62) (62) (62)
Associates (30) (78) (90) 157 236 Operating cashflow 799 448 -633 2,778 1,390
Jointly controlled entities - - - - - Capex & acquisitions -1,618 -674 -200 -200 -200
Exceptionals - - - - - Free cashflow -819 -226 -833 2,578 1,190
Pretax profit 658 722 1,238 1,118 1,028 Others -107 -418 32 43 51
Taxation (174) (206) (359) (313) (288) Investing cashflow -1724 -1092 -168 -157 -149
Minority Interest 66 79 79 79 79 Equity Raised 1,339 0 0 0 0
PATAMI 418 406 768 694 629 Others 0 0 0 0 0
Core Earning 418 406 768 694 629 Net Borrowing 556 945 0 0 0
Basic shares (m) 2,489 2,489 2,539 2,539 2,539 Financing cashflow 1,656 885 -307 -278 -252
Basic EPS (sen) 16.8 16.3 30.3 27.3 24.8 Net cashflow 730 242 (1,108) 2,343 989
Balance sheet Valuation ratios
FYE 31 Dec (RM m) 2013# 2014# 2015* 2016E 2017E Net DPS (sen) 0.00 0.00 0.00 1.00 1.00
Fixed assets 5,357 5,479 989 1,112 1,211 FCF/ share (sen) -32.90 -9.07 -32.83 101.55 46.86
Other long-term assets 715 939 849 1,006 1,242 FCF y ield (% ) -10.3% -2.8% -10.3% 31.7% 14.6%
Other short-term assets 76 76 76 76 76 Market capitalization (m) 7,965 7,965 7,965 7,965 7,965
Working capital 3,106 2,729 4,310 3,198 2,754 Net cash (m) -1,808 -1,907 -3,015 -672 317
Receivables 922 759 1,198 889 766 Enterprise value 9,773 9,872 10,980 8,637 7,648
Payables 2,160 1,924 3,039 2,255 1,942 EV/ EBITDA (x) 13.1 11.6 7.8 8.2 8.5
Inventory 24 46 73 54 46
Net cash / (debt) -1,808 -1,907 -3,015 -672 317 Growth margins ratios
Cash 2,171 2,412 1,304 3,647 4,636 Growth (%)
ST debt 642 931 931 931 931 Sales Growth 16.8 57.9 -25.8 -13.9
LT debt 3,336 3,388 3,388 3,388 3,388 Operating expenses 17.6 55.7 -26.1 -13.7
Shareholders' funds 5,731 6,792 7,364 7,891 8,380 EBITDA Growth 14.2 65.5 -24.7 -14.5
Share capital 1,844 1,904 1,904 1,904 1,904 PBT Growth 9.7 71.4 -9.7 -8.1
Reserves 3,632 3,955 4,416 4,832 5,210 PATMI -3.0 89.4 -9.6 -9.4
Minorities 255 310 389 468 547 Basic EPS Growth -3.0 85.7 -9.6 -9.4
Other liabilities 1,715 524 -4,156 -3,172 -2,779
Summary Earnings Table
Revenue 3,261 3,810 6,017 4,464 3,845 Margins (%)
EBITDA 744 849 1,405 1,057 904 EBITDA Margin 22.8 22.3 23.4 23.7 23.5
Net profit 418 406 768 694 629 PBT Margin 20.2 19.0 20.6 25.1 26.7
P/E (x) 19.0 19.6 10.6 11.7 12.9 PATMI 12.8 10.6 12.8 15.6 16.4
BV / share 2.3 2.4 2.5 2.7 2.8
P/BV (x) 1.4 1.4 1.3 1.2 1.1
ROA (% ) 4.5 4.2 17.1 10.2 7.9
ROE (% ) 7.3 6.0 10.4 8.8 7.5
# Financial y ear end Oct
*14M of financial result.

HLIB Research | Property
www.hlebroking.com
Page 23 of 26
07 January 2016
Financial Projections for UEMSunrise
Income statement Cashflow
FYE 31 Oct (RM m) 2013A 2014A 2015E 2016E 2017E FYE 31 Oct (RM m) 2013A 2014A 2015E 2016E 2017E
Revenue 2,425 2,662 1,427 2,551 3,744 EBIT 569 498 228 412 614
Operating cost -1,836 -2,143 -1,198 -2,139 -3,129 D&A 20 21 - - -
EBITDA 590 519 228 412 614 Working capital changes - (1,357) 3,804 (2,174) (2,308)
D&A -20 -21 0 0 0 Taxation (100) (120) (65) (104) (148)
Net Interest -11 -23 8 28 7 Others 187 945 (50) (50) (50)
Associates 128 134 70 49 73 Operating cashflow 601 -103 3,917 -1,917 -1,891
Jointly controlled entities - - - - - Capex & acquisitions -234 -327 0 0 0
Exceptionals - - - - - Free cashflow 367 -430 3,917 -1,917 -1,891
Pretax profit 686 609 306 489 695 Others 123 -344 58 79 57
Taxation (100) (120) (65) (104) (148) Investing cashflow -111 -671 58 79 57
Minority Interest (0) (0) (0) (17) (28) Equity Raised 0 0 0 0 0
PATAMI 579 480 241 402 575 Others 0 0 0 0 0
Core Earning 579 480 241 402 575 Net Borrowing -6 416 0 0 0
Basic shares (m) 4,537 4,537 4,537 4,537 4,537 Financing cashflow -169 152 -72 -120 -173
Basic EPS (sen) 12.8 10.6 5.3 8.8 12.7 Net cashflow 321 (621) 3,902 (1,959) (2,007)
Balance sheet Valuation ratios
FYE 31 Oct (RM m) 2013A 2014A 2015E 2016E 2017E Net DPS (sen) 0.00 0.00 0.00 1.00 1.00
Fixed assets 3,555 3,420 788 788 788 FCF/ share (sen) 8.08 -9.47 86.33 -42.25 -41.68
Other long-term assets 1,011 1,369 1,439 1,488 1,561 FCF y ield (% ) 7.1% -8.3% 75.7% -37.1% -36.6%
Other short-term assets 0 0 0 0 0 Market capitalization (m) 5,173 5,173 5,173 5,173 5,173
Working capital 2,537 3,523 1,509 2,698 3,960 Net cash (m) -578 -1,619 2,284 325 -1,682
Receivables 1,806 2,762 1,063 1,900 2,788 Enterprise value 5,751 6,791 2,889 4,848 6,854
Payables 624 585 352 629 923 EV/ EBITDA (x) 9.8 13.1 12.7 11.8 11.2
Inventory 106 177 95 169 248
Net cash / (debt) -578 -1,619 2,284 325 -1,682 Growth margins ratios
Cash 1,362 739 4,642 2,683 676 Growth (%)
ST debt 218 238 238 238 238 Sales Growth 9.7 -46.4 78.8 46.8
LT debt 1,722 2,120 2,120 2,120 2,120 Operating expenses 16.7 -44.1 78.5 46.3
Shareholders' funds 6,470 6,819 6,987 7,251 7,626 EBITDA Growth -12.1 -56.0 80.2 49.3
Share capital 2,269 2,269 2,269 2,269 2,269 PBT Growth -11.2 -49.8 59.8 42.1
Reserves 3,750 4,064 4,233 4,514 4,917 PATMI -17.1 -49.7 66.4 43.3
Minorities 451 486 485 469 440 Basic EPS Growth -17.1 -49.7 66.4 43.3
Other liabilities 55 -125 -967 -1,952 -2,998
Summary Earnings Table
Revenue 2,425 2,662 1,427 2,551 3,744 Margins (%)
EBITDA 590 519 228 412 614 EBITDA Margin 24.3 19.5 16.0 16.1 16.4
Net profit 579 480 241 402 575 PBT Margin 28.3 22.9 21.4 19.2 18.6
P/E (x) 8.9 10.8 21.4 12.9 9.0 PATMI 23.9 18.0 16.9 15.7 15.4
BV / share 1.4 1.4 1.4 1.5 1.6
P/BV (x) 0.8 0.8 0.8 0.8 0.7
ROA (% ) 7.4 5.7 3.0 5.7 9.5
ROE (% ) 9.0 7.0 3.5 5.5 7.5

HLIB Research | Property
www.hlebroking.com
Page 24 of 26
07 January 2016
Financial Projections for MahSing
Income statement Cashflow
FYE 31 Oct (RM m) 2013A 2014A 2015E 2016E 2017E FYE 31 Oct (RM m) 2013A 2014A 2015E 2016E 2017E
Revenue 2,006 2,905 3,336 3,676 4,375 EBIT 369 453 526 577 698
Operating cost -1,620 -2,434 -2,792 -3,076 -3,650 D&A 16 17 19 23 27
EBITDA 385 471 545 600 725 Working capital changes (81) (40) (422) (333) (684)
D&A -16 -17 -19 -23 -27 Taxation (92) (117) (137) (151) (182)
Net Interest 3 2 4 8 6 Others (2) 5 (33) (42) (42)
Associates - - - - - Operating cashflow 178 316 -47 75 -183
Jointly controlled entities - - - - - Capex & acquisitions -561 -782 -50 -50 -50
Exceptionals - - - - - Free cashflow -383 -465 -97 25 -233
Pretax profit 372 455 530 584 704 Others 1 6 9 13 11
Taxation (92) (117) (137) (151) (182) Investing cashflow -560 -776 -41 -37 -39
Minority Interest (1) (2) (2) (2) (2) Equity Raised 526 91 625 0 0
PATAMI 281 339 367 398 487 Others 0 0 0 0 0
Core Earning 281 339 367 398 487 Net Borrowing 207 315 540 0 0
Basic shares (m) 1,447 1,447 2,401 2,401 2,401 Financing cashflow 646 265 1,018 -159 -195
Basic EPS (sen) 19.4 23.4 15.3 16.6 20.3 Net cashflow 265 (195) 930 (122) (416)
Balance sheet Valuation ratios
FYE 31 Oct (RM m) 2013A 2014A 2015E 2016E 2017E Net DPS (sen) 8.00 6.50 6.12 6.64 8.12
Fixed assets 744 1,159 262 289 313 FCF/ share (sen) -26.48 -32.17 -4.04 1.02 -9.69
Other long-term assets 83 75 75 75 75 FCF y ield (% ) -18.9% -23.0% -2.9% 0.7% -6.9%
Other short-term assets 2 2 2 2 2 Market capitalization (m) 2,026 2,026 2,026 2,026 2,026
Working capital 2,028 2,482 2,850 3,140 3,738 Net cash (m) -18 -520 410 289 -128
Receivables 582 818 940 1,036 1,233 Enterprise value 2,044 2,546 1,615 1,737 2,153
Payables 1,370 1,508 1,733 1,909 2,272 EV/ EBITDA (x) 5.3 5.4 3.0 2.9 3.0
Inventory 76 155 178 196 233
Net cash / (debt) -18 -520 410 289 -128 Growth margins ratios
Cash 822 639 1,570 1,448 1,031 Growth (%)
ST debt 84 69 69 69 69 Sales Growth 44.8 14.9 10.2 19.0
LT debt 756 1,090 1,090 1,090 1,090 Operating expenses 50.2 14.7 10.2 18.7
Shareholders' funds 1,963 2,278 3,662 3,899 4,190 EBITDA Growth 22.2 15.7 10.1 20.8
Share capital 707 738 960 960 960 PBT Growth 22.5 16.4 10.3 20.5
Reserves 1,245 1,531 2,154 2,393 2,685 PATMI 20.9 8.2 8.5 22.3
Minorities 11 10 8 7 5 Basic EPS Growth 20.9 -34.8 8.5 22.3
Other liabilities 875 920 -61 -103 -190
Summary Earnings Table
Revenue 2,006 2,905 3,336 3,676 4,375 Margins (%)
EBITDA 385 471 545 600 725 EBITDA Margin 19.2 16.2 16.3 16.3 16.6
Net profit 281 339 367 398 487 PBT Margin 18.5 15.7 15.9 15.9 16.1
P/E (x) 7.2 6.0 9.2 8.4 6.9 PATMI 14.0 11.7 11.0 10.8 11.1
BV / share 1.5 1.6 1.3 1.4 1.5
P/BV (x) 0.9 0.9 1.1 1.0 0.9
ROA (% ) 12.2 11.9 12.1 13.1 16.9
ROE (% ) 14.3 14.9 10.0 10.2 11.6

HLIB Research | Property
www.hlebroking.com
Page 25 of 26
07 January 2016
Financial Projections for Sunway
Income Statement Quarterly Financial Summary
FYE 31 Dec (RM m) 2012A 2013A 2014A 2015E 2016E FYE 31 Dec (RM m) 2013Q4 2013Q1 2014Q2 2014Q3 2014Q4
Revenue 3,876.8 4,733.7 4,730.7 4,758.7 4,676.4 Revenue 1,025.7 1,204.6 1,134.0 1,477.5 1,060.0 EBITDA 594.5 1,960.5 723.0 748.4 779.1 Expenses (932.6) (1,086.8) (1,002.4) (1,315.9) (939.9) D&A (89.9) (136.9) (99.3) (116.3) (131.9) Other Income 16.4 16.2 20.4 211.5 49.8 EBIT 504.5 1,823.6 623.6 632.0 647.2 EBIT 109.6 134.0 151.9 373.2 169.9 Interest Income 27.1 35.6 36.1 26.2 26.7 Derivatives (0.0) 0.2 (0.1) (2.8) (3.2) Finance Costs (104.6) (138.1) (118.3) (107.1) (102.3) Net Interest Expense (7.8) (10.2) (5.1) (7.2) (11.4) Associates/JCE 301.2 172.5 178.7 190.9 207.9 Associates & JCE 40.4 109.6 38.5 44.7 38.1 Profit Before Tax 728.2 1,893.6 720.2 742.1 779.5 Profit Before Tax 142.2 233.6 185.2 407.8 193.5 Tax (128.5) (120.9) (134.9) (137.2) (142.7) Tax (30.4) (44.9) (21.8) (50.8) (36.1) Net Profit 599.7 1,772.7 585.3 604.8 636.8 Net Profit 111.8 188.7 163.4 357.0 157.4 Minority Interests (67.4) (273.0) (40.9) (46.4) (74.9) Minority Interests (7.8) (6.2) (19.7) (44.0) (10.9) PATAMI 532.3 1,499.8 544.4 558.4 561.9 PATAMI 104.0 182.5 143.7 313.0 146.5 Exceptionals 181.8 1,017.8 - - - Exceptionals 31.3 (981.3) 6.3 (56.6) 5.6 Core Earnings 350.6 482.0 544.4 558.4 561.9 Core Earnings 124.4 157.5 110.3 126.0 149.3 Basic Shares (m) 1,292.5 1,723.4 1,723.4 1,723.4 1,723.4 Core EPS (sen) 6.40 7.31 8.66 11.93 7.68 FD Core EPS (sen) 6.27 7.03 8.24 11.32 7.23 Core EPS (sen) 27.1 28.0 31.6 32.4 32.6 FD Core EPS (sen) 22.6 24.0 27.0 27.7 24.4 W. Ave. Shares (m) 1,723.5 1,723.7 1,724.0 1,727.9 1,733.2
Balance Sheet Rates and Ratios
FYE 31 Dec (RM m) 2012A 2013A 2014A 2015E 2016E FYE 31 Dec (RM m) 2012A 2013A 2014A 2015E 2016E
Cash 1,140 1,519 890 858 921 Core PER (x) 11.3 10.9 9.7 9.4 9.4 Trade Receivables 1,404 1,405 1,166 1,173 1,153 FD Core PER (x) 13.5 12.8 11.3 11.0 12.5 Inventories 626 623 713 717 705 Net DPS (sen) 6.0 10.0 11.0 11.0 12.0 Development Costs 600 1,276 994 1,006 1,085 Net DY (%) 2.0 3.3 3.6 3.6 3.9
Associates/JCE 1,553 2,284 2,371 2,458 2,551 BVPS (RM) 2.8 3.1 3.3 3.5 3.7 PPE 3,008 3,548 3,749 3,933 4,101 P/B (x) 1.1 1.0 0.9 0.9 0.8 Goodwill 319 320 320 320 320 NTA/Share (RM) 2.5 2.9 3.1 3.3 3.6 Others 95 137 130 130 130 Total Assets 8,745 11,112 10,333 10,594 10,965 EBITDA Margin (%) 15.3 41.4 15.3 15.7 16.7 Trade Payables 1,605 2,154 1,296 1,304 1,281 EBIT Margin (%) 13.0 38.5 13.2 13.3 13.8 Total Debt 2,747 2,795 2,461 2,299 2,246 PBT Margin (%) 26.6 43.6 19.0 19.6 21.1 Others 524 511 511 511 511 PATAMI Margin (%) 9.0 10.2 11.5 11.7 12.0 Total Liabilities 4,876 5,460 4,267 4,114 4,038 ROE (%) 10.7 10.8 9.9 9.5 9.0 Shareholders' Funds 3,558 5,335 5,707 6,076 6,448 ROA (%) 4.2 4.9 5.1 5.3 5.2 Minority Interests 310 317 358 405 480 Total Capital 3,868 5,652 6,065 6,480 6,928 Net Gearing (%) 49.1 28.7 28.5 24.5 21.2
Cashflow Analysis Assumption Metrics
FYE 31 Dec (RM m) 2012A 2013A 2014A 2015E 2016E FYE 31 Dec (RM m) 2012A 2013A 2014A 2015E 2016E
EBITDA 594.5 1,960.5 723.0 748.4 779.1 Revenue 3,877 4,734 4,731 4,759 4,676 Working Capital (154.1) (124.7) (427.4) (15.0) (69.5) Property 923 1,167 1,209 1,223 1,320 Interest Received 27.1 39.9 36.1 26.2 26.7 Property Investment 591 816 840 865 891 Dividends fr Assoc 151.8 83.1 91.6 104.2 114.6 Construction 1,275 1,591 1,463 1,391 1,122 Others (233.2) (865.8) (127.4) (137.2) (142.7) Trading/Manufacture 559 587 616 647 679 CFO 386.1 1,092.9 295.9 726.6 708.3 Quarry 197 198 208 218 229 Capex (465.5) (657.9) (300.0) (300.0) (300.0) Others 332 375 394 414 435 Purchase/Disposal 317.4 38.2 - - - Others (209.7) (215.0) - - - EBIT Margins (%) 13.0 38.5 13.2 13.3 13.8 CFI (357.7) (834.7) (300.0) (300.0) (300.0) Financing 493.2 48.6 (334.8) (161.5) (53.4) Shares Issued - 732.9 - - - Dividends - (344.3) (172.3) (189.6) (189.6) Interest Paid (104.6) (117.5) (118.3) (107.1) (102.3) Others (141.7) (184.3) - - - CFF 246.9 135.4 (625.4) (458.2) (345.2) Net Cashflow 275.2 393.5 (629.5) (31.6) 63.0

HLIB Research | Property
www.hlebroking.com
Page 26 of 26
07 January 2016
Disclaimer
The information contained in this report is based on data obtained from sources believed to be reliable. However, the data and/or sources have not been independently verified and as such, no representation, express or implied, is made as to the accuracy, adequacy, completeness or reliability of the info or opinions in the report.
Accordingly, neither Hong Leong Investment Bank Berhad nor any of its related companies and associates nor person connected to it accept any liability whatsoever for any direct, indirect or consequential losses (including loss of profits) or damages that may arise from the use or reliance on the info or opinions in this publication.
Any information, opinions or recommendations contained herein are subject to change at any time without prior notice. Hong Leong Investment Bank Berhad has no obligation to update its opinion or the information in this report.
Investors are advised to make their own independent evaluation of the info contained in this report and seek independent financial, legal or other advice regarding the appropriateness of investing in any securities or the investment strategies discussed or recommended in this report. Nothing in this report constitutes investment, legal, accounting or tax advice or a representation that any investment or strategy is suitable or appropriate to your individual circumstances or otherwise represent a personal recommendation to you.
Under no circumstances should this report be considered as an offer to sell or a solicitation of any offer to buy any securities referred to herein.
Hong Leong Investment Bank Berhad and its related companies, their associates, directors, connected parties and/or employees may, from time to time, own, have positions or be materially interested in any securities mentioned herein or any securities related thereto, and may further act as market maker or have assumed underwriting commitment or deal with such securities and provide advisory, investment or other services for or do business with any companies or entities mentioned in this report. In reviewing the report, investors should be aware that any or all of the foregoing among other things, may give rise to real or potential conflict of interests.
This research report is being supplied to you on a strictly confidential basis solely for your information and is made strictly on the basis that it will remain confidential. All materials presented in this report, unless specifically indicated otherwise, is under copyright to Hong Leong Investment Bank Berhad. This research report and its contents may not be reproduced, stored in a retrieval system, redistributed, transmitted or passed on, directly or indirectly, to any person or published in whole or in part, or altered in any way, for any purpose.
This report may provide the addresses of, or contain hyperlinks to, websites. Hong Leong Investment Bank Berhad takes no responsibility for the content contained therein. Such addresses or hyperlinks (including addresses or hyperlinks to Hong Leong Investment Bank Berhad own website material) are provided solely for your convenience. The information and the content of the linked site do not in any way form part of this report. Accessing such website or following such link through the report or Hong Leong Investment Bank Berhad website shall be at your own risk. 1. As of 07 January 2016, Hong Leong Investment Bank Berhad has proprietary interest in the following securities covered in this report: (a) -.
2. As of 07 January 2016, the analysts, Jason Tan, who prepared this report, have interest in the following securities covered in this report: (a) -.
Published & Printed by
Hong Leong Investment Bank Berhad (10209-W)
Level 23, Menara HLA No. 3, Jalan Kia Peng 50450 Kuala Lumpur Tel 603 2168 1168 / 603 2710 1168 Fax 603 2161 3880
Equity rating definitions
BUY Positive recommendation of stock under coverage. Expected absolute return of more than +10% over 12-months, with low risk of sustained downside. TRADING BUY Positive recommendation of stock not under coverage. Expected absolute return of more than +10% over 6-months. Situational or arbitrage trading opportunity. HOLD Neutral recommendation of stock under coverage. Expected absolute return between -10% and +10% over 12-months, with low risk of sustained downside. TRADING SELL Negative recommendation of stock not under coverage. Expected absolute return of less than -10% over 6-months. Situational or arbitrage trading opportunity. SELL Negative recommendation of stock under coverage. High risk of negative absolute return of more than -10% over 12-months. NOT RATED No research coverage and report is intended purely for informational purposes.
Industry rating definitions
OVERWEIGHT The sector, based on weighted market capitalization, is expected to have absolute return of more than +5% over 12-months. NEUTRAL The sector, based on weighted market capitalization, is expected to have absolute return between –5% and +5% over 12-months. UNDERWEIGHT The sector, based on weighted market capitalization, is expected to have absolute return of less than –5% over 12-months.