Projects of Common Interest 2018 - 2019 Regional Meetings... · Energy Projects of Common Interest...
111
Energy Projects of Common Interest 2018 - 2019 Meeting of TEN-E Gas cross - Regional Groups and networks thematic group 7 November 2018, Brussels DG ENER, Networks & Regional Initiatives https://webcast.ec.europa.eu/pci-gas-meeting
Transcript of Projects of Common Interest 2018 - 2019 Regional Meetings... · Energy Projects of Common Interest...

Energy
Projects of Common Interest 2018 - 2019
Meeting of TEN-E Gas cross - Regional Groups and 𝐂𝐂𝐂𝐂𝟐𝟐 networks thematic group
7 November 2018, Brussels
DG ENER, Networks & Regional Initiatives
https://webcast.ec.europa.eu/pci-gas-meeting

Energy
10:00-10:15 Introductionby Catharina Sikow-Magny, Head of Unit Networks & Regional Initiatives, DG ENER
10:15-10:35 Projects of Common Interest (PCI) legal framework: brief overview by Milosz Momot, DG ENER
10:35-11:20 PCI process (2018 – 2019) in view of preparing the 4th Union listTimeline and interventions by Regional Groups and Thematic areas leadersJane Amilhat Deputy Head of Unit Networks & Regional Initiatives, DG ENERRaphael Sauter, RG NSI West leaderAdam Szolyak, RG NSI East leaderMilosz Momot, RG SGC leaderSebastian Gras, RG BEMIP leaderKatrien Prins, Thematic area – CO2 network leader
11:20-12:20 The role of monitoring of PCIs in the overall PCI process:
ACER 2018 monitoring outcomesby Boyko Nitzov, Agency for the Cooperation of Energy Regulators
The inclusion of monitoring results in the 2018- 2019 PCI process-principles by Irina Mihaela Minciuna, DG ENER
Agenda

Energy
Agenda
12:20-14:00 Lunch break
14:00-14:45 The Ten-Year Network Development Plan for gas (TYNDP 2018) : process, scenarios and European needs identificationby Stefano Astorri, European Network of Transmission System Operators for Gas (ENTSOG)
14:45-15:45 Working together: roles and responsibilities in the PCI processby Irina Mihaela Minciuna, DG ENER
15:45-16:00 Next steps by Catharina Sikow-Magny, Head of Unit Networks & Regional Initiatives, DG ENER

Energy
Projects of Common Interest
Legal framework

Energy
COMPETITIVE-NESS
SECURITY OF SUPPLY SUSTAINABILITY
TEN-E Regulation
(347/2013) -addressing
infrastructure needs in a
comprehensive way
Trans-European energy networks are at the heart of the European energy policy

Energy
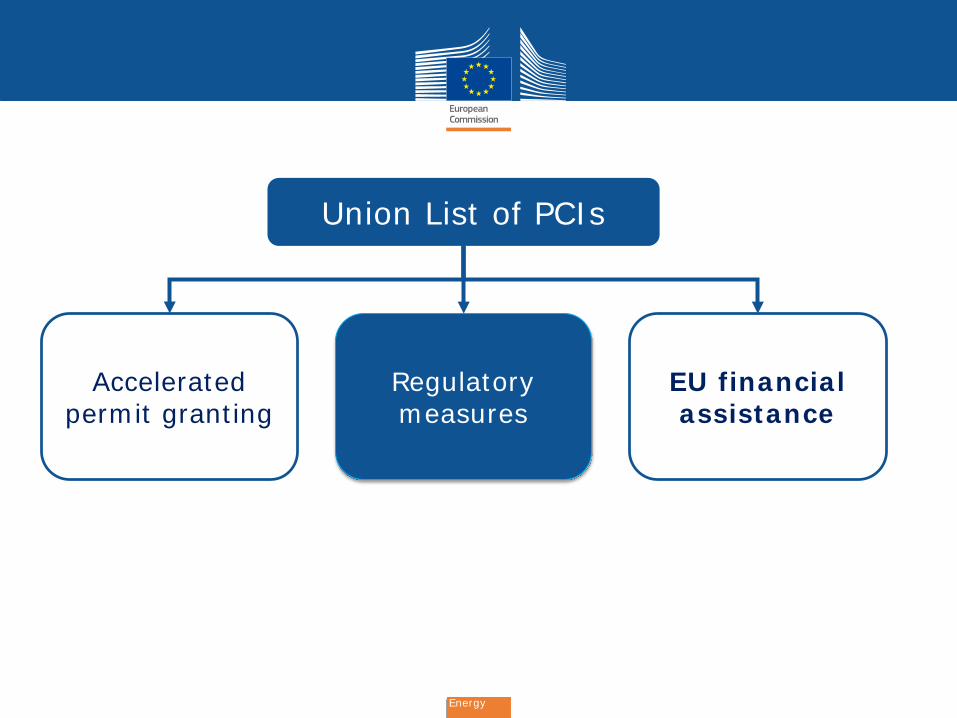
Union List of PCIs
Acceleratedpermit
granting
Regulatory measures
EU financialassistance
Criteria / CBA
CO2 transportE-highwaysSmart grids
Project of Common Interest Benefits
Regional cooperation &
High Level Groups

Energy
Gas infrastructure consist of:Tr
ansm
issi
on • for gas transmission, the project concerns investment in reverse flow capacities or changes the capability to transmit gas across the borders of the Member States concerned by at least 10 % compared to the situation prior to the commissioning of the project;Sto
rage
and
LN
G
• for gas storage or liquefied/compressed natural gas, the project aims at supplying directly or indirectly at least two Member States or at fulfilling the infrastructure standard (N-1 rule) at regional level in accordance with Article 6(3) of Regulation (EU) No 994/2010 of the European Parliament and of the Council

Energy
Union List of PCIs
Acceleratedpermit
granting
Regulatory measures
EU financialassistance

Energy
Permit granting – Regime of common interest
Competent Authority to
manage permit granting process
3,5 years time limit for
the permit granting decision
Increased transparencyand enhanced
public participation
Priority status for PCIs
• Most preferential treatment in Member States
• Streaming of Environmentalassessment procedures
Energy
Union List of PCIs
Acceleratedpermit granting
Regulatorymeasures
EU financialassistance
Energy
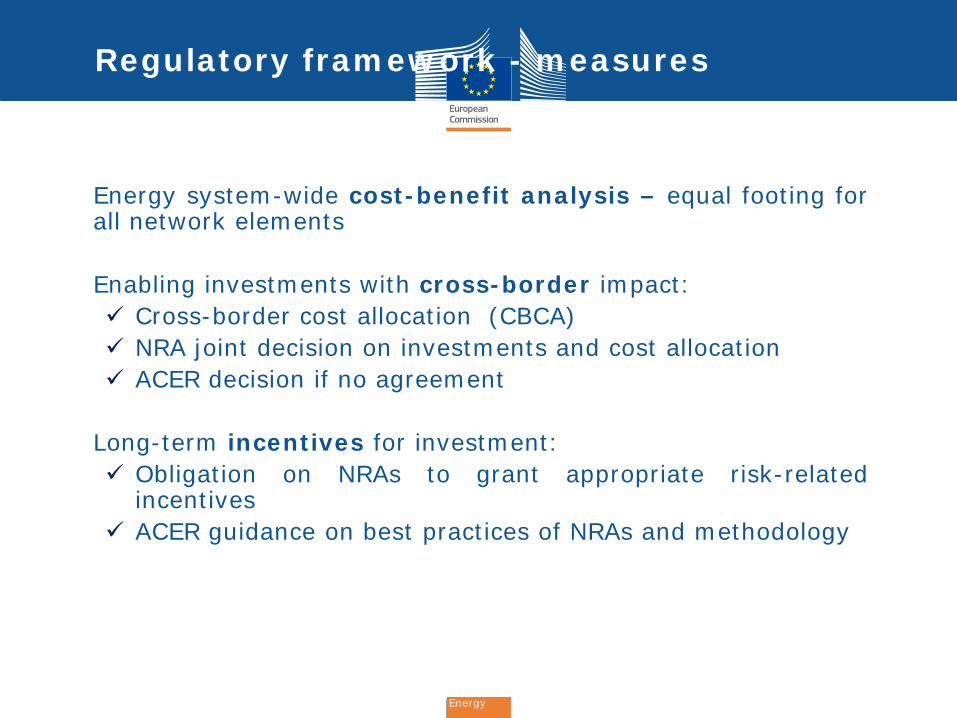
Regulatory framework - measures
• Energy system-wide cost-benefit analysis – equal footing forall network elements
• Enabling investments with cross-border impact: Cross-border cost allocation (CBCA) NRA joint decision on investments and cost allocation ACER decision if no agreement
• Long-term incentives for investment: Obligation on NRAs to grant appropriate risk-related
incentives ACER guidance on best practices of NRAs and methodology

Energy
Union List of PCIs
Acceleratedpermit granting
Regulatorymeasures
EU financialassistance
Structural Funds, EIB, EFSI, Marguerite Fund, EBRD
CEF Regulation 1361/2013 with 5.35bn;

Energy
TEN-E Regulation introducesBENEFITS for PCIs but alsocertain obligations on PCIpromoters
Your project (indeed)But part of a (common)network
Delays may trigger call forproposals for an alternativeproject promoterArt 5(7)(d)
Submit an annual report onprogress achieved, delaysregistered – to ACER(reporting by 31 March)
Draw up an implementationplan including a timetablefor the major milestones ofa project (Art 5(1)) -Transparency platform
Keep project websites up-to-date (Art 9(7))
Share information withinRegional Groups
Promoters obligation

Energy
Projects of Common Interest2018 - 2019 Process

Energy
2018-2019 PCI process gas
Cross regional meeting
Regional meeting
Technical and High Level Decision Making Body meeting

Energy
Step 1: Identification of system needs
• Objective: identify the most relevant needs within the region for which further infrastructure development is necessary
• Input: largely based on the ENTSOG TYNDP data
• Regional groups are responsible for defining the needs of the priority corridors
• Output: agreed needs of the priority corridors.

Energy
Step 2: Projects submission
• Objective: collect the candidate PCI projects
• Input: TYNDP 2018 projects can apply
• Project promoters submit their project/s for the PCI selection in line with the Commission guidance.
• Submission tool: ENTSOG tool developed in line with the Commission requirements.
Note: The Commission is in charge of the submission process, not ENTSOG
• Output: list of candidate PCI projects
Submission window:
20 November 2018 -10 January 2019

Energy
Step 3.1: Public consultation on candidate projects
• Objective: collect public views on the candidate PCI projects
• Input: TYNDP 2018 project sheets + ACER monitoring outcomes + information submitted in the PCI submission window
• Stakeholders & citizens are invited to submit their views on the projects.
• Consultation tool: The EUSurvey tool will be used for this purpose.
• Output: public views per projects summed up in the report on public consultation. These views will be considered by the Regional Groups.

Energy
Step 3.2: National Regulatory Authorities projects consultation
• Objective: collect the NRAs views on the candidate PCI projects
• Input: TYNDP 2018 project sheets + ACER monitoring outcomes + information submitted in the PCI submission window
• NRAs submit their views on all the projects from their national territory.
• Consultation tool: ACER survey tool will be used for this purpose.
• Output: NRAs view per projects, views that will be used by the Regional Groups.

Energy
Step 4: Define methodology and assess the candidate PCI projects
• Objective: define the assessment methodology and based on it assess all the PCI candidate projects
• Input: TYNDP 2018 project data and project monitoring information
• RG members are responsible to agree on the assessment methodology and prepare the Decision Making Body decision.
• Output: Assessment methodology and outcome of the methodology implementation per priority corridor.

Energy
Step 5. PCI list adoption and ACER opinion
• Objective: Technical and High Level Decision Making Body PCI lists per corridor adoption
• Input: RGs assessment resultsand ACER opinion
• Technical and High Level Decision Making Body are responsible to adopt the list.
• Output: 4th PCI list to be formally adopted by the Commission [Delegated Act]

Energy
Projects of Common Interest
Gas Regional Groups & Thematic Group Cross-border carbon dioxide network

Energy
• Electricity regional group leaders:NSI West leader: Raphael SauterRG NSI East leader - Adam SzolyakRG SGC leader: Milosz MomotRG BEMIP leader: Sebastian Gras
•Thematic area CO2 network: Katrien Prins

Energy
North-South gas interconnections in Western Europe
North-South gas interconnections in Western Europe (‘NSI West Gas’): gas infrastructure for North-South gas flows in Western Europe to further diversify routes of supply and for increasing short-term gas deliverability
Member States concerned: Belgium, Denmark, France, Germany, Ireland, Italy, Luxembourg, Malta, the Netherlands, Portugal, Spain, the United Kingdom;

Energy
North-South gas interconnections in Central Eastern and South Eastern Europe
North-South gas interconnections in Central Eastern and South Eastern Europe (‘NSI East Gas’): gas infrastructure for regional connections between and in the Baltic Sea region, the Adriatic and Aegean Seas, the Eastern Mediterranean Sea and the Black Sea, and for enhancing diversification and security of gas supply.
Member States concerned: Austria, Bulgaria, Croatia, Cyprus, Czech Republic, Germany, Greece, Hungary, Italy, Poland, Romania, Slovakia, Slovenia;

Energy
Southern Gas Corridor
Southern Gas Corridor (‘SGC’): infrastructure for the transmission of gas from the Caspian Basin, Central Asia, the Middle East and the Eastern Mediterranean Basin to the Union to enhance diversification of gas supply.
Member States concerned: Austria, Bulgaria, Croatia, Czech Republic, Cyprus, France, Germany, Hungary, Greece, Italy, Poland, Romania, Slovakia, Slovenia;

Energy
Baltic Energy Market Interconnection Plan in gas
Baltic Energy Market Interconnection Plan in gas (‘BEMIP Gas’): gas infrastructure to end the isolation of the three Baltic States and Finland and their dependency on a single supplier, to reinforce internal grid infrastructures accordingly, and to increase diversification and security of supplies in the Baltic Sea region.
Member States concerned: Denmark, Estonia, Finland, Germany, Latvia, Lithuania, Poland, Sweden.

Energy
PRIORITY THEMATIC AREA: Cross-border carbon dioxide network
Cross-border carbon dioxide network: development of carbon dioxide transport infrastructure between Member States and with neighbouring third countries in view of the deployment of carbon dioxide capture and storage.
Member States concerned: All

Energy
ACER monitoring
2018 report outcomes

Energy
Inclusion of monitoring in the PCI process

Energy
The Projects of Common Interest are chosen due to their high benefit to the Energy Union
In order to bring the benefits to citizens and businesses the PCIs need to be implemented on time
Monitoring by the Regional and High Level Groups is necessary to check and support the timely implementation of PCIs

Energy
Copenhagen Forum conclusion
• “The Forum asks the Regional Groups members to increase their involvement in the project implementation in line with the legal requirements. In addition, the Forum asks the Regional Groups to include the monitoring in the process of defining the future PCI lists.”

Energy
Regional Group members:
• 1. acknowledge the importance of monitoring for the PCIs implementation
• 2. agree to include the PCI monitoring outcomes in the PCI assessment methodology
• 3. follow and support the PCIs implementation under the Regional and High Level Groups fora

Energy
Working together: roles and responsibilities

Energy
Overview of roles & responsibilities

Energy
Cooperation Platform
Members: ENTSOG, ACER and European Commission
Regular meetings: Feb2018 until March/April 2019
Tasks: 1. Makes sure that TYNDP
material fulfills the PCI process needs
2. Makes checks on data necessary for the PCI process
3. Supports in the drafting of the PCI assessment methodology
4. Continuous support to the Regional Groups in the PCI process

Energy
Regional Groups
Members: Member States, National Regulatory Authorities, ENTSOs, ACER, promoters and European Commission
Regular meetings: Q3/2018-Q2/2019
Tasks: 1. Identifies and agrees on
the Regional infrastructure needs/ gaps
2. Agree on the PCI assessment methodology
3. Discusses and makes recommendations to facilitate implementation of PCIs

Energy
Regional Groups –NRAs
1. Annex III.2.(7) For proposed projects falling under the categories set out in Annex II.1 and 2, national regulatory authorities, and if necessary the Agency, shall, where possible in the context of regional cooperation (Article 6 of Directive 2009/72/EC, Article 7 of Directive 2009/73/EC), check the consistent application of the criteria/ cost-benefit analysis methodology and evaluate their cross-border relevance. They shall present their assessment to the Group.
2. Within the context of the Regional groups discusses and makes recommendations to facilitate implementation of PCIs

Energy
Regional Groups – Stakeholders
Stakeholders are invited to participate in meetings throughout the process [where appropriate] and engage in discussions, especially regarding the needs identification in the regions.
Stakeholders and the general public are also consulted on the list of the candidate projects at the beginning of the process through an open consultation.

Energy
Decision Making Body
Members: Member States and European Commission
Meeting: June-Sept 2019
Tasks: • Following Regional Groups
recommendation discusses and adopts the regional PCI lists

Energy
The Ten-Year Network Development Plan for gas (TYNDP 2018)
- process, - scenarios- European needs identification

Energy
Projects of Common InterestNext steps

Energy
PCI submission
• Period: 20 November 2018 – 10 January 2019
• Submission through online tool
• All the data available in the TYNDP will be automatically considered (including costs)
• For a cross-border infrastructure to be considered eligible to enter the PCI process all of its projects must be submitted (e.g. Interconnector A-B= [country A to border] + [border to country B]). Failure to comply with this requirement will result in project elimination. The cross-border project promoters are advised to discuss with their counterpart before submitting their part of the project.

Energy
Regional system needs assessment
• Next meetings will be hold in the regional format:
• 2nd week December
• The meetings are also open to the public
• For the meetings preparation the RGs member will receive:
• End November – the draft ENTSOG System needs report

Energy
Public PCI candidate consultation
• Period: mid-January – mid March
• Open to all the interested public
• Similar with the past PCI consultation

Energy
NRAs consultation
• Period: mid-January – mid March
• Based on an online questionnaire
• NRAs will be asked to check the consistent application of the criteria/ cost-benefit analysis methodology and evaluate their cross-border relevance

Energy
European Commission contacts – PCI process:
For general inquiries: [email protected]
Regional group leaders:
NSI West leader: Raphael SauterEmail: [email protected] Phone: +32 229-92827
RG NSI East leader - Adam SzolyakEmail: [email protected] Phone: +32 229-84032
RG SGC leader: Milosz MomotEmail: [email protected] Phone: +32 229-80750
RG BEMIP leader: Sebastian GrasEmail: [email protected] Phone: +32 229-83127
Thematic area – CO2 network: Katrien PrinsEmail: [email protected] Phone: +32 229-60353

THE ROLE OF MONITORING OF PCIS IN THE OVERALLPCI PROCESS:
ACER 2018 MONITORING OUTCOMES
Meeting of the TEN-E Cross-Regional Group on Gas Brussels, 7 November 2018
The views expressed in this presentation are those of the presenter and not necessarily of the Agency, any of its Boards, or any NRA.

1
Needs, gaps, assessment tools
A Look Back to 2017 PCIs
Source: This slide is based on the Agency’s Opinion on the Draft 2017 Gas PCI List, http://www.acer.europa.eu/Official_documents/Acts_of_the_Agency/Opinions/Opinions/ACER%20Opinion%2013-2017.pdf
• Clear link between the infrastructure needs and the assessed features of the projects:
• Infrastructure gap or may introduce redundant capacities? Most IPs currently do not show signs of congestion
• Bottom-up approach - involve stakeholder views about problems and needs• Still… gap between projects supported by the market and proposed for the PCI
list was significant• Define minimum mandatory information to be provided by project
promoters in their application• ENTSOG to make the TYNDP better for the purpose of the PCI selection:
• PS-CBA should be available as an output of the TYNDP• Update of the PCI assessment methodology should start as soon as the format
of the output of the TYNDP 2018 is developed• The most pressing deficiency in 2017 was the CBA methodology: limited
availability of benefit and cost data, esp. in monetary terms in the TYNDP• The updated CBA methodology to be communicated by ENTSOG to the
European Commission before the process starts (done!)

2
PCI Monitoring Results 2017
A Look Back to 2017 PCI Progress
Source: This slide is based on the Agency’s Consolidated Report on the progress of electricity and gas Projects of Common Interest for the year 2016, Vol. 2 – Gas http://www.acer.europa.eu/Official_documents/Acts_of_the_Agency/Publication/Consolidated%20Report%20on%20the%20progress%20of%20electricity%20and%20gas%20projects%20of%20Common%20Interest%20for%20the%20year%202016.pdf
• Transmission dominates planned investments… only in 2 cases would bring gas by pipeline from new sources;
• About €6 billion invested since 2013 (€3.2 billion in 2016 alone);• Investment bulk went into just 2 PCIs in SGC. Investment levels do not correlate well
with reported commissioning dates;• 21 PCIs filed investment requests incl. CBCA, 13 intend to apply;• 8 applied for specific incentives, 35 not decided yet, 42 do not plan to apply;• 4 applied for exemptions, 15 not decided yet, 61 do not plan to apply.

3
Refined Monitoring Tools, Looking for Trends
New in 2018 PCI Monitoring
Source: This slide and the next ones are based on the Agency’s PCI Monitoring Report 2018, available from: https://www.acer.europa.eu/Official_documents/Publications/Pages/Publication.aspx
• New information support system (“VALVE”), remotely accessible:• Pre-filled with TYNDP 2017 data, promoters could confirm that the information
is still valid or provide an update (53 PCIs, 98 investment items)• Information at the level of each investment item, then converted and
aggregated (if applicable) to PCI level• Reports for 52 out of the 53 PCIs by the legal deadline, 1 PCI after the deadline
• Project life-cycle cost data missing or incomplete for 66% of the PCIs• Only 6 PCIs were able to indicate the value of benefits• PCIs are subject to CBA already at the stage of preparing the PCI list, so
the lack of any estimate of the value of a project’s expected lifecycle costs and benefits casts fundamental doubts on the projects merits’ level.
• Recommended by the Agency:• Foresee in the CBA methodology ways and means to allow project promoters
to assess / update the lifecycle value of the costs and the monetised benefits• Promoters to evaluate the costs and the benefits of their projects from the
inception of the project and to track the progress of the costs and benefits over the entire project cycle

4
PCIs and NDPs (1/2)
New in 2018 PCI Monitoring
• NDPs typically include the national sections of cross-border gas transmission projects, but – as a rule – do not consider the cross-border effects of LNG or UGS projects located outside their geographical scope
• 12 PCIs are entirely absent from the NDP of their hosting countries (6 transmission, 5 UGS and 1 LNG project)
• 11 investment items of PCIs are missing from the NDP of at least one of the hosting countries
• Reasons for the absence of a PCI in the NDP (as reported):• No NDP exists in the country or the operators are not required to prepare and
publish an NDP (8 instances);• The project is not developed by the TSO, but by an independent developer (6
instances);• The NDP was prepared at an earlier date compared to the date of the adoption
of the PCI list, the PCI will be proposed for the next NDP (4 instances);• The promoter has not yet applied for a connection to the national transmission
system and thus is out of the scope of the NDP (3 instances).

5
PCIs and NDPs (2/2)
New in 2018 PCI Monitoring
• TYNDP should build on NDPs, so PCIs should build on NDPs• Promoters should always first apply for inclusion in the relevant NDPs (where
applicable)• If a valid reason exists which prevents a promoter from first applying for
inclusion of a project in the relevant NDPs (e.g. no NDP exists), then promoters should first consult the relevant NRAs and other relevant offices in the concerned MS, before applying to the PCI list
• Greater consistency is recommended in the assessment of the cross-border impacts of gas transmission (pipelines, compressor stations), LNG, and UGS projects
• Each investment item should exist only in one instance on the PCI list:• Avoid having the same investment item or project component as a part of
several PCIs (to avoid double counting the project characteristics and potential confusion in the treatment of investment requests under Article 12 of R. No 347/2013 and also in subsequent requests for grants
• Make sure that the scope of the investment associated with the relevant PCI and its costs and benefits is clearly defined and uniquely attributable to the PCI

6
Advancement
PCI Monitoring Results 2018
• 25 PCIs in the current list were on the 2015 PCI list in the same form• 5 of these PCIs made progress (2 moved from permitting to construction and 3
advanced into the permitting phase), 13 PCIs remained unchanged, 7 PCIs registered since 2015 a setback or “reverse progress”, i.e. they are currently in a less advanced status than before
• Decreasing number of PCIs for which no work was reported• However, in many cases no work was carried out, but the PCI is still reported to be
“on time”, which looks inconsistent• Only 5 PCIs advanced from one stage to the next one in 2017
Status as of31 January 2018:

PCI Monitoring Results 2018
Cost• Total investment costs for all projects in the 2017 PCI list amounts to €43.5
billion, €9 billion less than in 2015• Up variations mostly due to technical changes and/or more precise budget• Down variations mostly due to a more precise budget or revised calculations
• Promoters plan to invest €15 billion and €10 billion in 2022 and 2023 respectively, i.e. about 60% of the total investment costs within 5 years, 57% in just two years (2022-2023)
• At the same time, promoters indicated that the costs actually incurred since the first PCI list (October 2013, i.e. over >4 years), amount to €9.65 billion (about €2.5 billion p.a.)
• For the investment plans actually to be carried out by 2023 as indicated by the promoters, the pace of investment would have to accelerate in the next few years by almost 300% p.a. compared to the observed levels since 2013
• 54% of total investment costs for pipelines (incl. CS) is in the SGC (up from 42% in 2017), 51% of total CS power also occurs in the SGC
7

PCI Monitoring Results 2018
Planned Pipeline Infrastructure, Cost Factors• More than 17,000 km of planned PCI pipelines, 1,000 km less than in 2017 - approx.
2x the estimated length of pipelines to be constructed in Europe over the next few years as reported by industry sources (“probable pipeline projects in Europe”) -9,613 km. Moreover, industry assessment covers all Europe to the Urals
• Reasonably good correlation of reported cost to pipe diameter, length, max operating pressure, terrain, population density, onshore/offshore
• Considering UIC, promoters “prima facie” may overestimate investment costs. Reported cost >UIC by 46%, up from 33% in 2017. Still, in the majority of instances reported costs appear to remain within a reasonable range
8

PCI Monitoring Results 2018
Benefits
• Benefits assessment was provided in just 6 cases• The results of this and of all the previous monitoring round carried out by
the Agency repeatedly demonstrate that promoters are not in a position to provide clear and easily understandable quantified (monetised) data about the benefits of their projects, or have no intention of calculating monetised benefits
• The Agency hopes that the 2nd CBA methodology will enable promoters to properly assess the benefits of their projects, as repeatedly recommended by the Agency in its Opinions
• The Agency calls on project promoters to evaluate the monetised benefits of their projects and provide the result in their annual reports to the Agency
9

PCI Monitoring Results 2018
Commissioning• If past reported implementation patterns continue in the future, the commissioning
dates of some projects are likely to be postponed• High peak of investment in the few coming years, if commissioning is to take place
according to schedule… but few projects are reported to be under construction• A bit less than half of the PCIs are reported to be on time and the other half is
reported to have fallen behind schedule – in one year…• No PCIs were planned to be commissioned in the lifetime of the 2015 PCI list• Only 7 PCIs are planned to be commissioned during the lifetime of the current PCI
list, i.e. in 2018 and 2019
Expected year of commissioning by corridor:
10

PCI Monitoring Results 2018
Rescheduling, Delays• Rescheduling in most cases is the result of one or more of these:
• Re-prioritisation of the project’s implementation against other investments of the project promoter
• Changes due to complementarity with the rescheduled infrastructure investments of another project promoter
• Gas market uncertainties, changes in the gas demand/supply balance• Delay is most likely to occur due to one or more of these:
• Environmental issues (including re-routing and/or re-siting, problems with cultural heritage or other authority involved in the environmental procedure)
• Financing reasons• Permit granting process
• To resolve the issues that caused difficulties, promoters typically resort to:• Requests for government support for permitting and regulatory decisions• Entering into new commercial contracts with suppliers/shareholders• Undertaking risk management activities• Grants
11

PCI Monitoring Results 2018
Facilitating Project Advancement and Continuity
• Define a consistent set of key project milestones and use aligned lists of project description items by key stakeholders (NRAs / Agency, ENTSOG, the European Commission, and INEA)
• The 2-year period of validity of the PCI lists represents a much shorter timeframe than the typical life cycle duration of a PCI
• The Agency sees value in re-evaluating regularly the PCI status granted to projects, to ensure that they still make sense in an ever evolving context. The Agency sees the 2-year frequency for this exercise as appropriate
• However, the Agency recommends that consideration is also given to better reconciling the duration of the PCI list validity with the observed duration of the typical PCI life cycle
• The Agency recommends using the results of the monitoring of the progress of projects already on the PCI list in the selection for future PCI lists, to make sure that the continuous relevance and progress of projects over longer period of time are properly considered
12

Thank you for your
attention
Thank you for your attention
The views expressed in this presentation are those of the presenter and not necessarily of the Agency, any of its Boards, or any NRA.

Ten-Year Network Development Plan for gas (TYNDP 2018)
Stefano AstorriInvestment Subject Manager, System Development
Process, scenarios and European needs identification
Brussels, 7 November 20184th PCI Regional Groups
<Code>_Rev_0

2
1234
TYNDP 2018 Process
TYNDP 2018 Scenarios
ENTSOG 2nd CBA Methodology
Infrastructure gaps

3
1234
TYNDP 2018 Process
TYNDP 2018 Scenarios
ENTSOG 2nd CBA Methodology
Infrastructure gaps

4
TYNDP 2018 Report Main elements
Demand Scenarios
Supply Scenarios
PS-CBA
CBA 2.0
ProjectFiche
Part of TYNDP 2018
Adapted version applied to TYNDP 2018
Infrastruct.gaps
System Assessment
Infra. data& Map
PRJ Name PRJ Status Code Project Name
Physical Reverse Flow
at Moffat interconnection
point (IE/UK)
Less-Advanced TRA-N-829PCI 5.1.1 Physical Reverse Flow at Moffat inter point (IE/UK)
Physical Reverse Flow
at Moffat interconnection
point (IE/UK)
Less-Advanced TRA-N-1064 Moffat Physical Reverse Flow
Bidirectional Austrian -
Czech Interconnection
(BACI)
Advanced TRA-N-21 Bidirectional Austrian-Czech Interconnector (B
Project Main Information
TYNDP 2018 project draft list

5
TYNDP 2018 process: main steps
Gas and Elect. ENTSOs Scenario Development
Gas CBA Methodology 2.0
Inclusion of projects in TYNDP
System & needs assessment
Projects assessment**
Final TYNDPReportDraft TYNDP Report *
Public workshop, webinar, SJWS or Prime Mover WS
Consultation with the member statesPublic consultationSubmission of projects in TYNDP
Mar’16 Dec’16 Dec’17 Jul’18 Dec’18 Jun’19
Adapted CBAM (Oct)
CBAM EC approval (?)
ACER Opinion (2 months)
Sep’18
June-18: publication of TYNDP projects
Mid-Dec-18: publication identification of gaps
End Jun-19: publication of Final TYNDP
End Jan-19: publication PS-CBA
fiches
ENTSOG TYNDP 2018 will support European Commission 4th PCI process• Or after CBAM approval by Commission** For PCI applicants

6
TYNDP 2018 Project Collection> 207 investment submitted for TYNDP 2018 (link)for ~ 165 overall projects.> Concerning 37 countries> Of which 10 countries not being part of EU

7
1234
TYNDP 2018 Process
TYNDP 2018 Scenarios
ENTSOG 2nd CBA Methodology
Infrastructure gaps

8
TYNDP 2018 Scenario Building ProcessDec ’16 Dec ’17
Gas and electricity ENTSOs Scenario Building
Draft scenario storylines
25/04/2016
Public WebConsultation
12/06/2016
Workshop
Workshop
Scenario storylines
Workshop
02/06/2016 05/07/2016 10/10/2016
Public WebConsultation
Data collection
Scenario building process
Draft Scen.
Report
Final Scen.
Report
Public WebConsultation
Workshop
09/10/2017
02/10/2017 10/11/2017
Workshop
30/03/2018
A 2-year process with thorough stakeholder engagement

from TYNDP 2017….
9
Towards a joint scenarios development
To create a common framework on which assess consistently System and Infrastructure Projects
… to TYNDP 2018

10
What Regulation states..
> Annex V of Regulation (EU) No 347/2013, covering the methodology for a harmonized energysystem-wide cost-benefit analysis for projects of common interest, specifies that:(1) The methodology shall be based on a common input data set representing the Union’s electricity and
gas systems in the years n+5, n+10, n+15, and n+20, where n is the year in which the analysis isperformed.
> Art. 11.8 of Regulation (EU) No 347/2013,(1) By 31 December 2016, the ENTSO for Electricity and the ENTSO for Gas shall jointly submit to the
Commission and the Agency a consistent and interlinked electricity and gas market and networkmodel including both electricity and gas transmission infrastructure as well as storage and LNGfacilities, covering the energy infrastructure priority corridors and areas and drawn up in line with theprinciples laid down in Annex V. After approval of this model by the Commission according to theprocedure set out in paragraphs 2 to 4, it shall be included in the methodologies.
Why a joint exercise?

11
Scenarios overview
3 storylines reflecting future increasing uncertainty
All scenarios have been built as realistic and technically sound, aiming at reducing emissions by 80 to 95% in line with EU targets for 2050

Decarbonisation and energy efficiency reshape energy demand, with gas having a role in all demand sectors.Gas demand decrease in some scenarios. Natural gas partially compensated by renewable gas.
Gas to power stems from modelling power generation mix
Gas and electricity demand
Coordinated approach on heating and transport sectors
Coordinated approach on heating and transport sectors
Electricity demand Gas demandTwh/y
Twh/y

13
Decarbonisation of gas supply
Different scenarios foreseeing different levels of renewable gas penetration. Future infrastructure projects will more and more focus on integration of renewable and decarbonized gases.

14
Peak gas demand
Peak demand is a key element of infrastructure design. Gas peak demand is mostly maintained over time especially for power generation.
Gas peak demand TYNDP 2018 Historic gas and electricity consumption
Gas Peak Winter 17/18
GW
h/d
Electricity demand
Gas demand

15
Reaching EU’s climate targets with the gas infra
Hybrid system allows high CO2 reductions at low cost. Gas infrastructure can cope with increasing shares of renewable gas. Additional infrastructure could further support renewable gas integration and CO2 reduction.
0
500
1.000
1.500
2.000
2.500m
t CO
2 eq
uiva
lent
CO2 reductions in gas and electricity system
40% Reduction 60% Redution 80% Redution

16
TYNDP 2018 scenarios evolution
TYNDP 2018 scenarios on a narrower range compared to TYNDP 2017 while still ensuring to capture a big envelope of future development and ensure a robust infrastructure assessment.
For TYNDP 2017 the values for 2040 have been interpolated since available only until year 2035.
TWh/y Max TYNDP 2017

17
1234
TYNDP 2018 Process
TYNDP 2018 Scenarios
ENTSOG 2nd CBA Methodology(and its application to TYNDP 2018)
Infrastructure gapd

18
2nd ENTSOG CBA Methodology
ENTSOG has released its Adapted CBA Methodology forEuropean Commission approval> Main improvements:
more streamlined methodology
increased transparency
refined supply and supply price methodology
refined market modelling assumptions
indicators simplification
project grouping guidelines
compulsory cost provision
improved sensitivity analysisclickhere

19
TYNDP assesses the gas infrastructure against the Union energy policies
Is further infrastructure needed? (1)
Sustaina-bility
Security of supply
Market integration
Compe-tition
Are they achieved with the existing infrastructure and FID projects?
Yes
No further infrastructure needs
No
TYNDP assesses further infrastructure development
> FID projects + advanced projects> FID projects + 3rd PCI list projects> Single PS-CBAs
Existing + FID = Low infra level
Exist.+FID + Advanced= Advanced infra level
Exist.+FID + PCI 2nd list= PCI infra level
CBA Methodology as common metrics to system and project assessment

20
Is further infrastructure needed? (2)
System Assessment PS-CBA
Infrastructure Gaps ?
Does ADVANCED
projects solve the needs?
Does 3rd PCI projects solve
the needs?
Infrastructure Levels (assessed grid)
Existing + FID* projects
* before TYNDP 2018 project data collection ended
Existing + FID* + Advanced
projects
Existing + FID* + 3rd PCI projects
v
benefits of projects measured through INCREMENTAL
APPROACH against :
Existing + FID* projects
Existing + FID* + Advanced
projects
Infrastructure Levels

21
1234
TYNDP 2018 Process
TYNDP 2018 Scenarios
ENTSOG 2nd CBA Methodology
Infrastructure gaps

22
Security of supply
• Resilience to extreme temperature• Resilience to many supply and infrastructure disruptions
Market integration and competition• Most of Europe has access to diversified supply sources• Hub prices converge most of the time – especially in Western Europe
Sustainability• The existing EU gas infrastructure is generally already able to
complement renewable generation and integrate renewable gases
In specific areas further infrastructure needs remain
What the EU gas infrastructure already achieves

23
Competition

24
Supply Source Access (SSA)> Infrastructure perspective to the share of countries’ demand able to benefit from decrease of price of a given supply source> If 20%* of the demand can benefit from this decrease, the country is considered accessing the source> Tariffs pancaking effect allows for more realistic source spread among countries
2020 2030 (DG) 2040 (GCA)
* Given a certain threshold, supplies with a limited potential may not appear as an additional source for countries with large demand. Results are shown for selected scenarios
HR, GR, FY, RO showing limited number of sources in ST
BG, HR, DK, EE, GR, HU, PT, SI, ES, SE, showing limited number of sources in ST
BG, FY, EE, FI, LV, LT, RO, PT, ES show limited source differentiation.MT and CY isolated.

25
> Unreducible share of this source necessary for a country to cover its demand on a yearly basis> Cooperative approach: countries will align their dependence level as long as infrastructures allow for it> Dependence > 25% indicates that at least one quarter of the demand need to be supplied from this source
Supply Source Dependence (SSD) - Russia
Countries with SSD > 25% in other scenarios: AT, BE, SI, SE
Countries with SSD > 25% in other scenarios: DE and NL
Future situations improves for BH, BG, FY and RS thanks to FID projects
2020 2030 DG 2040 GCA
Results are shown for selected scenarios

26
> At EU level, limited dependence on LNG> Some country limitations still exist> LNG dependence considers LNG as single source (but tested also as multisource)
Supply Source Dependence (SSD) – Global LNG
Iberian peninsula showing even higher dependence in ST scenarios
Iberian peninsula showing limited dependence but increasing over time
2020 2025 (DG) 2030 (GCA)
Results are shown for selected scenarios

27
Supply needs over time
Access to new supply sources – indigenous or extra-EU - would contribute to maintain supply diversification and flexibility
TWh
max potential
min potential

28
> A country is better diversified from an infrastructure perspective if its entry are sufficiently balanced between its borders.
> Countries with LICD < 5000 considered sufficiently diversified in terms of capacity.
LNG and Interconnection Capacity diversification (LICD)
2020 2030 (DG) 2040 (GCA)
Results are shown for selected scenarios
Some SEE countries improves due to commissioning of FID projects

29
Market Integration

30
Price convergence
Marginal price can generally converge even in case of high price variation of Russian and LNG supply, with a rather Central-Western / Eastern Europe discrepancy in case of significantly high Russian or LNG price
2020
2040
RU max RU min LNG max LNG min
RU max
Results are shown for selected scenarios
> Refined supply methodology and tariffs inclusion allow to better identify price differentials> Projects may contribute to further price convergence
RU min LNG max LNG min

31
Security of Supply

32
Assessment of the resilience of the European gas system to cope with various stressful events>Climatic stressPeak day demand2-week cold spell
>Supply route disruptions in case of climatic stress*1. Ukraine route2. Belarus route3. Imports to Baltic states and Finland4. Algerian import pipelines
>Infrastructure disruptionSingle Largest Infrastructure disruption of each country, during a peak day
Risk of demand curtailment (CD)
*Based on risk groups defined by SoS regulation 2017/1938 (Annex I)

33
Climatic Stress – Peak day> The assessment shows that most of the EU gas system is resilient to Peak and 2-Week demand
situations> Only Croatia presents demand curtailment from 2025 onwards and FYROM only in 2025.
2020 2030 (DG) 2040 (GCA)
Results are shown for selected scenarios

34
2020
> Some countries (SEE) showing risk of curtailed demand in all scenarios due to infrastructure limitations> In ST Europe has not sufficient capacities of alternative import routes from Russian supply, impacting also
Western European countries
2030 – 2040 (DG/GCA) 2030 – 2040 (ST)
Supply Route Disruption - Ukraine
Results are shown for selected scenarios
Commissioning of FID projects allows more countries to share the risk.

2020
> Under Belarus transit disruption most of the gas system is resilient but Lithuania in all scenarios from 2030 onward Poland in ST
Supply Route Disruption - Belarus
2030 (DG) 2040 (ST)
Results are shown for selected scenarios

36
> Finland and Estonia exposed to a high risk of demand curtailment from 2020 onwards> Lithuania exposed from 2025 due to decommissioning of Klaipeda LNG
Supply Route Disruption - Baltic States and Finland
2020 2030 2040
Results are shown for selected scenarios

37
> Until 2030 European gas system is resilient to a disruption of all import pipelines from Algeria.> From 2030, whilst the EU is generally resilient, the Iberian Peninsula may be exposed to a limited risk of
demand curtailment in all scenarios resulting from an increasing peak demand in all scenarios.
Supply Route Disruption – Algeria pipelines
2020 2030 2040
Results are shown for selected scenarios

38
> It considers the disruption of the Single Largest Infrastructure disruption > The indicator is simulated and takes into account possible bottlenecks before the disrupted infrastructure
Largest Infrastructure Disruption
DK faces risk of curtailment in EUCO and ST while PL in EUCO but limited
More countries facing curtailment in DG and ST
Most exposed: SE, FI, EE, RO, GR, IE with BG and RS only in 2020
Results are shown for selected scenarios
> In ST (2030-2040), SLI disruption in Slovakia can expose all Europe to an overall gas shortage (≈400 GWh on a peak day)
2020 2030 2040

Adaptation of L-gas to H-gasNetherlands, Germany, Belgium and France markets are partly supplied with L-gas.
> Starting from 2020, part of the local gas demand in BE, FR and DE will be converted from L-gas to H-gas> L-H gas conversion is already considered in the Low assessment> ENTSOG will run Ps-CBAs for L-H gas projects

40
Next steps

41
Project-specific assessment process in TYNDP 2018
PS-CBA only on projects for which promoters have stated the intention to apply to PCI in point 1
>ENTSOG is currently running PS-CBA on project groups>List of project groups published by ENTSOG here>Promoters will be delivered with all main PS-CBA results

Thank You for Your Attention
ENTSOG -- European Network of Transmission System Operators for GasAvenue de Cortenbergh 100, B-1000 Brussels
EML:
WWW: www.entsog.eu
Stefano AstorriInvestment Subject Manager, System Development

43
Global Climate Action

44
Sustainable Transition

45
Distributed Generation

46
Peak Demand
Electricity peak demand TYNDP 2018 Gas peak demand TYNDP 2018

47
Ensuring the consistent assessment of the two key energynetworks of Europe against the same futures> The ENTSOs joint scenario building process for TYNDP 2020 has started,
after it was applied for the first time for TYNDP 2018.
> Scenarios cover all energy use, in Transport, Heating and Industry, andaddress the role of the energy carriers gas and electricity.
> Carbon emissions and RES integration are key features in the scenariodevelopment.
Joint ENTSOs Scenario Development
TYNDP 2020 scenario development has startedCarbon emissions and level of de-/centralisation are key features

48
Infrastructure level composition

49
CBA 2.0 Indicators
> For indicators in benefits from projects can be verified in terms ofmitigating/solving the identified infrastructure gaps up to a certainthreshold
> For all other indicators, any improvement from the current situation canbe considered as benefit from projects assessed in the PS-CBA phase

50
Limited Supply Source Access
2020 Shares per source for each country