Projected Impacts of the Doha Development Round on Egypt ... · TECHNICAL REPORT Projected Impacts...
42
TECHNICAL REPORT Projected Impacts of the Doha Development Round on Egypt’s Trade and Production A Global CGE Analysis SUBMITTED BY Peter J. Minor, Principal Associate Nathan Associates Inc. July 2006 www.nathaninc.com
Transcript of Projected Impacts of the Doha Development Round on Egypt ... · TECHNICAL REPORT Projected Impacts...

T E C HN I C A L R E PO R T
Projected Impacts of the Doha Development Round on Egypt’s Trade and Production A Global CGE Analysis
SUBMITTED B Y Peter J. Minor, Principal Associate Nathan Associates Inc.
July 2006 www.na than i nc . c om


This report was made possible through support provided by the United States Agency for International
Development. The opinions expressed herein are those of the authors and do not necessarily reflect the views of
the United States Agency for International Development.
The research was conducted under the direction of Peter Minor, Principal Associate, of Nathan Associates Inc,
in cooperation with the Egyptian Ministry of Trade and Industry Trade Policy Analysis Unit (TPAU). Data
and modeling support were carried out by Noha Khalifa, Noha Mahfouz, Nermeen El Meligy and Abeer M.
Alanwar.
For further information or for hardcopies of publications, please contact
Erin Endean
Nathan Associates Inc.
or
Peter Minor
Nathan Associates Inc.

II
Contents
1. Introduction 1
2. Methodology and Data 3
Global and Single Country Models 3
CGE Assumptions 4
GTAP Database 5
3. Status of Doha Round Negotiations 11
Agricultural Market Access 12
Nonagricultural Market Access 15
Other Issues 18
4. Results of GTAP Simulations 21
Welfare Impact by Region 21
Welfare Impact by Economic Element 23
Impact on Egypt’s Trade and Production 24
5. Conclusions 35

ILLUSTRATIONS
Figures
Figure 41. Percent Change in Egypt’s Agricultural Exports Due to Doha Round 27 Figure 42. Percent Change in Egypt’s Agricultural Imports Due to Doha Round 27 Figure 43. Percent Change in Egypt’s Production Due to Doha Round 28 Figure 44. Percent Change in Egypt’s Imports of Nonagricultural Products
Due to Doha Round 31 Figure 45. Percent Change in Egypt’s Exports of Nonagricultural Products
Due to Doha Round 31 Figure 46. Percent Change in Egypt’s Output of Nonagricultural Products
Due to Doha Round 32
Tables
Table 11. Impacts of Doha Liberalizations—Counting the Impacts Across Borders 4 Table 12. GTAP Sectors and Regions for CGE Global Model for Egypt 6 Table 31. Agricultural Export Subsidies 12 Table 32. Harbinson Tiered Tariff Cutting Formula for Agriculture in CGE Scenarios of
Egypt’s Market Access in the Doha Round 14 Table 33. Ranges of Proposed TariffCutting Formulas for Agriculture, June 2006 14 Table 34. Egypt's Trade Weighted Average Agricultural Import Applied Tariffs,
2004, with Proposed Harbinson Reductions 16 Table 35. Egypt's Average Nonagricultural Import Applied Tariffs, 2004,
with Proposed Girard Formula Reductions 17 Table 41. Regional Welfare Impacts of WTO Market Access Proposals for
Agricultural and Nonagricultural Products 22 Table 42. Decomposition of Welfare Impacts of WTO Market Access Proposals for
Agriculture and Nonagricultural Products, by Region 24 Table 43. Impacts of Doha Proposals on Egypt’s Agricultural Trade 26 Table 44. Impact of Doha Proposals on Egypt’s Agricultural Output 28 Table 45. Impact of Doha Proposals on Egypt’s Nonagricultural Trade 29 Table 46. Impact of Doha Proposals on Egypt’s Nonagricultural Output 32 Table 47. Impact on of Doha Proposals on Egypt’s Services Trade 33

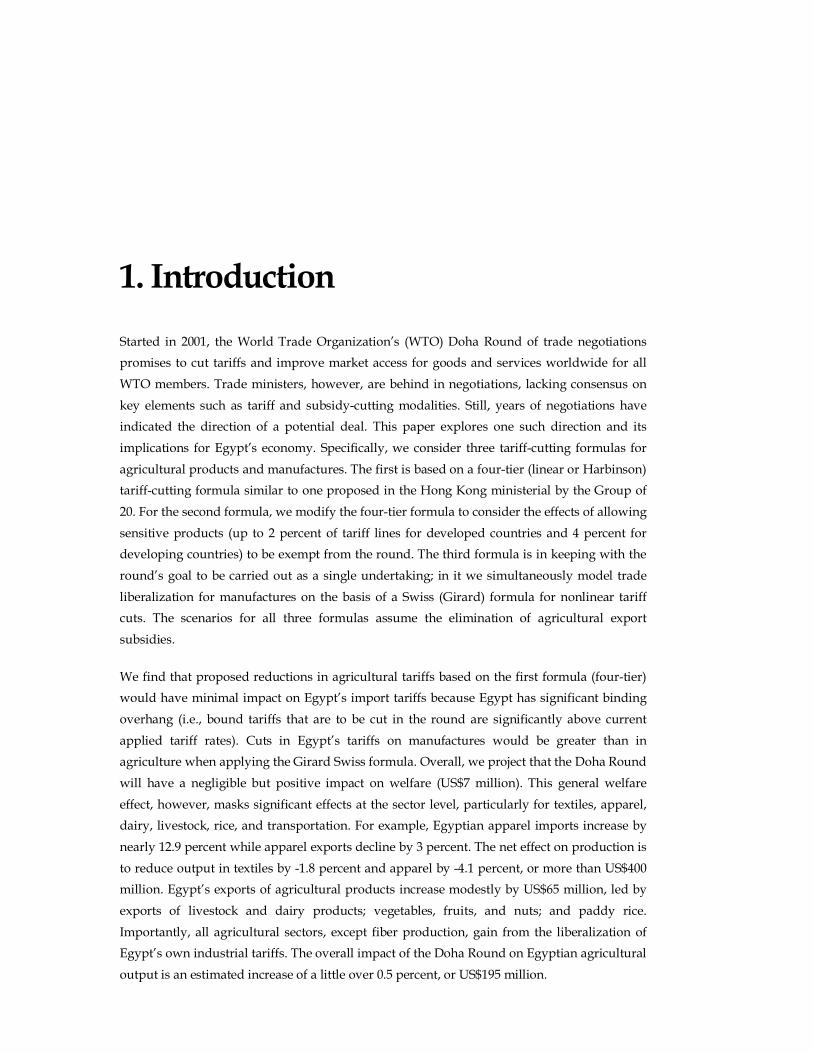
1. Introduction
Started in 2001, the World Trade Organization’s (WTO) Doha Round of trade negotiations promises to cut tariffs and improve market access for goods and services worldwide for all WTO members. Trade ministers, however, are behind in negotiations, lacking consensus on key elements such as tariff and subsidycutting modalities. Still, years of negotiations have indicated the direction of a potential deal. This paper explores one such direction and its implications for Egypt’s economy. Specifically, we consider three tariffcutting formulas for agricultural products and manufactures. The first is based on a fourtier (linear or Harbinson) tariffcutting formula similar to one proposed in the Hong Kong ministerial by the Group of 20. For the second formula, we modify the fourtier formula to consider the effects of allowing sensitive products (up to 2 percent of tariff lines for developed countries and 4 percent for developing countries) to be exempt from the round. The third formula is in keeping with the round’s goal to be carried out as a single undertaking; in it we simultaneously model trade liberalization for manufactures on the basis of a Swiss (Girard) formula for nonlinear tariff cuts. The scenarios for all three formulas assume the elimination of agricultural export subsidies.
We find that proposed reductions in agricultural tariffs based on the first formula (fourtier) would have minimal impact on Egypt’s import tariffs because Egypt has significant binding overhang (i.e., bound tariffs that are to be cut in the round are significantly above current applied tariff rates). Cuts in Egypt’s tariffs on manufactures would be greater than in agriculture when applying the Girard Swiss formula. Overall, we project that the Doha Round will have a negligible but positive impact on welfare (US$7 million). This general welfare effect, however, masks significant effects at the sector level, particularly for textiles, apparel, dairy, livestock, rice, and transportation. For example, Egyptian apparel imports increase by nearly 12.9 percent while apparel exports decline by 3 percent. The net effect on production is to reduce output in textiles by 1.8 percent and apparel by 4.1 percent, or more than US$400 million. Egypt’s exports of agricultural products increase modestly by US$65 million, led by exports of livestock and dairy products; vegetables, fruits, and nuts; and paddy rice. Importantly, all agricultural sectors, except fiber production, gain from the liberalization of Egypt’s own industrial tariffs. The overall impact of the Doha Round on Egyptian agricultural output is an estimated increase of a little over 0.5 percent, or US$195 million.

2
In the following pages, we review our analytical methodology and data sources, review the status of the Doha Round negotiations, and present sectorbysector and countrybycountry breakdowns of our model’s results.
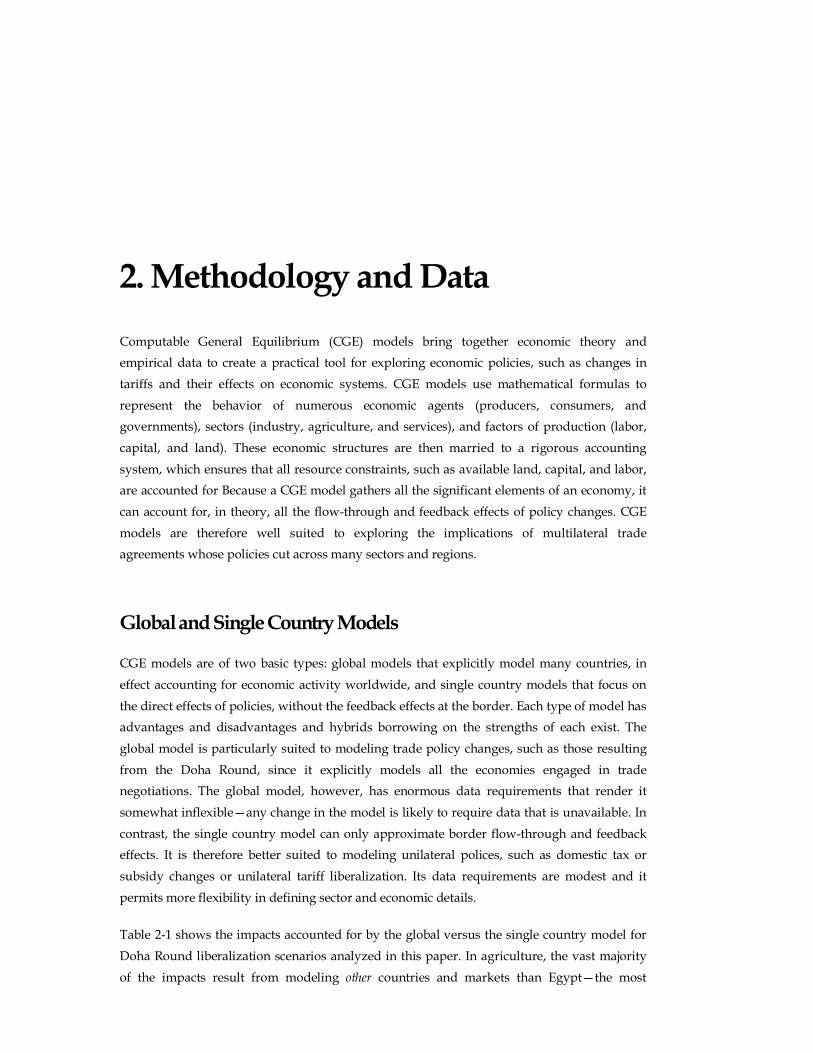
2. Methodology and Data
Computable General Equilibrium (CGE) models bring together economic theory and empirical data to create a practical tool for exploring economic policies, such as changes in tariffs and their effects on economic systems. CGE models use mathematical formulas to represent the behavior of numerous economic agents (producers, consumers, and governments), sectors (industry, agriculture, and services), and factors of production (labor, capital, and land). These economic structures are then married to a rigorous accounting system, which ensures that all resource constraints, such as available land, capital, and labor, are accounted for Because a CGE model gathers all the significant elements of an economy, it can account for, in theory, all the flowthrough and feedback effects of policy changes. CGE models are therefore well suited to exploring the implications of multilateral trade agreements whose policies cut across many sectors and regions.
Global and Single Country Models
CGE models are of two basic types: global models that explicitly model many countries, in effect accounting for economic activity worldwide, and single country models that focus on the direct effects of policies, without the feedback effects at the border. Each type of model has advantages and disadvantages and hybrids borrowing on the strengths of each exist. The global model is particularly suited to modeling trade policy changes, such as those resulting from the Doha Round, since it explicitly models all the economies engaged in trade negotiations. The global model, however, has enormous data requirements that render it somewhat inflexible—any change in the model is likely to require data that is unavailable. In contrast, the single country model can only approximate border flowthrough and feedback effects. It is therefore better suited to modeling unilateral polices, such as domestic tax or subsidy changes or unilateral tariff liberalization. Its data requirements are modest and it permits more flexibility in defining sector and economic details.
Table 21 shows the impacts accounted for by the global versus the single country model for Doha Round liberalization scenarios analyzed in this paper. In agriculture, the vast majority of the impacts result from modeling other countries and markets than Egypt—the most

4
significant concessions will be made abroad and will affect Egypt’s agricultural sector. 1 For manufactures, most impacts are the result of Egypt’s own liberalization. Still, about onethird of impacts result from changes beyond Egypt’s borders, such as preference and competitiveness erosion. Services, whose proposed Doha liberalizations were not included here, are affected primarily by events in Egypt; border effects are limited ,since all services impacts are indirect, resulting from liberalizations modeled in agriculture and manufactures.
Table 21 Impacts of Doha Liberalizations—Counting the Impacts Across Borders
Sector Global Model Single Country Model
Agriculture 100% 21%
Manufactures 100% 66%
Services 100% 85%
SOURCE: GTAP model and database 6.2.
CGE Assumptions
Despite the advantages of a CGE model, results must be interpreted with care. Modeling any economy requires some abstraction and some assumptions and CGE models can be sensitive to data and formula specifications. For example, is the textile industry best modeled as perfectly competitive, as monopolistic, or as something in between? Is unskilled labor a scare resource or is it in surplus? Is the trade balance fixed or is there room for macroeconomic adjustments, such as increased foreign investment? Often, answers to such questions are not clear and results can be sensitive to assumptions. It is best to support CGE analysis with detailed industry studies and analysis from other models. Any conclusions should be probed and questioned, not only to ascertain their validity, but also to ensure understanding of their full consequences. One economist likens the CGE process to the “the economist’s laboratory.”
GENERAL TRADE AND ANALYSIS PROJECT (GTAP) ASSUMPTIONS
The CGE model employed here, the GTAP model and data, is multiregion and multisector, and assumes perfect competition and constant return to scale in all markets. 2 These rather strong assumptions are best applied to markets with relatively homogenous products.
1 We do not model domestic support liberalization, which would only increase the global impacts on Egypt. 2 Publicly available variations of the GTAP model allow for imperfect competition and increasing returns to
scale. A small country variation of the GTAP model can be easily employed using the Crusoe suite of applications available for free.

5
Moreover, the standard GTAP model is a comparative static model, so, while the demand for investment is modeled, the net change in productive capacity resulting from such investment is not. Such “dynamic” effects of investment can be explored with the GTAP “Dyn” model, which allows modeling expanded production capacities resulting from investment decisions—but this extension is not employed here. Because the GTAP model is a comparative static model, and it does not model the dynamic effects of policies, its results must be seen as somewhat conservative. Even so, the model can provide powerful insights into the underlying data and mechanisms of economic change resulting from policies being negotiated in the Doha Round.
MODELING ASSUMPTIONS OR CLOSURE
CGE models are built on microeconomic foundations of industry supply and demand. At some point, however, a modeler must make assumptions about how the macro economy including capital flows, interest rates, employment, wages, and government budgets, will behave. These macro aspects are often referred to as closures, or how the economist views the macro economy, and closes the economic system’s link between the micro and macro economy. For our analysis, we make assumptions about unemployment and trade balances. We assume unemployment in all countries except the developed countries of the United States, European Union, and Japan. This closure is achieved by fixing the real wage 3 of unskilled labor. Semiskilled and skilled labor are assumed to be in limited supply in all regions, but to be mobile between sectors. Next, we assume that all countries, other then the developed countries and the emerging Asian giants (India and China), have fixed trade balances. The trade balance is an important macroeconomic variable because it is tied to capital markets and capital flows. For a country to systemically change its balance of trade in goods and services, it must incur significant changes in capital flows, either through domestic savings or foreign investment. 4 So, in essence, when modelers allow the trade balance to change, they are making assumptions about savings and investment.
GTAP Database
A global CGE model requires an enormous amount of data on topics from trade flows, border protection, and industry cost structures to consumption and investment. The GTAP database summarizes these data into 57 sectors and 92 countries—no other database provides such comprehensive coverage. After consulting with Egypt’s Ministry or Trade, we narrowed the 92 countries to 12 of strategic importance to the trade negotiations and the 57 sectors to 26 (Exhibit 21).
3 In a CGE model, prices only matter in relative terms and must be measured against other prices to be meaningful. The real wage is therefore fixed, instead of the nominal wage.
4 This is known in macroeconomics as SI = X – M.

6
Exhibit 21 GTAP Sectors and Regions for CGE Global Model for Egypt
COUNTRY AND REGIONS
Central America, China (PRC, Taiwan and Hong
Kong), European Union, India, Japan, Least
Developed Countries, MERCOSUR, Mexico, United
States, Rest of World ROW, Rest of the Middle East
SECTORS
Agricultural—cereal and feed, fibers (cotton, wool,
flax).; livestock and dairy; processed food,
beverages, and tobacco; paddy rice; processed rice;
vegetables, fruit, nuts; vegetables, oil and fats;
wheat; other agriculture
Nonagricultural—apparel and leather products;
textiles; cars and transport equipment; chemicals;
machinery and electric equipment; metal products;
minerals (e.g. cement); metals (ferrous and non
ferrous); wood, pulp and paper; energy (coal, oil
and gas); other manufactures
Services—electric distribution; construction; trade
and finance; transport and communication; other
services
Publicly available and widely used, 5 the GTAP database is benchmarked to 2001, the last year for which comprehensive data on global trade and protection were assembled. For the research presented in this paper, the authors updated the 2001 database to include
• Egypt’s 2004 tariff schedule; • U.S. applied duties for 2005 reflecting the Qualified Industrial Zones (QIZ) program; • Tariffs for the EU adjusted for EU enlargement; and
• WTO concessions resulting from the Uruguay Round scheduled for implementation through 2004.
The database used for simulations is an adjunct to the standard GTAP trade and protection database created by the Centre d’Etudes Prospectives et d’Informations Internationales (CEPII) with the United Nations Trade and Development Committee (UNCTAD) and the WTO. Key elements of the GTAP database are summarized below.
GTAP BILATERAL TRADE DATABASE, 2001
At the core of the GTAP database are comprehensive sets of data on bilateral trade and trade barriers for more than 100 countries at the Harmonized Schedule (HS) sixdigit level for 2001. Data are collected from the United Nations, the WTO, and national sources. Trade flows (imports and exports) reported by national authorities are combined and scored for consistency and quality on an HS6 and reporter basis over five years. Based on this quality
5 The standard GTAP framework and database is documented in Global Trade Analysis: Modeling and Applications, T.W. Hertel (ed.), published in 1997 by Cambridge University Press. A detailed discussion of the databases is in Dimaranan, Betina V. (2006), Global Trade, Assistance, and Production: The GTAP 6 Data Base, Center for Global Trade Analysis, Purdue University and at https://www.gtap.agecon.purdue.edu/ databases/v6/v6_doco.asp

7
score, bilateral trade flows are developed such that one country’s imports equal the partner country’s exports with adjustments for trade and transportation margins. Trade data are known to suffer high incidences of reporting errors (Exhibit 22), so the virtue of this methodology should not be underestimated. But ensuring accuracy requires gathering data from more than 100 countries, and variations in reporting schedules cause significant time lags. Researchers must then make a trade off: use recent national statistics that are likely to contain under or overreporting errors of 50 percent or 100 percent or more, or use older data corrected on the basis of trading partners’ reporting. Egypt’s imports and exports are consistently underreported in important categories, which means that recent data (2004) are of uncertain value unless crosschecked extensively. For our analysis we use the balanced trade data for 2001.
Exhibit 22 Are Recent Data Better Data?
Many in the trade community believe that up to date
trade data are more accurate because they reflect recent
events. Trade data, however, are notoriously error laden.
Compare the value of Egypt’s reported exports of
apparel in 2002 (US$142 million) (UNCOMTRADE
database) to the value of U.S. and EU imports of apparel
from Egypt over the same period (US$981 million). 6 To
eliminate such errors, the GTAP program relies on
comparisons of reporters and partner’s data. For
example, the GTAP database reports Egypt’s exports of
apparel for 2001 as US$701 million, while
Egyptian exports reported to the UN are
US$148 million. Making systemic corrections to
trade data requires a large number of
reporters—and that causes significant lags in
reporting. Crosschecking data for trade
statistics is important and accuracy may often
be more valuable than timeliness. Other data,
such as on tariffs, are reliable and more recent
data are preferred.
GTAP PROTECTION DATABASE
GTAP’s unique database on border protection is the result of a joint project of UNCTAD, the WTO, and CEPII. The objective of the project is to create a comprehensive source of WTO and applied tariff protection data. A key feature of the protection database is the estimation of ad valorem equivalents (AVEs) of specific tariff rates and tariff rate quotas. Estimating AVEs of specific duties requires representative reference price data of a country’s typical import values “butfor” the duties.
The “butfor” caveat is a significant problem because specific duties often distort trade values, usually shifting imports to higher value products that are less sensitive to duties. The result is that estimates of advalorem specific rates tend to be understated, especially in less developed countries where large segments of the consuming population are extremely sensitive to
6 Changing Trade Rules for Textiles and Apparel: Egyptian Market Access, January 2004, Nathan Associates Inc.

8
higher prices resulting from specific duties. These estimates are important for the agriculture, food, and food product sectors, where they are commonly used in place of traditional ad valorem tariffs. The use of specific duties is far less prevalent in manufacturing and resources, although petroleum frequently attracts a standard, relatively low specific tax rate. The trade and protection database estimates reference prices for converting specific duties based on several regional and product groupings that take into account a country’s level of development. This minimizes serious errors due to the use of distortionladen data. The protection database is based on tariff and trade data available in 2001.
Another important aspect of the protection database is its emphasis on bilateral protection, accounting for trade preferences that create protection rates that vary between countries on a bilateral basis. This is in sharp contrast to traditional protection databases that often report protection data on a singular basis, representing either MFN duties or averages of both preferential tariffs and MFN protection. In presenting a reasonably accurate representation of actual as opposed to average protection levels the protection database enhances analytical power.
The WTO Uruguay Round succeeded in eliminating most quantitative barriers to trade by requiring members to tariffy all such barriers. Here the intent was to make protection levels transparent, but the resulting system of tariff rate quota levels (TRQs) is equally complex and obscure. TRQs obscure protection levels because they stratify tariff data on the basis of realized import levels, resulting in rents to quota holders. The protection database estimates the value of TRQs on the basis of their marginal values, which is the level of protection for the last good entered under the stratified system. Moreover, rents are estimated on the basis of quota rights, further enhancing analytical power in estimating the effects of TRQs on welfare and distributional gains.
CEPII DOHA MARKET ACCESS SCENARIOS
The Doha Round seeks to reduce and even eliminate tariffs and trade barriers worldwide. Member countries have agreed that the basis of market access negotiations will be 2001 most favored nation (MFN) bound duties. For many countries, especially developing countries, a significant attribute of MFN bound duties is that they often exceed MFN applied rates and preferential rates. Negotiators refer to this gap as the “binding overhang.” 7 Why is binding overhang important? In applying the Doha Round tariffreduction formulas one must use bound rather than applied rates, but to accurately calculate the effects of tariffreduction formulas, one must work through bound rates to find the effective cut to applied rates, if any. To do this, the standard GTAP database of applied and preferential tariffs must be augmented to include MFN bound and applied tariff rates. CEPII has undertaken the enormous task of
7 See Binding Overhang and TariffCutting Formulas: A Systematic, WorldWide Quantitative Assessment, Mohamed Hedi Bchir, Sebastian, Jean and Laborde, David, May 30 2005, CEPII.

9
converting the WTO CEP database to the HS6 level and matching it to the GTAP database of HS6 bilateral applied tariffs and trade. After matching WTO bound rates to the GTAP applied and preferential rates, CEPII researchers calculated ten scenarios to illustrate significant possible outcomes of the Doha market access negotiations, as follows: 8
• S1—Agricultural cuts based on a harmonizing (Swiss or nonlinear) formula; • S2—Agricultural cuts based on a harmonizing formula (S1) with 2% sensitive products; • S3—Agricultural cuts based on a harmonizing formula (S1) with 5% sensitive products; • S4—Agricultural proportional cuts based on a fourtier formula; • S5—Agricultural proportional cuts based on a fourtier formula with 2% sensitive products; • S6—Agricultural cuts with harmonizing formula (S2) with a 200% tariff cap; • S7—Agricultural cuts with light harmonizing formula; • S8—Agricultural cuts based on harmonizing formula (S1) and 50% cuts in nonagricultural
market access (NAMA) for developed countries and 33% cut for developing countries and 0% cut for LDCs;
• S9—Agricultural cuts based on harmonizing formula (S1) and NAMA cuts based on a nonlinear Swisstype (Girard) formula with a coefficient of 1 for developed countries and 2 for developing countries and LDCs get the round for free;
• S10—Developed countries cut (S1) and NAMA at 50% cut for all countries.
UPDATING GTAP DATABASE OF TRADE AND TARIFFS
To more accurately estimate the impacts of Doha tariff cuts, the base GTAP tariff database is updated at the HS6 level for several important events. Before any simulations are run, tariffs are altered to account for
• The expansion of the EU15 to the EU25 requiring the elimination of selected tariffs and duties for the ten acceding countries as well as setting their prior tariffs to the EU Common External Tariff (CET);
• The remaining Uruguay Round tariff and duty reductions to be phased out by the end of 2004;
• The accession of China and Taiwan to the WTO in 2002;
• The implementation of the US QIZ program for Egypt with U.S. average applied rates for 2005; and
• The updating of Egyptian tariffs to 2004 MFN bound and applied rates.
In addition to these modifications to tariff schedules, we simulate the implementation of the WTO Agreement on Textiles and Clothing (ATC) on trade shares.
8 See, Binding Overhang and TariffCutting formulas: A Systematic, Worldwide Quantitative Assessment by Bchir, Mohamed Hedi, Sébastien Jean and David Laborde, presented at the Eighth Annual Conference on Global Economic Analysis, Lübeck, Germany. See also, Consequences of Alternative Formulas for Agricultural Tariff Cuts by Jean, Sébastien, David Laborde and Will Martin, in Agricultural Reform and the Doha Development Agenda, Washington, D.C., The World Bank.

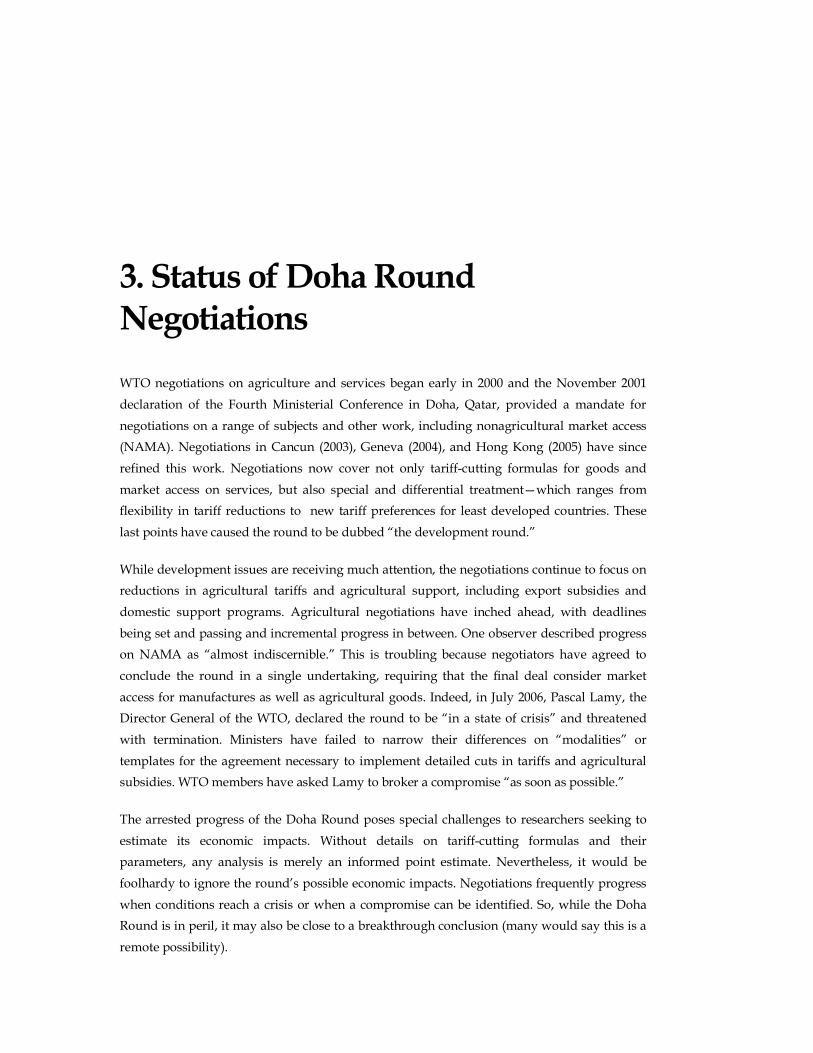
3. Status of Doha Round Negotiations WTO negotiations on agriculture and services began early in 2000 and the November 2001 declaration of the Fourth Ministerial Conference in Doha, Qatar, provided a mandate for negotiations on a range of subjects and other work, including nonagricultural market access (NAMA). Negotiations in Cancun (2003), Geneva (2004), and Hong Kong (2005) have since refined this work. Negotiations now cover not only tariffcutting formulas for goods and market access on services, but also special and differential treatment—which ranges from flexibility in tariff reductions to new tariff preferences for least developed countries. These last points have caused the round to be dubbed “the development round.”
While development issues are receiving much attention, the negotiations continue to focus on reductions in agricultural tariffs and agricultural support, including export subsidies and domestic support programs. Agricultural negotiations have inched ahead, with deadlines being set and passing and incremental progress in between. One observer described progress on NAMA as “almost indiscernible.” This is troubling because negotiators have agreed to conclude the round in a single undertaking, requiring that the final deal consider market access for manufactures as well as agricultural goods. Indeed, in July 2006, Pascal Lamy, the Director General of the WTO, declared the round to be “in a state of crisis” and threatened with termination. Ministers have failed to narrow their differences on “modalities” or templates for the agreement necessary to implement detailed cuts in tariffs and agricultural subsidies. WTO members have asked Lamy to broker a compromise “as soon as possible.”
The arrested progress of the Doha Round poses special challenges to researchers seeking to estimate its economic impacts. Without details on tariffcutting formulas and their parameters, any analysis is merely an informed point estimate. Nevertheless, it would be foolhardy to ignore the round’s possible economic impacts. Negotiations frequently progress when conditions reach a crisis or when a compromise can be identified. So, while the Doha Round is in peril, it may also be close to a breakthrough conclusion (many would say this is a remote possibility).
12
In the following sections, we review the status of negotiations for agricultural and nonagricultural tariff reductions. In reviewing proposals we can narrow the possibilities for proposed modalities or tariffcutting formulas; and in comparing the current state of negotiations to the ten CEPII scenarios, we can narrow our field of analysis to three scenarios:
• S4—Agricultural proportional cuts based on a fourtier formula,
• S5—Agricultural proportional cuts based on a fourtier formula with 2% sensitive products, and
• S9—Agricultural cuts based on harmonizing formula (S1) and NAMA cuts based on a nonlinear Swisstype (Girard) formula with a coefficient of 1 for developed countries and 2 for developing countries and LDCs get the round for free.
Agricultural Market Access
Agricultural negotiations, which concern market access (tariffs), export subsidies, and domestic support, are among the most contentious in the round. Developed country tariffs and domestic support are significant and developing countries are seeking better access for their products. Negotiations of cotton tariffs and subsidies have become a rallying point for developing countries.
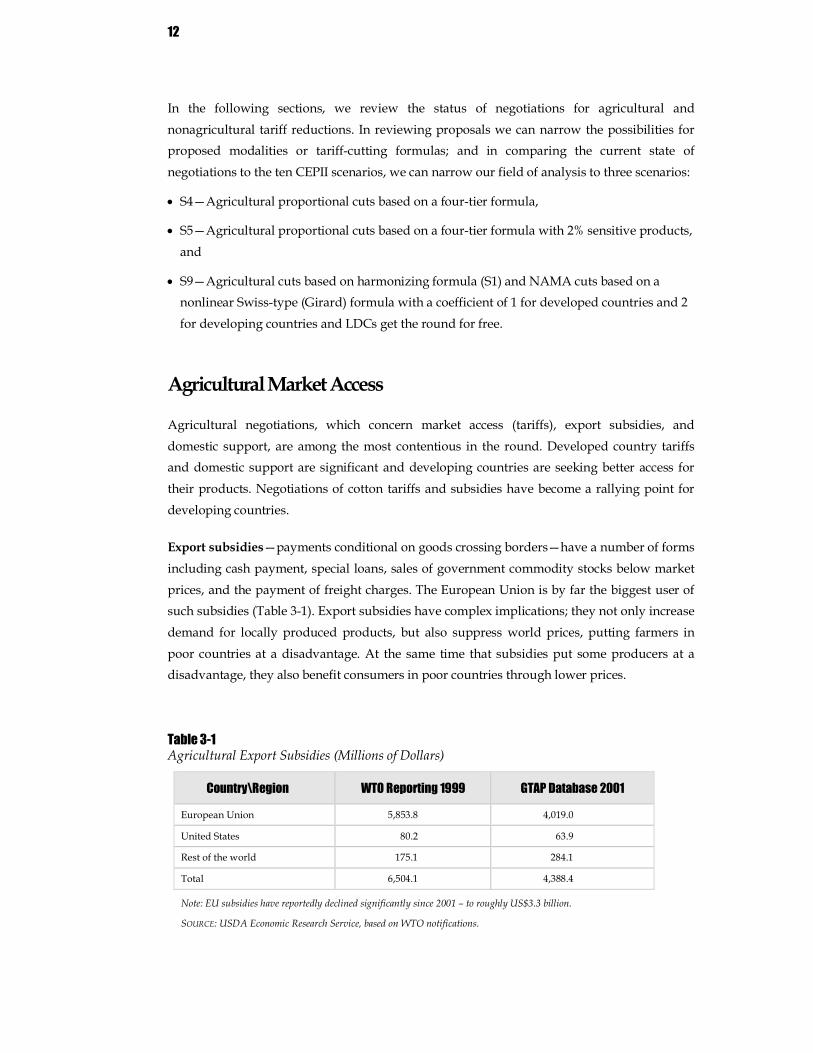
Export subsidies—payments conditional on goods crossing borders—have a number of forms including cash payment, special loans, sales of government commodity stocks below market prices, and the payment of freight charges. The European Union is by far the biggest user of such subsidies (Table 31). Export subsidies have complex implications; they not only increase demand for locally produced products, but also suppress world prices, putting farmers in poor countries at a disadvantage. At the same time that subsidies put some producers at a disadvantage, they also benefit consumers in poor countries through lower prices.
Table 31 Agricultural Export Subsidies (Millions of Dollars)
Country\Region WTO Reporting 1999 GTAP Database 2001
European Union 5,853.8 4,019.0
United States 80.2 63.9
Rest of the world 175.1 284.1
Total 6,504.1 4,388.4
Note: EU subsidies have reportedly declined significantly since 2001 – to roughly US$3.3 billion.
SOURCE: USDA Economic Research Service, based on WTO notifications.

13
Members have agreed to eliminate export subsidies, but the timeline over which they would be phased out is a point with little agreement. The EU favors a long period to phase out subsidies while the United States prefers elimination within five years. In the scenarios that follow, the assumption is that all export subsidies are phased out—no time line of phasing is implied.
Domestic supports are subsidies and programs that assist agricultural sectors within a country’s borders and that are not conditional on exporting. Supports are used almost exclusively by developed countries, and developing countries are pressing for their elimination ehven though many of them are unwilling to make concessions in market access. Progress on domestic support and market access has been especially difficult as the United States and EU take opposite positions on liberalization in each area. The United States uses supports far more than the EU, which uses tariffs as its primary means of protection. Negotiators have agreed to “substantial reductions” in domestic support mechanisms that affect trade, but current offers are linked to progress in other areas of agricultural negotiations, as well as nonagricultural products and services. Domestic interest groups are influential and any deal will likely consist of a series of compromises.
At the end of the 2005 Hong Kong negotiations, ministers overcame two hurdles to agricultural market access by agreeing to use ad valorem tariff equivalents (AVE) of specific duty rates as well as proportional and tiered rate cuts for agriculture. Two of the CEPII scenarios, S4 and S5 were (crafted well before the ministerial) are based on a tiered formula cut known as the Harbinson proposal 9 (July 2003j). The Harbinson proposal was the result of significant consultations and negotiations, but was ultimately rejected in later rounds. Many observers, recognizing the significant input and consultation that the proposal embodied, believe that a final deal will likely reflect many elements of the Harbinson proposal. Table 32 presents the Harbinson proposal and tariffcutting formulas for developed and developing countries.
The major elements of the Harbinson proposal include four tiers based on base bound rates and differential tariff cuts for developed and developing countries. The tariff cuts for developed countries range from 40 to 60 percent and the cuts for developing countries are close to twothirds of the developed countries’ cuts.
9 World Trade Organization, TN/AG/W/1/Rev.1 18 March 2003

14
Table 32 Harbinson Tiered Tariff Cutting Formula for Agriculture in CGE Scenarios of Egypt’s Market Access in the Doha Round
Band
Developed Countries Developing Countries
Tariff Range Cut Tariff Range Cut 1 < 15% 40% < 20% 25%
2 15% 90% 50% 20% 60% 30%
3 > 90 60 60% 120% 35%
4 > 120% 40%
SOURCE: WTO July 2003 Doc 031585.
Table 33 presents the range of proposals on the negotiating table as of June 2006 for the United States, EU, and G20. The last row in the table presents a description of the CEPII\Harbinson cuts used in our analysis. The U.S. proposal calls for the most aggressive tariff cuts, the EU is proposing more modest cuts, and the G20 proposal is between the two. The Harbinson proposal that we use (Table 32) is between the US and EU proposals and close to the G20 proposal. Many observers expect exactly this type of outcome, one that is between the U.S. and EU proposals, if any. The tariffcutting formulas tabled for developed countries are roughly twothirds the developing countries’ cuts.
Table 33 Ranges of Proposed TariffCutting Formulas for Agriculture, June 2006
Proposer
Developed Countries Developing Countries
Tariff Range Cut Tariff Range Cut United States 55 90 % 2/3 of developed
countries’ cut European Union 2060% 2/3 of developed
countries’ cut G20 4575% 2/3 of developed
countries’ cut CEPII Harbinson Proposal
4060% 2/3 (2640)
SOURCE: Trade Bridges, June 2006 and other sources.
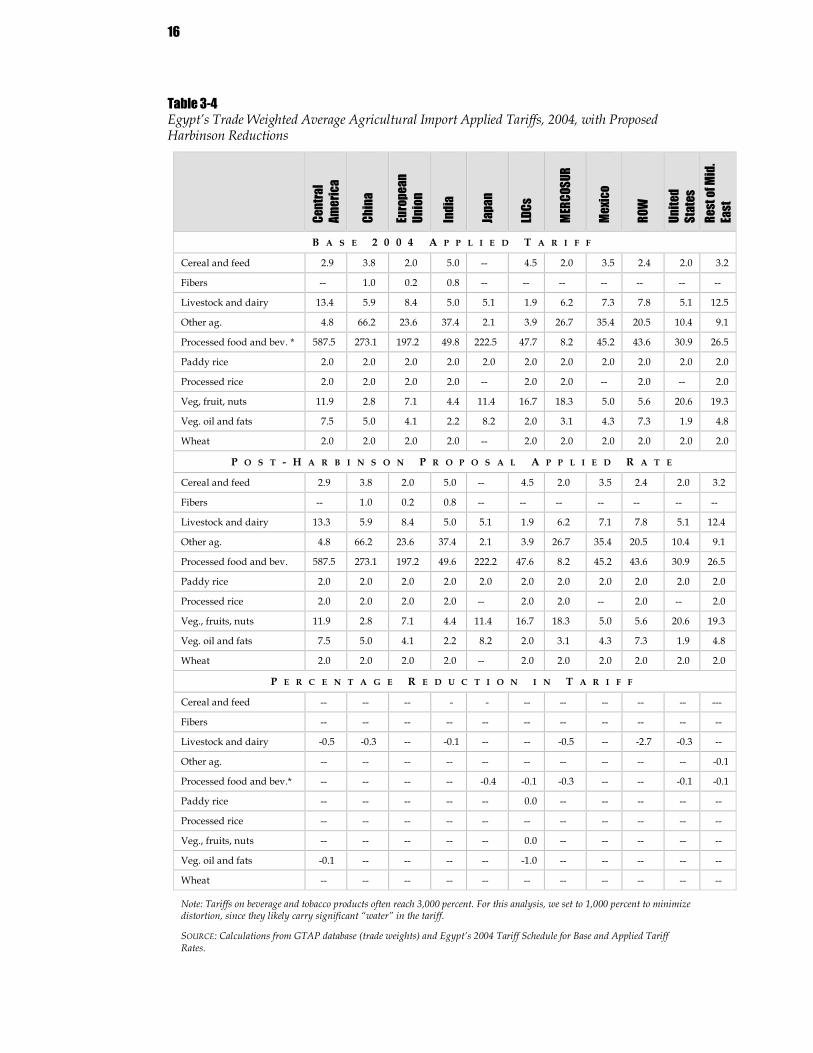
A significant parameter of the cuts, the tariff ranges, is less clear, and could have significant impacts on the final cuts of the round. Table 34 presents the implications of applying the Harbinson proposal to Egypt’s 2004 tariff schedule. The changes reflect the impact of cutting MFN bound rates on applied rates. Of significance to Egypt, the Harbinson proposal has only minimal effects on 2004 applied agricultural tariff rates. Cuts in applied rates are minimal, with a peak cut of 2.7 percent on certain livestock and dairy products. The minimal impact of the Harbinson proposal on Egypt is due in large part to Egypt’s MFN bound tariffs on agricultural imports being higher than its 2004 applied rates, resulting in significant binding overhang on agricultural products. Another significant attribute, and a major issue to be addressed in the Doha Round, are “sin” taxes on alcohol and tobacco, which in Egypt peak at
15
3,000 percent. Alcohol and tobacco are the only product areas that could be significantly affected by the Harbinson proposal. It seems unlikely, however, that countries will agree to reduce these tariffs significantly, much less eliminate them. Table 34, therefore, excludes alcohol and tobacco from any tariffcutting formula, either as sensitive products or another basis yet to be defined in the round. 10 This assumption is probably much more realistic.
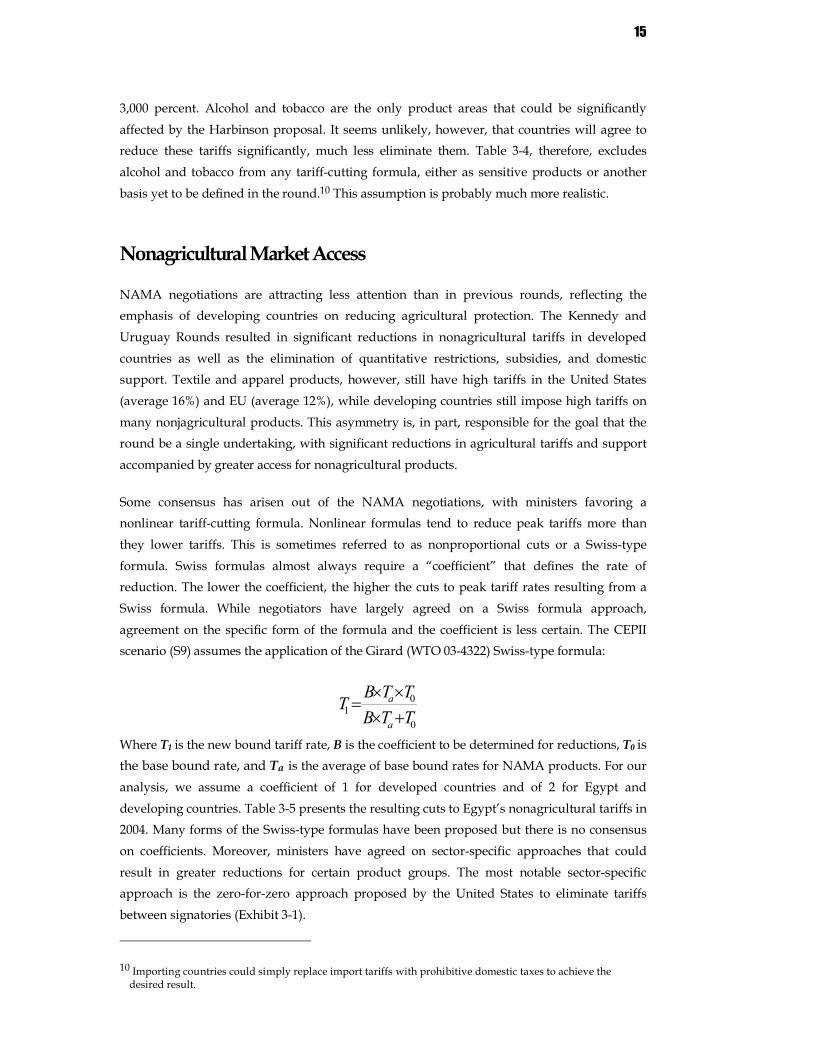
Nonagricultural Market Access
NAMA negotiations are attracting less attention than in previous rounds, reflecting the emphasis of developing countries on reducing agricultural protection. The Kennedy and Uruguay Rounds resulted in significant reductions in nonagricultural tariffs in developed countries as well as the elimination of quantitative restrictions, subsidies, and domestic support. Textile and apparel products, however, still have high tariffs in the United States (average 16%) and EU (average 12%), while developing countries still impose high tariffs on many nonjagricultural products. This asymmetry is, in part, responsible for the goal that the round be a single undertaking, with significant reductions in agricultural tariffs and support accompanied by greater access for nonagricultural products.
Some consensus has arisen out of the NAMA negotiations, with ministers favoring a nonlinear tariffcutting formula. Nonlinear formulas tend to reduce peak tariffs more than they lower tariffs. This is sometimes referred to as nonproportional cuts or a Swisstype formula. Swiss formulas almost always require a “coefficient” that defines the rate of reduction. The lower the coefficient, the higher the cuts to peak tariff rates resulting from a Swiss formula. While negotiators have largely agreed on a Swiss formula approach, agreement on the specific form of the formula and the coefficient is less certain. The CEPII scenario (S9) assumes the application of the Girard (WTO 034322) Swisstype formula:
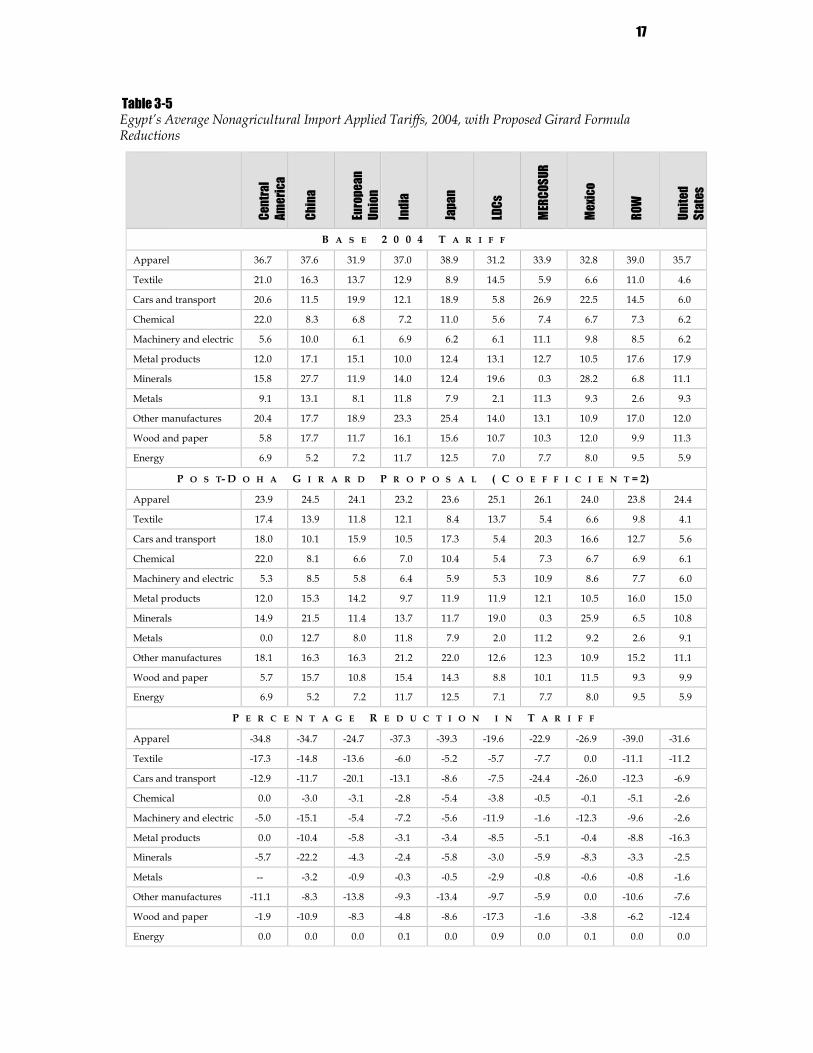
Where T1 is the new bound tariff rate, B is the coefficient to be determined for reductions, T0 is the base bound rate, and Ta is the average of base bound rates for NAMA products. For our analysis, we assume a coefficient of 1 for developed countries and of 2 for Egypt and developing countries. Table 35 presents the resulting cuts to Egypt’s nonagricultural tariffs in 2004. Many forms of the Swisstype formulas have been proposed but there is no consensus on coefficients. Moreover, ministers have agreed on sectorspecific approaches that could result in greater reductions for certain product groups. The most notable sectorspecific approach is the zeroforzero approach proposed by the United States to eliminate tariffs between signatories (Exhibit 31).
10 Importing countries could simply replace import tariffs with prohibitive domestic taxes to achieve the desired result.
0
0 1 T T B
T T B T a
a
+ × × ×
=
16
Table 34 Egypt’s Trade Weighted Average Agricultural Import Applied Tariffs, 2004, with Proposed Harbinson Reductions
Cent
ral
Amer
ica
Chin
a
Euro
pean
Un
ion
Indi
a
Japa
n
LDCs
MERC
OSUR
Mexic
o
ROW
Unite
d St
ates
Re
st of
Mid
. Ea
st
B A S E 2 0 0 4 A P P L I E D T A R I F F
Cereal and feed 2.9 3.8 2.0 5.0 4.5 2.0 3.5 2.4 2.0 3.2
Fibers 1.0 0.2 0.8
Livestock and dairy 13.4 5.9 8.4 5.0 5.1 1.9 6.2 7.3 7.8 5.1 12.5
Other ag. 4.8 66.2 23.6 37.4 2.1 3.9 26.7 35.4 20.5 10.4 9.1
Processed food and bev. * 587.5 273.1 197.2 49.8 222.5 47.7 8.2 45.2 43.6 30.9 26.5
Paddy rice 2.0 2.0 2.0 2.0 2.0 2.0 2.0 2.0 2.0 2.0 2.0
Processed rice 2.0 2.0 2.0 2.0 2.0 2.0 2.0 2.0
Veg, fruit, nuts 11.9 2.8 7.1 4.4 11.4 16.7 18.3 5.0 5.6 20.6 19.3
Veg. oil and fats 7.5 5.0 4.1 2.2 8.2 2.0 3.1 4.3 7.3 1.9 4.8
Wheat 2.0 2.0 2.0 2.0 2.0 2.0 2.0 2.0 2.0 2.0
P O S T H A R B I N S O N P R O P O S A L A P P L I E D R A T E
Cereal and feed 2.9 3.8 2.0 5.0 4.5 2.0 3.5 2.4 2.0 3.2
Fibers 1.0 0.2 0.8
Livestock and dairy 13.3 5.9 8.4 5.0 5.1 1.9 6.2 7.1 7.8 5.1 12.4
Other ag. 4.8 66.2 23.6 37.4 2.1 3.9 26.7 35.4 20.5 10.4 9.1
Processed food and bev. 587.5 273.1 197.2 49.6 222.2 47.6 8.2 45.2 43.6 30.9 26.5
Paddy rice 2.0 2.0 2.0 2.0 2.0 2.0 2.0 2.0 2.0 2.0 2.0
Processed rice 2.0 2.0 2.0 2.0 2.0 2.0 2.0 2.0
Veg., fruits, nuts 11.9 2.8 7.1 4.4 11.4 16.7 18.3 5.0 5.6 20.6 19.3
Veg. oil and fats 7.5 5.0 4.1 2.2 8.2 2.0 3.1 4.3 7.3 1.9 4.8
Wheat 2.0 2.0 2.0 2.0 2.0 2.0 2.0 2.0 2.0 2.0
P E R C E N T A G E R E D U C T I O N I N T A R I F F
Cereal and feed
Fibers
Livestock and dairy 0.5 0.3 0.1 0.5 2.7 0.3
Other ag. 0.1
Processed food and bev.* 0.4 0.1 0.3 0.1 0.1
Paddy rice 0.0
Processed rice
Veg., fruits, nuts 0.0
Veg. oil and fats 0.1 1.0
Wheat
Note: Tariffs on beverage and tobacco products often reach 3,000 percent. For this analysis, we set to 1,000 percent to minimize distortion, since they likely carry significant “water” in the tariff.
SOURCE: Calculations from GTAP database (trade weights) and Egypt’s 2004 Tariff Schedule for Base and Applied Tariff Rates.
17
Table 35 Egypt’s Average Nonagricultural Import Applied Tariffs, 2004, with Proposed Girard Formula Reductions
Cent
ral
Amer
ica
Chin
a
Euro
pean
Un
ion
Indi
a
Japa
n
LDCs
MERC
OSUR
Mexic
o
ROW
Unite
d St
ates
B A S E 2 0 0 4 T A R I F F
Apparel 36.7 37.6 31.9 37.0 38.9 31.2 33.9 32.8 39.0 35.7
Textile 21.0 16.3 13.7 12.9 8.9 14.5 5.9 6.6 11.0 4.6
Cars and transport 20.6 11.5 19.9 12.1 18.9 5.8 26.9 22.5 14.5 6.0
Chemical 22.0 8.3 6.8 7.2 11.0 5.6 7.4 6.7 7.3 6.2
Machinery and electric 5.6 10.0 6.1 6.9 6.2 6.1 11.1 9.8 8.5 6.2
Metal products 12.0 17.1 15.1 10.0 12.4 13.1 12.7 10.5 17.6 17.9
Minerals 15.8 27.7 11.9 14.0 12.4 19.6 0.3 28.2 6.8 11.1
Metals 9.1 13.1 8.1 11.8 7.9 2.1 11.3 9.3 2.6 9.3
Other manufactures 20.4 17.7 18.9 23.3 25.4 14.0 13.1 10.9 17.0 12.0
Wood and paper 5.8 17.7 11.7 16.1 15.6 10.7 10.3 12.0 9.9 11.3
Energy 6.9 5.2 7.2 11.7 12.5 7.0 7.7 8.0 9.5 5.9
P O S T D O H A G I R A R D P R O P O S A L ( C O E F F I C I E N T = 2)
Apparel 23.9 24.5 24.1 23.2 23.6 25.1 26.1 24.0 23.8 24.4
Textile 17.4 13.9 11.8 12.1 8.4 13.7 5.4 6.6 9.8 4.1
Cars and transport 18.0 10.1 15.9 10.5 17.3 5.4 20.3 16.6 12.7 5.6
Chemical 22.0 8.1 6.6 7.0 10.4 5.4 7.3 6.7 6.9 6.1
Machinery and electric 5.3 8.5 5.8 6.4 5.9 5.3 10.9 8.6 7.7 6.0
Metal products 12.0 15.3 14.2 9.7 11.9 11.9 12.1 10.5 16.0 15.0
Minerals 14.9 21.5 11.4 13.7 11.7 19.0 0.3 25.9 6.5 10.8
Metals 0.0 12.7 8.0 11.8 7.9 2.0 11.2 9.2 2.6 9.1
Other manufactures 18.1 16.3 16.3 21.2 22.0 12.6 12.3 10.9 15.2 11.1
Wood and paper 5.7 15.7 10.8 15.4 14.3 8.8 10.1 11.5 9.3 9.9
Energy 6.9 5.2 7.2 11.7 12.5 7.1 7.7 8.0 9.5 5.9
P E R C E N T A G E R E D U C T I O N I N T A R I F F
Apparel 34.8 34.7 24.7 37.3 39.3 19.6 22.9 26.9 39.0 31.6
Textile 17.3 14.8 13.6 6.0 5.2 5.7 7.7 0.0 11.1 11.2
Cars and transport 12.9 11.7 20.1 13.1 8.6 7.5 24.4 26.0 12.3 6.9
Chemical 0.0 3.0 3.1 2.8 5.4 3.8 0.5 0.1 5.1 2.6
Machinery and electric 5.0 15.1 5.4 7.2 5.6 11.9 1.6 12.3 9.6 2.6
Metal products 0.0 10.4 5.8 3.1 3.4 8.5 5.1 0.4 8.8 16.3
Minerals 5.7 22.2 4.3 2.4 5.8 3.0 5.9 8.3 3.3 2.5
Metals 3.2 0.9 0.3 0.5 2.9 0.8 0.6 0.8 1.6
Other manufactures 11.1 8.3 13.8 9.3 13.4 9.7 5.9 0.0 10.6 7.6
Wood and paper 1.9 10.9 8.3 4.8 8.6 17.3 1.6 3.8 6.2 12.4
Energy 0.0 0.0 0.0 0.1 0.0 0.9 0.0 0.1 0.0 0.0
18
Exhibit 31 ZeroforZero Sector Approach to Tariff Reduction
The U.S. zeroforzero proposal would eliminate
tariffs on a fullrange of consumer and industrial
goods from shoes, textiles and apparel, tractors, to
children’s toys. The proposal calls for two steps to
tariff elimination.
1. Members must cut and harmonize tariffs in the
fiveyear period from 2005 to 2010. WTO members
eliminate all tariffs at or below 5 percent by 2010, cut
all other tariffs through a “tariff equalizer” formula
to less than 8 percent by 2010, and eliminate tariffs
on certain highly traded industrial sectors as soon as
possible, but not later than 2010.
2. Members make equal annual cuts in remaining
tariffs between 2010 and 2015. These cuts will result
in zero tariffs.
The proposal also calls for a separate program to
identify and eliminate nontariff barriers, which
would run on a parallel track with the negotiations
on industrial tariffs.
SOURCE: U. S. Trade Representative Office 2003 Annual Report. www.ustr.gov/reports/2003annual/IIwto.pdf
Other Issues
To resolve the crisis in the Doha Round, the WTO minister will likely focus on fostering agreement on formulas, parameters, and ranges for tariffcutting formulas. WTO members, however, will also have to reach agreement on special and differential treatment for developing countries, sensitive products, binding unbound tariffs, tariff caps, phaseout schedules, and formulas for calculating advalorem equivalent tariffs. Decisions on these issues could have farreaching effects for the final Doha Agreement. The scenarios analyzed here review one such possibility by testing how sensitive results are to excluding certain agricultural products from negotiations. The parameters of any final agreement cannot be known, but reviewing the possibilities now being considered in WTO negotiations is helpful.
SPECIAL AND DIFFERENTIAL TREATMENT
SDT for developing countries was agreed on early in the Doha Round, in principal, to achieve the round’s objective of furthering development. SDT recognizes the special circumstances of developing countries, and provides for less than reciprocal concessions from developing country members. Under SDT are proposals to allow developing countries to
• Take more time to implement concessions; • Apply less than the full formula rate (this proposal can be worked into an infinite number
of possibilities based on the percentage of tariff lines to which they apply); • Exempt a proportion of tariff lines from tariff cuts (simulated in this research for
agriculture, but this provision could be extended to manufactures); and
• Opt out of sector approaches.
It is also proposed that LDCs be allowed to optout of all tariffcutting formulas while increasing their access to developed country markets through GSP and other programs. There

19
appears to be little consensus on these issues, but some of their elements are sure to be in any final agreement.
SECTOR APPROACHES
Early on in the negotiations, some members expressed interest in cutting tariffs aggressively, even eliminating them on certain products or sectors. This sector approach has had a tempered reception. Many members entertain the idea, but few other than the United States and the EU promote it. Indeed, as negotiations progressed and sector approaches were proposed, they met counterproposals for developing countries to opt out or even for countries to opt in as a default. Perhaps the most widely known sector approach is the zeroforzero approach proposed by the U.S. trade representative early in 2003. While sector approaches are most often talked about in NAMA negotiations, they have also been considered for important and sensitive agricultural products, such as cotton. And though there is little consensus on sector approaches, related proposals are important. For example, applying a sector approach in a sensitive product category—one that carries high average tariffs worldwide, such as textiles and apparel—could have a significant impact on a country such as Egypt.
FLEXIBILITIES
Early on in negotiations, member countries agreed to use tariffcutting formulas, such as the Harbinson and Girard formulas studied in this paper. The power of such formulas is their equal applicability to all products in a category, such as agriculture. This approach was considered more practical than the linebyline approaches of earlier rounds, which left significant tariffs untouched. WTO ministers, however, continue to consider a variety of approaches that would permit members to exempt certain or sensitive products. Lack of agreement on “flexibilities”—linebyline exemptions from any general tariffcutting formula—is often blamed for the lack of agreement on a formula. However, even if some members agree to a broad range of exemptions, it seems unlikely that all countries will support the agreement. The EU supports exemptions or reduced reductions for about 8 percent of agricultural product lines. Meanwhile, many observers say anything more than 1 to 2 percent of exemptions would render cuts nearly meaningless. Therefore, some form of flexibility, perhaps limited, will likely be included in a final agreement to appease concerns over sensitive products.
PEAK TARIFFS
Peak tariffs in some WTO member countries exceed 1,000 percent. One goal of the WTO is to reduce these tariffs through the general tariffcutting formulas and/or by setting tariff caps that define the upper limit of any tariff, regardless of the formula. How caps would coincide with provisions for flexibilities on sensitive products or if caps would provide allowances for

20
certain types of “sin” taxes, such as those on Egyptian imports of alcohol and beverages, is unknown.
4. Results of GTAP Simulations
A computable general equilibrium (CGE) model summarizes impacts across an entire economy, netting out positive and negative implications of policy changes for agents (consumers, producers, and governments) and the movement of resources from one sector to another. In contrast, partial equilibrium models frequently focus on impacts within a sector or group of sectors without accounting for limited resources such as capital, land, or skilled labor. 11 Because CGE models at least in theory represent an entire economy, they also provide meaningful perspective for such figures as millions of dollars and thousands of jobs. In this section we examine the likely effects on general welfare and trade and production of two possible liberalization scenarios which include a single scenario for nonagricultural products and two possible scenarios for agricultural products. The two scenarios are a combination of three CEPII scenarios listed in section 3, S4, S5 and S9 which provide the data. CEPII scenarios S4 and S5 model the effects of a four tier formula on agriculture, with differing assumptions for sensitive products (S4 – 2% sensitive products and S5 with 5% sensitive products), the most likely scenarios, are employed here. The Swiss harmonizing formula from S9, for nonagricultural products is combined with the cuts in S4 and S5, reducing the number of scenarios to two.
WelfareImpactby Region
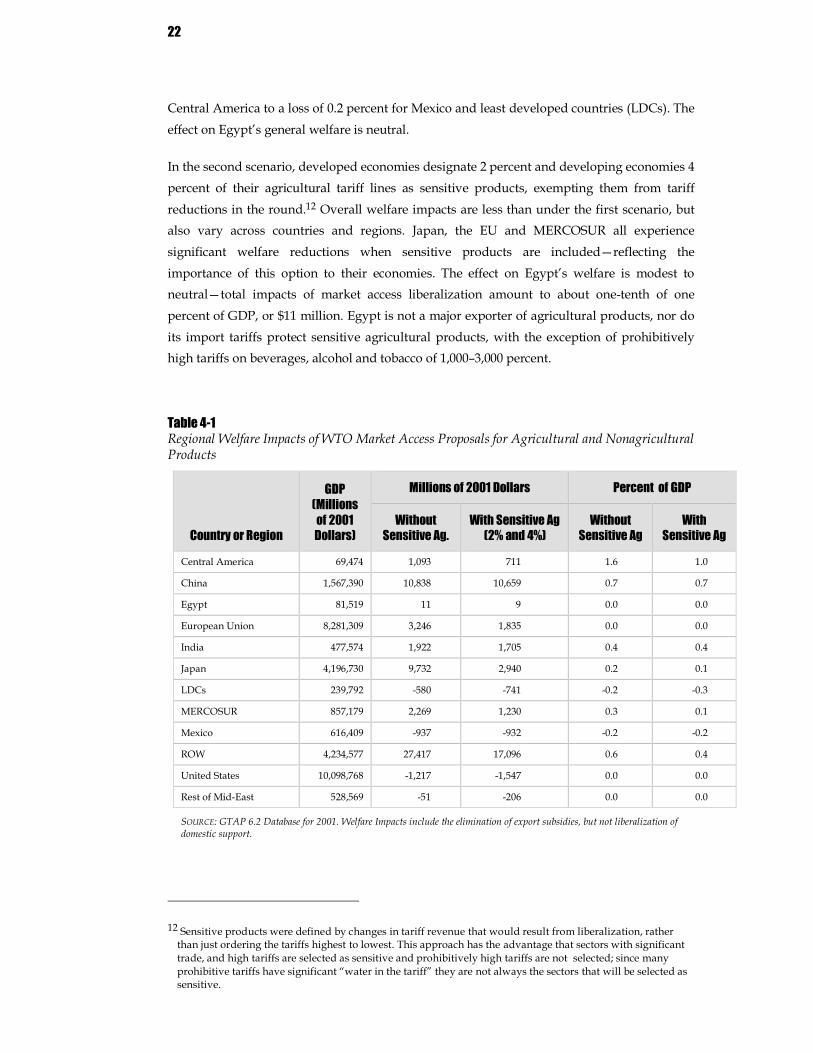
Table 41 presents estimates of net welfare impacts of proposed market access liberalization under two scenarios. Both scenarios assume full liberalization of nonagricultural products and the liberalization of agricultural export subsidies.
In the first scenario, agricultural tariffs are liberalized according to the Harbinson proposal, without allowance for flexibility for sensitive agricultural products. Overall welfare impacts vary widely between countries and regions, ranging from a gain of 1.6 percent of GDP for
11 Some economist can chain together large numbers of partial equilibrium models to replicate an entire economy, but they rarely impose the rigid accounting schemes of partial equilibrium models.
22
Central America to a loss of 0.2 percent for Mexico and least developed countries (LDCs). The effect on Egypt’s general welfare is neutral.
In the second scenario, developed economies designate 2 percent and developing economies 4 percent of their agricultural tariff lines as sensitive products, exempting them from tariff reductions in the round. 12 Overall welfare impacts are less than under the first scenario, but also vary across countries and regions. Japan, the EU and MERCOSUR all experience significant welfare reductions when sensitive products are included—reflecting the importance of this option to their economies. The effect on Egypt’s welfare is modest to neutral—total impacts of market access liberalization amount to about onetenth of one percent of GDP, or $11 million. Egypt is not a major exporter of agricultural products, nor do its import tariffs protect sensitive agricultural products, with the exception of prohibitively high tariffs on beverages, alcohol and tobacco of 1,000–3,000 percent.
Table 41 Regional Welfare Impacts of WTO Market Access Proposals for Agricultural and Nonagricultural Products
Country or Region
GDP (Millions of 2001 Dollars)
Millions of 2001 Dollars Percent of GDP
Without Sensitive Ag.
With Sensitive Ag (2% and 4%)
Without Sensitive Ag
With Sensitive Ag
Central America 69,474 1,093 711 1.6 1.0
China 1,567,390 10,838 10,659 0.7 0.7
Egypt 81,519 11 9 0.0 0.0
European Union 8,281,309 3,246 1,835 0.0 0.0
India 477,574 1,922 1,705 0.4 0.4
Japan 4,196,730 9,732 2,940 0.2 0.1
LDCs 239,792 580 741 0.2 0.3
MERCOSUR 857,179 2,269 1,230 0.3 0.1
Mexico 616,409 937 932 0.2 0.2
ROW 4,234,577 27,417 17,096 0.6 0.4
United States 10,098,768 1,217 1,547 0.0 0.0
Rest of MidEast 528,569 51 206 0.0 0.0
SOURCE: GTAP 6.2 Database for 2001. Welfare Impacts include the elimination of export subsidies, but not liberalization of domestic support.
12 Sensitive products were defined by changes in tariff revenue that would result from liberalization, rather than just ordering the tariffs highest to lowest. This approach has the advantage that sectors with significant trade, and high tariffs are selected as sensitive and prohibitively high tariffs are not selected; since many prohibitive tariffs have significant “water in the tariff” they are not always the sectors that will be selected as sensitive.
23
WelfareImpact by Economic Element
Understanding where welfare benefits and costs arise can provide insight not only into the overall impact of the Doha Round, but also into how different stakeholders in an economy are affected. Table 42 presents the four main manifestations of welfare changes:
• Allocative efficiency—the gain or loss to an economy when scarce resources, such as land, skilled labor, and capital are used more efficiently;
• The endowment effect—the gain from greater utilization of unemployed factors of production, such as unskilled labor in Egypt;
• The terms of trade effect—the change in the ratio of export prices to import prices; and
• The investment savings effect—the change in the cost of capital exports to imports.
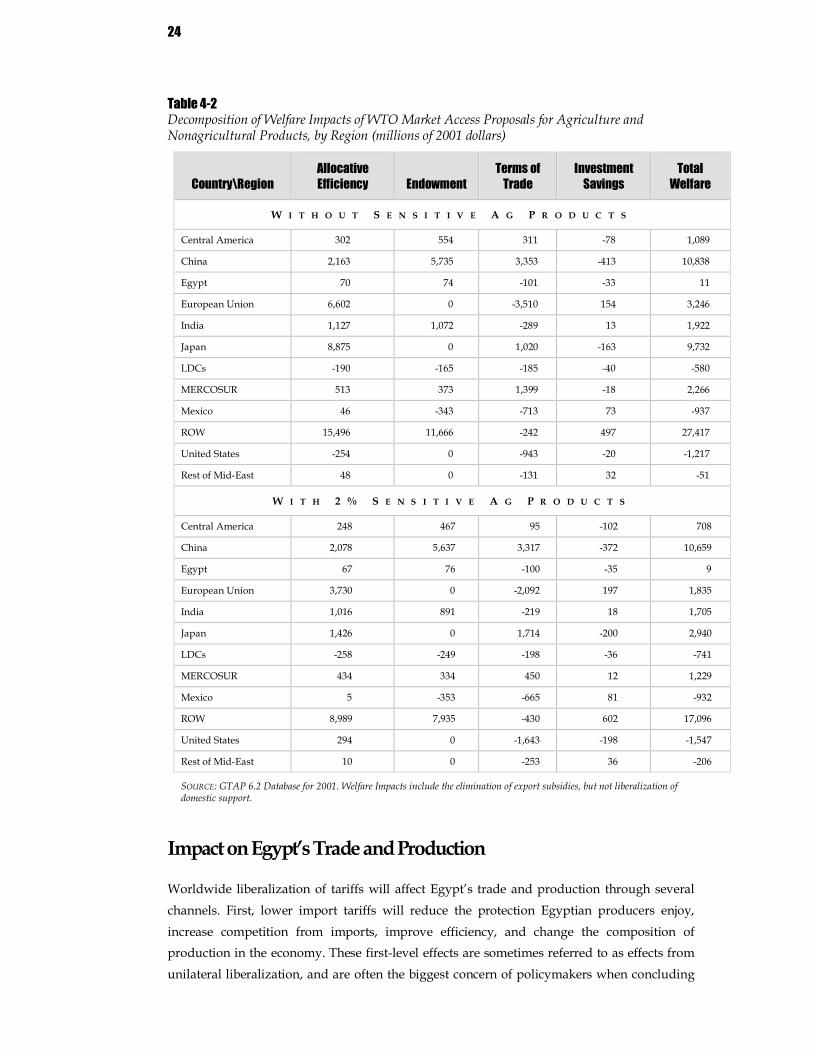
The relatively neutral change in Egypt’s welfare masks substantial benefits and costs due to the Doha liberalization. The most significant cost is manifest in the terms of trade effect; overall, import prices rise by more than Egypt’s export prices, costing the economy approximately $165 million across all traded sectors. The second most important manifestation of Egypt’s changing welfare is the endowment effect—a net gain in unskilled wage payments of $159 million. Finally, Egypt gains $120 million in allocative efficiency, as constrained resources, such as skilled labor and capital move from highly protected and inefficient sectors, such as textiles and apparel, to more productive uses in services and construction.
In examining the data presented in Table 42, we can see that excluding 2 percent of agricultural products from agricultural negotiations has little effect on Egypt, but significant effects on the EU and MERCOSUR (Argentina, Brazil, Chile, and Uruguay). Europe’s economies lose significantly in general welfare but gain in terms of trade ($1.4 billion) under the 2 percent exclusion, which significantly depresses agricultural import prices to the detriment of large exporters, such as MERCOSUR. While the EU gains from lower agricultural prices, allocative efficiency among member economies declines by more than $3 billion. This decline cancels the benefits of the depressed import prices and illustrates the high cost of agricultural protection to the economies of the EU.
MERCOSUR, a major agricultural exporter, also loses under the 2 percent exclusion. MERCOSUR members lose nearly $1 billion because of lower export prices, which makes their reluctance to introduce flexibilities into any Doha deal understandable. LDCs also lose from lower agricultural prices and employment—losses that undermine the Doha “development” goals. It seems that special market access rules might be needed to achieve development goals for LDCs. The emerging giants, China and India, are affected only modestly by the exclusion of sensitive agricultural products, largely because they are more engaged in manufactures trade.
24
Table 42 Decomposition of Welfare Impacts of WTO Market Access Proposals for Agriculture and Nonagricultural Products, by Region (millions of 2001 dollars)
Country\Region Allocative Efficiency Endowment
Terms of Trade
Investment Savings
Total Welfare
W I T H O U T S E N S I T I V E A G P R O D U C T S
Central America 302 554 311 78 1,089
China 2,163 5,735 3,353 413 10,838
Egypt 70 74 101 33 11
European Union 6,602 0 3,510 154 3,246
India 1,127 1,072 289 13 1,922
Japan 8,875 0 1,020 163 9,732
LDCs 190 165 185 40 580
MERCOSUR 513 373 1,399 18 2,266
Mexico 46 343 713 73 937
ROW 15,496 11,666 242 497 27,417
United States 254 0 943 20 1,217
Rest of MidEast 48 0 131 32 51
W I T H 2 % S E N S I T I V E A G P R O D U C T S
Central America 248 467 95 102 708
China 2,078 5,637 3,317 372 10,659
Egypt 67 76 100 35 9
European Union 3,730 0 2,092 197 1,835
India 1,016 891 219 18 1,705
Japan 1,426 0 1,714 200 2,940
LDCs 258 249 198 36 741
MERCOSUR 434 334 450 12 1,229
Mexico 5 353 665 81 932
ROW 8,989 7,935 430 602 17,096
United States 294 0 1,643 198 1,547
Rest of MidEast 10 0 253 36 206
SOURCE: GTAP 6.2 Database for 2001. Welfare Impacts include the elimination of export subsidies, but not liberalization of domestic support.
Impact on Egypt’sTrade and Production
Worldwide liberalization of tariffs will affect Egypt’s trade and production through several channels. First, lower import tariffs will reduce the protection Egyptian producers enjoy, increase competition from imports, improve efficiency, and change the composition of production in the economy. These firstlevel effects are sometimes referred to as effects from unilateral liberalization, and are often the biggest concern of policymakers when concluding
25
any trade agreement. But it is the expectation of more exports that will win the policy debate. While this view is a simplification, it underscores the main concerns of policymakers. The following analysis recognizes this point of view by providing impact assessments for both multilateral liberalization, which includes gains and losses in export markets resulting from other countries liberalizations next to the estimated impacts of Egypt’s unilateral liberalization alone.
AGRICULTURE
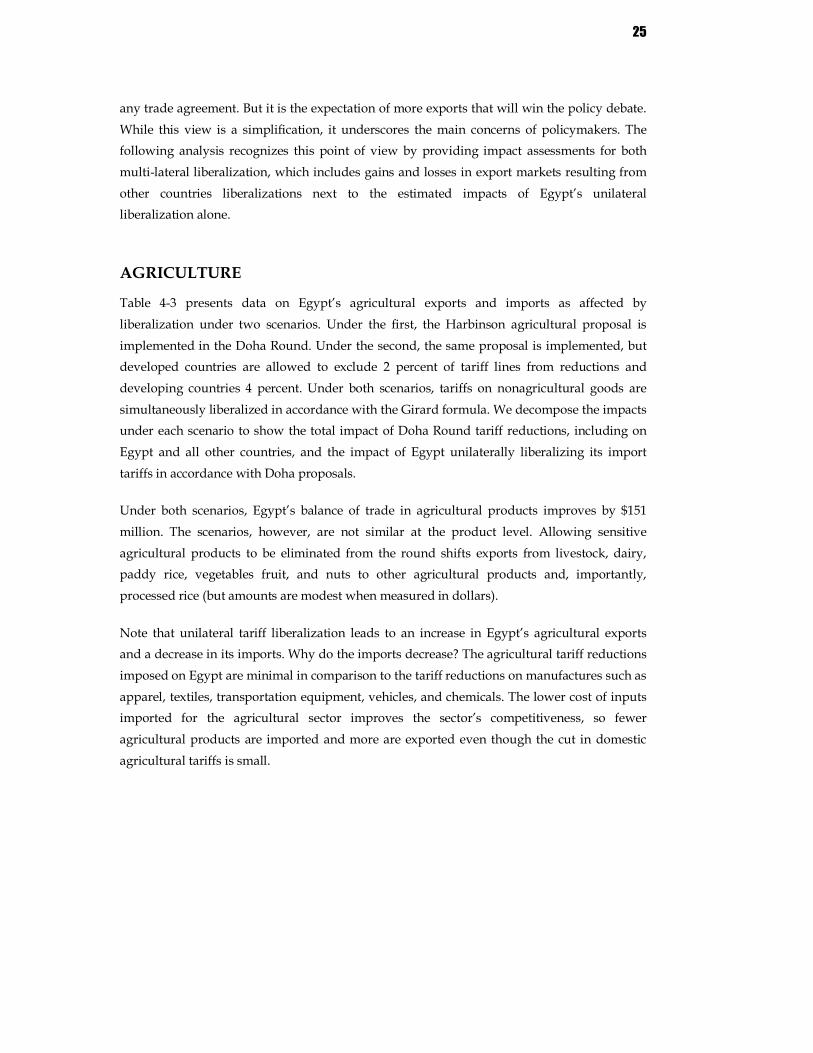
Table 43 presents data on Egypt’s agricultural exports and imports as affected by liberalization under two scenarios. Under the first, the Harbinson agricultural proposal is implemented in the Doha Round. Under the second, the same proposal is implemented, but developed countries are allowed to exclude 2 percent of tariff lines from reductions and developing countries 4 percent. Under both scenarios, tariffs on nonagricultural goods are simultaneously liberalized in accordance with the Girard formula. We decompose the impacts under each scenario to show the total impact of Doha Round tariff reductions, including on Egypt and all other countries, and the impact of Egypt unilaterally liberalizing its import tariffs in accordance with Doha proposals.
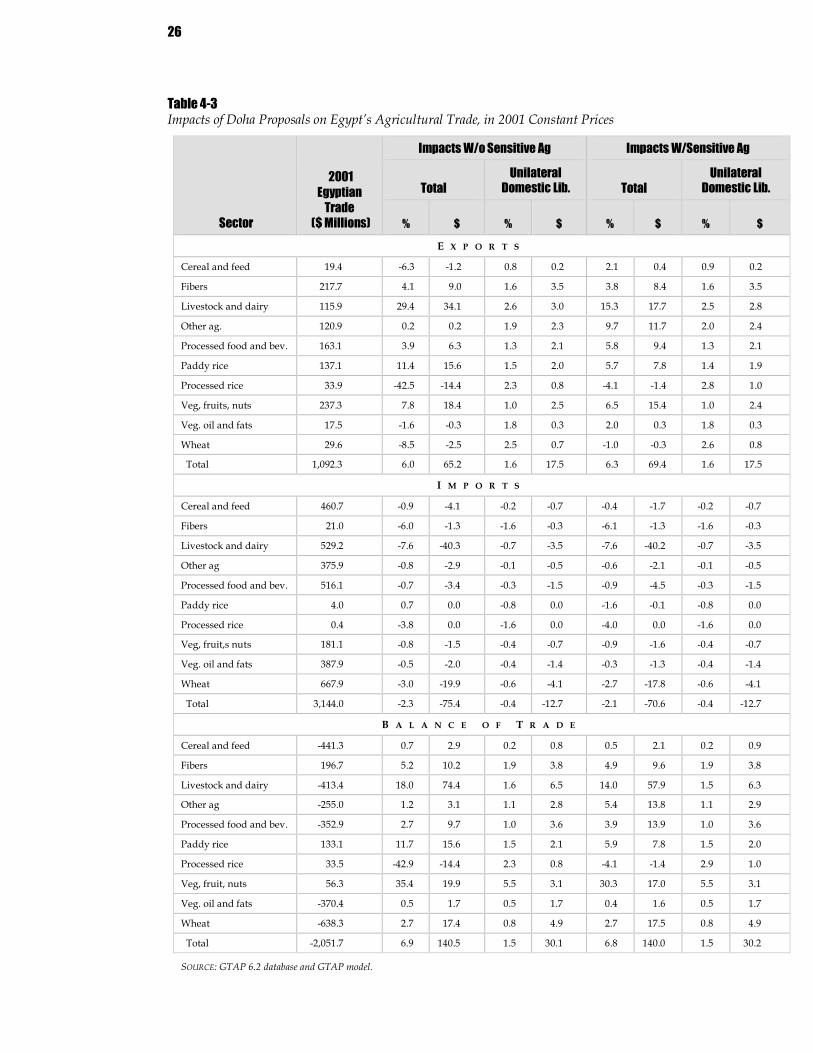
Under both scenarios, Egypt’s balance of trade in agricultural products improves by $151 million. The scenarios, however, are not similar at the product level. Allowing sensitive agricultural products to be eliminated from the round shifts exports from livestock, dairy, paddy rice, vegetables fruit, and nuts to other agricultural products and, importantly, processed rice (but amounts are modest when measured in dollars).
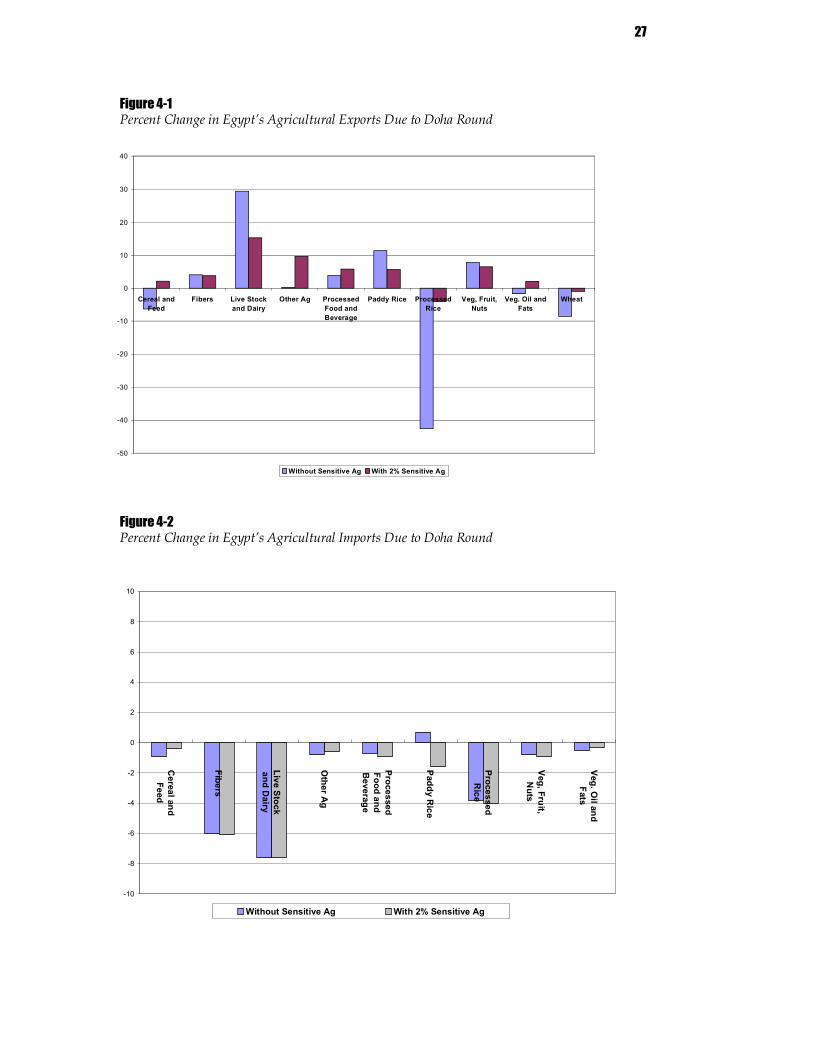
Note that unilateral tariff liberalization leads to an increase in Egypt’s agricultural exports and a decrease in its imports. Why do the imports decrease? The agricultural tariff reductions imposed on Egypt are minimal in comparison to the tariff reductions on manufactures such as apparel, textiles, transportation equipment, vehicles, and chemicals. The lower cost of inputs imported for the agricultural sector improves the sector’s competitiveness, so fewer agricultural products are imported and more are exported even though the cut in domestic agricultural tariffs is small.
26
Table 43 Impacts of Doha Proposals on Egypt’s Agricultural Trade, in 2001 Constant Prices
Sector
2001 Egyptian
Trade ($ Millions)
Impacts W/o Sensitive Ag Impacts W/Sensitive Ag
Total Unilateral
Domestic Lib. Total Unilateral
Domestic Lib.
% $ % $ % $ % $
E X P O R T S
Cereal and feed 19.4 6.3 1.2 0.8 0.2 2.1 0.4 0.9 0.2
Fibers 217.7 4.1 9.0 1.6 3.5 3.8 8.4 1.6 3.5
Livestock and dairy 115.9 29.4 34.1 2.6 3.0 15.3 17.7 2.5 2.8
Other ag. 120.9 0.2 0.2 1.9 2.3 9.7 11.7 2.0 2.4
Processed food and bev. 163.1 3.9 6.3 1.3 2.1 5.8 9.4 1.3 2.1
Paddy rice 137.1 11.4 15.6 1.5 2.0 5.7 7.8 1.4 1.9
Processed rice 33.9 42.5 14.4 2.3 0.8 4.1 1.4 2.8 1.0
Veg, fruits, nuts 237.3 7.8 18.4 1.0 2.5 6.5 15.4 1.0 2.4
Veg. oil and fats 17.5 1.6 0.3 1.8 0.3 2.0 0.3 1.8 0.3
Wheat 29.6 8.5 2.5 2.5 0.7 1.0 0.3 2.6 0.8
Total 1,092.3 6.0 65.2 1.6 17.5 6.3 69.4 1.6 17.5
I M P O R T S
Cereal and feed 460.7 0.9 4.1 0.2 0.7 0.4 1.7 0.2 0.7
Fibers 21.0 6.0 1.3 1.6 0.3 6.1 1.3 1.6 0.3
Livestock and dairy 529.2 7.6 40.3 0.7 3.5 7.6 40.2 0.7 3.5
Other ag 375.9 0.8 2.9 0.1 0.5 0.6 2.1 0.1 0.5
Processed food and bev. 516.1 0.7 3.4 0.3 1.5 0.9 4.5 0.3 1.5
Paddy rice 4.0 0.7 0.0 0.8 0.0 1.6 0.1 0.8 0.0
Processed rice 0.4 3.8 0.0 1.6 0.0 4.0 0.0 1.6 0.0
Veg, fruit,s nuts 181.1 0.8 1.5 0.4 0.7 0.9 1.6 0.4 0.7
Veg. oil and fats 387.9 0.5 2.0 0.4 1.4 0.3 1.3 0.4 1.4
Wheat 667.9 3.0 19.9 0.6 4.1 2.7 17.8 0.6 4.1
Total 3,144.0 2.3 75.4 0.4 12.7 2.1 70.6 0.4 12.7
B A L A N C E O F T R A D E
Cereal and feed 441.3 0.7 2.9 0.2 0.8 0.5 2.1 0.2 0.9
Fibers 196.7 5.2 10.2 1.9 3.8 4.9 9.6 1.9 3.8
Livestock and dairy 413.4 18.0 74.4 1.6 6.5 14.0 57.9 1.5 6.3
Other ag 255.0 1.2 3.1 1.1 2.8 5.4 13.8 1.1 2.9
Processed food and bev. 352.9 2.7 9.7 1.0 3.6 3.9 13.9 1.0 3.6
Paddy rice 133.1 11.7 15.6 1.5 2.1 5.9 7.8 1.5 2.0
Processed rice 33.5 42.9 14.4 2.3 0.8 4.1 1.4 2.9 1.0
Veg, fruit, nuts 56.3 35.4 19.9 5.5 3.1 30.3 17.0 5.5 3.1
Veg. oil and fats 370.4 0.5 1.7 0.5 1.7 0.4 1.6 0.5 1.7
Wheat 638.3 2.7 17.4 0.8 4.9 2.7 17.5 0.8 4.9
Total 2,051.7 6.9 140.5 1.5 30.1 6.8 140.0 1.5 30.2
SOURCE: GTAP 6.2 database and GTAP model.
27
Figure 41 Percent Change in Egypt’s Agricultural Exports Due to Doha Round
Figure 42 Percent Change in Egypt’s Agricultural Imports Due to Doha Round
50
40
30
20
10
0
10
20
30
40
Cereal and Feed
Fibers Live Stock and Dairy
Other Ag Processed Food and Beverage
Paddy Rice Processed Rice
Veg, Fruit, Nuts
Veg. Oil and Fats
Wheat
Without Sensitive Ag With 2% Sensitive Ag
10
8
6
4
2
0
2
4
6
8
10
Cereal and Feed
Fibers
Live Stock and D
airy
Other A
g
Processed Food and Beverage
Paddy Rice
Processed Rice
Veg, Fruit, Nuts
Veg. Oil and
Fats
Without Sensitive Ag With 2% Sensitive Ag
28
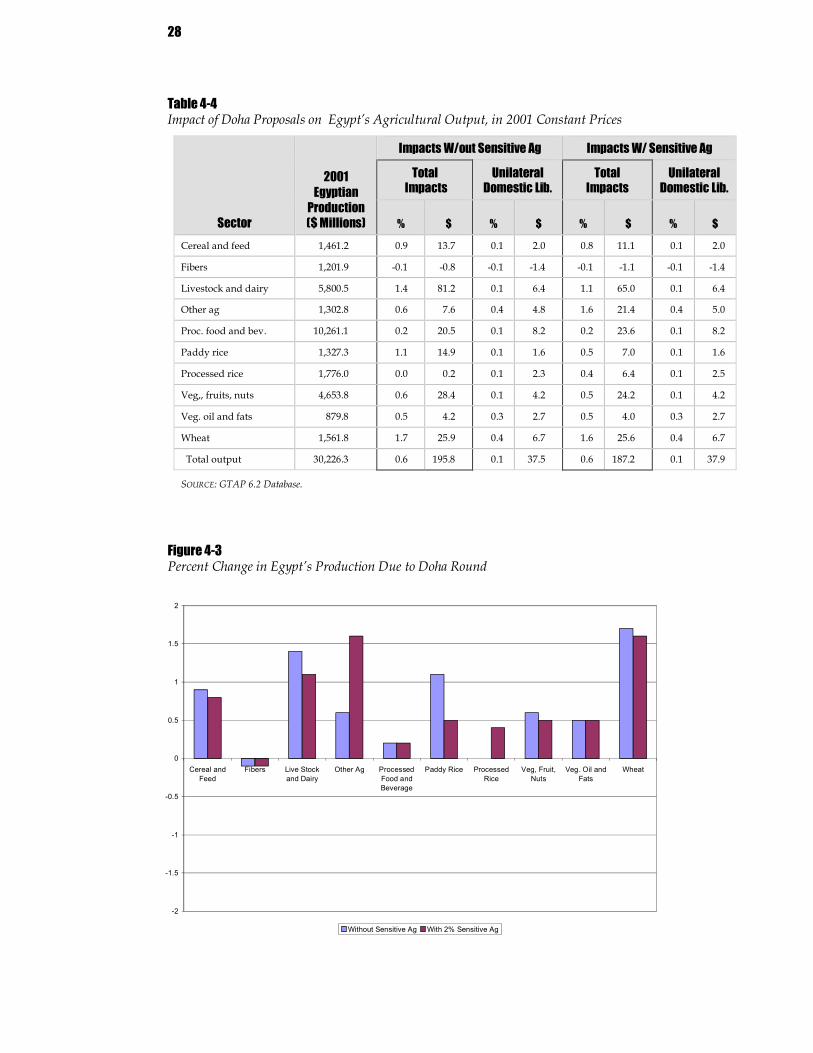
Table 44 Impact of Doha Proposals on Egypt’s Agricultural Output, in 2001 Constant Prices
Sector
2001 Egyptian
Production ($ Millions)
Impacts W/out Sensitive Ag Impacts W/ Sensitive Ag
Total Impacts
Unilateral Domestic Lib.
Total Impacts
Unilateral Domestic Lib.
% $ % $ % $ % $
Cereal and feed 1,461.2 0.9 13.7 0.1 2.0 0.8 11.1 0.1 2.0
Fibers 1,201.9 0.1 0.8 0.1 1.4 0.1 1.1 0.1 1.4
Livestock and dairy 5,800.5 1.4 81.2 0.1 6.4 1.1 65.0 0.1 6.4
Other ag 1,302.8 0.6 7.6 0.4 4.8 1.6 21.4 0.4 5.0
Proc. food and bev. 10,261.1 0.2 20.5 0.1 8.2 0.2 23.6 0.1 8.2
Paddy rice 1,327.3 1.1 14.9 0.1 1.6 0.5 7.0 0.1 1.6
Processed rice 1,776.0 0.0 0.2 0.1 2.3 0.4 6.4 0.1 2.5
Veg,, fruits, nuts 4,653.8 0.6 28.4 0.1 4.2 0.5 24.2 0.1 4.2
Veg. oil and fats 879.8 0.5 4.2 0.3 2.7 0.5 4.0 0.3 2.7
Wheat 1,561.8 1.7 25.9 0.4 6.7 1.6 25.6 0.4 6.7
Total output 30,226.3 0.6 195.8 0.1 37.5 0.6 187.2 0.1 37.9
SOURCE: GTAP 6.2 Database.
Figure 43 Percent Change in Egypt’s Production Due to Doha Round
2
1.5
1
0.5
0
0.5
1
1.5
2
Cereal and Feed
Fibers Live Stock and Dairy
Other Ag Processed Food and Beverage
Paddy Rice Processed Rice
Veg, Fruit, Nuts
Veg. Oil and Fats
Wheat
Without Sensitive Ag With 2% Sensitive Ag
29
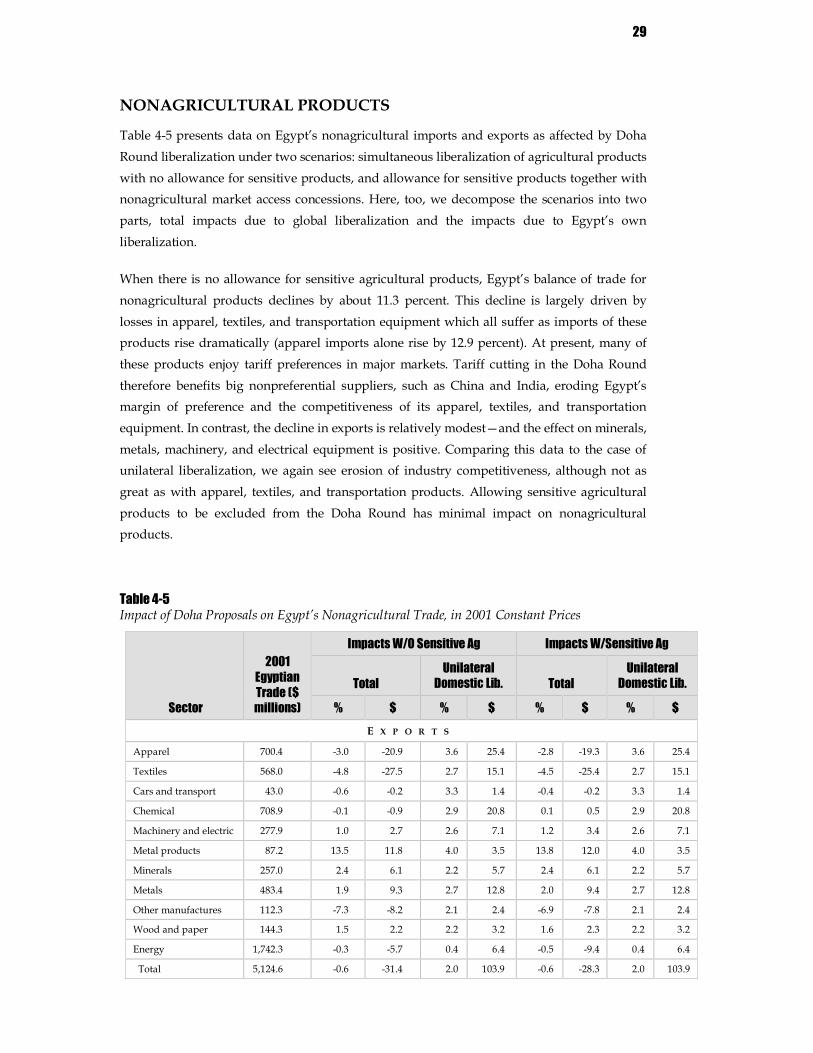
NONAGRICULTURAL PRODUCTS
Table 45 presents data on Egypt’s nonagricultural imports and exports as affected by Doha Round liberalization under two scenarios: simultaneous liberalization of agricultural products with no allowance for sensitive products, and allowance for sensitive products together with nonagricultural market access concessions. Here, too, we decompose the scenarios into two parts, total impacts due to global liberalization and the impacts due to Egypt’s own liberalization.
When there is no allowance for sensitive agricultural products, Egypt’s balance of trade for nonagricultural products declines by about 11.3 percent. This decline is largely driven by losses in apparel, textiles, and transportation equipment which all suffer as imports of these products rise dramatically (apparel imports alone rise by 12.9 percent). At present, many of these products enjoy tariff preferences in major markets. Tariff cutting in the Doha Round therefore benefits big nonpreferential suppliers, such as China and India, eroding Egypt’s margin of preference and the competitiveness of its apparel, textiles, and transportation equipment. In contrast, the decline in exports is relatively modest—and the effect on minerals, metals, machinery, and electrical equipment is positive. Comparing this data to the case of unilateral liberalization, we again see erosion of industry competitiveness, although not as great as with apparel, textiles, and transportation products. Allowing sensitive agricultural products to be excluded from the Doha Round has minimal impact on nonagricultural products.
Table 45 Impact of Doha Proposals on Egypt’s Nonagricultural Trade, in 2001 Constant Prices
Sector
2001 Egyptian Trade ($ millions)
Impacts W/O Sensitive Ag Impacts W/Sensitive Ag
Total Unilateral
Domestic Lib. Total Unilateral
Domestic Lib.
% $ % $ % $ % $ E X P O R T S
Apparel 700.4 3.0 20.9 3.6 25.4 2.8 19.3 3.6 25.4
Textiles 568.0 4.8 27.5 2.7 15.1 4.5 25.4 2.7 15.1
Cars and transport 43.0 0.6 0.2 3.3 1.4 0.4 0.2 3.3 1.4
Chemical 708.9 0.1 0.9 2.9 20.8 0.1 0.5 2.9 20.8
Machinery and electric 277.9 1.0 2.7 2.6 7.1 1.2 3.4 2.6 7.1
Metal products 87.2 13.5 11.8 4.0 3.5 13.8 12.0 4.0 3.5
Minerals 257.0 2.4 6.1 2.2 5.7 2.4 6.1 2.2 5.7
Metals 483.4 1.9 9.3 2.7 12.8 2.0 9.4 2.7 12.8
Other manufactures 112.3 7.3 8.2 2.1 2.4 6.9 7.8 2.1 2.4
Wood and paper 144.3 1.5 2.2 2.2 3.2 1.6 2.3 2.2 3.2
Energy 1,742.3 0.3 5.7 0.4 6.4 0.5 9.4 0.4 6.4
Total 5,124.6 0.6 31.4 2.0 103.9 0.6 28.3 2.0 103.9
30
Sector
2001 Egyptian Trade ($ millions)
Impacts W/O Sensitive Ag Impacts W/Sensitive Ag
Total Unilateral
Domestic Lib. Total Unilateral
Domestic Lib.
% $ % $ % $ % $ I M P O R T S
Apparel 1,542.7 12.9 199.0 13.1 202.7 12.8 198.1 13.1 202.7
Textiles 690.3 1.7 12.0 1.8 12.1 1.5 10.6 1.8 12.1
Cars and transport 1,669.6 0.8 14.0 0.7 12.2 0.8 13.9 0.7 12.2
Chemical 2,224.8 0.6 12.9 0.4 8.7 0.6 12.9 0.4 8.7
Machinery and electric 4,077.6 0.3 10.2 0.1 2.0 0.2 9.8 0.1 2.0
Metal products 345.7 1.6 5.7 0.9 3.1 1.6 5.5 0.9 3.1
Minerals 526.1 0.3 1.3 0.3 1.3 0.2 0.8 0.3 1.3
Metals 1,043.8 0.8 8.1 0.4 3.8 0.8 7.9 0.4 3.7
Other manufactures 181.1 2.7 5.0 3.0 5.4 2.6 4.8 3.0 5.4
Wood and paper 846.8 0.3 2.9 0.5 4.2 0.3 2.9 0.5 4.2
Energy 425.1 1.3 5.3 0.2 1.0 1.2 5.3 0.2 1.0
Total 13,148.5 1.5 200.7 1.7 221.4 1.5 199.0 1.7 221.5
B A L A N C E O F T R A D E
Apparel 842.3 49.8 219.9 40.2 177.3 49.3 217.4 40.2 177.3
Textile 122.3 20.1 39.5 1.5 3.0 18.3 36.0 1.5 3.0
Cars and transport 1,626.7 3.5 14.3 2.6 10.8 3.4 14.0 2.6 10.8
Chemical 1,515.9 4.7 12.0 11.6 29.5 5.3 13.4 11.6 29.5
Machinery and electric 3,799.7 3.6 12.9 2.6 9.1 3.7 13.2 2.6 9.2
Metal products 258.5 4.6 6.1 4.9 6.6 4.9 6.5 4.9 6.6
Minerals 269.0 22.1 7.4 13.1 4.4 20.6 6.9 13.1 4.4
Metals 560.4 31.1 17.5 29.4 16.6 30.9 17.4 29.3 16.5
Other manufactures 68.7 3.6 13.2 0.8 3.0 3.4 12.5 0.8 3.0
Wood and paper 702.6 0.1 0.7 0.2 1.0 0.1 0.5 0.2 1.0
Energy 1,317.2 0.0 0.4 0.3 5.4 0.2 4.1 0.3 5.4
Total 8,023.8 11.3 232.1 5.7 117.5 11.1 227.3 5.7 117.6
SOURCE: GTAP 6.2 database and GTAP model.
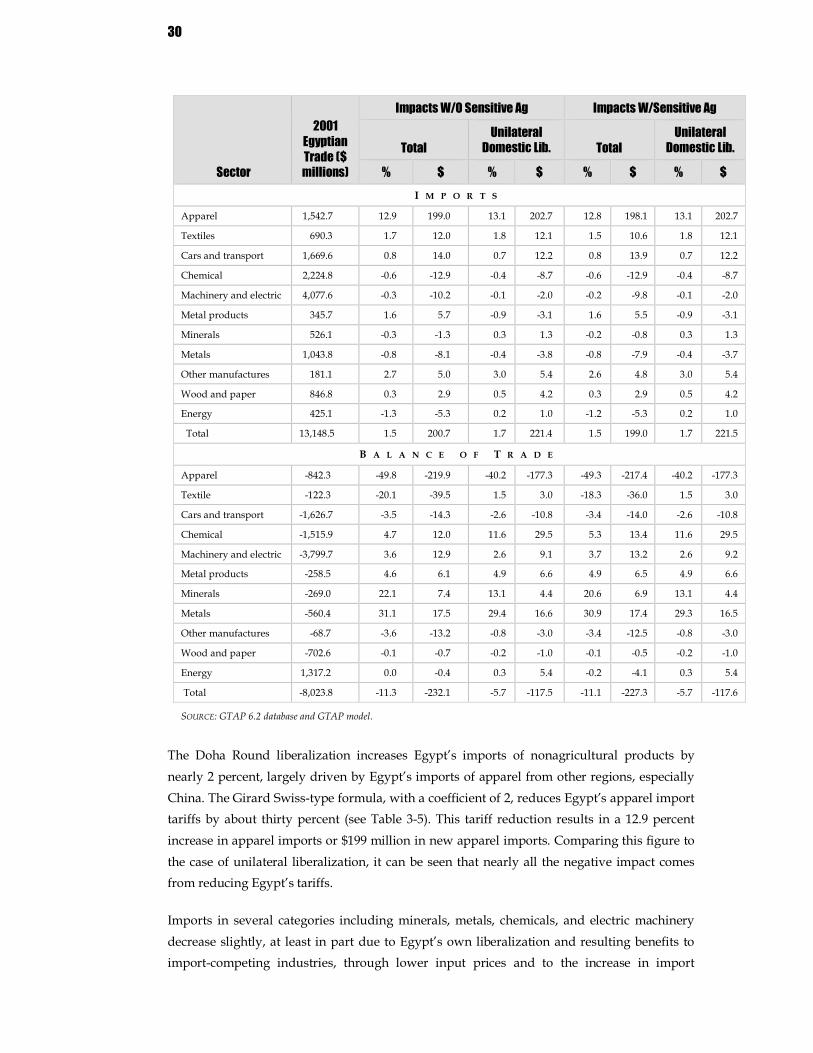
The Doha Round liberalization increases Egypt’s imports of nonagricultural products by nearly 2 percent, largely driven by Egypt’s imports of apparel from other regions, especially China. The Girard Swisstype formula, with a coefficient of 2, reduces Egypt’s apparel import tariffs by about thirty percent (see Table 35). This tariff reduction results in a 12.9 percent increase in apparel imports or $199 million in new apparel imports. Comparing this figure to the case of unilateral liberalization, it can be seen that nearly all the negative impact comes from reducing Egypt’s tariffs.
Imports in several categories including minerals, metals, chemicals, and electric machinery decrease slightly, at least in part due to Egypt’s own liberalization and resulting benefits to importcompeting industries, through lower input prices and to the increase in import

31
product prices. Again, excluding sensitive products in agricultural negotiations has minimal impact.
Figure 44 Percent Change in Egypt’s Imports of Nonagricultural Products Due to Doha Round
Figure 45 Percent Change in Egypt’s Exports of Nonagricultural Products Due to Doha Round
14
10
6
2
2
6
10
14
Apparel
Textile
Cars and Transport
Chemical
Machinery and Electric
Metal Products
Minerals
Metals
Other Manufactures
Wood and Paper
Energy
Without Sensitive Ag With 2% Sensitive Ag
15
10
5
0
5
10
15
Apparel
Textile
Cars and Transport
Chemical
Machinery and Electric
Metal Products
Minerals
Metals
Other Manufactures
Wood and Paper
Energy
Without Sensitive Ag With 2% Sensitive Ag

32
Table 46 Impact of Doha Proposals on Egypt’s Nonagricultural Output, in 2001 Constant Prices
Sector
2001 Egyptian
Production ($ Millions)
Impacts W/o Sensitive Ag Impacts W/ Sensitive Ag
Total Unilateral
Domestic Lib. Total Unilateral
Domestic Lib.
% $ % $ % $ % $ Apparel 7,135.6 4.1 291.8 3.5 250.5 4.1 289.7 3.5 250.5
Textile 6,744.3 1.8 120.7 0.8 55.3 1.7 115.3 0.8 55.3
Cars and transport 2,148.7 0.3 6.9 0.2 3.7 0.3 7.1 0.2 3.7
Chemical 4,198.3 0.0 0.8 0.6 26.0 0.1 2.1 0.6 26.0
Machinery and electric 2,172.6 0.0 0.9 0.3 6.7 0.0 0.7 0.3 6.7
Metal products 1,755.4 0.2 3.7 0.8 13.5 0.3 4.7 0.8 13.5
Minerals 3,780.6 0.2 6.4 0.4 13.6 0.2 6.8 0.4 13.6
Metals 3,042.1 0.7 20.1 1.0 30.1 0.7 20.7 1.0 30.1
Other manufactures 613.5 2.4 14.7 0.6 3.5 2.3 13.9 0.6 3.4
Wood and paper 2,916.0 0.1 4.1 0.0 0.9 0.1 3.8 0.0 0.9
Energy 8,534.8 0.1 9.4 0.3 24.8 0.0 3.4 0.3 24.8
Total 43,041.9 0.9 400.3 0.5 199.0 0.9 391.4 0.5 199.0
Figure 46 Percent Change in Egypt’s Output of Nonagricultural Products Due to Doha Round
5
4
3
2
1
0
1
2
3
4
5
Apparel
Textile
Cars and Transport
Chemical
Machinery and Electric
Metal Products
Minerals
Metals
Other Manufactures
Wood and Paper
Energy
Without Sensitive Ag With 2% Sensitive Ag

33
SERVICES
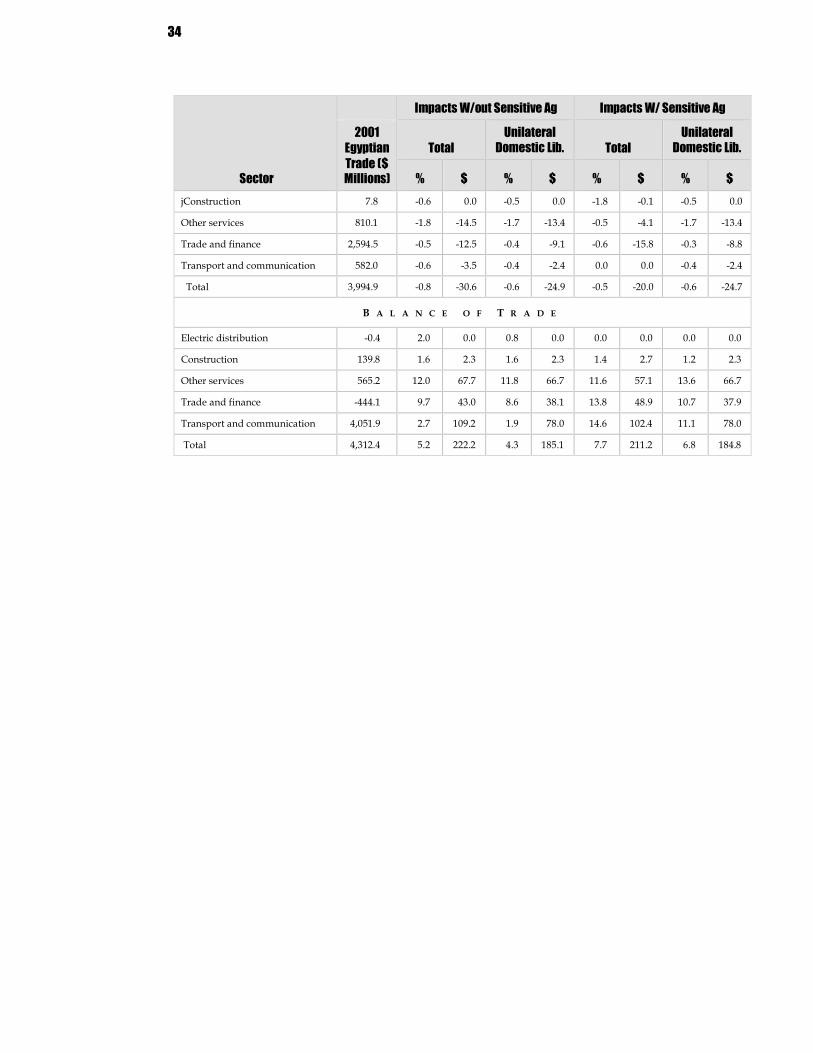
Services often comprise twothirds or more of an economy’s activity, but services trade data are rarely of the same quality as data on manufactured and agricultural goods. Services data are usually collected at the highest levels by central banks, and even then they are estimates based on residuals in national accounts as much as they are data reported from census estimates. The GTAP database includes 12 service sectors (combined in Table 47 into 5 services sectors). GTAP’s services trade data are based on a number of estimation techniques, starting with International Monetary Fund and national central bank estimates. These data are then reconciled with each country’s inputoutput table to estimate trade and consumption. Unlike goods, services are rarely subject to tariffs or taxes at the border. Fully covering services trade liberalization would entail creating estimates of rulesbased changes in trade regimes—in contrast to tariffs and quotas, for which estimates are more readily available—so such coverage is beyond our scope. Therefore, the data in Table 47 represent changes in services trade that would result from tariff reductions for agricultural and nonagricultural goods. Impacts, as generated, are due to linkages in the model and derive from liberalizations modeled in nonservices sectors.
Egypt’s balance of service trade improves by 5.2 percent or $222 million dollars. This improvement is largely driven by Egypt’s exports of transportation and communication services, which become more cost competitive. Nearly 75 percent of this improved competitiveness results from unilateral liberalization. Since most gains in services exports result from unilateral liberalization rather than better market access abroad, allowing for sensitive agricultural products has little effect on services trade in our scenarios.
Table 47 Impact on of Doha Proposals on Egypt’s Services Trade
Sector
Impacts W/out Sensitive Ag Impacts W/ Sensitive Ag
2001 Egyptian Trade ($ Millions)
Total Unilateral
Domestic Lib. Total Unilateral
Domestic Lib.
% $ % $ % $ % $
E X P O R T S
Electric distribution 0.1 2.4 0.0 1.2 0.0 2.1 0.0 1.2 0.0
Construction 147.6 1.5 2.2 1.5 2.2 1.8 2.6 1.5 2.2
Other services 1,375.3 3.9 53.2 3.9 53.4 3.9 53.1 3.9 53.4
Trade and finance 2,150.4 1.4 30.5 1.4 29.0 1.5 33.1 1.4 29.0
Transport and communication 4,633.9 2.3 105.7 1.6 75.5 2.2 102.4 1.6 75.5
Total 8,307.3 0.0 191.6 1.9 160.2 2.3 191.2 1.9 160.2
I M P O R T S
Electric distribution 0.5 0.9 0.0 0.3 0.0 0.7 0.0 0.3 0.0
34
Sector
Impacts W/out Sensitive Ag Impacts W/ Sensitive Ag
2001 Egyptian Trade ($ Millions)
Total Unilateral
Domestic Lib. Total Unilateral
Domestic Lib.
% $ % $ % $ % $ jConstruction 7.8 0.6 0.0 0.5 0.0 1.8 0.1 0.5 0.0
Other services 810.1 1.8 14.5 1.7 13.4 0.5 4.1 1.7 13.4
Trade and finance 2,594.5 0.5 12.5 0.4 9.1 0.6 15.8 0.3 8.8
Transport and communication 582.0 0.6 3.5 0.4 2.4 0.0 0.0 0.4 2.4
Total 3,994.9 0.8 30.6 0.6 24.9 0.5 20.0 0.6 24.7
B A L A N C E O F T R A D E
Electric distribution 0.4 2.0 0.0 0.8 0.0 0.0 0.0 0.0 0.0
Construction 139.8 1.6 2.3 1.6 2.3 1.4 2.7 1.2 2.3
Other services 565.2 12.0 67.7 11.8 66.7 11.6 57.1 13.6 66.7
Trade and finance 444.1 9.7 43.0 8.6 38.1 13.8 48.9 10.7 37.9
Transport and communication 4,051.9 2.7 109.2 1.9 78.0 14.6 102.4 11.1 78.0
Total 4,312.4 5.2 222.2 4.3 185.1 7.7 211.2 6.8 184.8
5. Conclusions
We project that the impact of the Doha Round on Egypt’s general welfare will be modest, though impact at the sector level will be more significant.
Agricultural Sector. Egypt’s agricultural negotiators should be more concerned with secondary effects arising from deals between major exporters, than from the direct effects of cuts Egypt itself will have to make. Because Egypt’s current tariff schedule has significant binding overhang, rate cuts proposed for MFN bound duties will have little impact on Egypt’s current applied duties. In addition, proposed cuts in Egypt’s major export markets for agricultural goods, such as rice and wheat, are likely to erode the country’s current margin of preference in those markets (e.g., the EU). Erosion of preferences positions the processed rice and processed food producers against the dairy and livestock producers. Ten to 20 percent of gains in the agricultural sector are projected to arise from liberalization of Egypt’s own industrial tariffs. 13 Industrial goods—such as transport vehicles, chemicals, fertilizers—are key inputs for the sector. Stakeholders in the agricultural sector should keep an eye on liberalization in major markets, and on positions on industrial tariff liberalization in Egypt.
Manufactures. The projected impact of proposed liberalizations is more pronounced for manufactured goods. The value of industrial output declines by more than US$400 million while agricultural output has a net gain of nearly US$200 million. Moreover, 90 percent of production loss in dollar terms is concentrated in textiles and apparel. Similarly, more than 90 percent of the impact on textiles and apparel arises from Egypt’s own liberalization of apparel import tariffs. The concentration of loss among one group of stakeholders will most likely make it difficult for Egypt to reach consensus on liberalization of this sector, unless losses are countered by expanded market access in other countries (such as developing and middleincome countries) or support to boost industry competitiveness.
Services Sector. Service sectors gains across the board in output and exports, with transport and communications accounting for nearly half of all gains. Exports rise by US$191.6 million
13 The notable exception is fibers, which is affected by demand from the textile and apparel sectors.

36
and the balance of trade improves by US$222.2 million. More than 80 percent of the improved trade balance in services results from Egypt’s own liberalization.