
Project Update and Deliverables July 1, 2010 Demand for North Slope Gas July 1, 2010 Project Update...
51
Project Update and Deliverables July 1, 2010
-
Upload
truongnhan -
Category
Documents
-
view
217 -
download
5
Transcript of Project Update and Deliverables July 1, 2010 Demand for North Slope Gas July 1, 2010 Project Update...

Project Update and DeliverablesJuly 1, 2010

Overview
óProject ReviewóProject Status and
July 1 DeliverablesóCost EstimationóCost of Service
AnalysisóSummary
2July 1, 2010 Project Update

Alaska Stand Alone Gas Pipeline Project
ó Bullet Line Project evaluated in 2008 by ENSTARó Project reinitiated by State and managed by Harry Noah in June
2009ó Project scope adjusted through summer and fall, 2009ó State management changes, January, 2010ó All project efforts reviewed and maintained through April, 2010ó HB369 passes and signed into law, May, 2010ó Alaska Gasline Development Corporation (AGDC) createdó Project management transition begins June, 2010ó Transfer of all management, engineering, and work product
deliverables to AGDC, July 1, 2010
Project Update 3July 1, 2010

July 1 Project Update Take-Home Pointsó New work product builds on earlier efforts
ó Diverse and experienced project team
ó Cost estimates bracket potential pipeline and facilities cost structure
ó ‘Cost block’ data provides versatility for pipeline configuration and cost of service modeling
ó Cost of service modeling suggests cost to consumer sensitive to:
ó All modeling input easily altered to analyze sensitivities for economic modelsó Pipeline configuration/ financing/ costs
Project Update 4July 1, 2010
ó Market demandó Financingó Local distribution system costs
ó Ultimate cost of projectó Commodity price

Take-Home Point
ó July deliverables provide critical baseline data and tools for continued plan development by the Alaska Gasline Development Corporation Team
July 1, 2010 Project Update 5

Distribution of Reserves
Project Update 6July 1, 2010
1.5
35 TCF 12

In-State Demand for North Slope Gas
July 1, 2010 Project Update 7
210
70
280
270
0
100
200
300
400
500
Total Natural Gas Demand Net North Slope Gas Demand
MM
cfd
Industrial Sector
Utility Sector
Years 1- 5
Northern Economics /ISER /SAICIn-State Gas Demand Study, 2010

In State Demand :Northern Economics Study
ó Years 1-5 after constructionó Assumes LNG
export at full capacityó No new
resource found in Cook Inlet
July 1, 2010 Project Update 8
From:Northern Economics /ISER /SAICIn-State Gas Demand Study, 2010
Project Review
Current Project Contributorsó State of Alaska – Project oversight and managementó Michael Baker Jr. - Engineering Leadó Energy Project Consultants, LLC - Cost of Service Analysis ó Black and Veatch - Cost of Service Analysisó Price-Gregory – Pipeline Cost Estimationó Ward A. Whitmore & Assoc. and Larkspur Associates - Facility Cost
Estimationó Doyon Emerald – Facility Process Specificationó AES – Environmental Permitting
The project contributors have over 200 years of combined pipeline and arctic experience
Additional project contributors: State of Alaska - Harry Noah , Ken Pohle, and John Reeves; ENSTAR -John Lau; Mike Metz & Associates.
9July 1, 2010 Project Update
Project Review
Scope of Workó Evaluate, utilize, and update original ENSTAR work productó Identify and evaluate alternate resource, pipelines, & routesó Define and scope range of project configurationsó Develop permit and engineering scopeó Develop cost of service economics
Work Products Previously Deliveredó Alternative route analysisó Project descriptionó Right of Way and EIS filings
Project Update 10July 1, 2010

Project Review
Current Work Productsó GIS database ó Reports and Capital Cost estimates:
ó Cost of Service Estimatesó Permitting update
Project Update
• Facilities • Civil Quantities
• Owner Costs • Pipeline Costs
• Design Basis • Logistics
• Material Sites • Waterway Crossings
• Geohazards • Construction
• Fairbanks Lateral Design • Right of Way
11July 1, 2010

Definition of Work Product
What work product delivers:
ó Project specification necessary to evaluate and optimize project development ó Cost of Service estimates that bracket economics of the
scenariosó Initiation of permitting and right of way processó Engineering effort to develop fast-track pipeline for 2016
gas delivery ó Credible cost estimates and set of decision support tools
for AGDC to evaluate and develop pipeline plan identified in HB369
July 1, 2010 Project Update 12

Definition of Work Product
What work product provides groundwork for:
ó Information to develop plan for single pipeline configurationó An economic comparison with other energy projects in
the Stateó Second phase of permit application to ready for
constructionó The next phase of detailed engineering design and
optimizationó Next phase of detailed cost estimates and financing
scenariosó Recommendations for in-state propane distribution
July 1, 2010 Project Update 13
Project Permitting Accomplishments
ó US Army Corps of Engineers Section 404/10 ó Filed November 16, 2009
ó State of Alaska Title 38 Right-of-Way ó Filed November 25, 2009
ó Bureau of Land Management Grant of Right-of-Way ó Filed November 25, 2009
ó Environmental Field Program Permits ó Filed May – June 2010
July 1, 2010 Project Update 14

Presented by Dr. Keith Meyer, P.E.
July 1, 2010 Project Update 15

Cost Estimate - Introduction
July 1, 2010 Project Update 16
Specifications used to develop Capital Cost Estimates
Cost estimates issued to the economic model
Pipeline Specification• Cost estimate initiated in
December 2009• 24-inch pipe• Construction, materials,
engineering, and owner costs
Facilities Specification• Facilities estimated in
Individual Cost Blocks• Cost Blocks combined for
cases considered

Useful Definitionsó Material balance
ó Changes in gas composition and rate as it passes through processing associated with the pipeline; a way to track Btu's
ó Gas conditioningó Removal of carbon dioxide, hydrogen sulfide, and dehydration
ó NGLó A mixture of propane, butane, and natural gasoline liquids removed from natural gas; includes small amounts of
ethane
ó NGL extractionó A cryogenic process to remove NGL from pipeline gas leaving a utility grade natural gas
ó LPGó Liquefied petroleum gas (propane & butane)
ó NGL fractionationó Separation of NGL into propane, LPG, and natural gasoline
ó CGF residue gasó Natural gas leaving the Prudhoe Bay Central Gas Facility
ó mmcfd – volumetric measurement in million cubic feet per day;ó Dth – Dekatherm is the heating value per unit volumeó 1 Dth = 1 MCF at 1,000 btus per cubic foot
Project UpdateJuly 1, 2010 17

Cost Estimate - Schedule
Project Update
November 2009 July 2010
Dec-09 Jan-10 Feb-10 Mar-10 Apr-10 May-10 Jun-10
Nov 09 - Mar 10Pipeline/Facility Specification
Apr 10 - Jun 10SummariesFeb 10 - Apr 10
Capital Cost Estimates
18July 1, 2010
Pipeline Cost Estimate
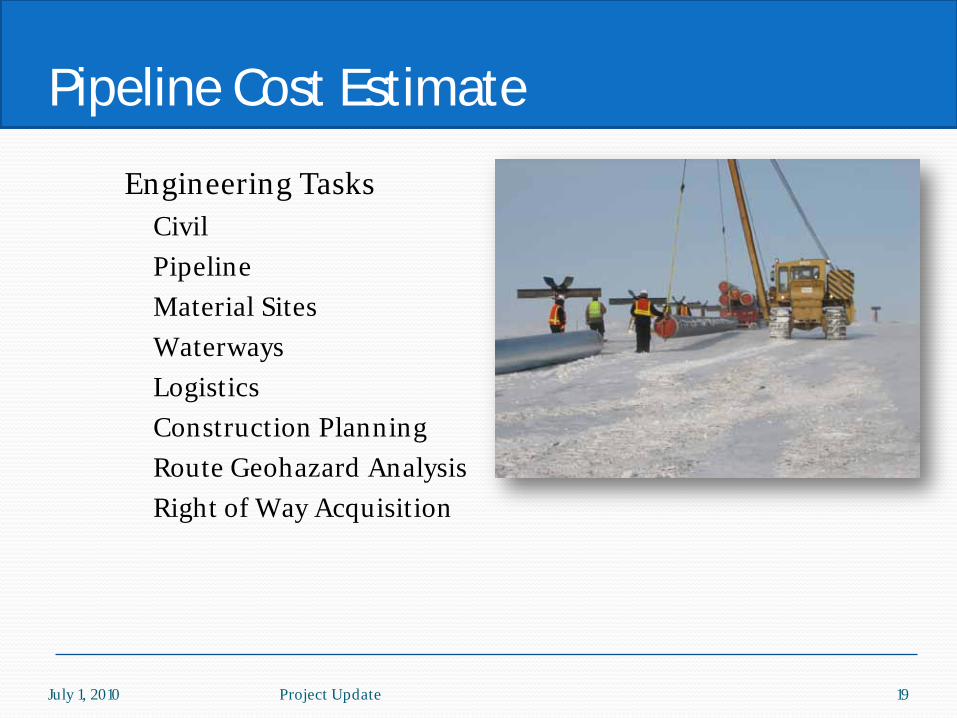
ó Engineering Tasksó Civiló Pipelineó Material Sitesó Waterwaysó Logisticsó Construction Planningó Route Geohazard Analysisó Right of Way Acquisition
July 1, 2010 Project Update 19

Pipeline Work Force Construction Requirements
Project Update 20
0
1000
2000
3000
4000
5000
6000
Summer2014
Fall Winter2015
Summer Fall Winter2016
Summer Fall
Work Force Construction Loading
July 1, 2010
No.
of
Empl
oyee
s

Pipeline Cost Summary Table
July 1, 2010 Project Update 21
Pipeline Construction Cost
$ (billion)
Construction - 24-inch Mainline 1.8
Construction - Fairbanks Lateral 0.04
Materials 0.9
Engineering & Permitting 0.3
Communications 0.2
Construction & ROW Support 0.2
Owner's Management Costs 0.4
Total for Pipe and Pipeline Construction Only $3.8
No contingency and no variance

Cost Estimate Scenarios
July 1, 2010 Project Update 22
Scenario/Description Facilities Configuration
1 Base Case Gas Treatment Plant (GTP)on North Slope and Natural Gas Liquids (NGL) extraction at Fairbanks and Cook Inlet
2 Cook Inlet Conditioning GTP & NGL extraction at Cook Inlet
3 Utility Grade Gas Only GTP & NGL facilities on North Slope – utility grade gas
4 Spiked Same as Scenario 1, except additional NGLs are injected into the gas stream for a richer stream

Flowrates(mmcfd)
Scenario 1 Scenario 2 Scenario 3 Scenario 4
Base CaseCook Inlet
ConditioningUtility Grade
Gas Only Spiked
250 X X X X
500 X X X X
750 X X X X
1,000 X X X X
Cost Estimate Cases
ó 16 cases – combination of scenarios and throughput flow-rates
July 1, 2010 Project Update 23

Facility Cost Block Approach
ó Facility cost block is a specific natural gas processing service; refers to individual block in configuration flow diagrams
ó Cost block estimates based on facility specification; no process design or optimization was completed
ó Cost block estimates are tied to specific flows
ó Costs blocks were coupled with an industry standard formula to adjust costs as a function of capacity to allow capital cost estimation for a range of project configurations
Project UpdateJuly 1, 2010 24
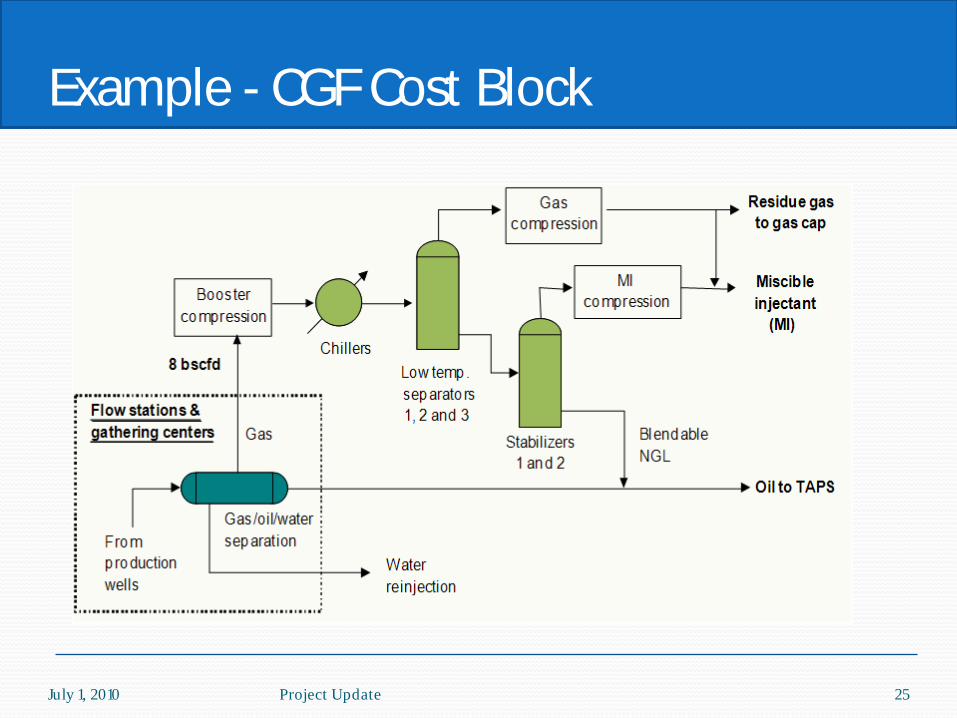
Example - CGF Cost Block
July 1, 2010 Project Update 25

Facilities Work Plan
ó Develop initial material balances for 4 Scenarios at 250, 500, 750, and 1000 mmcfd rates
ó Process simulations and process flow diagrams (PFD) for each cost block based on material balances
ó Major equipment specifications at approximately 250 mmcfd based on PFDs
ó Capital cost estimates based on equipment specifications
ó Capital costs parsed by year in which component was placed in service to meet flow schedule
Project UpdateJuly 1, 2010 26

Facilities Cost Summary ( No Pipeline Costs)
Flowrate(mmcfd) Base Case Cook Inlet
ConditioningUtility
Gas OnlySpiked
With NGL
250 $ 2.6 $ 1.9 $ 2.1 $ 3.1
500 $ 4.0 $ 3.2 $ 3.2 $ 4.6
750 $ 5.3 $ 4.1 $ 4.0 $ 6.0
1,000 $ 7.1 $ 5.5 $ 5.3 $ 8.0
$ (billion)
Project Update
ó Numbers from deterministic cost estimateó Includes compressor stations and Cook Inlet NGL handling
July 1, 2010 27

Capital Cost Summary (Facilities plus Pipeline)
July 1, 2010 Project Update 28
Flow Rate(mmcfd) Base Case Cook Inlet
ConditioningUtility
Gas OnlySpiked
with NGL
250 $6.4 $ 5.7 $ 5.9 $ 6.9
500 $7.8 $ 7.0 $ 7.0 $ 8.4
750 $9.1 $ 7.9 $ 7.8 $ 9.8
1,000 $ 10.9 $ 9.3 $ 9.1 $ 11.8
$ (billion)
ó Numbers from deterministic cost estimate; no contingencyó Includes compressor stations and Cook Inlet NGL handlingó Includes 24” main line and 12” Fairbanks lateral pipelinesó Pipeline costs plus facilities costs needed to maintain throughput

Presented by Bill Sparger
July 1, 2010 Project Update 29

ó Cost of Service to the consumer – residential and/or industrial
ó Analyzed using an industry standard commercial model developed by B&V for the State
ó Includes commodity, transmission and distribution components
ó All inputs ranged or scenario based
Project Update
Cost of Service Analysis
July 1, 2010 30

Cost of Service Analysis
ó Technical Input:
ó All input broken down by GTP, Pipeline, and NGLó Capital costs – 2010$ - no escalation or contingencyó Scheduleó Cash flow curve
Project UpdateJuly 1, 2010 31

Cost of Service Analysis
ó Technical Input: cont’d
ó Cost escalation/yearó Operations & Maintenance (O & M) cost/year – 2010$ó Maintenance cap ex/year – 2010$ó Fuel and line pack volumesó Quantity and heating value of gas available for end use
Project UpdateJuly 1, 2010 32

Cost of Service Analysis
ó Commercial Input:
ó Debt/equity ratioó Return on equity ó Cost of permanent debt (interest)ó Interest during construction ó Contract term
Project UpdateJuly 1, 2010 33

Cost of Service Analysis
ó Commercial Input: cont’d
ó Depreciation lifeó Load factoró Commodity pricingó Distribution/LDC tariff rateó Private vs. Public ownership
Project UpdateJuly 1, 2010 34

Cost of Service Analysis
July 1, 2010 Project Update 35
Scenario/Description Facilities Configuration
1 Base Case Gas Treatment Plant (GTP)on North Slope and Natural Gas Liquids (NGL) extraction at Fairbanks and Cook Inlet
2 Cook Inlet Conditioning GTP & NGL extraction at Cook Inlet
3 Utility Grade Gas Only GTP & NGL facilities on North Slope – utility grade gas
4 Spiked Same as Scenario 1, except additional NGLs are injected into the gas stream for a richer stream

Cost of Service Analysis
ó Scenario/Volume matrix
Rf
July 1, 2010 Project Update 36
Case
Scenarios Volume (mmcfd)Inlet to Pipeline Remarks1 2 3 4
a X X X X 250 Base Case
b X X 500 RFS 2 yrs after case a
c X X 750 RFS 3 yrs after case b
d X X 1,000 RFS 3 yrs after case c
e X X X X 250 then 1,000 RFS 3 yrs after case a
RFS = Ready For Service

Cost of Service Analysis – Volume Ramp Up
July 1, 2010 Project Update 37
Scenario 1 Slow Ramp Up Year Cost Increment
250 mmcfd (a) Year 1 $6.1
500 (b) Year 3 $1.3
750 (c) Year 6 $1.3
1000 (d) Year 9 $1.8
Fast Ramp Up250 mmcfd (a) Year 1 $6.1
1,000 (e) Year 4 $4.0
$ (billions)
ó All cases above 340 mmcfd require expansion of market demand

Natural Gas Delivered to Market - Scenario 1
Cost of Service Analysis
July 1, 2010 38Preliminary Project Cost of Service Presentation
250 mmcf/d Cases
341
259
192212
247
267239
259
0
50
100
150
200
250
300
350
400
Case 1a Case 2a Case 3a Case 4a
000
Dth
Nat Gas to Market
Pipeline Inlet
July 1, 2010 38Project Update
Note: One Dekatherm (Dth) is approximately one Mcf/d to customer

Presented by Mike Elenbaas
July 1, 2010 Project Update 39

óWhat are the projected tariff calculations and sensitivities for the Alaska Stand Alone Gas Pipeline scenarios analyzed?
July 1, 2010 40Project Update
Cost of Service Analysis

Answering Question Requires Following Assumptions:
ó Technical Assumptionsó Capital Costó Scheduleó Operations & Maintenance (O&M)
ó Commercial Assumptionsó Demandó Assume that entire pipeline throughput is sold to market (e.g.,
a “Full” pipeline)ó Financingó Debt / Equity Splitó Return on Equity (ROE), cost of debtó Escalation rate, Interest during construction
July 1, 2010 Project Update 41
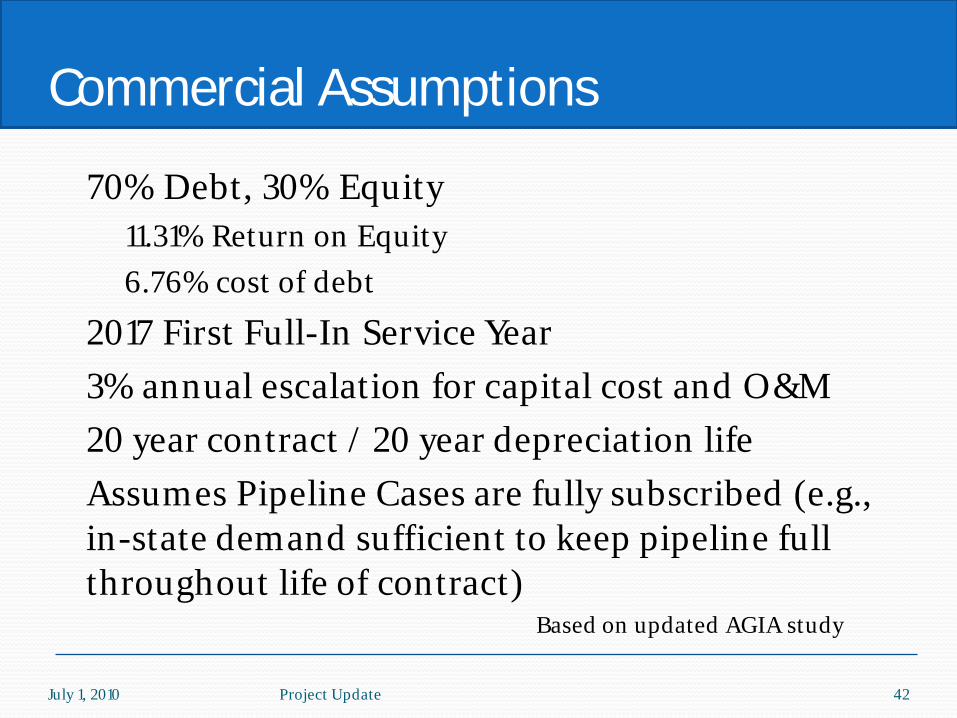
Commercial Assumptions
ó 70% Debt, 30% Equityó 11.31% Return on Equityó 6.76% cost of debt
ó 2017 First Full-In Service Yearó 3% annual escalation for capital cost and O&Mó 20 year contract / 20 year depreciation lifeó Assumes Pipeline Cases are fully subscribed (e.g.,
in-state demand sufficient to keep pipeline full throughout life of contract)
Based on updated AGIA study
July 1, 2010 Project Update 42

ó Gas commodity costs not included in tariffs shown below
250 mmcf/d Cases - Levelized Tariff at Cook Inlet
$13.01
$15.98$15.81 $16.09
$0.00
$5.00
$10.00
$15.00
$20.00
$25.00
Case 1a Case 2a Case 3a Case 4a
$/Dt
h
Gas CostLDCNGLPipelineGTP
? ? ??
Using these assumptions gives the following tariff results
July 1, 2010 Project Update
Assumes Base Capex, 70/30 D/E, 11.31% ROE, 6.76% cost of debt; 100% load factor
Requires Significant Liquids Market Development
43
Note: One Dekatherm (Dth) is approximately one Mcf/d to customer

Tariff Model Results verses Current Costsfor Existing Market
ó Tariff results for cases not requiring increase in market demand years 1-5ó Comparison with current average costs to consumer in Cook Inlet
July 1, 2010 Project Update 44
Assumes Base Capex, 70/30 D/E, 11.31% ROE, 6.76% cost of debt; 100% load factor Note: One Dekatherm (Dth) is approximately one Mcf/d to customer
250 mmcf/d Cases - Levelized Tariff at Cook Inlet
$16.09$15.81 $15.98
$8.10
$0.00
$5.00
$10.00
$15.00
$20.00
$25.00
Case 1a Case 2a Case 3a EnstarResidential
$/Dt
h
Future Gas Cost
LDC
Current Gas Cost
NGL
Pipeline
GTP
? ? ?
Current CostsStand Alone Cases
?

Case 1: Cook Inlet Levelized Tariff
$14.71$9.23 $7.55 $7.34 $6.80
$1.11
$1.11$1.11 $1.11 $1.11
$0.00
$5.00
$10.00
$15.00
$20.00
$25.00
Case 1a(250 mmcf/d)2017 In Svc
Case 1b(500 mmcf/d)2019 In Svc
Case 1c(750 mmcf/d)2022 In Svc
Case 1d(1000 mmcf/d)
2025 In Svc
Case 1e(1000 mmcf/d)
2020 In Svc
$/Dt
h
Gas CostLDCCook Inlet
?
? ? ? ?
Notes:ó Gas commodity
costs notincluded in tariffs
ó Demand Assumed to keep pipeline full for entire 20 year contract (2017 – 2036)
July 1, 2010 Project Update
Sensitivity Cases: Market Expansion Case Tariff Results
Tariffs assume Base Capex, 70/30 D/E, 11.31% ROE, 6.76% cost of debt; 100% load factor
Hypothetical Market Cases
Capacity limitation per AGIA: 500 mmcf/d
45

Sensitivity Cases: Capital Expenditures and Financing
July 1, 2010 Project Update 46
$11.28$14.71 $16.44
$18.80
$1.11
$1.11
$1.11$1.11
$1.11
$6.99
$8.10
$19.90
$17.55$15.81
$12.39
0
5
10
15
20
25
30
Enstar Residential Base Capital100% Debt
Base Capital70/30 Debt /Equity
P50 Capital70/30 Debt /Equity
High (P75) Capital70/30 Debt /Equity
Case
Pric
e ($
/Dth
)
Gas Cost
Existing Enstar System
Cook Inlet Tariff
Current Costs
Case 1a - 250 mmcf/d Costs
?
??
?
Public Private Private Private - EntityBase Case Base Case P50 P75 - Capex100% Debt 70/30 D/E 70/30 D/E 70/30 D/E - Financing
6.05% 11.31% / 6.76% 11.31% / 6.76% 11.31% / 6.76% - ROE / Cost of Debt

Presented by Bob Swenson
July 1, 2010 Project Update 47

July 1 Project Update Summaryó New work product builds on earlier efforts
ó Diverse and experienced project team
ó Cost estimates bracket potential pipeline and facilities cost structure
ó ‘Cost block’ data provides versatility for pipeline configuration and cost of service modeling
ó Cost of service modeling suggests cost to consumer sensitive to:
ó All modeling input easily altered to analyze sensitivities for economic modelsó Pipeline configuration/ financing/ costs
Project Update 48July 1, 2010
ó Market demandó Financingó Local distribution system costs
ó Ultimate cost of projectó Commodity price

Summary
ó July deliverables provide critical baseline data and tools for continued project plan development by the Alaska GaslineDevelopment Corporation Team
July 1, 2010 Project Update 49

Questions
óWebsite and contact information for questions
ó www.gasline.us.comó Bryan Butcher, Vice President
Alaska Gasline Development [email protected]
Project Update 50July 1, 2010

July 1, 2010